Variability and trends of aerosol properties over Kanpur ... and trends of aerosol properties over...
10
Variability and trends of aerosol properties over Kanpur, northern India using AERONET data (2001–10) This article has been downloaded from IOPscience. Please scroll down to see the full text article. 2012 Environ. Res. Lett. 7 024003 (http://iopscience.iop.org/1748-9326/7/2/024003) Download details: IP Address: 128.183.108.197 The article was downloaded on 17/05/2013 at 19:58 Please note that terms and conditions apply. View the table of contents for this issue, or go to the journal homepage for more Home Search Collections Journals About Contact us My IOPscience https://ntrs.nasa.gov/search.jsp?R=20140010254 2018-06-14T20:58:09+00:00Z
Transcript of Variability and trends of aerosol properties over Kanpur ... and trends of aerosol properties over...

Variability and trends of aerosol properties over Kanpur, northern India using AERONET data
(2001–10)
This article has been downloaded from IOPscience. Please scroll down to see the full text article.
2012 Environ. Res. Lett. 7 024003
(http://iopscience.iop.org/1748-9326/7/2/024003)
Download details:
IP Address: 128.183.108.197
The article was downloaded on 17/05/2013 at 19:58
Please note that terms and conditions apply.
View the table of contents for this issue, or go to the journal homepage for more
Home Search Collections Journals About Contact us My IOPscience
https://ntrs.nasa.gov/search.jsp?R=20140010254 2018-06-14T20:58:09+00:00Z
IOP PUBLISHING ENVIRONMENTAL RESEARCH LETTERS
Environ. Res. Lett. 7 (2012) 024003 (9pp) doi:10.1088/1748-9326/7/2/024003
Variability and trends of aerosolproperties over Kanpur, northern Indiausing AERONET data (2001–10)Dimitris G Kaskaoutis1, Ramesh P Singh2, Ritesh Gautam3,4,Manish Sharma1, P G Kosmopoulos5 and S N Tripathi6
1 Research and Technology Development Centre, Sharda University, Greater Noida, NCR 201306, India2 School of Earth and Environmental Sciences, Schmid College of Science and Technology, ChapmanUniversity, Orange, CA 92866, USA3 Goddard Earth Sciences Technology and Research, Universities Space Research Association,Columbia, MD, USA4 NASA Goddard Space Flight Center, Greenbelt, MD, USA5 Laboratory of Meteorology, Department of Physics, University of Athens, University campusGR-15784, Zografou, Greece6 Department of Civil Engineering, Indian Institute of Technology, Kanpur, India
E-mail: [email protected]
Received 2 February 2012Accepted for publication 9 March 2012Published 11 April 2012Online at stacks.iop.org/ERL/7/024003
AbstractNatural and anthropogenic aerosols over northern India play an important role in influencingthe regional radiation budget, causing climate implications to the overall hydrological cycle ofSouth Asia. In the context of regional climate change and air quality, we discuss aerosolloading variability and trends at Kanpur AERONET station located in the central part of theIndo-Gangetic plains (IGP), during the last decade (2001–10). Ground-based radiometricmeasurements show an overall increase in column-integrated aerosol optical depth (AOD) on ayearly basis. This upward trend is mainly due to a sustained increase in the seasonal/monthlyaveraged AOD during the winter (Dec–Feb) and post-monsoon (Oct–Nov) seasons (dominatedby anthropogenic emissions). In contrast, a neutral to weak declining trend is observed duringlate pre-monsoon (Mar–May) and monsoon (Jun–Sep) months, mainly influenced byinter-annual variations of dust outbreaks. A general decrease in coarse-mode aerosolsassociated with variable dust activity is observed, whereas the statistically significantincreasing post-monsoon/winter AOD is reflected in a shift of the columnar size distributiontowards relatively larger particles in the accumulation mode. Overall, the present studyprovides an insight into the pronounced seasonal behavior in aerosol loading trends and, ingeneral, is in agreement with that associating the findings with those recently reported bysatellite observations (MODIS and MISR) over northern India. Our results further suggest thatanthropogenic emissions (due mainly to fossil-fuel and biomass combustion) over the IGPhave continued to increase in the last decade.
Keywords: aerosol optical depth, trend, AERONET, Kanpur, Indo-Gangetic plains
S Online supplementary data available from stacks.iop.org/ERL/7/024003/mmedia
1. Introduction
Aerosols over India exhibit strong seasonal and inter-annualvariability mainly driven by the regional monsoon system
and seasonally changed airmass patterns. The Indo-Gangeticplains (IGP), in the northern part of India, are amongthe most densely populated as well as the most heavilyaerosol-laden regions of the world. With the increase in
11748-9326/12/024003+09$33.00 c© 2012 IOP Publishing Ltd Printed in the UK
Environ. Res. Lett. 7 (2012) 024003 D G Kaskaoutis et al
population density and energy demands, aerosol emissionshave been gradually increasing, mainly through fossil-fueland bio-fuel combustions (Lawrence and Lelieveld 2010).The large increase in anthropogenic aerosols over IGPis hypothesized to cause considerable changes to regionalmonsoonal climate (Ramanathan et al 2005, Lau et al2006, Dey and Tripathi 2008, Gautam et al 2010). The twomain contrasting seasons over northern India (winter andpre-monsoon/summer), in terms of boundary-layer dynamicsand wind patterns, dictate variations in aerosol type andtheir spatial, temporal and vertical distribution. During therelatively stable winter season, the area is often coveredby a low lying thick fog/hazy layer (Gautam et al 2007).The aerosols are mainly of anthropogenic origin due tolarge carbonaceous and sulfate emissions from fossil-fueland bio-fuel combustions (Prasad et al 2006). In contrast,the IGP experiences an enhanced convective and turbulentboundary layer and witnesses a large influx of westerly winddriven dust-laden air masses during the pre-monsoon/summerseason (April–June) (Gautam et al 2011). This period alsomarks the development and evolution of the monsoon typecirculation over the Indian subcontinent. The onset of themonsoon season typically sees a significant reduction in thedust-laden aerosols associated with heavy and continuousrainfall (Singh et al 2004) and by the end of the monsoonseason, northwestern IGP is influenced by aerosols due toextensive crop-residue burning (Sharma et al 2010).
Numerous studies using satellite observations andground-based measurements have revealed an overall increasein aerosol optical depth (AOD) over India especially inIGP (Satheesh et al 2002, Massie et al 2004, Sarkaret al 2006, Porch et al 2007, Prasad and Singh 2007a,Lawrence and Lelieveld 2010, Dey and Di Girolamo 2011,Kaskaoutis et al 2011, Kharol et al 2011, Ramachandran et al2012). Systematic aerosol observations via the well-calibratedAERONET instruments have played a vital role in thedetermination of the increase of anthropogenic aerosols,especially in developing countries (Yoon et al 2011, Xia 2011,Wang et al 2011).
Kanpur AERONET station, in the central part of theIGP, has been operational since January 2001 (Singh et al2004) and, for the first time, we present monthly long-term(2001–10) trend analyses of spectral AOD measurements.We have analyzed the 10 year period and also two5 year sub-periods, (i) 2001–5 and (ii) recent, 2006–10,independently in view of the statistically changing aerosolproperties. The Angstrom exponents at different spectralbands are also analyzed in order to understand the trendsassociated with anthropogenic or natural processes and arediscussed with respect to the modification of the columnaraerosol size distribution. In addition to the analysis of theaerosol loading trend over Kanpur for a 10 year period, thepresent work also supplements the satellite (MODIS, MISR)derived trends of AOD over IGP during the last decade.
2. Data and methodology
The intense haze and smog conditions over the IGP during thewinter season, firstly observed by the ADEOS Polder satellite
(Goloub et al 2001) as a blanket of heavy aerosol layerover the area, motivated the Indian Institute of Technology(IIT) Kanpur and NASA/GSFC to establish the first long-termAERONET station in India at Kanpur (26.5◦N, 80.2◦E) in2001 (Singh et al 2004). During the last decade, severalstudies have dealt with aerosols over Kanpur focusing onaerosol type classification (Gobbi et al 2007, Eck et al2010, Giles et al 2011), model simulations (Chin et al2009) and satellite validation (Tripathi et al 2005, Jethvaet al 2007, Prasad and Singh 2007a). Direct-beam andsun/sky almucantar radiance measurements using a CIMELsunphotometer provide column-integrated spectral AODs ateight wavelengths, from 340 to 1640 nm, and water vaporcontent at 940 nm (Holben et al 1998). Furthermore, viathe almucantar measurements and the spectral deconvolutionalgorithm (SDA) retrievals, aerosol columnar size distribution(CSD), single scattering albedo (SSA), asymmetry parameter,refractive index, fine and coarse-mode AODs are alsoavailable for large solar zenith angles (>50◦) and high aerosolloading conditions (AOD440 > 0.4) (Dubovik et al 2000). TheLevel 2 (cloud screened and quality assured) AERONET datawere used in the present work, following the uncertaintiesin the retrievals described elsewhere (Giles et al 2011). Theaerosol properties were daily averaged and analyzed on amonthly and seasonal basis during the period January 2001to December 2010.
Since aerosols over India are composed of both naturaland anthropogenic components during different seasons, wealso analyze the respective trends of fine and coarse particlesby examining the variability in Angstrom exponents (α)defined at shorter (380–500 nm) and longer (675–870 nm)wavelengths. According to Reid et al (1999), Schuster et al(2006), the former is indicative of the aerosol fine-modesize, while the latter provides useful information about thecoarse-to-fine mode ratio. Thus, supplementary to AOD500and α440−870, direct-sun retrievals of α380−500 and α675−870are used for the trend analysis over Kanpur during 2001–10.AERONET almucantar retrievals are not used for analyzingtrends in this study due to limited observations available,especially during the monsoon season, and to avoid potentialbias in linear regression type analysis.
For all the available data series (AOD500, α440−870,α380−500, α675−870), linear regression analysis was appliedduring the period 2001–10 using the monthly mean values.In addition to the monthly means, median-based analysisis a potential way to avoid outliers/skewed data, especiallyfor those months with limited sample size. Therefore, linearregressions were also calculated using the monthly medianvalues. If there is not much sampling/outlier bias then trendsfrom both the median and mean methodologies would beclose and not deviate significantly. With the usage of themedian-based analysis, sampling and outlier biases wereminimized, which help us to make the analysis more robust.Moreover, the trends in aerosol properties are analyzed on amonthly basis during the period 2001–10 using the daily meanAERONET retrievals. The percentage (%) variation in aerosolproperties is calculated via the formula: x(%) = aN/x100,where x is the variable, a is the slope value from the linear
2
Environ. Res. Lett. 7 (2012) 024003 D G Kaskaoutis et al
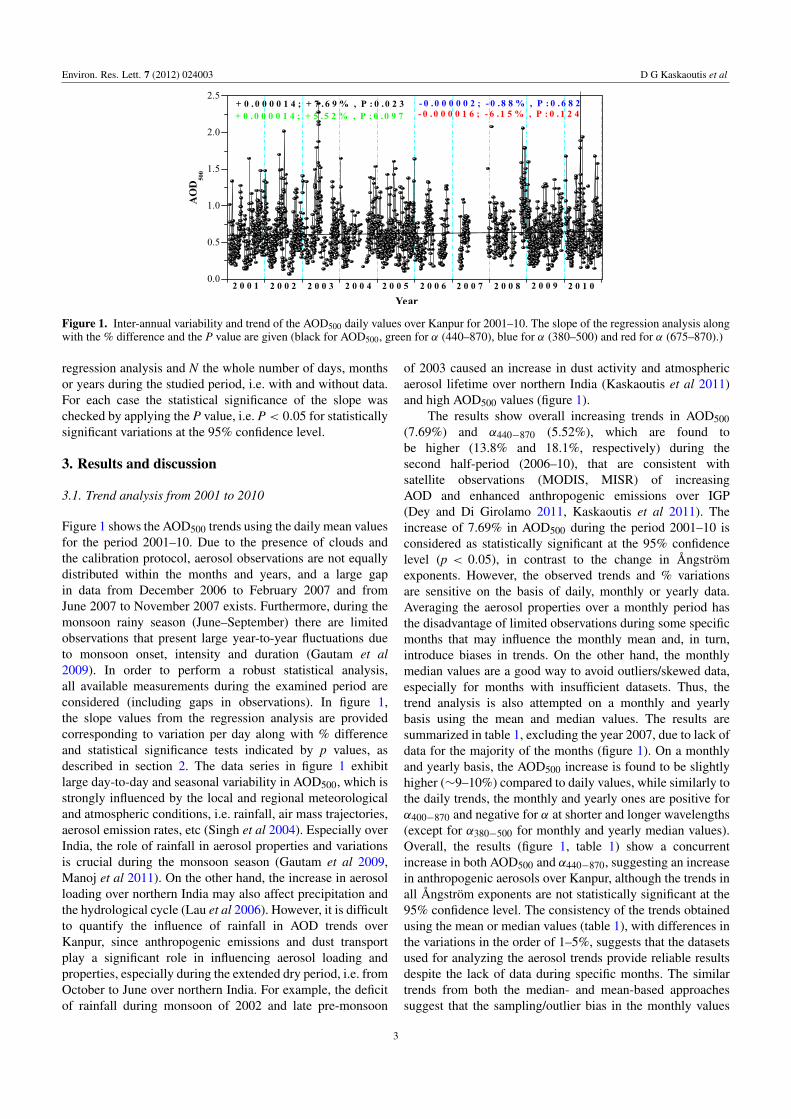
Figure 1. Inter-annual variability and trend of the AOD500 daily values over Kanpur for 2001–10. The slope of the regression analysis alongwith the % difference and the P value are given (black for AOD500, green for α (440–870), blue for α (380–500) and red for α (675–870).)
regression analysis and N the whole number of days, monthsor years during the studied period, i.e. with and without data.For each case the statistical significance of the slope waschecked by applying the P value, i.e. P < 0.05 for statisticallysignificant variations at the 95% confidence level.
3. Results and discussion
3.1. Trend analysis from 2001 to 2010
Figure 1 shows the AOD500 trends using the daily mean valuesfor the period 2001–10. Due to the presence of clouds andthe calibration protocol, aerosol observations are not equallydistributed within the months and years, and a large gapin data from December 2006 to February 2007 and fromJune 2007 to November 2007 exists. Furthermore, during themonsoon rainy season (June–September) there are limitedobservations that present large year-to-year fluctuations dueto monsoon onset, intensity and duration (Gautam et al2009). In order to perform a robust statistical analysis,all available measurements during the examined period areconsidered (including gaps in observations). In figure 1,the slope values from the regression analysis are providedcorresponding to variation per day along with % differenceand statistical significance tests indicated by p values, asdescribed in section 2. The data series in figure 1 exhibitlarge day-to-day and seasonal variability in AOD500, which isstrongly influenced by the local and regional meteorologicaland atmospheric conditions, i.e. rainfall, air mass trajectories,aerosol emission rates, etc (Singh et al 2004). Especially overIndia, the role of rainfall in aerosol properties and variationsis crucial during the monsoon season (Gautam et al 2009,Manoj et al 2011). On the other hand, the increase in aerosolloading over northern India may also affect precipitation andthe hydrological cycle (Lau et al 2006). However, it is difficultto quantify the influence of rainfall in AOD trends overKanpur, since anthropogenic emissions and dust transportplay a significant role in influencing aerosol loading andproperties, especially during the extended dry period, i.e. fromOctober to June over northern India. For example, the deficitof rainfall during monsoon of 2002 and late pre-monsoon
of 2003 caused an increase in dust activity and atmosphericaerosol lifetime over northern India (Kaskaoutis et al 2011)and high AOD500 values (figure 1).
The results show overall increasing trends in AOD500(7.69%) and α440−870 (5.52%), which are found tobe higher (13.8% and 18.1%, respectively) during thesecond half-period (2006–10), that are consistent withsatellite observations (MODIS, MISR) of increasingAOD and enhanced anthropogenic emissions over IGP(Dey and Di Girolamo 2011, Kaskaoutis et al 2011). Theincrease of 7.69% in AOD500 during the period 2001–10 isconsidered as statistically significant at the 95% confidencelevel (p < 0.05), in contrast to the change in Angstromexponents. However, the observed trends and % variationsare sensitive on the basis of daily, monthly or yearly data.Averaging the aerosol properties over a monthly period hasthe disadvantage of limited observations during some specificmonths that may influence the monthly mean and, in turn,introduce biases in trends. On the other hand, the monthlymedian values are a good way to avoid outliers/skewed data,especially for months with insufficient datasets. Thus, thetrend analysis is also attempted on a monthly and yearlybasis using the mean and median values. The results aresummarized in table 1, excluding the year 2007, due to lack ofdata for the majority of the months (figure 1). On a monthlyand yearly basis, the AOD500 increase is found to be slightlyhigher (∼9–10%) compared to daily values, while similarly tothe daily trends, the monthly and yearly ones are positive forα400−870 and negative for α at shorter and longer wavelengths(except for α380−500 for monthly and yearly median values).Overall, the results (figure 1, table 1) show a concurrentincrease in both AOD500 and α440−870, suggesting an increasein anthropogenic aerosols over Kanpur, although the trends inall Angstrom exponents are not statistically significant at the95% confidence level. The consistency of the trends obtainedusing the mean or median values (table 1), with differences inthe variations in the order of 1–5%, suggests that the datasetsused for analyzing the aerosol trends provide reliable resultsdespite the lack of data during specific months. The similartrends from both the median- and mean-based approachessuggest that the sampling/outlier bias in the monthly values
3
Environ. Res. Lett. 7 (2012) 024003 D G Kaskaoutis et al
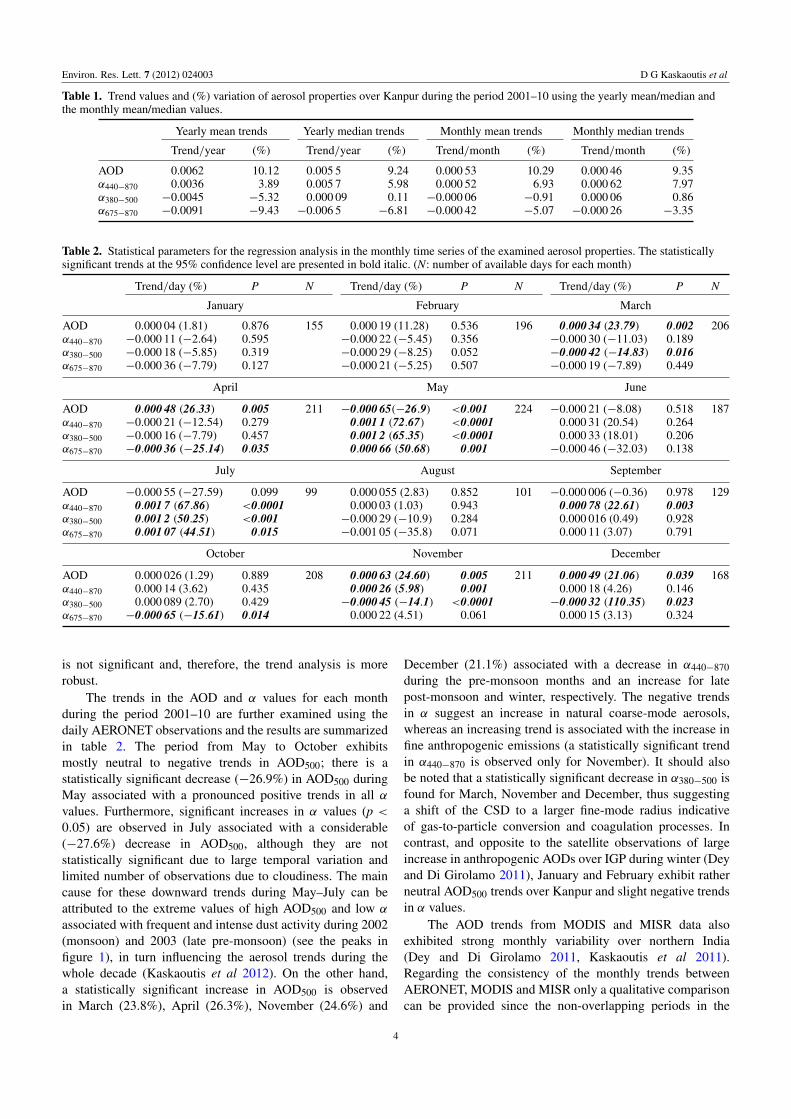
Table 1. Trend values and (%) variation of aerosol properties over Kanpur during the period 2001–10 using the yearly mean/median andthe monthly mean/median values.
Yearly mean trends Yearly median trends Monthly mean trends Monthly median trends
Trend/year (%) Trend/year (%) Trend/month (%) Trend/month (%)
AOD 0.0062 10.12 0.005 5 9.24 0.000 53 10.29 0.000 46 9.35α440−870 0.0036 3.89 0.005 7 5.98 0.000 52 6.93 0.000 62 7.97α380−500 −0.0045 −5.32 0.000 09 0.11 −0.000 06 −0.91 0.000 06 0.86α675−870 −0.0091 −9.43 −0.006 5 −6.81 −0.000 42 −5.07 −0.000 26 −3.35
Table 2. Statistical parameters for the regression analysis in the monthly time series of the examined aerosol properties. The statisticallysignificant trends at the 95% confidence level are presented in bold italic. (N: number of available days for each month)
Trend/day (%) P N Trend/day (%) P N Trend/day (%) P N
January February March
AOD 0.000 04 (1.81) 0.876 155 0.000 19 (11.28) 0.536 196 0.000 34 (23.79) 0.002 206α440−870 −0.000 11 (−2.64) 0.595 −0.000 22 (−5.45) 0.356 −0.000 30 (−11.03) 0.189α380−500 −0.000 18 (−5.85) 0.319 −0.000 29 (−8.25) 0.052 −0.000 42 (−14.83) 0.016α675−870 −0.000 36 (−7.79) 0.127 −0.000 21 (−5.25) 0.507 −0.000 19 (−7.89) 0.449
April May June
AOD 0.000 48 (26.33) 0.005 211 −0.000 65(−26.9) <0.001 224 −0.000 21 (−8.08) 0.518 187α440−870 −0.000 21 (−12.54) 0.279 0.001 1 (72.67) <0.0001 0.000 31 (20.54) 0.264α380−500 −0.000 16 (−7.79) 0.457 0.001 2 (65.35) <0.0001 0.000 33 (18.01) 0.206α675−870 −0.000 36 (−25.14) 0.035 0.000 66 (50.68) 0.001 −0.000 46 (−32.03) 0.138
July August September
AOD −0.000 55 (−27.59) 0.099 99 0.000 055 (2.83) 0.852 101 −0.000 006 (−0.36) 0.978 129α440−870 0.001 7 (67.86) <0.0001 0.000 03 (1.03) 0.943 0.000 78 (22.61) 0.003α380−500 0.001 2 (50.25) <0.001 −0.000 29 (−10.9) 0.284 0.000 016 (0.49) 0.928α675−870 0.001 07 (44.51) 0.015 −0.001 05 (−35.8) 0.071 0.000 11 (3.07) 0.791
October November December
AOD 0.000 026 (1.29) 0.889 208 0.000 63 (24.60) 0.005 211 0.000 49 (21.06) 0.039 168α440−870 0.000 14 (3.62) 0.435 0.000 26 (5.98) 0.001 0.000 18 (4.26) 0.146α380−500 0.000 089 (2.70) 0.429 −0.000 45 (−14.1) <0.0001 −0.000 32 (110.35) 0.023α675−870 −0.000 65 (−15.61) 0.014 0.000 22 (4.51) 0.061 0.000 15 (3.13) 0.324
is not significant and, therefore, the trend analysis is morerobust.
The trends in the AOD and α values for each monthduring the period 2001–10 are further examined using thedaily AERONET observations and the results are summarizedin table 2. The period from May to October exhibitsmostly neutral to negative trends in AOD500; there is astatistically significant decrease (−26.9%) in AOD500 duringMay associated with a pronounced positive trends in all αvalues. Furthermore, significant increases in α values (p <0.05) are observed in July associated with a considerable(−27.6%) decrease in AOD500, although they are notstatistically significant due to large temporal variation andlimited number of observations due to cloudiness. The maincause for these downward trends during May–July can beattributed to the extreme values of high AOD500 and low α
associated with frequent and intense dust activity during 2002(monsoon) and 2003 (late pre-monsoon) (see the peaks infigure 1), in turn influencing the aerosol trends during thewhole decade (Kaskaoutis et al 2012). On the other hand,a statistically significant increase in AOD500 is observedin March (23.8%), April (26.3%), November (24.6%) and
December (21.1%) associated with a decrease in α440−870during the pre-monsoon months and an increase for latepost-monsoon and winter, respectively. The negative trendsin α suggest an increase in natural coarse-mode aerosols,whereas an increasing trend is associated with the increase infine anthropogenic emissions (a statistically significant trendin α440−870 is observed only for November). It should alsobe noted that a statistically significant decrease in α380−500 isfound for March, November and December, thus suggestinga shift of the CSD to a larger fine-mode radius indicativeof gas-to-particle conversion and coagulation processes. Incontrast, and opposite to the satellite observations of largeincrease in anthropogenic AODs over IGP during winter (Deyand Di Girolamo 2011), January and February exhibit ratherneutral AOD500 trends over Kanpur and slight negative trendsin α values.
The AOD trends from MODIS and MISR data alsoexhibited strong monthly variability over northern India(Dey and Di Girolamo 2011, Kaskaoutis et al 2011).Regarding the consistency of the monthly trends betweenAERONET, MODIS and MISR only a qualitative comparisoncan be provided since the non-overlapping periods in the
4
Environ. Res. Lett. 7 (2012) 024003 D G Kaskaoutis et al
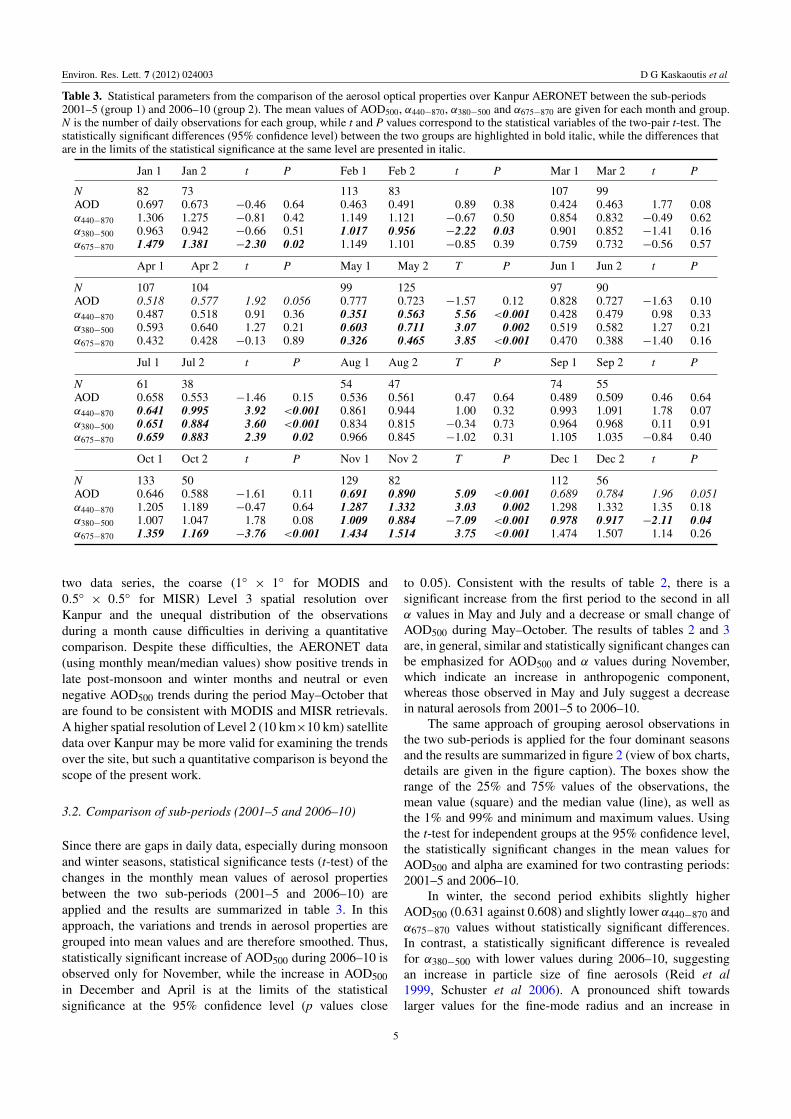
Table 3. Statistical parameters from the comparison of the aerosol optical properties over Kanpur AERONET between the sub-periods2001–5 (group 1) and 2006–10 (group 2). The mean values of AOD500, α440−870, α380−500 and α675−870 are given for each month and group.N is the number of daily observations for each group, while t and P values correspond to the statistical variables of the two-pair t-test. Thestatistically significant differences (95% confidence level) between the two groups are highlighted in bold italic, while the differences thatare in the limits of the statistical significance at the same level are presented in italic.
Jan 1 Jan 2 t P Feb 1 Feb 2 t P Mar 1 Mar 2 t P
N 82 73 113 83 107 99AOD 0.697 0.673 −0.46 0.64 0.463 0.491 0.89 0.38 0.424 0.463 1.77 0.08α440−870 1.306 1.275 −0.81 0.42 1.149 1.121 −0.67 0.50 0.854 0.832 −0.49 0.62α380−500 0.963 0.942 −0.66 0.51 1.017 0.956 −2.22 0.03 0.901 0.852 −1.41 0.16α675−870 1.479 1.381 −2.30 0.02 1.149 1.101 −0.85 0.39 0.759 0.732 −0.56 0.57
Apr 1 Apr 2 t P May 1 May 2 T P Jun 1 Jun 2 t P
N 107 104 99 125 97 90AOD 0.518 0.577 1.92 0.056 0.777 0.723 −1.57 0.12 0.828 0.727 −1.63 0.10α440−870 0.487 0.518 0.91 0.36 0.351 0.563 5.56 <0.001 0.428 0.479 0.98 0.33α380−500 0.593 0.640 1.27 0.21 0.603 0.711 3.07 0.002 0.519 0.582 1.27 0.21α675−870 0.432 0.428 −0.13 0.89 0.326 0.465 3.85 <0.001 0.470 0.388 −1.40 0.16
Jul 1 Jul 2 t P Aug 1 Aug 2 T P Sep 1 Sep 2 t P
N 61 38 54 47 74 55AOD 0.658 0.553 −1.46 0.15 0.536 0.561 0.47 0.64 0.489 0.509 0.46 0.64α440−870 0.641 0.995 3.92 <0.001 0.861 0.944 1.00 0.32 0.993 1.091 1.78 0.07α380−500 0.651 0.884 3.60 <0.001 0.834 0.815 −0.34 0.73 0.964 0.968 0.11 0.91α675−870 0.659 0.883 2.39 0.02 0.966 0.845 −1.02 0.31 1.105 1.035 −0.84 0.40
Oct 1 Oct 2 t P Nov 1 Nov 2 T P Dec 1 Dec 2 t P
N 133 50 129 82 112 56AOD 0.646 0.588 −1.61 0.11 0.691 0.890 5.09 <0.001 0.689 0.784 1.96 0.051α440−870 1.205 1.189 −0.47 0.64 1.287 1.332 3.03 0.002 1.298 1.332 1.35 0.18α380−500 1.007 1.047 1.78 0.08 1.009 0.884 −7.09 <0.001 0.978 0.917 −2.11 0.04α675−870 1.359 1.169 −3.76 <0.001 1.434 1.514 3.75 <0.001 1.474 1.507 1.14 0.26
two data series, the coarse (1◦ × 1◦ for MODIS and0.5◦ × 0.5◦ for MISR) Level 3 spatial resolution overKanpur and the unequal distribution of the observationsduring a month cause difficulties in deriving a quantitativecomparison. Despite these difficulties, the AERONET data(using monthly mean/median values) show positive trends inlate post-monsoon and winter months and neutral or evennegative AOD500 trends during the period May–October thatare found to be consistent with MODIS and MISR retrievals.A higher spatial resolution of Level 2 (10 km×10 km) satellitedata over Kanpur may be more valid for examining the trendsover the site, but such a quantitative comparison is beyond thescope of the present work.
3.2. Comparison of sub-periods (2001–5 and 2006–10)
Since there are gaps in daily data, especially during monsoonand winter seasons, statistical significance tests (t-test) of thechanges in the monthly mean values of aerosol propertiesbetween the two sub-periods (2001–5 and 2006–10) areapplied and the results are summarized in table 3. In thisapproach, the variations and trends in aerosol properties aregrouped into mean values and are therefore smoothed. Thus,statistically significant increase of AOD500 during 2006–10 isobserved only for November, while the increase in AOD500in December and April is at the limits of the statisticalsignificance at the 95% confidence level (p values close
to 0.05). Consistent with the results of table 2, there is asignificant increase from the first period to the second in allα values in May and July and a decrease or small change ofAOD500 during May–October. The results of tables 2 and 3are, in general, similar and statistically significant changes canbe emphasized for AOD500 and α values during November,which indicate an increase in anthropogenic component,whereas those observed in May and July suggest a decreasein natural aerosols from 2001–5 to 2006–10.
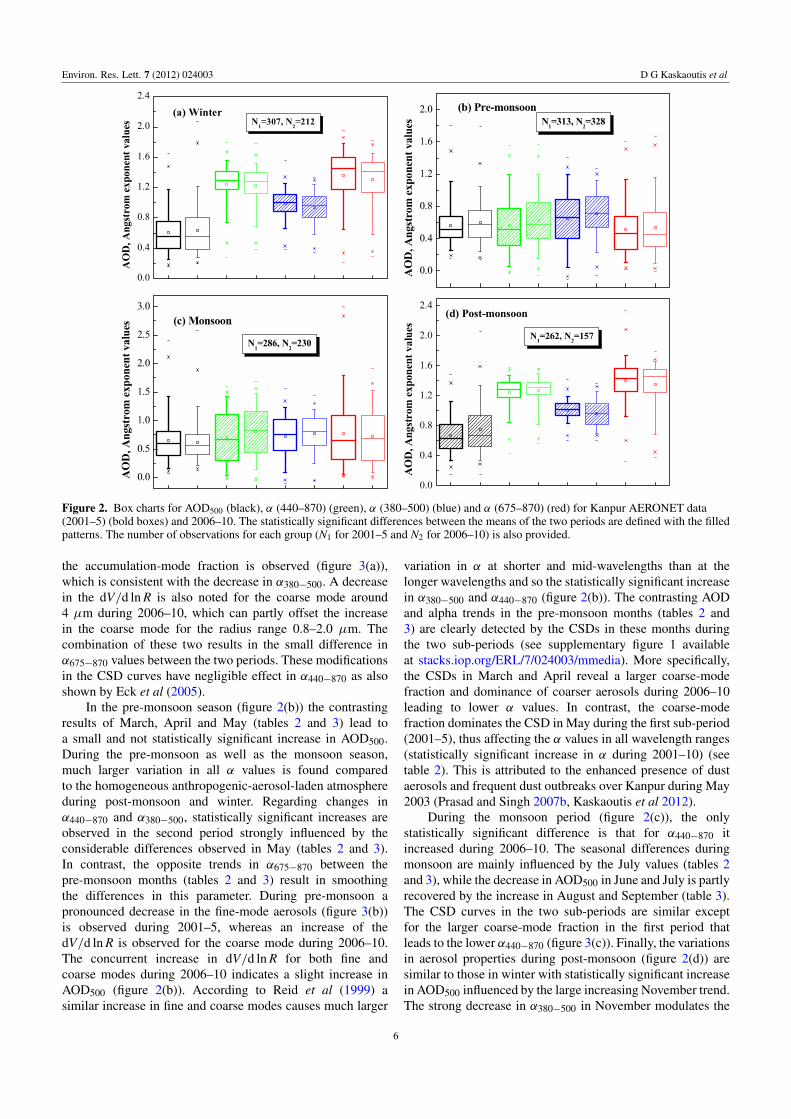
The same approach of grouping aerosol observations inthe two sub-periods is applied for the four dominant seasonsand the results are summarized in figure 2 (view of box charts,details are given in the figure caption). The boxes show therange of the 25% and 75% values of the observations, themean value (square) and the median value (line), as well asthe 1% and 99% and minimum and maximum values. Usingthe t-test for independent groups at the 95% confidence level,the statistically significant changes in the mean values forAOD500 and alpha are examined for two contrasting periods:2001–5 and 2006–10.
In winter, the second period exhibits slightly higherAOD500 (0.631 against 0.608) and slightly lower α440−870 andα675−870 values without statistically significant differences.In contrast, a statistically significant difference is revealedfor α380−500 with lower values during 2006–10, suggestingan increase in particle size of fine aerosols (Reid et al1999, Schuster et al 2006). A pronounced shift towardslarger values for the fine-mode radius and an increase in
5
Environ. Res. Lett. 7 (2012) 024003 D G Kaskaoutis et al
Figure 2. Box charts for AOD500 (black), α (440–870) (green), α (380–500) (blue) and α (675–870) (red) for Kanpur AERONET data(2001–5) (bold boxes) and 2006–10. The statistically significant differences between the means of the two periods are defined with the filledpatterns. The number of observations for each group (N1 for 2001–5 and N2 for 2006–10) is also provided.
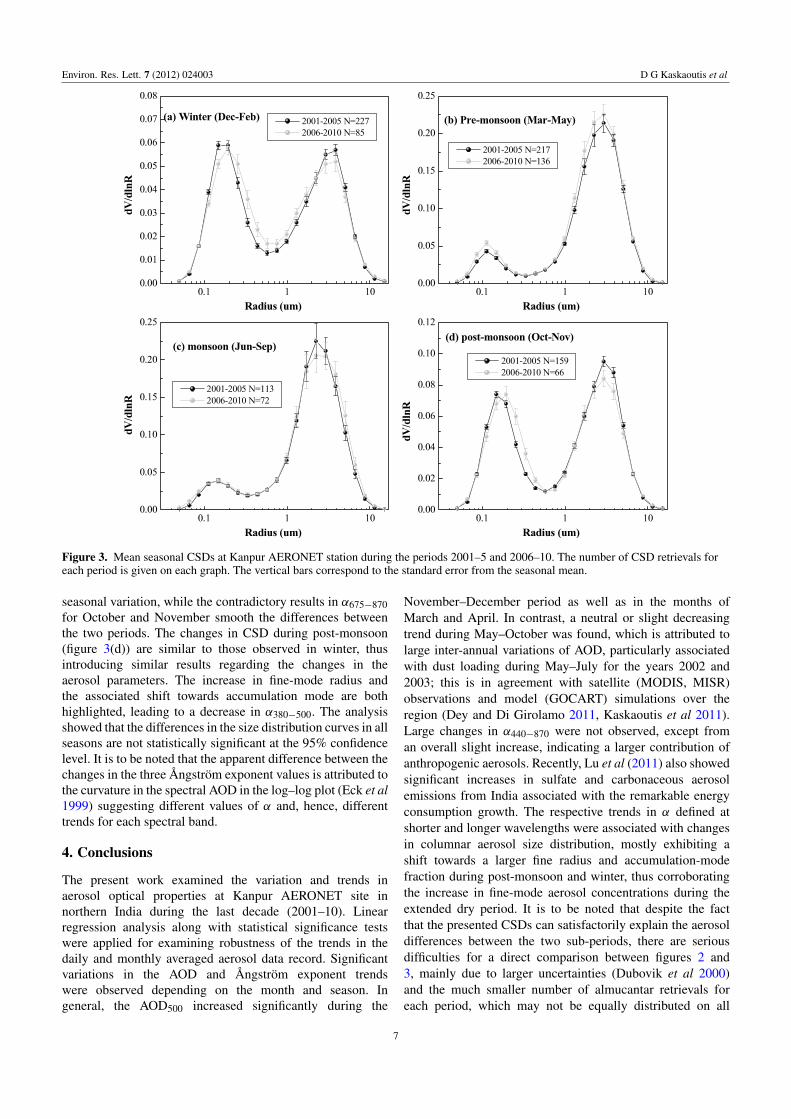
the accumulation-mode fraction is observed (figure 3(a)),which is consistent with the decrease in α380−500. A decreasein the dV/d ln R is also noted for the coarse mode around4 µm during 2006–10, which can partly offset the increasein the coarse mode for the radius range 0.8–2.0 µm. Thecombination of these two results in the small difference inα675−870 values between the two periods. These modificationsin the CSD curves have negligible effect in α440−870 as alsoshown by Eck et al (2005).
In the pre-monsoon season (figure 2(b)) the contrastingresults of March, April and May (tables 2 and 3) lead toa small and not statistically significant increase in AOD500.During the pre-monsoon as well as the monsoon season,much larger variation in all α values is found comparedto the homogeneous anthropogenic-aerosol-laden atmosphereduring post-monsoon and winter. Regarding changes inα440−870 and α380−500, statistically significant increases areobserved in the second period strongly influenced by theconsiderable differences observed in May (tables 2 and 3).In contrast, the opposite trends in α675−870 between thepre-monsoon months (tables 2 and 3) result in smoothingthe differences in this parameter. During pre-monsoon apronounced decrease in the fine-mode aerosols (figure 3(b))is observed during 2001–5, whereas an increase of thedV/d ln R is observed for the coarse mode during 2006–10.The concurrent increase in dV/d ln R for both fine andcoarse modes during 2006–10 indicates a slight increase inAOD500 (figure 2(b)). According to Reid et al (1999) asimilar increase in fine and coarse modes causes much larger
variation in α at shorter and mid-wavelengths than at thelonger wavelengths and so the statistically significant increasein α380−500 and α440−870 (figure 2(b)). The contrasting AODand alpha trends in the pre-monsoon months (tables 2 and3) are clearly detected by the CSDs in these months duringthe two sub-periods (see supplementary figure 1 availableat stacks.iop.org/ERL/7/024003/mmedia). More specifically,the CSDs in March and April reveal a larger coarse-modefraction and dominance of coarser aerosols during 2006–10leading to lower α values. In contrast, the coarse-modefraction dominates the CSD in May during the first sub-period(2001–5), thus affecting the α values in all wavelength ranges(statistically significant increase in α during 2001–10) (seetable 2). This is attributed to the enhanced presence of dustaerosols and frequent dust outbreaks over Kanpur during May2003 (Prasad and Singh 2007b, Kaskaoutis et al 2012).
During the monsoon period (figure 2(c)), the onlystatistically significant difference is that for α440−870 itincreased during 2006–10. The seasonal differences duringmonsoon are mainly influenced by the July values (tables 2and 3), while the decrease in AOD500 in June and July is partlyrecovered by the increase in August and September (table 3).The CSD curves in the two sub-periods are similar exceptfor the larger coarse-mode fraction in the first period thatleads to the lower α440−870 (figure 3(c)). Finally, the variationsin aerosol properties during post-monsoon (figure 2(d)) aresimilar to those in winter with statistically significant increasein AOD500 influenced by the large increasing November trend.The strong decrease in α380−500 in November modulates the
6
Environ. Res. Lett. 7 (2012) 024003 D G Kaskaoutis et al
Figure 3. Mean seasonal CSDs at Kanpur AERONET station during the periods 2001–5 and 2006–10. The number of CSD retrievals foreach period is given on each graph. The vertical bars correspond to the standard error from the seasonal mean.
seasonal variation, while the contradictory results in α675−870for October and November smooth the differences betweenthe two periods. The changes in CSD during post-monsoon(figure 3(d)) are similar to those observed in winter, thusintroducing similar results regarding the changes in theaerosol parameters. The increase in fine-mode radius andthe associated shift towards accumulation mode are bothhighlighted, leading to a decrease in α380−500. The analysisshowed that the differences in the size distribution curves in allseasons are not statistically significant at the 95% confidencelevel. It is to be noted that the apparent difference between thechanges in the three Angstrom exponent values is attributed tothe curvature in the spectral AOD in the log–log plot (Eck et al1999) suggesting different values of α and, hence, differenttrends for each spectral band.
4. Conclusions
The present work examined the variation and trends inaerosol optical properties at Kanpur AERONET site innorthern India during the last decade (2001–10). Linearregression analysis along with statistical significance testswere applied for examining robustness of the trends in thedaily and monthly averaged aerosol data record. Significantvariations in the AOD and Angstrom exponent trendswere observed depending on the month and season. Ingeneral, the AOD500 increased significantly during the
November–December period as well as in the months ofMarch and April. In contrast, a neutral or slight decreasingtrend during May–October was found, which is attributed tolarge inter-annual variations of AOD, particularly associatedwith dust loading during May–July for the years 2002 and2003; this is in agreement with satellite (MODIS, MISR)observations and model (GOCART) simulations over theregion (Dey and Di Girolamo 2011, Kaskaoutis et al 2011).Large changes in α440−870 were not observed, except froman overall slight increase, indicating a larger contribution ofanthropogenic aerosols. Recently, Lu et al (2011) also showedsignificant increases in sulfate and carbonaceous aerosolemissions from India associated with the remarkable energyconsumption growth. The respective trends in α defined atshorter and longer wavelengths were associated with changesin columnar aerosol size distribution, mostly exhibiting ashift towards a larger fine radius and accumulation-modefraction during post-monsoon and winter, thus corroboratingthe increase in fine-mode aerosol concentrations during theextended dry period. It is to be noted that despite the factthat the presented CSDs can satisfactorily explain the aerosoldifferences between the two sub-periods, there are seriousdifficulties for a direct comparison between figures 2 and3, mainly due to larger uncertainties (Dubovik et al 2000)and the much smaller number of almucantar retrievals foreach period, which may not be equally distributed on all
7
Environ. Res. Lett. 7 (2012) 024003 D G Kaskaoutis et al
days of each season. Overall, this study confirms the seasonaldependency in the aerosol loading trends, recently reportedby satellite observations (MODIS and MISR) over northernIndia, and further provides an in depth assessment based oncolumnar particle size variations from monthly decompositionof the observed trends.
Acknowledgments
IIT Kanpur AERONET was operational as of January 2001after the joint agreement by IIT Kanpur and NASA. Oursincere thanks go to the AERONET team for processing andmaking the data available. The authors thank three anonymousreferees for their comments/suggestions to improve theoriginal version of the paper. One of the authors (RG) isgrateful to USRA for partially supporting this work.
References
Chin M, Diehl T, Dubovik O, Eck T F, Holben B N, Sinyuk A andStreets D G 2009 Light absorption by pollution, dust, andbiomass burning aerosols: a global model study and evaluationwith AERONET measurements Ann. Geophys. 27 3439–64
Dey S and Di Girolamo L 2011 A decade of change in aerosolproperties over the Indian subcontinent Geophys. Res. Lett.38 L14811
Dey S and Tripathi S N 2008 Aerosol direct radiative effects overKanpur in the Indo-Gangetic basin, Northern India: long-term(2001–2005) observations and implications to regional climateJ. Geophys. Res. 113 D04212
Dubovik O, Smirnov A, Holben B N, King M D, Kaufman Y J,Eck T F and Slutsker I 2000 Accuracy assessments of aerosolproperties retrieved from aerosol robotic network (AERONET)sun and sky radiance measurements J. Geophys. Res.105 9791–806
Eck T F, Holben B N, Reid J S, Dubovik O, Smirnov A,O’Neill N T, Slutsker I and Kinne S 1999 Wavelengthdependence of the optical depth of biomass burning, urban, anddesert dust aerosols J. Geophys. Res. 104 31333–49
Eck T F et al 2005 Columnar aerosol optical properties atAERONET sites in central eastern Asia and aerosol transportto the tropical mid-Pacific J. Geophys. Res. 110 D06202
Eck T F et al 2010 Climatological aspects of the optical propertiesof fine/coarse mode aerosol mixtures J. Geophys. Res.115 D19205
Gautam R, Hsu C N, Kafatos M and Tsay S-C 2007 Influences ofwinter haze on fog/low cloud over the Indo-Gangetic plainsJ. Geophys. Res. 112 D05207
Gautam R, Hsu N C and Lau K-M 2010 Premonsoon aerosolcharacterization and radiative effects over the Indo-Gangeticplains: implications for regional climate warming J. Geophys.Res. 115 D17208
Gautam R, Hsu N C, Lau K-M and Kafatos M 2009 Aerosol andrainfall variability over the Indian monsoon region:distributions, trends and coupling Ann. Geophys. 29 3691–703
Gautam R et al 2011 Accumulation of aerosols over theIndo-Gangetic plains and southern slopes of the Himalayas:distribution, properties and radiative effects during the 2009pre-monsoon season Atmos. Chem. Phys. 11 12841–63
Giles D M et al 2011 Aerosol properties over the Indo-Gangeticplain: a 1 mesoscale perspective from the TIGERZ experimentJ. Geophys. Res. 116 D18203
Gobbi G P, Kaufman Y J, Koren I and Eck T F 2007 Classificationof aerosol properties derived from AERONET direct sun dataAtmos. Chem. Phys. 7 453–8
Goloub P, Deuze J L, Herman M, Tanre D, Chiapello I,Roger B and Singh R P 2001 Aerosol remote sensing over landusing the spaceborne polarimeter POLDER Current Problemsin Atmospheric Radiation ed W L Smith andYu M Timofeyev (Hampton, VA: A Deepak) pp 113–6
Holben B N, Eck T F, Slutsker I, Tanre D, Buis J P, Setzer A,Vermote E, Reagan J A and Kaufman Y A 1998AERONET—a federated instrument network and data achievefor aerosol characterization Remote Sens. Environ. 66 1–16
Jethva H, Satheesh S K and Srinivasan J 2007 Assessment ofsecond-generation MODIS aerosol retrieval (Collection 005) atKanpur, India Geophys. Res. Lett. 34 L19802
Kaskaoutis D G, Kharol S K, Sinha P R, Singh R P,Badarinath K V S, Mehdi W and Sharma M 2011 Contrastingaerosol trends over South Asia during the last decade based onMODIS observations Atmos. Meas. Tech. Discuss. 4 5275–323
Kaskaoutis D G et al 2012 Influence of anomalous dry conditionson aerosols over India: transport, distribution and propertiesJ. Geophys. Res. at press (doi:10.1029/2011JD017314)
Kharol S K, Badarinath K V S, Sharma A R, Kaskaoutis D G andKambezidis H D 2011 Multiyear analysis of Terra/AquaMODIS aerosol optical depth and ground observations overtropical urban region of Hyderabad, India Atmos. Environ.45 1532–42
Lau K M, Kim M K and Kim K M 2006 Asian summer monsoonanomalies induced by aerosol direct forcing: the role of theTibetan Plateau Clim. Dyn. 26 855–64
Lawrence M G and Lelieveld J 2010 Atmospheric pollutant outflowfrom southern Asia: a review Atmos. Chem. Phys. 10 11017–96
Lu Z, Zhang Q and Streets D G 2011 Sulfur dioxide and primarycarbonaceous aerosol emissions in China and India,1996–2010 Atmos. Chem. Phys. 11 9839–64
Manoj M G, Devara P C S, Safai P D and Goswami B N 2011Absorbing aerosols facilitate transition of Indian monsoonbreaks to active spells Clim. Dyn. 37 2181–98
Massie S T, Torres O and Smith S J 2004 Total Ozone MappingSpectrometer (TOMS) observations of increses in Asianaerosol in winter from 1979 to 2000 J. Geophys. Res.109 D18211
Porch W, Chylek P, Dubey M and Massie S 2007 Trends in aerosoloptical depth for cities in India Atmos. Environ. 41 7524–32
Prasad A K and Singh R P 2007a Comparison of MISR-MODISaerosol optical depth over the Indo-Gangetic basin during thewinter and summer seasons (2000–2005) Remote Sens.Environ. 107 109–19
Prasad A K and Singh R P 2007b Changes in aerosol parametersduring major dust storm events (2001–2005) over theIndo-Gangetic plains using AERONET and MODIS dataJ. Geophys. Res. 112 D09208
Prasad A K, Singh R P and Kafatos M 2006 Influence of coal basedthermal power plants on aerosol optical properties in theIndo-Gangetic basin Geophys. Res. Lett. 33 L05805
Ramachandran S, Kedia S and Srivastava R 2012 Aerosol opticaldepth trends over different regions of India Atmos. Environ.49 338–47
Ramanathan V, Chung C, Kim D, Bettge T, Buja L, Kiehl J T,Washington W M, Fu Q, Sikka D R and Wild M 2005Atmospheric brown clouds: impacts on South Asian climateand hydrological cycle Proc. Natl Acad. Sci. 102 5326–33
Reid J S, Eck T F, Christopher S A, Hobbs P V andHolben B N 1999 Use of the Angstrom exponent to estimatethe variability of optical and physical properties of agingsmoke particles in Brazil J. Geophys. Res. 104 27473–89
Sarkar S, Chokngamwong R, Cervone G, Singh R P andKafatos M 2006 Variability of aerosol optical depth andaerosol forcing over India Adv. Space Res. 37 2153–9
Satheesh S K, Ramanathan V, Holben B N, Krishna Moorthy K,Loeb N G, Maring H, Prospero J M and Savoie D 2002Chemical, microphysical, and radiative effects of Indian Oceanaerosols J. Geophys. Res. 107 4725–37
8

Environ. Res. Lett. 7 (2012) 024003 D G Kaskaoutis et al
Schuster G L, Dubovik O and Holben B N 2006 Angstrom exponentand bimodal aerosol size distributions J. Geophys. Res.111 D07207
Sharma A R, Kharol S K, Badarinath K V S and Singh D 2010Impact of agriculture crop residue burning on atmosphericaerosol loading—a study over Punjab State, India Ann.Geophys. 28 367–79
Singh R P, Dey S, Tripathi S N, Tare V and Holben B 2004Variability of aerosol parameters over Kanpur, northern IndiaJ. Geophys. Res. 109 D23206
Tripathi S N, Dey S, Chandel A, Srivastva S, Singh R P andHolben B 2005 Comparison of MODIS and AERONET
derived aerosol optical depth over the Ganga basin, India Ann.Geophys. 23 1093–101
Wang S, Fang L, Gu X, Yua T and Gao J 2011 Comparison ofaerosol optical properties from Beijing and Kanpur Atmos.Environ. 45 7406–16
Xia X 2011 Variability of aerosol optical depth and Angstromwavelength exponent derived from AERONET observations inrecent decades Environ. Res. Lett 6 044011
Yoon J, von Hoyningen-Huene W, Kokhanovsky A A,Vountas M and Burrows J P 2011 Trend analysis of the aerosoloptical thickness and Angstrom exponent derived from theglobal AERONET spectral observations Atmos. Meas. Tech.Discuss. 4 5325–88
9