Variability and connectivity of plaice populations from ...
26
General rights Copyright and moral rights for the publications made accessible in the public portal are retained by the authors and/or other copyright owners and it is a condition of accessing publications that users recognise and abide by the legal requirements associated with these rights. Users may download and print one copy of any publication from the public portal for the purpose of private study or research. You may not further distribute the material or use it for any profit-making activity or commercial gain You may freely distribute the URL identifying the publication in the public portal If you believe that this document breaches copyright please contact us providing details, and we will remove access to the work immediately and investigate your claim. Downloaded from orbit.dtu.dk on: Mar 27, 2022 Variability and connectivity of plaice populations from the Eastern North Sea to the Western Baltic Sea, and implications for assessment and management Ulrich, Clara; Boje, Jesper; Cardinale, Massimiliano; Gatti, Paul; le Bras, Quentin; Andersen, Michael; Hansen, Jakob Hemmer; Hintzen, Niels T.; Jacobsen, Jonathan B.; Jonsson, Patrik Total number of authors: 16 Published in: Journal of Sea Research Link to article, DOI: 10.1016/j.seares.2013.04.007 Publication date: 2013 Link back to DTU Orbit Citation (APA): Ulrich, C., Boje, J., Cardinale, M., Gatti, P., le Bras, Q., Andersen, M., Hansen, J. H., Hintzen, N. T., Jacobsen, J. B., Jonsson, P., Miller, D. C. M., Eg Nielsen, E., Rijnsdorp, A. D., Sköld, M., Svedäng, H., & Wennhage, H. (2013). Variability and connectivity of plaice populations from the Eastern North Sea to the Western Baltic Sea, and implications for assessment and management. Journal of Sea Research, 84, 40-48. https://doi.org/10.1016/j.seares.2013.04.007
Transcript of Variability and connectivity of plaice populations from ...
General rights Copyright and moral rights for the publications made accessible in the public portal are retained by the authors and/or other copyright owners and it is a condition of accessing publications that users recognise and abide by the legal requirements associated with these rights.
Users may download and print one copy of any publication from the public portal for the purpose of private study or research.
You may not further distribute the material or use it for any profit-making activity or commercial gain
You may freely distribute the URL identifying the publication in the public portal If you believe that this document breaches copyright please contact us providing details, and we will remove access to the work immediately and investigate your claim.
Downloaded from orbit.dtu.dk on: Mar 27, 2022
Variability and connectivity of plaice populations from the Eastern North Sea to theWestern Baltic Sea, and implications for assessment and management
Ulrich, Clara; Boje, Jesper; Cardinale, Massimiliano; Gatti, Paul; le Bras, Quentin; Andersen, Michael;Hansen, Jakob Hemmer; Hintzen, Niels T.; Jacobsen, Jonathan B.; Jonsson, PatrikTotal number of authors:16
Published in:Journal of Sea Research
Link to article, DOI:10.1016/j.seares.2013.04.007
Publication date:2013
Link back to DTU Orbit
Citation (APA):Ulrich, C., Boje, J., Cardinale, M., Gatti, P., le Bras, Q., Andersen, M., Hansen, J. H., Hintzen, N. T., Jacobsen,J. B., Jonsson, P., Miller, D. C. M., Eg Nielsen, E., Rijnsdorp, A. D., Sköld, M., Svedäng, H., & Wennhage, H.(2013). Variability and connectivity of plaice populations from the Eastern North Sea to the Western Baltic Sea,and implications for assessment and management. Journal of Sea Research, 84, 40-48.https://doi.org/10.1016/j.seares.2013.04.007
Journal of Sea Research http://dx.doi.org/10.1016/j.seares.2013.04.007, © 2013 Elsevier
Variability and connectivity of plaice populations from the Eastern
North Sea to the Western Baltic Sea, and implications for assessment
and management.
Clara Ulrich
a, Jesper Boje
a, Massimiliano Cardinale
b, Paul Gatti
a1, Quentin LeBras
a1, Michael Andersen
c,
Jakob Hemmer-Hansend, Niels T. Hintzen
e, Jonathan B. Jacobsen
c, Patrik Jonsson
b, David C.M. Miller
e,
Einar E. Nielsend, Adriaan D. Rijnsdorp
e, Mattias Sköld, Henrik Svedäng
b, Håkan Wennhage
b
aTechnical University of Denmark, National Institute for Aquatic Resources (DTU Aqua), Charlottenlund Castle,
2920 Charlottenlund, Denmark bSwedish University of Agricultural Sciences (SLU), Department of Aquatic Resources, Institute of Marine Research,
Turistgatan 5, SE-453 30 Lysekil, Sweden cDanish Fishermen's Producers' Organization (DFPO), Nordensvej 3, Taulov, 7000 Fredericia
dTechnical University of Denmark, National Institute for Aquatic Resources (DTU Aqua), Vejlsøvej 39, 8600
Silkeborg eInstitute for Marine Resources and Ecosystem Studies (IMARES), Wageningen University & Research Centre
(WUR), P.O. Box 68, 1970 AB IJmuiden, The Netherlands
ABSTRACT An essential prerequisite of sustainable fisheries is the match between biologically relevant processes and management action. Various populations may however co-occur on fishing grounds, although they might not belong to the same stock, leading to poor performance of stock assessment and management. Plaice in Kattegat and Skagerrak have traditionally been considered as one stock unit. Current understanding indicates that several plaice components may exist in the transition area between the North Sea and the Baltic Sea. A comprehensive review of all available biological knowledge on plaice in this area is performed, including published and unpublished literature together with analyses of commercial and survey data and historical tagging data. The results suggest that plaice in Skagerrak is closely associated with plaice in the North Sea, although local populations are present in the area. Plaice in Kattegat, the Belts Sea and the Sound can be considered a stock unit, as is plaice in the Baltic Sea. The analyses revealed great heterogeneity in the dynamics and productivity of the various local components, and suggested for specific action to maintain biodiversity.
Keywords: cod, distribution, Gadus morhua, growth, haemoglobin, physiology
*Corresponding author: Dr. Clara Ulrich, DTU Aqua, Tel +45 21 15 74 86; [email protected]
Article first published online: 24 April 2013 Please note that this is an author-produced PostPrint of the final peer-review corrected article accepted for publication. The definitive publisher-authenticated version can be accesses here: http://dx.doi.org/10.1016/j.seares.2013.04.007

2 Introduction 34
An essential prerequisite of sustainable fisheries is the match between biologically relevant processes and 35
management action (Reiss et al., 2009). Management however, is often undertaken at the scale of large 36
hydrographical basins with fixed administrative boundaries, which can often mismatch the putative ecological 37
and/or genetic structure of the marine populations. Even when known and acknowledged (see e.g. review by 38
Reiss et al., 2009), such a mismatch can often not be easily solved. This is partly due to the inertia inherent in 39
fisheries management and its set of conflicting objectives, but partly also because the exact characterization 40
and quantification of the mismatch is a difficult task (ICES 2011b). 41
Fish species show complex life cycles that comprise ontogenic habitat segregation. A population can only 42
sustain itself when the habitats are connected and the fish can close the life cycle (Sinclair, 1988, Rijnsdorp et 43
al., 2009). Fish of different populations may mix during feeding while they segregate during the spawning 44
period. Hence, it is important to know if the fish in a certain area belong to a single panmictic population, or 45
belong to different populations (Metcalfe, 2006; Volckaert 2013). Stock assessment usually builds on catches 46
from a given area, and if different genetic populations are simultaneously present within this area, such a 47
procedure will produce an overall picture of stock dynamics, which might not reflect actual trends within these 48
individual populations (Kell et al., 2009). All individual components should however be maintained and their 49
dynamics monitored to ensure the overall sustainability of the stock. 50
For some species, such as herring, it has been possible to monitor the relative proportion of each population in 51
an area (e.g. Clausen et al., 2007, Bierman et al., 2010, ICES, 2011b). But in most cases it is not possible, and 52
fish stocks are usually assessed ignoring the underlying structure of sub-populations. This may increase the risk 53
of depletion of local stocks and stock collapse (Hilborn et al., 2003, Kell et al., 2009, Ying et al., 2011). 54
The European plaice (Pleuronectes platessa, Pleuronectidae) is predominantly distributed within the North Sea 55
but extends to adjacent waters. Plaice stock structure comprises different spawning components, which 56
separate during spawning and mix during feeding. Juveniles of different spawning components mix also partly 57
on nursery grounds (Hunter et al., 2004, Kell et al., 2004, Hufnagl et al., 2012). In spite of the assumed 58
connectivity between components, plaice abundance is assessed and managed as a suite of ten discrete stock 59
units from the West of Ireland to the Eastern Baltic Sea (ICES, 2010). Only for the eastern English Channel is 60
the connectivity with both the Western English Channel and the North Sea coarsely accounted for in stock 61
assessment and advice (ICES, 2011a). Noticeably, although several different spawning components are 62
acknowledged, Hoarau et al. (2002, 2004) found only weak genetic differentiation between the North Sea-Irish 63
Sea, Norway, the Baltic and the Bay of Biscay using mt-DNA and microsatellite genetic markers. 64
On the Eastern side of the North Sea, a single plaice stock has historically been defined in the transition area to 65
the Baltic Sea, in ICES Division IIIa (covering two sub-divisions, Skagerrak (IIIa North) and Kattegat (IIIa 66
South)). This area is characterised by a great heterogeneity of hydrographical conditions, with a very steep 67
salinity gradient and important mainstream currents (Danielssen et al, 1997, Figure 1). The assessment of this 68
stock by the International Council for the Exploration of the Sea (ICES) has increasingly been deemed as 69
unreliable and the annual advice for future catch opportunities has thus long been given without sound scientific 70
basis (ICES, 2010). This has important political and socio-economic consequences. Although plaice is not 71
among the highest valued species in the area, it is nevertheless targeted by a coastal fishery along the Danish 72
Northwestern Jutland coast. It enters also a mixed trawl fishery together with cod and Nephrops. Thus, the 73
scientific inability to deliver a robust stock assessment in area IIIa is a concern for the sustainability of the 74
stock itself but also for the local fishery that exploits it. In addition, the lack of agreed assessment is an 75
institutional barrier against fisheries ecolabelling, which has created mistrust and frustration among 76
stakeholders. Overall, there is an urgent need to improve the whole governance scheme for this stock. 77
Over the years, a number of initiatives have been taken within ICES to improve the assessment of this stock 78
(e.g. ICES, 2006), but with limited success. A major problem is the difficulty in tracking cohorts in the catch-at-79
age matrix. This study investigates the potential sources of uncertainty and variability driving this issue. It 80
presents a comprehensive literature review of the biology of plaice in the area, complemented by an analysis of 81
recent commercial catch and survey data and historical tagging data, that may throw light on the stock 82
structure in the transition area. A significant part of the relevant information was found in the grey literature 83
including ICES working group reports and unpublished master theses and laboratory studies. This synthesis 84
allows us to produce a revised picture of the plaice stock structure from the Eastern North Sea to the Baltic 85
Sea, and we discuss the implications for sustainable management. 86
87
2.1 Distribution 88
2.1.1 Spawning and egg/larvae drift 89
Spawning in the Kattegat usually occurs in late February and early March at depths between 30 and 40 meters 90
(Nielsen et al., 2004a) and in temperatures at about 4 degrees Celsius (Simpson, 1959). The main plaice 91
spawning grounds are located in the south-western part of the Kattegat (Johansen, 1912; Poulsen, 1939, 92
Ulmestrand, 1992; Nielsen et al., 1998; 2004a). Spawning sites have also been indicated along the Swedish 93
Kattegat coast (Trybom, 1908; Molander, 1923). Modelling studies have indicated that the Swedish coast was 94
formerly occupied by extensive aggregations of adult fish during spawning time, and that the reduction of this 95
component is mostly a recent feature (Cardinale et al., 2011). 96
The evidence of spawning in the Skagerrak is less clear and available information is inconsistent or sometimes 97
contradictory. Johansen (1912) found only few eggs and larvae in the Skagerrak and therefore considered 98
spawning in Skagerrak unimportant. The egg density in the North Sea off the north coast of Denmark was 99
observed to be low by Taylor et al. (2007), but high by Munk et al. (2009). Potential inflow of North Sea eggs 100
and larvae in Skagerrak is corroborated by particle drift modelling in the North Sea (Hufnagl et al., 2012), 101
which predicts an inflow of North Sea water and thereby eggs and larvae into Skagerrak during spring. This 102
pattern could be expected to be more pronounced nowadays, in the current period of record-high North Sea 103
plaice abundance (ICES, 2012a) and northerly shift in North Sea plaice distribution (Engelhard et al., 2011). 104
However, low to moderate spawning activity was noticed in the south-western part of the Skagerrak by 105
Molander (1923), Ulmestrand (1992) and Nielsen and Bagge (1985). The modelled results by Cardinale et al. 106
(2011) also suggest that aggregations of adult fish during 1st quarter may occur along the Danish North coast. 107
In addition, anecdotal information from the Danish fishing industry has reported large catches of spawning 108
females along the Danish Skagerrak coast. However, there are very little records of spawning or spent females 109
in Skagerrak in IBTS spring data (Gatti, unpublished2). 110
This information indicates therefore that spawning in the Skagerrak is likely to occur, but a significant part of 111
the eggs and larvae settling in shallow waters in the Skagerrak are considered to originate from the North Sea 112
stock. This drift is reinforced during windy winters, where larvae may drift further into the Kattegat (Poulsen 113
1939, Nielsen et al., 1998). 114
Beyond the area IIIa, spawning is likely to take place in the Belt Sea and in the Sound (Svedäng et al. 2004). 115
Free-floating eggs are found in the deeper basins in the southern Baltic Sea (Nissling et al. 2002). Both 116
spermatozoa and eggs are adapted to the low salinity conditions that prevail in the southern Baltic Sea. 117
2.1.2 Nurseries 118
Plaice are dependent on shallow (0-3 m) sediment substratum as nursery grounds during their early juvenile 119
stage (Gibson 1999). For plaice, variation in year-class strength is generated during the pelagic stages and 120
subsequently dampened during the early juvenile stage indicating that density dependent processes are acting 121
on the nursery grounds (van der Veer 1986, Beverton 1995). These nurseries are important for the population 122
dynamic since a relationship between the nursery size and the population abundance has been hypothesized 123
(Rijnsdorp et al., 1992; van der Veer et al., 2000). 124
In the Skagerrak-Kattegat area potential plaice nursery grounds are present along the Swedish west coast and 125
along the Danish Kattegat coast (Wennhage et al., 2007). The absence of tides in the area makes the physical 126
condition in the shallow nursery areas benign and stable (Gibson et al. 1998), but excludes the possibility for 127
selective tidal transport as a mechanism for plaice larvae to reach nursery grounds. The Swedish Skagerrak 128
coast is rocky, but contains many small nursery grounds within the complex archipelago. The inter-annual 129
variation in supply of larvae to the Eastern Skagerrak nursery grounds is correlated to prevalence of onshore 130
wind (Pihl 1990, Nielsen et al., 1998). Growth rate is negatively correlated and mortality positively correlated to 131
settlement density in the area (Pihl et al. 2000). The Kattegat has more of an open coast with plaice nursery 132
habitats fringing the coast. Juvenile recruitment in the nursery areas along the southern part of the Danish east 133
coast drift mainly from the spawning areas in southern Kattegat (Nielsen et al. 1998). 134
2 Gatti, 2011. Source of uncertainties in the catch-at-age matrix of the IIIa plaice stock. Bachelor internship report, Agrocampus Ouest,
Rennes, France. Unpublished.

2.1.3 Adults 135
The distribution of adults can be inferred from the commercial fishery data and the scientific surveys. The 136
fishery operates year round in the area IIIa, without strong seasonal patterns. The most productive area is the 137
Danish North coast from the North Sea boundary to the most Northerly harbour of Skagen, and there is a 138
continuum of catches from there to the North Sea (Figure 2). Catches in the Western Skagerrak component 139
normally constitute at least 90–95% of the total Skagerrak catches. There are less catches in the North of 140
Kattegat and along the Swedish coast of Skagerrak. The fishery is also important in the Southwestern Kattegat 141
and Belt Sea, and then in the Baltic Sea around the island of Bornholm. During spawning season, adults 142
aggregations recorded by surveys reflect that general pattern (Cardinale et al., 2011). 143
Plaice is primarily caught by targeted Danish fisheries using selective gears such as gillnets and Danish seine, 144
and also in demersal trawl mixed fisheries. Overall, trends in Danish landings in Skagerrak are comparable to 145
those in the neighbouring central North Sea (subdivision IVb), whereas landings in Kattegat have continuously 146
decreased (Figure 3). Beyond the effect of external factors linked to regulations and alternative fishing 147
opportunities, such trends might also reveal a closer coupling in the dynamics of the plaice populations in 148
Skagerrak and North Sea than with the Kattegat. 149
2.2 Migrations 150
Nielsen et al. (unpublished3) compiled an extensive collection of historical (1903-1964) Danish plaice tagging 151
experiments in the fishing grounds around Denmark, where about 13000 fish were recaptured from an initial 152
release of about 40000 individuals. The tagging started in 1903-4 in Kattegat, Skagerrak and the North Sea, 153
while the Belt Sea taggings was initiated in 1922. The overall dataset is patchy and unbalanced since the 154
successive taggings experiments were performed independently from each other, but represents nevertheless a 155
new source of information of potential interest. Releases were performed in all seasons but mainly concentrated 156
in March-May and September-November. For the analyses of migrations between areas, recaptures were 157
calibrated with nominal landings from ICES annual statistics, as measures of fishing effort were not available for 158
the time series. 159
These Danish tagging data revealed stable migration pattern over the years. In general limited movements 160
were recorded, especially in the Belt, Western Baltic, Kattegat and North Sea, where up to 90% of the fish were 161
recaptured in the same area as they were released (Figure 4). In total, plaice migration into and out of the 162
entire management area IIIa was in the range 5-10% of the tagged individuals. However most tagged fish were 163
recaptured within the tagging year, and only 18% of the tags had stayed more than one year at sea. Remote 164
recaptures within the year is indicative of seasonal migration, whereas remote recapture after more than year 165
may also reflect ontogenic migration. 166
Considering all tags, the recaptures from the Skagerrak releases exhibited the highest rates of movement 167
(>40%) indicating that this area is a transitional area. There was an easterly net within-year flow towards the 168
3 Nielsen, E., Boje, J., and Nicolaisen. H. Plaice tagging in Danish waters 1903-1964. Working Document to ICES (2006)
North of Kattegat which could reflect: (1) a spawning migration of a Skagerrak stock towards spawning around 169
Skagen peninsula as suggested by Cardinale et al. (2011) or (2) a summer migration of fish spawning in the 170
westerly areas or in the North Sea towards feeding grounds in Skagerrak. Relative little mixing occured 171
between fish in the northern and southern Kattegat. However, southern Kattegat seems more connected to the 172
Belts and the Baltic. Considering only the tags recaptured after more than one year, the patterns appeared 173
quite different (Figure 4). No eastwards migrations were observed in Skagerrak and Kattegat, but conversely a 174
significant amount of fish released there were caught in the North Sea. 175
Swedish tagging experiments between 1903 and 1909 of plaice on the Swedish Kattegat coast are consistent 176
with these patterns. They indicated a resident adult population (Trybom, 1905; 1908; Molander, 1944), 177
although a significant proportion of the juvenile fish tagged in the northern Kattegat migrated towards western 178
Skagerrak and the North Sea as they became older. 179
In the Skagerrak, tagging studies on the Swedish Skagerrak coast in the 1920s (Molander, 1923), and in the 180
1960s (Jacobsson, 1982), showed that the resident component was very small (estimated by maturity 181
examinations), indicating that the coastal zone may function as a nursery area for offshore spawning stocks. At 182
ages 2-4 years, maturing fish left the coast and swam towards the western Skagerrak and to various locations 183
in the North Sea. It was noted that the size and age at which the plaice left their coastal nursery grounds varied 184
systematically between fjords. It should also be observed that some tagged fish migrated for spawning to the 185
northern part of the Swedish Kattegat coast (Molander, 1923). 186
Additionally, three tagging experiments were conducted in the Baltic Sea (SD 25) on the Swedish east coast 187
between 1908 and 1909. In spite of low recapture rates, the experiments indicated rather stationary behaviour 188
with no reported recaptures beyond the western Baltic (SD 24) (Trybom, 1911). This is also consistent with the 189
Danish tagging data. 190
Parasite data corroborated the results of the tagging experiments and showed that adult plaice residing in the 191
Skagerrak between spring and autumn may migrate into the North Sea during the spawning period in winter 192
(van Banning et al., 1978). Skagerrak plaice was characterised by a high infestation rate with the parasite 193
Myxabolis aeglefinus. Infestation rate was high throughout the year in Skagerrak plaice (>30%), but showed 194
both a clear seasonal and latitudinal trend in North Sea areas. Infestation rates were highest during the 195
spawning period in the North Sea increasing from a maximum of about 1% in the Southern Bight and 196
Flamborough spawning grounds, to 5-10% in the German Bight and 10% in the Fisherbank spawning ground. 197
It is important to notice that all these tagging data were old (up to 100 years) and may no longer be 198
representative for the current situation since population dynamics may have changed in relation to the 199
environmental conditions as shown in Cardinale et al. (2011). Therefore, we conclude that these older data 200
provide a useful overall picture of the putative population structure, but do not allow any quantification of its 201
current dynamics. 202
2.3 Genetic structure 203
A number of studies have investigated the genetic population structure of plaice across its Northern European 204
distribution (Hoarau et al. 2002, 2004; 2005; Watts et al. 2010: Was et al. 2010). In particular, transitions 205
have been studied through samples from the North Sea, Western Baltic and Eastern Baltic. However, samples 206
from IIIa have not been included in any of the studies. Generally, these studies have found very limited genetic 207
structure using both nuclear microsatellites and mtDNA SSCP (Single Strand Conformation Polymorphism) 208
analysis, the only exceptions being the very distinct off shelf populations from Iceland and Faeroe Islands 209
(Hoarau et al. 2002; Was et al. 2010). Within the North Sea region, Hoarau et al. (2002; 2005) found no 210
evidence of genetic structuring of populations, while they found that Western Baltic plaice were weakly 211
distinguishable from North Sea/Irish Sea plaice using mtDNA analysis. Meanwhile, using microsatellites did not 212
allow distinguishing between Baltic and North Sea populations (Was et al., 2010). 213
These results differ from recent genetic studies of other marine fish (including other flatfish such as flounder 214
and turbot) in the transition area between the North Sea and the Baltic Sea, that revealed a relatively high 215
degree of population structuring with a gradual genetic change correlating with the changes in environmental 216
variables, and salinity in particular (Limborg et al., 2009, Nielsen et al. 2004b, Hemmer-Hansen et al. 2007). 217
2.4 Growth and reproduction 218
Age-Length Keys (ALK) by sex and area during first quarter from 2005 to 2010 were combined from the Danish 219
harbour samples and the IBTS data (see Supplementary Online Material), and von Bertalanffy curves were 220
fitted using nls function in R (Figure 5). The ALKs are rather flat and spread, with overlapping distribution of 221
ages across length. This variability is not a priori considered to reflect the actual uncertainty in the otolith aging 222
itself, since there is a fair amount of consistency across the age interpretation of various experienced age 223
readers (L. Worsøe Clausen, pers. Com.), especially for the younger ages. Rather, this reflects that the 224
individual variability in growth is large and blurs the signal in data, contributing to the lack of cohort tracking in 225
the catch-at-age matrix. This individual variability could be linked to either the heterogeneity of local 226
hydrographical conditions impacting growth, and/or to catches originating from different populations. 227
Differences in growth patterns by sex are marked; however, there are average differences in growth across 228
areas only for males. 229
First quarter IBTS data from 2005 to 2010 were used to estimate maturity ogives in Kattegat and Skagerrak 230
(Figure 6). Every fish which had a maturity stage greater than or equal to 2 was considered to be mature. 231
Maturity differences were found between Skagerrak and Kattegat. As Rijnsdorp (1989) showed in the North 232
Sea, there is an increase of age at 50% maturity (A50) from South to North. On average, a Kattegat plaice 233
matures earlier than a Skagerrak one. 234
3 Discussion 235
3.1 Synthesis 236
This comprehensive work of both literature review of published and unpublished studies as well as compilation 237
and analysis of various data suggest a complex picture of plaice stock structure between the North Sea and the 238
Baltic Sea. The information available is often sporadic, fairly old, and sometimes inconsistent or contradictory. 239
Consequently, the linkages between units cannot be quantified nor precisely mapped. 240
However, some broad and qualitative patterns in plaice distribution and population dynamics have emerged. 241
The area IIIa is highly heterogeneous in terms of hydrographical conditions, and it is hypothesised that salinity, 242
currents and wind are potentially strong drivers of the dynamics of growth and populations. There is evidence 243
of spawning by local populations at both boundaries of the area in the Western Skagerrak and the South-244
western Kattegat, but the inflow of eggs and larvae from the North Sea is expected to be important. The 245
importance of the Swedish coast as a spawning area has decreased to a very low level (Cardinale et al., 2011), 246
but this area still acts as important nursery grounds connected to both the local and the North Sea spawning 247
grounds. A westerly homing behaviour of the North Sea juveniles has been observed through the tagging 248
studies, whereas some both-ways seasonal adult migration has been recorded at both boundaries and also 249
within Skagerrak. The Northern Kattegat (around the Island of Læsø) seems to act as an internal border 250
between Skagerrak and Kattegat, with lesser fish and fishing density and limited exchanges. Although there is a 251
continuum of plaice fishing from the North Sea to the Baltic Sea, the main fishery is primarily located towards 252
the North Sea boundary. Similar trends in catch rates and hydrographical features across this boundary suggest 253
also that the increasing North Sea stock may extend beyond the administrative boundary. 254
In summary, catches in the Western Skagerrak are therefore expected to be a mix of: i) adult North Sea plaice 255
whose distribution extends beyond the North Sea boundary; ii) juvenile North Sea plaice that hatched in area 256
IIIa and return to the North Sea to spawn; iii) local populations spawning along the Danish coast. In the area 257
further East towards the Swedish coast and Northern Kattegat, fish densities have dropped to historically low 258
levels and catches are low. This area doesn’t seem to beneficiate from North Sea adults migrating into the 259
Kattegat. Therefore, catches in this area may be mostly constituted of categories ii) and iii) above. Finally, 260
catches in the Kattegat (South from Læsø) and in the Belt Sea may mostly be constituted of local populations, 261
although some North Sea juveniles (category ii) may still have settled in these more southerly areas. 262
This complex picture of stock structure, together with the diversity of local hydrographical conditions, 263
complicates the study of the population dynamics in the area. Scientific data from surveys and harbour 264
sampling show great individual variability of growth patterns, and extrapolating from these samples to the 265
stock level produces a poor tracking of the cohorts. 266
267
3.2 Implications for stock assessment and management 268
The information on biology and fishery of plaice in IIIa and adjacent waters reviewed above, supports a revision 269
of the delineation of plaice stocks and corresponding management areas into three stocks (ICES 2012a, b). In 270
terms of stock assessment, plaice in the Skagerrak is shown to be more closely associated with North Sea 271
plaice. it seems therefore sensible to include Skagerrak in the North Sea stock assessment in spite of the 272
evidence for a spatial structure in the Skagerrak. The second stock is found further south and comprises the 273
plaice in Kattegat (SD 21), Belts (SD 22) and Sound (SD 23). The third plaice stock is in the Baltic proper (SD 274
24-32). According to spatially disaggregated landings figures (Figure 2), the actual boundary between the 275
Kattegat-Belt-Sound stock and the Baltic stock may potentially be within the SD 24 rather than at the boundary 276
between SD22 and SD 24; but this may cover too few catches to be considered manageable. 277
ICES (2012a, b) produced exploratory assessments of these alternative stock definitions. A combined 278
assessment of the Skagerrak with the North Sea stock shows an upward scaling of the total biomass by about 279
15% but does not affect the general trends. Meanwhile, the assessment of Kattegat plaice together with Belt 280
and Sound is more internally consistent than what was previously observed when it was assessed together with 281
Skagerrak 282
In terms of improved scientific advice for management, ICES (2012c) gave specific consideration to the spatial 283
structure in Skagerrak. A relative index of adult aggregation during spawning modified from Cardinale et al. 284
(2011) was suggested by ICES (2012a, b) as a proxy for a SSB index for local plaice units, which showed 285
different trends in dynamics 286
4 Conclusion and future perspectives 287
This multi-disciplinary work represents a milestone in a long and comprehensive endeavour, whose starting 288
point was poor fisheries management and unresolved stock assessment issues. This unsustainable situation 289
requires improved understanding and revision of basic biological hypotheses, which in turn would suggest 290
alternative approaches to fisheries management. An important step forward has been achieved here in trying to 291
infer the structure and connectivity of plaice populations in the transition area between the North Sea and the 292
Baltic Sea based on available, but fragmented, knowledge. A complex picture of partly overlapping and 293
interlinked populations with variable growth patterns has been implied from the assembled data, supporting the 294
idea that the area IIIa cannot be considered and assessed as an isolated stock. Pragmatic approaches are now 295
being implemented on an interim basis, as a first step towards sustainable management of the plaice fishery in 296
the Skagerrak-Kattegat area. 297
New scientific analyses are currently being launched to better inform the origin of catches, through analyses of 298
otolith shape and genetic markers in combination with hydrographical models (Gürkan et al., 2013). It is also 299
hypothesised that the apparent contradictions in the observed lack of genetic differentiation for plaice compared 300
to other fish stocks may be due to the choice of genetic markers in the various studies (potentially combined 301

with inappropriate sampling design). As a tool, genetic markers have evolved towards targeting genes subject 302
to environmental selection. Such markers may differentiate faster even under relatively high levels of migration 303
(Nielsen et al. 2009). Thus, new findings of low but significant levels of population structuring or genetic 304
isolation by distance may have strong implications for interpretation of evolutionary separation, migration rates 305
and associated population based management (Reiss et al. 2009). Therefore, the ongoing analyses of plaice 306
genetics in the transition area could potentially shed new light on the structuring of populations. Such 307
information will allow disentangling the effect of genetic structuring from environment forcing in the growth 308
patterns, potentially providing quantitative information on the degree of mixing of the various components and 309
more accurate assessment of the status of these. 310
5 Acknowledgements 311
The work from DTU Aqua and DFPO authors has been mainly financed by the EFF project “Certified 312
sustainability of Danish Fisheries”. This support is gratefully acknowledged. The authors wish also to thank 313
Barbara Schoute at the ICES secretariat for her support and help in integrating the scientific results into 314
operational advice, as well as the monitoring group at DTU Aqua for providing data and practical knowledge. 315
316
6 References 317
Beverton, R.J.H, 1995. Spatial limitation of population size: The concentration hypothesis. Neth. J. Sea Res. 34, 318
1–6. 319
320
Bierman, S.M., Dickey-Collas, M., van Damme, C.J.G., van Overzee, H.M.J., Pennock-Vos, M.G., Tribuhl, S.V., 321
Clausen, L.A.W., 2010. Between-year variability in the mixing of North Sea herring spawning components leads 322
to pronounced variation in the composition of the catch. ICES J. Mar. Sci. 67, 885–896. 323
324
Cardinale, M., Hagberg, J., Svëdang, H., Bartolino, V., Gedamke, T., Hjelm, J., Börjesson, P., Norén, F., 2009. 325
Fishing through time: population dynamics of plaice (Pleuronectes platessa) in the Kattegat–Skagerrak over a 326
century. Popul. Ecol., 52, 251-262. 327
328
Cardinale, M., Bartolino, V., Llope, M., Maiorano, L., Sköld M., Hagberg., J., 2011. Historical spatial baselines in 329
conservation and management of marine resources. Fish Fish 12, 289–298. 330
331

Clausen, L.A.W, Bekkevold, D., Hatfield, E.M.C., Mosegaard, H., 2007. Application and validation of otolith 332
microstructure as a stock identification method in mixed Atlantic herring (Clupea harengus L) stocks in the 333
North Sea and western Baltic. ICES J. Mar. Sci. 64: 377-385. 334
335
Danielssen, D.S., Edler, L., Fonselius, S., Hernroth, L., Ostrowski, M., Svendsen, E., Talpsepp, L., 1997. 336
Oceanographic variability in the Skagerrak and Northern Kattegat, May–June, 1990. ICES J. Mar. Sci. 54, 753–337
773. 338
339
Engelhard, G.H., Pinnegar, J.K., Kell, L.T., Rijnsdorp, A.D., 2011. Nine decades of North Sea sole and plaice 340
distribution. ICES J. Mar. Sci. 68, 1090–1104. 341
342
Gibson, R.N., Pihl, L., Burrows, M.T., Modin, J., Wennhage, H., Nickell, L.A, 1998. Diel movements of juvenile 343
plaice Pleuronectes platessa in relation to predators, competitors, food availability and abiotic factors on a 344
microtidal nursery ground. Mar. Ecol. Prog. Ser. 165, 145–159. 345
346
Gibson, R.N., 1999. The ecology of the early life stages of the plaice, Pleuronectes platessa L.: A review. 347
Tohoku National Fisheries Research Institute 17–50. 348
349
Gürkan, Z., Christensen, A., Maar, M., Møller, E.F., Madsen, K.S., Munk, P., Mosegaard, H., 2013. Spatio-350
temporal dynamics of growth and survival of Lesser Sandeel early life-stages in the North Sea: Predictions from 351
a coupled individual-based and hydrodynamic-biogeochemical model. Ecol. Model., 250, 294-306. 352
353
Hemmer-Hansen, J.H., Nielsen, E.E., Grønkjær, P., Loeschcke, V., 2007. Evolutionary mechanisms shaping the 354
genetic population structure of marine fishes; lessons from the European flounder (Platichthys flesus L.). Mol. 355
Ecol. 16, 3104-3118. 356
357
Hilborn, R., Quinn, T. P., Schindler, D. E., Rogers, D. E. 2003. Biocomplexity and fisheries sustainability. Proc. 358
Natl. Acad. Sci. USA 100, 6564–6568. 359
360
Hoarau, G., Rijnsdorp, A.D., Van Der Veer, H.W., Stam, W.T., Olsen, J.L., 2002. Population structure of plaice 361
(Pleuronectes platessa L.) in northern Europe: Microsatellites revealed large-scale spatial and temporal 362
homogeneity. Mol. Ecol. 11, 1165-1176. 363
364
Hoarau, G., Piquet, A.M.T., van der Veer, H.W., Rijnsdorp A.D., Stam, W., Olsen, J.L., 2004. Population 365
structure of plaice (Pleuronectes platessa L.) in northern Europe: a comparison of resolving power between 366
microsatellites and mitochondrial DNA data. J. Sea Res. 51, 183-190. 367
368
Hoarau, G., Boon, E., Jongma, D.N. Ferber, S., Palsson, J., Van Der Veer, H.W., Rijnsdorp, A.D., Stam, W.T., 369
Olsen, J.L., 2005. Low effective population size and evidence for inbreeding in an overexploited flatfish, plaice 370
(Pleuronectes platessa L.). Proc. Roy. Soc. Lond. B Biol. Sci. 272, 497-503. 371
372
Hufnagl, M., Peck, M.A., Nash, R.D., Pohlmann, T., Rijnsdorp, A.D.,2012. Changes in potential North Sea 373
spawning grounds of plaice (Pleuronectes platessa L.) based on early life stage connectivity to nursery habitats. 374
J. Sea Res. doi.org/10.1016/j.seares.2012.10.007 375
376
Hunter, E., Metcalfe, J.D., Arnold, G.P., Reynolds, J.D., 2004. Impacts of migratory behaviour on population 377
structure in North Sea plaice. J. Anim. Ecol. 73, 377-385. 378
379
ICES, 2006. Report of the Working Group on the Assessment of Demersal Stocks in the North Sea and 380
Skagerrak (WGNSSK). ICES CM 2011/ACFM:09. 381
382
ICES, 2010. Report of the ICES Advisory Committee 2010. ICES Advice, 2010. Book 6, 309 pp. 383
384
ICES, 2011a. Report of the Working Group on the Assessment of Demersal Stocks in the North Sea and 385
Skagerrak (WGNSSK), 4 - 10 May 2011, ICES Headquarters, Copenhagen. ICES CM 2011/ACOM:13. 1190 pp. 386
387
ICES, 2011b. Report of the Workshop on the Implications of Stock Structure (WKISS), 5-7 April 2011, ICES 388
Headquarters, Copenhagen. ICES CM 2011/SSGSUE:03. 53 pp. 389
390
ICES, 2012a. Report of the Working Group on the Assessment of Demersal Stocks in the North Sea and 391
Skagerrak (WGNSSK), 27 April - 3 May 2012, ICES Headquarters, Copenhagen. ICES CM 2012/ACOM:13.1204 392
pp. 393
394
ICES, 2012b. Report of the Workshop on the Evaluation of Plaice Stocks (WKPESTO), 28 February - 1 March 395
2012, ICES Headquarters, Copenhagen. ICES CM 2012/ACOM:32. 59 pp. 396
397
ICES, 2012c. Special request Advice June 2012. Joint EU–Norway request on management measures for plaice 398
in the Skagerrak. ICES Advice, 2012. Book 6 399
400
Jacobsson, A, 1982. Fiskmärkningar (Fish taggings). In Vatten 1977-1981. Report from the Swedish EPA. in 401
Swedish. 402
403
Johansen, A.C., 1912. Rødspættefiskeriet i Bælthavet (Plaice fisheri i the Belt Sea). Skr. Kommn. Havunders. 7. 404
In Danish. 405
406
Kell, L.T., Scott, R., Hunter, E., 2004. Implications for current management advice for North Sea plaice: Part I. 407
Migration between the North Sea and English Channel. J. Sea. Res. 51, 287-299. 408
409
Kell, L.T., Dickey-Collas, M., Hintzen, N.T., Nash, R.D.M., Pilling, G.M., Roel, B.A., 2009. Lumpers or splitters? 410
Evaluating recovery and management plans for metapopulations of herring. ICES J. Mar. Sci. 66, 1776–1783. 411
412
Limborg, M., Pedersen, J.S., Hemmer-Hansen, J., Tomkiewicz, J., Bekkevold, D., 2009. Genetic population 413
structure of European sprat (Sprattus sprattus L.): differentiation across a steep environmental gradient in a 414
small pelagic fish. Mar. Ecol. Prog. Ser. 379, 213-224. 415
416
Metcalfe, J.D., 2006. Fish population structuring in the North Sea: understanding processes and mechanisms 417
from studies of the movements of adults. J. Fish Biol. 69, 48–65. 418
419
Molander, A.R, 1923. Några result av märkningar och tillväxtundersökningar av rödspotta i Bohuslänska fjordar 420
(Some results of tagging and growth investigations of plaice in fjords in the county of Bohuslän). Svensk 421
Fiskeri-tidskrift 32:101-114. In Swedish. 422
423
Molander, A.R., 1944. Rödspotta och torsk i södra Kattegatt (Plaice and cod in the southern Kattegat). 424
Meddelanden från Svenska Hydrografisk-biologiska Kommissionen. Biologi I. 23 pp. In Swedish. 425
426
Munk., P., Fox, C.J., Bolle, L.J., van Damme, C.J.G., Fossum, P., Kraus, G., 2009. Spawning of North Sea fishes 427
linked to hydrographic features. Fish. Oceanogr. 18, 458–469. 428
429
Nielsen, E., Bagge, O., 1985. Preliminary investigations of 0-group and 1-group plaice surveys in the Kattegat 430
in the period 1950-84. ICES CM 1985/G:19, 34 pp. 431
432
Nielsen, E., Bagge, O., MacKenzie, B.R., 1998. Wind-induced transport of plaice (Pleuronectes platessa) early 433
life-history stages in the Skagerrak-Kattegat. J. Sea Res. 39, 11– 28. 434
435
Nielsen, E., Støttrup, J.G., Heilmann, J., MacKenzie, B.R., 2004a. The spawning of plaice Pleuronectes platessa 436
in the Kattegat. J. Sea Res. 51, 219-228 437
438
Nielsen, E.E., Nielsen, P.H., Meldrup, D., Hansen, M.M., 2004b. Genetic population structure of turbot 439
(Scophthalmus maximus L.) supports the presence of multiple hybrid zones for marine fishes in the transition 440
zone between the Baltic Sea and the North Sea. Mol. Ecol. 13, 585-595. 441
442
Nielsen, E.E., Hemmer-Hansen, J., Larsen, P.F., Bekkevold, D., 2009. Population genomics of marine fishes: 443
identifying adaptive variation in space and time. Mol. Ecol. 18, 3128-3150. 444
445
Nissling, A., Westin, L., Hjerne, O., 2002. Reproductive success in relation to salinity for three flatfish species, 446
dab (Limanda limanda), plaice (Pleuronectes platessa), and flounder (Pleuronectes flesus), in the brackish 447
water Baltic Sea. ICES J. Mar. Sci. 59: 93-108. 448
449
Pihl, L., 1990. Year-class strength regulation in plaice (Pleuronectes platessa L.) on the Swedish west coast. 450
Hydrobiol. 195, 79–88. 451
452
Pihl, L., Modin, J., Wennhage, H., 2000. Spatial distribution patterns of newly settled plaice (Pleuronectes 453
platessa L.) along the Swedish Skagerrak archipelago. J. Sea Res. 44, 65–80. 454
455
Poulsen, E.M., 1939. On the migrations and racial character of the plaice. Danish Biol. Sta. XLIII, 1938, 78 pp. 456
457
Reiss, H., Hoarau, G., Dickey-Collas, M., Wolf, W.J., 2009. Genetic population structure of marine fish: 458
mismatch between biological and fisheries management units. Fish Fish. 10, 361-395. 459
460
Rijnsdorp, A.D., 1989. Maturation of male and female North Sea plaice (Pleuronectes platessa L.). ICES J. Mar. 461
Sci. 46, 35 –51. 462
463
Rijnsdorp, A.D., van Beek, F.A., Flatman, S., Millner, R.M., Riley, J.D., Giret, M., de Clerck, R., 1992. 464
Recruitment of sole stocks, Solea solea (L.) in the northeast Atlantic. Neth. J Sea Res. 29, 173–192. 465
466
Simpson, A.C., 1959. The spawning of the plaice (Pleuronectes platessa) in the North Sea. Fish. Invest. Ser. II 467
XXII, 7, 111 pp. 468
469
Sinclair, M., 1988. Marine Populations: An Essay on Population Regulation and Speciation. University of 470
Washington Press. 252 pp. 471
472
Taylor, N., Fox, C.J., Bolle, L., Dickey-Collas, M., Fossum, P.G.K, Munk, P., Rolf, N., Van Damme, C., Vorbach, 473
M., 2007. Results of the spring 2004 North Sea ichthyoplankton surveys. ICES Coop. Res. Rep., 285. 474
475
Trybom, F, 1905. Märkning af rödspättor vid Sveriges vestkust 1902 och 1903 (Tagging of plaice on the west 476
coast of Sweden 1902 and 1903). Meddelanden från Svenska Hydrografisk-biologiska Kommissionen 1-7. in 477
Swedish. 478
479
Trybom, F, 1908. Svenska rödspättemärkningar och mätningar 1904 and 1905 (Swedish tagging of plaice and 480
measurements 1904 and 1905). Meddelanden från Svenska Hydrografisk-biologiska Kommissionen 1-14. in 481
Swedish. 482
483
Trybom, F, 1911. Svenska rödspättemärkningar 1909, med tillägg från äldre märkningar (Swedish tagging of 484
plaice 1909, with supplement for older taggings). Meddelanden från Svenska Hydrografisk-biologiska 485
Kommissionen 1-14. in Swedish. 486
487
Ulmestrand, M, 1992. The geographical distribution, size composition and maturity stages of plaice 488
Pleuronectes platessa (L.) during spawning season in the Skagerrak and Kattegat. Medd. Havsfiskelab., 325 489
(1992) 8 pp. 490
491
Van Banning, P., de Veen, J.F., van Leeuwen P.I., 1978. The myxosporidian parasite Myxobolus aeglefini 492
Auerbach 1906, and its use as a parasitological tag for plaice of the eastern North Sea. ICES CM 1978/G:48. 22 493
pp. 494
495
van der Veer, H.W., 1986. Immigration, Settlement, and density-dependent mortality of a larval and early 496
postlarval 0-group plaice (Pleuronectes platessa) population in the Western Wadden Sea. Mar. Ecol.-Prog. Ser. 497
29, 223–236. 498
499
van der Veer, H.W., Berghahn, R., Miller, J.M., Rijnsdorp, A.D., 2000. Recruitment in flatfish, with special 500
emphasis on North Atlantic species: Progress made by the flatfish Symposia. ICES J. Mar. Sci. 57, 202-215. 501
502
Volckaert, F.A.M., 2013. (Flat)fish stocks in an ecosystem and evolutionary perspective. J Sea Res., 75, 19-32. 503 504
Was, A., Gosling, E., Hoarau, G., 2010. Microsatellite analysis of plaice (Pleuronectes platessa L.) in the NE 505
Atlantic: weak genetic structuring in a milieu of high gene flow. Mar. Biol. 157, 447-462. 506
507
Watts, P.C., Kay, S.M., Wolfenden, D., Fox, C.J., Geffen, A.J., Kemp, S.J., Nash, R.D.M., 2010. Temporal 508
patterns of spatial genetic structure and effective population size in European plaice (Pleuronectes platessa) 509
along the west coast of Scotland and in the Irish Sea. ICES J. Mar. Sci. 67, 607-616. 510
511

Wennhage, H., Pihl, L., Stål, J., 2007. Distribution and quality of plaice (Pleuronectes platessa) nursery grounds 512
on the Swedish west coast. J Sea Res. 57, 218-229. 513
514
Ying, Y., Chen, Y., Lin, L., and Gao, T., 2011. Risks of ignoring fish population spatial structure in fisheries 515
management. Can. J. Fish. Aquat. Sci. 68, 2101–2120. 516

7 Figures caption 517
518
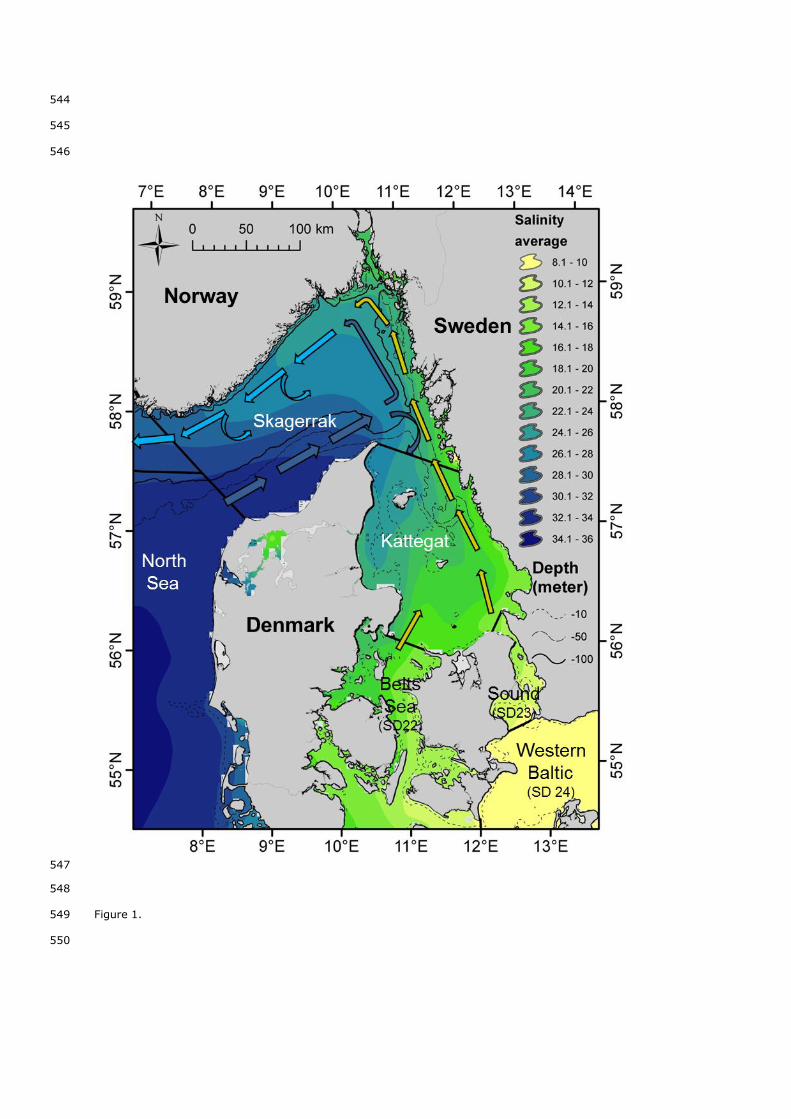
Figure 1. Hydrographical map of the area with average surface salinity, depth and currents (Yellow: Baltic 519
current , Dark blue: North jutland current , Azure: Skagerrak costal current). Salinity data from DHI. Currents 520
redrawn from Danielssen et al. (1997). The black straight lines delimitate the management areas. 521
522
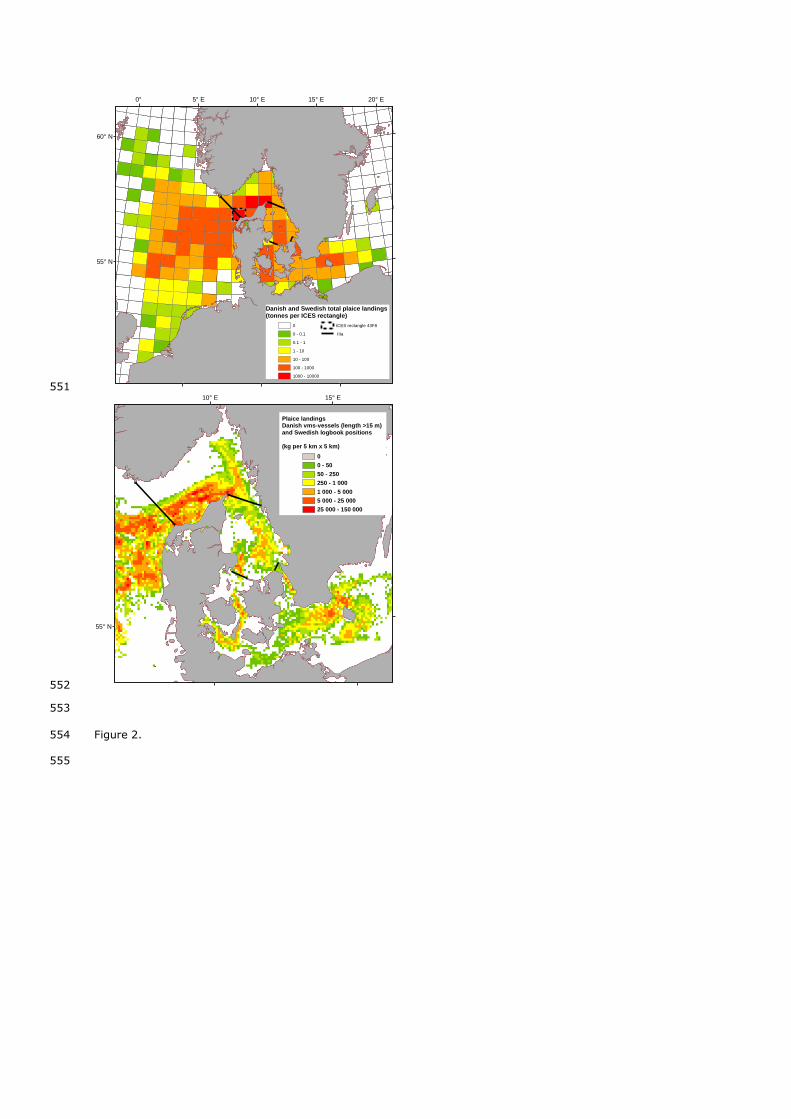
Figure 2. Danish and Swedish plaice landings in 2009. Top: By ICES rectangle, all vessels included. Bottom: by 523
5*5 km grid, including the most spatially detailed information available (Sweden: logbooks information by haul, 524
all vessels. Denmark: logbooks crossed with VMS data, vessels above fifteen meters; see Supplementary Online 525
Material for further explanation). Black lines show boundaries of IIIa sub-areas. 526
527
Figure 3. Danish plaice landings by gear in Kattegat (Dashed line), Skagerrak (Plain line) and Central North Sea 528
(Dotted line). 529
530
Figure 4 Proportion (%) of historical recaptures corrected for the differences in recapture probability between 531
areas, Danish tagging data 1903-1964. Top: all tags. Bottom: tags recaptured more than one year after the 532
release. Black: Residency. Grey: migration towards Baltic Sea. white: migration towards North Sea. 533
534
Figure 5: Age-Length Keys and fitted Von Bertalanffy curves by sex and area, Danish harbour samples and 535
IBTS data 2005-2010. (a) Females Skagerrak, (b) Females Kattegat, (c) Males Skagerrak, (d) Males Kattegat, 536
(e) All four fitted Von Bertalanffy plotted together. Grey areas : 95% confidence intervals of parameters 537
estimates. 538
539
Figure 6: Average and fitted maturity by area, IBTS data 2005-2010 Diamonds and dashed line: Kattegat. 540
Triangles and plain line : Skagerrak. Grey areas : 95% confidence intervals of parameters estimates. 541
542
543
544
545
546
547
548
Figure 1. 549
550
551
552
553
Figure 2. 554
555
20° E15° E10° E5° E0°
60° N
55° N
Danish and Swedish total plaice landings (tonnes per ICES rectangle)
0
0 - 0.1
0.1 - 1
1 - 10
10 - 100
100 - 1000
1000 - 10000
ICES rectangle 43F8
IIIa
15° E10° E
55° N
Plaice landingsDanish vms-vessels (length >15 m)
and Swedish logbook positions
(kg per 5 km x 5 km)
0
0 - 50
50 - 250
250 - 1 000
1 000 - 5 000
5 000 - 25 000
25 000 - 150 000

556
Figure 3. 557
558

559
560
561
Figure 4 562
563

564
565
Figure 5 566
567
568

569
Figure 6 570
571
Supplementary On Line Material 1
Supplementary data analyses were performed using recent fisheries data (2005-2010) including 1) Danish 2
harbour sampling, 2) Danish and Swedish logbooks data and 3) survey data. The various data sources are 3
briefly described, and detailed results are provided on online supplementary information. 4
Fishery statistics 5
Commercial landings as reported through logbooks and sale slips are the primary source of information used in 6
stock assessment, and their reliability is crucial. Tonnage information in logbooks is automatically crossed-7
checked with sale slips, therefore the reported quantities are considered reliable. Paper logbooks can however 8
be subject to important area misreporting, driven for example by differences in available fishing opportunities 9
and regulations across management areas. Misreporting in the Danish logbooks between the area IIIa and 10
adjacent waters was suspected to have occurred in the past for a number of species (e.g. ICES, 2010b). 11
Logbook data were therefore scrutinised for similar issues for plaice, considering that most landings in area IIIa 12
are reported at the edge of the North Sea (Figure 2; See also ICES (2011a) for the landings distribution by area 13
and country). Noticeably, ICES rectangle 43F8, where up to 40% of Skagerrak landings are reported, is 14
administratively split between both management areas, and misreporting in this particular area could 15
potentially have large consequences. The validity procedure included a cross-check of logbooks data since 2005 16
with Vessel Monitoring System (VMS) data following the merging method developed by Bastardie et al. (2010) 17
and Hintzen et al. (2012), allowing quantifying the amount of plaice misreporting (Gatti, unpublished1,). For the 18
vessels smaller than fifteen meters (more than 45% of the Danish plaice landings in area IIIa) for which no 19
VMS are available, reported landing areas were checked against the departure harbour. Overall, no systematic 20
area misreporting was observed for the period considered, and the mismatch between both data sources 21
seemed to have declined over time (Gatti, unpublished). Although the possibility of area misreporting during 22
the 1980 and 1990s cannot be ruled out, it is unlikely that this source of uncertainty is a significant factor of 23
inconsistency in the data, and therefore the Danish logbooks can be considered to be sufficiently reliable to 24
describe actual fishing patterns. 25
Swedish data were compiled from Swedish logbooks. Positions are based on gear set-positions for each effort 26
as reported by fishers on a haul-by-haul basis, and the overall quality is judged reliable. In addition, the fishery 27
takes only place in the central part of area IIIa. Therefore, no further check of potential area misreporting was 28
performed. 29
Biological sampling data 30
The Danish harbour sampling program samples plaice on a quarterly basis to construct Age-Length-Keys by 31
commercial category and sub-area. Catch-at-age information for the area IIIa is available since 1978, and by 32
1 Gatti, 2011. Source of uncertainties in the catch-at-age matrix of the IIIa plaice stock. Bachelor internship report, Agrocampus Ouest, Rennes, France. Unpublished.

area since 1984; But the analyses of age-length keys was restricted to the period 2005-2010, as for fisheries 33
data (Gatti, unpublished). On average, around 8300 fish are aged annually, of which 35-45% originate from the 34
Skagerrak and 15-25% from the Kattegat, the rest being taken primarily in the North Sea and Belt Sea. Due to 35
a number of external, practical and financial considerations the harbour sampling is however slightly skewed 36
towards the Easterly side of the fishery in IIIa (where major cod and Nephrops fisheries are), although most 37
plaice landings originate from the more westerly areas (Figure 2). 38
Survey data 39
Plaice data from the NS IBTS (North Sea International Bottom Trawl Survey) were extracted from the ICES 40
database DATRAS (http://datras.ices.dk/). Information on growth, sex and maturity was investigated for the 41
period 2005 to 2010. In addition, the IBTS time series have been used do derive relative indices of spawning 42
abundance in IIIa, as suggested by Cardinale et al. (2011). In comparison to that study that spanned over a 43
century of survey data, the time series of spatial indices was here restricted to the time frame of IBTS data only 44
(since 1974), and not smoothed for year to year variation. 45
46
References 47
Bastardie, F., Nielsen, J.R., Ulrich, C., Egekvist, J., Degel, H., 2010. Detailed mapping of fishing effort and 48
landings by coupling fishing logbooks with satellite-recorded vessel geo-location. Fish. Res., 106, 41-53. 49
50
Cardinale, M., Bartolino, V., Llope, M., Maiorano, L., Sköld M., Hagberg., J., 2011. Historical spatial baselines in 51
conservation and management of marine resources. Fish Fish 12, 289–298. 52
Hintzen, N.T., Bastardie, F., Beare, D., Piet, G.J., Ulrich, C., Deporte, N., Egekvist, J., Degel, H., 2012. 53
VMStools: Open-source software for the processing, analysis and visualisation of fisheries logbook and VMS 54
data. Fish. Res. 115-116:31-43. 55
ICES, 2010b. Report of the Workshop on procedures to establish the appropriate level of the mixed herring TAC 56
(Spring Western Baltic (WBSS) and Autumn Spawning North Sea (NSAS) stocks) in Skagerrak and Kattegat 57
(Division IIIa, 23 ‐ 25 November, ICES Headquarters, Copenhagen. ICES CM 2010/ACOM:64. 63 pp. 58
ICES, 2011a. Report of the Working Group on the Assessment of Demersal Stocks in the North Sea and 59
Skagerrak (WGNSSK), 4 - 10 May 2011, ICES Headquarters, Copenhagen. ICES CM 2011/ACOM:13. 1190 pp. 60
61