Vapour properties, cycles and plantkey2engineeringscience.com/vapour_properties.pdf · Vapour...
24
1 Vapour properties, cycles and plant Before embarking on the material set out in this Chapter, you should first make sure you are familiar with the subject matter given in Chapters 12 to 15 of the accompanying Engineering Science book. In particular: when we first look at the nature and behaviour of vapours you will need prior knowledge and understanding of fluid intensive properties such as internal energy (U), volume (V), absolute pressure (P) and temperature (T), enthalpy (H) and entropy (S), as well as being familiar with the extensive or specific properties of working fluids including; specific volume ( ( ) s V , specific internal energy () u , specific enthalpy () h and specific entropy () s . In addition, when considering vapour properties you will need to understand latent heat, as detailed in Chapter 12.3.3; fluid processes such as constant volume, constant pressure, isothermal, isentropic and polytropic (Chapter 14.2) and; be able to sketch and interpret pressure/volume and temperature/entropy diagrams as detailed in (Chapter 15.1 and 15.2). In the book we concentrated on fluids in the gaseous state and to a lesser extent in the liquid state and looked at heat engine applications such as the piston engine and gas turbine engine, where the working fluid was essentially a gas or gas mixture. Here, we are going to deal with fluids which normally exist in the vapour phase (a vapour is a fluid in a gaseous state, that does not generally obey the gas laws) such as; steam, ammonia, carbon dioxide and Freon and see how some of these fluids may be used in steam power plant and refrigeration systems. 1. Vapour properties 1.1 Introduction Consider the p–V diagram, Figure 1, that shows the three main states through which the fluid passes, these are: Liquid state The wet vapour state, where the fluid consists of a mixture of a liquid and dry vapour and The superheated state where no liquid particles are present. Figure 1 A fluid undergoing changes of state
Transcript of Vapour properties, cycles and plantkey2engineeringscience.com/vapour_properties.pdf · Vapour...

1
Vapour properties, cycles and plant
Before embarking on the material set out in this Chapter, you should first make sure you are familiar with thesubject matter given in Chapters 12 to 15 of the accompanying Engineering Science book. In particular: whenwe first look at the nature and behaviour of vapours you will need prior knowledge and understanding of fluidintensive properties such as internal energy (U), volume (V), absolute pressure (P) and temperature (T), enthalpy(H) and entropy (S), as well as being familiar with the extensive or specific properties of working fluidsincluding; specific volume ( ( )sV , specific internal energy ( )u , specific enthalpy ( )h and specific entropy ( )s . Inaddition, when considering vapour properties you will need to understand latent heat, as detailed in Chapter12.3.3; fluid processes such as constant volume, constant pressure, isothermal, isentropic and polytropic(Chapter 14.2) and; be able to sketch and interpret pressure/volume and temperature/entropy diagrams asdetailed in (Chapter 15.1 and 15.2).
In the book we concentrated on fluids in the gaseous state and to a lesser extent in the liquid state and looked atheat engine applications such as the piston engine and gas turbine engine, where the working fluid wasessentially a gas or gas mixture. Here, we are going to deal with fluids which normally exist in the vapour phase(a vapour is a fluid in a gaseous state, that does not generally obey the gas laws) such as; steam, ammonia,carbon dioxide and Freon and see how some of these fluids may be used in steam power plant and refrigerationsystems.
1. Vapour properties
1.1 Introduction
Consider the p – V diagram, Figure 1, that shows the three main states through which the fluid passes, these are:
Liquid state The wet vapour state, where the fluid consists of a mixture of a liquid and dry vapour and The superheated state where no liquid particles are present.
Figure 1 A fluid undergoing changes of state

2
A saturation state is defined as a state at which a change of phase takes place without change in temperatureand pressure. The saturated liquid line represents a series of fluid boiling points, joined up at particulartemperatures and pressures. Similarly, the saturated vapour line represents a series of saturation points wherethe liquid is completely changed into a vapour, again without change in their particular pressures andtemperatures, as the change of state takes place.
If the fluid is in the superheated state (see definition) at a temperature T2 (point A in Figure 1) and iscompressed at this constant temperature along its isotherm (line of constant temperature), it will become a drysaturated vapour at point B and then change state at constant pressure between B and C. It becomes a saturatedliquid at point C and any further attempt to reduce the volume will cause a rapid rise in pressure, shown as lineC to D.
As the temperatures of the isotherms rise towards the critical isotherm TCR, the period of the change of statebecomes less until at the critical point ( )PCR further compression along this isotherm will produce a changefrom vapour to liquid without a condensation period. This can clearly be seen by the reduction in length of theshaded area (change in state) of the plot in Figure 1, as the isotherms approach TCR, where at the criticalpoint ( )PCR the saturated liquid and dry saturated vapour are physically indistinguishable. At temperaturesabove the critical isotherm the fluid enters the gaseous state and behaves as a gas, where its properties may bedetermined using the ideal gas equations, below this isotherm the fluid behaves as a vapour and its properties arethen obtained from tables or graphs, as you will see in section 1.2.
To finish our introduction, some common terms associated with vapours and steam, are detailed below.
Boiling – is the formation of vapour bubbles within the fluid, boiling occurs when the absolute pressurein the fluid reaches the vapour pressure.
Saturation temperature – this is the boiling point of the liquid at a given pressure and is thetemperature ( ors sT t ) at which the change of state takes place.
Saturated vapour – this is a vapour at the temperature of its boiling point, for a given pressure Dry saturated vapour – is a vapour in the gaseous state free from liquid particles, all particles being
vapourised. Dry saturated vapours do not obey the equation of state(characteristic gas equation, seeChapter 12.4.3)
Wet saturated vapour – this is a gaseous mixture (undergoing a change of state) containing saturatedliquid and dry saturated vapour, that does not follow the equation of state
Dryness fraction – A fluid (wet vapour) undergoing a change of state between a saturated liquid and adry saturated vapour, will at any intermediate point have a dryness fraction, given by:
Dryness fraction mass of dry vapour( )total mass of wet vapour mixture
x
Triple point – This has been chosen as the datum for water and is the unique point where ice, water andwater vapour (steam) can co-exist in equilibrium, this point occurs at 0.01○C and 0.006112 bar (seereference to tables in Section 1.2)
Superheated steam – this is steam in which the temperature has been raised above saturationtemperature at a given pressure. For steam in the superheated state temperature and pressure areindependent properties and either both of these must be quoted, or as an alternative, the pressuretogether with the degree of superheat may be quoted, when defining the state of the superheated steam.
1.2 Vapour properties and the use of vapour tables
As mentioned in the introduction, vapours (those below the critical temperature) do not obey the perfect gasequations and as such alternative means are often necessary to find their desired properties, one such methodrequires the use of vapour tables.
One such set of tables are those arranged by G.F.C. Rogers and Y.R. Mayhew entitled Thermodynamic andTransport Properties of Fluids (SI Units) Fifth Edition, published by Blackwell (ISBN 978-0-631-19703-4)that set out, among others, the properties of saturated water and steam, superheated steam and three particular

3
refrigerants; Ammonia, Dichloroflouromethane (Refrigerant 12) and Tetraflouroethane (Refrigerant 134a) . Youare strongly recommended to obtain a set of these tables or similar, for yourself, before continuing with yourstudy, in order to make sense of their use, in this chapter. Other sources of reference, freely available on thenet include, for steam: http://www.engineeringtoolbox.com, where tables for saturated steam and the Mollier(enthalpy – entropy) diagram for water-steam (see later) may be found. Also, with respect to refrigerants,information on thermodynamic properties for the environmentally friendly refrigerants such as R – 410A and R– 507 may be found by following the links from the DuPont site at,http://www2.dupont.com/Refrigerants/en_GB/index.html , when consulting the tables presented on this site youshould give due consideration to the SI units used where for example, the pressures are given in kPa rather thanbar.
In this chapter we will only be quoting examples from the tables by Rogers and Mayhew, but before we do sowe need to define the important properties of vapours and liquids found as headings within these tables.
Specific enthalpy (see Chapter 13.4.3) – is defined as the sum of the internal specific energy ( )u andthe pressure/specific volume energy ( )pv i.e. h u pv , with normal units of /kJ kg .
Important notes:
1) Our usual symbol for specific volume sV used throughout the book has been replaced by ( )v since underthese circumstances (i.e. its use in thermodynamic tables) there is little possibility of confusing thissymbol with that for velocity.
2) From the definition h u pv , then differentiating dh du pdv vdp and since for the vapour duringchange of state pressure is constant 0, therefore 0dp vdp then for an elementary change in heatenergy dQ du pdv , therefore:
dh dQ ………………………………………………………………………………....1
That is the change in enthalpy heat energy change (heat transferred), compare Equation 1 with Equation13.11, in the book.
3) The subscripts, used with the properties given in the Roger and Mayhew tables and many others, are asfollows:c Refers, to a property in the critical statef Refers, to a property of the saturated liquidg Refers, to a property of the saturated vapourfg Refers, to a change of phase at constant pressure ( )ps Refers to a saturation temperature or pressure
4) The specific enthalpies of the saturated liquid fh , saturated vapour gh and superheated vapours aretabulated above the datum corresponding to the triple point of water and steam (see page 2 of Rogersand Mayhew). During the change of state from saturated liquid to dry saturated vapour the enthalpytransferred to the fluid is fgh .
5) In the tables prepared by Rogers and Mayhew they use the same symbol ( )T for thermodynamictemperature measured in Kelvin (K) as that for temperature measured in centigrade, we will also use inthis chapter upper case ( )T to indicate temperature measured in (○C).
Specific enthalpy of wet vapour –The dryness fraction ( )x defined earlier, indicates the fraction of the
enthalpy transferred to the fluid fgh , then the specific enthalpy of the wet vapour, which is the sum ofthe enthalpy of the liquid plus the enthalpy of the dry vapour, is given by:
f fgh h xh ……………………………………………………………………..…2

4
Specific enthalpy of superheated steam – This may be determined directly from tables, such as thoseshown on page 6 and 7 of Rogers and Mayhew.For example steam at 4 bar and 300○C is superheated because the saturation temperature at thispressure is from the table on page 6 143.6sT ○C, so the steam at this pressure and temperature has 300– 143.6 156.4○C of superheat and has a specific enthalpy 3067 /h kJ kg .
Specific internal energy – This may be obtained by:
a) Transposing the definition for specific enthalpy i.e. h u pv so that, u h pv orb) Read directly from tables. Rogers and Mayhew tabulate the specific internal energy of the
saturated liquid ( )fu and the dry saturated vapour ( )gu , as well as ( )u for superheatedvapour. When the vapour has dryness fraction ( )x , then the specific internal energy is foundfrom:
( )f g fu u x u u ………………………………………………………………….3
Note from Equation 3 that the dryness fraction only applies to the change of state, as it does inEquation 2, when finding the specific enthalpy. By way of example if we wish to find the specificinternal energy of wet steam (wet vapour) at 15 bar, with a dryness fraction of 0.8, then from page 4 ofthe Rogers and Mayhew tables we read-off that, 843 /fu kJ kg and 2595 /gu kJ kg , then fromEquation 3 we have 843 0.8(2595 843) 2244.6 /u kJ kg
Specific volume – This is the volume ( )v occupied by unit mass and has units of 3 /m kg . Now for dryvapour gv v , this may be found by reading directly from the tables. For wet vapour
(1 )g fv xv x v and if the volume occupied by the liquid particles ( )fv is neglected (which inpractice it usually is, unless instructed to the contrary) then:
gv xv ………………………………………………………………………………4
Then using as an example our wet steam at 15 bar with dryness fraction of 0.8, the specific volume isfound from page 4 of the tables to be 3(0.8)(0.1317) 0.10536 /v m kg (ignoring the approximationerror).
We are now in a position to find the specific volume, specific internal energy and specific enthalpy propertiesfor wet vapours and for superheat situations. We first look at a couple of examples that involve saturated steamand superheated steam, leaving the refrigerants until we have considered entropy in the next section.The headings found on pages 2 – 5 of Rogers and Mayhew tables for saturated water and steam, are shownbelow.
pbar
sTC 3 /
gvm kg /
fukJ kg /
gukJ kg /
fhkJ kg /
fghkJ kg /
ghkJ kg /
fskJ kg /
fgskJ kg /
gskJ kg
Note that we have used lower case ( )t for temperature in Celsius, while in the tables upper case (T) is used.

5
Example 1
Find the specific volume, internal energy and enthalpy for wet steam at 5bar with a dryness fraction of 0.9.
Then from Equation 4 and the listed value of 30.3748 /gv m kg on page 4 of the tables a good estimate of the
specific volume of the wet steam is given as 3(0.9)(0.3427) 0.3084 /gv xv m kg .The specific internal energy ( )u is given by Equation 1.3 as ( )f g fu u x u u so again, from the values onpage 4 of the tables we get that 639 0.9(2562 639) 2369.7 /u kJ kg .Finally the specific enthalpy is given by Equation 2, as f fgh h xh 640 0.9(2109) 2538.1 /kJ kg where bydefinition fg g fh h h which in this case from the tables, gives 2749 640 2109fgh , that is the middlecolumn enthalpy value shown.
Example 2
Steam at a pressure of 100 bar has a specific enthalpy of 3097 /kJ kg . Determine the temperature, specificvolume of the steam and the specific internal energy.
In order to solve this problem we first need to know whether the steam is wet or superheated. From page 5 ofthe tables, wet steam at 100bar has a maximum enthalpy in the dry saturated state of 2725 /gh kJ kg and sincethe steam we are concerned with has an enthalpy of 3097 /kJ kg it must be superheated. Then from page 8 of thetables we find that superheated steam at 100 bar, with specific enthalpy of 3097 /kJ kg has a temperature
400T C and a specific volume 30.02639 /m kg (notice that the figures in the tables are 100 times larger thanthe true values of the specific volume, see the units of specific volume in the column underneath thetemperature).
Then to find the specific internal energy for superheated steam (not quoted in superheated steam tables, forgaseous state), we may for steam in this condition use our definition of specific enthalpy i.e. h u pv sothat 23097 (100 x 10 )(0.02639) 2833.1 /u h pv kJ kg . Notice the multiple of 102 to convert the pressurein bar to kPa and so keep the units for specific enthalpy ( / )kJ kg , consistent.
Example 3
Suppose we want to find the temperature and specific enthalpy for say, dry saturated steam at a pressure of52bar then in order to do so we must interpolate the values from the tables.
Then from page 5 in the tables the saturation temperature for a pressure of 50bar is 50 263.9T ○C and at 55bar
55 269.9T therefore 522263.9 269.9 263.9 263.9 2.4 266.35
T ○C that is the temperature at 52bar is
given by adding (in this case) two fifths of the temperature interval to the lower temperature of the interval. If,as a further example, the required temperature had been for a pressure of 53bar, then the calculation for the
interpolation would have been 533263.9 269.9 263.9 263.9 3.6 267.55
t ○C. This kind of interpolation
assumes a linear relationship and this is the case, verified by the pressure law (see Chapter 12.4.2).

6
Then in a similar manner the specific enthalpy for the dry saturated steam ( )gh at 52bar, is given from the table
readings as 5222794 2790 2794 2794 1.6 2792.4 /5
h kJ kg noting from the tables that the specific
enthalpy drops as the pressure rises between 50 and 52bar.
Note: Extreme care needs to be taken, when interpolating vertically, in the tables, because the linear relationshipdoes not always hold, for example, when considering superheated steam at low pressure (page 6 of tables) therelationship between specific volumes is not at all linear, as can be seen by the graph of pressure against specificvolume shown in Figure 1.
1.3 Specific entropy and change of state
Consider Figure 2 that shows the Temperature – Specific entropy diagram for liquid and vapour, where theproduction of steam at constant pressure is represented by line ABCD.
Figure 2 The T – s diagram for liquid and vapour
From the diagram it can be seen that the liquid reaches saturation temperature at point B, the change of statetakes place between B and C and superheating at constant pressure occurs from C to D. The saturated liquid anddry saturated vapour lines are also shown and the constant pressure line AB can be seen very close to thesaturated liquid line. The specific entropies of the saturated liquid ,fs dry saturated vapour gs and thesuperheated vapour are all measured back to the triple point, where the entropy is deemed to be zero (see forexample the first entry at the top of page 2 in the tables).The specific entropy of the wet vapour is found in an identical manner to the specific enthalpy and specificinternal energy (Equations 2 and 3), where the dryness fraction is only applicable to the change in state and thusthe entropy between and including points B, C, is given by:
f fgs s xs …………………………………………………………………………………………...5
7
Then providing the pressure and temperature of the steam is known and in the case of wet steam the drynessfraction is known or can be determined the entropy ( )s can be determined from Equation 5 using the steamtables. Alternatively, providing the specific heat capacity ( )pc is known, the change in specific entropy may be
determined using Equation 15.3 from the book i.e. 2 22 1
1 1
ln lnpT ps s s c RT p
and for the circumstance
concerning steam at constant pressure, the change in specific entropy is given by the relationship:
lnps
Ts cT
………………………………………………………………………………………..6
When using Equation 6, remember that absolute temperature in Kelvin must be entered.
Note: The shaded area under BC represents the heat transfer during change of state and is equal to the enthalpy,fgh therefore:
fg s fgh T s ………………………………………………………………………………………….7
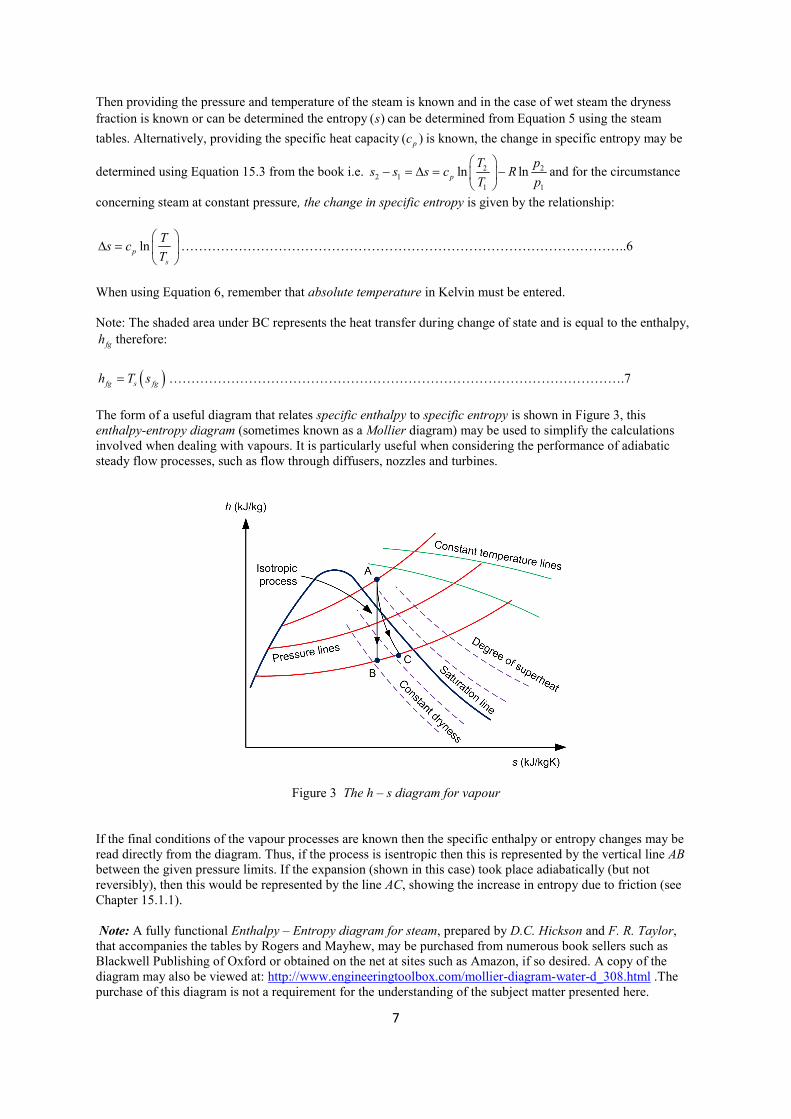
The form of a useful diagram that relates specific enthalpy to specific entropy is shown in Figure 3, thisenthalpy-entropy diagram (sometimes known as a Mollier diagram) may be used to simplify the calculationsinvolved when dealing with vapours. It is particularly useful when considering the performance of adiabaticsteady flow processes, such as flow through diffusers, nozzles and turbines.
Figure 3 The h – s diagram for vapour
If the final conditions of the vapour processes are known then the specific enthalpy or entropy changes may beread directly from the diagram. Thus, if the process is isentropic then this is represented by the vertical line ABbetween the given pressure limits. If the expansion (shown in this case) took place adiabatically (but notreversibly), then this would be represented by the line AC, showing the increase in entropy due to friction (seeChapter 15.1.1).
Note: A fully functional Enthalpy – Entropy diagram for steam, prepared by D.C. Hickson and F. R. Taylor,that accompanies the tables by Rogers and Mayhew, may be purchased from numerous book sellers such asBlackwell Publishing of Oxford or obtained on the net at sites such as Amazon, if so desired. A copy of thediagram may also be viewed at: http://www.engineeringtoolbox.com/mollier-diagram-water-d_308.html .Thepurchase of this diagram is not a requirement for the understanding of the subject matter presented here.
8
Now that we know a little more about how entropy change is displayed in the tables, we will finish this sectionwith one or two more examples that require the use of steam and refrigerant tables.
Example 4
Determine the specific entropy for the dry saturated steam at a pressure of 52bar given in Example 3.
Then in a similar manner to the interpolation we used to find the specific enthalpy in Example 1.3, thespecific entropy for the dry saturated steam ( )gs at 52bar, is given from the readings on page 5 of the tables as:
5225973 5931 5973 5973 16.8 5956.2 /5
s kJ kgK , noting from the tables that the specific entropy
(like the specific enthalpy in Example 3) drops as the pressure of the dry saturated steam rises between 50 and52bar.
Example 5
Refrigerant R12 (dichlorodifluoromethane) is at a temperature 15t ○C when the saturation pressure,1.826sp bar , find the specific enthalpy and specific entropy of the refrigerant under these conditions.
Then from page 14 of the tables we see that the saturation temperature of the refrigerant at 1.826sp bar ,is 15t ○C, therefore the refrigerant must have 30K of superheat, where the difference in temperature inCelsius between 15t ○C and 15t ○C is 30○C 30K . Then reading off from the 30K superheat column wefind that 199.44 /h kJ kg and 0.7728 / .s kJ kgK
More practice on the use of vapour tables will be given later when we consider vapour compression cycles insection 3.
2. The Rankine Cycle and Steam Plant
In this section we consider the first of two important vapour cycles, the Rankine cycle which is the ideal cyclefor steam plant. In section 3 we will consider the Vapour-compression cycle, for refrigeration plant. In order torefresh your memory concerning thermodynamic cycles and thermal efficiencies you should look againparticularly at, the Carnot cycle and its associated efficiencies in Chapter 15.2 of the book, before tackling thevapour cycles that follow.
2.1 The basic Rankine cycle
The Rankine cycle as already mentioned is the ideal cycle upon which practical steam plant is based. In its basicform steam power plant consists of a steam generator (boiler), a turbine (the power output from the plant), acondenser and water feed pump, as illustrated in Figure 4.
The steam generated by the boiler at state 1 passes through the turbine where the heat energy from the steam isextracted to do external work ( TW the whole purpose of the steam plant). The turbine work (from the SFEEthat is Equation 13.10 for isentropic expansion) is equal to the enthalpy change across the turbine i.e.
1 2TW h h ………………………………………………………………………………………….8

9
Figure 4 A typical basic steam plant set-up
The steam enters the condenser after isentropically expanding through the turbine at state 2. At this stage wemake the assumption that only the latent enthalpy (heat) is extracted from the steam, by the cooling waterpassing through the condenser matrix and that after condensation the water from the steam (now at state 3)enters the feed pump with liquid enthalpy 3 2 .fh h Work is then done by the pump in raising the pressure to
1( )p and the condition of the liquid is represented by state 4. The basic cycle of the vapour plant shown inFigure 4, is represented on the p – v and T – s diagrams, shown in Figure 5a) and 5b), respectively.
The feed pump work on the liquid is given by, 1 2 2( )P fW p p v (remembering that in this chapter thesymbol v specific volume). Heat is transferred (supplied) to the fluid at constant pressure between 4 and 1 (seep – v diagram in Figure 5), therefore, 1 4 1 3 1 2 2( )in fQ h h h h p p v and the:
Net specific work done 1 2 1 2 2( )T P fW W h h p p v ………………………………………...9
Therefore net work outputRankine efficiencypositive heat suppliedR ………………………………………10
Then 1 2 1 2 2
1 3 1 2 2
( )
( )f
Rf
h h p p vh h p p v
………………………………………………………………….11
If the feed pump work 1 2 2( )P fW p p v is ignored, for being small, as it often is then Equation 1.11 reduces to,
1 2
1 3R
h hh h
and because 3 2fh h the specific enthalpy of the liquid at pressure 2( )p then we may write that:
1 2
1 2R
f
h hh h
………………………………………………………………………………………12

10
Figure 5 Basic vapour cycle: a) p – v diagram and b) T – s diagram
Example 6
A steam power plant operating on the ideal Rankine cycle is supplied with steam from the boiler at a pressure of40bar and a temperature of 350○C. The steam exits the turbine and passes to the condenser at a pressure of0.5bar. Determine, with the use of tables; a) the dryness fraction of the steam as it enters the condenser, b) theRankine efficiency, ignoring the feed pump work and c) Sketch the cycle on a T – s diagram. Also d), if thespecific steam consumption ( )ssc is the steam flow in /kg h (kilograms per hour) required to develop 1 kW ofpower, determine the ( )ssc in /kg kWh for this plant.
a) In the ideal Rankine cycle the expansion across the turbine is assumed to be isentropic (see Chapter14.2.4) therefore there is no change, in entropy so that 1 2s s . Then from page 4 of the tables (Rogersand Mayhew) the saturation temperature for steam at 40bar is 250.3○C, so that in our case the steamsupplied to the system at 350○C is superheated and from page 7 of the tables steam at 40bar at thistemperature has entropy 1 6.584 /s kJ kgK . Also from page 2 of the tables, after interpolation theentropy of the steam exhausting the condenser is given (from Equation 5) as,
2 1.089 6.504f fgs s xs x and since 1 2s s then 6.584 1.089 6.504x from which we get thedryness fraction 0.845x

11
b) Now as we are allowed to ignore the feed pump work, the Rankine efficiency is given by Equation 121 2
1 2R
f
h hh h
Where again from the steam tables at 40bar and 350○C we find that 1 3094 /h kJ kg . Also,
at 0.5bar from Equation 2 and page 2 of tables we find that
2 2 2 340.2 0.845 2305.1 2288 /f fgh h xh kJ kg , therefore 3094 2288 0.293 29.3%3094 340.2R
c) Figure 6 shows the sketch of the T – s diagram for our situation, where you should note that thetemperature is given in Kelvin, as it should be on thermodynamic diagrams. Note also how thesuperheated steam entering the plant is illustrated and the isentropic expansion through the turbine isshown by the vertical line from state 1 to state 2.
Figure 6 The T – s diagram for the steam plant operating on the Rankine cycle with superheat
d) From the information given in the question we know that the specific steam consumption is the steam flow inkg/h required to develop 1kWof power. Now 1 (1 / ) x (3600 ) 3600kWh kJ s s kJ and the net specificwork output, ignoring the feed pump work is, from Equation 1.9, given as,
Net specific work output 1 2 (3094 2288) 806 /TW h h kJ kg and remembering that1 3600kWh kJ ,
then the specific steam consumption 3600 4.47 /806
ssc kg kWh
2.2 The improved Rankine cycle and steam plant
The energy provided from the turbine of steam plant, is frequently used to produce electrical power where evensmall increases in thermal efficiency can provide large savings in the fuel requirements of the plant. It is for thisreason that every effort is made to increase the efficiency of the Rankine cycle upon which steam plants operate.The methods used to improve the efficiency of the Rankine cycle are based on being able to:
Increase the average temperature at which heat is transferred to the working fluid in the boiler or Decrease the average temperature at which heat is rejected from the working fluid in the condenser

12
There are three ways in which this may be accomplished, these are:
i) Superheating the steam to higher temperaturesii) Lowering the condenser pressureiii) Increasing the boiler pressure
2.2.1 Superheating
The average temperature at which heat is added to the steam can be increased, without increasing boilerpressure, by superheating the steam. We have previously determined the degree of superheat but have not untilnow, really given a reason for its use.
Figure 7 The effect of superheating
Figure 7 illustrates the effect of superheating (our steam plant set-up Figure 4), where it can be seen thatincreasing the average temperature at which heat is transferred to the working fluid in the boiler increase theheat input and the network, resulting in an increase in thermal efficiency.
2.2.2 Lowering condenser pressure
We know from our study of the basic system that, steam exists in the condenser as a saturated mixture, at asaturation temperature directly related to condenser pressure so that lowering the condenser pressure,automatically lowers the temperature of the steam.
Figure 8 The effect of lowering the condenser pressure

13
From Figure 8 it can be seen that lowering the temperature of the steam increases the network of the plant andso increases its efficiency, this can also be seen by studying the above Equations 10 and 11. A consequence oflowering condenser pressure (2 ,3 ) is that it increases the moisture content of the steam in the final stages of theturbine (higher percentage of saturated vapour at 2 ) which is detrimental to the performance of the turbinecausing a reduction in efficiency and over time, corrosion of the turbine blades.
2.2.3 Increasing boiler pressure
An increase in boiler pressure results in an increase in the temperature at which boiling takes place. This in turnraises the temperature at which heat is added to the steam, raising the thermal efficiency of the cycle.
Figure 9 The effect of increasing boiler pressure
From Figure 9 it can be seen that for a fixed turbine inlet temperature (1 ,1 ) that the cycle moves to the left,increasing the moisture content of the steam, as it exits the turbine. This undesirable effect can be minimised bysuperheating the steam to very high temperatures prior to turbine entry or expanding the steam in stages using aprocess known as reheating, this latter process provides the best practical solution to the problem as you will seein section 2.2.4.
Example 7
Steam from the boiler enters the turbine of a steam plant (operating on the Rankine cycle) at 40bar and 350○C itexits the turbine and passes to the condenser at a pressure of 0.05bar. Determine:
a) The thermal efficiency of the power plantb) The thermal efficiency if the steam is superheated to 600○C, prior to entering the turbinec) The thermal efficiency if the boiler pressure is raised to 150bar while the turbine entry temperature
remains at 600○C.
a) Now in order to find the thermal efficiency of the plant we proceed in a similar manner to that adoptedfor Example 6, where in this case the steam enters the turbine under the same conditions but leavesunder different conditions. Then using Equation 5 and page 3 of the tables by Rogers and Mayhew fora pressure of 0.05bar, we find the dryness fraction from 2 0.476 7.918f fgs s xs x and because weassume isentropic expansion through the turbine for plant based on the Rankine cycle,then 1 2 6.584 /s s kJ kgK so 6.584 0.476 7.918x and the dryness fraction 0.7714x , also frompage 7 of the tables for superheated steam at 350○C we find that 1 3094 /h kJ kg .

14
We are now in a position to find the specific enthalpy of the vapour as it leaves the turbine, then from Equation2 and page 3 of the tables, 2 2 2 138 0.7714 x 2423 2007.5 / .f fgh h xh kJ kg Also from Equation 9 thepump work is given by 1 2 2( )P fW p p v and since fv v at 0.05bar then from page 10 of the
tables, 0.1005fv by interpolation, therefore in consistent units5
3
100.001005(40 0.05)10pW
so that
4.01 /pW kJ kg . Then from Equation 11 where 1 2 1 2 2
1 3 1 2 2
( )
( )f
Rf
h h p p vh h p p v
, noting that
3 138 /fh h kJ kg at 0.05bar, then we find that
3094 2007.5 4.01
36.7%3094 138 4.01R
b) Again from page 7 of the tables for the superheated vapour at 40bar and 600○C then 1 3674 /h kJ kgand for the Rankine cycle 1 2 7.368 /s s kJ kgK therefore from
2 , 7.368 0.476 7.918f fgs s xs x we find that the dryness fraction is 0.87x , from Equation 2 and
page 3 of the tables 2 2 2 138 0.87 x 2423 2246 /f fgh h xh kJ kg andbecause 3 fh h then 3 138 /h kJ kg . The feed pump work will remain the same as that found in part a)because the entry and exit pressures in the turbine are the same therefore the efficiency is from Equation
11, found to be,
3674 2246 4.01
40.3%3674 138 4.01R
.
Note: that by increasing the superheat temperature of the steam from 350○C to 600○C we have improved theefficiency, of the plant from 36.7% to 40.3%, while at the same time increasing the dryness of the steamleaving the turbine from 71% to 87%.
c) By increasing the boiler pressure to 150bar, there will be changes to the states in the cycle, these arehighlighted in the notes below.
From the tables 1 3581 /h kJ kg , 1 2 6.677 /s s kJ kgK and 6.677 0.476 7.918x so the drynessfraction of the steam leaving the turbine is 0.783x . The enthalpy of the vapour leaving the turbine isgiven by 2 2 2 138 0.783 x 2423 2035.6 /f fgh h xh kJ kg . The pump work will now
be5
1 2 2 2
10( ) (150 0.05)0.001005 x 15.07 / .10P fW p p v kJ kg
The cycle efficiency is now
3581 2035.6 15.07
44.6%3581 138 15.07R
Notes: By increasing the boiler pressure, from 40bar to 150bar the thermal efficiency is increased from 40.3%to 44.6% however the dryness fraction of the steam leaving the turbine is reduced from 87% down to78.3%, in other words the steam leaves the boiler in a wetter condition.During this example we have only considered improvements based on the ideal Rankine cycle, let ussuppose that in part a) the turbine working in the real plant has an isentropic efficiency of 85% whateffect will this have on the plant efficiency? We know that the turbine work is given as 1 2TW h h and
the isentropic efficiency 1 20.853094 2007.5
h h
so that the real turbine work, in this
case 1 2 923.5 /h h kJ kg . The plant efficiency will now be
923.5 4.0131.1%
3094 138 4.01R
15
2.2.4 Rankine cycle with re-heat
As explained in section 2.2.3, an unfortunate consequence of increasing the efficiency of the plant by increasingthe boiler pressure is that the moisture content of the steam is also increased to unacceptable levels as it exits theturbine (see Figure 9). We know from the above argument that superheating the steam prior to entering theturbine would be one solution. Unfortunately the very high temperatures required are prohibited by thetemperature tolerance of the materials from which the turbine blades are made, although current and futuredevelopments in materials technology, have allowed turbine designers, to increase entry temperatures, all be it atan additional cost.
However the current solution which results in notable efficiency gains is to use the concept of reheating thesteam in the boiler after passing from the high pressure turbine before reaching the low pressure turbine. In thisway the degree of wetness of the steam leaving the low pressure turbine is kept to a suitable value, normally thisis around 10%. Example 8 that follows, illustrates the benefits to be gained by the application of reheat to asteam plant that operates on this modified Rankine cycle.
Example 8
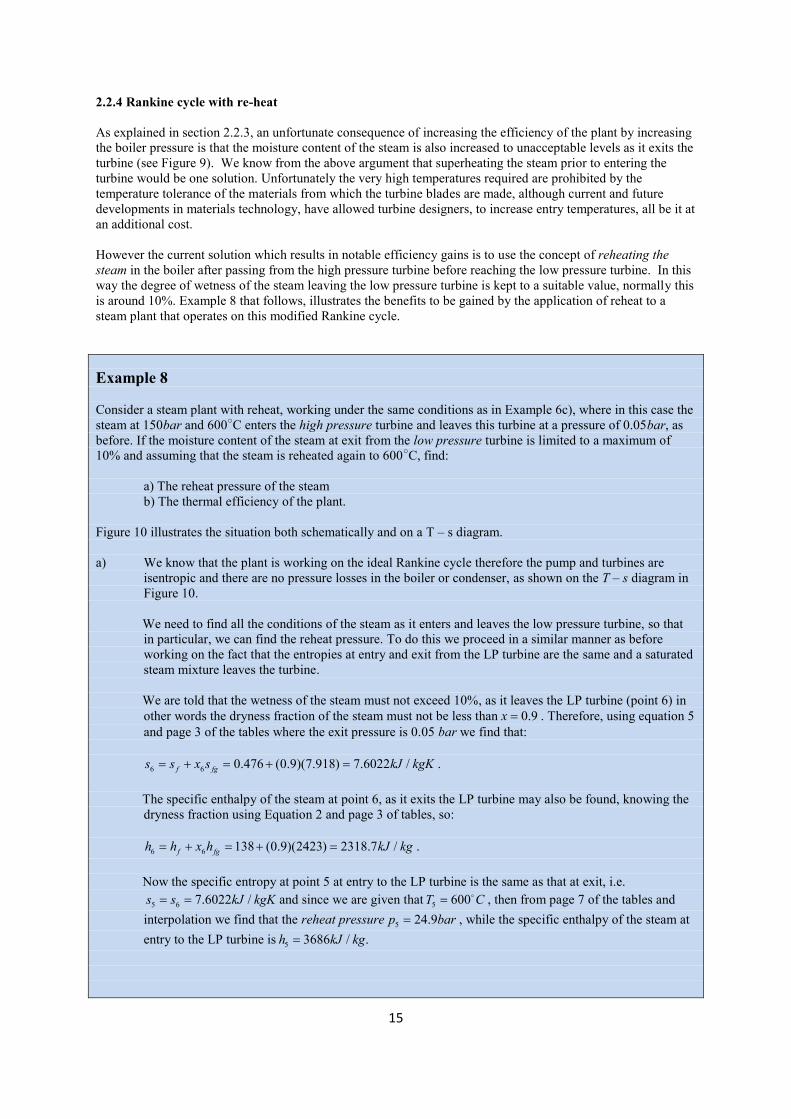
Consider a steam plant with reheat, working under the same conditions as in Example 6c), where in this case thesteam at 150bar and 600○C enters the high pressure turbine and leaves this turbine at a pressure of 0.05bar, asbefore. If the moisture content of the steam at exit from the low pressure turbine is limited to a maximum of10% and assuming that the steam is reheated again to 600○C, find:
a) The reheat pressure of the steamb) The thermal efficiency of the plant.
Figure 10 illustrates the situation both schematically and on a T – s diagram.
a) We know that the plant is working on the ideal Rankine cycle therefore the pump and turbines areisentropic and there are no pressure losses in the boiler or condenser, as shown on the T – s diagram inFigure 10.
We need to find all the conditions of the steam as it enters and leaves the low pressure turbine, so thatin particular, we can find the reheat pressure. To do this we proceed in a similar manner as beforeworking on the fact that the entropies at entry and exit from the LP turbine are the same and a saturatedsteam mixture leaves the turbine.
We are told that the wetness of the steam must not exceed 10%, as it leaves the LP turbine (point 6) inother words the dryness fraction of the steam must not be less than 0.9x . Therefore, using equation 5and page 3 of the tables where the exit pressure is 0.05 bar we find that:
6 6 0.476 (0.9)(7.918) 7.6022 /f fgs s x s kJ kgK .
The specific enthalpy of the steam at point 6, as it exits the LP turbine may also be found, knowing thedryness fraction using Equation 2 and page 3 of tables, so:
6 6 138 (0.9)(2423) 2318.7 /f fgh h x h kJ kg .
Now the specific entropy at point 5 at entry to the LP turbine is the same as that at exit, i.e.5 6 7.6022 /s s kJ kgK and since we are given that 5 600T C , then from page 7 of the tables and
interpolation we find that the reheat pressure 5 24.9p bar , while the specific enthalpy of the steam atentry to the LP turbine is 5 3686 / .h kJ kg

16
Figure 10 Schematic and T – s diagram of steam plant with reheat
b) In order to find the efficiency of the plant we need to find the specific enthalpies of the working fluid(steam) at each point (state) in the cycle using tables and then, find the work transfers of the pump andturbines, using equations (9 to 11).
Then for point 1, where 1 150p bar and 1 600T C we find from page 8 of the tables that,
1 3581 /h kJ kg and 1 6.677 / .s kJ kgK
Point 2, where we know that 2 5 24.9p p bar and 2 1 6.677 / .s s kJ kgK If, we now interpolatevalues from page 7 of the tables we find that our value of the specific entropy lies on the column where
300T C , at a pressure 2 5 24.9p p bar , so interpolating for the specific enthalpy between thevalue 2995 to 3025 kJ/kg K we find that 2 3010 /h kJ kg .
Point 3, where the working fluid is a saturated liquid that enters the pump at a pressure of 0.05bar, sothe value of its enthalpy 3 fh h may be read directly from page 3 of the tables as 3 138 /h kJ kgK .For this saturated liquid the specific volume is 3 fv v which when interpolated from page 10 of the
tables for a pressure of 0.05 bar is 3v 0.0010053 3 /m kg (note units from table). Now since throughthe pump we have constant entropy and 4 150p bar , then from Equation 9 where in this case
4 3 3( )P fW p p v we find the work input to the pump is:
4 3 3( ) (15000 5)(0.0010053) 15.074 /P fW p p v kJ kg .

17
Now from the T – s diagram in Figure 10, you should be able to deduce that the specific enthalpy at point 4 willbe: 4 3 (138 15.074) 153.074 / .ph h W kJ kg
Now we know from equation 10, that net work outputRankine efficiency 1positive heat supplied
outR
in
and
1 4 5 2( ) ( ) (3581 153.074) (2318.7 138) 4103.926 /inq h h h h kJ kg also,
6 3( ) (2318.7 138) 2180.7 /outq h h kJ kg
Therefore the plant thermal efficiency, working on the Rankine cycle is2180.71 0.469 46.9%
4103.926R
The above efficiency compares with that given for the cycle without reheat (example 7) of 44.6% thatis a 2.3% increase in efficiency.
We leave this short study of steam and steam plant, if you require more information, for example, on thebenefits of plant that include regeneration or combined systems, you are advised to consult standardundergraduate texts on thermodynamics such as those written by G.F.C. Rogers and Y.R. Mayhew or the text onApplied Thermodynamics by T.D. Eastop and A. McConkey or any of their modern equivalents.
We now take a brief look at vapour compression refrigeration and its associated plant.
3. Vapour Compression Refrigeration and Plant
3.1 Refrigerants
The ideal form of the vapour compression cycle is in fact, the Carnot heat engine cycle (Chapter 15.2) acting inreverse and this is the ideal cycle used for refrigerators and refrigeration plant, where the working fluid is arefrigerant capable of evaporation at cold temperatures, so absorbing heat in the form of latent energy. Thus, therefrigerant used passes through a closed cycle during which it absorbs heat from the cold chamber of therefrigeration unit, it is then compressed to an appropriate high pressure and temperature, cooled in a condenserand then throttled down to the pressure at which evaporation can take place, (see Figure 11).
The refrigerant should be capable of producing a good refrigerating effect, for the amount of work put into thecycle. Some of the important properties of refrigerants that govern their choice for particular applicationsinclude; level of toxicity, corrosive/non-corrosive properties, volatility, flammability and with modern dayrefrigerants, the effect they have on the environment is of importance. Refrigerants are all identified using arefrigerant (R) number. The older typical refrigerants include ammonia (R717) and carbon dioxide (R744),together with fluorocarbons (CFCs) such as Freon, all of these posing some threat to the environment, as well asin the case of ammonia, having high toxicity and flammability.
The tables (Rogers and Mayhew) show the properties of Ammonia (R717), Dichlorodifluoromethane (R12) andthe inert gas refrigerant, Tetrafluoroethane (R134a), note that in each case on pages 13, 14 and 15 of the tablesonly two superheat temperatures are given. Thus for example on page 14 of the tables, R12 at 1.509 bar and10○C must have 30K of superheat since its saturation temperature at this pressure is – 20○C and so its specificenthalpy and entropy in this state, are from the tables 196.89 /h kJ kg and 0.7764 /s kJ kgK , respectively.Modern more environmentally friendly refrigerants have been produced to replace (R12) and (R134a) such as(R410a) which is a mixture of the improved difluoromethane (R32) and pentafluoroethane (R125), which is nowused as a refrigerant for air-conditioning applications.

18
3.2 The basic vapour-compression refrigeration cycle
Figure 11 illustrates the closed cycle for the refrigerant as it passes around the basic vapour-compressionrefrigeration system.
Figure 11 The basic vapour compression refrigeration cycle
As the refrigerant passes through the evaporator (which is located in the cold chamber of the refrigerator) heat isabsorbed ( )inQ and as the refrigerant passes through the condenser (the large coil on the back of a domesticrefrigerator), heat is rejected ( )outQ the input work ( )inW is via the compressor, as shown in Figure 11.
Wet vapour is difficult to expand and compress, so the refrigerant is usually dry before compression andsuperheated afterwards. At the exit from the condenser, the under-cooled liquid would be difficult to expandthrough a turbine so a throttling valve is used instead. As the refrigerant passes through the throttle, no usefulwork is produced but this process does convert the pressure into internal energy (with no change in enthalpy, seeFigure 12b) this makes the liquid evaporate and because its saturation temperature drops, it exits the throttle as acolder very wet vapour (see Figure 12a).
In the vapour compression cycle shown on the T – s and p – h diagrams of Figure 12, we assume thatcompression is isentropic from 1 to 2 and point 3 is the liquid saturation point at the higher pressure p2 beforethrottling. The refrigerant is isentropically compressed from 1 to 2, cooled at constant pressure in thecondenser, where in this case, as shown on Figure 12a) it loses its superheat and latent heat. The refrigerant isthen throttled to the pressure p1 where it enters the evaporator as a very wet cool vapour and absorbs heat fromthe contents of the refrigerator cold chamber, between 4 and 1.
Constant pressure undercooling of the fluid in the condenser between 3 and 3 , produces the condition at 4 afterthe throttling process has taken place. In the ideal cycle (where we ignore heat losses to the surroundings) therefrigerating effect at the evaporator plus the work done by the compressor on the refrigerant will be equal to theheat given out at the condenser i.e.:Refrigerating effect work done on refrigerant heat out (see Figure 12b).
In practical refrigeration systems, it is found that there is more heat energy ( )inQ absorbed by the evaporator andmore heat energy ( )outQ given out at the condenser, than the work needed to drive the compressor ( )inW .
The coefficient of performance (C.O.P) is a measure of the refrigerating effect obtained for the work input to
the cycle and it is given by the ratio: 41
2 1
Refrigerating effectWork done by the compressor
h hCOP
h h

19
Figure 12 T – s and p – h diagrams for vapour compression refrigeration cycle
Example 9
Refrigerant 134a enters a throttling valve as a saturated liquid at 7.7bar and is throttled to a pressure of1.0637bar. Determine the dryness fraction of the refrigerant after throttling and the temperature drop during theprocess.
This is a simple example of the use of the Rogers and Mayhew tables, where the relevant required information isfound on page 15. Since the refrigerant is subject to a throttling process the enthalpy remains constant. Then atinlet: 1 7.7p bar and since refrigerant is a saturated liquid the temperature
1 30sT T C and 1 241.69 /fh h kJ kg .
At exit 1 1.0637p bar , 167.25 / , 383.37 /f gh kJ kg h kJ kg and 25sT C . Now since for throttlingprocess 1 2h h and using Equation 2, f fgh h xh we find that the dryness fraction of the refrigerant
is 22
241.69 167.25 74.44 0.344383.37 167.25 216.12
f
fg
h hx
h
. Thus the refrigerant at exit from the throttling valve is a,
saturated vapour with a dryness fraction of 0.344, therefore the temperature of the refrigerant at exit must be thesaturated temperature at this pressure, i.e. 25sT C and so the temperaturechange 2 1 25 30 55T T T C , that is a temperature drop of 55○C.

20
Example 10
In a vapour compression refrigeration system using R12, evaporation take place at 1.509bar and condensationoccurs at 6.516bar. The vapour is dry saturated after isentropic compression and there is no undercooling, alsothe vapour is throttled between leaving the condenser and entering the evaporator. Using appropriate valuesfrom the tables sketch the resulting cycle on a T – s diagram and determine:
a) The temperatures and specific enthalpies at points 2, 3 and 4, in the cycleb) The dryness fraction of the vapour on entry to the condenser and h1c) The coefficient of performance of the system
Figure 13 T – s diagram for R12 vapour compression refrigeration system
a) The cycle is shown in Figure 13, where it can be seen that reading directly from page 14 of the Rogersand Mayhew tables for R12, 1 20 273 253T K and 2 25 273 298T K . Also the appropriatespecific enthalpies are as follows 2 197.73 /gh h kJ kg , 3 59.7 /fh h kJ kg at 298K and because therefrigerant is throttled from point 3 to point 4, then 4 3 59.7 /h h kJ kg .
b) The dryness fraction at entry to the condenser may be found by considering the entropy at points A andB, shown on Figure 13 and since for isentropic compression 1 2s s , then the required dryness
fraction 11 0.6869 0.0731 0.6138 0.966
0.7087 0.0731 0.6356AxAB
, taking the values of specific entropy from page 14
of tables.
The enthalpy at point 1 may now be found using Equation 2 where 1 1f fgh h x h so that,
1 17.82 0.966(178.73 17.82) 173.26 /h kJ kg .
c) The coefficient of performance is now found easily using 41
2 1
173.26 59.7 4.61197.73 173.11
h hCOP
h h
.
Notice that the coefficient of performance is greater than unity this is allowable and happens when theheat removed from the refrigerating space is greater than the work input. The COP should not beconfused with the thermal efficiency which can never be greater than unity!

21
3.3 Modified vapour cycles and refrigeration plant
As discussed in the previous section wet vapour is difficult to expand and compress, so the refrigerant is usuallydry before compression and superheated afterwards (Figure 12a). At the exit from the condenser, the under-cooled liquid used to increase the refrigerating effect, would be difficult to expand through a turbine, hence theuse of a throttling valve. Improvements may be made to this basic compression cycle, by use of a flashchamber.
Figure 14 Schematic of basic flash chamber vapour refrigeration system
In the system schematic shown in Figure 14, the condensed high pressure liquid at (point 7) is sprayed into thelow pressure flash chamber (via point 4) where, the drop in pressure has the same effect as throttling and theliquid partially evaporates and drops in temperature. Now in this set-up the dry saturated vapour is drawn intothe compressor (point 5), rather than passing directly through the evaporator, where, if it did so, it would makeno contribution to the refrigerating effect. In the mean-time the saturated liquid from the flash chamber (point 1)is pumped to the evaporator (2). The advantage of this system is that the evaporator now works at a higherpressure, which in turn increases the refrigerating effect (see Figure 12b).
Further improvements to the flash chamber system may be made if an increase in plant components wasacceptable, where efficiency gains out-weighed the increase in the size and costs of the plant.In the more complex plant illustrated in Figure 15, we still use a flash chamber where the vapour is bled off andfed back to the compression process at some intermediate pressure but in this case the throttling process iscarried out in two stages, each one starting with a liquid.
Figure 15 Schematic of a two-stage flash chamber vapour refrigeration system

22
Consider a quantity of refrigerant flowing around the system illustrated in Figure 15. At the flash chamber aquantity of the refrigerant, as a dry saturated vapour is bled-off (7) at some intermediate pressure to the inter-stage of the two stage compressor (3). The remaining liquid in the flash chamber passes through a throttlingvalve (8) to the evaporator (9), which in turn passes through the first stage of the compressor (1-2) where, as avapour, it is mixed adiabatically with the flash vapour (7). The resulting mixture at stage (3) is compressed inthe second stage compressor (3-4) where it is then delivered to the condenser at state (4). On leaving thecondenser (5) the saturated liquid is throttled and at (state 6) is sprayed into the flash chamber.
Now the problem with the analysis of the system illustrated in Figure 15 is that the quantities of the refrigerantcirculating around the system are not the same, so we need to look at how we determine these quantities and thestate of the refrigerant at various points around the system. If we look at unit mass of the fluid flowing aroundthe system, then at point (7) we see from the Figure that x kg of dry saturated vapour is bled-off to the inter-stage mixing point, the remaining mass (1 )x kg of liquid refrigerant, passes through the throttle valve (8-9) tothe evaporator. Formula 2 i.e. f fgh h xh may be used to determine the values of x and so the energy balance,on the flash chamber.
Figure 16 p – h diagram for two-stage flash chamber vapour refrigeration system
Figure 16 shows the p – h diagram with the different pathways for unit mass of the refrigerant, for the two-stageflash chamber vapour refrigeration system, illustrated in Figure 15.
Example 11 shows the method we adopt to determine the enthalpies of the refrigerant as it circulates around thesystem and so determine parameters such as the COP.
Example 11
A two stage compression system operates on the cycle illustrated in Figures 15 and 16, using refrigerant 134a.The system operates between the inlet pressure of the first stage compressor at 1.327bar and a pressure of8.867bar that leaves the second stage compressor, (the condenser operating pressure). The refrigerant leaves thecondenser as a saturated liquid and is throttled to a flash chamber operating pressure of 3.496bar. Assuming therefrigerant leaves the evaporator as a saturated vapour and both stages of compression are isentropic, determine:
a) The fraction of refrigerant that evaporates as it is throttled to the flash chamberb) The amount of heat taken in by the evaporator (the refrigerating effect)c) The work done on the compressord) The coefficient of performance

23
In order to solve this problem we use the Rogers and Mayhew tables (page 15) in order to find the specificenthalpies (i.e. per unit mass) of the refrigerant at the various states indicated on Figure 15.
a) The fraction of refrigerant that evaporates, is that given by the quality of the refrigerant at state 6, then
using Equation 2 where, f fgh h xh or in this case 6 f
fg
h hx
h
where from tables with 6h at 8.867bar
and ,f fgh h at the flash chamber pressure of 3.496bar, we find that from the tables,
248.98 206.75 0.217194.58
x
b) Then heat taken in by the evaporator can be seen from Figure 15 to be 6 1 9(1 )( )inQ x h h . Then againfrom tables where 1h is a saturated vapour at 1.327bar and 9h is a saturated liquid at 3.496bar we find that,
(1 0.217)(386.44 206.75) 142.49 /inQ kJ kg
c) The total compressor work is the work input to both stages of the compressor, which for isentropiccompression is equal to 6 2 1 4 3(1 )( ) ( )in LP HPW W W x h h h h . The enthalpy at state 3 isdetermined from a specific energy balance on the mixing chamber, where the energy in is equated to theenergy out (per kg of refrigerant). Then from the mixing point the energy out is 3(1)( )outE h and
6 7 2(1 )inE x h x h so that equating and fromtables 3h 6 7 2 2(1 ) (0.217)(401.33) (1 0.217)( )x h x h h .
Now 2h is found by first noting that 1 2gs s s (isentropic compression) then from tables where
1 386.44 /h kJ kg at 1.327bar and 1 20T C 1 2 1.7408s s . Now, the pressure at (2) is 3.496,
therefore from this pressure line in the tables it can be seen that for the value of 2 1.7408s a certainamount of superheat exists. So interpolating the tables the degree of superheat is given from the entropies
as 1.7562 1.7408 0.4751.7562 1.7238
. Then the increase in enthalpy due to superheat
is (0.475)(410.5 401.33) 4.36 /kJ kg , therefore 2 401.33 4.36 405.69 /h kJ kg and fromabove 3 6 7 2(1 ) (0.217)(401.33) (1 0.217)(405.69) 404.74 /h x h x h kJ kg .Now in order to find the compressor work we also need to find the enthalpy 4h , this is found in a similarmanner to the way in which we found 3h . Then by interpolating tables the degree of superheat at state 3
for enthalpy 3 404.74 /h kJ kg , is (410.5 404.74) 0.57610
and so since entropy difference is
(17562 1.7238) 0.0324 at 3 3.4966p bar thenentropy 3 41.7238 (0.576)(0.0324) 1.7424 /s kJ kgK s .
Again, with a similar argument to above the degree of super heat at 4 8.867p bar is, from interpolation
of the entropies, 1.747 1.7424 0.1341.747 1.7126
so increase in enthalpy due to
superheat (0.134)(427.93 404.74) 3.107 /kJ kg so that 4 417.14 3.107 420.247 / .h kJ kg We now have all the enthalpies needed to determine the compressor work.Therefore, 6 2 1 4 3(1 )( ) ( )in LP HPW W W x h h h h so that:
(1 0.217(405.69 386.44) (420.247 404.74) 30.58 /inW kJ kg

24
d) Finally, the coefficient of performance may be found using the relationship in
comp
QCOP
W where, as
before this coefficient is the ratio of the refrigerating effect inQ over the work input ( )compW and is
given in this case as 142.49 4.6630.58
in
comp
QCOP
W .
Finally, you are strongly advised to work through Example 11, with the tables to hand, making sure you fullyunderstand how the required specific enthalpies were found, including the use where necessary, of interpolationto determine the associated entropies, as well as the enthalpies.
This bring us to the end of our short introduction to vapour properties, cycles and plant, if you wish to pursueyour study of vapour compression and other types of refrigeration systems, you should refer to the samestandard undergraduate texts on thermodynamics, detailed at the end of Section 2.
© Lloyd Dingle 2013 For further information please go to www.key2engineeringscience.com