Allianz Vision Allianz Vision SM Variable Annuity Prospectus

Vanguard® Variable Annuity
Prospectus
May 1, 2018
Vanguard Variable Annuity Prospectus May 1, 2018
Issued Through Separate Account VA DD By Transamerica Premier Life Insurance Company
The Vanguard Variable Annuity (the “Contract”) provides a means of investing on a tax-deferred basis in Portfolios of Vanguard Variable Insurance Fund
Money Market Portfolio
Short-Term Investment-Grade Portfolio
Total Bond Market Index Portfolio
Global Bond Index Portfolio
High Yield Bond Portfolio
Conservative Allocation Portfolio
Moderate Allocation Portfolio
Balanced Portfolio
Equity Income Portfolio
Diversified Value Portfolio
Total Stock Market Index Portfolio
Equity Index Portfolio
Mid-Cap Index Portfolio
Growth Portfolio
Capital Growth Portfolio
Small Company Growth Portfolio
International Portfolio
Total International Stock Market Index
Portfolio
RealEstate Index Portfolio
The Contract is intended for retirement savings or other long-term investment purposes. You bear all investment risk (including the possible loss of principal), and investment results are not guaranteed. The Contract provides a Free Look Period of at least 10 days (20 days or more in some instances) during which the Contract may be cancelled.
Why Reading This Prospectus Is Important
This prospectus explains the Vanguard Variable Annuity. Reading the Contract prospectus will help you decide whether the Contract is the right investment for you. The Contract prospectus must be accompanied by a current prospectus for Vanguard Variable Insurance Fund, which discusses in greater depth the objective, risks, and strategies of each Portfolio of Vanguard Variable Insurance Fund. Please read them both carefully before you invest and keep them for future reference. A Statement of Additional Information for the Contract prospectus has been filed with the Securities and Exchange Commission, is incorporated by reference, and is available free by writing to Vanguard Annuity and Insurance Services, 455 Devon Park Drive, Wayne, PA 19087-1815 or by calling (800)522-5555 on business days between 8 a.m. and 8 p.m., Eastern time. The Table of Contents for the Statement of Additional Information is included at the end of the Contract prospectus.
Neither the Securities and Exchange Commission nor any state securities commission has approved or disapproved these securities or passed upon the accuracy or adequacy of this prospectus. Any representation to the contrary is a criminal offense.
The Contract is available in all states except New York.
This prospectus does not constitute an offering in any jurisdiction where it would be unlawful to make an offering like this. No one has been authorized to give any information or make any representations about this offering other than those contained in this prospectus. You should not rely on any other information or representations.
Contents
1 Cross Reference to Definitions 26 Access to Your Money 2 Summary 27 Performance 5 Fee Table 28 Death Benefit 7 Example 31 Additional Features 8 The Annuity Contract 36 Other Information 9 Annuity Payments 40 Table of Contents of Statement of Additional Information 11 Purchase 41 Appendix A (Condensed Financial Information) 14 Investment Options 45 Appendix B (Death Benefit) 19 Expenses 47 Appendix C (GLWB Rider – Adjusted Partial Withdrawals) 20 Tax Information 49
Appendix D (GLWB Rider – Blended Rider Fee)

1
CROSS REFERENCE TO DEFINITIONS
We have generally defined the technical terms associated with the Contract where they are used in this prospectus. The following list shows where certain of the more technical and more frequently used terms are defined in this prospectus. In the text you can easily locate the defined word because it will appear in bold type or its definition will be covered in a space on the page set aside specifically for discussion of the term.
Accumulated Value .......................................................................................................... 13
Accumulation Phase .......................................................................................................... 8
Accumulation Unit ............................................................................................................ 13
Accumulation Unit Value .................................................................................................. 13
Adjusted Partial Withdrawal ............................................................................................. 29
Annuitant .......................................................................................................................... 29
Annuity Payment Options ................................................................................................... 9
Beneficiary(ies) ................................................................................................................. 30
Business Day ................................................................................................................... 11
Company ............................................................................................................................ 2
Contract .............................................................................................................................. 8
Contract Date ................................................................................................................... 11
Contract Owner ................................................................................................................ 37
Free Look Period ................................................................................................................ 3
Guaranteed Lifetime Withdrawal Benefit (“GLWB”) Rider ................................................. 3
Income Date ....................................................................................................................... 9
Income Phase .................................................................................................................... 8
Initial Premium Payment .................................................................................................. 11
Joint Annuitant ................................................................................................................. 30
Net Premium Payment ..................................................................................................... 11
Non-Qualified Contract ....................................................................................................... 8
Portfolios .......................................................................................................................... 14
Premium Payment ............................................................................................................ 11
Premium Tax .................................................................................................................... 12
Qualified Contract ............................................................................................................ 11
Separate Account ............................................................................................................. 14
Subaccounts ..................................................................................................................... 14
Tax Deferral ...................................................................................................................... 21
Vanguard Variable Insurance Fund ................................................................................... 2
Valuation Period ............................................................................................................... 13

2
Summary
The sections in this Summary provide you with a concise discussion of the major topics covered in this prospectus. Each section of the Summary is discussed in greater detail in the main body of the prospectus at corresponding section headings. Please read the full prospectus carefully.
THE ANNUITY CONTRACT
The Vanguard Variable Annuity is a flexible-premium variable annuity offered by Transamerica Premier Life Insurance Company (the “Company”). The Contract provides a means of investing on a tax-deferred basis in various Subaccounts that invest in the portfolios of Vanguard Variable Insurance Fund (the “Portfolios”).
Who Should Invest
The Contract is intended for long-term investors who want tax-deferred accumulations of funds, generally for retirement but also for other long-term purposes.
The Contract provides benefits in two distinct phases: accumulation and income.
The Accumulation Phase
During the Accumulation Phase, you choose to allocate your investment in the Contract among the various Subaccounts that invest in the Vanguard Portfolios available under the Contract. You can contribute additional dollars to the Contract and you can take withdrawals from the Contract during the Accumulation Phase. The value of your investment depends on the investment performance of the Subaccounts you choose. Your earnings are generally not taxed during this phase unless you withdraw them.
The Income Phase
During the Income Phase, you can receive regular annuity payments on a fixed or variable basis and for various periods of time depending on your need for income and the choices available under the Contract. See Annuity Payments, for more information about Annuity Payment Options.
Vanguard Variable Insurance Fund
The Subaccounts available for investment under the Contract invest in Portfolios of Vanguard Variable Insurance Fund (the Fund), an open-end investment company. The Fund is a member of the Vanguard Group (Vanguard), a family of more than 200 mutual funds holding assets of approximately $4.5 trillion.
ANNUITY PAYMENTS
During the Income Phase, you receive regular annuity payments under a wide range of Annuity Payment Options. The Contract allows you to receive an income guaranteed for as long as you live or until the second of two people dies. You may also choose to receive a guaranteed number of payments over a number of years. Most Annuity Payment Options are available on either a variable basis (where the amount of the payment rises or falls depending on the investment performance of the Subaccount you have chosen) or a fixed basis (where the payment amount is guaranteed).
PURCHASE
You can buy the Contract with a minimum investment of $5,000 under most circumstances. You can add $250 or more at any time during the Accumulation Phase. Totals of all Premium Payments that exceed $5,000,000 may require prior approval from the Company.
INVESTMENT OPTIONS You can allocate your purchase payments to one of several underlying fund portfolios listed in this prospectus and described in the underlying fund prospectuses. Depending upon their investment performance, you can make or lose money in any of the subaccounts.
We currently allow you to transfer money between any of the investment choices during the accumulation phase. The Company does not charge a fee for exchanges among the subaccounts.
EXPENSES
There are no sales charges or sales loads associated with the Contract. The Company will deduct a daily charge corresponding to an annual charge of 0.10% of the net asset value of the
Separate Account as an Administrative Expense Charge and a daily charge corresponding to an annual charge of 0.20% for the mortality and expense risks assumed by the Company (a lower rate may be assessed for certain periods, please see Fee Table). If you choose the optional death benefit there will be an additional annual charge of 0.20% (0.05% of the accumulated value assessed quarterly). For Contracts valued at less than $25,000 at the time of fee assessment, there is also a $25 Annual Contract Maintenance Fee that is prorated at issue and assessed in full at calendar year-end.

3
You will also pay Fund Operating Expenses, which currently range from 0.11% to 0.40% annually of the average daily value of the Portfolios.
If you elect the Guaranteed Lifetime Withdrawal Benefit (“GLWB”) Rider, then there is a quarterly rider fee based on an annual rate of the current rider fee of 1.20% (0.95% for the portion of the total withdrawal base attributable to premium payments or transfers into designated investments prior to May 1, 2013) during the accumulation phase (for the single or joint life option) of the total withdrawal base on each rider anniversary.
TAXES
In general, you are not taxed on earnings on your investment in the Contract until you withdraw them or receive Annuity Payments. Earnings are taxed as ordinary income. During the Accumulation Phase, for tax purposes withdrawals are taken from earnings first, then from your investment in the Contract. If you receive money from the Contract before age 59 1/2, you may have to pay a 10% federal penalty tax on the earnings portion received. During the Income Phase, payments come partially from earnings, partially from your investment.
ACCESS TO YOUR MONEY
You can take money out of your Contract at any time during the Accumulation Phase without incurring a withdrawal charge. In the absence of specific directions from the contract owner, all deductions will be made from all funded Subaccounts on a pro rata basis. You may have to pay income tax and a tax penalty on any money you take out. Please refer to minimum withdrawal requirements based on withdrawal type and disbursement method.
PERFORMANCE
The investment performance of the Subaccounts you choose directly affects the value of your Contract. You bear all investment risk (including the possible loss of principal), and investment results are not guaranteed.
From time to time, the Company may advertise the investment performance of the Subaccounts. In doing so, it will use standardized methods prescribed by the Securities and Exchange Commission (“SEC”), as well as certain non-standardized methods.
Past performance does not indicate or predict future performance.
DEATH BENEFIT
If the Annuitant dies during the Accumulation Phase, the Beneficiary will receive the Death Benefit. The Death Benefit is the then-current Accumulated Value of the Contract on the date the Company receives Due Proof of Death and all Company forms, fully completed. However, for an additional charge, there is an optional Death Benefit Rider available that you can select at the time of purchase, the Return of Premium Death Benefit (the “optional Death Benefit”) (see Death Benefit). The optional Death Benefit is the greater of the then-current Accumulated Value of the Contract or the sum of all Premium Payments less any Adjusted Partial Withdrawals and Premium Taxes, if any. The Contract is a variable annuity and if applicable, the Death Benefit is subject to market risk until Beneficiaries have made claim (any optional Death Benefit may also be subject to market risk until Beneficiaries have made claim). The Beneficiary may elect to receive these amounts as a lump sum or as Annuity Payments. ADDITIONAL FEATURES
GLWB Rider
You may elect to purchase the optional Guaranteed Lifetime Withdrawal Benefit (“GLWB”) Rider (also known as Secure IncomeTM). The rider provides you with a guaranteed lifetime withdrawal benefit (subject to the claims-paying ability of the insurance company) for amounts you have invested in certain designated investments available under the Contract. The rider is available during the accumulation phase, and only the designated investments will be considered in determining the total withdrawal base for the guaranteed lifetime withdrawal benefit provided under the rider. Transfers from designated investments to non-designated investments will be considered withdrawals under the rider. Excess withdrawals may significantly reduce or eliminate the benefit of this rider. The tax rules for qualified contracts may limit the value of this rider. Please consult a qualified tax advisor before electing the GLWB Rider for a qualified contract. There is an extra charge for this rider.
OTHER INFORMATION
Free Look Period
The Contract provides for a Free Look Period of at least 10 days after the Contract Owner receives the Contract (20 or more days in some instances as specified in your Contract) plus 5 days for mailing.
TRANSAMERICA PREMIER LIFE INSURANCE COMPANY
Transamerica Premier Life Insurance Company is a life insurance company incorporated under Iowa law. It is principally engaged in offering life insurance and annuity contracts.

4
Separate Account VA DD
The Separate Account VA DD (the “Separate Account”) is a unit investment trust registered with the SEC and operating under Iowa law. The Separate Account has various Subaccounts, each of which invests solely in a corresponding Portfolio of the Fund.
Other topics
Additional information on the topics summarized above and on other topics not summarized here can be found at Other Information.
INQUIRIES AND CONTRACT AND POLICYHOLDER INFORMATION
For more information about the Vanguard Variable Annuity, call (800)522-5555 or write:
Regular Mail: Overnight or Certified Mail:
Vanguard Annuity and Insurance Services Vanguard Annuity and Insurance Services P.O. Box 1105 455 Devon Park Drive Valley Forge, PA 19482-1105 Wayne, PA 19087-1815
If you have questions about your Contract, please telephone Vanguard Annuity and Insurance Services at (800)462-2391. Personal and/or account specific information may be requested to validate a caller’s identity and authorization prior to the providing of any information. We reserve the right to refuse a telephone request if the caller is unable to provide the requested information or if we reasonably believe that the caller is not an individual authorized to act on the Contract. As Contract Owner, you will receive periodic statements confirming any transactions that take place as well as quarterly statements and an annual report.

5
Fee Table
The following Fee Table illustrates all expenses that you would incur as a Contract Owner. The purpose of this Fee Table is to assist you in understanding the various costs and expenses that you would pay directly or indirectly as a purchaser of the Contract. The first table describes the fees and expenses that you will pay at the time you purchase the Contract, surrender the Contract, or transfer cash value between investment options. State premium taxes may also be deducted. For a complete discussion of Contract cost and expenses, see Expenses. OWNER TRANSACTION EXPENSES
Sales Load Imposed on Purchases .......................................................................................................... None
Surrender Fees ......................................................................................................................................... None
Exchange Fees ......................................................................................................................................... None
State Premium Tax (See Premium Tax) ................................................................................... 0.00% to 3.50%
The next table describes the fees and expenses that you will pay periodically during the time that you own the Contract, not including the investment portfolios’ fees and expenses. SEPARATE ACCOUNT ANNUAL EXPENSES1 (as a percentage of average account value)
Annual Contract Maintenance Fee2 ............................................................................................................. $25
Accumulated Value Death Benefit
Mortality and Expense Risk Charge3,4 ................................................................................................ 0.20%
Administrative Expense Charge ......................................................................................................... 0.10%
Total Separate Account Annual Expenses ............................................................................... 0.30% OPTIONAL RIDER FEES
Return of Premium Death Benefit5,6 ........................................................................................................ 0.20%
Return of Premium Death Benefit (No Longer Available for New Issues)6,7 ........................................... 0.05%
Annual Step-Up Death Benefit (No Longer Available for New Issues)6,8 ................................................ 0.12% GLWB Rider (annualized rate—% of Total Withdrawal Base attributable to premium payments and
transfers into designated investments on or after May 1, 2013)9:
Maximum ............................................................................................................................................ 2.00%
Current ................................................................................................................................................ 1.20% GLWB Rider (annualized rate—% of Total Withdrawal Base attributable to premium payments and
transfers into designated investments prior to May 1, 2013)9: ......................................................... 0.95%
1 See Expenses, for more information. 2 Applies to Contracts valued at less than $25,000 at the time of initial purchase and any year thereafter if the Accumulated Value is below
$25,000. For Contracts valued at less than $25,000 at the time of fee assessment, the $25 Annual Contract Maintenance Fee is prorated at issue and assessed in full at calendar year-end.
3 The mortality and expense risk charge will not be greater than 0.20% (as shown in the table); however, the fee may be assessed at a lower rate for certain periods.
4 Currently, the daily mortality and expense risk charge will be assessed at a rate corresponding to an annual charge of 0.190%. 5 For contract owners who purchased the contract on or after October 19, 2011. 6 This additional annual fee is a percentage of the Accumulated Value that is assessed at the beginning of each quarter based on the
Contract Anniversary Date. 7 For contract owners who purchased the contract on or before October 18, 2011. 8 For contract owners who purchased the contract prior to October 30, 2010. 9 The GLWB rider fee is a percentage of the total withdrawal base. The total withdrawal base on the date the rider takes effect (“rider date”)
is the accumulated value in the designated investments. During any rider year, the total withdrawal base is equal to the total withdrawal base on the rider date or on the most recent rider anniversary, plus subsequent premium payments to or transfers into the designated investments under the rider, less any total withdrawal base adjustments. On the rider anniversary the total withdrawal base can step up to the accumulated value in the designated investments if the accumulated value in the designated investments is greater than the current total withdrawal base.
The annual rider fee percentage is currently 1.20% (for the single or joint life option). If any premium additions or transfers are made into the designated investments under the rider, then a new rider fee percentage may apply to such premium additions or transfers. Thereafter, if a new fee applies the total rider fee will be adjusted to reflect the weighted average of the current rider fee percentage and the rider fee percentage associated with the additional premium and/or transfers to the designated investments under the rider.

6
The next item shows the minimum and maximum total operating expenses charged by the investment Portfolios that you may pay periodically during the time that you own the Contract. More detail concerning each investment Portfolio’s fees and expenses is contained in the prospectus for the Fund.
TOTAL FUND OPERATING EXPENSES1
Minimum Maximum
Expenses that are deducted from Portfolio assets, including management fees, distribution and/or service (12b-1) fees, and other expenses 0.11% 0.40%
1 The fee table information relating to the underlying fund portfolios is for the year ending December 31, 2017 (unless otherwise noted) and was provided to the Company by the underlying fund portfolios, their investment advisors or managers. Actual future expenses of the portfolios may be greater or less than those shown in the table.
ANNUAL FUND OPERATING EXPENSES during the fiscal year ended December 31, 2017
Subaccount Management
Fees
12b-1 Distribution
Fees Other
Expenses
Acquired Fund Fees
and Expenses
Total Fund Operating Expenses
Money Market Portfolio1 0.13% None 0.03% 0.00% 0.16%
Short-Term Investment-Grade Portfolio 0.13% None 0.03% 0.00% 0.16%
Total Bond Market Index Portfolio 0.12% None 0.03% 0.00% 0.15%
Global Bond Index Portfolio4 0.00% None 0.00% 0.14% 0.14%
High Yield Bond Portfolio 0.25% None 0.03% 0.00% 0.28%
Conservative Allocation Portfolio 0.00% None 0.00% 0.14%2 0.14%
Moderate Allocation Portfolio 0.00% None 0.00% 0.14%2 0.14%
Balanced Portfolio 0.21% None 0.02% 0.00% 0.23%
Equity Income Portfolio 0.29% None 0.02% 0.00% 0.31%
Diversified Value Portfolio 0.25% None 0.02% 0.00% 0.27%
Total Stock Market Index Portfolio 0.00% None 0.00% 0.15%2 0.15%
Equity Index Portfolio 0.13% None 0.02% 0.00% 0.15%
Mid-Cap Index Portfolio 0.16% None 0.03% 0.00% 0.19%
Growth Portfolio 0.37% None 0.03% 0.00% 0.40%
Capital Growth Portfolio 0.34% None 0.02% 0.00% 0.36%
Small Company Growth Portfolio 0.31% None 0.03% 0.00%3 0.34%
International Portfolio 0.36% None 0.03% 0.00% 0.39%
Total International Stock Market Index Portfolio5 0.00% None 0.00% 0.11% 0.11%
Real Estate Index Portfolio6 0.24% None 0.03% 0.00% 0.27%
1 Vanguard and the Portfolio’s Board have voluntarily agreed to temporarily limit certain net operating expenses in excess of the Portfolio’s daily yield
so as to maintain a zero or positive yield for the Portfolio. Vanguard and the Portfolio’s Board may terminate the temporary expense limitation at any time.
2 Although the Portfolio is not expected to incur any net expenses daily, the Portfolio’s contract owners indirectly bear the expenses of the underlying Vanguard funds in which the Portfolio invests. This figure includes transaction costs (i.e., purchase and redemption fees), if any, imposed on the Portfolio by the underlying funds. See the Vanguard Variable Insurance Fund Prospectus.
3 Acquired Fund Fees and Expenses are expenses incurred indirectly by the Portfolio through its ownership of shares in other investment companies, such as business development companies. These expenses are similar to the expenses paid by any operating company held by the Portfolio. They are not direct costs paid by Portfolio shareholders and are not used to calculate the Portfolio’s net asset value. They have no impact on the costs associated with portfolio operations.
4 Effective on or about September 7, 2017 Global Bond Index Portfolio with the advisor The Vanguard Group, Inc. was made available. 6 Effective on or about September 7, 2017 Total International Stock Market Index Portfolio with the advisor The Vanguard Group, Inc. was made available. 6 Effective on or about January 18, 2018 REIT Index Portfolio was renamed Real Estate Index Portfolio.

7
Example
The following Example is intended to help you compare the cost of investing in the Contract with the cost of investing in other variable annuity contracts. These costs include Contract owner transaction expenses, Separate Account annual expenses, and Portfolio fees and expenses.1
The Example assumes that you invest $10,000 in the Contract for the time periods indicated. The Example also assumes that your investment has a 5% annual rate of return each year, the highest fees and expenses of any of the Portfolios for the year ended December 31, 2017, and the Contract with the combination of available optional features with the highest fees and expenses, including the GLWB Rider (Joint Life), the Accumulated Value Death Benefit Option and the Return of Premium Death Benefit Option, respectively. Although your actual costs may be higher or lower, based on these assumptions, your costs would be:
1 Year 3 Years 5 Years 10 Years
If the Contract is annuitized or if you surrender the Contract at the end of the applicable time period
• Return of Premium Death Benefit Option $211 $653 $1120 $2411
• Accumulated Value Death Benefit Option $191 $591 $1017 $2201 1 The Example does not reflect premium tax charges. Different fees and expenses not reflected in the Example may be assessed during the income
phase of the Contract.
Please remember that the Example is an illustration and does not represent past or future expenses. Your actual expenses may be lower or higher than those reflected in the Example. Similarly, your rate of return may be more or less than the 5% assumed in the Example.
For information concerning the compensation and expenses paid for the sale of the Contracts, see “Distributor of the Contracts.”
CONDENSED FINANCIAL INFORMATION
Please note that Appendix A contains a history of accumulation unit values in a table labeled “Condensed Financial Information.”
Automated Quotes
The Vanguard Tele-Account Service provides access to Accumulation Unit Values (to six decimal places) and total returns for all Subaccounts, and yield information for the Money Market, Total Bond Market Index, High Yield Bond, and Short-Term Investment-Grade Portfolios of the Fund. Contract Owners may use this service for 24-hour access to Portfolio information. To access the service you may call Tele-Account at (800)662-6273 (ON-BOARD) and follow the step-by-step instructions, or speak with a Vanguard Annuity and Insurance Services associate at (800)522-5555 to request a brochure that explains how to use the service.
Vanguard’s website also has Accumulation Unit Values (to six decimal places) for all Subaccounts. This service can be accessed from vanguard.com.
Accessing Your Contract on the Web
You may access information and manage your annuity on vanguard.com. This convenient service, available 24-hours a day, allows you to check your annuity balances, your Portfolio holdings, and make exchanges between Portfolios at any time. (Note: exchange requests received prior to the close of regular trading on the New York Stock Exchange—usually 4 p.m., Eastern time—will be processed as of the close of business on that same day. Requests received after the close of regular trading will be processed the next Business Day).
In order to access your annuity on the web, you must be a registered user of vanguard.com. You can simply log on to vanguard.com to register, or speak with a Vanguard Annuity and Insurance Services associate at (800)522-5555 for assistance.

8
The Annuity Contract
The Vanguard Variable Annuity is a flexible-premium variable annuity offered by Transamerica Premier Life Insurance Company (the “Company”). The Contract provides a means of investing on a tax-deferred basis in Subaccounts that invest in various portfolios (the “Portfolios”) offered by Vanguard Variable Insurance Fund. You may purchase a Contract using after-tax dollars (a Non-Qualified Contract), or you may purchase a Qualified Contract by “rolling over” funds from another individual retirement annuity or from a qualified plan.
Who Should Invest
The Contract is intended for long-term investors who are United States citizens or Resident Aliens who want tax-deferred accumulation of funds, generally for retirement but also for other long-term investment purposes. The tax-deferred feature of the Contract is most attractive to investors in high federal and state marginal tax brackets who have exhausted other avenues of tax deferral, such as pre-tax contributions to employer-sponsored retirement or savings plans. The tax-deferred feature of the Contract is unnecessary when the Contract is purchased to fund a qualified plan.
About the Contract
The Vanguard Variable Annuity is a contract between you, the Contract Owner, and the Company, the issuer of the Contract.
The Contract provides benefits in two distinct phases: accumulation and income.
Accumulation Phase
The Accumulation Phase starts when you purchase your Contract and ends immediately before the Income Date, when the Income Phase starts. During the Accumulation Phase, you choose to allocate your investment in the Contract among the various available Subaccounts. The Contract is a variable annuity because the value of your investment in the Subaccounts can go up or down depending on the investment performance of the Subaccounts you choose. The Contract is a flexible-premium annuity because you can make additional investments of at least $250 until the Income Phase begins. During this phase, you are generally not taxed on earnings from amounts invested unless you withdraw them.
Other benefits available during the Accumulation Phase include the ability to: Make transfers among your Subaccount choices (“exchanges”) at no charge and without current tax consequences.
(See Exchanges Among the Subaccounts.) Withdraw all or part of your money with no surrender penalty charged by the Company, although you may incur income
taxes and a 10% penalty tax prior to age 59½. (See Full and Partial Withdrawals.)
Income Phase
During the Income Phase, you receive regular annuity payments. The amount of these payments is based in part on the amount of money accumulated under your Contract (its Accumulated Value) and the Annuity Payment Option you select. The Annuity Payment Options are explained at Annuity Payments.
At your election, payments can be either variable or fixed. If variable, the payments rise or fall depending on the investment performance of the Subaccounts you choose. If fixed, the payment amounts are guaranteed.
Annuity payments are available in a wide variety of options, including payments over a specified period or for life (for either a single life or joint lives), with or without a guaranteed number of payments.
Please note: all benefits (guaranteed benefit or living benefit riders) under the Contract terminate when annuity payments begin or on the maturity date. The only benefits that remain include guarantees provided under the terms of the annuity option.
The Separate Account
When you purchase a Contract, your money is deposited into the Company’s Separate Account VA DD (the “Separate Account”). The Separate Account contains a number of Subaccounts that invest exclusively in shares of the corresponding Portfolios. The investment performance of each Subaccount is linked directly to the investment performance of one of the Portfolios. Assets in the Separate Account belong to the Company but are accounted for separately from the Company’s other assets and can be used only to satisfy its obligations to Contract Owners.
Vanguard Variable Insurance Fund
The Subaccounts available for investment under the Contract invest in the Portfolios of Vanguard Variable Insurance Fund, an open-end investment company intended exclusively as an investment vehicle for variable annuity and variable life insurance contracts offered by insurance companies. The Fund is a member of the Vanguard Group (Vanguard), a family of more than 200 mutual funds holding assets of approximately $4.5 trillion. Through their jointly owned subsidiary, Vanguard, Vanguard Variable Insurance Fund and the other funds in the group obtain at cost virtually all of their corporate management, administrative, shareholder accounting, and distribution services.

9
Annuity Payments
During the Income Phase, you receive regular annuity payments under a wide range of Annuity Payment Options.
Starting the Income Phase
As Contract Owner, you exercise control over when the Income Phase begins. The Income Date is the date on which annuity payments begin and is always the first day of the month. You may also change the Income Date at any time in writing, as long as the Annuitant or Joint Annuitant is living and the Company receives the request at least 30 days before the then-scheduled Income Date. Any Income Date you request must be at least 30 days from the day the Company receives written notice. You can generally change the annuity commencement date by giving us 30 days notice with the new date or age. The latest Income Date generally cannot be after the date specified in your Contract unless a later date is agreed to by us. The earliest Income Date is at least 30 days after you purchase your Contract. The Income Date on Qualified Contracts may also be controlled by the plan or its endorsements. It is important to remember that annuitizing your Contract is an irrevocable decision once Annuity Payments have begun.
Your Contract may not be “partially” annuitized, i.e., you may not apply a portion of your contract value to an Annuity Option while keeping the remainder of your Contract in force.
Please note: all benefits (guaranteed benefit or living benefit riders) under the Contract terminate when annuity payments begin or on the maturity date. The only benefits that remain include guarantees provided under the terms of the annuity option.
Annuity Payment Options
The income you take from the Contract during the Income Phase can take several different forms, depending on your particular needs. Except for the Period Certain Annuity Option listed below, the Annuity Payment Options listed below are available on either a variable basis or a fixed basis. Other Annuity Payment Options may be available. For Qualified Contracts, the Annuity Payment option must satisfy the minimum distribution requirements under the federal tax law.
If available on a variable basis, the Annuity Payment Options provide payments that, after the initial payment, will go up or down depending on the investment performance of the Subaccounts you choose.
If available on a fixed basis, the Annuity Payment Options provide payments in an amount that does not change. If you choose a fixed Annuity Payment Option, the Company will move your investment out of the Subaccounts and into the general account of the Company.
1. Life Annuity—Monthly Annuity Payments are paid for the life of an Annuitant, ending with the last payment before the Annuitant dies. If the annuitant dies before the due date of the second (third, fourth, etc ) annuity payment, then we will only make one (two, three, etc ) annuity payments.
2. Joint and Last Survivor Annuity—Monthly Annuity Payments are paid for as long as at least one of two named Annuitants is living, ending with the last payment before the surviving Annuitant dies. This option is also available as a 50% or 75% Last Survivor Annuity. (The payment decreases by 50% or 25%, respectively upon the death of the first annuitant.) If the surviving annuitant dies before the due date of the second (third, fourth, etc ) annuity payments, then we will only make one (two, three, etc ) annuity payments.
3. Life Annuity With Period Certain—Monthly Annuity Payments are paid for as long as the Annuitant lives, with payments guaranteed to be made for a period of 10,15, 20 or 30 years, as elected. If the Annuitant dies before the period certain ends, the Company will make any remaining payments to the Beneficiary.
4. Period Certain Annuity—Available only on a fixed basis. Monthly Annuity Payments are paid for a specified period, which may be from 10 to 30 years.
Adjusted Annuitant Age
Annuity Payments under Options 1, 2, and 3 are based on the Adjusted Age of the Annuitant. The Adjusted Age is the Annuitant’s actual age on the Annuitant’s nearest birthday, at the Income Date, adjusted as follows:
Income Date Adjusted Age
Before 2010 Actual Age
2010-2019 Actual Age minus 1
2020-2026 Actual Age minus 2
2027-2033 Actual Age minus 3
2034-2040 Actual Age minus 4
After 2040 Determined by the Company
Calculating Annuity Payments Fixed Annuity Payments. Each fixed Annuity Payment is guaranteed to be at least the amount shown in the Contract’s Annuity Tables corresponding to the Annuity Payment Option selected.

10
Variable Annuity Payments. To calculate variable Annuity Payments, the Company determines the amount of the first variable Annuity Payment. The first variable Annuity Payment will equal the amount shown in the applicable Annuity Table in the Contract. This amount depends on the Accumulated Value of your Contract on the date your Annuity Payment amount is calculated, the sex and age of the Annuitant (and Joint Annuitant where there is one), the Annuity Payment Option selected, and any applicable Premium Taxes. Subsequent variable Annuity Payments depend on the investment experience of the Subaccounts chosen. If the actual net investment experience of the Subaccounts chosen exactly equals the Assumed Interest Rate (or AIR, which is the annual effective rate used in the calculation of each variable annuity payment), of 4%, then the variable Annuity Payments will not change in amount. If the actual net investment experience of the Subaccounts chosen is greater than the AIR of 4%, then the variable Annuity Payments will increase. On the other hand, they will decrease if the actual experience is lower. The Statement of Additional Information contains a more detailed description of the method of calculating variable Annuity Payments.
Impact of Annuitant’s Age on Annuity Payments. For either fixed or variable Annuity Payments involving life income, the actual ages of the Annuitant and Joint Annuitant will affect the amount of each payment. Since payments based on the lives of older Annuitants and Joint Annuitants are expected to be fewer in number, the amount of each Annuity Payment will be greater.
Impact of Annuitant’s Sex on Annuity Payments. For either fixed or variable Annuity Payments involving life income, the sex of the Annuitant and Joint Annuitant will affect the amount of each payment. Since payments based on the lives of male Annuitants and Joint Annuitants are expected to be fewer in number, in most states the amount of each Annuity Payment will be greater than for female Annuitants and Joint Annuitants.
Impact of Length of Payment Periods on Annuity Payments. The value of all payments, both fixed and variable, will be greater for shorter guaranteed periods than for longer guaranteed periods, and greater for single-life annuities than for joint and survivor annuities, because they are expected to be made for a shorter period.
A FEW THINGS TO KEEP IN MIND REGARDING
Annuity Payments
If an Annuity Payment Option is not selected, the Company will assume that you chose the Life Annuity With Period Certain option (with 10 years of payments guaranteed) on a variable basis.
The minimum monthly payment is $100 ($20 for Contracts issued to South Carolina, Texas, and Massachusetts residents). If on the Income Date your Accumulated Value is below $5,000 (or $2,000 for Contracts issued to South Carolina, Texas, and Massachusetts residents), the Company reserves the right to pay that amount to you in a lump sum.
From time to time, the Company may require proof that the Annuitant, Joint Annuitant, or Contract Owner is living.
If someone has assigned ownership of a Contract to you, or if a non-natural person (e.g., a corporation) owns a Contract, you may not start the Income Phase of the Contract without the Company’s consent.
At the time the Company calculates your fixed Annuity Payments, the Company may offer more favorable rates than those guaranteed in the Annuity Tables found in the Contract.
Once Annuity Payments begin, you may not select a different Annuity Payment Option. Nor may you cancel an Annuity Payment Option after Annuity Payments have begun.
If you have selected a variable Annuity Payment Option, you may change the Subaccounts funding the variable Annuity Payments by written request or by calling Vanguard Annuity and Insurance Services at (800)462-2391. However, each Vanguard Variable Annuity portfolio (other than money market portfolios and short-term bond portfolios) generally prohibits an investor’s purchases or exchanges into a portfolio for 30 calendar days after the investor has redeemed or exchanged out of that portfolio.
You may select an Annuity Payment Option and allocate a portion of the value of your Contract to a fixed version of that Annuity Payment Option and a portion to a variable version of that Annuity Payment Option (assuming the Annuity Payment Option is available on both a fixed and variable basis). You may not select more than one Annuity Payment Option.
If you choose an Annuity Payment Option and the postal or other delivery service is unable to deliver checks to the Payee’s address of record, no interest will accrue on amounts represented by uncashed Annuity Payment checks. It is the Payee’s responsibility to keep the Company informed of the Payee’s most current address of record.
If annuity payments are selected as a death distribution option, payments must begin within one year of the date of death.

11
Purchase
Application and Issuance of Contracts
Contract Issuance. To invest in the Vanguard Variable Annuity, you should send a completed Application, Assessment and Disclosure form, and your Initial Premium Payment to Vanguard Annuity and Insurance Services. Depending on the Death Benefit option selected, there may be limitations on the age of the Annuitant (See Death Benefit). If the Contract Owner is an individual, there must be an immediate familial relationship (such as spouse, domestic partner, parent, child, grandparent, grandchild, or sibling) between the Contract Owner and the Annuitant.
If the Application is received in good order, the Company will issue the Contract and will credit the Initial Premium Payment within two Business Days after receipt. A Business Day is any day that the New York Stock Exchange is open for trading.
If the Company cannot credit the Initial Premium Payment because the Application is incomplete, the Company will contact the applicant, explain the reason for the delay, and refund the Initial Premium Payment within five Business Days unless the client consents to the Company’s retaining the Initial Premium Payment and crediting it as soon as the necessary requirements are fulfilled.
In order to prevent lengthy processing delays caused by the clearing of foreign checks, the Company will accept only those foreign checks that are drawn in U.S. dollars and are issued by a foreign bank with a U.S. correspondent bank.
You may purchase a Qualified Contract only in connection with a “rollover” of funds from another qualified plan or individual retirement annuity. Qualified Contracts contain certain other restrictive provisions limiting the timing of payments to and distributions from the Qualified Contract. No additional Premium Payments to your Qualified Contract will be accepted, unless the additional premium payment is funded by another qualified plan. (See QUALIFIED INDIVIDUAL RETIREMENT ANNUITIES.)
DEFINITION
Qualified Contract
When the term “Qualified Contract” is used in this prospectus we generally mean a Contract that qualifies as an individual retirement annuity under Section 408(b) of the Internal Revenue Code; there are other types of qualified annuity contracts defined under different Internal Revenue Code sections.
Premium Payments
A Premium Payment is any amount you use to buy or add to the Contract. A Premium Payment may be reduced by any applicable Premium Tax or an initial Annual Contract Maintenance Fee. In that case, the resulting amount is called a Net Premium Payment.
A FEW THINGS TO KEEP IN MIND REGARDING
Premium Payments
The minimum Initial Premium Payment for a Contract is $5,000. You must obtain prior Company approval to purchase a policy with an amount less than the stated minimum.
The Company will not accept third-party checks, Travelers checks, or money orders for Premium Payments.
You may make additional Premium Payments at any time during the Accumulation Phase and while the Annuitant or Joint Annuitant, if applicable, is living. Additional Premium Payments must be at least $250 unless you have obtained our prior approval to accept a lesser amount.
We will credit Additional Premium Payments to your policy as of the business day we receive your premium and required information in good order at our Administrative Office. Additional Premium Payments must be received before the close of the New York Stock Exchange (usually 4 p.m., Eastern time) to get same-day pricing of the additional Premium Payment.
The minimum amount that you can allocate to any one Subaccount is $1,000. We reserve the right to reject cumulative premium payments over $5,000,000 (this includes
subsequent premium payments) for all Contracts with the same owner or same annuitant. The Company reserves the right to reject any Application or Premium Payment.
The date on which the Initial Premium Payment is credited and the Contract is issued is called the Contract Date.

12
DEFINITION
Premium Tax
A Premium Tax is a regulatory tax some states assess on the Premium Payments made into a Contract. If the Company should have to pay any Premium Tax, it may be deducted from each Premium Payment or from the Accumulated Value as the Company incurs the tax.
As of the date of this Prospectus, the following states assess a Premium Tax on all Initial and subsequent Premium Payments, including 1035 exchanges:
Qualified
Non-Qualified
Maine 0.00% 2.00%
South Dakota 0.00 1.25*
Wyoming 0.00 1.00
*The tax of 1.25% is applied to the first $500,000 in premiums (including 1035 exchanges) in a calendar year. Any amount over $500,000 in a calendar year is assessed a 0.8% tax.
As of the date of this Prospectus, the following states assess a Premium Tax against the Accumulated Value if the Contract Owner chooses an Annuity Payment Option instead of receiving a lump sum distribution:
Qualified
Non-Qualified
California 0.50% 2.35%
Nevada 0.00 3.50
West Virginia 1.00 1.00
Purchasing by Wire
Money should be wired to: WELLS FARGO
ABA 121000248
DEPOSIT ACCOUNT NUMBER 2014126521732
TRANSAMERICA PREMIER LIFE INSURANCE COMPANY and
THE VANGUARD GROUP, INC.
[YOUR CONTRACT NUMBER]
[YOUR NAME]
Please call (800)462-2391 before wiring.
Please be sure your bank includes your Contract number to assure proper credit to your Contract. If you would like to wire your Initial Premium Payment, you should complete the Vanguard Variable Annuity Application
and the Assessment and Disclosure Form and mail it to Vanguard Annuity and Insurance Services, P.O. Box 1105, Valley Forge, PA 19482-1105, prior to completing wire arrangements. Wires from non-US banks are not accepted.
The Company will accept Federal Funds wire purchase orders only when the New York Stock Exchange and banks are open for business. A purchase payment received before the close of regular trading on the New York Stock Exchange (usually 4 p.m., Eastern time) will have a trade date of the same day, and purchase payments received after that time will have a trade date of the first business day following the date of receipt.
Annuity ExpressTM
The Annuity Express service allows you to make additional Premium Payments by transferring funds automatically from your checking or statement savings account (not passbook savings account) to one or more Subaccounts on a monthly, quarterly, semi-annual, or annual basis. You may add to existing Subaccounts provided you have a minimum balance of $1,000. The minimum automatic purchase is $50; the maximum is $100,000.
Section 1035 Exchanges
Under Section 1035 of the Internal Revenue Code, you may exchange the assets of an existing non-qualified annuity contract or life insurance or endowment policy to the Vanguard Variable Annuity without any current tax consequences. To make a “1035 Exchange,” complete a 1035 Exchange form and mail it along with your signed and completed Application and your current contract, to Vanguard Annuity and Insurance Services.
To accommodate owners of Vanguard Variable Annuities, under certain conditions the Company will allow for the consolidation of two or more Vanguard Variable Annuities into the newest Contract. In order to provide Contract Owners with consolidated account reporting, the Company will accept these exchanges on a case-by-case basis. If applicable,

13
you will be responsible for only one Annual Contract Maintenance Fee. Under no circumstances will the Company allow the exchange of an existing Vanguard Variable Annuity for an identical new Vanguard Variable Annuity.
Because special rules and procedures apply to 1035 Exchanges, particularly if the Contract being exchanged was issued prior to August 14, 1982, you should consult a tax advisor before making a 1035 Exchange.
Please note that any outstanding loans you may have on a contract you wish to exchange may create a current tax consequence. For this reason we encourage you to settle any outstanding loans with your current insurance company before initiating a 1035 Exchange into a Vanguard Variable Annuity.
Allocation of Premium Payments
You specify on the Application what portion of your Premium Payments you want to be allocated among which Subaccounts. You may allocate your Premium Payments to one or more Subaccounts. All allocations you make should be in whole-number percentages and a minimum of $1,000. Your Initial Net Premium Payment will be immediately allocated among the Subaccounts in the percentages you specified on your Application without waiting for the Free Look Period to pass.
Should your investment goals change, you may change the allocation percentages for additional Net Premium Payments by contacting Vanguard Annuity and Insurance Services. The change will take effect on the date the Company receives your request. You may establish the telephone privilege by completing the appropriate section of the Application, or by sending a letter authorizing the Company to take instructions by telephone. See Telephone and Online Privilege.
WHAT‘S MY CONTRACT WORTH TODAY?
Accumulated Value The Accumulated Value of your Contract is the value of all amounts accumulated under the Contract during the Accumulation Phase (similar to the current market value of a mutual fund account). When the Contract is opened, the Accumulated Value is equal to your initial Net Premium Payment. On any Business Day thereafter, the Accumulated Value equals the Accumulated Value from the previous Business Day;
plus: Any additional Net Premium Payments credited. Any increase in the Accumulated Value due to investment results of the Subaccount(s) you selected. minus: Any decrease in the Accumulated Value due to investment results of the Subaccount(s) you selected. The daily Mortality and Expense Risk Charge. The daily Administrative Expense Charge. The Annual Contract Maintenance Fee, if applicable. Any optional death benefit charge, if applicable. Any withdrawals. Any Premium Taxes that occur during the Valuation Period. The Valuation Period is any period between two successive Business Days beginning at the close of business of the first Business Day and ending at the close of business of the next Business Day. You should expect the Accumulated Value of your Contract to change from Valuation Period to Valuation Period, reflecting the investment experience of the Subaccounts you have selected as well as the daily deduction of charges. An Accumulation Unit is a measure of your ownership interest in the Contract during the Accumulation Phase. When you allocate your Net Premium Payments to a selected Subaccount, the Company will credit a certain number of Accumulation Units to your Contract. The Company determines the number of Accumulation Units it credits by dividing the dollar amount you have allocated to a Subaccount by the Accumulation Unit Value for that Subaccount as of the end of the Valuation Period in which the payment is received. Each Subaccount has its own Accumulation Unit Value (similar to the share price (net asset value) of a mutual fund). The Accumulation Unit Value varies each Valuation Period with the net rate of return of the Subaccount. The net rate of return reflects the performance of the Subaccount for the Valuation Period and is net of asset charges to the Subaccount. Per Subaccount, the Accumulated Value equals the number of Accumulation Units multiplied by the Accumulation Unit Value for that Subaccount. All dividends and capital gains earned will be reinvested and reflected in the Accumulation Unit Value, keeping the earnings tax-deferred.

14
Investment Options When you purchase the Contract, your Premium Payments are deposited into the Separate Account VA DD (the Separate Account). The Separate Account contains a number of subaccounts that invest exclusively in shares of the Portfolios of the Vanguard Variable Insurance Fund (the Subaccounts). The investment performance of each Subaccount is linked directly to the investment performance of one of the Portfolios. Assets in the Separate Account belong to the Company, but are accounted for separately from the Company’s other assets and can be used only to satisfy its obligations to the Contract Owners.
You can allocate your Premium Payments to one or more Subaccounts that invest exclusively in shares of the Portfolios. You are responsible for choosing the subaccounts for your annuity Contract, and the amounts allocated to each, that are appropriate for your own individual circumstances and your investment goals, financial situation, and risk tolerance. Since investment risk is borne by you, decisions regarding investment allocations should be carefully considered. You can make or lose money in any of the Subaccounts that invest in these Portfolios depending on their investment performance.
In making your investment selections, we encourage you to thoroughly investigate all of the information regarding the
Portfolios that is available to you, including each Portfolio’s prospectus, statement of additional information as well as the annual and semiannual reports. Other sources such as vanguard.com provide more current information. After you select the Portfolios for your initial premium allocation, you should monitor and periodically re-evaluate your allocations to determine if they are still appropriate.
Vanguard Variable Insurance Fund
The Vanguard Variable Annuity offers you a means of investing in various Subaccounts that invest in the Portfolios of Vanguard Variable Insurance Fund. For more detailed information regarding the Portfolios, you should read the prospectus for Vanguard Variable Insurance Fund that accompanies the Contract prospectus. If you received a summary prospectus for any of the Portfolios listed below, please follow the instructions on the first page of the summary prospectus to obtain a copy of the full Portfolio prospectus.
The general public may invest in the Portfolios of Vanguard Variable Insurance Fund only through certain insurance contracts. The investment objectives and policies of the Portfolios may be similar to those of publicly available Vanguard funds. You should not expect that the investment results of any publicly available Vanguard funds will be comparable to those of the Portfolios.
Exchanges Among the Subaccounts
Should your investment goals change, you may exchange assets among the Subaccounts at no cost, subject to the following conditions: You may request exchanges in writing, by telephone, or online at vanguard.com. The Company will process requests
it receives prior to the close of regular trading on the New York Stock Exchange (usually 4 p.m., Eastern time) at the close of business that same day. Requests received after the close of the New York Stock Exchange are processed the next Business Day.
The minimum amount you may exchange from a Subaccount is $250 (unless the Accumulated Value in a Subaccount is less than $250).
The Company does not charge a fee for exchanges among the Subaccounts.
Please note: If you elect the GLWB Rider, then transfers out of the designated investments may reduce or eliminate the benefits of the rider.
LIMITATIONS ON
Exchanges Because excessive exchanges can disrupt management of the Fund and increase the Fund’s costs for all Contract Owners, each Vanguard Variable Annuity portfolio (other than money market portfolios and short-term bond portfolios) generally prohibits an investor’s purchases or exchanges into a portfolio for 30 calendar days after the investor has redeemed or exchanged out of that portfolio.

15
PORTFOLIO AND MANAGEMENT INVESTMENT OBJECTIVE
Money Market PortfolioManager: The
Vanguard Group, Inc., through its Fixed Income Group
seeks to provide current income while maintaining liquidity and a stable share price of $1.
Short-Term Investment-Grade Portfolio Manager: The Vanguard Group, Inc., through its Fixed Income Group
seeks to provide current income while maintaining limited price volatility.
Total Bond Market Index Portfolio Manager: The Vanguard Group, Inc., through its Fixed Income Group
seeks to track the performance of a broad, market-weighted bond index.
Global Bond Index Portfolio (3) Manager: The Vanguard Group, Inc.
seeks to track the performance of a benchmark index that measures the investment return of the global, investment-grade, fixed income market.
High Yield Bond Portfolio Manager: Wellington Management Company, LLP
seeks to provide a high level of current income.
Conservative Allocation Portfolio Manager: The Vanguard Group, Inc.(1)
seeks to provide current income and low to moderate capital appreciation.
Moderate Allocation Portfolio Manager: The Vanguard Group, Inc.(1)
seeks to provide capital appreciation and a low to moderate level of current income.
Balanced Portfolio Manager: Wellington Management Company, LLP
seeks to provide long-term capital appreciation and reasonable current income.
Equity Income Portfolio Manager: Wellington Management Company, LLP and The Vanguard Group, Inc.
seeks to provide an above-average level of current income and reasonable long-term capital appreciation.
Diversified Value Portfolio Manager: Barrow, Hanley, Mewhinney & Strauss, LLC.
seeks to provide long-term capital appreciation and income.
Total Stock Market Index Portfolio Manager: The Vanguard Group, Inc.(2)
seeks to track the performance of a benchmark index that measures the investment return of the overall stock market.
Equity Index Portfolio Manager: The Vanguard Group, Inc., through its Equity Index Group
seeks to track the performance of a benchmark index that measures the investment return of large-capitalization stocks.
Mid-Cap Index Portfolio Manager: The Vanguard Group, Inc., through its Equity Index Group
seeks to track the performance of a benchmark index that measures the investment return of mid-capitalization stocks.
Growth Portfolio Manager: Jackson Square Partners, LLC, Wellington Management Company, LLP, and William Blair Investment Management, LLC
seeks to provide long-term capital appreciation.
Capital Growth Portfolio Manager: PRIMECAP Management Company
seeks to provide long-term capital appreciation.
Small Company Growth Portfolio Manager: The Vanguard Group, Inc. and ArrowMark Colorado Holdings, LLC
seeks to provide long-term capital appreciation.
International Portfolio Manager: Baillie Gifford Overseas Ltd, and Schroder Investment Management North America Inc.
seeks to provide long-term capital appreciation.
Total International Stock Market Index Portfolio (4) Manager: The Vanguard Group, Inc.
seeks to track performance of a benchmark index that measures the investment return of stocks issued by companies located in developed and emerging markets, excluding the United States.
Real Estate Index Portfolio(5) Manager: Vanguard Equity Investment Group
seeks to provide a high level of income and moderate long-term capital appreciation by tracking the performance of a benchmark index that measures the performance of publicly traded equity REITs and other real estate-related investments.
1 The Conservative Allocation Portfolio and Moderate Allocation Portfolio each receive advisory services indirectly by investing in U.S. fixed-
income securities; small-, mid-, and large-cap U.S. stocks; foreign fixed-income securities; and foreign stocks. 2 The Total Stock Market Index Portfolio receives advisory services indirectly by investing in the Equity Index Portfolio and Extended Market Index
Fund. 3 Effective on or about September 7, 2017 Global Bond Index Portfolio advisor The Vanguard Group, Inc. was made available. 4 Effective on or about September 7, 2017 Total International Stock Market Index Portfolio advisor The Vanguard Group, Inc. was made available. 5 Effective on or about January 18, 2018 REIT Index Portfolio was renamed Real Estate Index Portfolio.
There is no assurance that a Portfolio will achieve its stated objective.
Vanguard Variable Insurance Fund Money Market Portfolio

16
Vanguard has designated the Money Market Portfolio as a “retail money market fund.” Retail money market funds are defined as prime or tax-exempt money market funds that have policies and procedures
reasonably designed to limit all beneficial owners of such money market funds to natural persons. Retail money market funds will be allowed to continue to maintain a stable NAV through the use of amortized cost accounting. If a retail money market fund’s weekly assets fall below a certain threshold, retail money market funds are subject to fees and gates. There are two types of liquidity fees: discretionary liquidity fees and default liquidity fees. Discretionary liquidity fee. The Money Market Portfolio may impose a liquidity fee of up to 2% on all redemptions in the event that the Portfolio’s weekly liquid assets fall below 30% of its total assets if the Board determines that it is in the best interest of the Portfolio. Once the Portfolio has restored its weekly liquidity asset to 30% of total assets, any liquidity fee must be suspended. Default liquidity fee. The Money Market Portfolio is required to impose a liquidity fee of 1% on all redemptions in the event that the Portfolio’s weekly liquid assets fall below 10% of its total assets unless the Board determines that (1) the fee is not in the best interest of the Portfolio or (2) a lesser/higher fee (up to 2%) is in the best interest of the Portfolio.
In addition to, or in lieu of, the liquidity fee, the Money Market Portfolio is permitted to implement temporarily a redemption gate (i.e., suspend redemptions) if the Portfolio’s weekly liquid assets fall below 30% of its total assets. The gate could remain in effect for no longer than 10 days in any 90-day period. Once the Portfolio has restored its weekly liquidity assets to 30% of total assets, the gate must be lifted.
Please refer to the underlying fund prospectus for the Money Market Portfolio for additional information about any other changes to the strategies, fees and expenses and other important information.
Disruptive Trading and Market Timing Statement of Policy This variable insurance product was not designed for the use of market timers or other investors who make programmed, large, frequent, or short-term exchanges. Such exchanges may be disruptive to the underlying fund portfolios and increase transaction costs.
Market timing and other programmed, large, frequent, or short-term exchanges among the subaccounts can cause risks with adverse effects for other contract owners (and beneficiaries and underlying fund portfolios). These risks and harmful effects include:
(1)dilution of the interests of long-term investors in a subaccount if purchases or exchanges into or out of an underlying fund portfolio are made at prices that do not reflect an accurate value for the underlying fund portfolio’s investments (some market timers attempt to do this through methods known as “time-zone arbitrage” and “liquidity arbitrage”);
(2)an adverse effect on portfolio management, such as: (a)impeding a portfolio manager’s ability to sustain an investment objective; (b)causing the underlying fund portfolio to maintain a higher level of cash than would otherwise be the case; or (c) causing an underlying fund portfolio to liquidate investments prematurely (or otherwise at an inopportune time) in
order to pay withdrawals or exchanges out of the underlying fund portfolio; and (3)increased brokerage and administrative expenses.
These costs are borne by all contract owners invested in those subaccounts, not just those making the exchanges. We have developed policies and procedures with respect to market timing and other exchanges and we do not make special arrangements or grant exceptions to accommodate market timing or other potentially disruptive or harmful trading. Do not invest with us if you intend to conduct market timing or other potentially disruptive trading.
Detection. We employ various means in an attempt to detect and deter market timing and disruptive trading. However, despite our monitoring we may not be able to detect nor halt all harmful trading. In addition, because other insurance companies (and retirement plans) with different policies and procedures may invest in the underlying fund portfolios, we cannot guarantee that all harmful trading will be detected or that an underlying fund portfolio will not suffer harm from programmed, large, frequent, or short-term exchanges among subaccounts of variable products issued by these other insurance companies or retirement plans.
Deterrence. If we determine you are engaged in market timing or other disruptive trading, we may take one or more actions in an attempt to halt such trading. Your ability to make exchanges is subject to modification or restriction if we determine, in our sole opinion, that your exercise of the exchange privilege may disadvantage or potentially harm the rights or interests of other contract owners (or others having an interest in the variable insurance products). As described below, restrictions may take various forms, but under our current policies and procedures will include a temporary suspension of exchange privileges. We may also restrict the exchange privileges of others acting on your behalf.
We reserve the right to reject any premium payment or exchange request from any person without prior notice, if, in our judgment, (1) the payment or exchange, or series of exchanges, would have a negative impact on an underlying fund portfolio’s operations, or (2) if an underlying fund portfolio would reject or has rejected our purchase order, or (3) because of a history of large or frequent exchanges. We may impose other restrictions on exchanges, or even prohibit exchanges for any owner who, in our view, has abused, or appears likely to abuse, the exchange privilege. We may, at any time and

17
without prior notice, discontinue exchange privileges, modify our procedures, impose holding period requirements or limit the number, size, frequency, manner, or timing of exchanges we permit. Because determining whether to impose any such special restrictions depends on our judgment and discretion, it is possible that some policy owners could engage in disruptive trading that is not permitted for others. We also reserve the right to reverse a potentially harmful exchange if an underlying fund portfolio refuses or reverses our order; in such instances some contract owners may be treated differently than others. For all of these purposes, we may aggregate two or more variable insurance products that we believe are connected. If you engage a third party investment advisor for asset allocation services, then you may be subject to these transfer restrictions because of the actions of your investment advisor in providing these services.
In addition to our internal policies and procedures, we will administer your variable insurance product to comply with any applicable state, federal, and other regulatory requirements concerning exchanges. We reserve the right to implement, administer, and charge you for any fee or restriction, including redemption fees, imposed by any underlying fund portfolio. To the extent permitted by law, we also reserve the right to defer the exchange privilege at any time that we are unable to purchase or redeem shares of any of the underlying fund portfolios.
Under our current policies and procedures, we do: expressly limit the number of exchanges into and out of the same fund within a 30 day period as described in the
Investment Options section under Limitations on Exchanges. Under our current policies and procedures, we do not:
impose redemption fees on exchanges; or provide a certain number of allowable exchanges in a given period.
Redemption fees, exchange limits, and other procedures or restrictions may be more or less successful than ours in deterring market timing or other disruptive trading and in preventing or limiting harm from such trading.
Please note that the limits and restrictions described herein are subject to our ability to monitor exchange activity. Our ability to detect market timing or other disruptive trading may be limited by operational and technological systems, as well as by our ability to predict strategies employed by contract owners (or those acting on their behalf) to avoid detection. As a result, despite our efforts to prevent harmful trading activity among the variable investment options available under this variable insurance product, there is no assurance that we will be able to detect or deter frequent or harmful exchanges by such contract owners or intermediaries acting on their behalf. Moreover, our ability to discourage and restrict market timing or other disruptive trading may be limited by provisions of the variable insurance product.
Furthermore, we may revise our policies and procedures in our sole discretion at any time and without prior notice, as we deem necessary or appropriate (1) to better detect and deter market timing or other harmful trading that may adversely affect other contract owners, other persons with material rights under the variable insurance products, or underlying fund shareholders generally, (2) to comply with state or federal regulatory requirements, or (3) to impose additional or alternative restrictions on owners engaging in frequent exchange activity among the investment options under the variable insurance product. In addition, we may not honor exchange requests if any variable investment option that would be affected by the exchange is unable to purchase or redeem shares of its corresponding underlying fund portfolio.
Underlying Fund Portfolio Frequent Trading Policies. The underlying fund portfolios may have adopted their own policies and procedures with respect to frequent purchases and redemptions of their respective shares. Underlying fund portfolios may, for example, assess a redemption fee (which we reserve the right to collect) on shares held for a relatively short period of time. The prospectuses for the underlying fund portfolios describe any such policies and procedures. The frequent trading policies and procedures of an underlying fund portfolio may be different, and more or less restrictive, than the frequent trading policies and procedures of other underlying fund portfolios and the policies and procedures we have adopted for our variable insurance products to discourage market timing and other programmed, large, frequent, or short-term exchanges. Contract owners should be aware that we may not have the contractual ability or the operational capacity to monitor contract owners’ exchange requests and apply the frequent trading policies and procedures of the respective underlying funds that would be affected by the exchanges. Accordingly, contract owners and other persons who have material rights under our variable insurance products should assume that the sole protection they may have against potential harm from frequent exchanges is the protection, if any, provided by the policies and procedures we have adopted for our variable insurance products to discourage market timing or other disruptive trading.
Contract owners should be aware that we are required to provide to an underlying fund portfolio or its designee, promptly upon request, certain information about the trading activity of individual owners, and to restrict or prohibit further purchases or transfers by specific owners identified by an underlying fund portfolio as violating the frequent trading policies for that underlying fund portfolio. Omnibus Orders. Contract owners and other persons with material rights under the variable insurance products also should be aware that the purchase and redemption orders received by the underlying fund portfolios generally are

18
“omnibus” orders from intermediaries such as retirement plans and separate accounts funding variable insurance products. The omnibus orders reflect the aggregation and netting of multiple orders from individual retirement plan participants and individual owners of variable insurance products. The omnibus nature of these orders may limit the underlying fund portfolios’ ability to apply their respective frequent trading policies and procedures. We cannot guarantee that the underlying fund portfolios will not be harmed by exchange activity relating to the retirement plans or other insurance companies that may invest in the underlying fund portfolios. These other insurance companies are responsible for their own policies and procedures regarding frequent exchange activity. If their policies and procedures fail to successfully discourage harmful exchange activity, it will affect other owners of underlying fund portfolio shares, as well as the owners of all of the variable annuity or life insurance policies, including ours, whose variable investment options correspond to the affected underlying fund portfolios. In addition, if an underlying fund portfolio believes that an omnibus order we submit may reflect one or more exchange requests from owners engaged in market timing and other programmed, large, frequent, or short-term exchanges, the underlying fund portfolio may reject the entire omnibus order and thereby delay or prevent us from implementing your request.
Automatic Asset Rebalancing During the Accumulation Phase, you can automatically rebalance the amounts invested in the Subaccounts in order to maintain a desired allocation. This rebalancing occurs automatically on a date you select and can take place on a monthly, quarterly, semi-annual or annual basis (provided the $1,000 minimum balance requirement has been met in the Subaccount to which you are moving money). The minimum amount you may exchange is $250. Rebalancing can be started, stopped, or changed at any time. Automatic Asset Rebalancing cannot be used in conjunction with the Automatic Exchange Service. Any additional exchange requests will not cause Automatic Asset Rebalancing to cease (Please note, an Automatic Asset Rebalance will not begin on the 29th, 30th, or 31st of the month. If an Automatic Asset Rebalance would have started on one of these dates, it will start on the 1st business day of the following month). To take advantage of the Automatic Asset Rebalancing service, complete a Vanguard Variable Annuity Automatic Asset Rebalance service form or contact Vanguard Annuity and Insurance Services.
Automatic Exchange Service During the Accumulation Phase, you can move money automatically among the Subaccounts. You can exchange fixed dollar amounts or percentages of your Subaccount balance into the other Subaccounts offered under the Contract on either a monthly, quarterly, semi-annual, or annual basis (provided the $1,000 minimum balance requirement has been met in the Subaccounts to which you are moving money).The minimum amount you may exchange is $250. While you are participating in this service, if the service date falls on a day that the New York Stock Exchange is closed, the service date will be the next business day. (Please note, an Automatic Exchange Service will not begin on the 29th, 30th, or 31st of the month. If an Automatic Exchange Service would have started on one of these dates, it will start on the 1st business day of the following month.) The Automatic Exchange Service should not be used to circumvent the limits placed on exchanges.
Automatic Exchange Service
Using the Automatic Exchange Service, you can exchange at regular intervals in a plan of investing often referred to as “dollar-cost averaging,” moving money, for example, from the Money Market Portfolio into a stock or bond Portfolio. The main objective of dollar-cost averaging is to shield your investment from short-term price fluctuations. Since the same dollar amount is transferred to other Subaccounts each month, more Accumulation Units are credited to a Subaccount if the value per Accumulation Unit is low, while fewer Accumulation Units are credited if the value per Accumulation Unit is high. Therefore, it is possible to achieve a lower average cost per Accumulation Unit over the long term if the Accumulation Unit Value declines over that period. This plan of investing allows investors to take advantage of market fluctuations but does not assure a profit or protect against a loss in declining markets.
To take advantage of the Automatic Exchange Service, complete a Vanguard Variable Annuity Automatic Exchange Service Form or contact Vanguard Annuity and Insurance Services.
You may change the amount to be exchanged or cancel this service at any time in writing or by telephone if you have telephone authorization on your Contract. This service cannot be used to establish a new Subaccount, and will not go into effect until the Free Look Period has expired. The minimum balance requirements will not apply to the subaccount that money is being automatically moved from.

19
Telephone and Online Privilege You may establish the telephone and online privilege on your Contract by completing the appropriate section of the Application. You may request an exchange of assets among the subaccounts through vanguard.com if you are a registered user. The Company, the Fund, and Vanguard shall not be responsible for the authenticity of instructions received by telephone or online. We will take reasonable steps to confirm that instructions communicated are genuine. Personal and/or account specific information may be requested to validate identity and authorization prior to the providing of any information. This information will be verified against the Contract Owner’s records and all transactions performed will be verified with the Contract Owner through a written confirmation statement. We reserve the right to refuse a telephone request if the caller is unable to provide the requested information or if we reasonably believe that the caller is not an individual authorized to act on the Contract. We will record all calls. The Company, the Fund, and Vanguard shall not be liable for any loss, cost, or expense for action on telephone or online instructions believed to be genuine in accordance with these procedures. We will make every effort to maintain the privilege. However, the Company and the Fund reserve the right to revise or terminate its provisions, limit the amount of a transaction, or reject any transaction, as deemed necessary, at any time.
Expenses
A CLOSER LOOK AT
The Costs of Investing in a Variable Annuity
Costs are an important consideration in choosing a variable annuity. That’s because you, as a contract owner, pay the costs of operating the underlying mutual funds, plus any transaction costs incurred when the fund buys and sells securities, as well as the costs associated with the annuity contract itself. These combined costs can have a significant effect on the investment performance of the annuity contract. Even seemingly small differences in mutual fund and annuity contract expenses can, over time, have a dramatic effect on performance.
SUMMARY OF COSTS OF INVESTING
in the Vanguard Variable Annuity
No sales load or sales charge No charge to make full or partial withdrawals No fee to exchange money among the Subaccounts $25 Annual Contract Maintenance Fee on Contracts valued at less than $25,000 Annual Mortality and Expense Risk Charge: 0.20% Annual Administrative Expense Charge: 0.10% Current Return of Premium death benefit fee: 0.20% Current GLWB Rider Fee: 1.20% (Single or Joint Life Option). Fees and expenses paid by the Portfolios which ranged from 0.11% to 0.40% in
the fiscal year ended December 31, 2017
Mortality and Expense Risk Charge
The Company charges a fee as compensation for bearing certain mortality and expense risks under the Contract. The Company will deduct a daily charge corresponding to an annual charge of 0.20% for the mortality and expense risks assumed by the Company (a lower rate may be assessed for certain periods, please see Fee Table).
The mortality and expense risk charge described above cannot be increased. If the charge is more than sufficient to cover actual costs or assumed risks, any excess will be added to the Company’s surplus. If the charges collected under the Contract are not enough to cover actual costs or assumed risks, then the Company will bear the loss.
The mortality and expense risk charge may be assessed at a lower rate for certain periods at our discretion. Currently, the daily mortality and expense risk charge will be assessed at a rate reduced by an amount corresponding to an annual amount of 0.010%. Accordingly, an aggregate annual charge of 0.190% will be assessed.

20
A CLOSER LOOK AT
The Mortality and Expense Risk Charge
The Company assumes mortality risk in two ways. First, where Contract Owners elect an Annuity Payment Option under which the Company guarantees a number of payments over a life or joint lives, the Company assumes the risk of making monthly annuity payments regardless of how long all Annuitants may live. Second, the Company assumes mortality risk in providing a Death Benefit in the event the Annuitant dies during the Accumulation Phase.
The expense risk the Company assumes is that the charges for administrative expenses, which are guaranteed not to increase beyond the rates shown for the life of the Contract, may not be great enough to cover the actual costs of issuing and administering the Contract.
Administrative Expense Charge
The Company assesses each Contract an annual Administrative Expense Charge to cover the cost of issuing and administering each Contract and of maintaining the Separate Account. The Administrative Expense Charge is assessed daily at a rate equal to 0.10% annually of the net asset value of the Separate Account.
Annual Contract Maintenance Fee
In certain situations, the Company charges an Annual Contract Maintenance Fee of $25. The fee is to reimburse the Company for the costs it expects over the life of the Contract for maintaining each Contract and the Separate Account.
The Company charges the fee if: Your Initial Premium Payment is less than $25,000; and in any subsequent year the Accumulated Value is below $25,000.
For Contracts valued at less than $25,000 at the time of fee assessment, the $25 Annual Contract Maintenance Fee is prorated at issue and assessed in full at calendar year-end. The fee will be assessed on the last Friday of the calendar year, based on the Accumulated Value of the Contract on that day. If that day is not a business day, it will be assessed on the preceding business day. If that Friday is the last business day of the calendar year, the fee will be assessed on the preceding Friday.
GLWB Rider If you elect this rider, a rider fee will be deducted on the rider date, and on each rider quarter thereafter, before annuitization. Each rider quarter, one-fourth of the current annual charge of 1.20% (0.95% for the portion of the Total Withdrawal Base attributable to premium payments and transfers into designated investments prior to May 1, 2013) for the single or joint life option of the total withdrawal base is deducted. Rider fees are deducted from each of the designated investments in proportion to the amount of Accumulated Value in each designated investment.
Fund Operating Expenses
The value of the assets in the Separate Account will reflect the fees and expenses paid by Vanguard Variable Insurance Fund. A complete description of these expenses is found in the “Fee Table” section of this prospectus, the Fees and Expenses section of the Fund’s prospectus, and in the “Management of the Fund” section of the Fund’s Statement of Additional Information.
Tax Information
INTRODUCTION The following discussion of annuity taxation is general in nature and is based on the Company’s understanding of the treatment of annuity contracts under current federal income tax law, particularly the Internal Revenue Code and various Treasury Regulations and Internal Revenue Service interpretations. The discussion does not touch upon applicable state or other income tax laws, any state and local estate or inheritance tax, or other tax consequences of ownership or receipt distributions under a Contract. It is not tax advice. You may want to consult with a qualified tax advisor about your particular situation to ensure that your purchase of a Contract results in the tax treatment you desire.
TAXATION OF THE COMPANY The Company at present is taxed as a life insurance company under part I of Subchapter L of the Code. The Separate Account is treated as a part of the Company and, accordingly, will not be taxed separately as a “regulated investment company” under Subchapter M of the Code. The Company does not expect to incur any federal income tax liability with respect to investment income and net capital gains arising from the activities of the Separate Account retained as part of

21
the reserves under the contract. Based on this expectation, it is anticipated that no charges will be made against the Separate Account for federal income taxes. If in future years, any federal income taxes are incurred by the Company with respect to the Separate Account, the Company may make a charge to that account. The Company may benefit from any dividends received or foreign tax credits attributable to taxes paid by certain underlying fund portfolios to foreign jurisdictions to the extent permitted under federal tax law.
TAXATION OF ANNUITIES IN GENERAL
Tax Deferral
Special rules in the Internal Revenue Code for annuity taxation exist today. In general, those rules provide that you are not currently taxed on increases in value under a Contract until you take some form of withdrawal or distribution from it. However, it is important to note that, under certain circumstances, you might not get the advantage of tax deferral, meaning that the increase in value would be subject to current federal income tax. (See ANNUITY CONTRACTS OWNED BY NON-NATURAL PERSONS and DIVERSIFICATION STANDARDS.)
A CLOSER LOOK AT
Tax Deferral
Tax deferral means no current tax is due on earnings in your Contract. The amount you would have paid in income taxes can be left in the Contract and earn money for you.
One tradeoff of tax deferral is that there are certain restrictions on your ability to access your money, including penalty taxes for early withdrawals. This is one reason why a variable annuity is intended as a long-term investment.
Another tradeoff is that, when funds are withdrawn, they are taxed at ordinary income rates instead of capital gains rates, which apply to certain other sorts of investments.
We may occasionally enter into settlements with owners and beneficiaries to resolve issues relating to the contract. Such settlements will be reported on the applicable tax form (e.g., Form 1099) provided to the taxpayer and the taxing authorities.
Taxation of Full and Partial Withdrawals If you make a full or partial withdrawal (including a Systematic Withdrawal) from a Non-Qualified Contract during the Accumulation Phase, you as the Contract Owner will be taxed at ordinary income rates on earnings you withdraw at that time. For purposes of this rule, withdrawals are taken first from earnings on the Contract and then from the money you invested in the Contract. This “investment in the contract” can generally be described as the cost of the Contract, or cost basis, and it generally includes all Premium Payments minus any amounts you have already received under the Contract that represented the return of invested money. (Special rules apply if any Premium Payments are made by a Section 1035 Exchange.) Also for purposes of this rule, a pledge or assignment of a Contract is treated as a partial withdrawal from a Contract. (If you are contemplating using your Contract as collateral for a loan, you may be asked to pledge or assign it.) You may also be subject to current taxation if you make a gift of a Non-Qualified Contract without valuable consideration. In the case of a full surrender under a Non-Qualified Contract, the amount received generally will be taxable only to the extent it exceeds the Owner’s investment in the contract.
Taxation of Annuity Payments When you take Annuity Payments in the Income Phase of a Non-Qualified Contract, for tax purposes each payment is deemed to return to you a portion of your investment in the Contract. Since with a Non-Qualified Contract you have already paid taxes on those amounts (the Contract was funded with after-tax dollars), you will not be taxed again on your investment—only on your earnings.
For fixed Annuity Payments from a Non-Qualified Contract, in general, the Company calculates the taxable portion of each payment using a formula known as the “exclusion ratio.” This formula establishes the ratio that the investment in the Contract bears to the total expected amount of Annuity Payments for the term of the Contract. The Company then applies that ratio to each payment to determine the non-taxable portion of the payment. The remaining portion of each payment is taxable at ordinary income tax rates.
For variable Annuity Payments from a Non-Qualified Contract, in general, the Company calculates the taxable portion of each payment using a formula that establishes a specific dollar amount of each payment that is not taxed. To find the dollar amount, the Company divides the investment in the Contract by the total number of expected periodic payments. The remaining portion of each payment is taxable at ordinary income tax rates.
Once your investment in the Contract has been returned, the balance of the Annuity Payments represent earnings only and therefore are fully taxable.

22
Taxation of Death Benefit Proceeds Amounts may be distributed from a Contract because of your death or the death of an Annuitant. Generally, such amounts are includible in the income of the recipient as follows: (i) if distributed in a lump sum, they are taxed in the same manner as a full surrender of the Contract, (ii) if distributed via partial withdrawals, these amounts are taxed in the same manner as partial surrenders, or (iii) if distributed under an Annuity Payment Option, they are taxed in the same way as Annuity Payments.
Taxation of Withdrawals and Distributions From Qualified Contracts Generally, the entire amount distributed from a Qualified Contract is taxable to the Contract Owner. In the case of Qualified Contracts with after-tax contributions, you may exclude the portion of each withdrawal or Annuity Payment constituting a return of after-tax contributions. Special rules must be used to determine the excludable portion. Once all of your after-tax contributions have been returned to you on a non-taxable basis, subsequent withdrawals or annuity payments are fully taxable as ordinary income. Since the Company has no knowledge of the amount of after-tax contributions you have made, you will need to make this computation in the preparation of your federal income tax return.
Tax Withholding Federal tax law requires that the Company withhold federal income taxes on all distributions unless the Contract Owner or payee, if applicable, elects not to have any amounts withheld and properly notifies the Company of that election. The amount of withholding varies according to the type of distribution. The withholding rates applicable to the taxable portion of periodic payments (other than eligible rollover distributions) are the same as the withholding rates generally applicable to payments of wages. A 10% minimum withholding rate applies to the taxable portion of non-periodic payments unless you elect to not have withholding. Regardless of whether you elect not to have federal income tax withheld, you are still liable for payment of federal income tax on the taxable portion of the payment. In certain situations, the Company will withhold taxes on distributions to non-resident aliens at a flat 30% rate unless a lower treaty rate or exemption from withholding applies under an applicable tax treaty and the Company has received the appropriate Form W-8 certifying the U.S. taxpayer identification number. Some states may require State Tax Withholding.
Penalty Taxes on Certain Early Withdrawals The Internal Revenue Code provides for a penalty tax in connection with certain withdrawals or distributions that are includible in income. The penalty amount is 10% of the amount includible in income that is received under an annuity. However, there are exceptions to the penalty tax. For instance, it does not apply to withdrawals: (1) made after the Contract Owner reaches age 59 ½; (2) made on or after the death of the Contract Owner or, where the Contract Owner is not an individual, on or after the death of the primary Annuitant (who is defined as the individual the events in whose life are of primary importance in affecting the timing and payment under the Contracts); (3) attributable to the disability of the Contract Owner which occurred after the purchase of the Contract (as defined in the Internal Revenue Code); (4) that are part of a series of substantially equal periodic payments made at least annually for the life (or life expectancy) of the Contract Owner, or joint lives (or joint life expectancies) of the Contract Owner and his or her beneficiary; (5) under an immediate annuity contract (as defined in the Internal Revenue Code); (6) that can be traced to an investment in the Contract prior to August 14, 1982; or (7) under a Contract that an employer purchases on termination of certain types of qualified plans and that the employer holds until the employee’s severance from employment. Regarding the disability exception, because the Company cannot verify that the owner is disabled, the Company will report such withdrawals to the Internal Revenue Service as early withdrawals with no known exception.
If the penalty tax does not apply to a withdrawal as a result of the application of item (4) above, and the series of payments is subsequently modified (for some reason other than death or disability), the tax for the year in which the modification occurs will be increased by an amount (as determined under Treasury Regulations) equal to the penalty tax that would have been imposed but for item (4) above, plus interest for the deferral period. The foregoing rule applies if the modification takes place (a) before the close of the period that is five years from the date of the first payment and after the taxpayer attains age 59½, or (b) before the taxpayer reaches age 59 ½. Certain exceptions to the modification rule may apply. Consult a tax advisor for more information regarding the application of these exceptions to your circumstances.
Distributions from Qualified Contracts are also subject to a 10% penalty tax. Many of the same exceptions to the early withdrawal or distribution apply to Qualified Contracts.
The penalty tax may not apply to distributions from Qualified Contracts issued under Section 408(b) of the Internal Revenue Code that you use to pay qualified higher education expenses, the acquisition costs (up to $10,000) involved in the purchase of a principal residence by a first-time homebuyer, or a distribution made on account of an Internal Revenue Service levy. Because the Company cannot verify that such an early withdrawal is for qualified higher education expenses or a first home purchase, the Company will report such withdrawals to the Internal Revenue Service as early withdrawals with no known exception.
Other exemptions may be applicable under certain circumstances and special rules may be applicable in connection with the exceptions enumerated above. For Qualified Contracts, other tax penalties may apply to certain distributions as well as to certain contributions and other transactions. You should consult with your personal tax advisor if you have any questions regarding the exceptions to the early withdrawal or distribution penalties.

23
ANNUITY CONTRACTS OWNED BY NON-NATURAL PERSONS Where a non-natural person (for example, a corporation) holds a Non-Qualified Contract, that Contract is generally not treated as an annuity contract for federal income tax purposes, and the income on that Contract (generally the increase in the net Accumulated Value less the payments) is considered taxable income each year. This rule does not apply where the non-natural person is only a nominal owner such as a trust or other entity acting as an agent for a natural person. The rule also does not apply where the estate of a decedent acquires a Contract, where an employer purchases a Contract on behalf of an employee upon termination of a qualified plan, or to an immediate annuity (as defined in the Internal Revenue Code). A Contract owned by a trust using the grantor’s social security number as its taxpayer identification number will be treated as owned by the grantor (natural person) for the purposes of our application of Section 72 of the Code. Consult a tax advisor for more information on how this may impact your contract.
The Money Market Portfolio is a retail money market fund which is defined as prime or tax-exempt money market fund that has policies and procedures reasonably designed to limit all beneficial owners of such money market funds to natural persons. This may impact a Contract Owners’ ability to invest in the Money Market Portfolio (See Regulatory Reform Affecting the Money Market Portfolio).
MULTIPLE-CONTRACTS RULE All nonqualified deferred annuity contracts that are issued by us to the same owner (contract holder) during any calendar year are treated as one annuity for purposes of determining the amount includable in the owner’s income when a taxable distribution (other than annuity payments) occurs. If you are considering purchasing multiple contracts from us during the same calendar year, you may wish to consult with your tax advisor regarding how aggregation will apply to your contracts.
OWNERSHIP TRANSFERS OF ANNUITY CONTRACTS Any transfer of a Non-Qualified Contract during the Accumulation Phase for less than full and adequate consideration will generally trigger income tax (and possibly the 10% federal penalty tax) on the gain in the Contract to the Contract Owner at the time of such transfer. The transferee’s investment in the Contract will be increased by any amount included in the Contract Owner’s income. This provision, however, does not apply to transfers between spouses or former spouses incident to a divorce that are governed by Internal Revenue Code Section 1041(a).
TRANSFERS, ASSIGNMENTS OR EXCHANGES OF ANNUITY CONTRACTS A transfer of ownership in a Contract, a collateral assignment, the exchange of a Contract, or the designation of an Annuitant or other beneficiary who is not also the Contract Owner may result in tax consequences to the Contract Owner, Annuitant, or beneficiary that this prospectus does not discuss. A Contract Owner considering such transaction or designation should contact a tax advisor about the potential tax effects of such a transaction.
DIFFERENT INDIVIDUAL OWNER AND ANNUITANT If the owner and annuitant on the Contract are different individuals, there may be negative tax consequences to the Contract Owner and/or beneficiaries under the contract if the Annuitant predeceases the owner including, but not limited, to the assessment of penalty tax and the loss of certain death benefit distribution options. You may wish to consult your legal counsel or tax advisor if you are considering designating a different individual as the Annuitant on your contract to determine the potential tax ramifications of such a designation. ANNUITY STARTING DATE This section makes reference to the annuity starting date as defined in Section 72 of the Code and the applicable regulations. Generally, the definition of annuity starting date will correspond with the definition of annuity commencement date used in your Contract and the dates will be the same. However, in certain circumstances, your annuity starting date and annuity commencement date will not be the same date. If there is a conflict between the definitions, we will interpret and apply the definitions in order to ensure your contract maintains its status as an annuity contract for federal income tax purposes. You may wish to consult a tax advisor for more information on when this issue may arise.
It is possible that at certain advanced ages a policy might no longer be treated as an annuity contract if the policy has not been annuitized before that age or have other tax consequences. You should consult with a tax advisor about the tax consequences in such circumstances.
MEDICARE TAX Distributions from nonqualified annuity contracts will be considered “investment income” for purposes of the Medicare tax on investment income. Thus, in certain circumstances, a 3.8% tax may be applied to some or all of the taxable portion of distributions (e.g. earnings) to individuals whose income exceeds certain threshold amounts. The Company is required to report distributions made from Non-Qualified Contracts as being potentially subject to this tax. While distributions from Qualified Contracts are not subject to the tax, such distributions may be includable in income for purposes of determining whether certain Medicare Tax thresholds have been met. As such, distributions from your Qualified Contract could cause your other investment income to be subject to the tax. Please consult a tax advisor for more information.
24
TAX-FREE EXCHANGES We may issue the Non-Qualified Contract in exchange for all or part of another annuity contract that you own. Such an exchange will be tax free if certain requirements are satisfied. If the exchange is tax free, your investment in the contract immediately after the exchange will generally be the same as that of the annuity contract exchanged, increased by any additional premium payment made as part of the exchange. Your contract value immediately after the exchange may exceed your investment in the contract. That excess may be includable in income should amounts subsequently be withdrawn or distributed from the contract (e.g., as partial withdrawal, surrender, annuity payment, or death benefit).
If you exchange part of an existing contract for the Non-Qualified Contract, and within 180 days of the exchange you receive a payment other than certain annuity payments (e.g., you make a partial withdrawal) from either contract, the exchange may not be treated as a tax free exchange. Rather, some or all of the amount exchanged into the Non-Qualified Contract could be includible in your income and subject to a 10% penalty tax.
You should consult your tax advisor in connection with an exchange of all or part of an annuity contract for the Non-Qualified Contract, especially if you may make a withdrawal from either contract within 180 days after the exchange.
DIVERSIFICATION STANDARDS To comply with certain regulations under Internal Revenue Code Section 817(h), after a start-up period, each Subaccount of the Separate Account is required to diversify its investments in accordance with certain diversification standards. If the diversification requirements are not satisfied, a Non-Qualified Contract will not be treated as an annuity contract for federal income tax purposes. We intend to comply with the diversification regulations.
OWNER CONTROL In certain circumstances, owners of variable annuity contracts have been considered for federal income tax purposes to be the owners of the assets of the separate account supporting their contracts due to their ability to exercise investment control over those assets. When this is the case, the contract owners have been currently taxed on income and gains attributable to the variable account assets. There is limited guidance in this area, and some features of the Contracts, such as the flexibility of an owner to allocate premium payments and transfer amounts among the investment divisions of the separate account, have not been clearly addressed in published rulings. While we believe that the Contracts do not give Owners investment control over separate account assets, we reserve the right to modify the Contracts as necessary to prevent an Owner from being treated as the Owner of the separate account assets supporting the Contract.
REQUIRED DISTRIBUTIONS In order to be treated as an annuity contract for federal income tax purposes, Section 72(s) of the Internal Revenue Code requires any Non-Qualified Contract to contain certain provisions specifying how an owner’s interest in the Contract will be distributed in the event of the death of an owner of the Contract. Specifically, section 72(s) requires that (a) if any owner dies on or after the annuity starting date, but prior to the time the entire interest in the contract has been distributed, the entire interest in the contract will be distributed at least as rapidly as under the method of distribution being used as of the date of such owner’s death; and (b) if any owner dies prior to the annuity starting date, the entire interest in the contract will be distributed within five years after the date of such owner’s death. These requirements will be considered satisfied as to any portion of an owner’s interest which is payable to or for the benefit of a designated beneficiary and which is distributed over the life of such designated beneficiary or over a period not extending beyond the life expectancy of that beneficiary, provided that such distributions begin within one year of the owner’s death. The designated beneficiary refers to a natural person designated by the owner as a beneficiary and to whom ownership of the contract passes by reason of death. However, if the designated beneficiary is the surviving spouse of the deceased owner, the contract may be continued with the surviving spouse as the new owner. Where the owner is not a natural person (for example, is a corporation), the death of the “primary annuitant” is treated as the death of the owner for purposes of federal tax law. (The Internal Revenue Code defines a “primary annuitant” as the individual who is of primary importance in affecting the timing or the amount of payout under the contract.) In addition, where the owner is not a natural person, a change in the identity of the “primary annuitant” is also treated as the death of the owner for purposes of federal tax law.
The Non-Qualified Contracts contain provisions that are intended to comply with these Internal Revenue Code requirements, although no regulations interpreting these requirements have yet been issued. We intend to review such provisions and modify them if necessary to assure that they comply with the applicable requirements when such requirements are clarified by regulation or otherwise.
Other after-death distribution rules apply to Qualified Contracts under Section 401(a)(9) of the Internal Revenue Code.
SAME SEX RELATIONSHIPS Same sex couples have the right to marry in all states. The parties to each marriage that is valid under the law of any state will each be treated as a spouse as defined in this contact. Until further guidance from the IRS, individuals in other arrangements, such as civil unions, registered domestic partnerships, or other similar arrangements, that are not recognized as marriage under the relevant state law, will not be treated as married or as spouses as defined in this contract. Therefore, exercise of the spousal continuation provisions of this contract or any riders by individuals who do not

25
meet the definition of “spouse” may have adverse tax consequences and/or may not be permissible. Please consult a tax advisor for more information on this subject.
FEDERAL ESTATE, GIFT AND GENERATION-SKIPPING TRANSFER TAXES The estate and gift tax unified credit basic exclusion amount is $10,000,000, subject to inflation adjustments (using the C-CPI-U), for taxable years beginning after December 31, 2017, and before January 1, 2026. The maximum rate is 40%.
There is no guarantee that the transfer tax exemptions and maximum rates will remain the same in the future. The uncertainty as to how the current law might be modified in coming years underscores the importance of seeking guidance from a qualified advisor to help ensure that your estate plan adequately addresses your needs and that of your beneficiaries under all possible scenarios.
FEDERAL ESTATE TAXES While no attempt is being made to discuss the federal estate tax implications of the contract, a purchaser should keep in mind that the value of an annuity contract owned by a decedent and payable to a beneficiary by virtue of surviving the decedent is included in the decedent’s gross estate. Depending on the terms of the annuity contract, the value of the annuity included in the gross estate may be the value of the lump sum payment payable to the designated beneficiary or the actuarial value of the payments to be received by the beneficiary. Consult an estate planning advisor for more information.
GENERATION-SKIPPING TRANSFER TAX Under certain circumstances, the Internal Revenue Code may impose a “generation skipping transfer tax” when all or part of an annuity contract is transferred to, or a death benefit is paid to, an individual two or more generations younger than the Owner. Regulations issued under the Internal Revenue Code may require us to deduct the tax from your Contract, or from any applicable payment, and pay it directly to the Internal Revenue Service. FOREIGN TAX CREDITS We may benefit from any foreign tax credits attributable to taxes paid by certain funds to foreign jurisdictions to the extent permitted under federal tax law.
FOREIGN ACCOUNT TAX COMPLIANCE ACT (“FATCA”) If the payee of a distribution from the Contract is a foreign financial institution (“FFI”) or a non-financial foreign entity (“NFFE”) within the meaning of the Code as amended by the Foreign Account Tax Compliance Act (“FATCA”), the distribution could be subject to U.S. federal withholding tax on the taxable amount of the distribution at a 30% rate irrespective of the status of any beneficial owner of the Contract or the distribution. The rules relating to FATCA are complex, and a tax advisor should be consulted if an FFI or NFFE is or may be designated as a payee with respect to the Contract.
QUALIFIED INDIVIDUAL RETIREMENT ANNUITIES Generally, you may purchase Qualified Contracts only in connection with a “rollover” of funds from another individual retirement annuity (IRA) or qualified plan. Qualified Contracts must contain special provisions and are subject to limitations on contributions and the timing of when distributions can and must be made pursuant to Section 401(a)(9) of the Internal Revenue Code. For the Qualified Contracts the Code requires that distributions generally must commence no later than April 1 of the calendar year following the calendar year in which the owner reaches age 70½. The actuarial present value of death and/or living benefit options and riders elected need to be taken into account in calculating minimum required distributions. Consult a competent tax advisor before purchasing an optional living or death benefit.
Tax penalties may apply to contributions greater than specified limits, loans, reassignments, distributions that do not meet specified requirements, or in other circumstances. No additional Premium Payments to your Qualified Contract will be accepted unless the additional premium is funded by another qualified plan. The tax rules applicable to Qualified Contracts vary according to the type of retirement plan and the terms and conditions of the plan.
The Internal Revenue Service has not reviewed the Contract for qualification as an IRA and has not addressed in a ruling of general applicability whether any death benefit provision in the Contract comports with IRA qualification requirements.
Your rights under a Qualified Contract may be subject to the terms of the retirement plan itself, regardless of the terms of the Qualified Contract. Adverse tax consequences may result if you do not ensure that contributions, distributions and other transactions with respect to the Contract comply with law. Anyone desiring to purchase a Qualified Contract should consult a personal tax advisor.
For Contracts with a guaranteed lifetime withdrawal benefit the application of certain tax rules, particularly those rules relating to distributions from your Contract are not entirely clear. The tax rules for qualified contracts may impact the value of the guaranteed lifetime withdrawal benefits. Additionally, certain actions may cause the owner to lose the benefit

26
of the guaranteed lifetime withdrawal benefit. In view of this uncertainty, you should consult a tax advisor before purchasing this contract as a qualified contract.
POSSIBLE TAX LAW CHANGES Although the likelihood of legislative or regulatory changes is uncertain, there is always the possibility that the tax treatment of the Contract could change by legislation, regulation or otherwise. You should consult a tax advisor with respect to legal or regulatory developments and their effect on the Contract.
We have the right to modify the Contract to meet the requirements of any applicable laws or regulations, including legislative or regulatory changes that could otherwise diminish the favorable tax treatment that annuity contract owners currently receive.
Access To Your Money
The value of your Contract can be accessed during the Accumulation Phase: By making a full or partial withdrawal. By electing an Annuity Payment Option. By your Beneficiary in the form of a Death Benefit.
Full and Partial Withdrawals You may withdraw all or part of your money at any time during the Accumulation Phase of your Contract without a Company charge, provided the Annuitant or Joint Annuitant is still living. All partial withdrawals must be for at least $250.
On the date the Company receives your request for a full withdrawal, the amount payable is the Accumulated Value. On the date the Company receives your request for a partial withdrawal, the Accumulated Value will be reduced by the
amount of the partial withdrawal.

27
Because you assume the investment risk under the Contract, the total amount paid upon a full withdrawal of the Contract may be more or less than the total Premium Payments made (taking prior withdrawals into account).
You can make a withdrawal request in writing or by telephone. To make a telephone withdrawal, you may establish the telephone privilege by completing the appropriate section of the Application. See Telephone and Online Privilege. You may send a written request authorized by all required Contract Owners to Vanguard Annuity & Insurance Services. Withdrawals are not currently permitted to be requested online.
Systematic Withdrawals You may elect to have a specified dollar amount or a percentage of the balance withdrawn from your Contract’s Accumulated Value on a monthly, quarterly, semi-annual, or annual basis. The Company requires a Subaccount balance of at least $1,000 in order to establish the systematic withdrawal program for your Contract. (See the Minimum Balance Requirements section below for additional information.) Withdrawals may be requested via check or electronic funds transfer. All check withdrawals must be for at least $250; a Systematic Withdrawal may be established via electronic fund transfer for at least $50. In the absence of specific directions from the Contract Owner, all deductions will be made from all funded Subaccounts on a pro rata basis.
You may elect this option by completing a Variable Annuity Automatic Transfer Form. The Company must receive your Form at least 30 days before the date you want systematic withdrawals to begin. The
Company will process each Systematic Withdrawal on the date and at the frequency you specified on the Variable Annuity Automatic Transfer Form.
You may change the amount to be withdrawn and the percentage, the frequency of distributions, or cancel this option by telephone. Any other changes you make, including a change in the destination of the check must be made in writing, and should include signatures of all Contract Owners.
Minimum Balance Requirements The required minimum balance in any Subaccount is $1,000. If an exchange or withdrawal (but not solely negative investment performance) would reduce the balance in a Subaccount to less than $1,000, the Company will transfer the remaining balance to the other Subaccounts under the Contract on a pro rata basis. If the entire value of the Contract falls below $1,000, the Company may notify you that the Accumulated Value of your Contract is below the minimum balance requirement. In that case, you will be given 60 days to make an additional Premium Payment before your Contract is liquidated. The Company would then promptly pay proceeds to the Contract Owner. The proceeds would be taxed as a withdrawal from the Contract. Full withdrawal will result in an automatic termination of the Contract. Federal tax law may impose restrictions on our right to terminate certain qualified contracts.
Payment of Full or Partial Withdrawal Proceeds The Company will pay cash withdrawals within seven days after receipt of your telephone or written request except in one of the following situations, in which the Company may delay the payment beyond seven days: The New York Stock Exchange is closed on a day that is not a weekend or a holiday, or trading on the New York Stock
Exchange is otherwise restricted. An emergency exists as defined by the SEC, or the SEC requires that trading be restricted. The SEC permits a delay for your protection as a Contract Owner. The payment is derived from premiums paid by check, in which case the Company may delay payment until the check
has cleared your bank, which may take up to ten calendar days.
TAXATION OF
Withdrawals
For important information on the tax consequences of withdrawals, see Taxation of Full and Partial Withdrawals and Penalty Taxes on Certain Early Withdrawals.
Tax Withholding on Withdrawals If you do not provide the Company with a telephone or written request not to have federal income taxes withheld when you request a full, partial or systematic withdrawal, federal tax law requires the Company to withhold federal income taxes from the taxable portion of any withdrawal and send that amount to the federal government. In that case, we will withhold at a rate of 10%. State income tax withholding may also be required.
Performance
Standardized Performance From time to time, the Company may advertise the yield and total return investment performance of a Subaccount for various periods, including quarter-to-date, year-to-date, one-year, five-year, and since inception. The Company will

28
calculate advertised yields and total returns according to standardized methods prescribed by the SEC, so that all charges and expenses attributable to the Contract will be included. Including these fees has the effect of decreasing the advertised performance of a Subaccount, so that a Subaccount’s investment performance will not be directly comparable to that of an ordinary mutual fund.
Non-Standardized Performance The Company may also advertise total return or other performance data in non-standardized formats that do not reflect the Annual Contract Maintenance Fee.
Not Indications of Future Performance The performance measures discussed above are not intended to indicate or predict future performance.
Statement of Additional Information Please refer to the Statement of Additional Information for a description of the method used to calculate a Subaccount’s yield and total return and a list of the indices and other benchmarks used in evaluating a Subaccount’s performance.
Death Benefit
In General If the Annuitant dies during the Accumulation Phase, the Beneficiary will receive the Death Benefit. The Death Benefit is the then-current Accumulated Value of the Contract on the date the Company receives Due Proof of Death and all Company forms, fully completed. However, for an additional charge, there is an optional Death Benefit Rider that can be selected by the Owner at the time of purchase. Please note, we may be required to remit the death benefit proceeds to a state prior to receiving Due Proof of Death (See Abandoned or Unclaimed Property).
For contract owners who purchased the contract on or after October 19, 2011:
Return of Premium Death Benefit Rider—This option is only available to Annuitants age 75 or younger at the time of Contract purchase. There is an additional annual charge of 0.20% (to be assessed 0.05% per quarter). With this option, the Death Benefit will be the greater of: The Accumulated Value of the Contract as of the date the Company receives Due Proof of Death and all Company
forms, fully completed; or The sum of all Premium Payments; less any Adjusted Partial Withdrawals and Premium Taxes, if any (see Adjusted
Partial Withdrawal).
For contract owners who purchased the contract between October 30, 2010 and October 18, 2011: Return of Premium Death Benefit Rider—This option is only available to Annuitants age 75 or younger at the time of Contract purchase. There is an additional annual charge of 0.05% (to be assessed 0.0125% per quarter). The additional annual charge will only be assessed for a period of 10 years from the Contract Date. With this option, the Death Benefit will be the greater of: The Accumulated Value of the Contract as of the date the Company receives Due Proof of Death and all Company
forms, fully completed; or The sum of all Premium Payments; less any Adjusted Partial Withdrawals and Premium Taxes, if any.
For contract owners who purchased the contract prior to October 30, 2010: 1) Return of Premium Death Benefit Rider—This option was only available to Annuitants age 75 or younger at the time of Contract purchase. There is an additional annual charge of 0.05% (to be assessed 0.0125% per quarter). The additional annual charge will only be assessed for a period of 10 years from the Contract Date. With this option, the Death Benefit will be the greater of: The Accumulated Value of the Contract as of the date the Company receives Due Proof of Death and all Company
forms, fully completed; or the sum of all Premium Payments; less any Adjusted Partial Withdrawals and Premium Taxes, if any.
2) Annual Step-Up Death Benefit Rider—This option was only available to Annuitants age 69 or younger at the time of Contract purchase. There is an additional annual charge of 0.12% (to be assessed 0.03% per quarter). The additional annual charge will only be assessed until the Annuitant’s 80th birthday. With this option, the Death Benefit will be the greatest of: The Accumulated Value of the Contract as of the date the Company receives Due Proof of Death and all Company
forms, fully completed. the sum of all Premium Payments, less any Adjusted Partial Withdrawals and Premium Taxes, if any; or

29
the highest Accumulated Value on any Contract Anniversary Date on or after the date the Rider is added to the Contract and until the Annuitant reaches age 80, plus any subsequent Premium Payment received by the Company after such Contract Anniversary Date less any Adjusted Partial Withdrawals and Premium Taxes, if any.
If you elect the Return of Premium Death Benefit Rider you may cancel this rider by contacting Vanguard Annuity and Insurance Services. Please note that if you cancel the rider, you will not be allowed to elect the additional death benefit rider in the future. Once the rider is cancelled, the Beneficiary will receive the Death Benefit upon the death of the annuitant. The Death Benefit is the then-current Accumulated Value of the Contract on the date the Company receives Due Proof of Death and all Company forms, fully completed.
Federal tax law generally requires that if a Contract Owner is a natural person and dies before the Income Date, then the entire value of the Contract must be distributed within five years of the date of death of the Contract Owner. If the Contract Owner is not a natural person, the death of the primary Annuitant triggers the same distribution requirement. Special rules may apply to a surviving spouse.
A WORD ABOUT
Adjusted Partial Withdrawal
When a Partial Withdrawal is taken from a Contract with the Death Benefit Rider, the Death Benefit will be reduced by an amount called the Adjusted Partial Withdrawal. It is equal to the Partial Withdrawal amount multiplied by an adjustment factor. The adjustment factor is equal to the amount of the Death Benefit prior to the Partial Withdrawal divided by the Accumulated Value prior to the Partial Withdrawal. Under certain circumstances, the Adjusted Partial Withdrawal amount deducted from the Death Benefit may be more than the dollar amount of the Partial Withdrawal. This will generally be the case if the Death Benefit amount exceeds the Accumulated Value at the time of the Partial Withdrawal.
The formula for the adjusted partial withdrawal is equal to (1) multiplied by (2) divided by (3), where: (1) is the amount of the partial withdrawal (2) is the value of the current guaranteed minimum death benefit immediately prior to the gross
partial surrender; (3) is the accumulated value immediately prior to the partial withdrawal.
Appendix B contains a more detailed description of the Adjusted Partial Withdrawal and provides examples of how it is calculated.
Death of the Annuitant During the Accumulation Phase
If the Annuitant dies during the Accumulation Phase, the Beneficiary will be entitled to the Death Benefit. The Death Benefit will be calculated on the date the Company receives Due Proof of Death and all Company forms, fully completed. For contracts with multiple beneficiaries, we will process the first beneficiary to provide us with due proof of their share of the death proceeds. We will not process any remaining beneficiary their share until we receive all Company forms in good order from that beneficiary. Each Beneficiary can choose to receive the amount payable in a lump-sum cash benefit or under one of the Annuity Payment Options. If the Beneficiary is the surviving spouse, he or she may receive the Death Benefit; elect any available Annuity Payment Option; or continue the Contract at the Accumulated Value as the new Contract Owner and Annuitant and name a new Beneficiary.
Death of the Annuitant During the Income Phase
The Death Benefit, if any, payable if the Annuitant dies during the Income Phase depends on the Annuity Payment Option selected. Upon the Annuitant’s death, the Company will pay the Death Benefit, if any, to the Beneficiary under the Annuity Payment Option in effect. For instance, if the Life Annuity With Period Certain option has been elected, and if the Annuitant dies during the Income Phase, then any unpaid payments certain will be paid to the Beneficiary.
DEFINITION
Due Proof of Death
When the term “Due Proof of Death” is used in this prospectus we mean any of the following: A certified death certificate
showing the manner of death A certified decree of a court of
competent jurisdiction as to the finding of death
A written notarized statement by a medical doctor who attended the deceased
Any other proof satisfactory to the Company

30
A WORD ABOUT
Joint Annuitants
The Contract permits you as Contract Owner to name a Joint Annuitant. This can have different effects depending on whether the Contract is in the Accumulation Phase or the Income Phase.
During the Accumulation Phase, the Death Benefit is payable only after the death of both the Annuitant and the Joint Annuitant, subject to any limitations imposed by federal tax law.
During the Income Phase, it will not matter that you have named a Joint Annuitant unless you have chosen an Annuity Payment Option, such as the Joint and Last Survivor Annuity option, that pays over the life of more than one person.
Designation of a Beneficiary The Contract Owner may select one or more Beneficiaries for the Annuitant and name them on the Application. Thereafter, while the Annuitant or Joint Annuitant is living, the Contract Owner may change the Beneficiary by written notice. The change will take effect as of the date the Contract Owner signs the notice, but it will not affect any payment made or any other action taken before the Company acknowledges the notice. The Contract Owner may also make the designation of Beneficiary irrevocable by sending written notice to the Company and obtaining approval from the Company. Changes in the Beneficiary may then be made only with the consent of the designated irrevocable Beneficiary. In the event the Contract Owner and the Annuitant are different, the Contract Owner may also name an Owner’s Designated Beneficiary. The Owner’s Designated Beneficiary may assume ownership of the Contract upon the Contract Owner’s death subject to any restrictions required under federal tax law. See Death of Contract Owner During the Accumulation Phase. The Owner’s Designated Beneficiary may be added or changed only in writing.
If the Annuitant dies during the Accumulation Period, the following will apply unless the Contract Owner has made other provisions: If there is more than one Beneficiary, each will share in the Death Benefit equally. If one or more Beneficiaries have already died, the Company will pay that share of the Death Benefit equally to the
survivor(s). If no Beneficiary is living, the Company will pay the proceeds to the Contract Owner. If no Beneficiary is named, the Company will pay the proceeds to the estate. If a Beneficiary dies at the same time as the Annuitant, the Company will pay the proceeds as though the Beneficiary
had died first. If a Beneficiary dies within 15 days after the Annuitant’s death and before the Company receives due proof of the Annuitant’s death, the Company will pay proceeds as though the Beneficiary had died first.
If a Beneficiary who is receiving Annuity Payments dies, the Company will pay any remaining Payments Certain to that
Beneficiary’s named Beneficiary(ies) when due. If no Beneficiary survives the Annuitant, the right to any amount payable will pass to the Contract Owner. If the Contract Owner is not living at this time, this right will pass to his or her estate.
Death of the Contract Owner Death of the Contract Owner During the Accumulation Phase. With two exceptions, federal tax law requires that when either the Contract Owner or the Joint Owner (if any) dies during the Accumulation Phase, the Company must pay out the entire value of the Contract within five years of the date of death. Since the death of a Contract Owner who is not the Annuitant does not trigger the payment of the Death Benefit, the value of the Contract in this instance will be the Accumulated Value only. First exception: If the entire value is to be distributed to the Owner’s Designated Beneficiary, he or she may elect to have it paid under an Annuity Payment Option over his or her life or over a period certain no longer than his or her life expectancy as long as the payments begin within one year of the Contract Owner’s death. In certain instances an Owner’s Designated Beneficiary may be permitted to elect a “stretch” withdrawal option as a means of disbursing death proceeds from a non-qualified annuity. The only method the Company uses for making distribution payments from a non-qualified “stretch” withdrawal option is the required minimum distribution method as set forth in Revenue Ruling 2002-62. The applicable payments are calculated using the Single Life Expectancy Table set forth in Treasury Regulation § 1.401(a)(9)-9, A-1. Second exception: If the Owner’s Designated Beneficiary is the spouse of the Contract Owner (or Joint Owner), the spouse may elect to continue the Contract in his or her name as Contract Owner indefinitely and to continue deferring tax on the accrued and future income under the Contract. (“Owner’s Designated Beneficiary” means the natural person whom the Contract Owner names as a beneficiary and who becomes the Contract Owner upon the Contract Owner’s death.) If the Contract Owner and the Annuitant are the same person, then upon that person’s death the Beneficiary is entitled to the Death Benefit under the distribution options described in this paragraph.

31
Death of the Contract Owner During the Income Phase. Federal tax law requires that when either the Contract Owner or the Joint Owner (if any) dies during the Income Phase, the Company must pay the remaining portions of the value of the Contract at least as rapidly as under the method of distribution being used on the date of death.
Non-Natural Person as Contract Owner. Where the Contract Owner is not a natural person (for example, is a corporation), the death of the “primary Annuitant” is treated as the death of the Contract Owner for purposes of federal tax law. (The Internal Revenue Code defines a “primary Annuitant” as the individual who is of primary importance in affecting the timing or the amount of payout under the Contract.) In addition, where the Contract Owner is not a natural person, a change in the identity of the “primary Annuitant” is also treated as the death of the Contract Owner for purposes of federal tax law.
Payment of Lump-Sum Death Benefits The Company will pay lump-sum Death Benefits within seven days after the election to take a lump sum becomes effective except in one of the following situations, in which the Company may delay the payment beyond seven days: The New York Stock Exchange is closed on a day that is not a weekend or a holiday, or trading on the New York Stock
Exchange is otherwise restricted. An emergency exists as defined by the SEC, or the SEC requires that trading be restricted. The SEC permits a delay for your protection as a Contract Owner. The payment is derived from premiums paid by check, in which case the Company may delay payment until the check
has cleared your bank, which may take up to ten calendar days. In certain instances a designated beneficiary may be permitted to elect a “stretch” payment option as a means of
disbursing death proceeds from a nonqualified annuity. The only method we use for making distribution payments from a nonqualified “stretch” payment option is the required minimum distribution method a set forth in Revenue Ruling 2002-62. The applicable payments are calculated using the Single Life Expectancy Table set forth in Treasury Regulation §1.401(a)(9)-9, A-1.
Please note, the death benefit terminates upon annuitization and there is a maximum annuity commencement date.
Additional Features
GLWB Rider You may elect the following optional rider under the Contract that offers a guaranteed lifetime withdrawal benefit. This rider is available during the accumulation phase, and the benefit under the rider only applies to Accumulated Value invested in certain designated investments. The tax rules for qualified contracts may limit the value of this rider. You should consult with a qualified tax professional before electing the GLWB Rider for a qualified Contract. Please Note: This Rider may not be issued or added to Inherited IRA (sometime also referred to as beneficiary IRAs) or a non-qualified annuity under which death benefits are being distributed under a “stretch” withdrawal option. You can elect to add this rider after your Contract has been issued (the spouse may elect the rider upon spousal continuation of the Contract). Your rider will take effect on the Contract’s next “quarterversary”. The guaranteed lifetime withdrawal benefit is based on our claims-paying ability.
GLWB Rider–Base Benefit Under this rider, you can receive up to the maximum annual withdrawal amount each rider year (first as withdrawals from your Accumulated Value and later, if necessary, as payments from the Company), starting with the rider year immediately following the annuitant’s 59th birthday and lasting until the annuitant’s death (unless your total withdrawal base is reduced to zero because of “excess withdrawals”; see Total Withdrawal Base Adjustments). A rider year begins on the rider date (the date the rider becomes effective) and on each anniversary thereafter. All withdrawals before the annuitant is age 59 are excess withdrawals. If the joint life option is elected, then for all purposes under the rider, age is determined by the age of the younger of the annuitant and the annuitant’s spouse. A penalty tax may be assessed on amounts withdrawn from the contract before the owner reaches age 59½.
Please note: You will begin paying the rider fee as of the date the rider takes effect (“rider date”), even if you do not begin taking
withdrawals for many years, or ever. (The rider fee may change over time. Any change in the rider fee will apply to new premium payments and transfers to the designated investments.) The Company will not refund the charges you have paid under the rider if you never choose to take withdrawals and/or if you never receive any payments under the rider.
This rider has been designed for you to take withdrawals from the designated investments each rider year that are less than or equal to the maximum annual withdrawal amount. You should not purchase this rider if you plan to take withdrawals from the designated investments in excess of the maximum annual withdrawal amount, because such excess withdrawals may significantly reduce or eliminate the benefit provided by the rider.

32
The longer you wait to start making withdrawals under the rider, the less time you have to benefit from the guarantee because of decreasing life expectancy as you age. On the other hand, the longer you wait to begin making withdrawals, the higher your withdrawal percentage may be (within limits) and the more opportunities you will have to lock in a higher total withdrawal base. You should carefully consider when to begin making withdrawals. There is a risk that you will not begin making withdrawals at the most financially beneficial time for you.
Because the guaranteed lifetime withdrawal benefit under this rider is accessed through regular withdrawals that do not exceed the maximum annual withdrawal amount, the rider may not be appropriate for you if you do not foresee a need for liquidity and your primary objective is to take maximum advantage of the tax deferral aspect of the contract.
Only Accumulated Value allocated to a limited number of specified funds (see Designated Investments) will be covered by this rider. You should determine whether these limitations are suited for your financial needs and risk tolerance.
Cumulative withdrawals from the designated investments in any rider year that are in excess of the maximum annual withdrawal amount are excess withdrawals. Any withdrawals before age 59 are excess withdrawals.
An excess withdrawal may reduce the maximum annual withdrawal amount and the total withdrawal base on greater than a dollar-for-dollar basis.
Transfers (exchanges) from designated investments to non-designated investments are considered withdrawals under the rider.
Upon the death of the annuitant, this rider terminates and there are no more additional guaranteed withdrawals. If the rider joint life option is elected, however, then this rider terminates and there are no further guaranteed withdrawals upon the death of the surviving spouse. Under the joint life option, the benefit applies only to the person who is the annuitant’s spouse on the rider date; this benefit does not apply to a person who becomes the annuitant’s spouse after the rider date. Under both the single life and joint life options available under this rider, the rider will terminate on the death of the owner if the owner is not an annuitant.
Like all withdrawals, withdrawals under this benefit also: reduce your Accumulated Value; reduce your death benefit and other benefits; and may be subject to income taxes and federal tax penalties. Maximum Annual Withdrawal Amount. You can withdraw from the designated investments up to the maximum annual withdrawal amount (after age 59) in any rider year without causing an excess withdrawal. (See Total Withdrawal Base Adjustments.)
The maximum annual withdrawal amount is zero if the annuitant (or youngest annuitant for a joint life rider) is not 59 years old on the rider date and remains zero until the first day of the rider year after the youngest annuitant’s 59th birthday. If the youngest annuitant is at least 59 years old on the rider date, then the maximum annual withdrawal amount is equal to the total withdrawal base multiplied by the withdrawal percentage.
For qualified contracts: The maximum annual withdrawal amount is equal to the greater of: (1)the maximum annual withdrawal amount described above; or (2)after the first rider anniversary, an amount equal to a required minimum distribution amount attributable to the
Accumulated Value in the designated investments using the annuitant’s age. The required minimum distribution may be used only if all of the following are true: the Contract to which the rider is attached is a tax-qualified contract for which IRS required minimum distributions
are required, the required minimum distributions do not start before the annuitant’s attained age 70 1/2, the required minimum distributions are based on either the Uniform Lifetime table or the Joint Life and Last
Survivor Expectancy table, the required minimum distributions are based on the age of the living annuitant (or the annuitant’s spouse, if the
joint life option is elected and the annuitant is deceased). The required minimum distributions cannot be based on the age of someone who is deceased,
the required minimum distributions are based only on the contract to which this rider is attached, and the required minimum distributions are only for the current calendar year. Amounts carried over from past
calendar years are not considered.
If any of the above are not true, then (2) above is equal to zero and the required minimum distribution is not available as a maximum annual withdrawal amount. An amount in addition to the amount described in (2) above may need to be taken to satisfy required minimum distributions if your required minimum distribution is calculated differently. Please consult with your tax advisor before electing this rider for a qualified contract. Such additional withdrawal amount will be considered an excess withdrawal (as described under “Total Withdrawal Base Adjustments”, below).

33
Once your Accumulated Value in the designated investments reaches zero, you will be eligible to receive benefit payments. Furthermore, any subsequent premium payments or transfers to the designated investments will not be considered for purposes of GLWB rider benefits. To receive withdrawals guaranteed by this rider after the Accumulated Value of your designated investments reaches zero (i.e., benefit payments), you must select the frequency of benefit payments. Once selected, the amount and frequency of benefit payments after your Accumulated Value reaches zero cannot be changed. Benefit payments after the Accumulated Value reaches zero are subject to the Company’s claims paying ability.
Please note:
If the rider is added before the youngest annuitant’s 59th birthday, then you will be charged a rider fee even though the maximum annual withdrawal amount is zero until the beginning of the rider year after the youngest annuitant’s 59th birthday.
You cannot carry over any portion of your maximum annual withdrawal amount that is not withdrawn during a rider year for withdrawal in a future rider year. This means that if you do not take the full maximum annual withdrawal amount during a rider year, you cannot take more than the maximum annual withdrawal amount in the next rider year and maintain the rider’s guarantees.
Excess withdrawals may cause you to lose the benefit of the rider.
Withdrawal Percentage for contract owners who purchased the GLWB Rider on or after May 1, 2013. A withdrawal percentage is used to calculate the maximum annual withdrawal amount. The withdrawal percentage is determined by the age of the annuitant (or the annuitant’s spouse if younger and the joint life option is elected) at the time of the first withdrawal taken on or after the rider anniversary immediately following the 59th birthday of the annuitant (or the annuitant’s spouse if younger and the joint life option is elected). The following withdrawal percentages currently apply under the single life and the joint life options of the rider:
Attained Age
at Time of First Withdrawal Withdrawal Percentage
Single Life Joint Life
0-58 0.0% 0.0%
59-64 4.0% 3.5%
65-69 5.0% 4.5%
70-79 5.0% 4.5%
80+ 6.0% 5.5%
Withdrawal Percentage for contract owners who purchased the GLWB Rider prior to May 1, 2013. A withdrawal percentage is used to calculate the maximum annual withdrawal amount. The withdrawal percentage is determined by the age of the annuitant (or the annuitant’s spouse if younger and the joint life option is elected) at the time of the first withdrawal taken on or after the rider anniversary immediately following the 59th birthday of the annuitant (or the annuitant’s spouse if younger and the joint life option is elected). The following withdrawal percentages currently apply under the single life and the joint life options of the rider:
Attained Age
at Time of First Withdrawal Withdrawal Percentage
Single Life Joint Life
0-58 0.0% 0.0%
59-64 4.5% 4.0%
65-69 5.0% 4.5%
70-79 5.5% 5.0%
80+ 6.5% 6.0%
Please note:
Once established, the withdrawal percentage will not increase even though the annuitant’s age increases.
Total Withdrawal Base. A total withdrawal base is used to calculate the maximum annual withdrawal amount and rider fee. The total withdrawal base on the rider date is the Accumulated Value in the designated investments. During any rider year, the total withdrawal base is equal to the total withdrawal base on the rider date or most recent rider anniversary, plus

34
subsequent premium payments allocated to (and transfers from non-designated investments into) designated investments (up to a maximum of $2.5 million in total premium payments and transfers into designated investments), less subsequent total withdrawal base adjustments. On each rider anniversary, the total withdrawal base will be set to the greater of: the current total withdrawal base; or the accumulated value in the designated investments on the rider anniversary.
Please note: The total withdrawal base is determined solely to calculate the maximum annual withdrawal amount. Your total
withdrawal base is not an Accumulated Value, a surrender value, or a death benefit. It is not available for withdrawal, it is not a minimum return for any subaccount, and it is not a guarantee of Accumulated Value.
Because the total withdrawal base is generally equal to the Accumulated Value in the designated investments on the rider date, the maximum annual withdrawal amount may be lower if you delay electing the rider and the Accumulated Value in the designated investments decreases before you elect the rider.
Total Withdrawal Base Adjustments. Cumulative gross partial withdrawals up to the maximum annual withdrawal amount from one or more designated investments in any rider year will not reduce the total withdrawal base. Cumulative gross partial withdrawals in excess of the maximum annual withdrawal amount (“excess withdrawals”) from one or more designated investments in any rider year, and transfers from a designated investment to a non-designated investment, will reduce the total withdrawal base, however, by the greater of the dollar amount of the excess withdrawal or a pro rata amount (that is in proportion to the reduction in the Accumulated Value in the designated investments), possibly to zero. Total withdrawal base adjustments occur immediately following excess withdrawals. See Appendix C—Vanguard GLWB Rider—Adjusted Partial Withdrawals for examples showing the effect of hypothetical withdrawals in more detail, including an excess withdrawal that reduces the total withdrawal base by a pro rata amount (i.e., by more than the amount withdrawn). Excess withdrawals may eliminate the benefit provided by this rider. The effect of an excess withdrawal is amplified if the Accumulated Value in the designated investments is less than the total withdrawal base.
Example. Assume you are the owner and annuitant and you make a single premium payment of $100,000 into the designated investments when you are 56 years old. Further assume that you do not make any additional withdrawals or premium payments, no step-ups occurred, but that after ten years your Accumulated Value in the designated investments has declined to $90,000 solely because of negative investment performance. You could withdraw from the designated investments up to $5,000, which is the applicable current withdrawal percentage of 5% multiplied by the total withdrawal base of $100,000, each rider year for the rest of your life (assuming that you take your first withdrawal when you are age 66, that you do not withdraw more than the maximum annual withdrawal amount from the designated investments in any one year and your total withdrawal base doesn’t increase in the future).
Of course, you can always withdraw, at your discretion, an amount up to your Accumulated Value pursuant to your
rights under the contract.
Example continued. Assume the same facts as above, but you withdraw $7,000 when you are 66 years old. That excess withdrawal will reduce your total withdrawal base and, consequently, reduce your future maximum annual withdrawal amount from $5,000 to $4,882.35.
See Appendix C—GLWB Rider—Adjusted Partial Withdrawals for examples showing the effect of hypothetical
withdrawals in more detail.
Designated Investments. The rider benefit applies ONLY to Accumulated Value in the following designated investments: the Conservative Allocation Portfolio the Moderate Allocation Portfolio the Balanced Portfolio
Please note: You may transfer (exchange) amounts among the designated and non-designated investments (subject to the terms
and conditions of the Contract and this rider). Transfers from designated to non-designated investments are considered withdrawals for purposes of this rider. We reserve the right to restrict new premium payments and transfers into the designated investments.
A designated investment may be un-designated at any time. If a designated investment is un-designated, then a Contract owner will be given the option to reallocate the value in the un-designated investment to a designated investment. Any amount not so reallocated will be treated as a withdrawal under this rider.

35
The rider benefit only applies to the Accumulated Value in the designated investments. The designated investments are designed to help manage the Company’s risk and support the guarantees under the rider (through, in part, a decrease in equity exposure and volatility) which may lessen the likelihood that the Company might have to make payments.
GLWB Rider–Joint Life Option
If you elect this rider, you can also elect to continue the benefits of the rider until the later of the death of the annuitant or the annuitant’s spouse. This allows the maximum annual withdrawal amount to be withdrawn until the later of the death of the annuitant or, if the annuitant’s spouse continues the contract, the annuitant’s spouse.
Please note that under this option: The annuitant’s spouse (i.e., a married man or woman as of the rider date) must be the joint annuitant. In the case of spousal joint owners, upon the death of the first annuitant, the surviving spouse may elect to continue the
contract and rider. The rider continues until the death of the surviving spouse. If, at the time of the annuitant’s death, the spouse cannot continue to keep the contract in effect under the tax code
(e.g. because of a change in marital status), then the rider will terminate and no additional withdrawals under the rider are permitted.
The annuitant’s spouse for purposes of this rider cannot be changed. The rider withdrawal percentage is based on the age of the younger of the annuitant and annuitant’s spouse.
GLWB Rider Fee
If you elect this rider, a rider fee will be deducted on the rider date, and on each rider quarter thereafter, before annuitization. The currently deducted rider fee corresponds to an annual rate of the current rider fee of 1.20% (0.95% for the portion of the Total Withdrawal Base attributable to premium payments and transfers into designated investments prior to May 1, 2013) for the single or joint life option of the total withdrawal base for contract owners who purchase the rider on or after May 1, 2013. Rider fees are deducted from each designated investment in proportion to the amount of Accumulated Value in each designated investment and do not impact your maximum annual withdrawal amount.
The rider fee percentage applicable to your rider will not change unless an additional premium payment is allocated to (or a transfer is made into) the designated investments and the rider fee percentage has changed since your rider was issued. Only the proportional increase in the total withdrawal base attributable to such additional premiums (or transfers) will be subject to the new rider fee percentage. Thereafter, the rider fee percentage will be adjusted to reflect the weighted average of the rider fee percentage and the rider fee percentage associated with any additional premium payments allocated to (and/or transfers into) the designated investments.
The adjusted (or “blended”) rider fee percentage will equal the sum of A and B, with the result divided by C, where: A = the current total withdrawal base before the premium addition multiplied by your rider’s rider fee percentage; B = the amount of additional premium paid multiplied by the rider fee percentage for new premium additions; and C = the total withdrawal base after adding the additional premium.
Example. Assume that you elect the joint life option under the rider and you make an initial premium payment of $100,000 on July 1. The rider fee on the initial premium is 1.20% of the total withdrawal base. Further assume that on October 1 of that same year, (i) the total withdrawal base (after step-ups) equals $150,000, (ii) you make an additional premium payment of $60,000, and (iii) the rider fee percentage on the additional premium is 1.30%. A new blended rider fee is calculated when the additional premium is paid. Your blended rider fee is 1.23% = [(150,000 x 1.20%) + (60,000 x 1.30%)] divided by (150,000 + 60,000). See Appendix D—GLWB Rider—Blended Rider Fee.
Please Note:
Because the rider fee is a percentage of your total withdrawal base on each rider quarter, the rider fee can be substantially more than that (same) percentage of your Accumulated Value in the designated investments if your total withdrawal base is higher than your Accumulated Value in the designated investments.
GLWB Rider Issue Requirements
The Company will issue the GLWB Rider if: the annuitant is not yet age 91 (or younger if required by state law); the annuitant is also an owner (except in the case of non-natural owners); there are no more than two owners; and if the joint life option is elected, the annuitant’s spouse is the joint annuitant, and has not attained age 91 (or younger if
required by state law). prior company approval is required prior to issuance of the GLWB Rider, if, upon election, the accumulated value in
the GLWB designated portfolios is greater than $2.5M, or an exchange is requested that would increase the value in the Designated Portfolios to greater than $2.5M.

36
Termination
The GLWB Rider will terminate upon the earliest of the following: the beginning of the next rider quarter (i.e., each three-month period following the rider date) following the date
Vanguard Annuity and Insurance Services receives written notice from you requesting termination of the GLWB Rider; the death of the annuitant (or the death of the annuitant’s spouse, if the joint life option was elected and that spouse
continued the contract as the surviving spouse); the death of the owner if the owner is not an annuitant; assignment of your contract; a change in the owner of the contract without the Company’s approval; a change to an annuitant (other than death); or termination of your Contract.
Please note:
You must begin to receive guaranteed lifetime withdrawal benefit payments from your designated investments no later than the latest Income Date. If you do not elect to receive guaranteed lifetime withdrawal benefit payments from your designated investments before the latest Income Date, we will begin making monthly payments to you, based on your maximum annual withdrawal amount.
If this rider is terminated at your request, then you can elect any available guaranteed lifetime withdrawal benefit rider one year following that termination date.
The GLWB Rider may vary for certain contracts, may not be available for all contracts, and may not be available in all states. This disclosure explains the material features of the GLWB Rider. The application and operation of the rider are governed by the terms and conditions of the rider itself.
Other Information
Transamerica Premier Life Insurance Company (the “Company,” “We,” “Us,” “Our”) Transamerica Premier Life Insurance Company was incorporated under the laws of the State of Maryland on March 5, 1858. It was redomesticated to the State of Iowa on April 1, 2007. It is engaged in the sale of life and health insurance and annuity policies. The Company is a wholly-owned indirect subsidiary of Transamerica Corporation which conducts most of its operations through subsidiary companies engaged in the insurance business or in providing non-insurance financial services. All of the stock of Transamerica Corporation is indirectly owned by Aegon N.V. of The Netherlands, the securities of which are publicly traded. Aegon N.V., a holding company, conducts its business through subsidiary companies engaged primarily in the insurance business. The Company is licensed in the District of Columbia, Guam, Puerto Rico and all states except New York.
All obligations arising under the policies, including the promise to make annuity payments, are general corporate obligations of the Company. Accordingly no financial institution, brokerage firm or insurance agency is responsible for the financial obligations of the Company arising under the policies.
Financial Condition of the Company
Many financial services companies, including insurance companies, have been facing challenges in this unprecedented economic and market environment, and we are not immune to those challenges. It is important for you to understand the impact these events may have, not only on your Accumulated Value, but also on our ability to meet the guarantees under your Contract.
Assets in the Separate Account. You assume all of the investment risk for your Accumulated Value that is allocated to the Subaccounts of the Separate Account. Your Accumulated Value in those Subaccounts constitutes a portion of the assets of the Separate Account. These assets are segregated and insulated from our general account, and may not be charged with liabilities arising from any other business that we may conduct.
Assets in the General Account. Any guarantees under a Contract that exceed Accumulated value, such as those associated with any optional death benefits, are paid from our general account (and not the Separate Account). Therefore, any amounts that we may be obligated to pay under the Contract in excess of Accumulated Value are subject to our financial strength and claims-paying ability and our long-term ability to make such payments. The assets of the Separate Account, however, are also available to cover the liabilities of our general account, but only to the extent that the Separate Account assets exceed the Separate Account liabilities arising under the Contracts supported by it.
We issue other types of insurance policies and financial products as well, and we also pay our obligations under these products from our assets in the general account.

37
Our Financial Condition. As an insurance company, we are required by state insurance regulation to hold a specified amount of reserves in order to meet all the contractual obligations of our general account. In order to meet our claims-paying obligations, we monitor our reserves so that we hold sufficient amounts to cover actual or expected policy and claims payments. In addition, we hedge our investments in our general account, and may require purchasers of certain of the variable insurance products that we offer to allocate premium payments and Accumulated Value in accordance with specified investment requirements. However, it is important to note that there is no guarantee that we will always be able to meet our claims-paying obligations, and that there are risks to purchasing any insurance product.
State insurance regulators also require insurance companies to maintain a minimum amount of capital, which acts as a cushion in the event that the insurer suffers a financial impairment, based on the inherent risks in the insurer’s operations. These risks include those associated with losses that we may incur as the result of defaults on the payment of interest or principal on our general account assets, which include bonds, mortgages, general real estate investments, and stocks, as well as the loss in market value of these investments. We may also experience liquidity risk if our general account assets cannot be readily converted into cash to meet obligations to our Contract owners or to provide the collateral necessary to finance our business operations.
How to Obtain More Information. We encourage both existing and prospective Contract Owners to read and understand our financial statements. We prepare our financial statements on a statutory basis. Our financial statements, which are presented in conformity with accounting practices prescribed or permitted by the Iowa Department of Insurance – as well as the financial statements of the separate account – are located in the Statement of Additional Information (SAI). For a copy of the SAI, simply call or write us at the phone number or address of our Administrative and Service Office referenced in this prospectus. In addition, the SAI is available on the SEC’s website at www.sec.gov. Our financial strength ratings which reflect the opinions of leading independent rating agencies of our ability to meet our obligations to our Contract owners, are available on our website (www.transamerica.com/individual/what-we-do/about-us/financial-strength/), and the websites of these nationally recognized statistical ratings organizations—A.M. Best Company (www.ambest.com), Moody’s Investors Service (www.moodys.com), Standard & Poor’s Rating Services (www.standardandpoors.com) and Fitch, Inc. (www.fitchratinings.com).
Separate Account VA DD
Established by the Company on July 16, 1990, the Separate Account operates under Iowa law. The Separate Account is a unit investment trust registered with the SEC under the Investment Company Act of 1940
(the “1940 Act”). Such registration does not signify that the SEC supervises the management or the investment practices or policies of the Separate Account.
The Company owns the assets of the Separate Account, and the obligations under the Contract are obligations of the Company. These assets are held separately from the other assets of the Company and are not chargeable with liabilities incurred in any other business operation of the Company (except to the extent that assets in the Separate Account exceed the reserves and other liabilities of the Separate Account). The Company will always keep assets in the Separate Account with a value at least equal to the total Accumulated Value under the Contracts. Income, gains, and losses incurred on the assets in the Separate Account, whether or not realized, are credited to or charged against the Separate Account without regard to other income, gains, or losses of the Company. Therefore, the investment performance of the Separate Account is entirely independent of the investment performance of the Company’s general account assets or any other separate account the Company maintains.
The Separate Account has various Subaccounts, each of which invests solely in a corresponding Portfolio of the Fund. Additional Subaccounts may be established at the Company’s discretion. The Separate Account meets the definition of a “separate account” under Rule 0-1(e)(1) of the 1940 Act.
Contract Owner (“You,” “Your”)
The Contract Owner is the person or persons designated as the Contract Owner in the Application to participate in the Contract. The term shall also include any person named as Joint Owner. A Joint Owner shares ownership in all respects with the Owner. The Owner has the right to assign ownership to a person or party other than himself.
Payee
The Payee is the Contract Owner, Annuitant, Beneficiary, or any other person, estate, or legal entity to whom benefits are to be paid.
Free Look Period
The Contract provides for a Free Look Period of at least 10 days after the Contract Owner receives the Contract (20 or more days in some instances as specified in your Contract) plus 5 days for mailing. The Contract Owner may cancel the Contract during the Free Look Period by returning it to Vanguard Annuity and Insurance Services, P.O. Box 1105, Valley Forge, PA 19482-1105. Upon cancellation, the Contract is treated as void from the Contract Date.
Withdrawals are currently permitted during the Free Look Period.

38
Administrative Services
Vanguard, Vanguard Annuity and Insurance Services, 455 Devon Park Drive, Wayne, PA 19087-1815, serves as Third Party Administrator of the contracts under an Administrative Services agreement with the Company.
Distributor of the Contracts We have entered into a distribution arrangement with Vanguard, through its wholly owned subsidiary, Vanguard Marketing Corporation, which is the principal distributor of the Contract. In addition we and/or our affiliates paid Vanguard approximately $680,000 in 2017 to assist with marketing expenses. A complete description of the services provided by Vanguard Marketing Corporation is found in the “Management of the Fund” section in the fund’s Statement of Additional Information. The principal business address for Vanguard is 455 Devon Park Drive, Wayne, PA 19087-1815.
Mixed and Shared Funding The underlying fund portfolios may serve as investment vehicles for variable life insurance contracts, variable annuity contracts and retirement plans (“mixed funding”) and shares of the underlying fund portfolios also may be sold to separate accounts of other insurance companies (“shared funding”). While the Company currently does not foresee any disadvantages to owners and participants arising from either mixed or shared funding, it is possible that the interests of owners of various contracts and/or participants in various plans for which the underlying fund portfolios serve as investments might at some time be in conflict. The Company and each underlying fund portfolio’s Board of Directors intend to monitor events in order to identify any material conflicts and to determine what action, if any, to take. Such action could include the sale of underlying fund portfolio shares by one or more of the separate accounts, which could have adverse consequences. Such action could also include a decision that separate funds should be established for variable life and variable annuity separate accounts. In such an event, the Company would bear the attendant expenses, but owners and plan participants would no longer have the economies of scale resulting from a larger combined fund. Please read the prospectuses for the underlying fund portfolios, which discuss the underlying fund portfolios’ risks regarding mixed and shared funding, as applicable.
Voting Rights
The Fund does not hold regular meetings of shareholders. The trustees of the Fund may call special meetings of shareholders as the 1940 Act or other applicable law may require. To the extent required by law, the Company will vote the Portfolio shares held in the Separate Account at shareholder meetings of the Fund in accordance with instructions received from persons having voting interests in the corresponding Portfolio. The Company will vote Fund shares as to which no timely instructions are received and those shares held by the Company as to which Contract Owners have no beneficial interest in proportion to the voting instructions that are received with respect to all Contracts participating in that Portfolio. Voting instructions to abstain on any item to be voted upon will be applied on a pro rata basis to reduce the votes eligible to be cast.
Prior to the Income Date, the Contract Owner holds a voting interest in each Portfolio to which the Accumulated Value is allocated. The number of votes which are available to a Contract Owner will be determined by dividing the Accumulated Value attributable to a Portfolio by the net asset value per share of the applicable Portfolio. After the Income Date, the person receiving Annuity Payments under any variable Annuity Payment Option has the voting interest. The number of votes after the Income Date will be determined by dividing the reserve for such Contract allocated to the Portfolio by the net asset value per share of the corresponding Portfolio. After the Income Date, the votes attributable to a Contract decrease as the reserves allocated to the Portfolio decrease. In determining the number of votes, fractional shares will be recognized.
The number of votes of the Portfolio that are available will be determined as of the date established by that Portfolio for determining shareholders eligible to vote at the meeting of the Fund. Voting instructions will be solicited by written communication prior to such meeting in accordance with procedures established by the Fund. When we receive those instructions, we will vote all of the shares in proportion to those instructions. Accordingly, it is possible for a small number of Contract owners (assuming there is a quorum) to determine the outcome of a vote, especially if they have large Accumulated Values.
Additions, Deletions, or Substitutions of Investments
The Company retains the right, subject to any applicable law, to make certain changes. The Company reserves the right to eliminate the shares of any of the Portfolios and to substitute shares of another Portfolio of the Fund or of another registered open-end management investment company, if the shares of the Portfolios are no longer available for investment or if, in the Company’s judgment, investment in any Portfolio would be inappropriate in view of the purposes of the Separate Account. To the extent the 1940 Act requires, substitutions of shares attributable to a Contract Owner’s interest in a Portfolio will not be made until SEC approval has been obtained and the Contract Owner has been notified of the change.

39
The Company may establish new Portfolios when marketing, tax, investment, or other conditions so warrant. The Company will make any new Portfolios available to existing Contract Owners on a basis the Company will determine. The Company may also eliminate one or more Portfolios if marketing, tax, investment, or other conditions so warrant.
In the event of any such substitution or change, the Company may, by appropriate endorsement, make whatever changes in the Contracts may be necessary or appropriate to reflect such substitution or change. Furthermore, if deemed to be in the best interests of persons having voting rights under the Contracts, the Company may operate the Separate Account as a management company under the 1940 Act or any other form permitted by law, may deregister the Separate Account under the 1940 Act in the event such registration is no longer required, or may combine the Separate Account with one or more other separate accounts.
Regulatory Modifications to Policy
We reserve the right to amend the policy or any riders attached thereto as necessary to comply with specific direction provided by state and federal regulators, through change of law, rule, regulation, bulletin, regulatory directives or agreements.
Certain Offers From time to time, we may offer you some form of payment or incentive in return for terminating or modifying certain guaranteed benefits. When we makes an offer, we may vary the offer amount, up or down, among the same group of Contract owners based on certain criteria such as cash value and any applicable benefit base, investment allocations and the amount and type of withdrawals taken. For example, for guaranteed benefits that have benefit bases that can be reduced on either a pro rata or dollar-for-dollar basis depending on the amount of withdrawals taken, we may consider whether you have taken any withdrawal that has caused a pro rata reduction in your benefit base, as opposed to a dollar-for-dollar reduction. Also, we may increase or decrease offer amounts from offer to offer. In other words, we may make an offer to a group of Contract owners based on an offer amount, and, in the future, make another offer based on a higher or lower offer amount to the remaining Contract owners in the same group.
If you accept an offer an offer that requires to terminate a guaranteed benefit and you retain your Contract, we will no longer charge you for it, and you will not be eligible for any future offers related to that type of guaranteed benefit, even if such future offer would have included a greater offer amount or different payment or incentive.
We will notify you of the terms of any such offer.
Financial Statements
The audited statutory-basis financial statements and schedules of the Company and the audited financial statements of the subaccounts of the Separate Account which are available for investment by Vanguard Variable Annuity Contract Owners (as well as the Report of Independent Registered Public Accounting Firm on them) are contained in the Statement of Additional Information.
Abandoned or Unclaimed Property Every state has unclaimed property laws that generally provide for escheatment to the state of unclaimed property (including proceeds of annuity, life and other insurance policies) under various circumstances. In addition to the state unclaimed property laws, we may be required to escheat property pursuant to regulatory demand, finding, agreement or settlement. To help prevent such escheatment, it is important that you keep your contact and other information on file with us up to date, including the names, contact information and identifying information for owners, insureds, annuitants, beneficiaries and other payees. Such updates should be communicated in a form and manner satisfactory to us.
Legal Proceedings We, like other life insurance companies, are subject to regulatory and legal proceedings, including class action lawsuits, in the ordinary course of our business. Such legal and regulatory matters include proceedings specific to us and other proceedings generally applicable to business practices in the industry in which we operate. In some lawsuits and regulatory proceedings involving insurers, substantial damages have been sought and/or material settlement payments have been made. Although the outcome of any litigation or regulatory proceeding cannot be predicted with certainty, at the present time, we believe that there are no pending or threatened proceedings or lawsuits that are likely to have a material adverse impact on the separate account or on our ability to meet our obligations under the policy. The Company was the subject of inquiries and remains under audits and market conduct examinations with a focus on the handling of unreported claims and abandoned property. The audits and related examination activity may result in additional payments to beneficiaries, escheatment of funds deemed abandoned, and administrative penalties. The Company previously implemented changes in the procedures for the identification of unreported claims and handling of escheatable property to comply with the terms of regulatory agreements and newly adopted laws and regulations. The

40
Company does not believe that any regulatory actions or agreements that result from these audits and examinations will have a material adverse impact on our ability to meet our obligations. Cyber Security We rely heavily on interconnected computer systems and digital data to conduct our variable product business activities. Because our variable product business is highly dependent upon the effective operation of our computer systems and those of our business partners, our business is potentially vulnerable to disruptions from utility outages and other problems, and susceptible to operational and information security risks resulting from information systems failure (e.g., hardware and software malfunctions) and cyber-attacks. These risks include, among other things, the theft, misuse, corruption and destruction of data maintained online or digitally, interference with or denial of service, attacks on websites and other operational disruption and unauthorized release of confidential customer information. Such systems failures and cyber-attacks affecting us, any third party administrator, the underlying fund portfolios, intermediaries and other affiliated or third-party service providers may adversely affect us and your cash value. For instance, cyber-attacks may interfere with our processing of Contract transactions, including the processing of orders from our website or with the underlying fund portfolios; cause the release and possible destruction of confidential customer or business information; impede order processing; subject us and/or our service providers and intermediaries to regulatory fines and financial losses; and/or cause reputational damage. Cyber security risks may also affect the issuers of securities in which the underlying fund portfolios invest, which may cause the underlying fund portfolios to lose value. There can be no assurance that we, the underlying fund portfolios or our service providers will avoid losses affecting your Contract that result from cyber-attacks or information security breaches in the future.
Table of Contents for the Vanguard Variable Annuity Statement of Additional Information
Contents
The Contract
Computation of Variable Annuity
Income Payments
Exchanges
Joint Annuitant
General Matters
Non-Participating
Misstatement of Age or Sex
Assignment
Annuity Data
Annual Report
Incontestability
Ownership
Distribution of the Contract
Performance Information
Subaccount Inception Dates
Money Market Subaccount Yields
30-Day Yield for Non-Money
Market Subaccounts
Standardized Average Annual Total Return
Additional Performance
Measures
Non-Standardized Cumulative
Total Return and Non-Standardized
Average Annual Total Return
Safekeeping of Account Assets
Conflicts of Interest with
Other Separate Accounts
State Regulation of the
Company
Records and Reports
Independent Registered
Public Accounting Firm
Other Information
Financial Statements
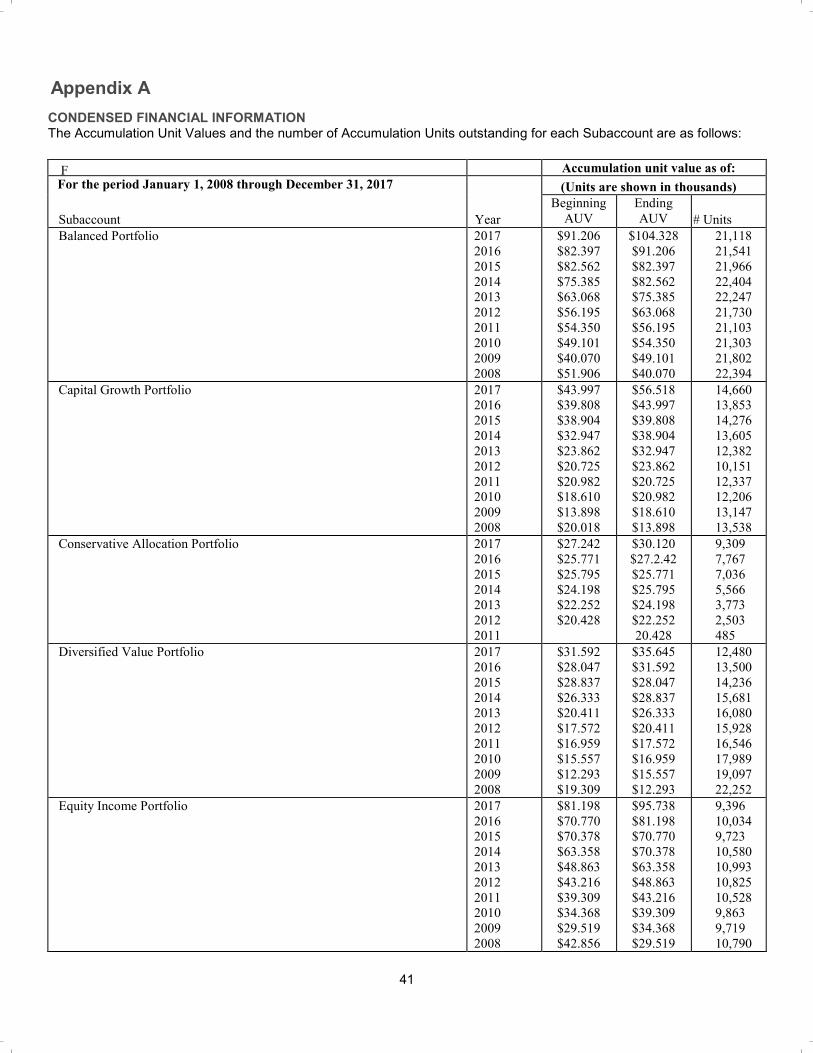
41
Appendix A
CONDENSED FINANCIAL INFORMATION The Accumulation Unit Values and the number of Accumulation Units outstanding for each Subaccount are as follows:
F Accumulation unit value as of:
For the period January 1, 2008 through December 31, 2017 (Units are shown in thousands)
Subaccount Year
Beginning
AUV
Ending
AUV # Units
Balanced Portfolio 2017
2016
2015
2014
2013
2012
2011
2010
2009
2008
$91.206
$82.397
$82.562
$75.385
$63.068
$56.195
$54.350
$49.101
$40.070
$51.906
$104.328
$91.206
$82.397
$82.562
$75.385
$63.068
$56.195
$54.350
$49.101
$40.070
21,118
21,541
21,966
22,404
22,247
21,730
21,103
21,303
21,802
22,394
Capital Growth Portfolio 2017
2016
2015
2014
2013
2012
2011
2010
2009
2008
$43.997
$39.808
$38.904
$32.947
$23.862
$20.725
$20.982
$18.610
$13.898
$20.018
$56.518
$43.997
$39.808
$38.904
$32.947
$23.862
$20.725
$20.982
$18.610
$13.898
14,660
13,853
14,276
13,605
12,382
10,151
12,337
12,206
13,147
13,538
Conservative Allocation Portfolio 2017
2016
2015
2014
2013
2012
2011
$27.242
$25.771
$25.795
$24.198
$22.252
$20.428
$30.120
$27.2.42
$25.771
$25.795
$24.198
$22.252
20.428
9,309
7,767
7,036
5,566
3,773
2,503
485
Diversified Value Portfolio 2017
2016
2015
2014
2013
2012
2011
2010
2009
2008
$31.592
$28.047
$28.837
$26.333
$20.411
$17.572
$16.959
$15.557
$12.293
$19.309
$35.645
$31.592
$28.047
$28.837
$26.333
$20.411
$17.572
$16.959
$15.557
$12.293
12,480
13,500
14,236
15,681
16,080
15,928
16,546
17,989
19,097
22,252
Equity Income Portfolio 2017
2016
2015
2014
2013
2012
2011
2010
2009
2008
$81.198
$70.770
$70.378
$63.358
$48.863
$43.216
$39.309
$34.368
$29.519
$42.856
$95.738
$81.198
$70.770
$70.378
$63.358
$48.863
$43.216
$39.309
$34.368
$29.519
9,396
10,034
9,723
10,580
10,993
10,825
10,528
9,863
9,719
10,790

42
F Accumulation unit value as of:
For the period January 1, 2008 through December 31, 2017 (Units are shown in thousands)
Subaccount Year
Beginning
AUV
Ending
AUV # Units
Equity Index Portfolio 2017
2016
2015
2014
2013
2012
2011
2010
2009
2008
$89.621
$80.387
$79.614
$70.347
$53.377
$46.207
$45.465
$39.681
$31.475
$50.057
$108.716
$89.621
$80.387
$79.614
$70.347
$53.377
$46.207
$45.465
$39.681
$31.475
14,216
14,518
14,730
15,068
15,175
15,680
16,520
17,644
18,808
19,810
Global Bond Index Portfolio* 2017 $ $19.951 2,596
Growth Portfolio 2017
2016
2015
2014
2013
2012
2011
2010
2009
2008
$41.947
$42.529
$39.502
$34.818
$25.812
$21.860
$22.109
$19.831
$14.728
$23.717
$54.757
$41.947
$42.529
$39.502
$34.818
$25.812
$21.860
$22.109
$19.831
$14.728
8,045
7,895
9,270
9,040
9,573
10,074
9,474
10,275
11,296
11,818
High Yield Bond Portfolio 2017
2016
2015
2014
2013
2012
2011
2010
2009
2008
$32.049
$28.865
$29.413
$28.255
$27.158
$23.831
$22.352
$19.997
$14.445
$18.562
$34.195
$32.049
$28.865
$29.413
$28.255
$27.158
$23.831
$22.352
$19.997
$14.445
10,665
10,629
10,541
11,182
11,553
14,562
12,431
12,248
12,524
10,232
International Portfolio 2017
2016
2015
2014
2013
2012
2011
2010
2009
2008
$37.287
$36.707
$37.099
$39.607
$32.228
$26.905
$31.209
$27.049
$19.000
$34.596
$53.046
$37.287
$36.707
$37.099
$39.607
$32.228
$26.905
$31.209
$27.049
$19.000
23,589
22,481
23,100
21,829
22,565
21,903
23,770
26,087
27,594
26,146

43
F Accumulation unit value as of:
For the period January 1, 2008 through December 31, 2017 (Units are shown in thousands)
Subaccount Year
Beginning
AUV
Ending
AUV # Units
Mid-Cap Index Portfolio 2017
2016
2015
2014
2013
2012
2011
2010
2009
2008
$51.240
$46.248
$47.059
$41.549
$30.884
$26.745
$27.382
$21.905
$15.651
$26.980
$60.840
$51.240
$46.248
$47.059
$41.549
$30.884
$26.745
$27.382
$21.905
$15.651
13,203
13,718
14,363
14,571
15,100
14,810
16,327
17,756
17,537
17,685
Moderate Allocation Portfolio 2017
2016
2015
2014
2013
2012
2011
$29.799
$27.789
$27.916
$26.160
$22,812
$20.458
$
$34.111
$29.799
$27.789
$27.916
$26.160
$22.812
$20.458
10,268
8,924
8,382
6,400
4,567
2,511
566
Money Market Portfolio 2017
2016
2015
2014
2013
2012
2011
2010
2009
2008
$1.900
$1,897
$1.900
$1.903
$1.907
$1.910
$1.912
$1.913
$1.907
$1.861
$1.914
$1.900
$1.897
$1.900
$1.903
$1.907
$1.910
$1.912
$1.913
$1.907
435,872
453,201
411,300
385,038
421,164
369,252
417,731
436,382
498,421
831,929
Real Estate Index Portfolio* 2017
2016
2015
2014
2013
2012
2011
2010
2009
2008
$58.870
$54.488
$53.459
$41.209
$40.388
$34.486
$31.897
$24.944
$19.372
$30.962
$61.504
$58.870
$54.488
$53.459
$41.209
$40.388
$34.486
$31.897
$24.944
$19.372
8,258
9,184
9,396
9,997
9,374
10,174
9,499
9,300
8,715
8,724
Short-Term Investment Grade Portfolio 2017
2016
2015
2014
2013
2012
2011
2010
2009
2008
$18.957
$18.509
$18.357
$18.093
$17.953
$17.244
$16.953
$16.160
$14.235
$14.788
$19.297
$18.957
$18.509
$18.357
$18.093
$17.953
$17.244
$16.953
$16.160
$14.235
51,945
50,234
49,619
50,166
47,236
47,221
46,613
43,576
42,643
24,9000

44
F Accumulation unit value as of:
For the period January 1, 2008 through December 31, 2017 (Units are shown in thousands)
Subaccount Year
Beginning
AUV
Ending
AUV # Units
Small Company Growth Portfolio 2017
2016
2015
2014
2013
2012
2011
2010
2009
2008
$72.274
$63.064
$65.038
$63.098
$43.183
$37.776
$37.379
$28.447
$20.470
$33.920
$88.975
$72.274
$63.064
$65.038
$63.098
$43.183
$37.776
$37.379
$28.447
$20.470
9,200
9,466
9,692
9,915
11,131
10,804
12,001
13,139
13,015
38,239
Total Bond Market Index Portfolio 2017
2016
2015
2014
2013
2012
2011
2010
2009
2008
$37.647
$36.846
$36.831
$34.884
$35.807
$34.523
$32.164
$30.290
$28.676
$27.332
$38.846
$37.647
$36.846
$36.831
$34.884
$35.807
$34.523
$32.164
$30.290
$28.676
39,531
38,623
37,608
36,537
34,896
41,255
41,027
39,006
38,239
32,884
Total International Stock Market Index Portfolio* 2017 $ $21.130 3,113
Total Stock Market Index Portfolio 2017
2016
2015
2014
2013
2012
2011
2010
2009
2008
$32.764
$29.194
$29.171
$26.054
$19.606
$16.904
$16.814
$14.399
$11.260
$18.008
$39.519
$32.764
$29.194
$29.171
$26.054
$19.606
$16.904
$16.814
$14.399
$11.260
31,587
31,603
31,711
30,397
30,263
29,376
29,461
30,630
28,395
26,354
* Date of commencement of operations for the Total Bond Market Index and Equity Index Subaccounts was April 29,
1991, for the Money Market Subaccount was May 2, 1991, for the Balanced Subaccount was May 23, 1991, for the Equity Income and Growth Subaccounts was June 7, 1993, for the International Subaccount was June 3, 1994, for the High Yield Bond and Small Company Growth Subaccounts was June 3, 1996, for the Short-Term Investment-Grade, Diversified Value, Mid-Cap Index, and REIT Index Subaccounts was February 8, 1999, for the Total Stock Market Index and Capital Growth Subaccounts was May 1, 2003, and for the Conservative Allocation and Moderate Allocation Subaccounts was October 19, 2011. Effective on or about September 7, 2017 Total International Stock Market Index Portfolio and Global Bond Index Portfolio advisor The Vanguard Group, Inc. was made available. Effective on or about January 18, 2018 REIT Index Portfolio was renamed Real Estate Index Portfolio.

45
Appendix B
DEATH BENEFIT Adjusted Partial Withdrawal. If you make a partial withdrawal, then your death benefit is reduced by an amount called the adjusted partial withdrawal. The amount of the reduction depends on the relationship between your guaranteed minimum death benefit and the accumulated value. The adjusted partial withdrawal is equal to (1) multiplied by (2) divided by (3), where:
(1)is the amount of the partial withdrawal (2)is the value of the current guaranteed minimum death benefit immediately prior to the gross partial surrender; (3)is the accumulated value immediately prior to the partial withdrawal.
The following examples describe the effect of a partial surrender on the death benefit and the accumulated value.
Example 1 (Assumed Facts for Example) Current guaranteed minimum death benefit before withdrawal ................................................................$ 75,000 Current accumulated value before withdrawal ...........................................................................................$ 50,000 Current death proceeds (greater of accumulated value or guaranteed minimum death benefit) ..............$ 75,000 Total Partial Withdrawal .............................................................................................................................$ 15,494 Adjusted partial withdrawal = 15,494 * 75,000 / 50,000 .............................................................................$ 23,241 New guaranteed minimum death benefit (after withdrawal) = $75,000 – 23,241 ......................................$ 51,759 New accumulated value (after withdrawal) = 50,000 – 15,494 ..................................................................$ 34,506
Summary: Reduction in guaranteed minimum death benefit = $23,241 Reduction in accumulated value = $15,494
* This example is for illustrative purposes only. The purpose of this illustration is to demonstrate how this feature is calculated using hypothetical values. Your experience will vary based on circumstances at the time of withdrawal.
** The guaranteed minimum death benefit is reduced more than the accumulated value because the guaranteed minimum death benefit was greater than the accumulated value just prior to the withdrawal.
Example 2 (Assumed Facts for Example) Current guaranteed minimum death benefit before withdrawal ................................................................$ 50,000 Current accumulated value before withdrawal ...........................................................................................$ 75,000 Current death proceeds (greater of accumulated value or guaranteed minimum death benefit) ..............$ 75,000 Total Partial Withdrawal .............................................................................................................................$ 15,556 Adjusted partial withdrawal = 15,556 * 50,000 / 75,000 .............................................................................$ 10,370 New guaranteed minimum death benefit (after withdrawal) = $50,000 – 10,370 ......................................$ 39,630 New accumulated value (after withdrawal) = 75,000 – 15,556 ..................................................................$ 59,444
Summary: Reduction in guaranteed minimum death benefit = $10,370 Reduction in accumulated value = $15,556
* This example is for illustrative purposes only. The purpose of this illustration is to demonstrate how this feature is calculated using hypothetical values. Your experience will vary based on circumstances at the time of withdrawal.
** The guaranteed minimum death benefit is reduced less than the accumulated value because the guaranteed minimum death benefit was less than the accumulated value just prior to the withdrawal.

46
Hypothetical Example In this example, certain death benefit values at various points in time are depicted based on hypothetical assumed rates of performance. This example is for illustrative purposes only and assumes a single $100,000 premium payment by a sole owner and annuitant who is age 50. It further assumes no subsequent premium payments or withdrawals.
End of Year
Net Rate of Return for Fund*
Policy Value (No GMDB
Elected)
Policy Value (Return of Premium
GMDB Elected)
Return of Premium
GMDB
Issue N/A $100,000 $100,000 $100,000 1 -4% $95,700 $95,650 $100,000 2 18% $112,639 $112,532 $100,000 3 15% $129,197 $129,018 $100,000 4 -7% $119,765 $119,535 $100,000 5 2% $121,801 $121,508 $100,000 6 10% $133,616 $133,233 $100,000 7 14% $151,922 $151,420 $100,000 8 -3% $146,908 $146,347 $100,000 9 17% $171,442 $170,714 $100,000 10 6% $181,214 $180,359 $100,000
* The assumed rate does reflect the deduction of a hypothetical fund fee but does not reflect the deduction of any other fees, charges or taxes. The death benefit values do reflect the deduction of hypothetical base policy fees and hypothetical death benefit fees. Different hypothetical returns and fees would produce different results.

47
Appendix C
GLWB RIDER—ADJUSTED PARTIAL WITHDRAWALS When a withdrawal is taken, the following parts of the guaranteed lifetime withdrawal benefit can be affected:
1. Total Withdrawal Base (“TWB”) 2. Maximum Annual Withdrawal Amount (“MAWA”)
Total Withdrawal Base. Gross partial withdrawals from the designated investments in a rider year up to the maximum annual withdrawal amount will not reduce the total withdrawal base. Gross partial withdrawals from the designated investments in a rider year in excess of the maximum annual withdrawal amount will reduce the total withdrawal base by an amount equal to the greater of: the excess withdrawal amount; and a pro rata amount, the result of (A / B) * C, where:
A) is the excess withdrawal amount (the amount in excess of the maximum annual withdrawal amount remaining prior to the withdrawal);
B) is the Accumulated Value in the designated investments after the maximum annual withdrawal amount has been withdrawn, but prior to the withdrawal of the excess amount; and
C) is the total withdrawal base prior to the withdrawal of the excess amount.
The following demonstrates, on a purely hypothetical basis, the effects of partial withdrawals under this guaranteed lifetime withdrawal benefit.
Example 1 (Non-Excess Withdrawal): Assumptions: Total Withdrawal Base (“TWB”) = $100,000 Maximum Annual Withdrawal Amount (“MAWA”) = 5.5% withdrawal percentage would result in $5,500 (5.5% of the
then current $100,000 total withdrawal base) Gross partial withdrawal (“GPWD”) = $5,500 Excess withdrawal (“EWD”) = None Accumulated Value (“AV”) before GPWD = $100,000
Question: Is any portion of the withdrawal greater than the maximum annual withdrawal amount? No. There is no excess withdrawal under the guarantee since no more than $5,500 is withdrawn.
Result: In this example, because no portion of the withdrawal was in excess of $5,500, the total withdrawal base does not change.
Example 2 (Excess Withdrawal): Assumptions: TWB = $100,000 MAWA = 5.5% withdrawal percentage would result in $5,500 (5.5% of the current $100,000 total withdrawal base) GPWD = $7,000 EWD = $1,500 ($7,000 - $5,500) AV before GPWD = $90,000
Result. For the guaranteed lifetime withdrawal benefit, because there was an excess withdrawal amount, the total withdrawal base needs to be adjusted and a new lower maximum annual withdrawal amount calculated. Had the withdrawal for this example not been more than $5,500, the total withdrawal base would remain at $100,000 and the maximum annual withdrawal amount would be $5,500. However, because an excess withdrawal has been taken, the total withdrawal base is also reduced (this is the amount the 5.5% is based on).
New total withdrawal base: Step One. The total withdrawal base is reduced only by the amount of the excess withdrawal or a pro rata amount, if greater.
Step Two. Calculate how much the total withdrawal base is affected by the excess withdrawal. 1. The formula is (EWD / (AV - 5.5% withdrawal)) * TWB before any adjustments 2. ($1,500 / ($90,000 - $5,500)) * $100,000 = $1,775.15
Step Three. Which is larger, the actual $1,500 excess withdrawal or the $1,775.15 pro rata amount? $1,775.15 pro rata amount.
Step Four. What is the new total withdrawal base upon which the maximum annual withdrawal amount is based? $100,000 - $1,775.15 = $98,224.85

48
Result. The new total withdrawal base is $98,224.85
New maximum annual withdrawal amount: Because the total withdrawal base was adjusted (due to the excess withdrawal) we have to calculate a new maximum annual withdrawal amount for the 5.5% guarantee that will be available starting on the next rider anniversary. This calculation assumes no more activity prior to the next rider anniversary.
Question: What is the new maximum annual withdrawal amount? $98,224.85 (the adjusted total withdrawal base) * 5.5% = $5,402.37
Result. Going forward, the maximum you can take out from the designated investments in a year without causing an excess withdrawal and further reduction of the total withdrawal base is $5,402.37 (assuming there are no future automatic step-ups).
Example 3 (Required Minimum Distribution “RMD”): TWB = $100,000 MAWA for rider year beginning July 1, 2011 = 5.5% withdrawal would be $5,500 (5.5% of the current $100,000 total
withdrawal base). RMD for 2011 = $6,000 (calculated as set forth in the rider) RMD for 2012 = $6,500 (calculated as set forth in the rider) GPWD on February 1, 2012 = $6,500 EWD = $500
Question: Is any portion of the withdrawal greater than the maximum annual withdrawal amount or the required minimum withdrawal calculated pursuant to the terms of the rider?
Yes. Because more than $6,000 (the greater of the MAWA ($5,500) or RMD for the tax year on that rider anniversary ($6,000) was withdrawn, there is an excess withdrawal of $500 (6,500 - 6,000 = 500). Please note, even though the withdrawal occurred in 2012, the RMD for 2012 does not become part of the MAWA calculation until July 1, 2012 (the rider anniversary during that tax year).
Result: Because there was an excess withdrawal amount, the total withdrawal base needs to be adjusted and a new lower maximum annual withdrawal amount calculated. See Example 2 (Excess Withdrawal) for an example of how the new total withdrawal base and new maximum annual withdrawal amount are calculated.

49
Appendix D
GLWB RIDER—BLENDED RIDER FEE
Assumptions: Policy Issue Date = 12/15/2012 Initial Premium = $100,000 Initial Premium allocated to designated funds = Total Withdrawal Base (TWB) = $50,000 GLWB Rider Fee at issue = 0.95% Rider Fee Change 5/1/2013 = 1.20% Premium Addition allocated to designated funds 2/1/2014 = $9,951.27
Result: In this example, your blended rider fee on 2/1/2014 is .99%. The calculation is [($50,000 x 0.95%) + ($9.951.27 x 1.20%)] divided by ($50,000 + $9,951.27).
Then, assume: Fund transfer from a non-designated fund 8/1/2014 = $5,000 TWB before fund transfer = $59,951.27
Result. Your blended rider fee on 8/1/2014 is 1.01% based on this fund transfer. The calculation is [($59,951.27 x 0.99%) + ($5,000 x 1.20%)] divided by ($59,951.27 + $5,000).
Lastly, assume: Rider Fee Change 5/1/2015 = 1.30% Premium Addition allocated to designated funds 7/1/2015 = $5,000 TWB before Premium Addition = $64,951.27
Result. Your blended rider fee on 7/1/2015 is 1.03%. The calculation is [($64,951.27 x 1.01 %) + ($5,000 x 1.30%)] divided by ($64,951.27+ $5,000).

SP 64 052018
Transamerica Premier Life Insurance Company

The Fund’s statutory Prospectus and Statement of Additional Information dated April 26, 2018, as may be amended or supplemented, are incorporated into and made part of this Summary Prospectus by reference.
Before you invest, you may want to review the Fund’s Prospectus, which contains more information about the Fund and its risks. You can find the Fund’s Prospectus and other information about the Fund online at www.vanguard.com/prospectus. You can also obtain this information at no cost by calling 800-522-5555 or by sending an email request to [email protected]
The Securities and Exchange Commission (SEC) has not approved or disapproved these securities or passed upon the adequacy of this prospectus. Any
representation to the contrary is a criminal offense.
Vanguard Variable Insurance FundSummary Prospectus
April 26, 2018
Money Market Portfolio
Short-Term Investment-Grade Portfolio
Total Bond Market Index Portfolio
Global Bond Index Portfolio
High Yield Bond Portfolio
Conservative Allocation Portfolio
Moderate Allocation Portfolio
Balanced Portfolio
Equity Income Portfolio
Diversified Value Portfolio
Total Stock Market Index Portfolio
Equity Index Portfolio
Mid-Cap Index Portfolio
Growth Portfolio
Capital Growth Portfolio
Small Company Growth Portfolio
International Portfolio
Total International Stock Market Index Portfolio Investor Shares
Real Estate Index Portfolio*
* Formerly known as REIT Index Portfolio

Contents
Portfolio Summaries
Money Market Portfolio 1
Short-Term Investment-Grade Portfolio 3
Total Bond Market Index Portfolio 5
Global Bond Index Portfolio 8
High Yield Bond Portfolio 10
Conservative Allocation Portfolio 13
Moderate Allocation Portfolio 15
Balanced Portfolio 18
Equity Income Portfolio 21
Diversified Value Portfolio 23
Total Stock Market Index Portfolio 25
Equity Index Portfolio 27
Mid-Cap Index Portfolio 30
Growth Portfolio 32
Capital Growth Portfolio 34
Small Company Growth Portfolio 36
International Portfolio 38
Total International Stock Market Index Portfolio 41
Real Estate Index Portfolio1 42
1
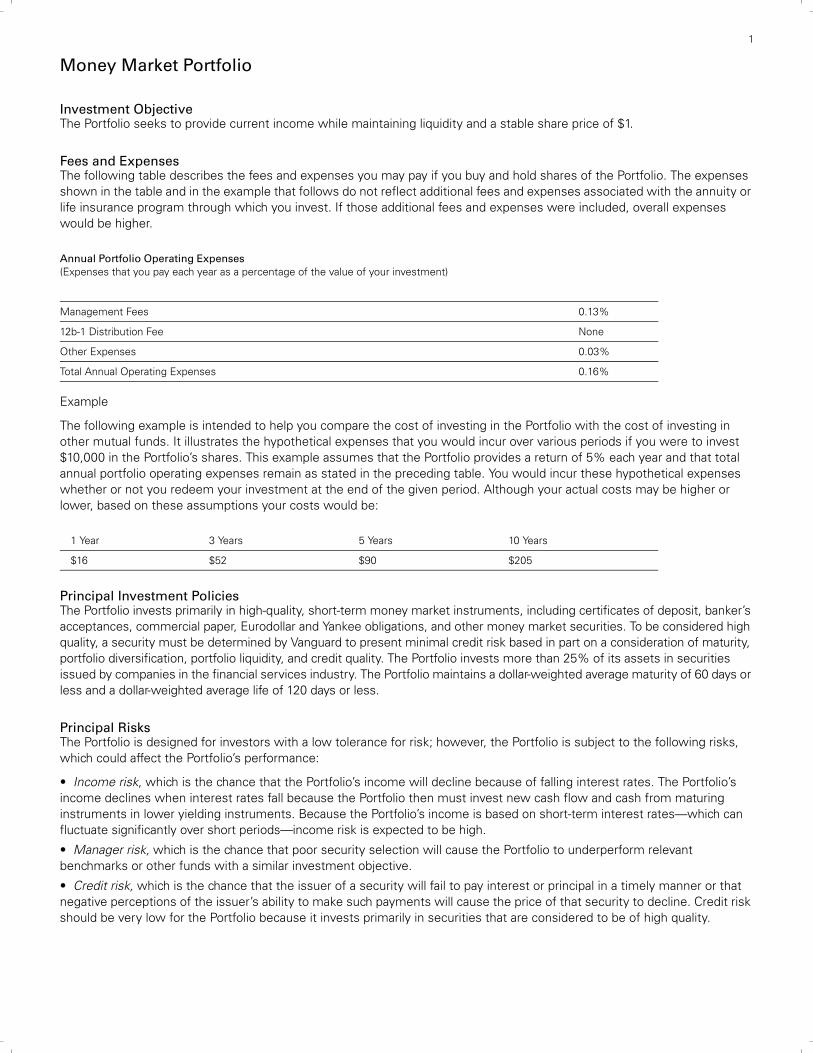
1
Money Market Portfolio
Investment ObjectiveThe Portfolio seeks to provide current income while maintaining liquidity and a stable share price of $1.
Fees and ExpensesThe following table describes the fees and expenses you may pay if you buy and hold shares of the Portfolio. The expenses shown in the table and in the example that follows do not reflect additional fees and expenses associated with the annuity or life insurance program through which you invest. If those additional fees and expenses were included, overall expenses would be higher.
Example
The following example is intended to help you compare the cost of investing in the Portfolio with the cost of investing in other mutual funds. It illustrates the hypothetical expenses that you would incur over various periods if you were to invest $10,000 in the Portfolio’s shares. This example assumes that the Portfolio provides a return of 5% each year and that total annual portfolio operating expenses remain as stated in the preceding table. You would incur these hypothetical expenses whether or not you redeem your investment at the end of the given period. Although your actual costs may be higher or lower, based on these assumptions your costs would be:
Principal Investment PoliciesThe Portfolio invests primarily in high-quality, short-term money market instruments, including certificates of deposit, banker’s acceptances, commercial paper, Eurodollar and Yankee obligations, and other money market securities. To be considered high quality, a security must be determined by Vanguard to present minimal credit risk based in part on a consideration of maturity, portfolio diversification, portfolio liquidity, and credit quality. The Portfolio invests more than 25% of its assets in securities issued by companies in the financial services industry. The Portfolio maintains a dollar-weighted average maturity of 60 days or less and a dollar-weighted average life of 120 days or less.
Principal RisksThe Portfolio is designed for investors with a low tolerance for risk; however, the Portfolio is subject to the following risks, which could affect the Portfolio’s performance:
• Income risk, which is the chance that the Portfolio’s income will decline because of falling interest rates. The Portfolio’s income declines when interest rates fall because the Portfolio then must invest new cash flow and cash from maturing instruments in lower yielding instruments. Because the Portfolio’s income is based on short-term interest rates—which can fluctuate significantly over short periods—income risk is expected to be high.
• Manager risk, which is the chance that poor security selection will cause the Portfolio to underperform relevant benchmarks or other funds with a similar investment objective.
• Credit risk, which is the chance that the issuer of a security will fail to pay interest or principal in a timely manner or that negative perceptions of the issuer’s ability to make such payments will cause the price of that security to decline. Credit risk should be very low for the Portfolio because it invests primarily in securities that are considered to be of high quality.
Annual Portfolio Operating Expenses(Expenses that you pay each year as a percentage of the value of your investment)
Management Fees 0.13%
12b-1 Distribution Fee None
Other Expenses 0.03%
Total Annual Operating Expenses 0.16%
1 Year 3 Years 5 Years 10 Years
$16 $52 $90 $205

2
• Foreign investment risk. The Portfolio’s investment in Eurodollar and Yankee obligations, which include certificates of deposit issued in U.S. dollars by foreign banks and foreign branches of U.S. banks, subjects it to the same risks as U.S. money market instruments, such as income risk and credit risk. Additional risks of Eurodollar and Yankee obligations include the chance that a foreign government will not let U.S. dollar-denominated assets leave the country, the chance that the banks that issue Eurodollar obligations may not be subject to the same regulations as U.S. banks, and the chance that adverse political or economic developments will affect investments in a foreign country.
• Industry concentration risk, which is the chance that there will be overall problems affecting a particular industry. Because the Portfolio invests more than 25% of its assets in securities issued by companies in the financial services industry, the Portfolio’s performance depends to a greater extent on the overall condition of that industry and is more susceptible to events affecting that industry.
You could lose money by investing in the Portfolio. Although the Portfolio seeks to preserve the value of your investment at $1.00 per share, it cannot guarantee it will do so. The Portfolio may impose a fee upon sale of your shares or may temporarily suspend your ability to sell shares if the Portfolio’s liquidity falls below required minimums because of market conditions or other factors. An investment in the Portfolio is not insured or guaranteed by the Federal Deposit Insurance Corporation or any other government agency. The Portfolio’s sponsor has no legal obligation to provide financial support to the Portfolio, and you should not expect that the sponsor will provide financial support to the Portfolio at any time.
Annual Total ReturnsThe following bar chart and table are intended to help you understand the risks of investing in the Portfolio. The bar chart shows how the performance of the Portfolio has varied from one calendar year to another over the periods shown. The table shows how the average annual total returns of the Portfolio compare with those of a relevant market index and a comparative benchmark, which have investment characteristics similar to those of the Portfolio. The Portfolio’s returns are net of its expenses but do not reflect additional fees and expenses that are deducted by the annuity or life insurance program through which you invest. If such fees and expenses were included in the calculation of the Portfolio’s returns, the returns would be lower. Returns for the Variable Insurance Money Market Funds Average are derived from data provided by Lipper, a Thomson Reuters Company. Keep in mind that the Portfolio’s past performance does not indicate how the Portfolio will perform in the future. Updated performance information is available on our website for Financial Advisors at advisors.vanguard.com or by calling Vanguard toll-free at 800-522-5555.
During the periods shown in the bar chart, the highest return for a calendar quarter was 0.99% (quarter ended March 31, 2008), and the lowest return for a quarter was 0.02% (quarter ended September 30, 2014).
Annual Total Returns — Money Market Portfolio
Average Annual Total Returns for Periods Ended December 31, 2017
1 Year 5 Years 10 Years
Money Market Portfolio 1.01% 0.37% 0.58%
Comparative Benchmarks(reflect no deduction for fees or expenses)
Citigroup 3-Month U.S. Treasury Bill Index 0.84% 0.23% 0.34%
Variable Insurance Money Market Funds Average 0.40 0.08 0.28
2.83 0.62 0.23 0.17 0.14 0.11 0.10 0.15 0.48 1.01
60%
40%
20%
0%
-20%
-40%
-60%
2008 2009 2010 2011 2012 2013 2014 2015 2016 2017

3
Investment AdvisorThe Vanguard Group, Inc. (Vanguard)
Portfolio Manager
John C. Lanius, Portfolio Manager at Vanguard. He has managed the Portfolio since 2004.
Tax InformationThe Portfolio normally distributes its net investment income and net realized capital gains, if any, to its shareholders, which are the insurance company separate accounts that sponsor your variable annuity or variable life insurance contract. The tax consequences to you of your investment in the Portfolio depend on the provisions of the annuity or life insurance contract through which you invest. For more information on taxes, please refer to the prospectus of the annuity or life insurance contract through which Portfolio shares are offered.
Payments to Financial IntermediariesThe Portfolio and its investment advisor do not pay financial intermediaries for sales of Portfolio shares.
Short-Term Investment-Grade Portfolio
Investment ObjectiveThe Portfolio seeks to provide current income while maintaining limited price volatility.
Fees and ExpensesThe following table describes the fees and expenses you may pay if you buy and hold shares of the Portfolio. The expenses shown in the table and in the example that follows do not reflect additional fees and expenses associated with the annuity or life insurance program through which you invest. If those additional fees and expenses were included, overall expenses would be higher.
Example
The following example is intended to help you compare the cost of investing in the Portfolio with the cost of investing in other mutual funds. It illustrates the hypothetical expenses that you would incur over various periods if you were to invest $10,000 in the Portfolio’s shares. This example assumes that the Portfolio provides a return of 5% each year and that total annual portfolio operating expenses remain as stated in the preceding table. You would incur these hypothetical expenses whether or not you redeem your investment at the end of the given period. Although your actual costs may be higher or lower, based on these assumptions your costs would be:
Portfolio Turnover
The Portfolio pays transaction costs, such as commissions, when it buys and sells securities (or “turns over” its portfolio). A higher portfolio turnover rate may indicate higher transaction costs. These costs, which are not reflected in annual portfolio operating expenses or in the previous expense example, reduce the Portfolio’s performance. During the most recent fiscal year, the Portfolio’s turnover rate was 83% of the average value of its portfolio.
Annual Portfolio Operating Expenses(Expenses that you pay each year as a percentage of the value of your investment)
Management Fees 0.13%
12b-1 Distribution Fee None
Other Expenses 0.03%
Total Annual Operating Expenses 0.16%
1 Year 3 Years 5 Years 10 Years
$16 $52 $90 $205

4
Principal Investment StrategiesThe Portfolio invests in a variety of high-quality and, to a lesser extent, medium-quality fixed income securities. Under normal circumstances, at least 80% of the Portfolio’s assets will be invested in short- and intermediate-term investment-grade securities. The Portfolio’s 80% policy may be changed only upon 60 days’ notice to shareholders. High-quality fixed income securities are those rated the equivalent of A3 or better by Moody’s Investors Service, Inc. (Moody’s), or another independent rating agency or, if unrated, are determined to be of comparable quality by the Portfolio’s advisor; medium-quality fixed income securities are those rated the equivalent of Baa1, Baa2, or Baa3 by Moody’s or another independent rating agency, or, if unrated, are determined to be of comparable quality by the Portfolio’s advisor. (Investment-grade fixed income securities are those rated the equivalent of Baa3 and above by Moody’s or another independent rating agency or, if unrated, are determined to be of comparable quality by the Portfolio’s advisor.) The Portfolio is expected to maintain a dollar-weighted average maturity of 1 to 4 years.
Principal RisksThe Portfolio is designed for investors with a low tolerance for risk; however, you could still lose money by investing in it. The Portfolio is subject to the following risks, which could affect the Portfolio’s performance:
• Income risk, which is the chance that the Portfolio’s income will decline because of falling interest rates. Income risk is generally high for short-term bond funds, so investors should expect the Portfolio’s monthly income to fluctuate.
• Interest rate risk, which is the chance that bond prices will decline because of rising interest rates. Interest rate risk should be low for the Portfolio because it invests primarily in short-term bonds, whose prices are less sensitive to interest rate changes than are the prices of longer-term bonds.
• Credit risk, which is the chance that a bond issuer will fail to pay interest or principal in a timely manner, or that negative perceptions of the issuer’s ability to make such payments will cause the price of that bond to decline. Although the Portfolio invests a limited portion of its assets in low-quality bonds, credit risk should be low for the Portfolio because it invests primarily in bonds that are considered high-quality and, to a lesser extent, in bonds that are considered medium-quality.
• Call risk, which is the chance that during periods of falling interest rates, issuers of callable bonds may call (redeem) securities with higher coupon rates or interest rates before their maturity dates. The Portfolio would then lose any price appreciation above the bond’s call price and would be forced to reinvest the unanticipated proceeds at lower interest rates, resulting in a decline in the Portfolio’s income. Such redemptions and subsequent reinvestments would also increase the Portfolio’s turnover rate. Call risk should be low for the Portfolio.
• Extension risk, which is the chance that during periods of rising interest rates, certain debt securities will be paid off substantially more slowly than originally anticipated, and the value of those securities may fall.
• Liquidity risk, which is the chance that the Portfolio may not be able to sell a security in a timely manner at a desired price.
• Manager risk, which is the chance that poor security selection will cause the Portfolio to underperform relevant benchmarks or other funds with a similar investment objective. In addition, significant investments in the financial and industrial sectors subject the Portfolio to proportionately higher exposure to the risks of these sectors.
• Derivatives risk. The Portfolio may invest in derivatives, which may involve risks different from, and possibly greater than, those of investments directly in the underlying securities or assets.
An investment in the Portfolio is not a deposit of a bank and is not insured or guaranteed by the Federal Deposit Insurance Corporation or any other government agency.
Annual Total ReturnsThe following bar chart and table are intended to help you understand the risks of investing in the Portfolio. The bar chart shows how the performance of the Portfolio has varied from one calendar year to another over the periods shown. The table shows how the average annual total returns of the Portfolio compare with those of a relevant market index, which has investment characteristics similar to those of the Portfolio. The Portfolio’s returns are net of its expenses but do not reflect additional fees and expenses that are deducted by the annuity or life insurance program through which you invest. If such fees and expenses were included in the calculation of the Portfolio’s returns, the returns would be lower. Keep in mind that the Portfolio’s past performance does not indicate how the Portfolio will perform in the future. Updated performance information is available on our website for Financial Advisors at advisors.vanguard.com or by calling Vanguard toll-free at 800-522-5555.

5
During the periods shown in the bar chart, the highest return for a calendar quarter was 5.92% (quarter ended June 30, 2009), and the lowest return for a quarter was –2.98% (quarter ended September 30, 2008).
Investment AdvisorThe Vanguard Group, Inc. (Vanguard)
Portfolio Managers
Samuel C. Martinez, CFA, Portfolio Manager at Vanguard. He has co-managed the Portfolio since April 2018.
Daniel Shaykevich, Principal of Vanguard. He has co-managed the Portfolio since April 2018.
Tax InformationThe Portfolio normally distributes its net investment income and net realized capital gains, if any, to its shareholders, which are the insurance company separate accounts that sponsor your variable annuity or variable life insurance contract. The tax consequences to you of your investment in the Portfolio depend on the provisions of the annuity or life insurance contract through which you invest. For more information on taxes, please refer to the prospectus of the annuity or life insurance contract through which Portfolio shares are offered.
Payments to Financial IntermediariesThe Portfolio and its investment advisor do not pay financial intermediaries for sales of Portfolio shares.
Total Bond Market Index Portfolio
Investment ObjectiveThe Portfolio seeks to track the performance of a broad, market-weighted bond index.
Fees and ExpensesThe following table describes the fees and expenses you may pay if you buy and hold shares of the Portfolio. The expenses shown in the table and in the example that follows do not reflect additional fees and expenses associated with the annuity or life insurance program through which you invest. If those additional fees and expenses were included, overall expenses would be higher.
Annual Total Returns — Short-Term Investment-Grade Portfolio
Average Annual Total Returns for Periods Ended December 31, 2017
1 Year 5 Years 10 Years
Short-Term Investment-Grade Portfolio 2.19% 1.77% 3.01%
Bloomberg Barclays U.S. 1-5 Year Credit Bond Index(reflects no deduction for fees or expenses) 2.32% 1.83% 3.49%
-3.45
13.865.22 2.02 4.42 1.08 1.76 1.12 2.72 2.19
60%
40%
20%
0%
-20%
-40%
-60%
2008 2009 2010 2011 2012 2013 2014 2015 2016 2017

6
Example
The following example is intended to help you compare the cost of investing in the Portfolio with the cost of investing in other mutual funds. It illustrates the hypothetical expenses that you would incur over various periods if you were to invest $10,000 in the Portfolio’s shares. This example assumes that the Portfolio provides a return of 5% each year and that total annual portfolio operating expenses remain as stated in the preceding table. You would incur these hypothetical expenses whether or not you redeem your investment at the end of the given period. Although your actual costs may be higher or lower, based on these assumptions your costs would be:
Portfolio Turnover
The Portfolio pays transaction costs, such as commissions, when it buys and sells securities (or “turns over” its portfolio). A higher portfolio turnover rate may indicate higher transaction costs. These costs, which are not reflected in annual portfolio operating expenses or in the previous expense example, reduce the Portfolio’s performance. During the most recent fiscal year, the Portfolio’s turnover rate was 91% of the average value of its portfolio.
Principal Investment StrategiesThe Portfolio employs an indexing investment approach designed to track the performance of the Bloomberg Barclays U.S. Aggregate Float Adjusted Index. This Index represents a wide spectrum of public, investment-grade, taxable, fixed income securities in the United States—including government, corporate, and international dollar-denominated bonds, as well as mortgage-backed and asset-backed securities—all with maturities of more than 1 year.
The Portfolio invests by sampling the Index, meaning that it holds a broadly diversified collection of securities that, in the aggregate, approximates the full Index in terms of key risk factors and other characteristics. All of the Portfolio’s investments will be selected through the sampling process, and under normal circumstances, at least 80% of the Portfolio’s assets will be invested in bonds held in the Index. The Portfolio maintains a dollar-weighted average maturity consistent with that of the Index, which generally ranges between 5 and 10 years.
Principal RisksAn investment in the Portfolio could lose money over short or long periods of time. You should expect the Portfolio’s share price and total return to fluctuate within a wide range. The Portfolio is subject to the following risks, which could affect the Portfolio’s performance:
• Interest rate risk, which is the chance that bond prices will decline because of rising interest rates. Interest rate risk should be moderate for the Portfolio because it invests primarily in short- and intermediate-term bonds, whose prices are less sensitive to interest rate changes than are the prices of long-term bonds.
• Income risk, which is the chance that the Portfolio’s income will decline because of falling interest rates. Income risk is generally high for short-term bond funds and moderate for intermediate-term bond funds, so investors should expect the Portfolio’s monthly income to fluctuate accordingly.
• Call risk, which is the chance that during periods of falling interest rates, issuers of callable bonds may call (redeem) securities with higher coupon rates or interest rates before their maturity dates. The Portfolio would then lose any price appreciation above the bond’s call price and would be forced to reinvest the unanticipated proceeds at lower interest rates, resulting in a decline in the Portfolio’s income. Such redemptions and subsequent reinvestments would also increase the Portfolio’s turnover rate. Call risk should be moderate for the Portfolio because it invests only a portion of its assets in callable bonds.
Annual Portfolio Operating Expenses(Expenses that you pay each year as a percentage of the value of your investment)
Management Fees 0.12%
12b-1 Distribution Fee None
Other Expenses 0.03%
Total Annual Operating Expenses 0.15%
1 Year 3 Years 5 Years 10 Years
$15 $48 $85 $192

7
• Prepayment risk, which is the chance that during periods of falling interest rates, homeowners will refinance their mortgages before their maturity dates, resulting in prepayment of mortgage-backed securities held by the Portfolio. The Portfolio would then lose any price appreciation above the mortgage’s principal and would be forced to reinvest the unanticipated proceeds at lower interest rates, resulting in a decline in the Portfolio’s income. Such prepayments and subsequent reinvestments would also increase the Portfolio’s turnover rate. Prepayment risk is moderate for the Portfolio because it invests only a portion of its assets in mortgage-backed securities.
• Extension risk, which is the chance that during periods of rising interest rates, certain debt securities will be paid off substantially more slowly than originally anticipated, and the value of those securities may fall. For funds that invest in mortgage-backed securities, extension risk is the chance that during periods of rising interest rates, homeowners will repay their mortgages at slower rates.
• Credit risk, which is the chance that a bond issuer will fail to pay interest or principal in a timely manner, or that negative perceptions of the issuer’s ability to make such payments will cause the price of that bond to decline. Credit risk should be low for the Portfolio because it purchases only bonds that are of investment-grade quality.
• Index sampling risk, which is the chance that the securities selected for the Portfolio, in the aggregate, will not provide investment performance matching that of the Portfolio’s target index. Index sampling risk for the Portfolio is expected to be low.
• Liquidity risk, which is the chance that the Portfolio may not be able to sell a security in a timely manner at a desired price.
An investment in the Portfolio is not a deposit of a bank and is not insured or guaranteed by the Federal Deposit Insurance Corporation or any other government agency.
Annual Total ReturnsThe following bar chart and table are intended to help you understand the risks of investing in the Portfolio. The bar chart shows how the performance of the Portfolio has varied from one calendar year to another over the periods shown. The table shows how the average annual total returns of the Portfolio compare with those of its target index and other comparative indexes, which have investment characteristics similar to those of the Portfolio. The Portfolio’s returns are net of its expenses, but do not reflect additional fees and expenses that are deducted by the annuity or life insurance program through which you invest. If such fees and expenses were included in the calculation of the Portfolio’s returns, the returns would be lower. Keep in mind that the Portfolio’s past performance does not indicate how the Portfolio will perform in the future. Updated performance information is available on our website for Financial Advisors at advisors.vanguard.com or by calling Vanguard toll-free at 800-522-5555.
During the periods shown in the bar chart, the highest return for a calendar quarter was 4.40% (quarter ended December 31, 2008), and the lowest return for a quarter was –3.21% (quarter ended December 31, 2016).
Annual Total Returns — Total Bond Market Index Portfolio
Average Annual Total Returns for Periods Ended December 31, 2017
1 Year 5 Years 10 Years
Total Bond Market Index Portfolio 3.57% 1.96% 3.89%
Comparative Indexes(reflect no deduction for fees or expenses)
Bloomberg Barclays U.S. Aggregate Bond Index 3.54% 2.10% 4.01%
Bloomberg Barclays U.S. Aggregate Float Adjusted Index 3.63 2.10 —
Spliced Bloomberg Barclays U.S. Aggregate Float Adjusted Index 3.63 2.10 4.03
5.23 5.94 6.50 7.65 4.02
-2.29
5.89 0.33 2.47 3.57
60%
40%
20%
0%
-20%
-40%
-60%
2008 2009 2010 2011 2012 2013 2014 2015 2016 2017

8
Investment AdvisorThe Vanguard Group, Inc. (Vanguard)
Portfolio Managers
William D. Baird, Portfolio Manager at Vanguard. He has co-managed the Portfolio since 2008.
Joshua C. Barrickman, CFA, Principal of Vanguard and head of Vanguard’s Fixed Income Indexing Americas. He has co-managed the Portfolio since 2013.
Tax InformationThe Portfolio normally distributes its net investment income and net realized capital gains, if any, to its shareholders, which are the insurance company separate accounts that sponsor your variable annuity or variable life insurance contract. The tax consequences to you of your investment in the Portfolio depend on the provisions of the annuity or life insurance contract through which you invest. For more information on taxes, please refer to the prospectus of the annuity or life insurance contract through which Portfolio shares are offered.
Payments to Financial IntermediariesThe Portfolio and its investment advisor do not pay financial intermediaries for sales of Portfolio shares.
Global Bond Index Portfolio
Investment ObjectiveThe Portfolio seeks to track the performance of a benchmark index that measures the investment return of the global, investment-grade, fixed income market.
Fees and ExpensesThe following table describes the fees and expenses you may pay if you buy and hold shares of the Portfolio. The expenses shown in the table and in the example that follows do not reflect additional fees and expenses associated with the annuity or life insurance program through which you invest. If those additional fees and expenses were included, overall expenses would be higher.
Example
The following example is intended to help you compare the cost of investing in the Portfolio (based on the fees and expenses of the underlying funds) with the cost of investing in other mutual funds. It illustrates the hypothetical expenses that you would incur over various periods if you were to invest $10,000 in the Portfolio’s shares. This example assumes that the Portfolio provides a return of 5% each year and that total annual operating expenses of the Portfolio and its underlying funds remain as stated in the preceding table. You would incur these hypothetical expenses whether or not you redeem your investment at the end of the given period. Although your actual costs may be higher or lower, based on these assumptions your costs would be:
Annual Portfolio Operating Expenses(Expenses that you pay each year as a percentage of the value of your investment)
Management Fees None
12b-1 Distribution Fee None
Other Expenses None
Acquired Fund Fees and Expenses 0.14%
Total Annual Operating Expenses 0.14%
1 Year 3 Years 5 Years 10 Years
$14 $45 $79 $179

9
Portfolio Turnover
The Portfolio may pay transaction costs, such as purchase fees, when it buys and sells securities (or “turns over” its portfolio). A higher portfolio turnover rate may indicate higher transaction costs. These costs, which are not reflected in annual portfolio operating expenses or in the previous expense example, reduce the Portfolio’s performance. During the fiscal period from September 7, 2017, to December 31, 2017, the Portfolio’s turnover rate was 8% of the average value of its portfolio.
Principal Investment StrategiesThe Portfolio invests in a mix of Vanguard mutual funds and Vanguard Variable Insurance Fund (VVIF) portfolios (underlying funds) according to an asset-allocation strategy that reflects an allocation of approximately 70% of the Portfolio’s assets to domestic fixed income securities and 30% to non-U.S. fixed income securities. Through this asset allocation strategy, the Portfolio seeks to track the investment performance of a composite index consisting of 70% Bloomberg Barclays U.S. Aggregate Float Adjusted Index and 30% Bloomberg Barclays Global Aggregate ex-USD Float Adjusted RIC Capped Index (USD Hedged). The Portfolio is currently able to employ this strategy by investing in one Vanguard mutual fund and one VVIF portfolio.
The Portfolio’s indirect fixed income holdings are a diversified mix of short-, intermediate-, and long-term U.S. government, U.S. agency, and investment-grade U.S. corporate bonds; mortgage-backed and asset-backed securities; and government, agency, corporate, and investment-grade foreign bonds issued in currencies other than the U.S. dollar (but hedged by Vanguard, typically with foreign currency exchange forward contracts, to minimize foreign currency exposure).
Under normal circumstances, the Portfolio will invest at least 80%, and usually all or substantially all, of its assets in underlying funds that together seek to track the Portfolio’s target index.
The Portfolio’s board of trustees may change the mix of underlying funds or the targeted allocation to the underlying asset classes and index without shareholder approval.
Principal RisksAn investment in the Portfolio could lose money over short or long periods of time. You should expect the Portfolio’s share price and total return to fluctuate within a wide range, like the fluctuations of the global fixed income market. The Portfolio is subject to the following risks, which could affect the Portfolio’s performance:
• Interest rate risk, which is the chance that bond prices will decline because of rising interest rates. Interest rate risk should be moderate for the Portfolio because the underlying funds primarily invest in short- and intermediate-term bonds, whose prices are less sensitive to interest rate changes.
• Credit risk, which is the chance that the issuer of a security will fail to pay interest or principal in a timely manner, or that negative perceptions of the issuer’s ability to make such payments will cause the price of that security to decline, thus reducing an underlying fund’s return.
• Income risk, which is the chance that an underlying fund’s income will decline because of falling interest rates. Income risk is generally high for short-term bond funds and moderate for intermediate-term bond funds, so investors should expect the Portfolio’s monthly income to fluctuate accordingly.
• Call risk, which is the chance that during periods of falling interest rates, issuers of callable bonds may call (redeem) securities with higher coupon rates or interest rates before their maturity dates. An underlying fund would then lose any price appreciation above the bond’s call price and would be forced to reinvest the unanticipated proceeds at lower interest rates, which may reduce the Portfolio’s income.
• Country/regional risk, which is the chance that world events—such as political upheaval, financial troubles, or natural disasters—will adversely affect the value or liquidity of securities issued by foreign governments, government agencies, or companies. Because an underlying fund may invest a large portion of its assets in bonds of issuers located in any one country or region, the Portfolio’s performance may be hurt disproportionately by the poor performance of the underlying fund’s investments in that area.
• Currency hedging risk, which is the chance that the currency hedging transactions entered into by the underlying international bond fund may not perfectly offset the funds’ foreign currency exposure.
• Nondiversification risk, which is the chance that the Portfolio’s performance may be hurt disproportionately by the poor performance of bonds issued by just a few issuers or even a single issuer. One of the underlying funds is considered nondiversified, which means that it may invest a significant percentage of its assets in bonds issued by a small number of issuers.

10
An investment in the Portfolio is not a deposit of a bank and is not insured or guaranteed by the Federal Deposit Insurance Corporation or any other government agency.
Annual Total ReturnsThe Portfolio has not been in operation long enough to report a full calendar-year return. Performance information is available on our website at vanguard.com/performance or by calling Vanguard toll-free at 800-662-7447.
Investment AdvisorThe Vanguard Group, Inc. (Vanguard)
Portfolio Manager
Joshua C. Barrickman, CFA, Principal of Vanguard and head of Vanguard’s Fixed Income Indexing Americas. He has managed the Portfolio since its inception in 2017.
Tax InformationThe Portfolio normally distributes its net investment income and net realized capital gains, if any, to its shareholders, which are the insurance company separate accounts that sponsor your variable annuity or variable life insurance contract. The tax consequences to you of your investment in the Portfolio depend on the provisions of the annuity or life insurance contract through which you invest. For more information on taxes, please refer to the prospectus of the annuity or life insurance contract through which Portfolio shares are offered.
Payments to Financial IntermediariesThe Portfolio and its investment advisor do not pay financial intermediaries for sales of Portfolio shares.
High Yield Bond Portfolio
Investment ObjectiveThe Portfolio seeks to provide a high level of current income.
Fees and ExpensesThe following table describes the fees and expenses you may pay if you buy and hold shares of the Portfolio. The expenses shown in the table and in the example that follows do not reflect additional fees and expenses associated with the annuity or life insurance program through which you invest. If those additional fees and expenses were included, overall expenses would be higher.
Example
The following example is intended to help you compare the cost of investing in the Portfolio with the cost of investing in other mutual funds. It illustrates the hypothetical expenses that you would incur over various periods if you were to invest $10,000 in the Portfolio’s shares. This example assumes that the Portfolio provides a return of 5% each year and that total annual portfolio operating expenses remain as stated in the preceding table. You would incur these hypothetical expenses whether or not you redeem your investment at the end of the given period. Although your actual costs may be higher or lower, based on these assumptions your costs would be:
Annual Portfolio Operating Expenses(Expenses that you pay each year as a percentage of the value of your investment)
Management Fees 0.25%
12b-1 Distribution Fee None
Other Expenses 0.03%
Total Annual Operating Expenses 0.28%
1 Year 3 Years 5 Years 10 Years
$29 $90 $157 $356

11
Portfolio Turnover
The Portfolio pays transaction costs, such as commissions, when it buys and sells securities (or “turns over” its portfolio). A higher portfolio turnover rate may indicate higher transaction costs. These costs, which are not reflected in annual portfolio operating expenses or in the previous expense example, reduce the Portfolio’s performance. During the most recent fiscal year, the Portfolio’s turnover rate was 28% of the average value of its portfolio.
Principal Investment StrategiesThe Portfolio invests primarily in a diversified group of high-yielding, higher-risk corporate bonds—commonly known as “junk bonds”—with medium- and lower-range credit-quality ratings. Under normal circumstances, the Portfolio invests at least 80% of its assets in corporate bonds that are rated below Baa by Moody’s Investors Service, Inc. (Moody’s); have an equivalent rating by any other independent bond-rating agency; or, if unrated, are determined to be of comparable quality by the Portfolio’s advisor. The Portfolio’s 80% policy may be changed only upon 60 days’ notice to shareholders.
The Portfolio may not invest more than 20% of its assets in any of the following, taken as a whole: bonds with credit ratings lower than B or the equivalent, convertible securities, preferred stocks, and fixed and floating rate loans of medium- to lower-range credit quality. The loans in which the Portfolio may invest will be rated Baa or below by Moody’s; have an equivalent rating by any other independent bond-rating agency; or, if unrated, are determined to be of comparable quality by the Portfolio’s advisor. The Portfolio’s high-yield bonds and loans have mostly short- and intermediate-term maturities.
Principal RisksAn investment in the Portfolio could lose money over short or long periods of time. You should expect the Portfolio’s share price and total return to fluctuate within a wide range. The Portfolio is subject to the following risks, which could affect the Portfolio’s performance:
• Credit risk, which is the chance that a bond or loan issuer will fail to pay interest or principal in a timely manner or that negative perceptions of the issuer’s ability to make such payments will cause the price of that bond or loan to decline. Credit risk should be high for the Portfolio because it invests primarily in bonds and loans with medium- and lower-range credit-quality ratings.
• Income risk, which is the chance that the Portfolio’s income will decline because of falling interest rates. Income risk is generally high for short-term bond funds and moderate for intermediate-term bond funds, so investors should expect the Portfolio’s monthly income to fluctuate accordingly.
• Call risk, which is the chance that during periods of falling interest rates, issuers of callable bonds may call (redeem) securities with higher coupon rates or interest rates before their maturity dates. The Portfolio would then lose any price appreciation above the bond’s call price and would be forced to reinvest the unanticipated proceeds at lower interest rates, resulting in a decline in the Portfolio’s income. Such redemptions and subsequent reinvestments would also increase the Portfolio’s turnover rate. Call risk should be moderate for the Portfolio because it invests only a portion of its assets in callable bonds.
• Interest rate risk, which is the chance that bond or loan prices will decline because of rising interest rates. Interest rate risk should be moderate for the Portfolio because it invests primarily in short- and intermediate-term bonds, whose prices are less sensitive to interest rate changes than are the prices of long-term bonds.
• Liquidity risk, which is the chance that the Portfolio may not be able to sell a security in a timely manner at a desired price. Liquidity risk is high for the Portfolio because of the intermediate duration and lower credit quality of the bonds.
• Manager risk, which is the chance that poor security selection will cause the Portfolio to underperform relevant benchmarks or other funds with a similar investment objective. In addition, significant investment in the communication sector subjects the portfolio to proportionately higher exposure to the risks of this sector.
Because of the speculative nature of junk bonds, you should carefully consider the risks associated with this portfolio.
An investment in the Portfolio is not a deposit of a bank and is not insured or guaranteed by the Federal Deposit Insurance Corporation or any other government agency.

12
Annual Total ReturnsThe following bar chart and table are intended to help you understand the risks of investing in the Portfolio. The bar chart shows how the performance of the Portfolio has varied from one calendar year to another over the periods shown. The table shows how the average annual total returns of the Portfolio compare with those of a relevant market index and a composite index, which have investment characteristics similar to those of the Portfolio. The Portfolio’s returns are net of its expenses but do not reflect additional fees and expenses that are deducted by the annuity or life insurance program through which you invest. If such fees and expenses were included in the calculation of the Portfolio’s returns, the returns would be lower. Keep in mind that the Portfolio’s past performance does not indicate how the Portfolio will perform in the future. Updated performance information is available on our website for Financial Advisors at advisors.vanguard.com or by calling Vanguard toll-free at 800-522-5555.
During the periods shown in the bar chart, the highest return for a calendar quarter was 14.41% (quarter ended June 30, 2009), and the lowest return for a quarter was –14.60% (quarter ended December 31, 2008).
Investment AdvisorWellington Management Company LLP (Wellington Management)
Portfolio Manager
Michael L. Hong, CFA, Managing Director and Fixed Income Portfolio Manager of Wellington Management. He has managed the Portfolio since 2008.
Tax InformationThe Portfolio normally distributes its net investment income and net realized capital gains, if any, to its shareholders, which are the insurance company separate accounts that sponsor your variable annuity or variable life insurance contract. The tax consequences to you of your investment in the Portfolio depend on the provisions of the annuity or life insurance contract through which you invest. For more information on taxes, please refer to the prospectus of the annuity or life insurance contract through which Portfolio shares are offered.
Payments to Financial IntermediariesThe Portfolio and its investment advisor do not pay financial intermediaries for sales of Portfolio shares.
Annual Total Returns — High Yield Bond Portfolio
Average Annual Total Returns for Periods Ended December 31, 2017
1 Year 5 Years 10 Years
High Yield Bond Portfolio 7.00% 5.02% 6.61%
Comparative Indexes(reflect no deduction for fees or expenses)
Bloomberg Barclays U.S. Corporate High Yield Bond Index 7.50% 5.78% 8.03%
High-Yield Corporate Composite Index 6.60 5.22 7.18
-21.95
38.85
12.10 6.9314.30
4.35 4.40
-1.58
11.35 7.00
60%
40%
20%
0%
-20%
-40%
-60%
2008 2009 2010 2011 2012 2013 2014 2015 2016 2017

13
Conservative Allocation Portfolio
Investment ObjectiveThe Portfolio seeks to provide current income and low to moderate capital appreciation.
Fees and ExpensesThe following table describes the fees and expenses you may pay if you buy and hold shares of the Portfolio. The expenses shown in the table and in the example that follows do not reflect additional fees and expenses associated with the annuity or life insurance program through which you invest. If those additional fees and expenses were included, overall expenses would be higher.
Example
The following example is intended to help you compare the cost of investing in the Portfolio (based on the fees and expenses of the underlying funds) with the cost of investing in other mutual funds. It illustrates the hypothetical expenses that you would incur over various periods if you were to invest $10,000 in the Portfolio’s shares. This example assumes that the Portfolio provides a return of 5% each year and that total annual operating expenses of the Portfolio and its underlying funds remain as stated in the preceding table. You would incur these hypothetical expenses whether or not you redeem your investment at the end of the given period. Although your actual costs may be higher or lower, based on these assumptions your costs would be:
Portfolio Turnover
The Portfolio may pay transaction costs, such as purchase fees, when it buys and sells securities (or “turns over” its portfolio). A higher portfolio turnover rate may indicate higher transaction costs. These costs, which are not reflected in annual portfolio operating expenses or in the previous expense example, reduce the Portfolio’s performance. During the most recent fiscal year, the Portfolio’s turnover rate was 19% of the average value of its portfolio.
Principal Investment StrategiesThe Portfolio invests in a mix of Vanguard mutual funds and other portfolios of Vanguard Variable Insurance Fund (collectively, the underlying funds) according to an asset-allocation strategy that reflects an allocation of approximately 60% of the Portfolio’s assets to fixed income securities and 40% to common stocks. The targeted percentage of the Portfolio’s assets allocated to the underlying asset classes is:
• U.S. fixed income securities 42%
• Large-cap U.S. stocks 20%
• Foreign stocks 16%
• Foreign fixed income securities 18%
• Small- and mid-cap U.S. stocks 4%
The Portfolio’s indirect fixed income holdings are a diversified mix of short-, intermediate-, and long-term U.S. government, U.S. agency, and investment-grade U.S. corporate bonds; mortgage-backed and asset-backed securities; and government, agency, corporate, and investment-grade foreign bonds issued in currencies other than the U.S. dollar (but hedged by Vanguard, typically with foreign currency exchange forward contracts, to minimize foreign currency exposure). The Portfolio’s indirect stock holdings are a diversified mix of U.S. and foreign large-, mid-, and small-capitalization stocks.
Annual Portfolio Operating Expenses(Expenses that you pay each year as a percentage of the value of your investment)
Management Fees None
12b-1 Distribution Fee None
Other Expenses None
Acquired Fund Fees and Expenses 0.14%
Total Annual Operating Expenses 0.14%
1 Year 3 Years 5 Years 10 Years
$14 $45 $79 $179

14
The Portfolio uses its investment in large-cap U.S. stocks and small- and mid-cap U.S. stocks to gain exposure to the overall domestic stock market. While the percentage of the Portfolio’s assets invested in either of these two asset classes may deviate slightly from the target allocation, the combination of the two asset classes will equal approximately 24% of the Portfolio’s assets in the aggregate.
The Portfolio’s board of trustees may change the targeted allocation to the underlying asset classes without shareholder approval.
Principal RisksThe Portfolio is subject to the risks associated with the stock and bond markets, any of which could cause an investor to lose money. However, because fixed income securities such as bonds usually are less volatile than stocks and because the Portfolio invests more than half of its assets in fixed income securities, the Portfolio’s overall level of risk should be low to moderate.
• With a target allocation of approximately 60% of its assets to fixed income securities, the Portfolio is proportionately subject to bond risks, including the following: interest rate risk, which is the chance that bond prices will decline because of rising interest rates; credit risk, which is the chance that the issuer of a security will fail to pay interest or principal in a timely manner, or that negative perceptions of the issuer’s ability to make such payments will cause the price of that security to decline, thus reducing the underlying fund’s return; and income risk, which is the chance that an underlying fund’s income will decline because of falling interest rates. If an underlying fund holds securities that are callable, the underlying fund’s income may decline because of call risk, which is the chance that during periods of falling interest rates, issuers of callable bonds may call (redeem) securities with higher coupon rates or interest rates before their maturity dates. An underlying fund would then lose any price appreciation above the bond’s call price and would be forced to reinvest the unanticipated proceeds at lower interest rates, resulting in a decline in the underlying fund’s income. For mortgage-backed securities, this risk is known as prepayment risk. The Portfolio is also subject to the following risks associated with investments in currency-hedged foreign bonds: country/regional risk, which is the chance that world events—such as political upheaval, financial troubles, or natural disasters—will adversely affect the value and/or liquidity of securities issued by foreign governments, government agencies, or companies; and currency hedging risk, which is the chance that the currency hedging transactions entered into by the underlying foreign fixed income securities fund may not perfectly offset the fund’s foreign currency exposure.
• With approximately 40% of its assets allocated to stocks, the Portfolio is proportionately subject to stock market risk, which is the chance that stock prices overall will decline. Stock markets tend to move in cycles, with periods of rising prices and periods of falling prices. The Portfolio is also subject to the following risks associated with investments in foreign stocks: country/regional risk, which is the chance that world events—such as political upheaval, financial troubles, or natural disasters—will adversely affect the value of securities issued by companies in foreign countries or regions; and currency risk, which is the chance that the value of a foreign investment, measured in U.S. dollars, will decrease because of unfavorable changes in currency exchange rates. Country/regional risk and currency risk are especially high in emerging markets.
• Asset allocation risk, which is the chance that the selection of underlying funds, and the allocation of assets to them, will cause the Portfolio to underperform other portfolios with a similar investment objective.
An investment in the Portfolio is not a deposit of a bank and is not insured or guaranteed by the Federal Deposit Insurance Corporation or any other government agency.
Annual Total ReturnsThe following bar chart and table are intended to help you understand the risks of investing in the Portfolio. The bar chart shows how the performance of the Portfolio has varied from one calendar year to another over the periods shown. The table shows how the average annual total returns of the Portfolio compare with those of a relevant market index and other comparative benchmarks, which have investment characteristics similar to those of the Portfolio. The Portfolio’s returns are net of its expenses, but do not reflect additional fees and expenses that are deducted by the annuity or life insurance program through which you invest. If such fees and expenses were included in the calculation of the Portfolio’s returns, the returns would be lower. Returns for the Variable Insurance Mixed-Asset Target Allocation Conservative Funds Average are derived from data provided by Lipper, a Thomson Reuters Company. Keep in mind that the Portfolio’s past performance does not indicate how the Portfolio will perform in the future. Updated performance information is available on our website for Financial Advisors at advisors.vanguard.com or by calling Vanguard toll-free at 800-522-5555.

15
During the periods shown in the bar chart, the highest return for a calendar quarter was 5.03% (quarter ended March 31, 2012), and the lowest return for a quarter was –2.63% (quarter ended September 30, 2015).
Investment AdvisorThe Vanguard Group, Inc. (Vanguard)
Portfolio Managers
William Coleman, CFA, Portfolio Manager at Vanguard. He has co-managed the Portfolio since 2013.
Walter Nejman, Portfolio Manager at Vanguard. He has co-managed the Portfolio since 2013.
Tax InformationThe Portfolio normally distributes its net investment income and net realized capital gains, if any, to its shareholders, which are the insurance company separate accounts that sponsor your variable annuity or variable life insurance contract. The tax consequences to you of your investment in the Portfolio depend on the provisions of the annuity or life insurance contract through which you invest. For more information on taxes, please refer to the prospectus of the annuity or life insurance contract through which Portfolio shares are offered.
Payments to Financial IntermediariesThe Portfolio and its investment advisor do not pay financial intermediaries for sales of Portfolio shares.
Moderate Allocation Portfolio
Investment ObjectiveThe Portfolio seeks to provide capital appreciation and a low to moderate level of current income.
Fees and ExpensesThe following table describes the fees and expenses you may pay if you buy and hold shares of the Portfolio. The expenses shown in the table and in the example that follows do not reflect additional fees and expenses associated with the annuity or life insurance program through which you invest. If those additional fees and expenses were included, overall expenses would be higher.
Annual Total Returns — Conservative Allocation Portfolio
Average Annual Total Returns for Periods Ended December 31, 2017
1 Year 5 Years
SinceInception(Oct. 19,
2011)
Conservative Allocation Portfolio 10.89% 6.55% 7.14%
Comparative Benchmarks(reflect no deduction for fees or expenses)
Bloomberg Barclays U.S. Aggregate Float Adjusted Index 3.63% 2.10% 2.65%
Conservative Allocation Composite Index 10.95 6.74 7.30
Variable Insurance Mixed-Asset Target Allocation Conservative Funds Average 8.97 4.93 5.70
9.25 9.06 6.91 0.20 6.02 10.89
60%
40%
20%
0%
-20%
-40%
-60%
2012 2013 2014 2015 2016 2017

16
Example
The following example is intended to help you compare the cost of investing in the Portfolio (based on the fees and expenses of the underlying funds) with the cost of investing in other mutual funds. It illustrates the hypothetical expenses that you would incur over various periods if you were to invest $10,000 in the Portfolio’s shares. This example assumes that the Portfolio provides a return of 5% each year and that total annual operating expenses of the Portfolio and its underlying funds remain as stated in the preceding table. You would incur these hypothetical expenses whether or not you redeem your investment at the end of the given period. Although your actual costs may be higher or lower, based on these assumptions your costs would be:
Portfolio Turnover
The Portfolio may pay transaction costs, such as purchase fees, when it buys and sells securities (or “turns over” its portfolio). A higher portfolio turnover rate may indicate higher transaction costs. These costs, which are not reflected in annual portfolio operating expenses or in the previous expense example, reduce the Portfolio’s performance. During the most recent fiscal year, the Portfolio’s turnover rate was 21% of the average value of its portfolio.
Principal Investment StrategiesThe Portfolio invests in a mix of Vanguard mutual funds and other portfolios of Vanguard Variable Insurance Fund (collectively, the underlying funds) according to an asset-allocation strategy that reflects an allocation of approximately 60% of the Portfolio’s assets to common stocks and 40% to fixed income securities. The targeted percentage of the Portfolio’s assets allocated to the underlying asset classes is:
• Large-cap U.S. stocks 30%
• U.S. fixed-income securities 28%
• Foreign stocks 24%
• Foreign fixed income securities 12%
• Small- and mid-cap U.S. stocks 6%
The Portfolio’s indirect stock holdings are a diversified mix of U.S. and foreign large-, mid-, and small-capitalization stocks. The Portfolio’s indirect fixed income holdings are a diversified mix of short-, intermediate-, and long-term U.S. government, U.S. agency, and investment-grade U.S. corporate bonds; mortgage-backed and asset-backed securities; and government, agency, corporate, and investment-grade foreign bonds issued in currencies other than the U.S. dollar (but hedged by Vanguard, typically with foreign currency exchange forward contracts, to minimize foreign currency exposure).
The Portfolio uses its investment in large-cap U.S. stocks and small- and mid-cap U.S. stocks to gain exposure to the overall domestic stock market. While the percentage of the Portfolio’s assets invested in either of these two asset classes may deviate slightly from the target allocation, the combination of the two asset classes will equal approximately 36% of the Portfolio’s assets in the aggregate.
The Portfolio’s board of trustees may change the targeted allocation to the underlying asset classes without shareholder approval.
Annual Portfolio Operating Expenses(Expenses that you pay each year as a percentage of the value of your investment)
Management Fees None
12b-1 Distribution Fee None
Other Expenses None
Acquired Fund Fees and Expenses 0.14%
Total Annual Operating Expenses 0.14%
1 Year 3 Years 5 Years 10 Years
$14 $45 $79 $179

17
Principal RisksThe Portfolio is subject to the risks associated with the stock and bond markets, any of which could cause an investor to lose money. However, because fixed income securities such as bonds usually are less volatile than stocks and because the Portfolio invests a significant portion of its assets in fixed income securities, the Portfolio’s overall level of risk should be moderate.
• With approximately 60% of its assets allocated to stocks, the Portfolio is proportionately subject to stock market risk, which is the chance that stock prices overall will decline. Stock markets tend to move in cycles, with periods of rising prices and periods of falling prices. The Portfolio is also subject to the following risks associated with investments in foreign stocks: country/regional risk, which is the chance that world events—such as political upheaval, financial troubles, or natural disasters—will adversely affect the value of securities issued by companies in foreign countries and regions; and currency risk, which is the chance that the value of a foreign investment, measured in U.S. dollars, will decrease because of unfavorable changes in currency exchange rates. Country/regional risk and currency risk are especially high in emerging markets.
• With a target allocation of approximately 40% of its assets to fixed income securities, the Portfolio is proportionately subject to bond risks, including the following: interest rate risk, which is the chance that bond prices will decline because of rising interest rates; credit risk, which is the chance that the issuer of a security will fail to pay interest or principal in a timely manner, or that negative perceptions of the issuer’s ability to make such payments will cause the price of that security to decline, thus reducing the underlying fund’s return; and income risk, which is the chance that an underlying fund’s income will decline because of falling interest rates. If an underlying fund holds securities that are callable, the underlying fund’s income may decline because of call risk, which is the chance that during periods of falling interest rates, issuers of callable bonds may call (redeem) securities with higher coupon rates or interest rates before their maturity dates. An underlying fund would then lose any price appreciation above the bond’s call price and would be forced to reinvest the unanticipated proceeds at lower interest rates, resulting in a decline in the underlying fund’s income. For mortgage-backed securities, this risk is known as prepayment risk. The Portfolio is also subject to the following risks associated with investments in currency-hedged foreign bonds: country/regional risk, which is the chance that world events—such as political upheaval, financial troubles, or natural disasters—will adversely affect the value and/or liquidity of securities issued by foreign governments, government agencies, or companies; and currency hedging risk, which is the chance that the currency hedging transactions entered into by the underlying foreign fixed income securities fund may not perfectly offset the fund’s foreign currency exposure.
• Asset allocation risk, which is the chance that the selection of underlying funds, and the allocation of assets to them, will cause the Portfolio to underperform other portfolios with a similar investment objective.
An investment in the Portfolio is not a deposit of a bank and is not insured or guaranteed by the Federal Deposit Insurance Corporation or any other government agency.
Annual Total ReturnsThe following bar chart and table are intended to help you understand the risks of investing in the Portfolio. The bar chart shows how the performance of the Portfolio has varied from one calendar year to another over the periods shown. The table shows how the average annual total returns of the Portfolio compare with those of a relevant market index and other comparative benchmarks, which have investment characteristics similar to those of the Portfolio. The Portfolio’s returns are net of its expenses, but do not reflect additional fees and expenses that are deducted by the annuity or life insurance program through which you invest. If such fees and expenses were included in the calculation of the Portfolio’s returns, the returns would be lower. Returns for the Variable Insurance Mixed-Asset Target Allocation Moderate Funds Average are derived from data provided by Lipper, a Thomson Reuters Company. Keep in mind that the Portfolio’s past performance does not indicate how the Portfolio will perform in the future. Updated performance information is available on our website for Financial Advisors at advisors.vanguard.com or by calling Vanguard toll-free at 800-522-5555.

18
During the periods shown in the bar chart, the highest return for a calendar quarter was 7.52% (quarter ended March 31, 2012), and the lowest return for a quarter was –4.64% (quarter ended September 30, 2015).
Investment AdvisorThe Vanguard Group, Inc. (Vanguard)
Portfolio Managers
William Coleman, CFA, Portfolio Manager at Vanguard. He has co-managed the Portfolio since 2013.
Walter Nejman, Portfolio Manager at Vanguard. He has co-managed the Portfolio since 2013.
Tax InformationThe Portfolio normally distributes its net investment income and net realized capital gains, if any, to its shareholders, which are the insurance company separate accounts that sponsor your variable annuity or variable life insurance contract. The tax consequences to you of your investment in the Portfolio depend on the provisions of the annuity or life insurance contract through which you invest. For more information on taxes, please refer to the prospectus of the annuity or life insurance contract through which Portfolio shares are offered.
Payments to Financial IntermediariesThe Portfolio and its investment advisor do not pay financial intermediaries for sales of Portfolio shares.
Balanced Portfolio
Investment ObjectiveThe Portfolio seeks to provide long-term capital appreciation and reasonable current income.
Fees and ExpensesThe following table describes the fees and expenses you may pay if you buy and hold shares of the Portfolio. The expenses shown in the table and in the example that follows do not reflect additional fees and expenses associated with the annuity or life insurance program through which you invest. If those additional fees and expenses were included, overall expenses would be higher.
Annual Total Returns — Moderate Allocation Portfolio
Average Annual Total Returns for Periods Ended December 31, 2017
1 Year 5 Years
SinceInception(Oct. 19,
2011)
Moderate Allocation Portfolio 14.80% 8.70% 9.31%
Comparative Benchmarks(reflect no deduction for fees or expenses)
Dow Jones U.S. Total Stock Market Float Adjusted Index 21.16% 15.52% 15.96%
Moderate Allocation Composite Index 14.88 8.90 9.48
Variable Insurance Mixed-Asset Target Allocation Moderate Funds Average 13.23 7.36 8.09
11.84 15.027.03
-0.16
7.5514.80
60%
40%
20%
0%
-20%
-40%
-60%
2012 2013 2014 2015 2016 2017

19
Example
The following example is intended to help you compare the cost of investing in the Portfolio with the cost of investing in other mutual funds. It illustrates the hypothetical expenses that you would incur over various periods if you were to invest $10,000 in the Portfolio’s shares. This example assumes that the Portfolio provides a return of 5% each year and that total annual portfolio operating expenses remain as stated in the preceding table. You would incur these hypothetical expenses whether or not you redeem your investment at the end of the given period. Although your actual costs may be higher or lower, based on these assumptions your costs would be:
Portfolio Turnover
The Portfolio pays transaction costs, such as commissions, when it buys and sells securities (or “turns over” its portfolio). A higher portfolio turnover rate may indicate higher transaction costs. These costs, which are not reflected in annual portfolio operating expenses or in the previous expense example, reduce the Portfolio’s performance. During the most recent fiscal year, the Portfolio’s turnover rate was 28% of the average value of its portfolio.
Principal Investment StrategiesThe Portfolio invests 60% to 70% of its assets in dividend-paying and, to a lesser extent, non-dividend-paying common stocks of established large companies. In choosing these companies, the advisor seeks those that appear to be undervalued but have prospects for improvement. These stocks are commonly referred to as value stocks. The remaining 30% to 40% of the Portfolio’s assets are invested mainly in fixed income securities that the advisor believes will generate a reasonable level of current income. These securities include investment-grade corporate bonds, with some exposure to U.S. Treasury and government agency bonds, and mortgage-backed securities.
Principal RisksThe Portfolio is subject to the risks associated with the stock and bond markets, any of which could cause an investor to lose money. However, because stock and bond prices can move in different directions or to different degrees, the Portfolio’s bond holdings may counteract some of the volatility experienced by the Portfolio’s stock holdings.
• With approximately 60% to 70% of its assets allocated to stocks, the Portfolio is proportionately subject to the following stock risks: stock market risk, which is the chance that stock prices overall will decline; and investment style risk, which is the chance that returns from large-capitalization value stocks will trail returns from the overall stock market. Large-cap stocks tend to go through cycles of doing better—or worse—than other segments of the stock market or the stock market in general. These periods have, in the past, lasted for as long as several years.
• With approximately 30% to 40% of its assets allocated to bonds, the Portfolio is proportionately subject to the following bond risks: interest rate risk, which is the chance that bond prices will decline because of rising interest rates; income risk, which is the chance that the Portfolio’s income will decline because of falling interest rates; credit risk, which is the chance that a bond issuer will fail to pay interest or principal in a timely manner or that negative perceptions of the issuer’s ability to make such payments will cause the price of that bond to decline; liquidity risk, which is the chance that the Portfolio may not be able to sell a security in a timely manner at a desired price; and call risk, which is the chance that during periods of falling interest rates, issuers of callable bonds may call (redeem) securities with higher coupon rates or interest rates before their maturity dates. The Portfolio would then lose any price appreciation above the bond’s call price and would be forced to reinvest the unanticipated proceeds at lower interest rates, resulting in a decline in the Portfolio’s income. Such redemptions and subsequent reinvestments would also increase the Portfolio’s turnover rate. For mortgage-backed securities, this risk is known as prepayment risk.
Annual Portfolio Operating Expenses(Expenses that you pay each year as a percentage of the value of your investment)
Management Fees 0.21%
12b-1 Distribution Fee None
Other Expenses 0.02%
Total Annual Operating Expenses 0.23%
1 Year 3 Years 5 Years 10 Years
$24 $74 $130 $293

20
• The Portfolio is also subject to manager risk, which is the chance that poor security selection will cause the Portfolio to underperform relevant benchmarks or other funds with a similar investment objective. In addition, significant investment in the financial sector subjects the Portfolio to proportionately higher exposure to the risks of this sector.
An investment in the Portfolio is not a deposit of a bank and is not insured or guaranteed by the Federal Deposit Insurance Corporation or any other government agency.
Annual Total ReturnsThe following bar chart and table are intended to help you understand the risks of investing in the Portfolio. The bar chart shows how the performance of the Portfolio has varied from one calendar year to another over the periods shown. The table shows how the average annual total returns of the Portfolio compare with those of a relevant market index and a composite stock/bond index, which have investment characteristics similar to those of the Portfolio. The Portfolio’s returns are net of its expenses but do not reflect additional fees and expenses that are deducted by the annuity or life insurance program through which you invest. If such fees and expenses were included in the calculation of the Portfolio’s returns, the returns would be lower. Keep in mind that the Portfolio’s past performance does not indicate how the Portfolio will perform in the future. Updated performance information is available on our website for Financial Advisors at advisors.vanguard.com or by calling Vanguard toll-free at 800-522-5555.
During the periods shown in the bar chart, the highest return for a calendar quarter was 13.60% (quarter ended June 30, 2009), and the lowest return for a quarter was –10.86% (quarter ended December 31, 2008).
Investment AdvisorWellington Management Company LLP (Wellington Management)
Portfolio Managers
Edward P. Bousa, CFA, Senior Managing Director and Equity Portfolio Manager of Wellington Management. He has managed the stock portion of the Portfolio since 2003.
John C. Keogh, Senior Managing Director and Fixed Income Portfolio Manager of Wellington Management. He has managed the bond portion of the Portfolio since 2003 (co-managed since 2017).
Loren L. Moran, CFA, Managing Director and Fixed Income Portfolio Manager of Wellington Management. She has co-managed the bond portion of the Portfolio since 2017.
Michael E. Stack, CFA, Senior Managing Director and Fixed Income Portfolio Manager of Wellington Management. He has co-managed the bond portion of the Portfolio since 2017.
Annual Total Returns — Balanced Portfolio
Average Annual Total Returns for Periods Ended December 31, 2017
1 Year 5 Years 10 Years
Balanced Portfolio 14.72% 10.91% 7.55%
Comparative Indexes(reflect no deduction for fees or expenses)
Standard & Poor's 500 Index 21.83% 15.79% 8.50%
Composite Stock/Bond Index 15.76 11.24 7.46
-22.57
22.9011.02
3.7012.56 19.88
9.840.09
11.01 14.72
60%
40%
20%
0%
-20%
-40%
-60%
2008 2009 2010 2011 2012 2013 2014 2015 2016 2017

21
Tax InformationThe Portfolio normally distributes its net investment income and net realized capital gains, if any, to its shareholders, which are the insurance company separate accounts that sponsor your variable annuity or variable life insurance contract. The tax consequences to you of your investment in the Portfolio depend on the provisions of the annuity or life insurance contract through which you invest. For more information on taxes, please refer to the prospectus of the annuity or life insurance contract through which Portfolio shares are offered.
Payments to Financial IntermediariesThe Portfolio and its investment advisor do not pay financial intermediaries for sales of Portfolio shares.
Equity Income Portfolio
Investment ObjectiveThe Portfolio seeks to provide an above-average level of current income and reasonable long-term capital appreciation.
Fees and ExpensesThe following table describes the fees and expenses you may pay if you buy and hold shares of the Portfolio. The expenses shown in the table and in the example that follows do not reflect additional fees and expenses associated with the annuity or life insurance program through which you invest. If those additional fees and expenses were included, overall expenses would be higher.
Example
The following example is intended to help you compare the cost of investing in the Portfolio with the cost of investing in other mutual funds. It illustrates the hypothetical expenses that you would incur over various periods if you were to invest $10,000 in the Portfolio’s shares. This example assumes that the Portfolio provides a return of 5% each year and that total annual portfolio operating expenses remain as stated in the preceding table. You would incur these hypothetical expenses whether or not you redeem your investment at the end of the given period. Although your actual costs may be higher or lower, based on these assumptions your costs would be:
Portfolio Turnover
The Portfolio pays transaction costs, such as commissions, when it buys and sells securities (or “turns over” its portfolio). A higher portfolio turnover rate may indicate higher transaction costs. These costs, which are not reflected in annual portfolio operating expenses or in the previous expense example, reduce the Portfolio’s performance. During the most recent fiscal year, the Portfolio’s turnover rate was 38% of the average value of its portfolio.
Principal Investment StrategiesThe Portfolio invests mainly in common stocks of mid-size and large companies whose stocks pay above-average levels of dividend income and are considered to have the potential for capital appreciation. In addition, the advisors generally look for companies that they believe are committed to paying dividends consistently. Under normal circumstances, the Portfolio will invest at least 80% of its assets in equity securities. The Portfolio’s 80% policy may be changed only upon 60 days’ notice to shareholders. The Portfolio uses multiple investment advisors. Each advisor independently selects and maintains a portfolio of common stocks for the Portfolio.
Annual Portfolio Operating Expenses(Expenses that you pay each year as a percentage of the value of your investment)
Management Fees 0.29%
12b-1 Distribution Fee None
Other Expenses 0.02%
Total Annual Operating Expenses 0.31%
1 Year 3 Years 5 Years 10 Years
$32 $100 $174 $393

22
Principal RisksAn investment in the Portfolio could lose money over short or long periods of time. You should expect the Portfolio’s share price and total return to fluctuate within a wide range. The Portfolio is subject to the following risks, which could affect the Portfolio’s performance:
• Stock market risk, which is the chance that stock prices overall will decline. Stock markets tend to move in cycles, with periods of rising prices and periods of falling prices.
• Investment style risk, which is the chance that returns from mid- and large-capitalization dividend-paying value stocks will trail returns from the overall stock market. Mid- and large-cap stocks each tend to go through cycles of doing better—or worse—than other segments of the stock market or the stock market in general. These periods have, in the past, lasted for as long as several years. Historically, mid-cap stocks have been more volatile in price than large-cap stocks because, among other things, mid-size companies tend to be more sensitive to changing economic conditions.
• Asset concentration risk, which is the chance that, because the Portfolio tends to invest a high percentage of assets in its ten largest holdings, the Portfolio’s performance may be hurt disproportionately by the poor performance of relatively few stocks.
• Manager risk, which is the chance that poor security selection will cause the Portfolio to underperform relevant benchmarks or other funds with a similar investment objective.
An investment in the Portfolio is not a deposit of a bank and is not insured or guaranteed by the Federal Deposit Insurance Corporation or any other government agency.
Annual Total ReturnsThe following bar chart and table are intended to help you understand the risks of investing in the Portfolio. The bar chart shows how the performance of the Portfolio has varied from one calendar year to another over the periods shown. The table shows how the average annual total returns of the Portfolio compare with those of a relevant market index and other comparative benchmarks, which have investment characteristics similar to those of the Portfolio. The Portfolio’s returns are net of its expenses but do not reflect additional fees and expenses that are deducted by the annuity or life insurance program through which you invest. If such fees and expenses were included in the calculation of the Portfolio’s returns, the returns would be lower. Returns for the Variable Insurance Equity Income Funds Average are derived from data provided by Lipper, a Thomson Reuters Company. Keep in mind that the Portfolio’s past performance does not indicate how the Portfolio will perform in the future. Updated performance information is available on our website for Financial Advisors at advisors.vanguard.com or by calling Vanguard toll-free at 800-522-5555.
During the periods shown in the bar chart, the highest return for a calendar quarter was 15.14% (quarter ended September 30, 2009), and the lowest return for a quarter was –17.99% (quarter ended December 31, 2008).
Annual Total Returns — Equity Income Portfolio
Average Annual Total Returns for Periods Ended December 31, 2017
1 Year 5 Years 10 Years
Equity Income Portfolio 18.25% 14.73% 8.69%
Comparative Benchmarks(reflect no deduction for fees or expenses)
FTSE High Dividend Yield Index 16.51% 15.16% 8.70%
Spliced Equity Income Index 16.51 15.16 8.70
Variable Insurance Equity Income Funds Average 15.06 12.01 6.34
-30.91
16.77 14.71 10.27 13.4030.04
11.410.85
15.07 18.25
60%
40%
20%
0%
-20%
-40%
-60%
2008 2009 2010 2011 2012 2013 2014 2015 2016 2017

23
Investment AdvisorsWellington Management Company LLP (Wellington Management)
The Vanguard Group, Inc. (Vanguard)
Portfolio Managers
W. Michael Reckmeyer, III, CFA, Senior Managing Director and Equity Portfolio Manager of Wellington Management. He has managed a portion of the Portfolio since 2007.
James P. Stetler, Senior Portfolio Manager at Vanguard. He has managed a portion of the Portfolio since 2003 (co-managed since 2012).
Binbin Guo, Ph.D., Principal of Vanguard and head of the Alpha Equity Investment team within Vanguard’s Quantitative Equity Group. He has co-managed a portion of the Portfolio since 2016.
Tax InformationThe Portfolio normally distributes its net investment income and net realized capital gains, if any, to its shareholders, which are the insurance company separate accounts that sponsor your variable annuity or variable life insurance contract. The tax consequences to you of your investment in the Portfolio depend on the provisions of the annuity or life insurance contract through which you invest. For more information on taxes, please refer to the prospectus of the annuity or life insurance contract through which Portfolio shares are offered.
Payments to Financial IntermediariesThe Portfolio and its investment advisors do not pay financial intermediaries for sales of Portfolio shares.
Diversified Value Portfolio
Investment ObjectiveThe Portfolio seeks to provide long-term capital appreciation and income.
Fees and ExpensesThe following table describes the fees and expenses you may pay if you buy and hold shares of the Portfolio. The expenses shown in the table and in the example that follows do not reflect additional fees and expenses associated with the annuity or life insurance program through which you invest. If those additional fees and expenses were included, overall expenses would be higher.
Example
The following example is intended to help you compare the cost of investing in the Portfolio with the cost of investing in other mutual funds. It illustrates the hypothetical expenses that you would incur over various periods if you were to invest $10,000 in the Portfolio’s shares. This example assumes that the Portfolio provides a return of 5% each year and that total annual portfolio operating expenses remain as stated in the preceding table. You would incur these hypothetical expenses whether or not you redeem your investment at the end of the given period. Although your actual costs may be higher or lower, based on these assumptions your costs would be:
Annual Portfolio Operating Expenses(Expenses that you pay each year as a percentage of the value of your investment)
Management Fees 0.25%
12b-1 Distribution Fee None
Other Expenses 0.02%
Total Annual Operating Expenses 0.27%
1 Year 3 Years 5 Years 10 Years
$28 $87 $152 $343

24
Portfolio Turnover
The Portfolio pays transaction costs, such as commissions, when it buys and sells securities (or “turns over” its portfolio). A higher portfolio turnover rate may indicate higher transaction costs. These costs, which are not reflected in annual portfolio operating expenses or in the previous expense example, reduce the Portfolio’s performance. During the most recent fiscal year, the Portfolio’s turnover rate was 18% of the average value of its portfolio.
Principal Investment StrategiesThe Portfolio invests mainly in large- and mid-size companies whose stocks are considered by the advisor to be undervalued. Undervalued stocks are generally those that are out of favor with investors and that the advisor believes are trading at prices that are below average in relation to measures such as earnings and book value. These stocks often have above-average dividend yields.
Principal RisksAn investment in the Portfolio could lose money over short or long periods of time. You should expect the Portfolio’s share price and total return to fluctuate within a wide range. The Portfolio is subject to the following risks, which could affect the Portfolio’s performance:
• Stock market risk, which is the chance that stock prices overall will decline. Stock markets tend to move in cycles, with periods of rising prices and periods of falling prices.
• Investment style risk, which is the chance that returns from large- and mid-capitalization value stocks will trail returns from the overall stock market. Large- and mid-cap stocks each tend to go through cycles of doing better—or worse—than other segments of the stock market or the stock market in general. These periods have, in the past, lasted for as long as several years. Historically, mid-cap stocks have been more volatile in price than large-cap stocks because, among other things, mid-size companies tend to be more sensitive to changing economic conditions.
• Asset concentration risk, which is the chance that the Portfolio’s performance may be hurt disproportionately by the poor performance of relatively few stocks. The Portfolio tends to invest a high percentage of assets in its ten largest holdings.
• Manager risk, which is the chance that poor security selection will cause the Portfolio to underperform relevant benchmarks or other funds with a similar investment objective.
An investment in the Portfolio is not a deposit of a bank and is not insured or guaranteed by the Federal Deposit Insurance Corporation or any other government agency.
Annual Total ReturnsThe following bar chart and table are intended to help you understand the risks of investing in the Portfolio. The bar chart shows how the performance of the Portfolio has varied from one calendar year to another over the periods shown. The table shows how the average annual total returns of the Portfolio compare with those of a relevant market index, which has investment characteristics similar to those of the Portfolio. The Portfolio’s returns are net of its expenses but do not reflect additional fees and expenses that are deducted by the annuity or life insurance program through which you invest. If such fees and expenses were included in the calculation of the Portfolio’s returns, the returns would be lower. Keep in mind that the Portfolio’s past performance does not indicate how the Portfolio will perform in the future. Updated performance information is available on our website for Financial Advisors at advisors.vanguard.com or by calling Vanguard toll-free at 800-522-5555.
During the periods shown in the bar chart, the highest return for a calendar quarter was 18.07% (quarter ended June 30, 2009), and the lowest return for a quarter was –20.32% (quarter ended December 31, 2008).
Annual Total Returns — Diversified Value Portfolio
-36.14
26.929.33 3.92
16.5029.40
9.83
-2.45
12.96 13.16
60%
40%
20%
0%
-20%
-40%
-60%
2008 2009 2010 2011 2012 2013 2014 2015 2016 2017

25
Investment AdvisorBarrow, Hanley, Mewhinney & Strauss, LLC (Barrow, Hanley)
Portfolio Managers
Jeff G. Fahrenbruch, CFA, Managing Director of Barrow, Hanley. He has served as a co-manager of the Portfolio since 2013.
David W. Ganucheau, CFA, Managing Director of Barrow, Hanley. He has served as a co-manager of the Portfolio since 2013.
Tax InformationThe Portfolio normally distributes its net investment income and net realized capital gains, if any, to its shareholders, which are the insurance company separate accounts that sponsor your variable annuity or variable life insurance contract. The tax consequences to you of your investment in the Portfolio depend on the provisions of the annuity or life insurance contract through which you invest. For more information on taxes, please refer to the prospectus of the annuity or life insurance contract through which Portfolio shares are offered.
Payments to Financial IntermediariesThe Portfolio and its investment advisor do not pay financial intermediaries for sales of Portfolio shares.
Total Stock Market Index Portfolio
Investment ObjectiveThe Portfolio seeks to track the performance of a benchmark index that measures the investment return of the overall stock market.
Fees and ExpensesThe following table describes the fees and expenses you may pay if you buy and hold shares of the Portfolio. The expenses shown in the table and in the example that follows do not reflect additional fees and expenses associated with the annuity or life insurance program through which you invest. If those additional fees and expenses were included, overall expenses would be higher.
Average Annual Total Returns for Periods Ended December 31, 2017
1 Year 5 Years 10 Years
Diversified Value Portfolio 13.16% 12.12% 6.63%
Russell 1000 Value Index(reflects no deduction for fees or expenses) 13.66% 14.04% 7.10%
Annual Portfolio Operating Expenses(Expenses that you pay each year as a percentage of the value of your investment)
Management Fees None
12b-1 Distribution Fee None
Other Expenses None
Acquired Fund Fees and Expenses 0.15%
Total Annual Operating Expenses 0.15%

26
Example
The following example is intended to help you compare the cost of investing in the Portfolio (based on the fees and expenses of the underlying funds) with the cost of investing in other mutual funds. It illustrates the hypothetical expenses that you would incur over various periods if you were to invest $10,000 in the Portfolio’s shares. This example assumes that the Portfolio provides a return of 5% each year and that total annual operating expenses of the Portfolio and its underlying funds remain as stated in the preceding table. You would incur these hypothetical expenses whether or not you redeem your investment at the end of the given period. Although your actual costs may be higher or lower, based on these assumptions your costs would be:
Portfolio Turnover
The Portfolio may pay transaction costs, such as purchase fees, when it buys and sells securities (or “turns over” its portfolio). A higher portfolio turnover rate may indicate higher transaction costs. These costs, which are not reflected in annual portfolio operating expenses or in the previous expense example, reduce the Portfolio’s performance. During the most recent fiscal year, the Portfolio’s turnover rate was 6% of the average value of its portfolio.
Principal Investment StrategiesThe Portfolio employs an indexing investment approach designed to track the performance of the Standard & Poor’s (S&P) Total Market Index by investing all, or substantially all, of its assets in two Vanguard funds—Vanguard Variable Insurance Fund Equity Index Portfolio and Vanguard Extended Market Index Fund. The S&P Total Market Index consists of substantially all of the U.S. common stocks regularly traded on the New York Stock Exchange and the Nasdaq over-the-counter market.
Principal RisksAn investment in the Portfolio could lose money over short or long periods of time. You should expect the Portfolio’s share price and total return to fluctuate within a wide range. Though the Portfolio seeks to track the Index, its performance typically can be expected to fall short by a small percentage representing operating costs of the underlying funds. The Portfolio is subject to the following risk, which could affect the Portfolio’s performance:
• Stock market risk, which is the chance that stock prices overall will decline. Stock markets tend to move in cycles, with periods of rising prices and periods of falling prices. In addition, the Portfolio’s target index may, at times, become focused in stocks of a particular market sector, which would subject the Portfolio to proportionately higher exposure to the risks of that sector.
An investment in the Portfolio is not a deposit of a bank and is not insured or guaranteed by the Federal Deposit Insurance Corporation or any other government agency.
Annual Total ReturnsThe following bar chart and table are intended to help you understand the risks of investing in the Portfolio. The bar chart shows how the performance of the Portfolio has varied from one calendar year to another over the periods shown. The table shows how the average annual total returns of the Portfolio compare with those of its target index and other comparative indexes, which have investment characteristics similar to those of the Portfolio. The Portfolio’s returns are net of its expenses but do not reflect additional fees and expenses that are deducted by the annuity or life insurance program through which you invest. If such fees and expenses were included in the calculation of the Portfolio’s returns, the returns would be lower. Keep in mind that the Portfolio’s past performance does not indicate how the Portfolio will perform in the future. Updated performance information is available on our website for Financial Advisors at advisors.vanguard.com or by calling Vanguard toll-free at 800-522-5555.
1 Year 3 Years 5 Years 10 Years
$15 $48 $85 $192

27
During the periods shown in the bar chart, the highest return for a calendar quarter was 16.95% (quarter ended June 30, 2009), and the lowest return for a quarter was –22.75% (quarter ended December 31, 2008).
Investment AdvisorThe Vanguard Group, Inc. (Vanguard)
Portfolio Managers
William Coleman, CFA, Portfolio Manager at Vanguard. He has co-managed the Portfolio since 2013.
Walter Nejman, Portfolio Manager at Vanguard. He has co-managed the Portfolio since 2013.
Tax InformationThe Portfolio normally distributes its net investment income and net realized capital gains, if any, to its shareholders, which are the insurance company separate accounts that sponsor your variable annuity or variable life insurance contract. The tax consequences to you of your investment in the Portfolio depend on the provisions of the annuity or life insurance contract through which you invest. For more information on taxes, please refer to the prospectus of the annuity or life insurance contract through which Portfolio shares are offered.
Payments to Financial IntermediariesThe Portfolio and its investment advisor do not pay financial intermediaries for sales of Portfolio shares.
Equity Index Portfolio
Investment ObjectiveThe Portfolio seeks to track the performance of a benchmark index that measures the investment return of large-capitalization stocks.
Fees and ExpensesThe following table describes the fees and expenses you may pay if you buy and hold shares of the Portfolio. The expenses shown in the table and in the example that follows do not reflect additional fees and expenses associated with the annuity or life insurance program through which you invest. If those additional fees and expenses were included, overall expenses would be higher.
Annual Total Returns — Total Stock Market Index Portfolio
Average Annual Total Returns for Periods Ended December 31, 2017
1 Year 5 Years 10 Years
Total Stock Market Index Portfolio 20.97% 15.39% 8.50%
Comparative Indexes(reflect no deduction for fees or expenses)
Dow Jones U.S. Total Stock Market Float Adjusted Index 21.16% 15.52% 8.66%
S&P Total Market Index 21.16 15.52 8.58
Spliced Total Market Index 21.16 15.52 8.58
-37.28
28.2617.11
0.8316.33
33.28
12.290.37
12.5620.97
60%
40%
20%
0%
-20%
-40%
-60%
2008 2009 2010 2011 2012 2013 2014 2015 2016 2017

28
Example
The following example is intended to help you compare the cost of investing in the Portfolio with the cost of investing in other mutual funds. It illustrates the hypothetical expenses that you would incur over various periods if you were to invest $10,000 in the Portfolio’s shares. This example assumes that the Portfolio provides a return of 5% each year and that total annual portfolio operating expenses remain as stated in the preceding table. You would incur these hypothetical expenses whether or not you redeem your investment at the end of the given period. Although your actual costs may be higher or lower, based on these assumptions your costs would be:
Portfolio Turnover
The Portfolio pays transaction costs, such as commissions, when it buys and sells securities (or “turns over” its portfolio). A higher portfolio turnover rate may indicate higher transaction costs. These costs, which are not reflected in annual portfolio operating expenses or in the previous expense example, reduce the Portfolio’s performance. During the most recent fiscal year, the Portfolio’s turnover rate was 5% of the average value of its portfolio.
Principal Investment StrategiesThe Portfolio employs an indexing investment approach designed to track the performance of the Standard & Poor’s 500 Index, a widely recognized benchmark of U.S. stock market performance that is dominated by the stocks of large U.S. companies. The Portfolio attempts to replicate the target index by investing all, or substantially all, of its assets in the stocks that make up the Index, holding each stock in approximately the same proportion as its weighting in the Index.
Principal RisksAn investment in the Portfolio could lose money over short or long periods of time. You should expect the Portfolio’s share price and total return to fluctuate within a wide range. The Portfolio is subject to the following risks, which could affect the Portfolio’s performance:
• Stock market risk, which is the chance that stock prices overall will decline. Stock markets tend to move in cycles, with periods of rising prices and periods of falling prices. The Portfolio’s target index tracks a subset of the U.S. stock market, which could cause the Portfolio to perform differently from the overall stock market. In addition, the Portfolio’s target index may, at times, become focused in stocks of a particular market sector, which would subject the Portfolio to proportionately higher exposure to the risks of that sector.
• Investment style risk, which is the chance that returns from large-capitalization stocks will trail returns from the overall stock market. Large-cap stocks tend to go through cycles of doing better—or worse—than other segments of the stock market or the stock market in general. These periods have, in the past, lasted for as long as several years.
An investment in the Portfolio is not a deposit of a bank and is not insured or guaranteed by the Federal Deposit Insurance Corporation or any other government agency.
Annual Portfolio Operating Expenses(Expenses that you pay each year as a percentage of the value of your investment)
Management Fees 0.13%
12b-1 Distribution Fee None
Other Expenses 0.02%
Total Annual Operating Expenses 0.15%
1 Year 3 Years 5 Years 10 Years
$15 $48 $85 $192

29
Annual Total ReturnsThe following bar chart and table are intended to help you understand the risks of investing in the Portfolio. The bar chart shows how the performance of the Portfolio has varied from one calendar year to another over the periods shown. The table shows how the average annual total returns of the Portfolio compare with those of its target index, which has investment characteristics similar to those of the Portfolio. The Portfolio’s returns are net of its expenses, but do not reflect additional fees and expenses that are deducted by the annuity or life insurance program through which you invest. If such fees and expenses were included in the calculation of the Portfolio’s returns, the returns would be lower. Keep in mind that the Portfolio’s past performance does not indicate how the Portfolio will perform in the future. Updated performance information is available on our website for Financial Advisors at advisors.vanguard.com or by calling Vanguard toll-free at 800-522-5555.
During the periods shown in the bar chart, the highest return for a calendar quarter was 15.95% (quarter ended June 30, 2009), and the lowest return for a quarter was –21.84% (quarter ended December 31, 2008).
Investment AdvisorThe Vanguard Group, Inc. (Vanguard)
Portfolio Managers
Donald M. Butler, CFA, Principal of Vanguard. He has co-managed the Portfolio since 2016.
Michelle Louie, CFA, Portfolio Manager at Vanguard. She has co-managed the Portfolio since 2017.
Tax InformationThe Portfolio normally distributes its net investment income and net realized capital gains, if any, to its shareholders, which are the insurance company separate accounts that sponsor your variable annuity or variable life insurance contract. The tax consequences to you of your investment in the Portfolio depend on the provisions of the annuity or life insurance contract through which you invest. For more information on taxes, please refer to the prospectus of the annuity or life insurance contract through which Portfolio shares are offered.
Payments to Financial IntermediariesThe Portfolio and its investment advisor do not pay financial intermediaries for sales of Portfolio shares.
Annual Total Returns — Equity Index Portfolio
Average Annual Total Returns for Periods Ended December 31, 2017
1 Year 5 Years 10 Years
Equity Index Portfolio 21.66% 15.63% 8.38%
Standard & Poor's 500 Index(reflects no deduction for fees or expenses) 21.83% 15.79% 8.50%
-36.93
26.4414.91
1.9315.86
32.1813.51
1.2711.81
21.66
60%
40%
20%
0%
-20%
-40%
-60%
2008 2009 2010 2011 2012 2013 2014 2015 2016 2017

30
Mid-Cap Index Portfolio
Investment ObjectiveThe Portfolio seeks to track the performance of a benchmark index that measures the investment return of mid-capitalization stocks.
Fees and ExpensesThe following table describes the fees and expenses you may pay if you buy and hold shares of the Portfolio. The expenses shown in the table and in the example that follows do not reflect additional fees and expenses associated with the annuity or life insurance program through which you invest. If those additional fees and expenses were included, overall expenses would be higher.
Example
The following example is intended to help you compare the cost of investing in the Portfolio with the cost of investing in other mutual funds. It illustrates the hypothetical expenses that you would incur over various periods if you were to invest $10,000 in the Portfolio’s shares. This example assumes that the Portfolio provides a return of 5% each year and that total annual portfolio operating expenses remain as stated in the preceding table. You would incur these hypothetical expenses whether or not you redeem your investment at the end of the given period. Although your actual costs may be higher or lower, based on these assumptions your costs would be:
Portfolio Turnover
The Portfolio pays transaction costs, such as commissions, when it buys and sells securities (or “turns over” its portfolio). A higher portfolio turnover rate may indicate higher transaction costs. These costs, which are not reflected in annual portfolio operating expenses or in the previous expense example, reduce the Portfolio’s performance. During the most recent fiscal year, the Portfolio’s turnover rate was 18% of the average value of its portfolio.
Principal Investment StrategiesThe Portfolio employs an indexing investment approach designed to track the performance of the CRSP US Mid Cap Index, a broadly diversified index of stocks of mid-size U.S. companies. The Portfolio attempts to replicate the target index by investing all, or substantially all, of its assets in the stocks that make up the Index, holding each stock in approximately the same proportion as its weighting in the Index.
Principal RisksAn investment in the Portfolio could lose money over short or long periods of time. You should expect the Portfolio’s share price and total return to fluctuate within a wide range. The Portfolio is subject to the following risks, which could affect the Portfolio’s performance:
• Stock market risk, which is the chance that stock prices overall will decline. Stock markets tend to move in cycles, with periods of rising prices and periods of falling prices. The Portfolio’s target index tracks a subset of the U.S. stock market, which could cause the Portfolio to perform differently from the overall stock market. In addition, the Portfolio’s target index may, at times, become focused in stocks of a particular market sector, which would subject the Portfolio to proportionately higher exposure to the risks of that sector.
Annual Portfolio Operating Expenses(Expenses that you pay each year as a percentage of the value of your investment)
Management Fees 0.16%
12b-1 Distribution Fee None
Other Expenses 0.03%
Total Annual Operating Expenses 0.19%
1 Year 3 Years 5 Years 10 Years
$19 $61 $107 $243

31
• Investment style risk, which is the chance that returns from mid-capitalization stocks will trail returns from the overall stock market. Historically, mid-cap stocks have been more volatile in price than the large-cap stocks that dominate the overall market, and they often perform quite differently.
An investment in the Portfolio is not a deposit of a bank and is not insured or guaranteed by the Federal Deposit Insurance Corporation or any other government agency.
Annual Total ReturnsThe following bar chart and table are intended to help you understand the risks of investing in the Portfolio. The bar chart shows how the performance of the Portfolio has varied from one calendar year to another over the periods shown. The table shows how the average annual total returns of the Portfolio compare with those of the Portfolio’s target index and other comparative indexes, which have investment characteristics similar to those of the Portfolio. The Portfolio’s returns are net of its expenses but do not reflect additional fees and expenses that are deducted by the annuity or life insurance program through which you invest. If such fees and expenses were included in the calculation of the Portfolio’s returns, the returns would be lower. Keep in mind that the Portfolio’s past performance does not indicate how the Portfolio will perform in the future. Updated performance information is available on our website for Financial Advisors at advisors.vanguard.com or by calling Vanguard toll-free at 800-522-5555.
During the periods shown in the bar chart, the highest return for a calendar quarter was 21.44% (quarter ended September 30, 2009), and the lowest return for a quarter was –25.65% (quarter ended December 31, 2008).
Investment AdvisorThe Vanguard Group, Inc. (Vanguard)
Portfolio Managers
Donald M. Butler, CFA, Principal of Vanguard. He has managed the Portfolio since its inception in 1999 (co-managed since 2016).
Michael A. Johnson, Portfolio Manager at Vanguard. He has co-managed the Portfolio since 2016.
Tax InformationThe Portfolio normally distributes its net investment income and net realized capital gains, if any, to its shareholders, which are the insurance company separate accounts that sponsor your variable annuity or variable life insurance contract. The tax consequences to you of your investment in the Portfolio depend on the provisions of the annuity or life insurance contract through which you invest. For more information on taxes, please refer to the prospectus of the annuity or life insurance contract through which Portfolio shares are offered.
Annual Total Returns — Mid-Cap Index Portfolio
Average Annual Total Returns for Periods Ended December 31, 2017
1 Year 5 Years 10 Years
Mid-Cap Index Portfolio 19.08% 14.86% 8.79%
Comparative Indexes(reflect no deduction for fees or expenses)
MSCI US Mid Cap 450 Index 20.26% 15.80% 9.31%
Spliced Mid Cap Index 19.30 15.06 8.96
CRSP US Mid Cap Index 19.30 15.07 —
-41.81
40.3725.37
-2.04
15.82
34.93
13.59
-1.43
11.1119.08
60%
40%
20%
0%
-20%
-40%
-60%
2008 2009 2010 2011 2012 2013 2014 2015 2016 2017

32
Payments to Financial IntermediariesThe Portfolio and its investment advisor do not pay financial intermediaries for sales of Portfolio shares.
Growth Portfolio
Investment ObjectiveThe Portfolio seeks to provide long-term capital appreciation.
Fees and ExpensesThe following table describes the fees and expenses you may pay if you buy and hold shares of the Portfolio. The expenses shown in the table and in the example that follows do not reflect additional fees and expenses associated with the annuity or life insurance program through which you invest. If those additional fees and expenses were included, overall expenses would be higher.
Example
The following example is intended to help you compare the cost of investing in the Portfolio with the cost of investing in other mutual funds. It illustrates the hypothetical expenses that you would incur over various periods if you were to invest $10,000 in the Portfolio’s shares. This example assumes that the Portfolio provides a return of 5% each year and that total annual portfolio operating expenses remain as stated in the preceding table. You would incur these hypothetical expenses whether or not you redeem your investment at the end of the given period. Although your actual costs may be higher or lower, based on these assumptions your costs would be:
Portfolio Turnover
The Portfolio pays transaction costs, such as commissions, when it buys and sells securities (or “turns over” its portfolio). A higher portfolio turnover rate may indicate higher transaction costs. These costs, which are not reflected in annual portfolio operating expenses or in the previous expense example, reduce the Portfolio’s performance. During the most recent fiscal year, the Portfolio’s turnover rate was 28% of the average value of its portfolio.
Principal Investment StrategiesThe Portfolio invests mainly in large-capitalization stocks of U.S. companies considered to have above-average earnings growth potential and reasonable stock prices in comparison with expected earnings. The Portfolio uses multiple investment advisors. Each advisor independently selects and maintains a portfolio of common stocks for the Portfolio.
Principal RisksAn investment in the Portfolio could lose money over short or long periods of time. You should expect the Portfolio’s share price and total return to fluctuate within a wide range. The Portfolio is subject to the following risks, which could affect the Portfolio’s performance:
• Stock market risk, which is the chance that stock prices overall will decline. Stock markets tend to move in cycles, with periods of rising prices and periods of falling prices.
• Investment style risk, which is the chance that returns from large-capitalization growth stocks will trail returns from the overall stock market. Large-cap growth stocks tend to go through cycles of doing better—or worse—than other segments of the stock market or the stock market in general. These periods have, in the past, lasted for as long as several years.
Annual Portfolio Operating Expenses(Expenses that you pay each year as a percentage of the value of your investment)
Management Fees 0.37%
12b-1 Distribution Fee None
Other Expenses 0.03%
Total Annual Operating Expenses 0.40%
1 Year 3 Years 5 Years 10 Years
$41 $128 $224 $505

33
• Asset concentration risk, which is the chance that the Portfolio’s performance may be hurt disproportionately by the poor performance of relatively few stocks. The Portfolio tends to invest a high percentage of assets in its ten largest holdings.
• Manager risk, which is the chance that poor security selection will cause the Portfolio to underperform relevant benchmarks or other funds with a similar investment objective. In addition, significant investment in the information technology sector subjects the Portfolio to proportionately higher exposure to the risks of this sector.
An investment in the Portfolio is not a deposit of a bank and is not insured or guaranteed by the Federal Deposit Insurance Corporation or any other government agency.
Annual Total ReturnsThe following bar chart and table are intended to help you understand the risks of investing in the Portfolio. The bar chart shows how the performance of the Portfolio has varied from one calendar year to another over the periods shown. The table shows how the average annual total returns of the Portfolio compare with those of relevant market indexes, which have investment characteristics similar to those of the Portfolio. The Portfolio’s returns are net of its expenses but do not reflect additional fees and expenses that are deducted by the annuity or life insurance program through which you invest. If such fees and expenses were included in the calculation of the Portfolio’s returns, the returns would be lower. Keep in mind that the Portfolio’s past performance does not indicate how the Portfolio will perform in the future. Updated performance information is available on our website for Financial Advisors at advisors.vanguard.com or by calling Vanguard toll-free at 800-522-5555.
During the periods shown in the bar chart, the highest return for a calendar quarter was 18.12% (quarter ended March 31, 2012), and the lowest return for a quarter was –21.54% (quarter ended December 31, 2008).
Investment AdvisorsJackson Square Partners, LLC (Jackson Square)
Wellington Management Company LLP (Wellington Management)
William Blair Investment Management, LLC (William Blair)
Portfolio Managers
Christopher J. Bonavico, CFA, Portfolio Manager and Research Analyst at Jackson Square. He has co-managed a portion of the Portfolio since 2010.
Christopher M. Ericksen, CFA, Portfolio Manager and Research Analyst at Jackson Square. He has co-managed a portion of the Portfolio since 2010.
Daniel J. Prislin, CFA, Portfolio Manager and Research Analyst at Jackson Square. He has co-managed a portion of the Portfolio since 2010.
Annual Total Returns — Growth Portfolio
Average Annual Total Returns for Periods Ended December 31, 2017
1 Year 5 Years 10 Years
Growth Portfolio 30.92% 16.57% 9.05%
Comparative Indexes(reflect no deduction for fees or expenses)
Russell 1000 Growth Index 30.21% 17.33% 10.00%
Standard & Poor's 500 Index 21.83 15.79 8.50
-37.72
35.05
11.81
-0.84
18.4335.28
13.79 7.98
-1.08
30.9260%
40%
20%
0%
-20%
-40%
-60%
2008 2009 2010 2011 2012 2013 2014 2015 2016 2017

34
Jeffrey S. Van Harte, CFA, Chairman and Chief Investment Officer at Jackson Square. He has co-managed a portion of the Portfolio since 2010.
Andrew J. Shilling, CFA, Senior Managing Director and Equity Portfolio Manager of Wellington Management. He has managed a portion of the Portfolio since 2010.
James Golan, CFA, Partner and Portfolio Manager of William Blair. He has co-managed a portion of the Portfolio since 2010.
David Ricci, CFA, Partner and Portfolio Manager of William Blair. He has co-managed a portion of the Portfolio since 2011.
Tax InformationThe Portfolio normally distributes its net investment income and net realized capital gains, if any, to its shareholders, which are the insurance company separate accounts that sponsor your variable annuity or variable life insurance contract. The tax consequences to you of your investment in the Portfolio depend on the provisions of the annuity or life insurance contract through which you invest. For more information on taxes, please refer to the prospectus of the annuity or life insurance contract through which Portfolio shares are offered.
Payments to Financial IntermediariesThe Portfolio and its investment advisors do not pay financial intermediaries for sales of Portfolio shares.
Capital Growth Portfolio
Investment ObjectiveThe Portfolio seeks to provide long-term capital appreciation.
Fees and ExpensesThe following table describes the fees and expenses you may pay if you buy and hold shares of the Portfolio. The expenses shown in the table and in the example that follows do not reflect additional fees and expenses associated with the annuity or life insurance program through which you invest. If those additional fees and expenses were included, overall expenses would be higher.
Example
The following example is intended to help you compare the cost of investing in the Portfolio with the cost of investing in other mutual funds. It illustrates the hypothetical expenses that you would incur over various periods if you were to invest $10,000 in the Portfolio’s shares. This example assumes that the Portfolio provides a return of 5% each year and that total annual portfolio operating expenses remain as stated in the preceding table. You would incur these hypothetical expenses whether or not you redeem your investment at the end of the given period. Although your actual costs may be higher or lower, based on these assumptions your costs would be:
Portfolio Turnover
The Portfolio pays transaction costs, such as commissions, when it buys and sells securities (or “turns over” its portfolio). A higher portfolio turnover rate may indicate higher transaction costs. These costs, which are not reflected in annual portfolio operating expenses or in the previous expense example, reduce the Portfolio’s performance. During the most recent fiscal year, the Portfolio’s turnover rate was 7% of the average value of its portfolio.
Annual Portfolio Operating Expenses(Expenses that you pay each year as a percentage of the value of your investment)
Management Fees 0.34%
12b-1 Distribution Fee None
Other Expenses 0.02%
Total Annual Operating Expenses 0.36%
1 Year 3 Years 5 Years 10 Years
$37 $116 $202 $456

35
Principal Investment StrategiesThe Portfolio invests in stocks considered to have above-average earnings growth potential that is not reflected in their current market prices. The Portfolio consists predominantly of large- and mid-capitalization stocks.
Principal RisksAn investment in the Portfolio could lose money over short or long periods of time. You should expect the Portfolio’s share price and total return to fluctuate within a wide range. The Portfolio is subject to the following risks, which could affect the Portfolio’s performance:
• Stock market risk, which is the chance that stock prices overall will decline. Stock markets tend to move in cycles, with periods of rising prices and periods of falling prices.
• Investment style risk, which is the chance that returns from mid- and large-capitalization growth stocks will trail returns from the overall stock market. Mid- and large-cap stocks each tend to go through cycles of doing better—or worse—than other segments of the stock market or the stock market in general. These periods have, in the past, lasted for as long as several years. Historically, mid-cap stocks have been more volatile in price than large-cap stocks because, among other things, mid-size companies tend to be more sensitive to changing economic conditions.
• Asset concentration risk, which is the chance that, because the Portfolio tends to invest a high percentage of its assets in its ten largest holdings, the Portfolio’s performance may be hurt disproportionately by the poor performance of relatively few stocks.
• Manager risk, which is the chance that poor security selection will cause the Portfolio to underperform relevant benchmarks or other funds with a similar investment objective. In addition, significant investments in the health care and information technology sectors subject the Portfolio to proportionately higher exposure to the risks of these sectors.
An investment in the Portfolio is not a deposit of a bank and is not insured or guaranteed by the Federal Deposit Insurance Corporation or any other government agency.
Annual Total ReturnsThe following bar chart and table are intended to help you understand the risks of investing in the Portfolio. The bar chart shows how the performance of the Portfolio has varied from one calendar year to another over the periods shown. The table shows how the average annual total returns of the Portfolio compare with those of a relevant market index, which has investment characteristics similar to those of the Portfolio. The Portfolio’s returns are net of its expenses, but do not reflect additional fees and expenses that are deducted by the annuity or life insurance program through which you invest. If such fees and expenses were included in the calculation of the Portfolio’s returns, the returns would be lower. Keep in mind that the Portfolio’s past performance does not indicate how the Portfolio will perform in the future. Updated performance information is available on our website for Financial Advisors at advisors.vanguard.com or by calling Vanguard toll-free at 800-522-5555.
During the periods shown in the bar chart, the highest return for a calendar quarter was 14.43% (quarter ended September 30, 2009), and the lowest return for a quarter was –21.64% (quarter ended December 31, 2008).
Annual Total Returns — Capital Growth Portfolio
Average Annual Total Returns for Periods Ended December 31, 2017
1 Year 5 Years 10 Years
Capital Growth Portfolio 28.83% 19.17% 11.26%
Standard & Poor's 500 Index(reflects no deduction for fees or expenses) 21.83% 15.79% 8.50%
-30.36
34.30
13.08
-0.93
15.47
38.48
18.432.62
10.8428.83
60%
40%
20%
0%
-20%
-40%
-60%
2008 2009 2010 2011 2012 2013 2014 2015 2016 2017

36
Investment AdvisorPRIMECAP Management Company (PRIMECAP)
Portfolio Managers
Theo A. Kolokotrones, Chairman of PRIMECAP. He has co-managed the Portfolio since its inception in 2002.
Joel P. Fried, President of PRIMECAP. He has co-managed the Portfolio since its inception in 2002.
Alfred W. Mordecai, Vice Chairman of PRIMECAP. He has co-managed the Portfolio since its inception in 2002.
M. Mohsin Ansari, Executive Vice President of PRIMECAP. He has co-managed the Portfolio since 2007.
James Marchetti, Senior Vice President, Portfolio Manager, and Principal of PRIMECAP. He has co-managed the Portfolio since 2015.
Tax InformationThe Portfolio normally distributes its net investment income and net realized capital gains, if any, to its shareholders, which are the insurance company separate accounts that sponsor your variable annuity or variable life insurance contract. The tax consequences to you of your investment in the Portfolio depend on the provisions of the annuity or life insurance contract through which you invest. For more information on taxes, please refer to the prospectus of the annuity or life insurance contract through which Portfolio shares are offered.
Payments to Financial IntermediariesThe Portfolio and its investment advisor do not pay financial intermediaries for sales of Portfolio shares.
Small Company Growth Portfolio
Investment ObjectiveThe Portfolio seeks to provide long-term capital appreciation.
Fees and ExpensesThe following table describes the fees and expenses you may pay if you buy and hold shares of the Portfolio. The expenses shown in the table and in the example that follows do not reflect additional fees and expenses associated with the annuity or life insurance program through which you invest. If those additional fees and expenses were included, overall expenses would be higher.
Example
The following example is intended to help you compare the cost of investing in the Portfolio with the cost of investing in other mutual funds. It illustrates the hypothetical expenses that you would incur over various periods if you were to invest $10,000 in the Portfolio’s shares. This example assumes that the Portfolio provides a return of 5% each year and that total annual portfolio operating expenses remain as stated in the preceding table. You would incur these hypothetical expenses whether or not you redeem your investment at the end of the given period. Although your actual costs may be higher or lower, based on these assumptions your costs would be:
Annual Portfolio Operating Expenses(Expenses that you pay each year as a percentage of the value of your investment)
Management Fees 0.31%
12b-1 Distribution Fee None
Other Expenses 0.03%
Total Annual Operating Expenses 0.34%
1 Year 3 Years 5 Years 10 Years
$35 $109 $191 $431

37
Portfolio Turnover
The Portfolio pays transaction costs, such as commissions, when it buys and sells securities (or “turns over” its portfolio). A higher portfolio turnover rate may indicate higher transaction costs. These costs, which are not reflected in annual portfolio operating expenses or in the previous expense example, reduce the Portfolio’s performance. During the most recent fiscal year, the Portfolio’s turnover rate was 93% of the average value of its portfolio.
Principal Investment StrategiesUnder normal circumstances the Portfolio invests at least 80% of its assets primarily in common stocks of small companies. These companies tend to be unseasoned but are considered by the Portfolio’s advisors to have superior growth potential. Also, these companies often provide little or no dividend income. The Portfolio’s 80% policy may be changed only upon 60 days’ notice to shareholders. The Portfolio uses multiple investment advisors. Each advisor independently selects and maintains a portfolio of common stocks for the Portfolio.
Principal RisksAn investment in the Portfolio could lose money over short or long periods of time. You should expect the Portfolio’s share price and total return to fluctuate within a wide range. The Portfolio is subject to the following risks, which could affect the Portfolio’s performance:
• Stock market risk, which is the chance that stock prices overall will decline. Stock markets tend to move in cycles, with periods of rising prices and periods of falling prices.
• Investment style risk, which is the chance that returns from small-capitalization growth stocks will trail returns from the overall stock market. Historically, small-cap stocks have been more volatile in price than the large-cap stocks that dominate the overall market, and they often perform quite differently. Small companies tend to have greater stock volatility because, among other things, these companies tend to be more sensitive to changing economic conditions.
• Manager risk, which is the chance that poor security selection will cause the Portfolio to underperform relevant benchmarks or other funds with a similar investment objective. In addition, significant investments in the information technology sector subjects the Portfolio to proportionately higher exposure to the risks of this sector.
An investment in the Portfolio is not a deposit of a bank and is not insured or guaranteed by the Federal Deposit Insurance Corporation or any other government agency.
Annual Total ReturnsThe following bar chart and table are intended to help you understand the risks of investing in the Portfolio. The bar chart shows how the performance of the Portfolio has varied from one calendar year to another over the periods shown. The table shows how the average annual total returns of the Portfolio compare with those of a relevant market index, which has investment characteristics similar to those of the Portfolio. The Portfolio’s returns are net of its expenses but do not reflect additional fees and expenses that are deducted by the annuity or life insurance program through which you invest. If such fees and expenses were included in the calculation of the Portfolio’s returns, the returns would be lower. Keep in mind that the Portfolio’s past performance does not indicate how the Portfolio will perform in the future. Updated performance information is available on our website for Financial Advisors at advisors.vanguard.com or by calling Vanguard toll-free at 800-522-5555.
During the periods shown in the bar chart, the highest return for a calendar quarter was 20.18% (quarter ended June 30, 2009), and the lowest return for a quarter was –25.40% (quarter ended December 31, 2008).
Annual Total Returns — Small Company Growth Portfolio
-39.47
39.3831.79
1.3614.65
46.54
3.38
-2.75
14.9423.46
60%
40%
20%
0%
-20%
-40%
-60%
2008 2009 2010 2011 2012 2013 2014 2015 2016 2017

38
Investment AdvisorsArrowMark Colorado Holdings, LLC (ArrowMark Partners)
The Vanguard Group, Inc. (Vanguard)
Portfolio Managers
Chad Meade, Partner and Portfolio Manager of ArrowMark Partners. He has co-managed a portion of the Portfolio since January 2016.
Brian Schaub, CFA, Partner and Portfolio Manager of ArrowMark Partners. He has co-managed a portion of the Portfolio since January 2016.
James P. Stetler, Senior Portfolio Manager at Vanguard. He has managed a portion of the Portfolio since 2008 (co-managed since 2012).
Binbin Guo, Ph.D., Principal of Vanguard and head of the Alpha Equity Investment team within Vanguard’s Quantitative Equity Group. He has co-managed a portion of the Portfolio since 2016.
Tax InformationThe Portfolio normally distributes its net investment income and net realized capital gains, if any, to its shareholders, which are the insurance company separate accounts that sponsor your variable annuity or variable life insurance contract. The tax consequences to you of your investment in the Portfolio depend on the provisions of the annuity or life insurance contract through which you invest. For more information on taxes, please refer to the prospectus of the annuity or life insurance contract through which Portfolio shares are offered.
Payments to Financial IntermediariesThe Portfolio and its investment advisors do not pay financial intermediaries for sales of Portfolio shares.
International Portfolio
Investment ObjectiveThe Portfolio seeks to provide long-term capital appreciation.
Fees and ExpensesThe following table describes the fees and expenses you may pay if you buy and hold shares of the Portfolio. The expenses shown in the table and in the example that follows do not reflect additional fees and expenses associated with the annuity or life insurance program through which you invest. If those additional fees and expenses were included, overall expenses would be higher.
Average Annual Total Returns for Periods Ended December 31, 2017
1 Year 5 Years 10 Years
Small Company Growth Portfolio 23.46% 15.89% 10.45%
Russell 2500 Growth Index(reflects no deduction for fees or expenses) 24.46% 15.47% 9.62%
Annual Portfolio Operating Expenses(Expenses that you pay each year as a percentage of the value of your investment)
Management Fees 0.36%
12b-1 Distribution Fee None
Other Expenses 0.03%
Total Annual Operating Expenses 0.39%

39
Example
The following example is intended to help you compare the cost of investing in the Portfolio with the cost of investing in other mutual funds. It illustrates the hypothetical expenses that you would incur over various periods if you were to invest $10,000 in the Portfolio’s shares. This example assumes that the Portfolio provides a return of 5% each year and that total annual portfolio operating expenses remain as stated in the preceding table. You would incur these hypothetical expenses whether or not you redeem your investment at the end of the given period. Although your actual costs may be higher or lower, based on these assumptions your costs would be:
Portfolio Turnover
The Portfolio pays transaction costs, such as commissions, when it buys and sells securities (or “turns over” its portfolio). A higher portfolio turnover rate may indicate higher transaction costs. These costs, which are not reflected in annual portfolio operating expenses or in the previous expense example, reduce the Portfolio’s performance. During the most recent fiscal year, the Portfolio’s turnover rate was 16% of the average value of its portfolio.
Principal Investment StrategiesThe Portfolio invests predominantly in the stocks of companies located outside the United States and is expected to diversify its assets in countries across developed and emerging markets. In selecting stocks, the Portfolio’s advisors evaluate foreign markets around the world and choose large-, mid-, and small-capitalization companies considered to have above-average growth potential. The Portfolio uses multiple investment advisors. Each advisor independently selects and maintains a portfolio of common stocks for the Portfolio.
Principal RisksAn investment in the Portfolio could lose money over short or long periods of time. You should expect the Portfolio’s share price and total return to fluctuate within a wide range. The Portfolio is subject to the following risks, which could affect the Portfolio’s performance:
• Investment style risk, which is the chance that returns from non-U.S. growth stocks, and, to the extent that the Portfolio is invested in them, small- and mid-capitalization stocks, will trail returns from global stock markets. Historically, non-U.S. small- and mid-cap stocks have been more volatile in price than the large-cap stocks that dominate the global markets, and they often perform quite differently.
• Stock market risk, which is the chance that stock prices overall will decline. Stock markets tend to move in cycles, with periods of rising prices and periods of falling prices. In addition, investments in foreign stocks can be riskier than U.S. stock investments. Foreign stocks tend to be more volatile and less liquid than U.S. stocks. The prices of foreign stocks and the prices of U.S. stocks may move in opposite directions.
• Country/regional risk, which is the chance that world events—such as political upheaval, financial troubles, or natural disasters—will adversely affect the value of securities issued by companies in foreign countries or regions. Because the Portfolio may invest a large portion of its assets in securities of companies located in any one country or region, including emerging markets, the Portfolio’s performance may be hurt disproportionately by the poor performance of its investments in that area. Country/regional risk is especially high in emerging markets.
• Currency risk, which is the chance that the value of a foreign investment, measured in U.S. dollars, will decrease because of unfavorable changes in currency exchange rates. Currency risk is especially high in emerging markets.
• Manager risk, which is the chance that poor security selection will cause the Portfolio to underperform relevant benchmarks or other funds with a similar investment objective. In addition, significant investment in the consumer discretionary sector subjects the Portfolio to proportionately higher exposure to the risks of this sector.
An investment in the Portfolio is not a deposit of a bank and is not insured or guaranteed by the Federal Deposit Insurance Corporation or any other government agency.
1 Year 3 Years 5 Years 10 Years
$40 $125 $219 $493

40
Annual Total ReturnsThe following bar chart and table are intended to help you understand the risks of investing in the Portfolio. The bar chart shows how the performance of the Portfolio has varied from one calendar year to another over the periods shown. The table shows how the average annual total returns of the Portfolio compare with those of a relevant market index and a comparative index, which have investment characteristics similar to those of the Portfolio. Returns for the Indexes shown are adjusted for withholding taxes. The Portfolio’s returns are net of its expenses but do not reflect additional fees and expenses that are deducted by the annuity or life insurance program through which you invest. If such fees and expenses were included in the calculation of the Portfolio’s returns, the returns would be lower. Keep in mind that the Portfolio’s past performance does not indicate how the Portfolio will perform in the future. Updated performance information is available on our website for Financial Advisors at advisors.vanguard.com or by calling Vanguard toll-free at 800-522-5555.
During the periods shown in the bar chart, the highest return for a calendar quarter was 27.23% (quarter ended June 30, 2009), and the lowest return for a quarter was –23.31% (quarter ended December 31, 2008).
Investment AdvisorsBaillie Gifford Overseas Ltd. (Baillie Gifford)
Schroder Investment Management North America Inc. (Schroders)
Portfolio Managers
James K. Anderson, Partner of Baillie Gifford & Co., which is the 100% owner of Baillie Gifford, and Head of Global Equities. He has managed a portion of the Portfolio since 2003 (co-managed since 2013).
Thomas Coutts, Partner of Baillie Gifford & Co., which is the 100% owner of Baillie Gifford. He has co-managed a portion of the Portfolio since December 2016.
Simon Webber, CFA, Portfolio Manager at Schroders. He has managed a portion of the Portfolio since 2009.
Tax InformationThe Portfolio normally distributes its net investment income and net realized capital gains, if any, to its shareholders, which are the insurance company separate accounts that sponsor your variable annuity or variable life insurance contract. The tax consequences to you of your investment in the Portfolio depend on the provisions of the annuity or life insurance contract through which you invest. For more information on taxes, please refer to the prospectus of the annuity or life insurance contract through which Portfolio shares are offered.
Payments to Financial IntermediariesThe Portfolio and its investment advisors do not pay financial intermediaries for sales of Portfolio shares.
Annual Total Returns — International Portfolio
Average Annual Total Returns for Periods Ended December 31, 2017
1 Year 5 Years 10 Years
International Portfolio 42.60% 10.80% 4.67%
Comparative Indexes(reflect no deduction for fees or expenses)
MSCI ACWI ex USA Index 27.19% 6.80% 1.84%
Spliced International Index 27.19 6.80 1.23
-44.87
42.57
15.79
-13.54
20.14 23.26
-6.05 -0.77
1.93
42.6060%
40%
20%
0%
-20%
-40%
-60%
2008 2009 2010 2011 2012 2013 2014 2015 2016 2017

41
Total International Stock Market Index Portfolio
Investment ObjectiveThe Portfolio seeks to track the performance of a benchmark index that measures the investment return of stocks issued by companies located in developed and emerging markets, excluding the United States.
Fees and ExpensesThe following table describes the fees and expenses you may pay if you buy and hold shares of the Portfolio. The expenses shown in the table and in the example that follows do not reflect additional fees and expenses associated with the annuity or life insurance program through which you invest. If those additional fees and expenses were included, overall expenses would be higher.
Example
The following example is intended to help you compare the cost of investing in the Portfolio (based on the fees and expenses of the underlying funds) with the cost of investing in other mutual funds. It illustrates the hypothetical expenses that you would incur over various periods if you were to invest $10,000 in the Portfolio’s shares. This example assumes that the Portfolio provides a return of 5% each year and that total annual operating expenses of the Portfolio and its underlying funds remain as stated in the preceding table. You would incur these hypothetical expenses whether or not you redeem your investment at the end of the given period. Although your actual costs may be higher or lower, based on these assumptions your costs would be:
Portfolio Turnover
The Portfolio may pay transaction costs, such as purchase fees, when it buys and sells securities (or “turns over” its portfolio). A higher portfolio turnover rate may indicate higher transaction costs. These costs, which are not reflected in annual portfolio operating expenses or in the previous expense example, reduce the Portfolio’s performance. During the fiscal period from September 7, 2017, to December 31, 2017, the Portfolio’s turnover rate was 5% of the average value of its portfolio.
Principal Investment StrategiesThe Portfolio employs an indexing investment approach designed to track the performance of the FTSE Global All Cap ex US Index, a float-adjusted market capitalization-weighted index designed to measure equity market performance of companies located in developed and emerging markets, excluding the United States. The Index includes approximately 5,900 stocks of companies located in over 46 countries. As of December 31, 2017, the largest markets covered in the Index were Japan, the United Kingdom, Canada, France, and Germany (which made up approximately 17%, 13%, 7%, 6%, and 6%, respectively, of the Index’s market capitalization). The Portfolio intends to obtain its exposure to the stocks in the Index by investing all, or substantially all, of its assets in a mix of Vanguard equity index funds (underlying funds). The Portfolio’s allocations to the underlying funds will change over time as the composition of the Index changes.
Annual Portfolio Operating Expenses(Expenses that you pay each year as a percentage of the value of your investment)
Management Fees None
12b-1 Distribution Fee None
Other Expenses None
Acquired Fund Fees and Expenses 0.11%
Total Annual Operating Expenses 0.11%
1 Year 3 Years 5 Years 10 Years
$11 $35 $62 $141

42
Principal RisksAn investment in the Portfolio could lose money over short or long periods of time. You should expect the Portfolio’s share price and total return to fluctuate within a wide range. Although the Portfolio seeks to track the Index, its performance typically can be expected to fall short by a small percentage representing operating costs of the underlying funds. The Portfolio is subject to the following risks through its investments in the underlying funds, which could affect the Portfolio’s performance:
• Stock market risk, which is the chance that stock prices overall will decline. Stock markets tend to move in cycles, with periods of rising prices and periods of falling prices. In addition, investments in foreign stocks can be riskier than U.S. stock investments. Foreign stocks tend to be more volatile and less liquid than U.S. stocks. The prices of foreign stocks and the prices of U.S. stocks may move in opposite directions.
• Investment style risk, which is the chance that returns from non-U.S. small- and mid-capitalization stocks will trail returns from global stock markets. Historically, non-U.S. small- and mid-cap stocks have been more volatile in price than the large-cap stocks that dominate the global markets, and they often perform quite differently.
• Country/regional risk, which is the chance that world events—such as political upheaval, financial troubles, or natural disasters—will adversely affect the value of securities issued by companies in foreign countries or regions. Because the underlying funds may invest a large portion of their assets in securities of companies located in any one country or region, the Portfolio’s performance may be hurt disproportionately by the poor performance of its investments in that area. Country/regional risk is especially high in emerging markets.
• Currency risk, which is the chance that the value of a foreign investment, measured in U.S. dollars, will decrease because of unfavorable changes in currency exchange rates. Currency risk is especially high in emerging markets.
• Emerging markets risk, which is the chance that the stocks of companies located in emerging markets will be substantially more volatile, and substantially less liquid, than the stocks of companies located in more developed foreign markets because, among other factors, emerging markets can have greater custodial and operational risks; less developed legal, tax, regulatory, and accounting systems; and greater political, social, and economic instability than developed markets.
An investment in the Portfolio is not a deposit of a bank and is not insured or guaranteed by the Federal Deposit Insurance Corporation or any other government agency.
Annual Total ReturnsThe Fund has not been in operation long enough to report a full calendar-year return. Performance information is available on our website at vanguard.com/performance or by calling Vanguard toll-free at 800-662-7447.
Investment AdvisorThe Vanguard Group, Inc. (Vanguard)
Portfolio Managers
William Coleman, CFA, Portfolio Manager at Vanguard. He has co-managed the Portfolio since its inception in 2017.
Walter Nejman, Portfolio Manager at Vanguard. He has co-managed the Portfolio since its inception in 2017.
Tax InformationThe Portfolio normally distributes its net investment income and net realized capital gains, if any, to its shareholders, which are the insurance company separate accounts that sponsor your variable annuity or variable life insurance contract. The tax consequences to you of your investment in the Portfolio depend on the provisions of the annuity or life insurance contract through which you invest. For more information on taxes, please refer to the prospectus of the annuity or life insurance contract through which Portfolio shares are offered.
Payments to Financial IntermediariesThe Portfolio and its investment advisor do not pay financial intermediaries for sales of Portfolio shares.
Real Estate Index Portfolio
Investment ObjectiveThe Portfolio seeks to provide a high level of income and moderate long-term capital appreciation by tracking the performance of a benchmark index that measures the performance of publicly traded equity REITs and other real estate-related investments.

43
Fees and ExpensesThe following table describes the fees and expenses you may pay if you buy and hold shares of the Portfolio. The expenses shown in the table and in the example that follows do not reflect additional fees and expenses associated with the annuity or life insurance program through which you invest. If those additional fees and expenses were included, overall expenses would be higher.
Example
The following example is intended to help you compare the cost of investing in the Portfolio with the cost of investing in other mutual funds. It illustrates the hypothetical expenses that you would incur over various periods if you were to invest $10,000 in the Portfolio’s shares. This example assumes that the Portfolio provides a return of 5% each year and that total annual portfolio operating expenses remain as stated in the preceding table. You would incur these hypothetical expenses whether or not you redeem your investment at the end of the given period. Although your actual costs may be higher or lower, based on these assumptions your costs would be:
Portfolio Turnover
The Portfolio pays transaction costs, such as commissions, when it buys and sells securities (or “turns over” its portfolio). A higher portfolio turnover rate may indicate higher transaction costs. These costs, which are not reflected in annual portfolio operating expenses or in the previous expense example, reduce the Portfolio’s performance. During the most recent fiscal year, the Portfolio’s turnover rate was 10% of the average value of its portfolio.
Principal Investment StrategiesThe Portfolio employs an indexing investment approach designed to track the performance of the MSCI US Investable Market Real Estate 25/50 Index. The Index is made up of stocks of large, mid-size, and small U.S. companies within the real estate sector, as classified under the Global Industry Classification Standard (GICS). The GICS real estate sector is composed of equity real estate investment trusts (known as REITs), which includes specialized REITs, and real estate management and development companies. The Portfolio attempts to replicate the Index by investing all, or substantially all, of its assets in the stocks that make up the Index, holding each stock in approximately the same proportion as its weighting in the Index.
Principal RisksAn investment in the Portfolio could lose money over short or long periods of time. You should expect the Portfolio’s share price and total return to fluctuate within a wide range. The Portfolio is subject to the following risks, which could affect the Portfolio’s performance:
• Industry concentration risk, which is the chance that the stocks of REITs and other real estate-related investments will decline because of adverse developments affecting the real estate industry and real property values. Because the Portfolio concentrates its assets in these stocks, industry concentration risk is high.
• Stock market risk, which is the chance that stock prices overall will decline. Stock markets tend to move in cycles, with periods of rising prices and periods of falling prices. The Portfolio’s target index may, at times, become focused in stocks of a limited number of companies, which could cause the Portfolio to underperform the overall stock market.
• Asset concentration risk, which is the chance that, because the Portfolio’s target index (and therefore the Portfolio) tends to be heavily weighted in its ten largest holdings, the Portfolio’s performance may be hurt disproportionately by the poor performance of relatively few stocks.
Annual Portfolio Operating Expenses(Expenses that you pay each year as a percentage of the value of your investment)
Management Fees 0.24%
12b-1 Distribution Fee None
Other Expenses 0.03%
Total Annual Operating Expenses 0.27%
1 Year 3 Years 5 Years 10 Years
$28 $87 $152 $343

44
• Interest rate risk, which is the chance that REIT stock prices overall will decline and that the cost of borrowing for REITs will increase because of rising interest rates. Interest rate risk is high for the Portfolio.
• Investment style risk, which is the chance that returns from REIT stocks—which typically are small- or mid-capitalization stocks—will trail returns from the overall stock market. Historically, REIT stocks have performed quite differently from the overall market.
An investment in the Portfolio is not a deposit of a bank and is not insured or guaranteed by the Federal Deposit Insurance Corporation or any other government agency.
Annual Total ReturnsThe following bar chart and table are intended to help you understand the risks of investing in the Portfolio. The bar chart shows how the performance of the Portfolio has varied from one calendar year to another over the periods shown. The table shows how the average annual total returns of the Portfolio compare with those of the Portfolio’s target index and other comparative indexes, which have investment characteristics similar to those of the Portfolio. The VVIF Real Estate Spliced Index reflects performance of the MSCI US REIT Index adjusted to include a 2% cash position (Lipper Money Market Average) through April 30, 2009; the MSCI US REIT Index through January 17, 2018; and the MSCI US Investable Market Real Estate 25/50 Index thereafter. Effective January 18, 2018, the Portfolio began tracking the MSCI US Investable Market Real Estate 25/50 Index as its target index. The Portfolio’s board of trustees believes that the current index is more closely aligned with the Portfolio’s new investment objective. The Portfolio’s returns are net of its expenses but do not reflect additional fees and expenses that are deducted by the annuity or life insurance program through which you invest. If such fees and expenses were included in the calculation of the Portfolio’s returns, the returns would be lower. Keep in mind that the Portfolio’s past performance does not indicate how the Portfolio will perform in the future. Updated performance information is available on our website for Financial Advisors at advisors.vanguard.com or by calling Vanguard toll-free at 800-522-5555.
During the periods shown in the bar chart, the highest return for a calendar quarter was 34.45% (quarter ended September 30, 2009), and the lowest return for a quarter was –38.26% (quarter ended December 31, 2008).
Investment AdvisorThe Vanguard Group, Inc. (Vanguard)
Portfolio Managers
Walter Nejman, Portfolio Manager at Vanguard. He has co-managed the Portfolio since 2016.
Gerard C. O’Reilly, Principal of Vanguard. He has managed the Portfolio since its inception in 1999 (co-managed since 2016).
Annual Total Returns — Real Estate Index Portfolio
Average Annual Total Returns for Periods Ended December 31, 2017
1 Year 5 Years 10 Years
Real Estate Index Portfolio 4.78% 9.09% 7.42%
Comparative Indexes(reflect no deduction for fees or expenses)
MSCI US REIT Index 5.07% 9.34% 7.44%
VVIF Real Estate Spliced Index 5.07 9.34 7.63
MSCI US Investable Market Real Estate 25/50 Index 9.05 0.00 0.00
-37.25
29.14 28.25
8.4417.46
2.33
30.11
2.22 8.36 4.78
60%
40%
20%
0%
-20%
-40%
-60%
2008 2009 2010 2011 2012 2013 2014 2015 2016 2017

45
Tax InformationThe Portfolio normally distributes its net investment income and net realized capital gains, if any, to its shareholders, which are the insurance company separate accounts that sponsor your variable annuity or variable life insurance contract. The tax consequences to you of your investment in the Portfolio depend on the provisions of the annuity or life insurance contract through which you invest. For more information on taxes, please refer to the prospectus of the annuity or life insurance contract through which Portfolio shares are offered.
Payments to Financial IntermediariesThe Portfolio and its investment advisor do not pay financial intermediaries for sales of Portfolio shares.
CFA® is a registered trademark owned by CFA Institute.
Vanguard funds are not sponsored, endorsed, sold, or promoted by the University of Chicago or its Center for Research in Security Prices, and neither the University of Chicago nor its Center for Research in Security Prices makes any representation regarding the advisability of investing in the funds.
THESE FUNDS ARE NOT SPONSORED, ENDORSED, SOLD OR PROMOTED BY MSCI INC. (“MSCI”), ANY OF ITS AFFILIATES, ANY OF ITS DIRECT OR INDIRECT INFORMATION PROVIDERS OR ANY OTHER THIRD PARTY INVOLVED IN, OR RELATED TO, COMPILING, COMPUTING OR CREATING ANY MSCI INDEX (COLLECTIVELY, THE “MSCI PARTIES”). THE MSCI INDEXES ARE THE EXCLUSIVE PROPERTY OF MSCI. MSCI AND THE MSCI INDEX NAMES ARE SERVICE MARK(S) OF MSCI OR ITS AFFILIATES AND HAVE BEEN LICENSED FOR USE FOR CERTAIN PURPOSES BY VANGUARD. NONE OF THE MSCI PARTIES MAKES ANY REPRESENTATION OR WARRANTY, EXPRESS OR IMPLIED, TO THE OWNERS OF THESE FUNDS OR ANY MEMBER OF THE PUBLIC REGARDING THE ADVISABILITY OF INVESTING IN FUNDS GENERALLY OR IN THESE FUNDS PARTICULARLY OR THE ABILITY OF ANY MSCI INDEX TO TRACK CORRESPONDING STOCK MARKET PERFORMANCE. MSCI OR ITS AFFILIATES ARE THE LICENSORS OF CERTAIN TRADEMARKS, SERVICE MARKS AND TRADE NAMES AND OF THE MSCI INDEXES WHICH ARE DETERMINED, COMPOSED AND CALCULATED BY MSCI WITHOUT REGARD TO THESE FUNDS OR THE ISSUER OR OWNER OF THESE FUNDS. NONE OF THE MSCI PARTIES HAS ANY OBLIGATION TO TAKE THE NEEDS OF THE ISSUERS OR OWNERS OF THESE FUNDS INTO CONSIDERATION IN DETERMINING, COMPOSING OR CALCULATING THE MSCI INDEXES. NONE OF THE MSCI PARTIES IS RESPONSIBLE FOR OR HAS PARTICIPATED IN THE DETERMINATION OF THE TIMING OF, PRICES AT, OR QUANTITIES OF THESE FUNDS TO BE ISSUED OR IN THE DETERMINATION OR CALCULATION OF THE CONSIDERATION INTO WHICH THESE FUNDS ARE REDEEMABLE. NONE OF THE MSCI PARTIES HAS ANY OBLIGATION OR LIABILITY TO THE OWNERS OF THESE FUNDS IN CONNECTION WITH THE ADMINISTRATION, MARKETING OR OFFERING OF THESE FUNDS.
ALTHOUGH MSCI SHALL OBTAIN INFORMATION FOR INCLUSION IN OR FOR USE IN THE CALCULATION OF THE MSCI INDEXES FROM SOURCES WHICH MSCI CONSIDERS RELIABLE, NONE OF THE MSCI PARTIES WARRANTS OR GUARANTEES THE ORIGINALITY, ACCURACY AND/OR THE COMPLETENESS OF ANY MSCI INDEX OR ANY DATA INCLUDED THEREIN. NONE OF THE MSCI PARTIES MAKES ANY WARRANTY, EXPRESS OR IMPLIED, AS TO RESULTS TO BE OBTAINED BY LICENSEE, LICENSEE’S CUSTOMERS OR COUNTERPARTIES, ISSUERS OF THE FUNDS, OWNERS OF THE FUNDS, OR ANY OTHER PERSON OR ENTITY, FROM THE USE OF ANY MSCI INDEX OR ANY DATA INCLUDED THEREIN IN CONNECTION WITH THE RIGHTS LICENSED HEREUNDER OR FOR ANY OTHER USE. NONE OF THE MSCI PARTIES SHALL HAVE ANY LIABILITY FOR ANY ERRORS, OMISSIONS OR INTERRUPTIONS OF OR IN CONNECTION WITH ANY MSCI INDEX OR ANY DATA INCLUDED THEREIN. FURTHER, NONE OF THE MSCI PARTIES MAKES ANY EXPRESS OR IMPLIED WARRANTIES OF ANY KIND, AND THE MSCI PARTIES HEREBY EXPRESSLY DISCLAIM ALL WARRANTIES OF MERCHANTABILITY OR FITNESS FOR A PARTICULAR PURPOSE, WITH RESPECT TO ANY MSCI INDEX AND ANY DATA INCLUDED THEREIN. WITHOUT LIMITING ANY OF THE FOREGOING, IN NO EVENT SHALL ANY OF THE MSCI PARTIES HAVE ANY LIABILITY FOR ANY DIRECT, INDIRECT, SPECIAL, PUNITIVE, CONSEQUENTIAL OR ANY OTHER DAMAGES (INCLUDING WITHOUT LIMITATION LOST PROFITS) EVEN IF NOTIFIED OF THE POSSIBILITY OF SUCH DAMAGES.
The “S&P 500 Index” (the “Index”) is a product of S&P Dow Jone Indices LLC (“SPDJI”), and has been licensed for use by Vanguard. Standard & Poor’s® and S&P® are registered trademarks of Standard & Poor’s Financial Services LLC (“S&P”); Dow Jones® is a registered trademark of Dow Jones Trademark Holdings LLC (“Dow Jones”); S&P® and S&P 500® are trademarks of S&P; and these trademarks have been licensed for use by SPDJI and sublicensed for certain purposes by Vanguard. Vanguard Equity Index Portfolio is not sponsored, endorsed, sold or promoted by SPDJI, Dow Jones, S&P, or any of their respective affiliates (collectively, “S&P Dow Jones Indices”). S&P Dow Jones Indices make no representation or warranty, express or implied, to the owners of the Vanguard Equity Index Portfolio or any member of the public regarding the advisability of investing in securities generally or in Vanguard Equity Index Portfolio particularly or the ability of the S&P 500 Index to track general market performance. S&P Dow Jones Indices’ only relationship to Vanguard with respect to the S&P 500 Index is the licensing of the Index and certain trademarks, service marks and/or trade names of S&P Dow Jones Indices and/or its licensors. The S&P 500 Index is determined, composed and calculated by S&P Dow Jones Indices without regard to Vanguard or the Vanguard Equity Index Portfolio. S&P Dow Jones Indices have no obligation to take the needs of Vanguard or the owners of Vanguard Equity Index Portfolio into consideration in determining, composing or calculating the S&P 500 Index. S&P Dow Jones Indices are not responsible for and have not participated in the determination of the prices, and amount of Vanguard Equity Index Portfolio or the timing of the issuance or sale of Vanguard Equity Index Portfolio or in the determination or calculation of the equation by which Vanguard Equity Index Portfolio is to be converted into cash, surrendered or redeemed, as the case may be. S&P Dow Jones Indices has no obligation or liability in connection with the administration, marketing or trading of Vanguard Equity Index Portfolio. There is no assurance that investment products based on the S&P 500 Index will accurately track index performance or provide positive investment returns. S&P Dow Jones Indices LLC is not an investment advisor. Inclusion of a security within an index is not a recommendation by S&P Dow Jones Indices to buy, sell, or hold such security, nor is it considered to be investment advice.
S&P DOW JONES INDICES DOES NOT GUARANTEE THE ADEQUACY, ACCURACY, TIMELINESS AND/OR THE COMPLETENESS OF THE INDEX OR ANY DATA RELATED THERETO OR ANY COMMUNICATION, INCLUDING BUT NOT LIMITED TO, ORAL OR WRITTEN COMMUNICATION (INCLUDING ELECTRONIC COMMUNICATIONS) WITH RESPECT THERETO. S&P DOW JONES INDICES SHALL NOT BE SUBJECT TO ANY DAMAGES OR LIABILITY FOR ANY ERRORS, OMISSIONS, OR DELAYS THEREIN. S&P DOW JONES INDICES MAKES NO EXPRESS OR IMPLIED WARRANTIES, AND EXPRESSLY DISCLAIMS ALL WARRANTIES OR CONDITIONS OF MERCHANTABILITY OR FITNESS FOR A PARTICULAR PURPOSE OR USE OR AS TO RESULTS TO BE OBTAINED BY VANGUARD, OWNERS OF THE VANGUARD EQUITY INDEX PORTFOLIO, OR ANY OTHER PERSON OR ENTITY FROM THE USE OF THE INDEX OR WITH RESPECT TO ANY DATA RELATED THERETO. WITHOUT LIMITING ANY OF THE FOREGOING, IN NO EVENT WHATSOEVER SHALL S&P DOW JONES INDICES BE LIABLE FOR ANY INDIRECT, SPECIAL, INCIDENTAL, PUNITIVE, OR CONSEQUENTIAL DAMAGES INCLUDING BUT NOT LIMITED TO, LOSS OF PROFITS, TRADING LOSSES, LOST TIME OR GOODWILL, EVEN IF THEY HAVE BEEN ADVISED OF THE POSSIBILITY OF SUCH DAMAGES, WHETHER IN CONTRACT, TORT, STRICT LIABILITY, OR OTHERWISE. THERE ARE NO THIRD PARTY BENEFICIARIES OF ANY AGREEMENTS OR ARRANGEMENTS BETWEEN S&P DOW JONES INDICES AND VANGUARD, OTHER THAN THE LICENSORS OF S&P DOW JONES INDICES.
BLOOMBERG is a trademark and service mark of Bloomberg Finance L.P. BARCLAYS is a trademark and service mark of Barclays Bank Plc, used under license. Bloomberg Finance L.P. and its affiliates, including Bloomberg Index Services Limited (BISL) (collectively, Bloomberg), or Bloomberg’s licensors, own all proprietary rights in the Bloomberg Barclays U.S. 1-5 Year Credit Bond Index, Bloomberg Barclays U.S. Aggregate Bond Index, Bloomberg Barclays U.S. Aggregate Float Adjusted Index, and Bloomberg Barclays U.S. Corporate High Yield Bond Index (the Indices or Bloomberg Barclays Indices).
Neither Barclays Bank Plc, Barclays Capital Inc., or any affiliate (collectively Barclays) or Bloomberg is the issuer or producer of the Total Bond Market Index Portfolio, the Conservative Allocation Portfolio,the Global Bond Index Portfolio, the High Yield Bond Portfolio and the Money Market Portfolio and neither Bloomberg nor Barclays has any responsibilities, obligations or duties to investors in the aforementioned Portfolios. The Indices are licensed for use by The Vanguard Group, Inc. (Vanguard) as the sponsor of the

aforementioned Portfolios. Bloomberg and Barclays’ only relationship with Vanguard in respect to the Indices is the licensing of the Indices, which is determined, composed and calculated by BISL, or any successor thereto, without regard to the Issuer or the aforementioned Portfolios or the owners of the aforementioned Portfolios.
Additionally, Vanguard may for itself execute transaction(s) with Barclays in or relating to the Indices in connection with the aforementioned Portfolios. Investors acquire the aforementioned Portfolios from Vanguard and investors neither acquire any interest in the Indices nor enter into any relationship of any kind whatsoever with Bloomberg or Barclays upon making an investment in the aforementioned Portfolios. The aforementioned Portfolios are not sponsored, endorsed, sold or promoted by Bloomberg or Barclays. Neither Bloomberg nor Barclays makes any representation or warranty, express or implied regarding the advisability of investing in the aforementioned Portfolios or the advisability of investing in securities generally or the ability of the Indices to track corresponding or relative market performance. Neither Bloomberg nor Barclays has passed on the legality or suitability of the aforementioned Portfolios with respect to any person or entity. Neither Bloomberg nor Barclays is responsible for and has not participated in the determination of the timing of, prices at, or quantities of the aforementioned Portfolios to be issued. Neither Bloomberg nor Barclays has any obligation to take the needs of the Issuer or the owners of the aforementioned Portfolios or any other third party into consideration in determining, composing or calculating the Indices. Neither Bloomberg nor Barclays has any obligation or liability in connection with administration, marketing or trading of the aforementioned Portfolios.
The licensing agreement between Bloomberg and Barclays is solely for the benefit of Bloomberg and Barclays and not for the benefit of the owners of the aforementioned Portfolios, investors or other third parties. In addition, the licensing agreement between Vanguard and Bloomberg is solely for the benefit of Vanguard and Bloomberg and not for the benefit of the owners of the aforementioned Portfolios, investors or other third parties.
NEITHER BLOOMBERG NOR BARCLAYS SHALL HAVE ANY LIABILITY TO THE ISSUER, INVESTORS OR TO OTHER THIRD PARTIES FOR THE QUALITY, ACCURACY AND/OR COMPLETENESS OF THE BLOOMBERG BARCLAYS INDICES OR ANY DATA INCLUDED THEREIN OR FOR INTERRUPTIONS IN THE DELIVERY OF THE BLOOMBERG BARCLAYS INDICES. NEITHER BLOOMBERG NOR BARCLAYS MAKES ANY WARRANTY, EXPRESS OR IMPLIED, AS TO RESULTS TO BE OBTAINED BY THE ISSUER, THE INVESTORS OR ANY OTHER PERSON OR ENTITY FROM THE USE OF THE BLOOMBERG BARCLAYS INDICES OR ANY DATA INCLUDED THEREIN. NEITHER BLOOMBERG NOR BARCLAYS MAKES ANY EXPRESS OR IMPLIED WARRANTIES, AND EACH HEREBY EXPRESSLY DISCLAIMS ALL WARRANTIES OF MERCHANTABILITY OR FITNESS FOR A PARTICULAR PURPOSE OR USE WITH RESPECT TO BLOOMBERG BARCLAYS INDICES OR ANY DATA INCLUDED THEREIN. BLOOMBERG RESERVES THE RIGHT TO CHANGE THE METHODS OF CALCULATION OR PUBLICATION, OR TO CEASE THE CALCULATION OR PUBLICATION OF THE BLOOMBERG BARCLAYS INDICES, AND NEITHER BLOOMBERG NOR BARCLAYS SHALL BE LIABLE FOR ANY MISCALCULATION OF OR ANY INCORRECT, DELAYED OR INTERRUPTED PUBLICATION WITH RESPECT TO ANY OF THE BLOOMBERG BARCLAYS INDICES. NEITHER BLOOMBERG NOR BARCLAYS SHALL BE LIABLE FOR ANY DAMAGES, INCLUDING, WITHOUT LIMITATION, ANY SPECIAL, INDIRECT OR CONSEQUENTIAL DAMAGES, OR ANY LOST PROFITS AND EVEN IF ADVISED OF THE POSSIBLITY OF SUCH, RESULTING FROM THE USE OF BLOOMBERG BARCLAYS INDICES OR ANY DATA INCLUDED THEREIN OR WITH RESPECT TO THE AFOREMENTIONED PORTFOLIOS.
None of the information supplied by Bloomberg or Barclays and used in this publication may be reproduced in any manner without the prior written permission of both Bloomberg and Barclays Capital, the investment banking division of Barclays Bank Plc. Barclays Bank Plc is registered in England No. 1026167. Registered office 1 Churchill Place London E14 5HP.
SP 64 052018

SP 64 052018
Transamerica Premier Life Insurance Company