Vanguard Market Neutral Fund2 • For the 12 months ended December 31, 2019, Vanguard Market Neutral...
32
See the inside front cover for important information about access to your fund’s annual and semiannual shareholder reports. Annual Report | December 31, 2019 Vanguard Market Neutral Fund
Transcript of Vanguard Market Neutral Fund2 • For the 12 months ended December 31, 2019, Vanguard Market Neutral...

See the inside front cover for important information about accessto your fund’s annual and semiannual shareholder reports.
Annual Report | December 31, 2019
Vanguard Market Neutral Fund

Contents
Please note: The opinions expressed in this report are just that—informed opinions. They should not be considered promisesor advice. Also, please keep in mind that the information and opinions cover the period through the date on the front of thisreport. Of course, the risks of investing in your fund are spelled out in the prospectus.
Important information about access to shareholder reports
Beginning on January 1, 2021, as permitted by regulations adopted by theSecurities and Exchange Commission, paper copies of your fund’s annual andsemiannual shareholder reports will no longer be sent to you by mail, unless youspecifically request them. Instead, you will be notified by mail each time a reportis posted on the website and will be provided with a link to access the report.
If you have already elected to receive shareholder reports electronically, you will notbe affected by this change and do not need to take any action. You may elect toreceive shareholder reports and other communications from the fund electronicallyby contacting your financial intermediary (such as a broker-dealer or bank) or, if youinvest directly with the fund, by calling Vanguard at one of the phone numbers onthe back cover of this report or by logging on to vanguard.com.
You may elect to receive paper copies of all future shareholder reports freeof charge. If you invest through a financial intermediary, you can contact theintermediary to request that you continue to receive paper copies. If you investdirectly with the fund, you can call Vanguard at one of the phone numbers on theback cover of this report or log on to vanguard.com. Your election to receive papercopies will apply to all the funds you hold through an intermediary or directly withVanguard.
A Note From Our Chairman. . . . . . . . . . . . . . . . . . . . . . . . . . 1
Your Fund’s Performance at a Glance. . . . . . . . . . . . . . . . . . 2
Advisor’s Report. . . . . . . . . . . . . . . . . . . . . . . . . . . . . . . . . . . 3
About Your Fund’s Expenses. . . . . . . . . . . . . . . . . . . . . . . . . 5
Performance Summary. . . . . . . . . . . . . . . . . . . . . . . . . . . . . .7
Financial Statements. . . . . . . . . . . . . . . . . . . . . . . . . . . . . . . 9

Dear Shareholder,
Recent volatility in financial markets—affecting stocks, bonds, and commodities— has been a good reminder of the wise old adage, “Never keep all your eggs in one basket.” Maintaining balance and diversification in your investment portfolio can help to both limit risk and set you up for long-term success.
It’s understandable why some investors might become complacent after a long market run-up like the one that lifted stock prices, especially U.S. stock prices, in the years following the global financial crisis. But failing to rebalance regularly can leave a portfolio with a much different mix of assets than intended and, often, more risk than intended.
Balance across and diversification within asset classes are powerful tools for managing risk and achieving your investment goals. A portfolio’s allocation will determine a large portion of its long- term return and also the majority of its volatility risk. A well-diversified portfolio is less vulnerable to significant swings in the performance of any one segment of the asset classes in which it invests.
Balance and diversification will never eliminate the risk of loss, nor will they guarantee positive returns in a declining market. But they may reduce the chance that you’ll suffer disproportionate losses in one particular high-flying asset class or sector when it comes back to earth. And exposure to all key market components should give you at least some participation in the sectors that are performing best at any given time.
Vanguard is committed to helping you achieve balance and diversification in your portfolios to help meet your invest-ment goals. We thank you for your continued loyalty.
Sincerely,
Mortimer J. Buckley Chairman and Chief Executive Officer January 23, 2020
A Note From Our Chairman
Tim BuckleyChairman and Chief Executive Officer
1

2
• For the 12 months ended December 31, 2019, Vanguard Market Neutral Fund returned –9.48% for Institutional Shares and –9.57% for Investor Shares. It fell short of its mandate of beating the returns of 3-month Treasury bills, which gained 2.25%.
• The fund’s stock selection model focuses on five themes that rank a universe of stocks. The sentiment indicator helped performance for the period. The quality, valuation, management decisions, and growth models detracted.
• Stock selection results in 10 of 11 sectors were negative on a relative basis; information technology was the only sector where selection produced positive results. Holdings in consumer discretionary, materials, industrials, and health care were the biggest detractors.
• In November, the fund lowered the investment minimum for Investor Shares to $50,000 from $250,000.
• For the decade ended December 31, 2019, the fund produced an average annual return of 1.08% for Investor Shares and 1.17% for Institutional Shares, ahead of its spliced benchmark.
Your Fund’s Performance at a Glance
Market Barometer Average Annual Total Returns Periods Ended December 31, 2019
One Year Three Years Five Years
Stocks
Russell 1000 Index (Large-caps) 31.43% 15.05% 11.48%
Russell 2000 Index (Small-caps) 25.53 8.59 8.23
Russell 3000 Index (Broad U.S. market) 31.02 14.57 11.24
FTSE All-World ex US Index (International) 21.81 9.96 5.83
Bonds
Bloomberg Barclays U.S. Aggregate Bond Index (Broad taxable market) 8.72% 4.03% 3.05%
Bloomberg Barclays Municipal Bond Index (Broad tax-exempt market) 7.54 4.72 3.53
FTSE Three-Month U.S. Treasury Bill Index 2.25 1.65 1.04
CPI
Consumer Price Index 2.29% 2.10% 1.82%

Advisor’s Report
3
Stocks in the United States surged in 2019, outperforming their international counterparts. The S&P 500 Index returned 31.49% for the 12 months ended December 31, 2019, while the FTSE Global All-Cap ex US Index returned 21.80%. The primary catalysts for the strong results were accommodative monetary policy by the U.S. Federal Reserve and an easing of geopolitical tensions near the end of the year. Corporate earnings were little changed on a year-over-year basis, but investors nonetheless bid up stock valuations.
The year began with concerns about slowing economic growth, tightening fiscal policy, and geopolitical tensions. The market quickly pivoted, however, producing strong first-quarter results thanks to more supportive rhetoric from the Fed and apparent lessening of U.S.-China trade tensions. The middle of 2019 saw a rise in worries over corporate earnings and geopolitical risks. At the end of the year, equities got a boost from the combination of stabilizing economic data, accommodative central banks, and an agreement on a U.S.-China “phase one” trade deal.
The Federal Reserve ended 2019 reversing course from the previous year. After raising interest rates by 25 basis points (0.25 percentage point) in December 2018 (its fourth such increase that year), the Fed cut them three times in 2019, in August, September, and October. At the end of
the year, the target range stood at 1.50%–1.75%, 75 basis points lower than it was at the end of 2018.
The broad fixed income markets generated positive returns, primarily because of stronger-than-expected growth, tame inflation, and continued central bank support. U.S. Treasury yields fell and the Bloomberg Barclays U.S. Aggregate Bond Index, a measure of the broad market of taxable investment-grade bonds in the U.S., returned 8.72% for the year.
Sovereign yields also declined in most markets after the injection of monetary stimulus by the Fed and the European Central Bank (ECB). Investment-grade bonds issued outside of the U.S. returned 8.06%, according to the Bloomberg Barclays Global Aggregate ex-USD Float Adjusted RIC Capped Index Hedged.
In this environment, Vanguard Market Neutral Fund returned –9.57% for Investor Shares and –9.48% for Institutional Shares. The fund fell short of its mandate of exceeding the return of 3-month U.S. Treasury bills, which posted 2.25% for the 12 months. Please note that the fund’s long-term record still achieves that mandate and that the fund does not try to outperform the equity market.

4
Although it’s important to understand how our overall performance is affected by broader macroeconomic and market factors, our approach to investing focuses on specific stock fundamentals and how companies rank relative to their industry peers.
Our model uses five themes—growth, quality, management decisions, sentiment, and valuation—to evaluate companies and generate a composite expected stock return. We seek to capitalize on investor biases by taking long positions in the stocks that our model ranks high and by shorting those that score the lowest. We aim to keep your fund’s sector exposures neutral, because our research has shown that sector bets do not add value over the long term.
For the most part, our stock selection for the year hurt relative performance; only one of the 11 industry sectors helped results. Our choices in information technology aided relative performance, while those in consumer discretionary, materials, industrials, and health care detracted the most.
Our sentiment signal boosted relative returns. The quality, valuation, management decisions, and growth signals detracted. We continue to believe exposure to all the signals offers a compelling investment opportunity.
Long positions in health care companies Arrowhead Pharmaceuticals and Tenet Healthcare, information technology companies Advanced Micro Devices and Lattice Semiconductor, and communication services firm Match Group added most to performance. Short positions in Nevro Corporation and Mirati Therapeutics and long positions in Mallinckrodt and Acorda Therapeutics, all in the health care sector, and a short position in materials holding Hecla Mining, detracted the most.
Despite this year’s headwinds, we remain committed to our investment philosophy and process of identifying companies with strong, consistent fundamental growth at attractive valuations. We believe these remain the tenets of long-term investment success.
Portfolio Managers:
James P. Stetler
Binbin Guo, Principal, Head of Alpha Strategies
Vanguard Quantitative Equity Group
January 22, 2020

About Your Fund’s Expenses
5
As a shareholder of the fund, you incur ongoing costs, which include costs for portfolio management, administrative services, and shareholder reports (like this one), among others. Operating expenses, which are deducted from a fund’s gross income, directly reduce the investment return of the fund.
A fund’s expenses are expressed as a percentage of its average net assets. This figure is known as the expense ratio. The following examples are intended to help you understand the ongoing costs (in dollars) of investing in your fund and to compare these costs with those of other mutual funds. The examples are based on an investment of $1,000 made at the beginning of the period shown and held for the entire period.
The accompanying table illustrates your fund’s costs in two ways:
• Based on actual fund return. This section helps you to estimate the actual expenses that you paid over the period. The ”Ending Account Value“ shown is derived from the fund‘s actual return, and the third column shows the dollar amount that would have been paid by an investor who started with $1,000 in the fund. You may use the information here, together with the amount you invested, to estimate the expenses that you paid over the period.
To do so, simply divide your account value by $1,000 (for example, an $8,600 account value divided by $1,000 = 8.6), then multiply the result by the number given for your fund under the heading ”Expenses Paid During Period.“
• Based on hypothetical 5% yearly return. This section is intended to help you compare your fund‘s costs with those of other mutual funds. It assumes that the fund had a yearly return of 5% before expenses, but that the expense ratio is unchanged. In this case—because the return used is not the fund’s actual return—the results do not apply to your investment. The example is useful in making comparisons because the Securities and Exchange Commission requires all mutual funds to calculate expenses based on a 5% return. You can assess your fund’s costs by comparing this hypothetical example with the hypothetical examples that appear in shareholder reports of other funds.
Note that the expenses shown in the table are meant to highlight and help you compare ongoing costs only and do not reflect transaction costs incurred by the fund for buying and sellingsecurities. Further, the expenses do not include any purchase, redemption, or account servicefees described in the fund prospectus. If such fees were applied to your account, your costswould be higher. Your fund does not carry a “sales load.”
The calculations assume no shares were bought or sold during the period. Your actual costs mayhave been higher or lower, depending on the amount of your investment and the timing of anypurchases or redemptions.
You can find more information about the fund’s expenses, including annual expense ratios, in theFinancial Statements section of this report. For additional information on operating expenses andother shareholder costs, please refer to your fund’s current prospectus.

6
Six Months Ended December 31, 2019
Market Neutral Fund
BeginningAccount Value
6/30/2019
EndingAccount Value
12/31/2019
ExpensesPaid During
Period
Based on Actual Fund Return
Investor Shares $1,000.00 $1,011.40 $7.71
Institutional Shares 1,000.00 1,012.76 7.41
Based on Hypothetical 5% Yearly Return
Investor Shares $1,000.00 $1,017.54 $7.73
Institutional Shares 1,000.00 1,017.85 7.43
The calculations are based on expenses incurred in the most recent six-month period. The fund’s annualized six-month expense ratios forthat period are 1.52% for Investor Shares and 1.46% for Institutional Shares. The dollar amounts shown as “Expenses Paid” are equal tothe annualized expense ratio multiplied by the average account value over the period, multiplied by the number of days in the most recentsix-month period, then divided by the number of days in the most recent 12-month period (184/365).

Performance Summary
All of the returns in this report represent past performance, which is not a guarantee of future results that may be achieved by the fund. (Current performance may be lower or higher thanthe performance data cited. For performance data current to the most recent month-end, visitour website at vanguard.com/performance.) Note, too, that both investment returns and principal value can fluctuate widely, so an investor’s shares, when sold, could be worth more or less than their original cost. The returns shown do not reflect taxes that a shareholder would pay on fund distributions or on the sale of fund shares.
See Financial Highlights for dividend and capital gains information.
Market Neutral Fund
7
Cumulative Performance: December 31, 2009, Through December 31, 2019Initial Investment of $50,000
2019201820172016201520142013201220112010
$179,000
30,00055,680
Average Annual Total ReturnsPeriods Ended December 31, 2019
OneYear
FiveYears
TenYears
Final Valueof a $50,000Investment
Market Neutral Fund Investor Shares -9.57% -1.32% 1.08% $55,680
• • • • • • • Spliced Market Neutral Index 2.25 1.04 0.55 52,815_________ Dow Jones U.S. Total Stock Market
Float Adjusted Index 30.90 11.18 13.43 176,256
Spliced Market Neutral Index: Citigroup 3-Month U.S. Treasury Bill Index through March 31, 2016; FTSE 3-Month Treasury Bill Indexthereafter.
OneYear
FiveYears
TenYears
Final Valueof a $5,000,000
Investment
Market Neutral Fund Institutional Shares -9.48% -1.24% 1.17% $5,618,811
Spliced Market Neutral Index 2.25 1.04 0.55 5,281,520
Dow Jones U.S. Total Stock Market FloatAdjusted Index 30.90 11.18 13.43 17,625,579

Sector DiversificationAs of December 31, 2019
Market Neutral Fund
8
The Global Industry Classification Standard (“GICS”) was developed by and is the exclusive property and a service markof MSCI Inc. (“MSCI”) and Standard and Poor’s, a division of McGraw-Hill Companies, Inc. (“S&P”), and is licensed for useby Vanguard. Neither MSCI, S&P nor any third party involved in making or compiling the GICS or any GICS classificationmakes any express or implied warranties or representations with respect to such standard or classification (or the resultsto be obtained by the use thereof), and all such parties hereby expressly disclaim all warranties of originality, accuracy,completeness, merchantability or fitness for a particular purpose with respect to any such standard or classification.Without limiting any of the foregoing, in no event shall MSCI, S&P, any of its affiliates or any third party involved inmaking or compiling the GICS or any GICS classification have any liability for any direct, indirect, special, punitive,consequential or any other damages (including lost profits) even if notified of the possibility of such damages.
LongPortfolio
ShortPortfolio
Communication Services 3.3% 3.5%
Consumer Discretionary 13.5 13.2
Consumer Staples 3.2 2.9
Energy 3.2 3.0
Financials 15.4 15.8
Health Care 14.3 14.2
Industrials 16.2 16.5
Information Technology 17.4 17.0
Materials 4.2 4.4
Real Estate 6.0 6.3
Utilities 3.3 3.2
The table reflects the fund’s equity exposure, based on itsinvestments in stocks and stock index futures. Any holdings inshort-term reserves are excluded. Sector categories are based onthe Global Industry Classification Standard (“GICS”), except for the“Other” category (if applicable), which includes securities thathave not been provided a GICS classification as of the effectivereporting period.

Financial Statements
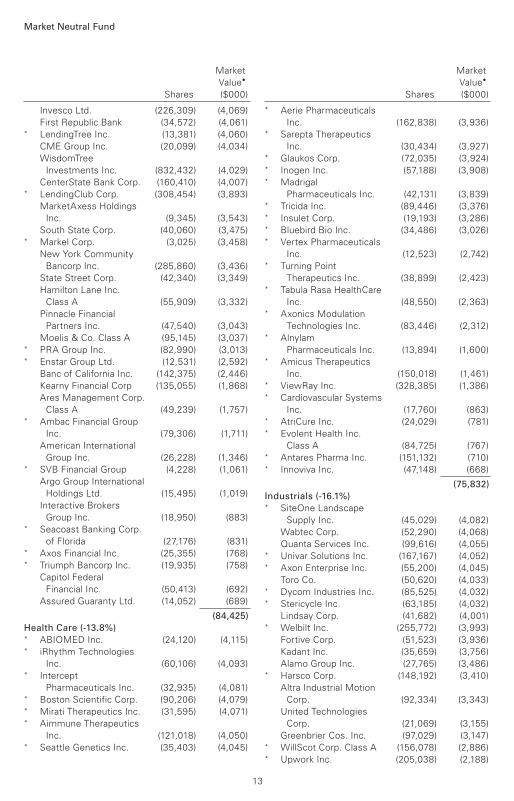
Statement of Net AssetsAs of December 31, 2019
Market Neutral Fund
Market
Value•
Shares ($000)
Market
Value•
Shares ($000)
Common Stocks – Long Positions (97.3%)
Communication Services (3.2%) *,† Discovery Inc. Series A 123,743 4,051* Take-Two Interactive
Software Inc. 29,454 3,606* Glu Mobile Inc. 438,266 2,652*,† MSG Networks Inc. 112,098 1,951* Alphabet Inc. Class C 1,048 1,401* EverQuote Inc. Class A 36,679 1,260*,^ Match Group Inc. 15,151 1,244*,† Liberty TripAdvisor
Holdings Inc. Class A 114,053 838† News Corp. Class B 57,166 829
17,832
Consumer Discretionary (13.1%)
Whirlpool Corp. 27,751 4,094
Wingstop Inc. 47,188 4,069† Rent-A-Center Inc. 140,503 4,052† Newell Brands Inc. 210,791 4,051† Gentex Corp. 138,749 4,021*,† SeaWorld Entertainment
Inc. 124,308 3,942† International Game
Technology plc 256,953 3,847*,† RH 17,916 3,825*,† Under Armour Inc.
Class C 180,961 3,471*,† Qurate Retail Group Inc.
QVC Group Class A 403,180 3,399*,† frontdoor Inc. 67,943 3,222* Booking Holdings Inc. 1,444 2,966*,† Skyline Champion Corp. 92,132 2,921*,† Everi Holdings Inc. 202,661 2,722
Starbucks Corp. 27,709 2,436*,† Conn’s Inc. 192,909 2,390*,† Adient plc 105,167 2,235
eBay Inc. 48,036 1,734*,† Taylor Morrison Home
Corp. Class A 78,321 1,712*,^ YETI Holdings Inc. 48,518 1,687*,† 1-800-Flowers.com Inc.
Class A 102,253 1,483
*,† Stoneridge Inc. 48,576 1,424*,† Boot Barn Holdings Inc. 29,582 1,317*,† American Axle &
Manufacturing Holdings
Inc. 107,249 1,154* Gentherm Inc. 17,082 758
Home Depot Inc. 3,296 720* Meritage Homes Corp. 10,744 656* Funko Inc. Class A 35,650 612* Genesco Inc. 12,711 609
Signet Jewelers Ltd. 25,794 561
72,090
Consumer Staples (3.1%) † Bunge Ltd. 66,314 3,816
Coca-Cola Consolidated
Inc. 12,945 3,677*,† Edgewell Personal
Care Co. 65,983 2,043
Fresh Del Monte
Produce Inc. 50,498 1,767† Medifast Inc. 14,176 1,553
Ingles Markets Inc.
Class A 27,090 1,287† Coty Inc. Class A 74,021 833* elf Beauty Inc. 44,434 717
Kraft Heinz Co. 19,880 639
John B Sanfilippo &
Son Inc. 6,840 624
16,956
Energy (3.1%) * Southwestern Energy
Co. 1,746,685 4,227† ConocoPhillips 62,803 4,084*,† CONSOL Energy Inc. 178,996 2,597*,^,† California Resources
Corp. 235,473 2,126† Delek US Holdings Inc. 38,180 1,280
Range Resources Corp. 234,356 1,137
DHT Holdings Inc. 97,392 807* Dorian LPG Ltd. 49,816 771
17,029
The fund files its complete schedule of portfolio holdings with the Securities and Exchange
Commission (SEC) for the first and third quarters of each fiscal year as an exhibit to its reports
on Form N-PORT. The fund’s Form N-PORT reports are available on the SEC’s website at
www.sec.gov.
9

Market Neutral Fund
Market
Value•
Shares ($000)
Market
Value•
Shares ($000)
Financials (15.0%) † Popular Inc. 69,582 4,088† MetLife Inc. 80,158 4,086† Primerica Inc. 31,243 4,079† Regions Financial Corp. 237,630 4,078† AXA Equitable Holdings
Inc. 164,214 4,069† LPL Financial Holdings
Inc. 44,082 4,067
Discover Financial
Services 47,927 4,065*,† Mr Cooper Group Inc. 324,358 4,058† Synchrony Financial 112,534 4,052† Walker & Dunlop Inc. 62,230 4,025† Navient Corp. 293,413 4,014*,† Enova International Inc. 166,092 3,996† Universal Insurance
Holdings Inc. 131,893 3,692† Brightsphere Investment
Group Inc. 328,568 3,358† OFG Bancorp 134,582 3,177† Bank of NT Butterfield
& Son Ltd. 84,635 3,133† MGIC Investment Corp. 182,806 2,590* Athene Holding Ltd.
Class A 45,420 2,136* Brighthouse Financial
Inc. 48,829 1,915† Radian Group Inc. 75,104 1,890
Piper Jaffray Cos. 18,677 1,493* Encore Capital Group
Inc. 38,996 1,379† FNB Corp. 99,187 1,260
National General
Holdings Corp. 55,285 1,222
PennyMac Financial
Services Inc. 31,256 1,064
Voya Financial Inc. 16,197 988† Ally Financial Inc. 32,127 982
Citigroup Inc. 9,517 760
Stewart Information
Services Corp. 16,714 682
Virtus Investment
Partners Inc. 4,839 589
Artisan Partners Asset
Management Inc.
Class A 17,279 558† Nelnet Inc. Class A 9,586 558*,† NMI Holdings Inc.
Class A 15,000 498
82,601
Health Care (13.9%) * PRA Health Sciences Inc. 36,895 4,101* IQVIA Holdings Inc. 26,420 4,082
*,† Tenet Healthcare Corp. 106,912 4,066*,† Medpace Holdings Inc. 48,290 4,059* Veeva Systems Inc.
Class A 28,850 4,058*,† Syneos Health Inc. 68,140 4,053*,† Esperion Therapeutics
Inc. 67,832 4,045*,† Integer Holdings Corp. 50,113 4,031† AbbVie Inc. 45,490 4,028* Novocure Ltd. 46,393 3,910*,† Quidel Corp. 51,062 3,831* DaVita Inc. 49,801 3,737† Bruker Corp. 71,828 3,661*,† Ironwood Pharmaceuticals
Inc. Class A 262,873 3,499*,^ Intrexon Corp. 574,758 3,150*,† STAAR Surgical Co. 79,060 2,781*,† Lantheus Holdings Inc. 102,529 2,103*,† Enanta Pharmaceuticals
Inc. 32,158 1,987*,† BioTelemetry Inc. 42,861 1,984* Prestige Consumer
Healthcare Inc. 43,593 1,766
Mesa Laboratories Inc. 5,310 1,324
McKesson Corp. 6,661 921* Amneal
Pharmaceuticals Inc. 190,120 916* OPKO Health Inc. 581,168 854* Endo International plc 155,510 729
Dentsply Sirona Inc. 10,999 622* Vanda Pharmaceuticals
Inc. 36,773 603*,† Spectrum
Pharmaceuticals Inc. 154,996 564* NanoString Technologies
Inc. 20,162 561* Fluidigm Corp. 118,201 411* Alkermes plc 11,879 242
76,679
Industrials (15.8%)
Oshkosh Corp. 43,083 4,078† Triton International Ltd. 101,241 4,070† Allison Transmission
Holdings Inc. 84,169 4,067† WW Grainger Inc. 11,996 4,061*,† Builders FirstSource Inc. 159,564 4,055
Spirit AeroSystems
Holdings Inc. Class A 55,548 4,048*,† Atkore International
Group Inc. 99,649 4,032* United Rentals Inc. 24,101 4,019*,† WESCO International Inc. 67,640 4,017† Kforce Inc. 98,005 3,891† Nielsen Holdings plc 188,432 3,825
10

Market Neutral Fund
Market
Value•
Shares ($000)
Market
Value•
Shares ($000)
† Armstrong World
Industries Inc. 39,660 3,727*,† GMS Inc. 128,837 3,489*,† BMC Stock Holdings Inc. 119,249 3,421*,† Herc Holdings Inc. 69,179 3,386* MasTec Inc. 52,171 3,347*,† Navistar International
Corp. 109,472 3,168† Triumph Group Inc. 122,505 3,096*,† Foundation Building
Materials Inc. 123,280 2,385† GrafTech International
Ltd. 178,869 2,078* American Woodmark
Corp. 18,137 1,896† Pentair plc 36,423 1,671
Terex Corp. 54,295 1,617† Rush Enterprises Inc.
Class A 34,342 1,597*,† FTI Consulting Inc. 11,733 1,298† Korn Ferry 29,615 1,256
Landstar System Inc. 10,802 1,230*,† TrueBlue Inc. 36,346 874
Wabash National Corp. 59,162 869* JetBlue Airways Corp. 43,251 810*,† Echo Global Logistics Inc. 37,342 773*,† Aerojet Rocketdyne
Holdings Inc. 12,217 558
86,709
Information Technology (16.9%) *,† Cardtronics plc Class A 92,727 4,140*,† Dell Technologies Inc. 79,704 4,096† Seagate Technology plc 68,705 4,088† Booz Allen Hamilton
Holding Corp. Class A 57,437 4,085† CDW Corp. 28,588 4,083† Avnet Inc. 96,080 4,078*,† Workiva Inc. Class A 96,612 4,063† Jabil Inc. 97,894 4,046*,† Synaptics Inc. 61,287 4,031*,† Advanced Micro Devices
Inc. 87,822 4,028*,† Lattice Semiconductor
Corp. 210,357 4,026*,† Sykes Enterprises Inc. 108,786 4,024* Cadence Design
Systems Inc. 57,976 4,021*,† Diebold Nixdorf Inc. 373,264 3,942† HP Inc. 191,413 3,934*,† Atlassian Corp. plc
Class A 31,365 3,774*,† SunPower Corp. 477,203 3,722*,† CACI International Inc.
Class A 14,276 3,569
*,† NCR Corp. 79,162 2,783*,† Five9 Inc. 41,275 2,707
Western Digital Corp. 38,066 2,416* Square Inc. 31,815 1,990
ManTech International
Corp. Class A 21,606 1,726
Plantronics Inc. 41,542 1,136*,† Amkor Technology Inc. 82,896 1,078* Plexus Corp. 13,638 1,049* Virtusa Corp. 22,917 1,039* TTM Technologies Inc. 63,338 953*,† Extreme Networks Inc. 126,758 934* Teradata Corp. 32,795 878
Benchmark Electronics
Inc. 20,739 713
Microsoft Corp. 3,643 574† ADTRAN Inc. 56,547 559* Insight Enterprises Inc. 7,781 547
92,832
Materials (4.1%) *,† Element Solutions Inc. 351,440 4,105*,† Allegheny Technologies
Inc. 194,631 4,021† CF Industries Holdings
Inc. 84,036 4,012† Valvoline Inc. 152,442 3,264† Trinseo SA 77,212 2,873† Greif Inc. Class A 37,355 1,651* Axalta Coating Systems
Ltd. 44,314 1,347* Koppers Holdings Inc. 19,295 737* Kraton Corp. 22,821 578
22,588
Real Estate (5.9%) † Sabra Health Care REIT
Inc. 192,583 4,110† Brixmor Property Group
Inc. 188,644 4,077† Park Hotels & Resorts
Inc. 156,599 4,051† GEO Group Inc. 243,433 4,043† Hannon Armstrong
Sustainable Infrastructure
Capital Inc. 124,776 4,015
Mid-America Apartment
Communities Inc. 17,568 2,317† CoreCivic Inc. 102,812 1,787^,† Tanger Factory Outlet
Centers Inc. 121,128 1,784
Kennedy-Wilson
Holdings Inc. 56,584 1,262† SITE Centers Corp. 89,831 1,259† Spirit Realty Capital Inc. 16,380 806
11

Market Neutral Fund
Market
Value•
Shares ($000)
Market
Value•
Shares ($000)
American Finance Trust
Inc. 53,693 712
Office Properties
Income Trust 21,931 705
Colony Capital Inc. 146,486 696^ Washington Prime
Group Inc. 171,840 625
32,249
Utilities (3.2%) † Southern Co. 64,063 4,081† NRG Energy Inc. 102,463 4,073† Vistra Energy Corp. 166,545 3,829† Exelon Corp. 68,287 3,113
Hawaiian Electric
Industries Inc. 39,450 1,848
Clearway Energy Inc. 40,495 808
17,752
Total Common Stocks—
Long Positions (Cost $483,192) 535,317
Common Stocks Sold Short (-97.4%)
Communication Services (-3.4%)
Sirius XM Holdings Inc. (572,443) (4,093)* Zillow Group Inc. (88,927) (4,085)
World Wrestling
Entertainment Inc.
Class A (57,631) (3,738)
Sinclair Broadcast
Group Inc. Class A (102,620) (3,421)
Walt Disney Co. (7,015) (1,015)* Liberty Broadband
Corp. Class A (7,903) (984)
Marcus Corp. (21,486) (683)* Vonage Holdings Corp. (90,374) (670)
(18,689)
Consumer Discretionary (-12.8%) * Capri Holdings Ltd. (108,062) (4,123)* Urban Outfitters Inc. (147,179) (4,087)
Carter’s Inc. (36,776) (4,021)
McDonald’s Corp. (20,228) (3,997)* Carvana Co. Class A (42,408) (3,904)* Five Below Inc. (30,128) (3,852)* Lululemon Athletica Inc. (15,837) (3,669)
Thor Industries Inc. (48,473) (3,601)
BJ’s Restaurants Inc. (90,627) (3,440)
Goodyear Tire &
Rubber Co. (200,893) (3,125)
Children’s Place Inc. (48,501) (3,032)* Grand Canyon
Education Inc. (30,834) (2,954)* Dorman Products Inc. (38,872) (2,943)
Callaway Golf Co. (137,591) (2,917)* OneSpaWorld Holdings
Ltd. (164,222) (2,765)
* Bright Horizons Family
Solutions Inc. (16,899) (2,540)
Wyndham Hotels &
Resorts Inc. (30,021) (1,886)
Caleres Inc. (77,297) (1,836)
Oxford Industries Inc. (22,716) (1,713)
Leggett & Platt Inc. (31,482) (1,600)* Shake Shack Inc.
Class A (26,532) (1,580)
Gap Inc. (84,200) (1,489)* Ulta Salon Cosmetics &
Fragrance Inc. (4,790) (1,212)
Dollar General Corp. (7,251) (1,131)
TJX Cos. Inc. (17,649) (1,078)
Marriott Vacations
Worldwide Corp. (7,003) (902)
Core-Mark Holding Co.
Inc. (23,242) (632)* Houghton Mifflin
Harcourt Co. (92,043) (575)
(70,604)
Consumer Staples (-2.8%)
Energizer Holdings Inc. (80,126) (4,024)
Cal-Maine Foods Inc. (84,006) (3,591)
Archer-Daniels-Midland
Co. (70,452) (3,266)* Freshpet Inc. (51,258) (3,029)
Nu Skin Enterprises Inc.
Class A (18,694) (766)* Grocery Outlet Holding
Corp. (21,578) (700)
(15,376)
Energy (-3.0%) * Diamond Offshore
Drilling Inc. (569,905) (4,098)
RPC Inc. (640,025) (3,354)
Equitrans Midstream
Corp. (144,069) (1,925)
Occidental Petroleum
Corp. (36,744) (1,514)
Diamondback Energy Inc. (14,360) (1,333)* Select Energy Services
Inc. Class A (125,924) (1,169)
Patterson-UTI Energy
Inc. (97,370) (1,022)
US Silica Holdings Inc. (118,258) (727)* Magnolia Oil & Gas
Corp. Class A (44,398) (559)* Oil States International
Inc. (33,008) (538)
(16,239)
Financials (-15.3%)
Loews Corp. (78,018) (4,095)* eHealth Inc. (42,361) (4,070)
12
Market Neutral Fund
Market
Value•
Shares ($000)
Market
Value•
Shares ($000)
Invesco Ltd. (226,309) (4,069)
First Republic Bank (34,572) (4,061)* LendingTree Inc. (13,381) (4,060)
CME Group Inc. (20,099) (4,034)
WisdomTree
Investments Inc. (832,432) (4,029)
CenterState Bank Corp. (160,410) (4,007)* LendingClub Corp. (308,454) (3,893)
MarketAxess Holdings
Inc. (9,345) (3,543)
South State Corp. (40,060) (3,475)* Markel Corp. (3,025) (3,458)
New York Community
Bancorp Inc. (285,860) (3,436)
State Street Corp. (42,340) (3,349)
Hamilton Lane Inc.
Class A (55,909) (3,332)
Pinnacle Financial
Partners Inc. (47,540) (3,043)
Moelis & Co. Class A (95,145) (3,037)* PRA Group Inc. (82,990) (3,013)* Enstar Group Ltd. (12,531) (2,592)
Banc of California Inc. (142,375) (2,446)
Kearny Financial Corp (135,055) (1,868)
Ares Management Corp.
Class A (49,239) (1,757)* Ambac Financial Group
Inc. (79,306) (1,711)
American International
Group Inc. (26,228) (1,346)* SVB Financial Group (4,228) (1,061)
Argo Group International
Holdings Ltd. (15,495) (1,019)
Interactive Brokers
Group Inc. (18,950) (883)* Seacoast Banking Corp.
of Florida (27,176) (831)* Axos Financial Inc. (25,355) (768)* Triumph Bancorp Inc. (19,935) (758)
Capitol Federal
Financial Inc. (50,413) (692)
Assured Guaranty Ltd. (14,052) (689)
(84,425)
Health Care (-13.8%) * ABIOMED Inc. (24,120) (4,115)* iRhythm Technologies
Inc. (60,106) (4,093)* Intercept
Pharmaceuticals Inc. (32,935) (4,081)* Boston Scientific Corp. (90,206) (4,079)* Mirati Therapeutics Inc. (31,595) (4,071)* Aimmune Therapeutics
Inc. (121,018) (4,050)* Seattle Genetics Inc. (35,403) (4,045)
* Aerie Pharmaceuticals
Inc. (162,838) (3,936)* Sarepta Therapeutics
Inc. (30,434) (3,927)* Glaukos Corp. (72,035) (3,924)* Inogen Inc. (57,188) (3,908)* Madrigal
Pharmaceuticals Inc. (42,131) (3,839)* Tricida Inc. (89,446) (3,376)* Insulet Corp. (19,193) (3,286)* Bluebird Bio Inc. (34,486) (3,026)* Vertex Pharmaceuticals
Inc. (12,523) (2,742)* Turning Point
Therapeutics Inc. (38,899) (2,423)* Tabula Rasa HealthCare
Inc. (48,550) (2,363)* Axonics Modulation
Technologies Inc. (83,446) (2,312)* Alnylam
Pharmaceuticals Inc. (13,894) (1,600)* Amicus Therapeutics
Inc. (150,018) (1,461)* ViewRay Inc. (328,385) (1,386)* Cardiovascular Systems
Inc. (17,760) (863)* AtriCure Inc. (24,029) (781)* Evolent Health Inc.
Class A (84,725) (767)* Antares Pharma Inc. (151,132) (710)* Innoviva Inc. (47,148) (668)
(75,832)
Industrials (-16.1%) * SiteOne Landscape
Supply Inc. (45,029) (4,082)
Wabtec Corp. (52,290) (4,068)
Quanta Services Inc. (99,616) (4,055)* Univar Solutions Inc. (167,167) (4,052)* Axon Enterprise Inc. (55,200) (4,045)
Toro Co. (50,620) (4,033)* Dycom Industries Inc. (85,525) (4,032)* Stericycle Inc. (63,185) (4,032)
Lindsay Corp. (41,682) (4,001)* Welbilt Inc. (255,772) (3,993)
Fortive Corp. (51,523) (3,936)
Kadant Inc. (35,659) (3,756)
Alamo Group Inc. (27,765) (3,486)* Harsco Corp. (148,192) (3,410)
Altra Industrial Motion
Corp. (92,334) (3,343)
United Technologies
Corp. (21,069) (3,155)
Greenbrier Cos. Inc. (97,029) (3,147)* WillScot Corp. Class A (156,078) (2,886)* Upwork Inc. (205,038) (2,188)
13

Market Neutral Fund
Market
Value•
Shares ($000)
Market
Value•
Shares ($000)
Insperity Inc. (25,225) (2,170)* TPI Composites Inc. (111,516) (2,064)
TransDigm Group Inc. (3,535) (1,979)
US Ecology Inc. (33,227) (1,924)
Forward Air Corp. (26,185) (1,832)* Evoqua Water
Technologies Corp. (96,101) (1,821)
Comfort Systems USA
Inc. (28,799) (1,436)
Rollins Inc. (43,147) (1,431)* Colfax Corp. (31,767) (1,156)* Chart Industries Inc. (12,951) (874)
Franklin Electric Co. Inc. (10,185) (584)* Air Transport Services
Group Inc. (24,554) (576)* Parsons Corp. (13,417) (554)
FedEx Corp. (1,700) (257)
(88,358)
Information Technology (-16.7%) * IPG Photonics Corp. (28,256) (4,095)
AVX Corp. (199,397) (4,082)
Corning Inc. (140,088) (4,078)
Jack Henry &
Associates Inc. (27,914) (4,066)
FLIR Systems Inc. (77,971) (4,060)
Cognex Corp. (72,253) (4,049)
Brooks Automation Inc. (96,216) (4,037)* Q2 Holdings Inc. (49,536) (4,016)* 2U Inc. (166,826) (4,002)* First Solar Inc. (70,494) (3,945)* Trimble Inc. (91,300) (3,806)
Cabot Microelectronics
Corp. (26,105) (3,767)
Fidelity National
Information Services Inc. (25,872) (3,599)* NetScout Systems Inc. (128,672) (3,097)* Black Knight Inc. (47,720) (3,077)* ForeScout Technologies
Inc. (88,540) (2,904)
Motorola Solutions Inc. (17,366) (2,798)
InterDigital Inc. (50,510) (2,752)* Fiserv Inc. (23,801) (2,752)* DocuSign Inc. Class A (33,278) (2,466)* Elastic NV (37,872) (2,435)* Lumentum Holdings Inc. (27,863) (2,210)* F5 Networks Inc. (15,634) (2,183)
MKS Instruments Inc. (18,879) (2,077)* Aspen Technology Inc. (15,509) (1,876)
Pegasystems Inc. (19,867) (1,582)* Tyler Technologies Inc. (4,411) (1,323)* Appfolio Inc. (8,831) (971)* EchoStar Corp. Class A (19,788) (857)* Yext Inc. (49,555) (715)* AMBARELLA INC (10,764) (652)
Monolithic Power
Systems Inc. (3,590) (639)
Power Integrations Inc. (6,388) (632)* Cree Inc. (13,295) (614)* 3D Systems Corp. (64,187) (562)
Methode Electronics
Inc. (14,069) (554)
Dolby Laboratories Inc.
Class A (5,749) (396)
(91,726)
Materials (-4.3%)
International Flavors &
Fragrances Inc. (31,961) (4,124)* Coeur Mining Inc. (504,065) (4,073)* Century Aluminum Co. (539,214) (4,052)* Ingevity Corp. (36,920) (3,226)
Hecla Mining Co. (831,445) (2,818)
Linde plc (11,931) (2,540)
Mosaic Co. (96,582) (2,090)* Novagold Resources
Inc. (75,217) (674)
(23,597)
Real Estate (-6.1%)
WP Carey Inc. (51,344) (4,110)
VICI Properties Inc. (160,511) (4,101)
PotlatchDeltic Corp. (93,518) (4,047)
Pebblebrook Hotel Trust (144,158) (3,865)
Cousins Properties Inc. (82,900) (3,415)
Empire State Realty
Trust Inc. (238,817) (3,334)* Redfin Corp. (152,608) (3,226)* Marcus & Millichap Inc. (59,728) (2,225)
Agree Realty Corp. (25,873) (1,815)
American Assets Trust
Inc. (25,240) (1,159)
Washington REIT (23,753) (693)
Seritage Growth
Properties Class A (16,400) (657)
SBA Communications
Corp. Class A (2,584) (623)
Lamar Advertising Co.
Class A (5,525) (493)
(33,763)
Utilities (-3.1%)
NiSource Inc. (147,446) (4,105)
Dominion Energy Inc. (49,436) (4,094)
CenterPoint Energy Inc. (145,532) (3,969)
Ormat Technologies Inc. (32,872) (2,450)
Consolidated Edison Inc. (15,682) (1,419)
UGI Corp. (25,387) (1,146)
(17,183)
Total Common Stocks Sold Short
(Proceeds $503,752) (535,792)
14
15
Market Neutral Fund
Market Value• Shares ($000)
At December 31, 2019, net assets consisted of:
Amount ($000)
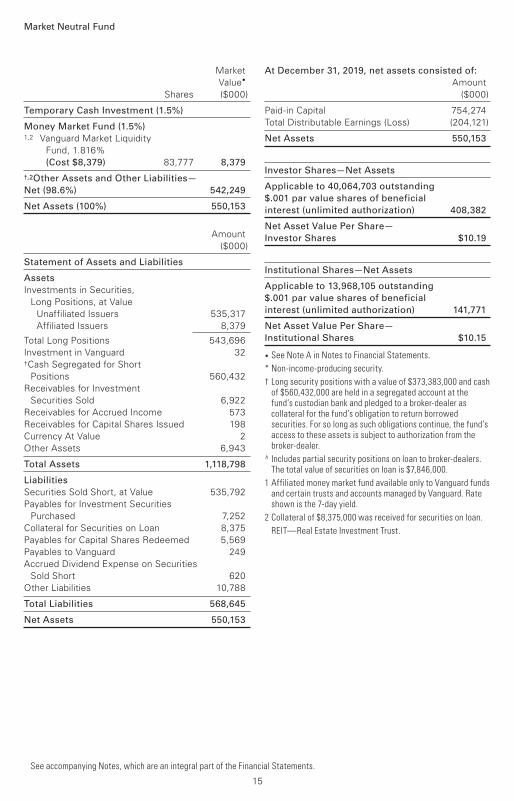
Temporary Cash Investment (1.5%)
Money Market Fund (1.5%)1,2 Vanguard Market Liquidity
Fund, 1.816% (Cost $8,379) 83,777 8,379
†,2Other Assets and Other Liabilities—
Net (98.6%) 542,249
Net Assets (100%) 550,153
Amount ($000)
Statement of Assets and Liabilities
Assets
Investments in Securities, Long Positions, at Value Unaffiliated Issuers 535,317
Affiliated Issuers 8,379
Total Long Positions 543,696Investment in Vanguard 32†Cash Segregated for Short
Positions 560,432Receivables for Investment
Securities Sold 6,922Receivables for Accrued Income 573Receivables for Capital Shares Issued 198Currency At Value 2Other Assets 6,943
Total Assets 1,118,798
Liabilities
Securities Sold Short, at Value 535,792Payables for Investment Securities
Purchased 7,252Collateral for Securities on Loan 8,375Payables for Capital Shares Redeemed 5,569Payables to Vanguard 249Accrued Dividend Expense on Securities
Sold Short 620Other Liabilities 10,788
Total Liabilities 568,645
Net Assets 550,153
Paid-in Capital 754,274Total Distributable Earnings (Loss) (204,121)
Net Assets 550,153
Investor Shares—Net Assets
Applicable to 40,064,703 outstanding
$.001 par value shares of beneficial
interest (unlimited authorization) 408,382
Net Asset Value Per Share—
Investor Shares $10.19
Institutional Shares—Net Assets
Applicable to 13,968,105 outstanding
$.001 par value shares of beneficial
interest (unlimited authorization) 141,771
Net Asset Value Per Share—
Institutional Shares $10.15
• See Note A in Notes to Financial Statements.
* Non-income-producing security.
† Long security positions with a value of $373,383,000 and cash of $560,432,000 are held in a segregated account at the fund’s custodian bank and pledged to a broker-dealer as collateral for the fund’s obligation to return borrowed securities. For so long as such obligations continue, the fund’s access to these assets is subject to authorization from the broker-dealer.
^ Includes partial security positions on loan to broker-dealers. The total value of securities on loan is $7,846,000.
1 Affiliated money market fund available only to Vanguard funds and certain trusts and accounts managed by Vanguard. Rate shown is the 7-day yield.
2 Collateral of $8,375,000 was received for securities on loan.
REIT—Real Estate Investment Trust.
See accompanying Notes, which are an integral part of the Financial Statements.

Year Ended December 31, 2019
($000)
Investment Income
Income
Dividends 13,684
Interest1 21,743
Securities Lending—Net 480
Total Income 35,907
Expenses
The Vanguard Group—Note B
Investment Advisory Services 963
Management and Administrative—Investor Shares 685
Management and Administrative—Institutional Shares 102
Marketing and Distribution—Investor Shares 104
Marketing and Distribution—Institutional Shares 10
Custodian Fees 67
Auditing Fees 26
Shareholders’ Reports—Investor Shares 21
Shareholders’ Reports—Institutional Shares 1
Trustees’ Fees and Expenses 1
Dividend Expense on Securities Sold Short 13,419
Total Expenses 15,399
Net Investment Income (Loss) 20,508
Realized Net Gain (Loss)
Investment Securities Sold—Long Positions1 95,853
Investment Securities Sold Short (61,461)
Foreign Currencies (1)
Realized Net Gain (Loss) 34,391
Change in Unrealized Appreciation (Depreciation)
Investment Securities—Long Positions1 130,605
Investment Securities Sold Short (314,998)
Foreign Currencies —
Change in Unrealized Appreciation (Depreciation) of Investment Securities (184,393)
Net Increase (Decrease) in Net Assets Resulting from Operations (129,494)
1 Interest income, realized net gain (loss), and change in unrealized appreciation (depreciation) from an affiliated company of the fund were $79,000, $3,000, and $1,000, respectively. Purchases and sales are for temporary cash investment purposes.
Statement of Operations
Market Neutral Fund
See accompanying Notes, which are an integral part of the Financial Statements.
16

Statement of Changes in Net Assets
Market Neutral Fund
See accompanying Notes, which are an integral part of the Financial Statements.
Year Ended December 31,
2019 2018
($000) ($000)
Increase (Decrease) in Net Assets
Operations
Net Investment Income (Loss) 20,508 15,439
Realized Net Gain (Loss) 34,391 19,030
Change in Unrealized Appreciation (Depreciation) (184,393) (24,650)
Net Increase (Decrease) in Net Assets Resulting from Operations (129,494) 9,819
Distributions
Net Investment Income
Investor Shares (15,919) (11,957)
Institutional Shares (4,991) (3,417)
Realized Capital Gain
Investor Shares — —
Institutional Shares — —
Total Distributions (20,910) (15,374)
Capital Share Transactions
Investor Shares (685,147) (155,618)
Institutional Shares (168,947) 15,693
Net Increase (Decrease) from Capital Share Transactions (854,094) (139,925)
Total Increase (Decrease) (1,004,498) (145,480)
Net Assets
Beginning of Period 1,554,651 1,700,131
End of Period 550,153 1,554,651
17

Investor Shares
For a Share Outstanding Year Ended December 31,
Throughout Each Period 2019 2018 2017 2016 2015
Net Asset Value, Beginning of Period $11.62 $11.66 $12.39 $12.12 $11.50
Investment Operations
Net Investment Income (Loss) .2061 .1081 .1111 .050 .0021
Net Realized and Unrealized Gain (Loss)
on Investments (1.314) (.038) (.717) .267 .620
Total from Investment Operations (1.108) .070 (.606) .317 .622
Distributions
Dividends from Net Investment Income (.322) (.110) (.124) (.047) (.002)
Distributions from Realized Capital Gains — — — — —
Total Distributions (.322) (.110) (.124) (.047) (.002)
Net Asset Value, End of Period $10.19 $11.62 $11.66 $12.39 $12.12
Total Return -9.57% 0.59% -4.89% 2.62% 5.41%
Ratios/Supplemental Data
Net Assets, End of Period (Millions) $408 $1,209 $1,368 $1,760 $650
Ratio of Total Expenses to Average Net Assets
Based on Total Expenses2,3 1.46% 1.80% 1.54% 1.60% 1.46%
Net of Dividend and Borrowing Expense on
Securities Sold Short 0.20% 0.20% 0.22% 0.22% 0.25%
Ratio of Net Investment Income (Loss)
to Average Net Assets 1.90% 0.93% 0.94% 0.48% 0.01%
Portfolio Turnover Rate 141% 110% 79% 64% 68%
1 Calculated based on average shares outstanding.
2 Includes dividend expense on securities sold short of 1.26%, 1.60%, 1.32%, 1.38%, and 1.06%, respectively.
3 Includes borrowing expense on securities sold short of 0.00%, 0.00%, 0.00%, 0.00%, and 0.15%, respectively.
Financial Highlights
See accompanying Notes, which are an integral part of the Financial Statements.
Market Neutral Fund
18

Institutional Shares
For a Share Outstanding Year Ended December 31,
Throughout Each Period 2019 2018 2017 2016 2015
Net Asset Value, Beginning of Period $11.57 $11.61 $12.34 $12.07 $11.45
Investment Operations
Net Investment Income (Loss) .2131 .1191 .1231 .061 .0111
Net Realized and Unrealized Gain (Loss)
on Investments (1.305) (.043) (.719) .265 .621
Total from Investment Operations (1.092) .076 (.596) .326 .632
Distributions
Dividends from Net Investment Income (.328) (.116) (.134) (.056) (.012)
Distributions from Realized Capital Gains — — — — —
Total Distributions (.328) (.116) (.134) (.056) (.012)
Net Asset Value, End of Period $10.15 $11.57 $11.61 $12.34 $12.07
Total Return -9.48% 0.65% -4.83% 2.70% 5.52%
Ratios/Supplemental Data
Net Assets, End of Period (Millions) $142 $346 $332 $338 $102
Ratio of Total Expenses to Average Net Assets
Based on Total Expenses2,3 1.40% 1.74% 1.46% 1.52% 1.36%
Net of Dividend and Borrowing Expense on
Securities Sold Short 0.14% 0.14% 0.14% 0.14% 0.15%
Ratio of Net Investment Income (Loss)
to Average Net Assets 1.96% 0.99% 1.02% 0.56% 0.11%
Portfolio Turnover Rate 141% 110% 79% 64% 68%
1 Calculated based on average shares outstanding.
2 Includes dividend expense on securities sold short of 1.26%, 1.60%, 1.32%, 1.38%, and 1.06%, respectively.
3 Includes borrowing expense on securities sold short of 0.00%, 0.00%, 0.00%, 0.00%, and 0.15%, respectively.
Financial Highlights
See accompanying Notes, which are an integral part of the Financial Statements.
Market Neutral Fund
19

Notes to Financial Statements
Market Neutral Fund
Vanguard Market Neutral Fund is registered under the Investment Company Act of 1940 as an
open-end investment company, or mutual fund. The fund offers two classes of shares: Investor
Shares and Institutional Shares. Each of the share classes has different eligibility and minimum
purchase requirements, and is designed for different types of investors.
A. The following significant accounting policies conform to generally accepted accounting principles
for U.S. investment companies. The fund consistently follows such policies in preparing its financial
statements.
1. Security Valuation: Securities are valued as of the close of trading on the New York Stock Exchange
(generally 4 p.m., Eastern time) on the valuation date. Equity securities are valued at the latest quoted
sales prices or official closing prices taken from the primary market in which each security trades;
such securities not traded on the valuation date are valued at the mean of the latest quoted bid and
asked prices. Securities for which market quotations are not readily available, or whose values have
been materially affected by events occurring before the fund’s pricing time but after the close of
the securities’ primary markets, are valued by methods deemed by the board of trustees to represent
fair value. Investments in Vanguard Market Liquidity Fund are valued at that fund’s net asset value.
2. Foreign Currency: Securities and other assets and liabilities denominated in foreign currencies
are translated into U.S. dollars using exchange rates obtained from an independent third party as of
the portfolio’s pricing time on the valuation date. Realized gains (losses) and unrealized appreciation
(depreciation) on investment securities include the effects of changes in exchange rates since the
securities were purchased, combined with the effects of changes in security prices. Fluctuations in
the value of other assets and liabilities resulting from changes in exchange rates are recorded as
unrealized foreign currency gains (losses) until the assets or liabilities are settled in cash, at which
time they are recorded as realized foreign currency gains (losses).
3. Short Sales: Short sales are the sales of securities that the fund does not own. The fund sells a
security it does not own in anticipation of a decline in the value of that security. In order to deliver
the security to the purchaser, the fund borrows the security from a broker-dealer. The fund must
segregate, as collateral for its obligation to return the borrowed security, an amount of cash and
long security positions at least equal to the market value of the security sold short. In the absence
of a default, the collateral segregated by the fund cannot be repledged, resold or rehypothecated.
This results in the fund holding a significant portion of its assets in cash. The fund later closes out
the position by returning the security to the lender, typically by purchasing the security in the open
market. A gain, limited to the price at which the fund sold the security short, or a loss, theoretically
unlimited in size, is recognized upon the termination of the short sale. The fund may receive a portion
of the income from the investment of collateral, or be charged a fee on borrowed securities, based
on the market value of each borrowed security and a variable rate that is dependent upon the
availability of such security. The net amounts of income or fees are recorded as interest income (for
net income received) or borrowing expense on securities sold short (for net fees charged) in the
Statement of Operations. Dividends on securities sold short are reported as an expense in the
Statement of Operations.
Cash collateral segregated for securities sold short is recorded as an asset in the Statement of
Assets and Liabilities. Long security positions segregated as collateral are shown in the Statement
of Net Assets.
20

Market Neutral Fund
4. Federal Income Taxes: The fund intends to continue to qualify as a regulated investment company
and distribute all of its taxable income. Management has analyzed the fund’s tax positions taken for
all open federal income tax years (December 31, 2016–2019), and has concluded that no provision
for federal income tax is required in the fund’s financial statements.
5. Distributions: Distributions to shareholders are recorded on the ex-dividend date. Distributions
are determined on a tax basis and may differ from net investment income and realized capital gains
for financial reporting purposes.
6. Securities Lending: To earn additional income, the fund lends its securities to qualified institutional
borrowers. Security loans are subject to termination by the fund at any time, and are required to be
secured at all times by collateral in an amount at least equal to the market value of securities loaned.
Daily market fluctuations could cause the value of loaned securities to be more or less than the
value of the collateral received. When this occurs, the collateral is adjusted and settled before the
opening of the market on the next business day. The fund further mitigates its counterparty risk by
entering into securities lending transactions only with a diverse group of prequalified counterparties,
monitoring their financial strength, and entering into master securities lending agreements with its
counterparties. The master securities lending agreements provide that, in the event of a counterparty’s
default (including bankruptcy), the fund may terminate any loans with that borrower, determine the
net amount owed, and sell or retain the collateral up to the net amount owed to the fund; however,
such actions may be subject to legal proceedings. While collateral mitigates counterparty risk, in
the event of a default, the fund may experience delays and costs in recovering the securities loaned.
The fund invests cash collateral received in Vanguard Market Liquidity Fund, and records a liability in
the Statement of Assets and Liabilities for the return of the collateral, during the period the securities
are on loan. Securities lending income represents fees charged to borrowers plus income earned
on invested cash collateral, less expenses associated with the loan. During the term of the loan, the
fund is entitled to all distributions made on or in respect of the loaned securities.
7. Credit Facility: The fund and certain other funds managed by The Vanguard Group (“Vanguard”)
participate in a $4.3 billion committed credit facility provided by a syndicate of lenders pursuant to
a credit agreement that may be renewed annually; each fund is individually liable for its borrowings,
if any, under the credit facility. Borrowings may be utilized for temporary and emergency purposes,
and are subject to the fund’s regulatory and contractual borrowing restrictions. The participating
funds are charged administrative fees and an annual commitment fee of 0.10% of the undrawn
amount of the facility; these fees are allocated to the funds based on a method approved by the
fund’s board of trustees and included in Management and Administrative expenses on the fund’s
Statement of Operations. Any borrowings under this facility bear interest at a rate based upon the
higher of the one-month London Interbank Offered Rate, federal funds effective rate, or overnight
bank funding rate plus an agreed-upon spread.
The fund had no borrowings outstanding at December 31, 2019, or at any time during the period
then ended.
8. Other: Dividend income (or dividend expense on short positions) is recorded on the ex-dividend
date. Interest income includes income distributions received from Vanguard Market Liquidity Fund
and is accrued daily. Security transactions are accounted for on the date securities are bought or
sold. Costs used to determine realized gains (losses) on the sale of investment securities are those
of the specific securities sold.
21

Market Neutral Fund
Each class of shares has equal rights as to assets and earnings, except that each class separately
bears certain class-specific expenses related to maintenance of shareholder accounts (included in
Management and Administrative expenses) and shareholder reporting. Marketing and distribution
expenses are allocated to each class of shares based on a method approved by the board of
trustees. Income, other non-class-specific expenses, and gains and losses on investments are
allocated to each class of shares based on its relative net assets.
B. In accordance with the terms of a Funds’ Service Agreement (the “FSA”) between Vanguard and
the fund, Vanguard furnishes to the fund investment advisory, corporate management, administrative,
marketing, and distribution services at Vanguard’s cost of operations (as defined by the FSA).
These costs of operations are allocated to the fund based on methods and guidelines approved by
the board of trustees. Vanguard does not require reimbursement in the current period for certain
costs of operations (such as deferred compensation/benefits and risk/insurance costs); the fund’s
liability for these costs of operations is included in Payables to Vanguard on the Statement of Assets
and Liabilities. All other costs of operations payable to Vanguard are generally settled twice a month.
Upon the request of Vanguard, the fund may invest up to 0.40% of its net assets as capital in
Vanguard. At December 31, 2019, the fund had contributed to Vanguard capital in the amount of
$32,000, representing 0.01% of the fund’s net assets and 0.01% of Vanguard’s capital received
pursuant to the FSA. The fund’s trustees and officers are also directors and employees, respectively,
of Vanguard.
C. Various inputs may be used to determine the value of the fund’s investments. These inputs are
summarized in three broad levels for financial statement purposes. The inputs or methodologies
used to value securities are not necessarily an indication of the risk associated with investing in
those securities.
Level 1—Quoted prices in active markets for identical securities.
Level 2—Other significant observable inputs (including quoted prices for similar securities, interest
rates, prepayment speeds, credit risk, etc.).
Level 3—Significant unobservable inputs (including the fund’s own assumptions used to determine
the fair value of investments). Any investments valued with significant unobservable inputs are noted
on the Statement of Net Assets.
At December 31, 2019, 100% of the market value of the fund’s investments was determined based
on Level 1 inputs.
22

23
Market Neutral Fund
D. Permanent differences between book-basis and tax-basis components of net assets are reclassified among capital accounts in the financial statements to reflect their tax character. These reclassifications have no effect on net assets or net asset value per share. As of period end, permanent differences primarily attributable to the accounting for foreign currency transactions were reclassified between the following accounts:
Amount ($000)
Paid-in Capital (33)
Total Distributable Earnings (Loss) 33
Temporary differences between book-basis and tax-basis components of total distributable earnings (loss) arise when certain items of income, gain, or loss are recognized in different periods for financial statement and tax purposes; these differences will reverse at some time in the future. The differences are primarily related to the tax deferral of losses on wash sales and unsettled short sales. As of period end, the tax-basis components of total distributable earnings (loss) are detailed in the table as follows:
Amount ($000)
Undistributed Ordinary Income 717
Undistributed Long-Term Gains —
Capital Loss Carryforwards (Non-expiring)* (223,478)
Net Unrealized Gains (Losses) 18,828
* The fund used capital loss carryforwards of $35,222,000 to offset taxable capital gains realized during the year ended December 31, 2019.
As of December 31, 2019, gross unrealized appreciation and depreciation for investments and securities sold short based on cost for U.S. federal income tax purposes were as follows:
Amount ($000)
Tax Cost 492,828
Gross Unrealized Appreciation 137,334
Gross Unrealized Depreciation (118,506)
Net Unrealized Appreciation (Depreciation) 18,828

Market Neutral Fund
E. During the year ended December 31, 2019, the fund purchased $2,973,279,000 of investment securities and sold $2,820,782,000 of investment securities, other than temporary cash investments. The proceeds of short sales and the cost of purchases to cover short sales were $845,746,000 and $2,222,475,000, respectively.
F. Capital share transactions for each class of shares were:
Year Ended December 31,
2019 2018
Amount Shares Amount Shares ($000) (000) ($000) (000)
Investor Shares
Issued 143,089 13,108 406,078 34,392
Issued in Lieu of Cash Distributions 14,208 1,375 10,168 873
Redeemed (842,444) (78,478) (571,864) (48,521)
Net Increase (Decrease)—Investor Shares (685,147) (63,995) (155,618) (13,256)
Institutional Shares
Issued 46,192 4,228 129,075 10,942
Issued in Lieu of Cash Distributions 3,397 329 2,788 240
Redeemed (218,536) (20,483) (116,170) (9,906)
Net Increase (Decrease)—Institutional Shares (168,947) (15,926) 15,693 1,276
At December 31, 2019, one shareholder was the record or beneficial owner of 27% of the fund’s net assets. If this shareholder were to redeem its investment in the fund, the redemption might result in an increase in the fund’s expense ratio, cause the fund to incur higher transaction costs, or lead to the realization of taxable capital gains.
G. Management has determined that no events or transactions occurred subsequent to December 31, 2019, that would require recognition or disclosure in these financial statements.
24

To the Board of Trustees of Vanguard Montgomery Funds and Shareholders of Vanguard Market
Neutral Fund
Opinion on the Financial Statements
We have audited the accompanying statement of net assets and statement of assets and liabilities
of Vanguard Market Neutral Fund (constituting Vanguard Montgomery Funds, referred to hereafter
as the “Fund”) as of December 31, 2019, the related statement of operations for the year ended
December 31, 2019, the statement of changes in net assets for each of the two years in the period
ended December 31, 2019, including the related notes, and the financial highlights for each of the
five years in the period ended December 31, 2019 (collectively referred to as the “financial
statements”). In our opinion, the financial statements present fairly, in all material respects, the
financial position of the Fund as of December 31, 2019, the results of its operations for the year then
ended, the changes in its net assets for each of the two years in the period ended December 31, 2019
and the financial highlights for each of the five years in the period ended December 31, 2019 in
conformity with accounting principles generally accepted in the United States of America.
Basis for Opinion
These financial statements are the responsibility of the Fund’s management. Our responsibility
is to express an opinion on the Fund’s financial statements based on our audits. We are a public
accounting firm registered with the Public Company Accounting Oversight Board (United States)
(“PCAOB”) and are required to be independent with respect to the Fund in accordance with the
U.S. federal securities laws and the applicable rules and regulations of the Securities and Exchange
Commission and the PCAOB.
We conducted our audits of these financial statements in accordance with the standards of the
PCAOB. Those standards require that we plan and perform the audit to obtain reasonable assurance
about whether the financial statements are free of material misstatement, whether due to error or fraud.
Our audits included performing procedures to assess the risks of material misstatement of the
financial statements, whether due to error or fraud, and performing procedures that respond to
those risks. Such procedures included examining, on a test basis, evidence regarding the amounts
and disclosures in the financial statements. Our audits also included evaluating the accounting
principles used and significant estimates made by management, as well as evaluating the overall
presentation of the financial statements. Our procedures included confirmation of securities owned
as of December 31, 2019 by correspondence with the custodian and brokers and by agreement to
the underlying ownership records of the transfer agent; when replies were not received from brokers,
we performed other auditing procedures. We believe that our audits provide a reasonable basis for
our opinion.
/s/PricewaterhouseCoopers LLP
Philadelphia, Pennsylvania
February 18, 2020
We have served as the auditor of one or more investment companies in The Vanguard Group of
Funds since 1975.
Report of Independent Registered Public Accounting Firm
25
Special 2019 tax information (unaudited) for Vanguard Market Neutral Fund
This information for the fiscal year ended December 31, 2019, is included pursuant to provisions of
the Internal Revenue Code.
The fund distributed $11,729,000 of qualified dividend income to shareholders during the fiscal year.
The fund distributed $1,980,000 of qualified business income to shareholders during the fiscal year.
For corporate shareholders, 51.3% of investment income (dividend income plus short-term gains, if
any) qualifies for the dividends-received deduction.
26

The People Who Govern Your Fund
The trustees of your mutual fund are there to see that the fund is operated and managed in your
best interests since, as a shareholder, you are a part owner of the fund. Your fund’s trustees also
serve on the board of directors of The Vanguard Group, Inc., which is owned by the Vanguard
funds and provides services to them.
A majority of Vanguard’s board members are independent, meaning that they have no affiliation
with Vanguard or the funds they oversee, apart from the sizable personal investments they have
made as private individuals. The independent board members have distinguished backgrounds
in business, academia, and public service. Each of the trustees and executive officers oversees
213 Vanguard funds.
Information for each trustee and executive officer of the fund appears below. That information,
as well as the Vanguard fund count, is as of the date on the cover of this fund report. The mailing
address of the trustees and officers is P.O. Box 876, Valley Forge, PA 19482. More information
about the trustees is in the Statement of Additional Information, which can be obtained, without
charge, by contacting Vanguard at 800-662-7447, or online at vanguard.com.
Interested Trustee1
Mortimer J. Buckley
Born in 1969. Trustee since January 2018. Principal
occupation(s) during the past five years and other
experience: chairman of the board (January 2019–
present) of Vanguard and of each of the investment
companies served by Vanguard; chief executive officer
(January 2018–present) of Vanguard; chief executive
officer, president, and trustee (January 2018–present)
of each of the investment companies served by
Vanguard; president and director (2017–present) of
Vanguard; and president (February 2018–present) of
Vanguard Marketing Corporation. Chief investment
officer (2013–2017), managing director (2002–2017),
head of the Retail Investor Group (2006–2012), and
chief information officer (2001–2006) of Vanguard.
Chairman of the board (2011–2017) and trustee
(2009–2017) of the Children’s Hospital of Philadelphia;
trustee (2018–present) of The Shipley School.
Independent Trustees
Emerson U. Fullwood
Born in 1948. Trustee since January 2008. Principal
occupation(s) during the past five years and other
experience: executive chief staff and marketing officer
for North America and corporate vice president (retired
2008) of Xerox Corporation (document management
products and services). Former president of the
Worldwide Channels Group, Latin America, and
Worldwide Customer Service and executive chief
staff officer of Developing Markets of Xerox. Executive
in residence and 2009–2010 Distinguished Minett
Professor at the Rochester Institute of Technology.
Director of SPX FLOW, Inc. (multi-industry manufac-
turing). Director of the University of Rochester Medical
Center, the Monroe Community College Foundation,
the United Way of Rochester, North Carolina A&T
University, and Roberts Wesleyan College. Trustee
of the University of Rochester.
Amy Gutmann
Born in 1949. Trustee since June 2006. Principal
occupation(s) during the past five years and other
experience: president (2004–present) of the University
of Pennsylvania. Christopher H. Browne Distinguished
Professor of Political Science, School of Arts and
Sciences, and professor of communication, Annenberg
School for Communication, with secondary faculty
appointments in the Department of Philosophy, School
of Arts and Sciences, and at the Graduate School of
Education, University of Pennsylvania. Trustee of the
National Constitution Center.
F. Joseph Loughrey
Born in 1949. Trustee since October 2009. Principal
occupation(s) during the past five years and other
experience: president and chief operating officer
(retired 2009) and vice chairman of the board
(2008–2009) of Cummins Inc. (industrial machinery).
Chairman of the board of Hillenbrand, Inc. (specialized
consumer services), and the Lumina Foundation.
1 Mr. Buckley is considered an “interested person,” as defined in the Investment Company Act of 1940, because he is an officer of the Vanguard funds.

Director of the V Foundation and Oxfam America.
Member of the advisory council for the College of
Arts and Letters and chair of the advisory board to
the Kellogg Institute for International Studies, both
at the University of Notre Dame.
Mark Loughridge
Born in 1953. Trustee since March 2012. Principal
occupation(s) during the past five years and other
experience: senior vice president and chief financial
officer (retired 2013) of IBM (information technology
services). Fiduciary member of IBM’s Retirement
Plan Committee (2004–2013), senior vice president
and general manager (2002–2004) of IBM Global
Financing, vice president and controller (1998–2002)
of IBM, and a variety of other prior management roles
at IBM. Member of the Council on Chicago Booth.
Scott C. Malpass
Born in 1962. Trustee since March 2012. Principal
occupation(s) during the past five years and other
experience: chief investment officer (1989–present)
and vice president (1996–present) of the University
of Notre Dame. Assistant professor of finance at the
Mendoza College of Business, University of Notre
Dame, and member of the Notre Dame 403(b)
Investment Committee. Chairman of the board of
TIFF Advisory Services, Inc. Member of the board
of Catholic Investment Services, Inc. (investment
advisors) and the board of superintendence
of the Institute for the Works of Religion.
Deanna Mulligan
Born in 1963. Trustee since January 2018. Principal
occupation(s) during the past five years and other
experience: president (2010–present) and chief
executive officer (2011–present) of The Guardian
Life Insurance Company of America. Chief operating
officer (2010–2011) and executive vice president
(2008–2010) of Individual Life and Disability of
The Guardian Life Insurance Company of America.
Member of the board of The Guardian Life Insurance
Company of America, the American Council of Life
Insurers, the Partnership for New York City (business
leadership), and the Committee Encouraging Corporate
Philanthropy. Trustee of the Economic Club of New
York and the Bruce Museum (arts and science).
Member of the Advisory Council for the Stanford
Graduate School of Business.
André F. Perold
Born in 1952. Trustee since December 2004. Principal
occupation(s) during the past five years and other
experience: George Gund Professor of Finance and
Banking, Emeritus at the Harvard Business School
(retired 2011). Chief investment officer and co-
managing partner of HighVista Strategies (private
investment firm). Board of advisors and investment
committee member of the Museum of Fine Arts
Boston. Board member (2018–present) of RIT Capital
Partners (investment firm); investment committee
member of Partners Health Care System.
Sarah Bloom Raskin
Born in 1961. Trustee since January 2018. Principal
occupation(s) during the past five years and other
experience: deputy secretary (2014–2017) of
the United States Department of the Treasury.
Governor (2010–2014) of the Federal Reserve
Board. Commissioner (2007–2010) of financial
regulation for the State of Maryland. Member of
the board of directors (2012–2014) of Neighborhood
Reinvestment Corporation. Director (2017–present)
of i(x) Investments; director (2017–present) of Reserve
Trust. Rubinstein Fellow (2017–present) of Duke
University; trustee (2017–present) of Amherst College.
Peter F. Volanakis
Born in 1955. Trustee since July 2009. Principal
occupation(s) during the past five years and other
experience: president and chief operating officer
(retired 2010) of Corning Incorporated (communications
equipment) and director of Corning Incorporated
(2000–2010) and Dow Corning (2001–2010).
Director (2012) of SPX Corporation (multi-industry
manufacturing). Overseer of the Amos Tuck School
of Business Administration, Dartmouth College
(2001–2013). Chairman of the board of trustees of
Colby-Sawyer College. Member of the board of
Hypertherm Inc. (industrial cutting systems, software,
and consumables).
Executive Officers
John Bendl
Born in 1970. Principal occupation(s) during the past
five years and other experience: principal of Vanguard.
Chief financial officer (October 2019–present) of each
of the investment companies served by Vanguard.
Chief accounting officer, treasurer, and controller of
Vanguard (2017–present). Partner (2003–2016) at
KPMG (audit, tax, and advisory services).
Glenn Booraem
Born in 1967. Principal occupation(s) during the past
five years and other experience: principal of Vanguard.
Investment stewardship officer (2017–present),
treasurer (2015–2017), controller (2010–2015),
and assistant controller (2001–2010) of each of
the investment companies served by Vanguard.
Christine M. Buchanan
Born in 1970. Principal occupation(s) during the past
five years and other experience: principal of Vanguard.
Treasurer (2017–present) of each of the investment
companies served by Vanguard. Partner (2005–2017)
at KPMG (audit, tax, and advisory services).
David Cermak
Born in 1960. Principal occupation(s) during the past
five years and other experience: principal of Vanguard.
Finance director (October 2019–present) of each
of the investment companies served by Vanguard.
Managing director and head (2017–present) of
Vanguard Investments Singapore. Managing director
and head (2017–2019) of Vanguard Investments Hong
Kong. Representative director and head (2014–2017)
of Vanguard Investments Japan.
Thomas J. Higgins
Born in 1957. Principal occupation(s) during the
past five years and other experience: principal of
Vanguard. Finance director (October 2019–present),
chief financial officer (2008–2019), and treasurer
(1998–2008) of each of the investment companies
served by Vanguard.
Peter Mahoney
Born in 1974. Principal occupation(s) during the past
five years and other experience: principal of Vanguard.
Controller (2015–present) of each of the investment
companies served by Vanguard. Head of International
Fund Services (2008–2014) at Vanguard.
Anne E. Robinson
Born in 1970. Principal occupation(s) during the
past five years and other experience: general
counsel (2016–present) of Vanguard. Secretary
(2016–present) of Vanguard and of each of the
investment companies served by Vanguard.
Managing director (2016–present) of Vanguard.
Managing director and general counsel of Global
Cards and Consumer Services (2014–2016) at
Citigroup. Counsel (2003–2014) at American Express.
Michael Rollings
Born in 1963. Principal occupation(s) during the
past five years and other experience: finance
director (2017–present) and treasurer (2017) of each
of the investment companies served by Vanguard.
Managing director (2016–present) of Vanguard. Chief
financial officer (2016–present) of Vanguard. Director
(2016–present) of Vanguard Marketing Corporation.
Executive vice president and chief financial officer
(2006–2016) of MassMutual Financial Group.
John E. Schadl
Born in 1972. Principal occupation(s) during the
past five years and other experience: principal of
Vanguard. Chief compliance officer (2019–present)
of Vanguard and of each of the investment companies
served by Vanguard. Assistant vice president (May
2019–present) of Vanguard Marketing Corporation.
Vanguard Senior Management Team
Joseph Brennan Chris D. McIsaac
Mortimer J. Buckley James M. Norris
Gregory Davis Thomas M. Rampulla
John James Karin A. Risi
Martha G. King Anne E. Robinson
John T. Marcante Michael Rollings

P.O. Box 2600Valley Forge, PA 19482-2600
Connect with Vanguard® > vanguard.com
Fund Information > 800-662-7447
Direct Investor Account Services > 800-662-2739
Institutional Investor Services > 800-523-1036
Text Telephone for PeopleWho Are Deaf or Hard of Hearing > 800-749-7273
This material may be used in conjunctionwith the offering of shares of any Vanguardfund only if preceded or accompanied bythe fund’s current prospectus.
All comparative mutual fund data are from Morningstar,Inc., unless otherwise noted.
You can obtain a free copy of Vanguard’s proxy votingguidelines by visiting vanguard.com/proxyreporting or bycalling Vanguard at 800-662-2739. The guidelines arealso available from the SEC’s website, www.sec.gov. Inaddition, you may obtain a free report on how your fundvoted the proxies for securities it owned during the 12months ended June 30. To get the report, visit eithervanguard.com/proxyreporting or www.sec.gov.
You can review information about your fund on theSEC’s website, and you can receive copies of thisinformation, for a fee, by sending a request via emailaddressed to [email protected].
Source for Bloomberg Barclays indexes: BloombergIndex Services Limited. Copyright 2020, Bloomberg. Allrights reserved.
© 2020 The Vanguard Group, Inc.All rights reserved.Vanguard Marketing Corporation, Distributor.
Q6340 022020