Vanderbilt University Law School Law and Economicswebfac/kline/e251_f09/hersch.pdfVanderbilt...
36
Vanderbilt University Law School Law and Economics Working Paper Number 09-15 Immigrant Status and the Value of Statistical Life Joni Hersch Vanderbilt University W. Kip Viscusi Vanderbilt University Forthcoming Journal of Human Resources. This paper can be downloaded without charge from the Social Science Research Network Electronic Paper Collection: http://ssrn.com/abstract_id=1394360
Transcript of Vanderbilt University Law School Law and Economicswebfac/kline/e251_f09/hersch.pdfVanderbilt...

Vanderbilt University Law School Law and Economics
Working Paper Number 09-15
Immigrant Status and the Value of Statistical Life
Joni Hersch Vanderbilt University
W. Kip Viscusi Vanderbilt University
Forthcoming Journal of Human Resources.
This paper can be downloaded without charge from the Social Science Research Network Electronic Paper Collection:
http://ssrn.com/abstract_id=1394360
.
Immigrant Status and the Value of Statistical Life
by
Joni Hersch*
and
W. Kip Viscusi†
April 22, 2009
Abstract
Using data from the Current Population Survey and the New Immigrant Survey, this
paper examines the common perception that immigrants are concentrated in high risk jobs for
which they receive little wage compensation. Compared to native U.S. workers, non-Mexican
immigrants are not at higher risk and have substantial values of statistical life. However,
Mexican immigrants incur much higher fatality risks than native U.S. workers and do not receive
wage compensation for these risks. Mexican immigrants who do not understand English fare
especially poorly. The evidence is consistent with Mexican immigrants facing different wage
offer curves.
* Joni Hersch is Professor of Law and Economics, Vanderbilt University. † W. Kip Viscusi is University Distinguished Professor of Law, Economics, and Management, Vanderbilt University. Because of confidentiality restrictions imposed by the U.S. Bureau of Labor Statistics on the Census of Fatal Occupational Injuries fatality rate data, the data used in this article cannot be disseminated.

1
I. Introduction
The popular belief that immigrants are concentrated in dangerous jobs is consistent with
recent U.S. accident statistics. Although the evidence is mixed, most recent studies suggest that
immigrants face higher levels of job risks.1 The frequently expressed concerns with the riskiness
of jobs held by immigrant workers may implicitly assume that labor markets are not functioning
efficiently. In the standard labor economics model of employment in hazardous jobs, the
compensating differentials for risky jobs make these positions at least as attractive to workers as
are safer alternatives. Workers who are most willing to bear risk will sort themselves into the
higher risk jobs so that the market provides an efficient matching of employer demands for labor
with workers’ preferences with respect to risk and wages. While this standard analysis is an
accurate characterization of the labor market for many immigrant groups, this paper shows that
immigrants from Mexico encounter large fatality risks without significant wage compensation.
Whether immigrant workers are disadvantaged in some way or are simply taking part in a
well functioning labor market for risky jobs requires consideration of the compensation received
for these risks. Berger and Gabriel (1991) find that immigrant workers have substantial values of
statistical life, with point estimates greater than the values for native U.S. workers. Leeth and
Ruser (2003) estimate the compensating wage differentials that Hispanics received irrespective
of immigrant status. They find strong evidence that Hispanic males receive compensating wage
differentials for fatality risks, suggesting that there is no apparent gap in the adequacy of labor
market performance.
1 Orrenius and Zavodny (2008) examine the job risks that immigrants currently face and find that, compared to native U.S. workers, immigrants are in riskier jobs. The high job risks faced by Hispanic workers in particular are the subject of many recent studies, such as those by Richardson, Ruser, and Suarez (2003) and by Loh and Richardson (2004), who find that Hispanics have a fatality risk that has been on the rise and is higher than that of the average worker. These patterns contrast with earlier analyses by Berger and Gabriel (1991) and by Hamermesh (1998), who find that immigrants in general faced somewhat lower risks than native U.S. workers. Enchautegui (2008) explores the job quality for immigrant workers.

2
These favorable results for market behavior do not necessarily imply that markets are
fully efficient or that some immigrant groups are not disadvantaged with respect to the risks they
face. To examine these concerns, we adopt a theoretical reference point that is an extension of
the standard labor market theory of compensating differentials. We hypothesize that there is a
segmented labor market. Instead of selecting jobs from a common wage offer curve available to
all workers, some immigrant groups face a different wage offer curve. In this model, immigrant
workers may select high risk jobs from the options available to them, but they may not receive
the same level of compensation for these risks that is received by other workers who face a
different wage offer curve. Section 2 of the paper outlines the theoretical framework that
underlies our approach.
Section 3 examines the risk levels faced by immigrants using two data sets with
observations on individual workers to which we match fatal and nonfatal job injury risk data.
We use data from the Current Population Survey (CPS), which offers the advantage of a large
sample size, and from the New Immigrant Survey (NIS), which provides more detail about the
characteristics of immigrants than other data sets. Non-Mexican immigrants as a group are
similar to native U.S. workers in terms of the average job risks that they face, but Mexican
immigrants are outliers. The difference between Mexican immigrants and other worker groups is
especially pronounced for risks of fatal injury.
Levels of compensation for job risks differ among immigrant groups. The evidence
presented in Section 4 for the CPS and Section 5 for the NIS indicates that immigrants as a
collective group receive substantial compensating differentials for fatality risks. However, that is
not the case for Mexican immigrants, who on average receive zero or very low levels of wage
premiums for fatal injury risks. The coupling of a fatality risk level that is higher than that of

3
other worker groups with less total wage compensation for these risks is consistent with a model
of segmented labor markets in which Mexican immigrants face a wage offer curve for fatality
risks that is lower and flatter than that faced by other workers. These results are inconsistent
with the standard model of compensating wage differentials.
The NIS data make possible further exploration of the source of the difference between
Mexican immigrants and other immigrant groups. One possible explanation for the difference is
that Mexican immigrants are assimilated less quickly due to language barriers that adversely
affect their labor market outcomes. A second possible explanation is the role of previous illegal
worker status. Borjas and Katz (2007) estimate that 68 percent of all undocumented workers in
the United States are of Mexican origin. Illegal workers may be more willing to take dangerous
jobs because they do not have labor market opportunities from employers that comply with the
law. The NIS data include information from which one can construct measures of language
proficiency and possible previous illegal status. The worker’s understanding of English is the
key determinant of whether workers from Mexico receive statistically significant compensation
for job fatality risks; previous illegal status does not have a statistically significant effect.
II. Segmented Markets for Dangerous Jobs
To explore the possible effect of immigrant status on the observed labor market
equilibrium, we develop a framework for a segmented labor market in which immigrants and
native U.S. workers face different labor market offer curves, may have different preferences, and
generate different estimated market wage-risk curves. This formulation is an extension of the
noncompeting group analysis in Viscusi and Hersch (2001) that they hypothesized and tested for
smokers, and which was used to examine racial differences in risk compensation in Viscusi

4
(2003). A key component of this model is that employers must be able to distinguish the
different labor market groups and offer different sets of job opportunities based on one’s group.
Immigrants can be readily identified by employers, facilitating the provision of different wage
offer curves based on immigrant status.
Our model begins with the components of the standard hedonic wage theory. Consider
the labor market for native U.S. workers. The outer envelope of the firms’ wage offer curves for
jobs of different risk p is the highest available wage w for any risk level p, and is given by w(p).
Other available jobs offering lower wage rates for the same risk level are dominated by these
options. Because providing a safer workplace is more costly to firms and imposes rising
marginal costs, dw/dp > 0 and d2w/dp2 < 0.
Figure 1 illustrates the wage offer curve for native U.S. workers. Workers will choose
the highest available point of tangency with their constant expected utility loci, which is the
wage-risk combination along w(p) that best reflects their risk preferences. In the standard
hedonic labor market model, the empirically estimated relationship between job risks and wages,
or Wage(p), is the estimated locus of the set of observable wage-risk combinations. Thus,
Wage(p) captures the joint influence of supply and demand and is the observed market
equilibrium set of tradeoffs.
We hypothesize that immigrants face a less attractive market offer curve wi(p), shown as
the lower curve in Figure 1. Firms can assess whether a worker is an immigrant based on the
person’s legally required documentation at the time of employment, visa status, and other
characteristics. Workers who are not immigrants will face the wage offer curve w(p). If
immigrants differ from native U.S. workers only in terms of their overall level of productivity,
not their safety-related productivity, then the two curves will differ only by a constant b, as

5
(1) pwbpwi .
We hypothesize that the differences go beyond a simple shift term and that wi(p) is flatter than
w(p), or
(2) dp/dwdp/dwi
at any given risk level p.
A flatter wage offer curve and a correspondingly lower wage-risk tradeoff rate may be
reflective of lower safety improvements for the firm from increasing the underlying safety
conditions for such jobs, making it less desirable to offer higher wages to attract workers. Even
if the underlying safety technologies are the same for jobs employing immigrants, a flatter offer
curve would arise if immigrants have lower safety-related productivity and impose additional
safety costs on the firm at higher underlying job risk levels p. To see how this result arises,
consider the standard model of firms’ demand price for risk in which each firm will offer a wage
locus that satisfies two conditions: i) wages are set at a level so that profits are equal to zero in
competitive equilibrium, and ii) workers are paid their marginal products. If immigrant workers
have a lower marginal product, whether it is because of lower productivity or greater safety
training costs, they will be paid lower wages and face a lower wage offer curve from the firm.
The key feature of the firm’s offer curve for our inquiry is its variation with the level of
job risk p. Increases in the job risk level in Figure 1 enable firms to reduce their safety-related
expenditures, making it possible to offer greater wages and remain on the same isoprofit curve.
However, if immigrant workers as a group impose higher safety-related costs at greater intrinsic
risk levels, then the wage offer must be lower for it to keep the firm on the same isoprofit curve
and compensate the worker based on the worker’s marginal product, including the worker’s

6
safety-related marginal product. The wage offer curve wi(p) in Figure 1 illustrates the flattening
of the wage offer curve as a function of the underlying riskiness of the job.
We hypothesize that immigrants do not face the same wage offer curve as do native U.S.
workers. Rather, they face a curve that is both lower and flatter than that for native U.S.
workers, as indicated by the lower curve in Figure 1. Let immigrant workers incur a risk p2 that
exceeds the risk p1 faced by native U.S. workers, where p2 > p1, as shown in Figure 1. Even
though immigrants face greater risk, the difference in the wage offer curves may lead immigrants
to receive less wage compensation for these risks than do native U.S. workers, or
(3) 0wpw0wpw 1i2i ,
for some combinations of risks p1 and p2. If immigrants faced the same offer curves as native
U.S. workers or offer curves that only differ by a constant b, as in equation 1, such a result could
never occur. The immigrant wage offers at p2 and at a risk of zero would be
(4) 22i pwbpw ,
and
(5) 0wb0wi ,
so that upon substitution equation 3 is
(6) 0wpw0wpw 12 .
This result contradicts the assumption that wage offer curves are upward sloping since p2 > p1,
but the compensating differential is less.
The regression analysis focuses on a canonical log wage equation to explore the
heterogeneity of compensating differentials for risk based on immigrant status. The log of
hourly wage (Wage) is a linear function of a vector X of characteristics of the worker (including
immigrant status) and the worker’s job, the fatality rate, the interaction of fatality rate with

7
immigrant status, and a random error term , or
(7) . Rate FatalityImmigrantImmigrantRateFatalityXWageln 43210
This specification permits a separate labor market equilibrium for immigrants that differs in
terms of the wage level and slope of the estimated wage-risk locus. We also present results
controlling for nonfatal work injuries and its interaction with immigrant status, although we note
that these estimates indicate difficulties in disentangling the compensation for different risks as
well as the interaction effects.2
The empirical analysis below provides three different sets of information pertaining to the
respective character of the market for risky jobs for both immigrants and non-immigrants. First,
an immigrant indicator variable is included in the equation to test whether the market equilibrium
curve for immigrants differs from that for native U.S. workers by a constant term or perhaps not
at all. We find that the immigrant indicator variable has a negative sign indicating lower wages,
controlling for risk and other determinants of wages. Second, we estimate the rates of tradeoff
between risk and wages for immigrants and for native U.S. workers and find that immigrants
have a lower rate of tradeoff. Such a result alone need not imply that immigrants face flatter
offer curves such as that shown in Figure 1, as immigrants may simply have sorted themselves
along the high risk, flatter part of the offer curve for which the tradeoff rates are less. The third
comparison of the total amount of the compensating differential immigrants receive for the high
risk p2 that exceeds the risk p1 for native U.S. workers is the definitive test. If, compared to a
zero risk level, immigrants receive less wage compensation for risk than do native U.S. workers,
2 We also explored estimates using two different measures of workers’ compensation benefits—the state benefit maximum for temporary total disability and the interaction of this variable with the nonfatal work injury rate. The coefficients had unexpected positive signs, perhaps because states with generous benefits have more favorable labor market conditions. Inclusion of the workers’ compensation variable did not affect the estimated coefficient on fatality risk, which is the main matter of interest.

8
then one can conclude that the wi(p) is not only lower than w(p), but is also flatter, as shown in
Figure 1. We find that this is the case for immigrants from Mexico.
III. Risk Levels by Immigrant Status
The main risk variables of interest are the job-related fatality rate and the nonfatal lost
workday rate. The fatality rate is the primary focus of the analysis as it is the main building
block of labor market estimates of the value of statistical life (VSL). The fatality risk variable is
constructed by the authors using data from the U.S. Census of Fatal Occupational Injuries
(CFOI). These data provide a comprehensive census of all work-related deaths. For a job
fatality to be included in the CFOI data, it must be verified using at least two different sources of
information, including death certificates, workers’ compensation records, accident reports by the
Occupational Safety and Health Administration, medical examiner or coroner reports, and
follow-up questionnaires. The average number of source documents used for the CFOI
verification of a job-related death is four (Loh and Richardson 2004).
The time period for the fatality risk measures used in this analysis is 2003-2005.
Beginning in 2003, the CFOI began classifying fatalities by the Standard Occupational
Classification (SOC) 2000 codes and North American Industry Classification System (NAICS)
2002 codes. The data sets to which we match our fatality data are for 2003, but to reduce the
number of sparse or empty cells, we construct fatality rates using the three-year period starting in
2003. To convert the number of fatalities into a fatality rate, we construct denominators using
2003-2005 CPS data on employment using the earnings weight variable to account for sampling
effects. The CPS and NIS data sets record occupation and industry using Census codes, so we
use a crosswalk to achieve a matchup.

9
We calculate the fatality rate by two-digit industry (52 two-digit industries), immigrant
status, and age (two age groups, 16-34 and 35-64).3 For comparison to the literature and as a
check for robustness, we also present estimates with the fatality rate calculated by two-digit
industry, by both two-digit industry and immigrant status, and by both two-digit industry and
occupation (in nine occupational categories).4
The nonfatal lost workday injury and illness rate is included in some of the analyses to
control for other risky aspects of the job. We use the injury and illnesses incidence rate per 100
workers for cases with days away from work for 2003.5 We match these lost workday rates to
individual workers by four-digit industry level. In addition to the risk measures defined earlier,
the key variables of interest are immigrant status, wages, and worker characteristics such as
education, work history, and demographic information.
The empirical analysis uses two different data sets for the same year to examine risk
levels and compensation immigrant workers receive for risk. The CPS data set is a large sample
that includes employment data for the U.S. work force, as well as information on immigrant
status and country of origin. These data make it possible to compare the labor market
performance of immigrants with that of native U.S. workers. We use data from the monthly CPS
for the year 2003 for the workers in the outgoing rotations, as earnings information is reported
for these workers. We also use data from the NIS, which is a sample of 8,573 new legal
3 Loh and Richardson (2004) find that fatality rates within occupations differ by immigrant status. The first study to construct CFOI fatality rates by age is Viscusi and Aldy (2007). That analysis did not also take into account immigrant status and was consequently able to include more age groups. Black and Kniesner (2003) explore the issue of measurement error for fatality risk rates. 4 As discussed below, the sample is restricted to workers who previously were referred to as blue-collar workers. This categorization corresponds to our nine occupational groups. The first CFOI industry-occupation measures are used in Viscusi (2004) and Kniesner, Viscusi, and Ziliak (2006). Their fatality rates are constructed using the earlier CFOI industry and occupation coding. 5 These rates are calculated by the Bureau of Labor Statistics, U.S. Department of Labor, and are available at http://www.bls.gov/iif/oshwc/osh/os/ostb1355.pdf.

10
immigrants to the U.S. who received permanent legal residence status in 2003.6 The NIS
provides detailed information on a wide range of worker and personal characteristics, including
information on English language proficiency and type of visa, as well as measures that make it
possible to construct proxies for whether the respondent was an illegal immigrant at one time.
Because the CPS has limited worker information, it is possible that estimates of compensating
differentials for risk suffer from omitted variables bias. By comparing wage equation estimates
derived from the CPS to those from the NIS, which includes more detailed worker information,
we have evidence on the robustness of the findings. We therefore make similar sample
restrictions using both data sets.
The empirical analysis of the CPS and the NIS data is restricted to workers in
occupations that previously were characterized as blue-collar jobs, as the most serious job risks
pertain to these occupations.7 Restriction to these occupations is common throughout the value
of statistical life literature. We also restrict the sample using both the CPS and NIS to those who
are not self-employed because the monthly CPS does not report earnings for self-employed
workers. In addition, we restrict the sample to those with hourly wages between $1.50 and $100
and age 18-64.
In the CPS, immigrants are identified as those who are foreign born, excluding those born
abroad of American parent(s) and those born in Puerto Rico or other U.S. outlying areas. The
NIS is comprised entirely of immigrants. Specific country of birth is identified in the CPS, and
6 The data and information on the NIS are available at http://nis.princeton.edu. 7 Due to a change in occupational classifications over time, there is no longer a traditional break point between blue-collar and white-collar jobs. The occupations we classify as blue-collar jobs are i) healthcare practitioner and technical occupations, and healthcare support occupations; ii) protective service occupations; iii) food preparation and serving related occupations, iv) building and grounds cleaning and maintenance occupations, v) personal care and service occupations, vi) farming, fishery, and forestry, and construction and extraction occupations; vii) installation, maintenance, and repair occupations; viii) production occupations, and ix) transportation and material moving occupations, from which we exclude aircraft pilots and flight engineers, and air traffic controllers and airfield operations specialists, for consistency with earlier categorizations of blue-collar jobs. We include indicator variables for these occupational categories in the wage equations.

11
country of birth or region is identified in the NIS. We group countries into broad categories,
specifically Europe, Asia, Middle East, North America, Central America, Caribbean, South
America, North Africa, other Africa, Oceania, and country not reported. We also separately
analyze immigrants from Mexico, stratifying Central America into Mexico and all other
countries.
To calculate the value of statistical life, we start by estimating log wage equations.
Hourly wage is either reported directly (CPS and NIS) or is calculated as weekly earnings
divided by usual hours worked per week (CPS) or from information on salary and time unit
(NIS). We also include indicator variables for detailed race (white, black, American Indian,
Asian or Pacific Islander, or more than one race reported), Hispanic ethnicity, sex, married,
employed by the government, union member or covered by union contract, full-time
employment, whether paid on an hourly basis, region of the U.S., and indicator variables for
occupation (nine occupational categories). Using both data sets, we control for years of
education. Education is imputed in the CPS from highest educational attainment and years in
degree program. The NIS allows distinguishing education attained before migrating to the U.S.
from education attained in the U.S., so we use these two measures of education in the analysis.
The CPS does not have specific information on work history. We approximate
experience by potential experience, defined as age - years of education completed - five. The
NIS includes information on the date of first job in the U.S., and we approximate potential U.S.
work experience by the difference between age and year of first job in U.S. All remaining
information used in the NIS wage equation estimates is not available in the CPS. We include
indicator variables for visa type (employment, spouse, diversity, and all other visa types), tenure
with current employer and its square, whether a new arrival immigrant (who acquired

12
immigration documents abroad, in contrast to adjustee immigrants who were residing in the U.S.
when they attained permanent residence status), and English language ability. English language
proficiency is an indicator variable based on respondents’ self-reports of whether they
understand spoken English very well or well.8 Reported English language proficiency is 52
percent for immigrants generally and 51 percent for Mexican immigrants, indicating little
difference between Mexican immigrants and other groups.
We also construct from the NIS indicators of whether the respondent was likely to have
spent some time as an illegal resident in the U.S. before achieving permanent legal residence
status. We define two indicators of possible prior illegal status. The first, narrower measure,
which we term Narrow Prior Illegal, identifies those who had entered without inspection in a
previous visit to the U.S. or who had attained legal residence status through legalization. Based
on the Narrow Prior Illegal measure, 27 percent of Mexican immigrants, 20 percent of non-
Mexican immigrants, and 21 percent of all immigrants may have had some prior illegal status.
The broader measure, which we call Broad Prior Illegal, adds those whose visa status in a
previous visit to the U.S. is unknown.9 The Broad Prior Illegal measure produces an estimate of
33 percent possible prior illegal status for the sample generally, with a 62 percent rate for
Mexican immigrants and 24 percent for non-Mexican immigrants.
We first address whether immigrants are in fact concentrated in the more hazardous jobs
and, if so, whether the differences are more pronounced for the more serious injuries. Table 1
presents description statistics for the CPS sample of 61,437 workers for the four different fatality
8 The CPS reports whether Spanish is the only language spoken by all members of the household age 15 and older. Explorations using this variable did not indicate significant effects on wage premiums for fatality risks. 9 The definition we employ of previous illegal status does not capture all of the ways that an immigrant can be illegal. For example, someone who enters legally with a tourist visa but works for pay during the visit would have an illegal status. See Jasso et al. (2008) for a complete characterization and analysis of illegal status using data from the NIS-Pilot 1996.

13
rate measures, as well as for nonfatal lost workday rates and wages. The data are presented for
different groups based on immigrant status and, if the worker is an immigrant, whether the
worker emigrated from Mexico. Mexican immigrants are a large segment of the immigrant
population, comprising 43 percent of all immigrants in the sample. Nationwide, Mexican
immigrants accounted for an average of 40 percent of all workplace fatalities to foreign-born
workers from 1996-2001, with a percentage share that increased over that time period. Loh and
Richardson (2004) calculate that Mexican-born fatalities rose from 241 in 1996 to 422 in 2001.
We distinguish Mexican immigrants as a category rather than Hispanic immigrants generally
because analysis based on Mexican origin indicates more pronounced labor market differences
than does analysis of Hispanics generally.
The average fatality rate per 100,000 workers varies depending on the fatality risk
measure and the sample. The average rate per 100,000 workers is 4.51 overall with the
exception of the industry-occupation measure, which is somewhat larger given the sample
restriction to largely blue-collar occupations. Immigrants as a group have substantially higher
fatality rates than all workers in the sample or than native U.S. workers for the two measures that
are based on immigrant-specific fatality rates, but not otherwise. Because immigrants are not a
homogeneous group, the fatality rates differ within the immigrant sample. Based on the
industry-immigrant status-age fatality rate, Mexican immigrants have a fatality rate of 5.97 as
compared to 4.38 for non-Mexican immigrants. For the four different fatality measures,
Mexican immigrants have fatality rates that range from 36 percent to 46 percent higher than that
for non-Mexican immigrants. Mexican immigrants likewise have a fatality rate that is greater
than that of native U.S. workers. The patterns based on industry-immigrant status-age yield
higher fatality rates for all three immigrant groups than those implied by overall industry

14
averages alone, which have a fatality rate per 100,000 workers of 4.52 for native U.S. workers,
4.56 for immigrants, 3.78 for non-Mexican immigrants, and 5.51 for Mexican immigrants.
Accounting for the immigrant-specific fatality rates produces a wider disparity between
immigrants and native U.S. workers than otherwise would be apparent based on the industry risk
levels alone.
The lost workday rate for immigrants and native U.S. workers are quite similar. Native
U.S. workers have an annual lost workday rate per 100 workers of 1.85, as compared to 1.83 for
immigrants. Mexican immigrants work in industries with an injury rate of 1.91, which is 3
percent greater than the native U.S. average. While Mexican immigrants have riskier jobs both
in terms of fatal and nonfatal risks, the far greater relative disparity is with respect to risks of
fatal injury.
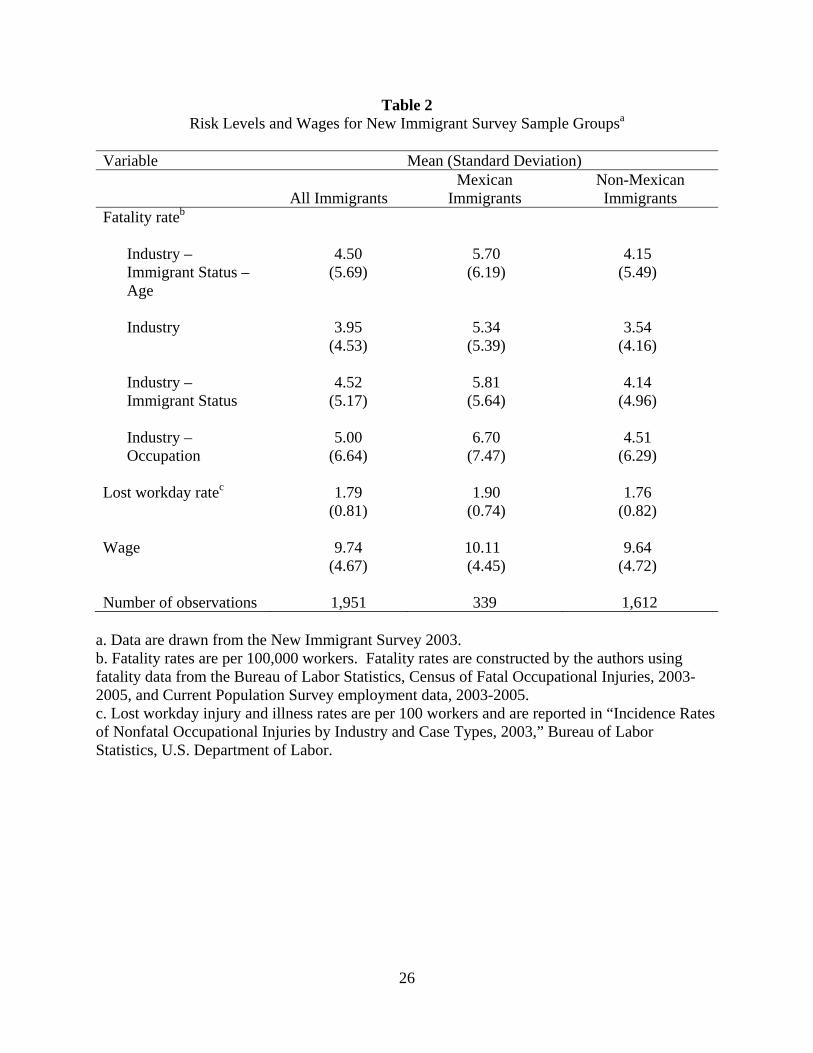
Table 2 presents the comparable risk and wage statistics for the NIS data set. These data
also indicate the outlier status of Mexican immigrants as compared to the immigrant population
generally. For all immigrants in the NIS, the average industry-immigrant status-age fatality rate
is 4.50 per 100,000 workers, and the lost workday rate per 100 workers is 1.79. Mexican
immigrants have an average fatality rate of 5.70, as compared to 4.15 for immigrants from
countries other than Mexico. This 37 percent difference is greater than the 8 percent spread for
nonfatal lost workday rates per 100 workers, which are 1.90 for Mexican immigrants and 1.76
for other immigrant groups. As with the CPS data, there is a high average fatality risk disparity
for the industries in which Mexican immigrants work and a higher fatality rate than indicated by
the average industry fatality risk measure. The fatality risk of Mexican immigrants as compared
to non-Mexican immigrants ranges from 37-40 percent higher for the two fatality risk variables
15
that are conditional on immigrant status to a difference of 49-51 percent for the other two fatality
risk variables.
IV. Immigrant Status and Compensating Differentials: Regression Evidence from the CPS
Table 3 presents estimates of the key risk and immigrant status variables based on CPS
data. The first column in Table 3 includes no immigrant-related variables and serves as a basis
of comparison with the existing VSL literature. The second and third columns provide evidence
on the difference between immigrants and non-immigrants. Column 2 controls for immigrant
status and its interaction with the fatality rate. Column 3 also includes the corresponding lost
workday rate variables. Robust standard errors are reported in parentheses, and the robust and
clustered (at the level of the fatality risk measure’s construction) standard errors are reported in
brackets. Our discussion focuses on significance levels based on robust standard errors, as the
coefficients based on the clustered standard errors are often not statistically significant for the
CPS results.
Workers in general receive a statistically significant compensating differential for fatality
risks. Immigrants overall receive lower pay than native U.S. employees, controlling for other
wage determinants. The immigrant interaction term with the fatality rate is negative and
statistically significant, implying that immigrants receive lower compensation for fatality risks.
The different slope and vertical intercept for immigrants are consistent with the labor market
segmentation hypothesis. There is also significant positive compensation for lost workday risks,
which does not differ significantly by immigrant status.
The VSL for a log wage equation without interactions is calculated using the following
standard equation,
16
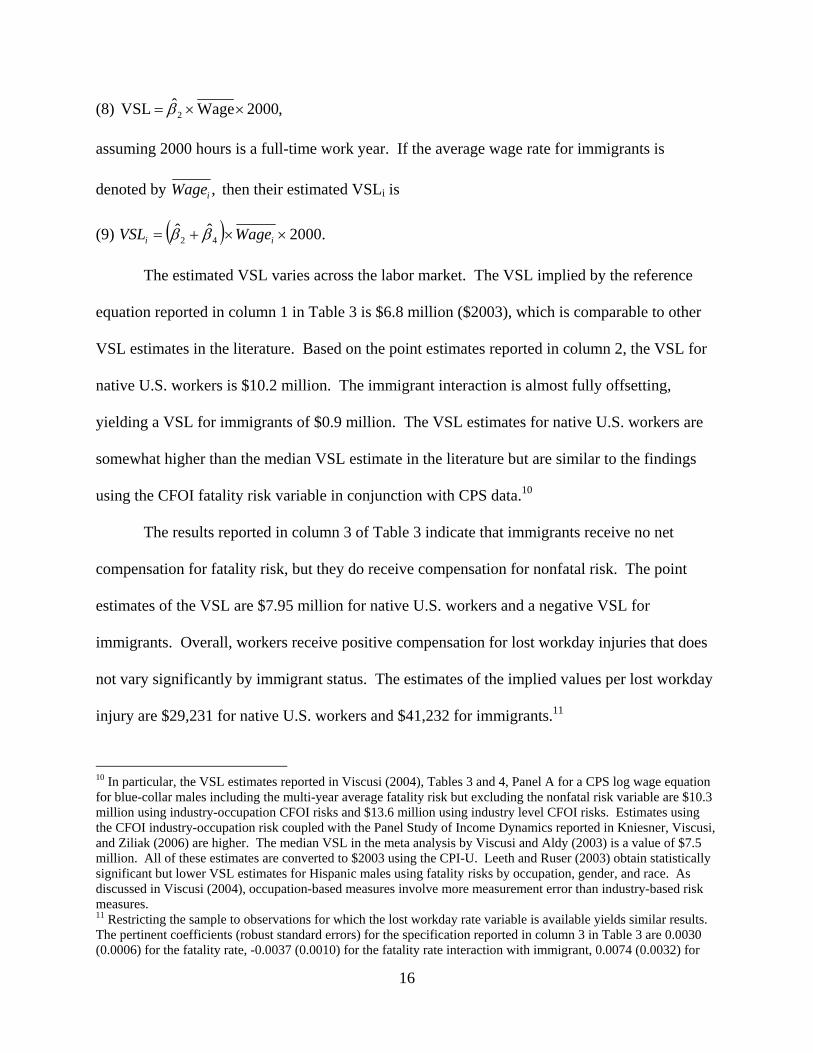
(8) ,2000WageˆVSL 2
assuming 2000 hours is a full-time work year. If the average wage rate for immigrants is
denoted by ,iWage then their estimated VSLi is
(9) .2000ˆˆ42 ii WageVSL
The estimated VSL varies across the labor market. The VSL implied by the reference
equation reported in column 1 in Table 3 is $6.8 million ($2003), which is comparable to other
VSL estimates in the literature. Based on the point estimates reported in column 2, the VSL for
native U.S. workers is $10.2 million. The immigrant interaction is almost fully offsetting,
yielding a VSL for immigrants of $0.9 million. The VSL estimates for native U.S. workers are
somewhat higher than the median VSL estimate in the literature but are similar to the findings
using the CFOI fatality risk variable in conjunction with CPS data.10
The results reported in column 3 of Table 3 indicate that immigrants receive no net
compensation for fatality risk, but they do receive compensation for nonfatal risk. The point
estimates of the VSL are $7.95 million for native U.S. workers and a negative VSL for
immigrants. Overall, workers receive positive compensation for lost workday injuries that does
not vary significantly by immigrant status. The estimates of the implied values per lost workday
injury are $29,231 for native U.S. workers and $41,232 for immigrants.11
10 In particular, the VSL estimates reported in Viscusi (2004), Tables 3 and 4, Panel A for a CPS log wage equation for blue-collar males including the multi-year average fatality risk but excluding the nonfatal risk variable are $10.3 million using industry-occupation CFOI risks and $13.6 million using industry level CFOI risks. Estimates using the CFOI industry-occupation risk coupled with the Panel Study of Income Dynamics reported in Kniesner, Viscusi, and Ziliak (2006) are higher. The median VSL in the meta analysis by Viscusi and Aldy (2003) is a value of $7.5 million. All of these estimates are converted to $2003 using the CPI-U. Leeth and Ruser (2003) obtain statistically significant but lower VSL estimates for Hispanic males using fatality risks by occupation, gender, and race. As discussed in Viscusi (2004), occupation-based measures involve more measurement error than industry-based risk measures. 11 Restricting the sample to observations for which the lost workday rate variable is available yields similar results. The pertinent coefficients (robust standard errors) for the specification reported in column 3 in Table 3 are 0.0030 (0.0006) for the fatality rate, -0.0037 (0.0010) for the fatality rate interaction with immigrant, 0.0074 (0.0032) for

17
To explore the sensitivity of the results to the fatality risk measure, Table 4 reports the
estimates of equation 7 (corresponding to column 2 of Table 3) for all four fatality risk measures.
The results are quite similar irrespective of the fatality risk variable used. The estimated VSL for
native U.S. workers ranges from $8.80 million to $10.22 million, while the estimated VSL for
immigrants is smaller and sometimes negative. Because of the similarity of the results and the
greater specificity of the industry-immigrant status-age variable, the remaining estimates are
based on this fatality rate.
To allow for structural differences by immigrant status, Table 5 reports equations
estimated separately for native U.S. workers and immigrants. The first set of results that do not
include the lost workday rate indicate a larger fatality risk premium for native U.S. workers,
implying a VSL for native U.S. workers of $8.80 million and $5.24 million for immigrants. The
second pair of equations including the lost workday rate continues to indicate statistically
significant compensation for fatality risks for native U.S. workers, but not for immigrants.
Although native U.S. workers and immigrants have wage equations that differ by more than an
intercept and a risk interaction term, the general result that immigrants receive lower fatality risk
compensation than native U.S. workers holds.12
The estimates in Table 6 examine differences in compensation based on the immigrant’s
country of origin. We report results for the interaction specification of the model because it is
not feasible to obtain reliable estimates using separate equations for each immigrant group.
Column 1 of Table 6 includes 11 separate fatality rate interaction terms for different regions of
the lost workday rate, and 0.0157 (0.0076) for the lost workday rate interaction with immigrant. The sample size is reduced from 61,437 to 57,195. 12 The F test for the equality of the coefficients for immigrants and native U.S. workers indicates that there are statistically significant differences for coefficients other than the intercept and the risk variables. For equations including both the fatality risk and the lost workday risk variables and the immigrant intercept and interactions, the pertinent F value for the equality of the other coefficients by immigrant status is F(27, 61377) = 13.27, which indicates a statistically significant difference at the usual significance levels.

18
origin as well as intercepts for each region. The two interaction terms that are statistically
significant at the 5 percent level are for immigrants from Africa, who on balance receive no
compensating differential for fatality risks, and for Mexican immigrants. Immigrants from
Africa comprise only 2 percent of the sample, so the subsequent empirical analysis focuses on
the differential fatality risk compensation for Mexican immigrants. For all other immigrant
groups, there is no evidence of any statistically significant difference in the compensation for
fatality risks relative to native U.S. workers. Based on these estimates, the average native U.S.
worker in the sample has a VSL of $7.95 million. The fatality rate interaction with Mexico is
larger than the fatality rate coefficient, indicating that there is no net fatality rate compensation
for Mexican immigrants.
The final three columns of Table 6 report different equations that focus more narrowly on
the fatality risk interaction with Mexico. The second column in Table 6 reports this equation
including the lost workday rate and its interaction with Mexico. Mexican immigrants receive
negative net compensation for fatality risks and no additional wage premium for nonfatal injury
risks above that received by other workers. Column 3 in Table 6 excludes the lost workday rate
but adds an additional fatality risk interaction term for non-Mexican immigrants. This
interaction term is not statistically significant. The fatality risk coefficient for Mexican
immigrants is almost a complete offset of the main fatality risk coefficient. The final
specification in Table 6 excludes the insignificant non-Mexican immigrant interaction and finds
that on balance Mexican immigrants receive no net positive compensation for fatality risks.13
Because Mexican workers receive lower total fatality risk compensation than native U.S.
13 The estimates are almost identical for the different fatality rate measures. The fatality rate coefficients for the specification that corresponds to column 4 of Table 6 range from 0.0031 to 0.0033 for the other fatality risk measures, and the negative and significant Mexican immigrant interactions imply point estimates of the VSL that are negative in all but one instance. For the one positive value, the VSL is $0.21 million.

19
workers and non-Mexican immigrants despite facing greater risks, we can reject the hypothesis
that their wage offer curve is the same as that for other workers or that the offer curve for
Mexican immigrants differs by only an intercept term.
V. Immigrant Status and Compensating Differentials: Regression Evidence from the NIS
The NIS data set provides additional detail on immigrant characteristics that makes it
possible to explore whether the differences in wage premiums for fatality risks are due to omitted
variables. In particular, we examine English language proficiency and prior illegal residence
status.
Table 7 presents selected coefficients for four different wage equations for the NIS
sample. Because all respondents to the NIS are immigrants, native U.S. workers are no longer
the basis of comparison. Immigrants as a group receive significant wage compensation for risk,
with the estimates in column 1 implying a VSL of $9.35 million. Adding the lost workday rate
in the second column of Table 7 reduces the fatality risk coefficient and implies a VSL of $7.21
million coupled with an implicit value of lost workday injuries of $54,349.
A regression using the NIS data with region of origin interactions patterned after those in
the first column of Table 6 indicated that Mexican immigrants are again the chief outliers, so we
estimate log wage equations for the NIS including an interaction of the risk variables with
Mexico. The results in the third column in Table 7 indicate a large negative interaction term
with Mexico, as Mexican immigrants receive no net wage compensation for fatality risks, while
non-Mexican immigrants have a VSL of $13.88 million.
The final column in Table 7 includes an interaction with Mexico of both the fatality rate
and the lost workday rate. Immigrants in general receive positive risk premia for both fatal risks

20
and nonfatal job injury risks. But Mexican immigrants receive no net fatality risk compensation.
Mexican immigrants do not receive additional compensation for lost workday risks over that
received by other immigrants. The consistent absence of compensation for fatal job risks for
Mexican immigrants leads us to reject the hypothesis that Mexican immigrants face the same
wage offer curve for fatality risks as do other immigrants.
To explore the possible reasons that workers from Mexico fare so poorly with respect to
fatality risk compensation, we examine two possible causes: the individual’s understanding of
the English language and whether the immigrant, who is now a legal immigrant, was at one time
an illegal immigrant to the U.S. Table 8 reports regressions with each of these variables included
separately and as an interaction with the fatality rate and with the fatality rate interacted with
Mexico.
Workers who understand English may face a different set of job opportunities than those
who do not, which many observers have suggested may have led the latter to take high risk jobs
that offer low pay.14 In addition, language barriers potentially could put these workers at greater
risk on the job so that their safety-related productivity is less. All estimates reported in this paper
control for understanding English and consistently show that those who understand English well
or very well have higher wages. Based on the first column of results in Table 8, the fatality risk
premium for workers overall does not differ significantly with the worker’s English language
proficiency, so one’s understanding of English does not affect the compensating differentials
received by non-Mexican immigrants. However, workers from Mexico who have better English
language proficiency receive a higher wage premium for fatality risks. While workers from
14 Loh and Richardson (2004), p. 42, offer the following observation: “Low educational attainment, lack of English proficiency, and other factors contribute to employment of many foreign-born workers in lower paying, higher risk jobs.” Lazear (2007) emphasizes the role of language problems for workers from Mexico, and McManus, Gould, and Welch (1983) document the labor market role of English language fluency more generally. The role of language proficiency affects immigrant workers’ risk levels, as documented by Orrenius and Zavodny (2008).

21
Mexico who do not understand English receive no premium for fatality risks and appear to be
paid less for such jobs, workers from Mexico who understand English receive compensation
implying a VSL of $3.44 million using the average wage rate for workers from Mexico who
understand English. The VSL is reduced by inclusion of the negative but statistically
insignificant interaction of the fatality rate with whether the individual understands English. The
pronounced compensation gap for workers from Mexico who do not understand English is
consistent with the job safety literature, which has highlighted the role of language barriers.
We also consider whether prior illegal status may account for a lower risk premium.
Illegal immigrants may have revealed themselves to be greater risk takers through their illegal
entry, and they may also face a different wage offer curve than legal immigrants. The estimates
in the final two columns of Table 8 also include in the basic wage equations each of these prior
illegal status variables as well as the interaction of each of them with the fatality rate and with
the fatality rate interacted with Mexico. Neither of these prior illegal status interactions is ever
statistically significant when interacted with the fatality risk variable. The Narrow Prior Illegal
variable does have an independent positive effect on wages. Understanding the English language
is more influential in determining a worker’s wage-risk tradeoff than one’s prior illegal status.
VI. Conclusion
The widespread impression that immigrants differ from native U.S. workers with respect
to the riskiness of their jobs is overly simplistic. As a group, immigrants do not incur fatal or
nonfatal job risks that are much different than those of native U.S. workers, and they are
compensated for these risks. The notable exception is Mexican immigrants. While the nonfatal

22
risks of their jobs are just a bit higher than those faced by other groups, the fatality risks are
substantially greater.
Job risks that workers incur necessarily differ across the U.S. economy, so the existence
of such differences in risk levels is not in itself inconsistent with a world of appropriately
functioning compensating differentials for risk. Unfortunately, Mexican workers do not fare
well with respect to their levels of compensation for fatality risks. Mexican workers generally
receive no statistically significant wage premiums for fatality risks, or they receive significantly
less risk compensation than do other groups who face lower levels of risk. These results are
consistent with a generalized model of hedonic labor market equilibrium in which Mexican
immigrants face wage offer curves that are both lower and flatter than those facing other groups.
The existence of this type of labor market segmentation raises a new set of issues as to
why this particular immigrant group faces labor market opportunities that differ in this manner.
The key determinant of these differences among Mexican immigrants is not the immigrant’s
previous illegal status, but rather is whether the Mexican immigrant is proficient in
understanding the English language. Understanding English may be consequential either
because it affects the set of jobs that are available or because knowledge of English is related to
safety-related productivity, such as one’s ability to profit from safety training and risk
information that may be provided only in English. It also may be that employers infer that
Mexican workers with a poor understanding of English have illegal status irrespective of whether
they have appropriate documentation.

23
References
Berger, Mark C., and Paul E. Gabriel. 1991. “Risk Aversion and the Earnings of the U.S. Immigrants and Natives.” Applied Economics 23(2): 311-318. Black, Dan. A., and Thomas J. Kniesner. 2003. “On the Measurement of Job Risk in Hedonic
Wage Models.” Journal of Risk and Uncertainty 27(3): 205-220. Borjas, George J., and Lawrence F. Katz. 2007. “The Evolution of the Mexican-Born Workforce in the United States.” In Mexican Immigration to the United States, ed. George J. Borjas, 13-55. Chicago: University of Chicago Press. Enchautegui, María E. 2008. “The Job Quality of U.S. Immigrants.” Industrial Relations 47 (1):108-113. Hamermesh, Daniel S. 1998. “Immigration and the Quality of Jobs.” In Help or Hindrance: The Economic Implications of Immigration for African Americans, ed. Daniel S. Hamermesh and Frank D. Bean, 75-106. New York: Russell Sage Foundation. Kniesner, Thomas J., W. Kip Viscusi, and James Ziliak. 2006. “Life-Cycle Consumption and the
Age-Adjusted Value of Life.” Contributions to Economic Analysis & Policy 5(4): article 4.
Jasso, Guillermina, et al. 2008. “From Illegal to Legal: Estimating Previous Illegal Experiences
among New Legal Immigrants to the United States.” International Migration Review 42(4): 803-843.
Lazear, Edward. 2007. “Mexican Assimilation in the United States.” In Mexican Immigration to the United States, ed. George J. Borjas, 107-122. Chicago: University of Chicago Press. Leeth, John D., and John Ruser. 2003. “Compensating Differentials for Fatal and Nonfatal Injury Risk by Gender and Race.” Journal of Risk and Uncertainty 27(3): 257-277. Loh, Katherine, and Scott Richardson. 2004. “Foreign-Born Workers: Trends in Fatal Occupational Injuries, 1996-2001.” Monthly Labor Review 127(6): 42-53. McManus, Walter, William Gould, and Finis Welch. 1983. “Earnings of Hispanic Men: The Role of English Language Proficiency.” Journal of Labor Economics 1(2): 101-130. Orrenius, Pia M., and Madeline Zavodny. 2008. “Do Immigrants Work in Riskier Jobs?” Demography. Forthcoming.

24
Richardson, Scott, John Ruser, and Peggy Suarez. 2003. “Hispanic Workers in the United States: An Analysis of Employment Distributions, Fatal Occupational Injuries, and Non- fatal Occupational Injuries and Illnesses,” Appendix in National Academies Press, Safety is Seguridad: A Workshop Summary, 43-82. Washington, D.C.: National Academies Press. Viscusi, W. Kip. 2003. “Racial Differences in the Value of a Statistical Life.” Journal of Risk and Uncertainty 27(3): 239-256. Viscusi, W. Kip. 2004. “The Value of Life: Estimates with Risk by Occupation and Industry.” Economic Inquiry 42(1): 29-48. Viscusi, W. Kip, and Joseph E. Aldy. 2003. “The Value of a Statistical Life: A Critical Review
of Market Estimates throughout the World.” Journal of Risk and Uncertainty 27(1): 5-76. Viscusi, W. Kip, and Joseph E. Aldy. 2007. “Labor Market Estimates of the Senior Discount for
the Value of Statistical Life.” Journal of Environmental Economics and Management 53(3): 377-392.
Viscusi, W. Kip, and Joni Hersch. 2001. “Cigarette Smokers as Job Risk Takers.” Review of Economics and Statistics 83(2): 269-280.

25
Table 1 Risk Levels and Wages for Current Population Survey Sample Groupsa
Variable Mean (Standard Deviation)
All Workers
Native U.S.
Immigrants
Mexican
Immigrants
Non-Mexican
Immigrants Fatality rateb
Industry – Immigrant status – Age
4.51 (5.32)
4.35 (5.16)
5.10 (5.81)
5.97 (6.24)
4.38 (5.32)
Industry 4.53
(5.15) 4.52
(5.22) 4.56
(4.91) 5.51
(5.39) 3.78
(4.31) Industry – Immigrant status
4.55 (5.24)
4.39 (5.11)
5.14 (5.65)
6.06 (5.93)
4.37 (5.28)
Industry – Occupation
6.17 (7.61)
6.30 (7.80)
5.71 (6.83)
6.68 (6.95)
4.90 (1.76)
Lost workday ratec 1.85
(0.92) 1.85
(0.95) 1.83
(0.83) 1.91
(0.72) 1.76
(0.90) Wage 13.60
(7.85) 14.19 (8.07)
11.39 (6.55)
10.28 (5.14)
12.32 (7.40)
Number of observations 61,437 50,673 10,764 4,545 6,219
a. Data are drawn from the 2003 Current Population Survey. b. Fatality rates are per 100,000 workers. Fatality rates are constructed by the authors using fatality data from the Bureau of Labor Statistics, Census of Fatal Occupational Injuries, 2003-2005, and Current Population Survey employment data, 2003-2005. c. Lost workday injury and illness rates are per 100 workers and are reported in “Incidence Rates of Nonfatal Occupational Injuries by Industry and Case Types, 2003,” Bureau of Labor Statistics, U.S. Department of Labor.
26
Table 2 Risk Levels and Wages for New Immigrant Survey Sample Groupsa
Variable Mean (Standard Deviation)
All Immigrants Mexican
Immigrants Non-Mexican Immigrants
Fatality rateb
Industry – Immigrant Status – Age
4.50 (5.69)
5.70 (6.19)
4.15 (5.49)
Industry 3.95
(4.53) 5.34
(5.39) 3.54
(4.16) Industry – Immigrant Status
4.52 (5.17)
5.81 (5.64)
4.14 (4.96)
Industry – Occupation
5.00 (6.64)
6.70 (7.47)
4.51 (6.29)
Lost workday ratec 1.79
(0.81) 1.90
(0.74) 1.76
(0.82) Wage 9.74
(4.67) 10.11 (4.45)
9.64 (4.72)
Number of observations 1,951 339 1,612
a. Data are drawn from the New Immigrant Survey 2003. b. Fatality rates are per 100,000 workers. Fatality rates are constructed by the authors using fatality data from the Bureau of Labor Statistics, Census of Fatal Occupational Injuries, 2003-2005, and Current Population Survey employment data, 2003-2005. c. Lost workday injury and illness rates are per 100 workers and are reported in “Incidence Rates of Nonfatal Occupational Injuries by Industry and Case Types, 2003,” Bureau of Labor Statistics, U.S. Department of Labor.

27
Table 3 Log Hourly Wage Regressions for Current Population Survey with Immigrant Interactionsa
(1) (2) (3) Fatality rate 0.0025
(0.0005)** [0.0017]
0.0036 (0.0005)** [0.0021]*
0.0028 (0.0005)** [0.0023]
Fatality rate × Immigrant -0.0032 (0.0009)** [0.0029]
-0.0035 (0.0010)** [0.0032]
Immigrant
-0.0739 (0.0081)** [0.0138]**
-0.0862 (0.0131)* [0.0234]**
Lost workday rate
0.0103 (0.0031)** [0.0121]
Lost workday rate × Immigrant
0.0078 (0.0070) [0.0148]
R-squared 0.34 0.34 0.34
a. Number of observations=61,437. Robust standard errors in parentheses; clustered standard errors in brackets, where clustering is by industry-immigrant status-age. *p<0.10, **p<0.05. Additional variables included in all wage regressions but coefficients not reported are: potential work experience, potential work experience squared, years of education, and indicator variables for sex, married, race, Hispanic ethnicity, full-time employment, paid hourly rate, union or employee association, government employer, occupation, metropolitan location, and region of the U.S. Column 3 also includes a lost workday rate missing value indicator.

28
Table 4 Sensitivity Analyses for Current Population Survey with Alternative Fatality Risk Variablesa
Fatality Rate Measure Industry –
Immigrant Status – Age
Industry
Industry – Immigrant
Status
Industry –
Occupation Fatality Rate 0.0036
(0.0005)** [0.0021]*
0.0035 (0.0005)** [0.0026]
0.0036 (0.0005)** [0.0028]
0.0031 (0.0004)** [0.0013]*
Fatality Rate ×
Immigrant -0.0032 (0.0009)** [0.0029]
-0.0051 (0.0010)** [0.0020]**
-0.0034 (0.0009)** [0.0037]
-0.0017 (0.0008)** [0.0011]
Native U.S.
VSL ($ millions) 10.22 9.93 10.22 8.80
Immigrant
VSL ($ millions) 0.91 -3.64 0.05 3.19
a. Number of observations = 61,437. Robust standard errors in parentheses; clustered standard errors in brackets, where clustering is by the level of the fatality risk measure’s construction. *p<0.10, **p<0.05. Additional variables included in all wage regressions but coefficients not reported are potential work experience, potential work experience squared, years of education, and indicator variables for sex, married, race, Hispanic ethnicity, immigrant, full-time employment, paid hourly rate, union or employee association, government employer, occupation, metropolitan location, and region of the U.S.

29
Table 5 Log Hourly Wage Regressions for Current Population Survey Stratifying by Immigrant Statusa
Native U.S. Immigrants Native U.S. Immigrants Fatality rate 0.0031
(0.0005)** [0.0021]
0.0023 (0.0009)* [0.0015]
0.0023 (0.0006)** [0.0022]
0.0010 (0.0010) [0.0016]
Lost workday rate 0.0094
(0.0032)** [0.0116]
0.0241 (0.0077)** [0.0132]*
R-squared 0.35 0.23 0.35 0.23 VSL ($ millions) 8.80 5.24 6.52 2.28 Lost workday injury ($) 26,677 54,900
a. Number of observations = 50,673 for native U.S. regressions and 10,764 for immigrants regressions. Robust standard errors in parentheses; clustered standard errors in brackets, where clustering is by industry-immigrant status-age. *p<0.10, **p<0.05. Additional variables included in all wage regressions but coefficients not reported are: potential work experience, potential work experience squared, years of education, and indicator variables for sex, married, race, Hispanic ethnicity, full-time employment, paid hourly rate, union or employee association, government employer, occupation, metropolitan location, and region of the U.S. The final two columns also include a lost workday rate missing value indicator.

30
Table 6 Log Hourly Wage Regressions for Current Population Survey with Region of Origin
Interactionsa
(1) (2) (3) (4)
Fatality rate 0.0028 (0.0005)** [0.0023]
0.0025 (0.0005)** [0.0020]
0.0036 (0.0005)** [0.0021]
0.0034 (0.0005)** [0.0018]*
Africa × Fatality rate -0.0300 (0.0085)** [0.0046]**
Asia/Oceania × Fatality rate -0.0033 (0.0027) [0.0032]
Caribbean × Fatality rate -0.0012 (0.0033) [0.0041]
Mexico × Fatality rate -0.0038 (0.0011)** [0.0035]
-0.0038 (0.0011)** [0.0033]
-0.0044 (0.0010)** [0.0033]
-0.0040 (0.0009)** [0.0028]
Non-Mexico × Fatality rate -0.0015 (0.0012) [0.0025]
Other Central America × Fatality rate
-0.0024 (0.0024) [0.0034]
Europe × Fatality rate -0.0042 (0.0036) [0.0045]
Middle East × Fatality rate -0.0040 (0.0106) [0.0095]
North America × Fatality rate 0.0087 (0.0097) [0.0100]
South America × Fatality rate 0.0027 (0.0039) [0.0044]
Country not reported × Fatality rate
0.0012 (0.0056) [0.0066]
Lost workday rate 0.0101 (0.0031)** [0.0122]
0.0115 (0.0030)** [0.0110]

31
(Table 6 continued)
(1) (2) (3) (4) Lost workday rate ×
Immigrant 0.0070
(0.0069) [0.0146]
Lost workday rate × Mexico 0.0009 (0.0071) [0.0111]
R-squared 0.34 0.34 0.34 0.34 a. Number of Observations=61,437. Robust standard errors in parentheses; clustered standard errors in brackets, where clustering is by industry-immigrant status-age. *p<0.10, **p<0.05. Additional variables included in all wage regressions but coefficients not reported are: potential work experience, potential work experience squared, years of education, and indicator variables for sex, married, race, Hispanic ethnicity, immigrant, full-time employment, paid hourly rate, union or employee association, government employer, occupation, metropolitan location, region of the U.S., and a series of region of origin variables for Africa, Asia/Oceania, Caribbean, Mexico, Other Central America, Europe, Middle East, North America, South America, and Country not reported. Columns 1 and 2 also include a lost workday rate missing value indicator.

32
Table 7 Log Hourly Wage Regressions for New Immigrant Survey with Mexico Interactionsa
(1) (2) (3) (4) Fatality rate 0.0048
(0.0021)** [0.0023]**
0.0037 (0.0021)* [0.0020]*
0.0072 (0.0023)** [0.0023]**
0.0063 (0.0021)** [0.0019]**
Mexico × Fatality rate -0.0092
(0.0031)** [0.0042]**
-0.0095 (0.0036)** [0.0043]**
Lost workday rate 0.0279
(0.0127)** [0.0139]
0.0253 (0.0129)* [0.0133]*
Mexico × Lost workday rate 0.0036
(0.0173) [0.0185]
R-squared 0.37 0.37 0.37 0.37
a. Number of observations=1,951. Robust standard errors in parentheses; clustered standard errors in brackets, where clustering is by industry-immigrant status-age. *p<0.10, **p<0.05. Additional variables included in all wage regressions but coefficients not reported are: age, age squared, years of education before U.S., years of education in U.S., potential U.S. work experience, potential U.S. work experience squared, tenure with current employer, tenure with current employer squared, and indicator variables for sex, married, race, Hispanic ethnicity, region of origin, understands English very well or well, visa type, new arrival, full-time employment, paid hourly rate, union contract, government employer, occupation, region of the U.S., and time period. Columns 2 and 4 also include a lost workday rate missing value indicator.

33
Table 8 Log Hourly Wage Regressions for New Immigrant Survey with Language and Illegal Status
Interactionsa
Interaction Variable Understand
English Narrow
Prior Illegal Broad
Prior Illegal Fatality 0.0085
(0.0039)** [0.0039]**
0.0069 (0.0022)** [0.0021]**
0.0072 (0.0024)** [0.0022]**
Fatality × Interaction Variable -0.0022
(0.0040) [0.0044]
0.0014 (0.0061) [0.0061]
0.0014 (0.0053) [0.0054]
Fatality × Mexico -0.0168
(0.0043)** [0.0058]**
-0.0089 (0.0034)** [0.0030]**
-0.0110 (0.0034)** [0.0023]**
Fatality × Mexico ×
Interaction Variable
0.0120 (0.0059)** [0.0057]**
0.0069 (0.0073) [0.0072]
0.0028 (0.0062) [0.0062]
Interaction Variable 0.0860
(0.0244)** [0.0310]**
0.0786 (0.0333)** [0.0456]*
0.0327 (0.0352) [0.0475]
R-squared 0.37 0.38 0.37
a. Number of observations=1,951. Robust standard errors in parentheses; clustered standard errors in brackets, where clustering is by industry-immigrant status-age. *p<0.10, **p<0.05. Additional variables included in all wage regressions but coefficients not reported are: age, age squared, years of education before U.S., years of education in U.S., potential U.S. work experience, potential U.S. work experience squared, tenure with current employer, tenure with current employer squared, and indicators for sex, married, race, Hispanic ethnicity, region of origin, visa type, new arrival, full-time employment, paid hourly rate, union contract, government employer, occupation, region of the U.S., and time period. Columns 2 and 3 also include an indicator for understands English very well or well.

34
Figure 1 Market Offer Curves for Immigrants and Native U.S. Workers