Vanadium: Bright Future, Manageable Risks...contains vanadium, which – of course – can be...
22
Vanadium: Bright Future, Manageable Risks By Thomas J. McHugh Strategic Minerals Corporation Danbury, Connecticut; U.S.A. For presentation at Titanium 2008 sponsored by International Titanium Association; Las Vegas, Nevada, September 23, 2008 OVERVIEW It is a pleasure to address an industry that is a major consumer of vanadium and relies on this metal for strength and properties that are needed in aerospace and other critical applications. The vanadium industry, in fact, is quite fascinating. 10 years ago – in 1998 – I wrote a paper in which I characterized the vanadium industry as a “bright underachiever.” I chose that metaphor because the industry then reminded me of a young man or woman who has exceptional potential, but who doesn’t convert that potential into exceptional accomplishments. Very soon thereafter, from 1999 through 2004, the industry fell into the worst downturn in its history. A number of vanadium projects folded or were abandoned, while the remaining producers tightened their operations for the sake of survival. It was not a pleasant time to be in the business. I now believe that the industry has emerged to face a bright future. Demand for vanadium has been climbing steadily since late 2004, when it quickly overtook then‐depressed production levels. It has been climbing ever since. Today I will review the pattern of vanadium supply and demand in the recent past, and comment on certain events and conditions affecting the industry’s future. I’m indebted for much of this data to Robert M. Bunting, who has kindly updated many of the charts he presented to this audience last year. Relationship to Steel Industry If there is anything that can be said of the vanadium industry as a whole, it’s that the fortunes of vanadium and steel are tightly lashed together. Ten years ago, I would have said that 85 to 90 per cent of worldwide vanadium production finds its way into steel. Today (Figure 1), I would say that the number is definitely over 90 per cent and growing. The remainder is almost evenly divided between titanium alloys and dozens of applications in the chemicals industry. These percentages clearly change as more applications are discovered and commercialized – the metallurgical, chemical, and electrical properties of vanadium have not been fully exhausted by any means. Since steel strengthening is vanadium’s dominant application, it is appropriate to review the trend in worldwide steel production. In Figure 2 one can see the seeds of the vanadium industry downturn in the late 1990’s, when sluggish steel demand rendered recently added vanadium capacity uneconomic. But, beginning in 2002, steel production began growing dramatically, pulling vanadium demand along with it.
Transcript of Vanadium: Bright Future, Manageable Risks...contains vanadium, which – of course – can be...

Vanadium: Bright Future, Manageable Risks By Thomas J. McHugh
Strategic Minerals Corporation Danbury, Connecticut; U.S.A.
For presentation at Titanium 2008 sponsored by International Titanium Association; Las Vegas, Nevada, September 23, 2008
OVERVIEW
It is a pleasure to address an industry that is a major consumer of vanadium and relies on this metal for strength and properties that are needed in aerospace and other critical applications. The vanadium industry, in fact, is quite fascinating. 10 years ago – in 1998 – I wrote a paper in which I characterized the vanadium industry as a “bright underachiever.” I chose that metaphor because the industry then reminded me of a young man or woman who has exceptional potential, but who doesn’t convert that potential into exceptional accomplishments. Very soon thereafter, from 1999 through 2004, the industry fell into the worst downturn in its history. A number of vanadium projects folded or were abandoned, while the remaining producers tightened their operations for the sake of survival. It was not a pleasant time to be in the business.
I now believe that the industry has emerged to face a bright future. Demand for vanadium has been climbing steadily since late 2004, when it quickly overtook then‐depressed production levels. It has been climbing ever since.
Today I will review the pattern of vanadium supply and demand in the recent past, and comment on certain events and conditions affecting the industry’s future. I’m indebted for much of this data to Robert M. Bunting, who has kindly updated many of the charts he presented to this audience last year.
Relationship to Steel Industry
If there is anything that can be said of the vanadium industry as a whole, it’s that the fortunes of vanadium and steel are tightly lashed together. Ten years ago, I would have said that 85 to 90 per cent of worldwide vanadium production finds its way into steel. Today (Figure 1), I would say that the number is definitely over 90 per cent and growing. The remainder is almost evenly divided between titanium alloys and dozens of applications in the chemicals industry. These percentages clearly change as more applications are discovered and commercialized – the metallurgical, chemical, and electrical properties of vanadium have not been fully exhausted by any means.
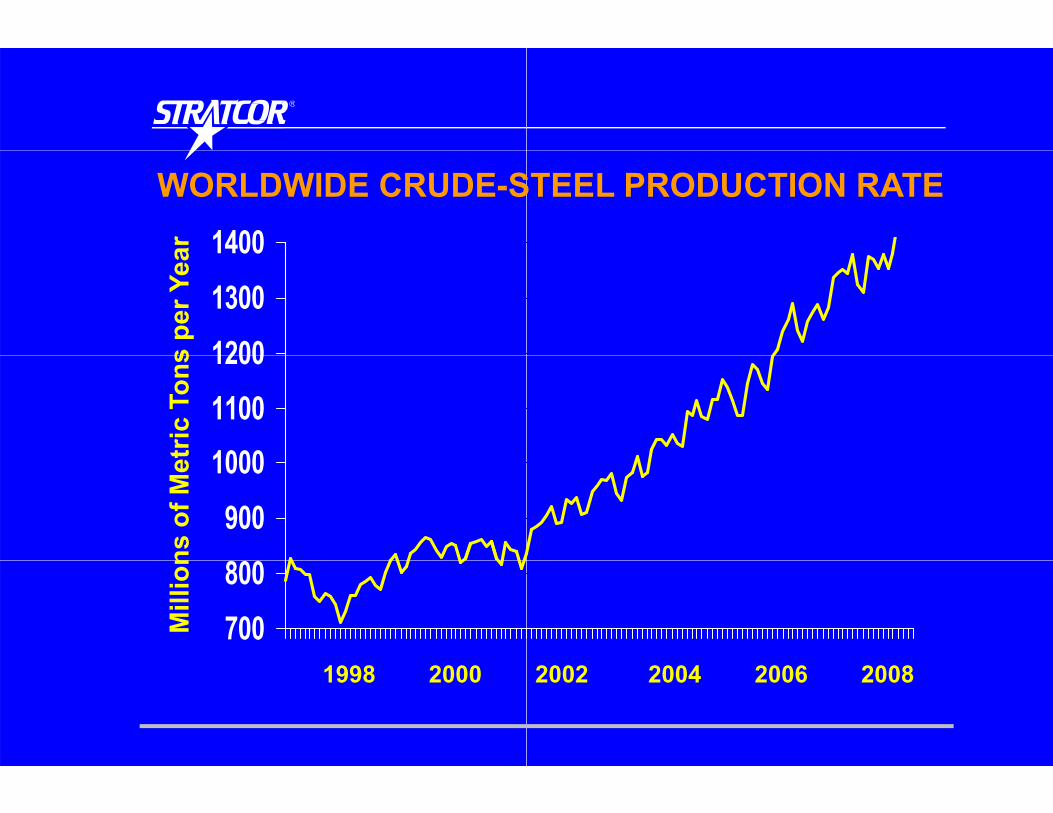
Since steel strengthening is vanadium’s dominant application, it is appropriate to review the trend in worldwide steel production. In Figure 2 one can see the seeds of the vanadium industry downturn in the late 1990’s, when sluggish steel demand rendered recently added vanadium capacity uneconomic. But, beginning in 2002, steel production began growing dramatically, pulling vanadium demand along with it.

Unequal Demand Geographically
However, the graph of total steel production masks an underlying reality in that most of the increase has been occurring in one region – China (Figure 3). While production in North America and Western Europe has been growing slowly, there are also signs that production in the former Soviet Union / Commonwealth of Independent States and other developing countries is accelerating. This is a natural consequence of continuing globalization and people seeking to improve their standards of living everywhere in the world.
In this context, Figure 4 is not at all surprising. Furthermore, consumers in developing countries are using more high strength steels and higher quality specialty steels, which use more vanadium than conventional, garden‐variety steels. This results in vanadium growth rates that are higher than the overall steel growth rate. In fact, today, vanadium consumption exceeds of 230 million pounds annually.
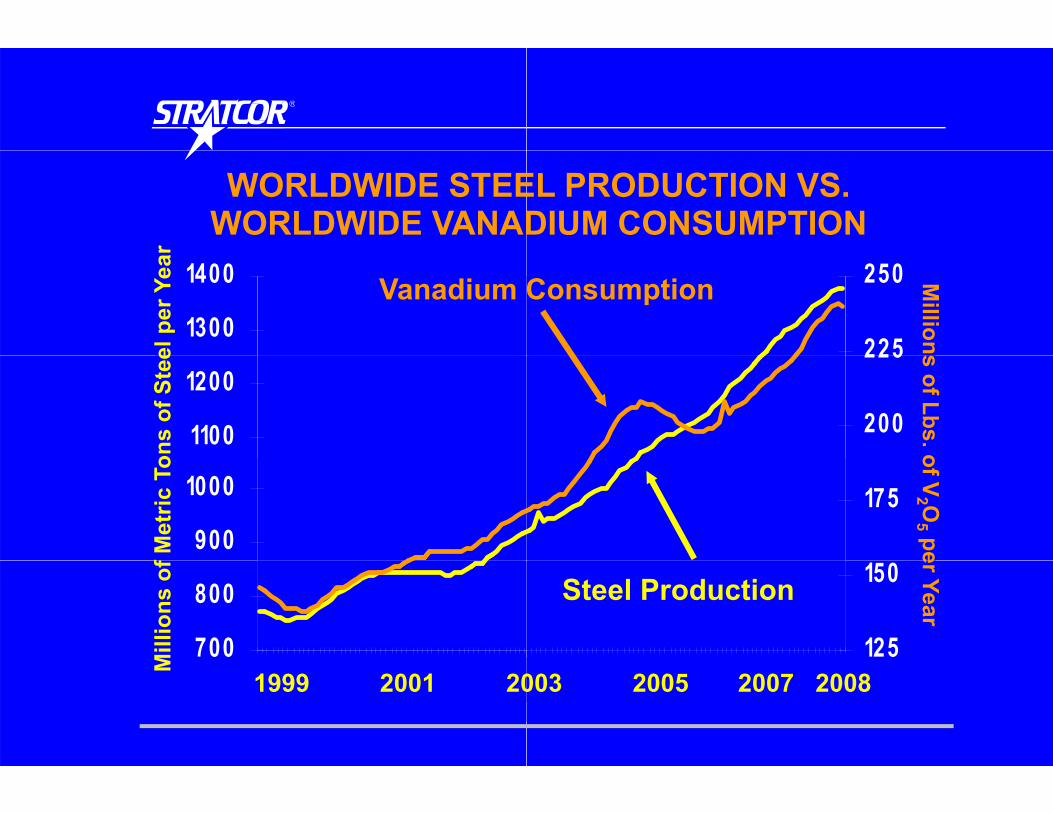
Figure 5 illustrates how inextricably the fortunes of vanadium are tied to steel. In this 12‐month moving average of vanadium consumption and steel production, you can see clearly how they track together. An interesting anomaly is seen in 2005, where vanadium consumption dropped sharply while steel production continued to rise. The reason for this will become apparent later.
Vanadium Supply and Demand
Next, I turn to the issue of supply and demand of vanadium (Figure 6). For a variety of reasons, between 1999 and 2003, much more vanadium was being produced than was required by the market. One reason was that the vanadium industry had enjoyed boom times in the few years prior to 1999, but it was slow to respond to a number of important external developments. First, worldwide steel production had turned down as the effects of a significant downturn in Asian economies rippled through the world economy. At the same time a major steelmaker changed its steelmaking practice in a manner that made more vanadium‐bearing slag available to the market. Finally, new greenfield capacity in Australia came on‐line at a time when demand was relatively weak. The net effect was significant overproduction, resulting in a large buildup of inventories and very difficult times for the vanadium industry.
Production was eventually cut back, but at a time when underlying demand had begun to grow. This increase of vanadium demand was partially masked by the large excess inventory – over 50 million pounds by some estimates. Once that inventory became depleted the supply‐demand environment quickly inverted, requiring increased production of vanadium to meet demand. For the past two years, supply and demand have been approximately in balance.
Figure 7 illustrates the supply/demand balance for the last complete year, showing major regions of production and consumption. This year, China has overtaken South Africa as the world’s largest vanadium‐producing country. Although vanadium consumption in China is also increasing, China still lags behind Western Europe and North America. The implications of this will become clearer later.

Vanadium Sources
Vanadium is a common and widely dispersed element. (Figure 8) Accordingly, the “primary” source of vanadium, accounting for well over two‐thirds of production, is the so‐called “secondary” supply: steel slags, spent catalysts, petroleum ashes and residues. It also occurs as a by‐product or co‐product of the production of other metals such as uranium. The largest source of vanadium, by far, is from slag generated during the production of steel, mainly in South Africa, Russia, and China. Vanadium is mined for its own sake, but only in areas where its concentration in the ore is high enough to extract economically. Although vanadium mining capacity has fallen in recent years, the shortfall has been more than compensated by large increases from steel slag and oil residues. The supply from uranium sources has been somewhat underutilized, but that is likely to change, as the demand outlook for both uranium and vanadium is bright.
Growth in China
Since China has led the world in increased steel production, it is not surprising that most new vanadium production has also come from China. Figure 9 shows how vanadium production in China began expanding rapidly, just as steel production began to soar at the beginning of this decade. Much of this new vanadium production began life as vanadium‐bearing iron ore. Slags from steelmaking using this ore contain 10% to 25% vanadium, which is much larger than the concentration in vanadium ore. This, plus the fact that the vanadium is already out of the ground, tends to make steelmaking slag the lowest‐cost vanadium source.
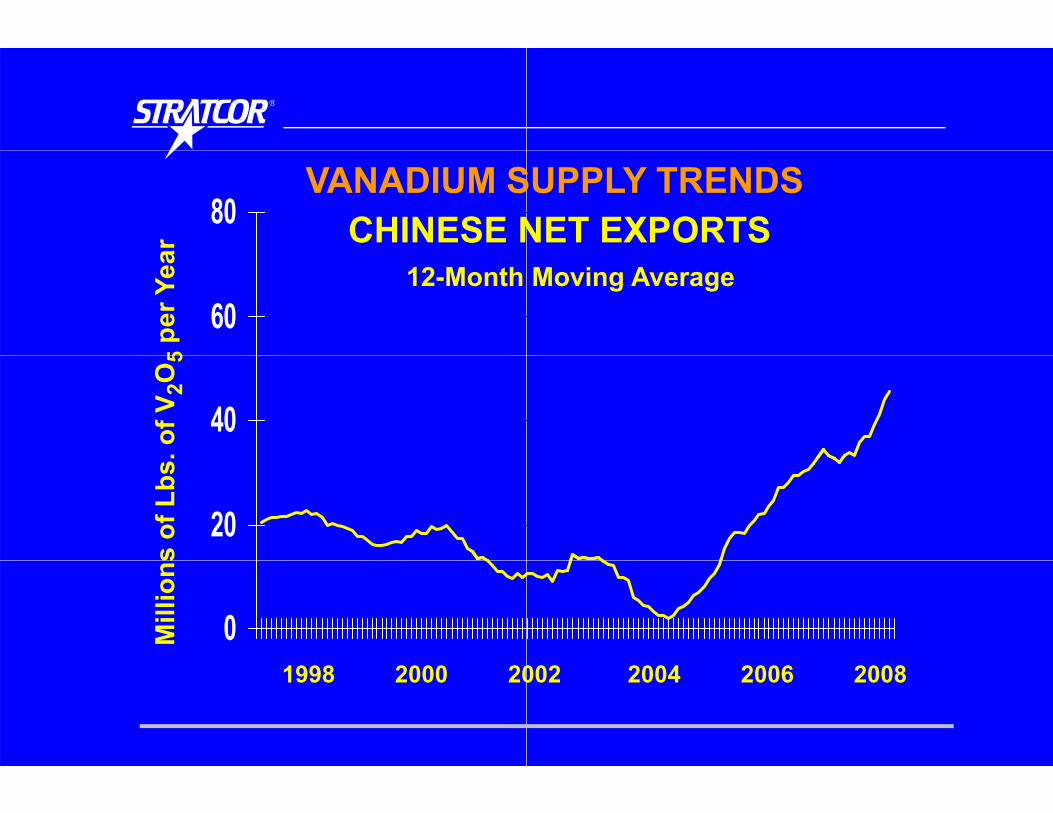
Initially, most of the vanadium from increased steelmaking in China was also consumed in China, reducing China’s net exports of vanadium to zero in 2004 (Figure 10). But the increase of vanadium supply was so rapid that it outstripped the increase in vanadium demand, resulting in China becoming a major net exporter of vanadium.
Another reason for the large increase in vanadium exports from China is that China has increased imports of ferroniobium substantially since 2005 (Figure 11). These imports have displaced some of the vanadium used by the Chinese to strengthen steel. This substitution is not feasible in all types of high‐strength steel and it can have some technical disadvantages, but a significant spike in vanadium prices in 2005 led to a search for alternatives.
Slowdown in South Africa
While the Chinese supply of vanadium has been growing, the supply of vanadium from South Africa has been dropping since 2005, as shown in Figure 12. That trend accelerated early in 2008 when South Africa announced power cutbacks during its peak summer season. In fact, one company declared force majeure – an announcement that panicked the market and affected pricing. Most South African metals companies have since adjusted to the peak power cutbacks demanded by Eskom, the South African electrical supplier. But the power shortage remains and could affect future supplies from this minerals‐rich country.

Russia: A Continued Presence
As shown in Figure 13, Russia has been a major world supplier of vanadium, especially in the last three years and will continue to be a major player in the future. A substantial amount of Russian iron ore contains vanadium, which – of course – can be recovered for use as a steel strengthener.
Usage Per Ton of Steel
Figure 14 illustrates one reason why I believe the vanadium industry has a bright future. It shows that the developed economies of the world are using vanadium to strengthen steel, while the developing parts of the world have far to go to realize its full potential. As they do, vanadium demand should accelerate. In fact, if China’s use of vanadium per ton of steel matched that of the United States, vanadium demand would increase by 76.5 million pounds of vanadium pentoxide per year.
Summary
I recognize that I have spoken a great deal about the use of vanadium in steel and how it affects the vanadium market. As producers of titanium, you undoubtedly want to know how all this affects you and your needs. The vanadium industry recognizes the titanium industry’s need for extremely high‐quality products for critical applications. These quality needs are significantly higher than those of steel producers. For the foreseeable future, the vanadium industry has the capacity to meet these needs. But as those needs grow, the vanadium industry will expand to meet those needs.
Another important conclusion that benefits the titanium industry is the bright financial health of the vanadium industry currently. This allows the industry to make capacity and equipment additions that will meet the titanium‐industry’s long‐term product and quality needs. It also allows the industry to provide technical support to titanium customers as needed.
The one possible area of concern might be sourcing – in other words, where will the vanadium come from that can be used in the high‐quality alloys needed by the titanium industry? With supply and demand growing strongly, the risk of supply disruptions is always present. But that risk can be managed. As vanadium requirements by the steel industry continues to grow, vanadium producers have become financially healthier and able to develop new sources, particularly from slags and residues that are lowest in cost. These additional sources will help the industry have the raw materials needed to produce alloys for the titanium industry.
Finally, in previous talks, we have called for strengthening long‐term relationships between vanadium producers and the titanium industry. This increased communication, planning, cooperation, and transparency will create the greatest value, to our greatest mutual benefit.

VanadBright F
ManageabManageab
INTERNATIONAL TITANIUM ASSOANNUAL CONFERENCELAS VEGAS NEVADALAS VEGAS, NEVADASEPTEMBER 23, 2008
diumFuture,ble Risksble Risks
OCIATION

USES OF V
• Steelmaking
• Chemical and
Steelmaking
• Chemical and
Tit i 3%• Titanium - 3%
VANADIUM
- 93%
d Catalyst 4%
- 93%
d Catalyst - 4%
%%
WORLDWIDE CRUDE-S1400ar
120013001400
s pe
r Yea
100011001200
tric
Ton
s
9001000
ns o
f Me
700800
Mill
ion
1998 2000
STEEL PRODUCTION RATE
2002 2004 2006 2008

CRUDE-STEEL PRODU600r
500
600
per Y
ea
300
400
tric
Ton
s
200
ns o
f Met
0
100
Mill
ion
1998 2000
UCTION RATE BY REGION
China
Other Asia
FSU
North AmericaWestern Europe
2002 2004 2006 2008

WORLDWIDE VANADI250ar
230
5pe
r Yea
190
210
s. o
f V2O
150
170
ns o
f Lbs
130
150
Mill
ion
1998 2000
UM-CONSUMPTION RATE
2002 2004 2006 2008
rWORLDWIDE STEE
WORLDWIDE VANAD
1300
1400
el p
er Y
ea Vanadium
1100
1200
ons
of S
tee
900
1000
f Met
ric T
o
700
800
Mill
ions
of
1 2 3 4 5 6 7 8 9 1 01 1 1 21 31 41 51 6 1 71 81 9 2 02 1 2 22 32 42 5 2 62 72 82 9 3 03 13 23 33 4 3 53 63 73 83 9 4 04 14 24 3 4 44 54 64 74 8 4 9 5 05 15 2 5M
1999 2001 20
EL PRODUCTION VS. DIUM CONSUMPTION
225
250 Millions
Consumption
200
225 s of Lbs. o
175
of V2 O
5 pe
125
150
er Year
Steel Production
35 45 55 65 7 5 85 9 6 06 16 2 6 36 46 56 6 6 76 86 9 7 07 1 7 27 37 47 5 7 67 77 87 9 8 08 18 28 38 4 8 58 68 78 88 9 9 09 19 29 3 9 49 59 69 79 8 9 91 0 01 0 11 0 21 0 31 0 41 0 51 0 61 0 71 0 81 0 91 1 01 1 11 1 21 1 31 1 4
003 2005 2007 2008

WORLDWIDE PRODUCT
250ar
12-Month Moving
230
250
5pe
r Yea
190
210
. of V
2O5
Production
170
s of
Lbs
.
130
150
Mill
ions
1999 2001 20
TION VS. CONSUMPTION Average -- Annual Rates
n
ConsumptionConsumption
003 2005 2007 2008

PRODUCTION AND CON
240 234 2007
200
240
V 2O
5
22 All Oth26 FSU / C
N th
120
160
Lbs.
of V
50
46 NorthAmeric
Wester
80
llion
s of
50
China
Europe
45
0
40
C ti
Mi
45 Other A
Consumption
NSUMPTION IN BALANCE2337
All OthersU.S.A.
1522
ers
CISh
China80h ca
rn Russia41e
P d ti
South Africa75Asia
Production

VANADIUM CAPA180
150
180
V 2O
5 93%
90
120
Lbs.
of V
60
90
llion
s of
87%
0
30
Steel Vanadium
Mi
Steel Vanadium Slag Ore R
ACITY UTILIZATION
Capacity2007 Production
Capacity UtilizationCapacity Utilization
69%74%
Oil Spent Uranium
74%0%
Oil Spent UraniumResidues Catalysts By-Products

VANADIUM SCHINESE P80ar
60
80
5pe
r Yea 12-Month M
40
60
. of V
2O5
20s of
Lbs
.
0Mill
ions
1999 2001
SUPPLY TRENDSPRODUCTIONMoving Average
2003 2005 2007 2008
VANADIUM SCHINESE N80
ar
60
5pe
r Yea 12-Month
40
. of V
2O5
20
s of
Lbs
.
0Mill
ions
1998 2000 20
SUPPLY TRENDSNET EXPORTSMoving Average
002 2004 2006 2008

70CHINESE FERRO
Year
50
60
Nb
per Y
30
40
50
bs. o
f FeN
20
30
ons
of L
b
0
10
Mill
io
2002 2003 2004
ONIOBIUM IMPORTS
4 2005 2006 2007 2008

WORLDWIDE VANADI250ar
230
5pe
r Yea
190
210
s. o
f V2O
150
170
ns o
f Lbs
130
150
Mill
ion
1998 2000
UM-CONSUMPTION RATE
2002 2004 2006 2008

arVANADIUM
SOU
100
120
5pe
r Yea
12-MontMoving Ave
60
80
. of V
2O5 Moving Ave
20
40
60
s of
Lbs
.
0
20
Mill
ions
1998 2000 20
SUPPLY TRENDSTH AFRICA
therageerage
002 2004 2006 2008

VANADIUM SRUSSIAN N60
ear RUSSIAN N
40O5
per Y
e
12-Month
40
s. o
f V2O
20
ns o
f Lbs
0Mill
io
1998 2000 20
SUPPLY TRENDSNET EXPORTSNET EXPORTSMoving Average
002 2004 2006 2008

VANADIUM USAGE20
0 070.080.09
STEE
L North Am
W
0 050.060.07
MT
OF
S W
0.030.040.05
V P
ER
0.010.02K
g
0
E PER MT OF STEEL007
merica
Western EuropeWestern Europe
FSU / CIS
76.5 Million Lbs. V2O5
China

SUM
● The Vanadium Industr● The Vanadium IndustrAll Customer Need
● The Vanadium Industr● The Vanadium IndustrMeet the TitaniumProduct and Quali
● The Vanadium IndustNew Sources of FG i CGrowing Custome
MARY
ry Will Expand to Meetry Will Expand to Meet ds, Including Titanium
ry Is Committed tory Is Committed to Industry’s Long-Termity Needs
ry Will Be Developing Feedstocks to Meet
N der Needs

SUM
● The Vanadium and Tit● The Vanadium and Titto Strengthen Lonwith Increased:
● Communi● Plannin
● Coop● T
. . . Providing Greatest Va
MARY
anium Industries Needanium Industries Need ng-Term Relationships,
cationngperation
Transparency
alue and Benefit to Both!