Valuing Victorias Parks -...
132
Valuing Victoria’s Parks Accounting for ecosystems and valuing their benefits: Report of first phase findings
Transcript of Valuing Victorias Parks -...

Valuing Victoria’s Parks
Accounting for ecosystems and valuing their benefits:
Report of first phase findings

Project Sponsors
Bill Jackson (PV)
Paul Smith (DELWP)
Report prepared by:
Tony Varcoe (PV)
Helen Betts O’Shea (DELWP)
Dr Zaida Contreras (DELWP)
Working Group
Tony Varcoe (Project Manager, PV)
Mark Eigenraam (DELWP)
Helen Betts O’Shea (DELWP)
Dr Zaida Contreras (DELWP)
Peter Egan (PV)
Project Control Group
David Nugent (Chair, PV)
Peter Brennan (PV)
Brian Doolan (PV)
Vivienne Clare (DELWP)
Will Guthrie (DELWP)
Ian Campbell-Fraser (DELWP)
Acknowledgements
This project was a collaboration between Parks Victoria (PV) and the Department of Environment,
Land, Water and Planning (DELWP) (formerly the Department of Environment and Primary
Industries, DEPI).
Thanks to the following people who contributed to the project: Tamara Boyd, Alysia Brandenberg,
Dale Appleton, Steve Shelley and Peter Egan (from Parks Victoria) and Freya McCormick, Pearl Tan,
Gordon Forbes, Charlie Showers, Jaymie Norris, David Parkes and Gordan Ivancic (from DELWP).
Thanks also to Carl Obst, Josh Bishop, David Cochrane and Michael Vardon for their advice. We are
grateful to Carl Obst, Drew Collins and Neil Byron for their review of an earlier version of this report.

Valuing Victoria’s Parks
Table of Contents
Summary and key findings ...................................................................................................................................... v
Glossary .................................................................................................................................................................. x
1. Introduction and context .................................................................................................................................... 1
1.1 The Victorian parks network ........................................................................................................................ 1
1.2 The purpose, value and benefits of Victoria’s parks .................................................................................... 2
1.3 Natural capital and ecosystem services ....................................................................................................... 4
1.4 Classification of ecosystem services ............................................................................................................. 6
1.5 About this study ........................................................................................................................................... 8
1.5.1 Purpose of this work ............................................................................................................................. 8
1.5.2 Study approach ..................................................................................................................................... 9
1.5.3 How will this report be used? ............................................................................................................... 9
1.5.4 Caveats on the report ......................................................................................................................... 10
2. Review of environmental accounting and valuation frameworks .................................................................... 11
2.1 Ecosystem accounting frameworks ............................................................................................................ 12
2.1.1 System of Environmental-Economic Accounting ................................................................................ 12
2.1.2 SEEA Experimental Ecosystem Accounting ......................................................................................... 12
2.1.3 The Victorian experience in ecosystem accounting ............................................................................ 14
2.2 Valuation of ecosystem services ................................................................................................................ 15
2.2.1 Environmental valuation concepts ..................................................................................................... 17
2.2.2 Economic valuation methods .............................................................................................................. 19
2.2.3 The Economics of Ecosystems and Biodiversity .................................................................................. 21
2.3 Synthesis of relevant valuation and accounting frameworks .................................................................... 22
3. Application of ecosystem accounting and valuation frameworks to Victorian parks ...................................... 25
3.1 Park management framework in Victoria .................................................................................................. 25
3.2 Use of ecosystem accounting and valuation for park management .......................................................... 26
3.2.1 Accounting for parks’ natural assets ................................................................................................... 26
3.2.2 Accounting for ecosystem services provided by Victoria’s parks ....................................................... 26
3.2.3 Valuing benefits from parks ecosystem services ................................................................................ 29
4. Ecosystem asset and service flow accounts ..................................................................................................... 31
4.1 Methodology to construct pilot ecosystem accounts ................................................................................ 31
4.2 Ecosystem Accounting Units ...................................................................................................................... 32
4.3 Ecosystem asset accounts .......................................................................................................................... 32
4.3.1 Environmental metrics used ............................................................................................................... 32
4.3.2 Overview of parks ecosystem assets and their condition ................................................................... 33
4.4 Built asset accounts .................................................................................................................................... 37

4.5 Cultural assets accounts ............................................................................................................................. 38
4.6 Ecosystem service flow account ................................................................................................................. 40
4.7 Case study: Ecosystem assets and services in the Mallee parks ................................................................ 43
4.8 Case study: Ecosystem assets and services in the Alpine National Park .................................................... 46
5. Valuation of ecosystem service benefits from Victoria’s parks ........................................................................ 49
5.1 Purpose of valuation .................................................................................................................................. 49
5.2 Methodology to value benefits from ecosystem services.......................................................................... 49
5.3 Ecosystem service benefits from Victoria’s parks ...................................................................................... 56
6. Summary of findings and further work ............................................................................................................. 59
6.1 Application for Parks Victoria ..................................................................................................................... 59
6.2 Learnings and further work ........................................................................................................................ 60
6.3 Implications of climate change ................................................................................................................... 63
6.4 Data requirements to assess return on investment ................................................................................... 63
Appendix 1: Types of parks in the Victorian parks network ................................................................................. 66
Appendix 2: Assessment of selected ecosystem services in parks ....................................................................... 67
A2.1 Provisioning services from parks.............................................................................................................. 67
(i) Provision of clean water............................................................................................................................... 67
(ii) Honey production ....................................................................................................................................... 72
A2.2 Regulating services from parks ................................................................................................................ 75
(i) Water purification and filtration services .................................................................................................... 75
(ii) Flood and stormwater regulation services ................................................................................................. 79
(iii) Climate regulation services ........................................................................................................................ 81
(iv) Pollination and seed dispersal .................................................................................................................... 89
(v) Coastal asset protection .............................................................................................................................. 91
(vi) Maintenance of nursery habitats ............................................................................................................... 94
(vii) Maintenance of habitats for species ......................................................................................................... 97
(viii) Other regulating services for further assessment .................................................................................. 100
(a) Pest and disease control services.......................................................................................................... 100
(b) Local climate regulation ....................................................................................................................... 101
(c) Air quality regulation ............................................................................................................................ 102
A2.3 Cultural services from parks................................................................................................................... 103
(i) Recreation services: enjoyment, tourism and health benefits .................................................................. 103
(ii) Landscape and neighbourhood amenity ................................................................................................... 112
(iii) Social cohesion and sense of place .......................................................................................................... 115
(iv) Opportunities for scientific research and education................................................................................ 117
(v) Historic place conservation ....................................................................................................................... 119
Appendix 3: Local ports in Victoria’s parks network .......................................................................................... 121
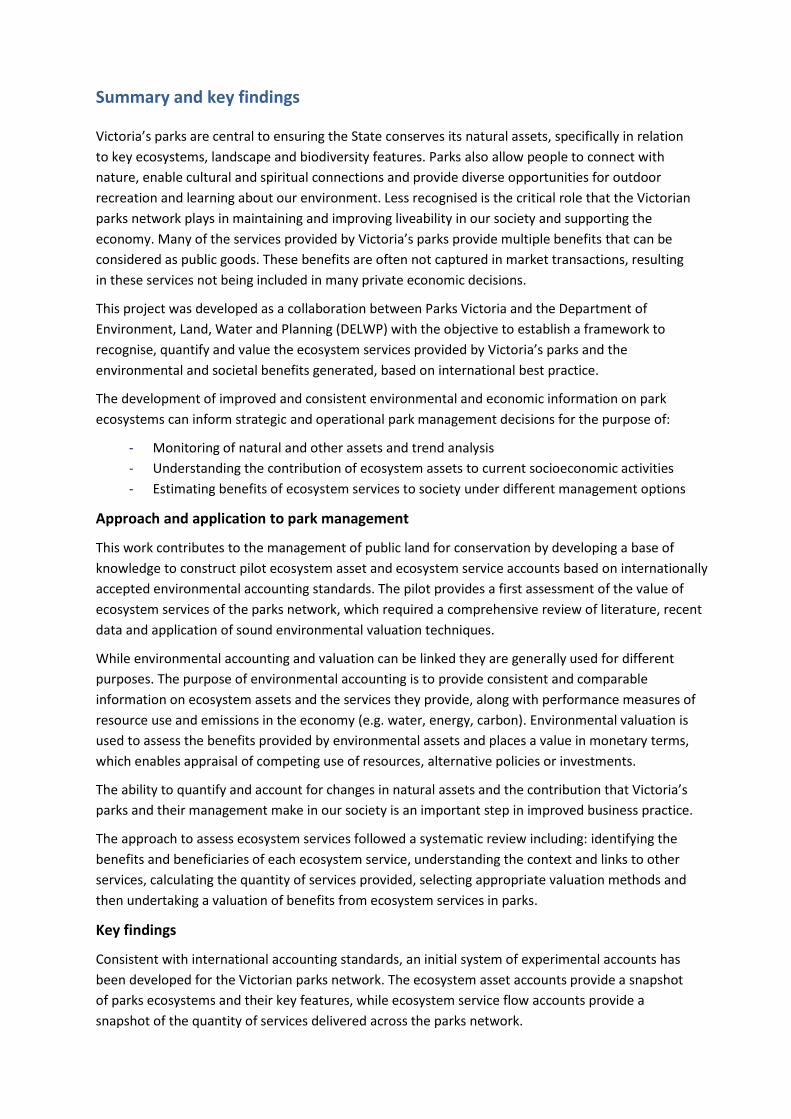
Summary and key findings
Victoria’s parks are central to ensuring the State conserves its natural assets, specifically in relation
to key ecosystems, landscape and biodiversity features. Parks also allow people to connect with
nature, enable cultural and spiritual connections and provide diverse opportunities for outdoor
recreation and learning about our environment. Less recognised is the critical role that the Victorian
parks network plays in maintaining and improving liveability in our society and supporting the
economy. Many of the services provided by Victoria’s parks provide multiple benefits that can be
considered as public goods. These benefits are often not captured in market transactions, resulting
in these services not being included in many private economic decisions.
This project was developed as a collaboration between Parks Victoria and the Department of
Environment, Land, Water and Planning (DELWP) with the objective to establish a framework to
recognise, quantify and value the ecosystem services provided by Victoria’s parks and the
environmental and societal benefits generated, based on international best practice.
The development of improved and consistent environmental and economic information on park
ecosystems can inform strategic and operational park management decisions for the purpose of:
- Monitoring of natural and other assets and trend analysis
- Understanding the contribution of ecosystem assets to current socioeconomic activities
- Estimating benefits of ecosystem services to society under different management options
Approach and application to park management
This work contributes to the management of public land for conservation by developing a base of
knowledge to construct pilot ecosystem asset and ecosystem service accounts based on internationally
accepted environmental accounting standards. The pilot provides a first assessment of the value of
ecosystem services of the parks network, which required a comprehensive review of literature, recent
data and application of sound environmental valuation techniques.
While environmental accounting and valuation can be linked they are generally used for different
purposes. The purpose of environmental accounting is to provide consistent and comparable
information on ecosystem assets and the services they provide, along with performance measures of
resource use and emissions in the economy (e.g. water, energy, carbon). Environmental valuation is
used to assess the benefits provided by environmental assets and places a value in monetary terms,
which enables appraisal of competing use of resources, alternative policies or investments.
The ability to quantify and account for changes in natural assets and the contribution that Victoria’s
parks and their management make in our society is an important step in improved business practice.
The approach to assess ecosystem services followed a systematic review including: identifying the
benefits and beneficiaries of each ecosystem service, understanding the context and links to other
services, calculating the quantity of services provided, selecting appropriate valuation methods and
then undertaking a valuation of benefits from ecosystem services in parks.
Key findings
Consistent with international accounting standards, an initial system of experimental accounts has
been developed for the Victorian parks network. The ecosystem asset accounts provide a snapshot
of parks ecosystems and their key features, while ecosystem service flow accounts provide a
snapshot of the quantity of services delivered across the parks network.

Status of Victoria’s park ecosystems
Parks Victoria manages over 3.7 million hectares of protected areas and almost 206,000 hectares of
non-protected areas. Victoria’s parks protect ecosystem assets of high significance for the State and
internationally. Specifically, national, State and wilderness parks present large areas of native
vegetation, accounting for 38% of all native vegetation in the State. In addition, the parks network as a
whole accounts for 60% of wetland areas of international significance in the State. Based on modelled
data on vegetation quality, native vegetation in parks is found in better condition than outside park
areas across all ecological vegetation classes.
Although specific data for marine and river assets in parks is more limited, the accounts suggest their
condition is relatively good. The parks network supports Marine Protected Areas with significant
habitats, such as sub-tidal and intertidal reefs, mangroves, seagrass and marine soft-sediment.
In terms of biodiversity, Victoria’s parks provide highly suitable habitats for many native species. An
assessment of around 640 of the nearly 3,000 parks and reserves indicates that Victoria’s parks
provide 888 threatened species with at least 50% of suitable habitat in the State.
Ecosystem services delivered by park ecosystems
The contribution of Victoria’s park ecosystems was assessed for three types of ecosystem services:
Delivery of natural resource products used in economic activities (provisioning services), such as
clean water and honey. Importantly, over one million hectares of water supply catchments are
located within Victoria’s parks. The annual run-off from nine high water yielding parks is 3,400
gigalitres (16% of the State total). This water is particularly significant for the communities of
eastern Victoria (Alpine, Lake Eildon National Parks), western Victoria (Grampians National Park)
and Greater Melbourne (Yarra Ranges National Park). Beehives in parks and reserves are
estimated to produce about 1,200 to 1,600 tonnes of honey products per annum.
Sustaining public benefits from natural regulating processes (regulating services), such as water
purification, air filtration, climate regulation, pollination, coastal protection, along with
maintenance of habitats for native species, nursery populations and genetic diversity. Victoria’s
parks offer most suitable habitats in the State to 888 rare or threatened species in Victoria. The
Victorian parks network is a major carbon sink with 270 million tonnes of carbon stored across
land and coastal habitats. Parks provide valuable water filtration services with current sediment
loads of 4,165 tonnes of solids (from nine high yielding parks) entering regulated rivers, which is
about 8% of what would be released if these parks were not protected.
Conserving intrinsic non-material ecosystem features that people appreciate (cultural services)
such as recreation, amenity, cultural heritage connection and health. Parks receive 30-51 million
visits every year, with almost 17 million visitor nights being from tourists. Of this, around 23
million visits to parks from Victorians involve physical activity which can provide health benefits.
Other types of assets in Victoria’s parks include over 28,000 built assets which are largely
infrastructure to support visitor access, recreational and education activities. In addition, the parks
network protects over 11,800 cultural objects in aboriginal cultural places, along with 145 historical
places listed in the State heritage register.
Current market values associated with park ecosystems
The economic contribution of park-attributable tourism to the Victorian economy is conservatively
estimated at around $1 billion Gross Value Added (GVA) and 14,000 jobs. The park-based apiary
sector produces honey and related products worth $3.4-$4.6 million per annum and receives
payments to beekeepers for pollination services in the range of $0.6-$1 million per annum.
In addition to managing parks, Parks Victoria manages built infrastructure and recreational activities
for the Port Phillip, Western Port and Port Campbell local ports. Parks Victoria visitation data
indicate these local ports and bays receive 45 million visits every year. Through the management of
these local ports, Parks Victoria plays a significant role in the contribution these three ports make to
the State economy, estimated at over $300 million GVA per annum in total.
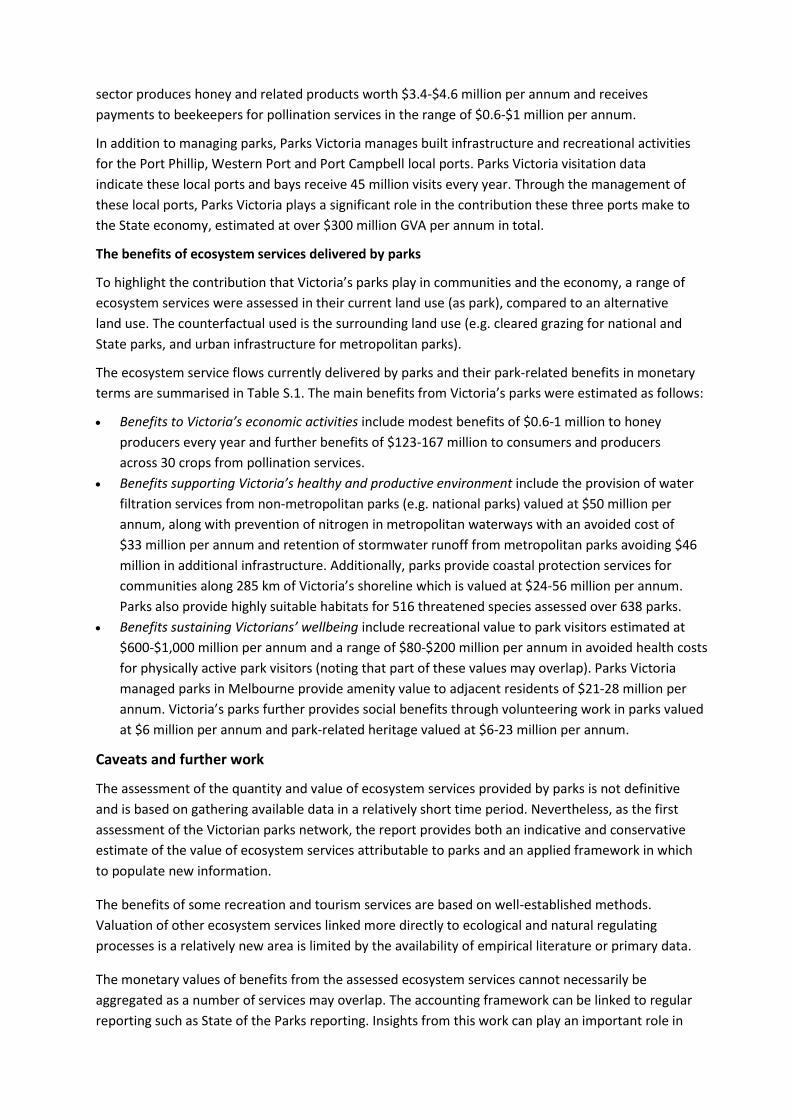
The benefits of ecosystem services delivered by parks
To highlight the contribution that Victoria’s parks play in communities and the economy, a range of
ecosystem services were assessed in their current land use (as park), compared to an alternative
land use. The counterfactual used is the surrounding land use (e.g. cleared grazing for national and
State parks, and urban infrastructure for metropolitan parks).
The ecosystem service flows currently delivered by parks and their park-related benefits in monetary
terms are summarised in Table S.1. The main benefits from Victoria’s parks were estimated as follows:
Benefits to Victoria’s economic activities include modest benefits of $0.6-1 million to honey
producers every year and further benefits of $123-167 million to consumers and producers
across 30 crops from pollination services.
Benefits supporting Victoria’s healthy and productive environment include the provision of water
filtration services from non-metropolitan parks (e.g. national parks) valued at $50 million per
annum, along with prevention of nitrogen in metropolitan waterways with an avoided cost of
$33 million per annum and retention of stormwater runoff from metropolitan parks avoiding $46
million in additional infrastructure. Additionally, parks provide coastal protection services for
communities along 285 km of Victoria’s shoreline which is valued at $24-56 million per annum.
Parks also provide highly suitable habitats for 516 threatened species assessed over 638 parks.
Benefits sustaining Victorians’ wellbeing include recreational value to park visitors estimated at
$600-$1,000 million per annum and a range of $80-$200 million per annum in avoided health costs
for physically active park visitors (noting that part of these values may overlap). Parks Victoria
managed parks in Melbourne provide amenity value to adjacent residents of $21-28 million per
annum. Victoria’s parks further provides social benefits through volunteering work in parks valued
at $6 million per annum and park-related heritage valued at $6-23 million per annum.
Caveats and further work
The assessment of the quantity and value of ecosystem services provided by parks is not definitive
and is based on gathering available data in a relatively short time period. Nevertheless, as the first
assessment of the Victorian parks network, the report provides both an indicative and conservative
estimate of the value of ecosystem services attributable to parks and an applied framework in which
to populate new information.
The benefits of some recreation and tourism services are based on well-established methods.
Valuation of other ecosystem services linked more directly to ecological and natural regulating
processes is a relatively new area is limited by the availability of empirical literature or primary data.
The monetary values of benefits from the assessed ecosystem services cannot necessarily be
aggregated as a number of services may overlap. The accounting framework can be linked to regular
reporting such as State of the Parks reporting. Insights from this work can play an important role in

informing the community about the connection between having healthy, resilient parks and the
State’s economy and community wellbeing.
The proposed approach can support park and public land planning, investment, management and
evaluation decisions for parks as well as inform policy and supporting funding models to maintain
parks’ natural capital, while maximising their value to the society.
Adapting this work to inform decision-making for land management will require further work
including greater focus on assessment of marginal values for ecosystem services from different
management options and more thorough assessment of the broader costs and benefits of these
alternatives. Additionally, conceptual models linking changes in the condition of ecosystems to
service flows will be required to undertake broader applications on program evaluation.
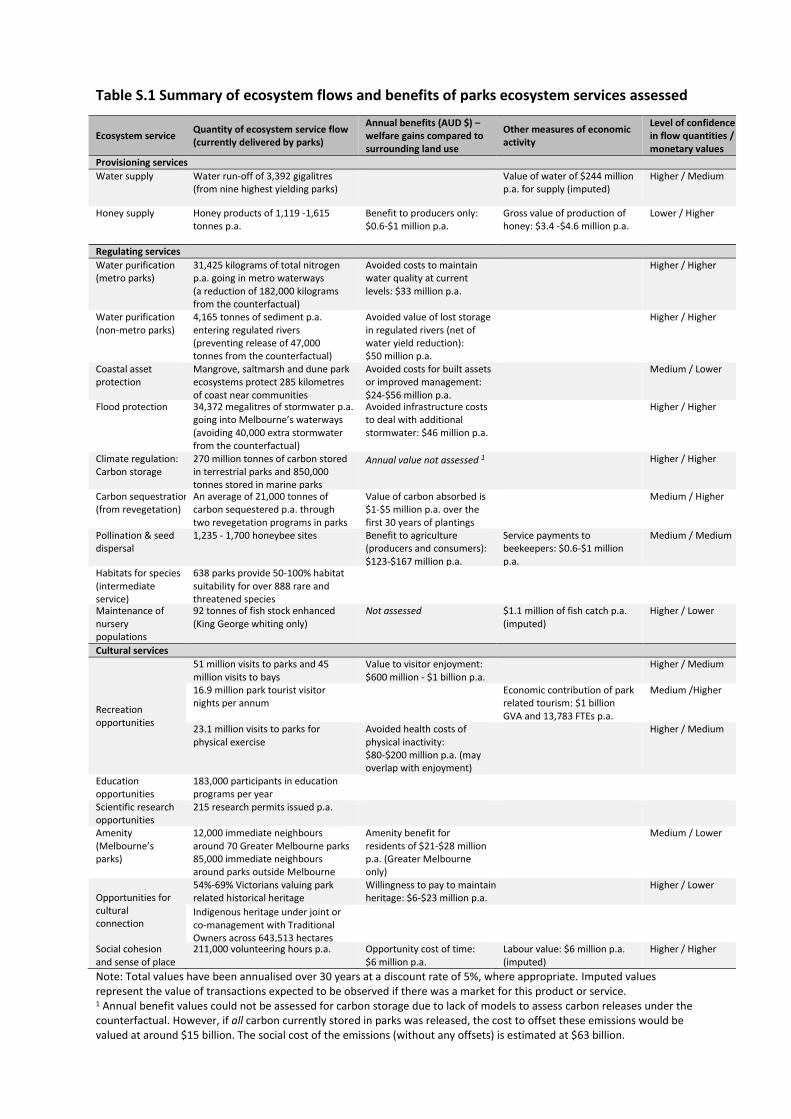
Table S.1 Summary of ecosystem flows and benefits of parks ecosystem services assessed
Ecosystem service Quantity of ecosystem service flow (currently delivered by parks)
Annual benefits (AUD $) – welfare gains compared to surrounding land use
Other measures of economic activity
Level of confidence in flow quantities / monetary values
Provisioning services
Water supply Water run-off of 3,392 gigalitres (from nine highest yielding parks)
Value of water of $244 million p.a. for supply (imputed)
Higher / Medium
Honey supply Honey products of 1,119 -1,615 tonnes p.a.
Benefit to producers only: $0.6-$1 million p.a.
Gross value of production of honey: $3.4 -$4.6 million p.a.
Lower / Higher
Regulating services
Water purification (metro parks)
31,425 kilograms of total nitrogen p.a. going in metro waterways (a reduction of 182,000 kilograms from the counterfactual)
Avoided costs to maintain water quality at current levels: $33 million p.a.
Higher / Higher
Water purification (non-metro parks)
4,165 tonnes of sediment p.a. entering regulated rivers (preventing release of 47,000 tonnes from the counterfactual)
Avoided value of lost storage in regulated rivers (net of water yield reduction): $50 million p.a.
Higher / Higher
Coastal asset protection
Mangrove, saltmarsh and dune park ecosystems protect 285 kilometres of coast near communities
Avoided costs for built assets or improved management: $24-$56 million p.a.
Medium / Lower
Flood protection 34,372 megalitres of stormwater p.a. going into Melbourne’s waterways (avoiding 40,000 extra stormwater from the counterfactual)
Avoided infrastructure costs to deal with additional stormwater: $46 million p.a.
Higher / Higher
Climate regulation: Carbon storage
270 million tonnes of carbon stored in terrestrial parks and 850,000 tonnes stored in marine parks
Annual value not assessed 1 Higher / Higher
Carbon sequestration (from revegetation)
An average of 21,000 tonnes of carbon sequestered p.a. through two revegetation programs in parks
Value of carbon absorbed is $1-$5 million p.a. over the first 30 years of plantings
Medium / Higher
Pollination & seed dispersal
1,235 - 1,700 honeybee sites Benefit to agriculture (producers and consumers): $123-$167 million p.a.
Service payments to beekeepers: $0.6-$1 million p.a.
Medium / Medium
Habitats for species (intermediate service)
638 parks provide 50-100% habitat suitability for over 888 rare and threatened species
Maintenance of nursery populations
92 tonnes of fish stock enhanced (King George whiting only)
Not assessed $1.1 million of fish catch p.a. (imputed)
Higher / Lower
Cultural services
Recreation opportunities
51 million visits to parks and 45 million visits to bays
Value to visitor enjoyment: $600 million - $1 billion p.a.
Higher / Medium
16.9 million park tourist visitor nights per annum
Economic contribution of park related tourism: $1 billion GVA and 13,783 FTEs p.a.
Medium /Higher
23.1 million visits to parks for physical exercise
Avoided health costs of physical inactivity: $80-$200 million p.a. (may overlap with enjoyment)
Higher / Medium
Education opportunities
183,000 participants in education programs per year
Scientific research opportunities
215 research permits issued p.a.
Amenity (Melbourne’s parks)
12,000 immediate neighbours around 70 Greater Melbourne parks 85,000 immediate neighbours around parks outside Melbourne
Amenity benefit for residents of $21-$28 million p.a. (Greater Melbourne only)
Medium / Lower
Opportunities for cultural connection
54%-69% Victorians valuing park related historical heritage
Willingness to pay to maintain heritage: $6-$23 million p.a.
Higher / Lower
Indigenous heritage under joint or co-management with Traditional Owners across 643,513 hectares
Social cohesion and sense of place
211,000 volunteering hours p.a. Opportunity cost of time: $6 million p.a.
Labour value: $6 million p.a. (imputed)
Higher / Higher
Note: Total values have been annualised over 30 years at a discount rate of 5%, where appropriate. Imputed values represent the value of transactions expected to be observed if there was a market for this product or service. 1 Annual benefit values could not be assessed for carbon storage due to lack of models to assess carbon releases under the counterfactual. However, if all carbon currently stored in parks was released, the cost to offset these emissions would be valued at around $15 billion. The social cost of the emissions (without any offsets) is estimated at $63 billion.

Glossary
Consumer surplus A measure of the benefits to consumers from the consumption of a good or service. It is measured as the value of the demand for a good or service (through the amount that an individual is willing to pay for it) additional to the price actually paid for it. In the case of natural parks, the price above which consumer surplus is measured refers to the value of entry fees to the park, which is zero in most open access resources.
Cultural services Non-material ecosystem outputs that have symbolic, social or intellectual significance for individuals or communities. Examples include recreation, spiritual, social and cultural connection, landscape amenity, health and wellbeing, social cohesion and involvement.
Economic contribution The economic contribution measures the employment and valued added to the local, State and national economies associated with expenditure on specific goods or services. The total economic contribution consists of the direct contribution of a market activity (e.g. value of gross operating surplus, labour income to staff and taxes paid minus subsidies) and flow on effects stimulated across other sectors (e.g. through the purchase of intermediary inputs).
Ecosystem assets Spatial areas containing a combination of biotic and abiotic components and other characteristics that function together.1
Ecosystem services Contributions of ecosystems to benefits used in economic and other human activity. They are generated through ecosystem processes reflecting the combination of characteristics, intra-ecosystem and inter-ecosystem flows. 2
Environmental-economic accounts
System of data and information reporting used to describe environmental assets and flows of ecosystem goods and services and their linkages to the economy and society.
Ecosystem accounting Statistical framework for organising biophysical data, measuring ecosystem services, tracking changes in ecosystem assets and linking this to economic and other human activity.
Externalities The result of an activity (production or consumption) causing incidental benefits or damages to others with no corresponding compensation provided to or paid for by those generating it.
Intermediate ecosystem services
Services provided within ecosystems (intra-ecosystem flows) or between ecosystems (inter-ecosystem flows). Examples include maintaining soil health and enhancing the habitat to native species, which both benefit specific ecosystems directly but not society or the economy. Intermediate services may benefit other provisioning, regulating and cultural services indirectly.
Non-use value Values reflecting individual’s preferences through willingness to pay measures to preserve a resource aside from any actual use.
Parks Parks refer to terrestrial, river or marine areas that are managed by the State for the purposes of conservation, recreation, leisure, tourism or water transport. Victorian parks include both areas classified as ‘protected areas’ such as national parks and non-protected areas such as metropolitan parks. Under the International Union for the Conservation of Nature (IUCN) classification system, a protected area is a clearly defined geographical space, recognised, dedicated and managed through legal or other effective means, to achieve the long term conservation of nature with associated ecosystem services and cultural values3. For the purposes of this report parks include both parks and reserves.
Provisioning services Tangible goods and services that can be exchanged or traded, as well as consumed or used directly by people. Examples include food, water and other raw materials.
Regulating services Ways in which ecosystems control or modify parameters that define the environment of people. Ecosystem outputs are not consumed, but affect individuals, communities and populations and their activities. Examples include climate regulation, watershed regulation such as purification, flood control and biological processes, including pest control, pollination and genetic diversity.
Service flows Quantity of services provided from ecosystem to beneficiaries.
Total economic value Sum of the various constituents of utilitarian value, including use values and non-use values.
Use value Value derived from the direct use of a good or service for consumption, production or other indirect uses (e.g. water treatment services through wetlands for water use downstream).
1 United Nations 2014, System of Environmental-Economic Accounting 2012: Central Framework 2 Ibid 3 IUCN Definition 2008. Available online at http://www.iucn.org/about/work/programmes/gpap_home/pas_gpap/

1
1. Introduction and context
On behalf of the Victorian Government, Parks Victoria manages one of the most diverse park and
waterway networks in the world. The network contains a highly diverse range of natural and cultural
resources that provide a wide range of benefits to the environment, the community and the economy.
Under its legislative obligations, Parks Victoria’s core functions are to provide services to the State and
its agencies in relation to the management of parks, reserves, State-managed land and waterways for
the purposes of conservation, recreation, leisure, tourism or water transport.
1.1 The Victorian parks network
Victoria’s parks and waterway network covers approximately 4 million hectares, including both
protected areas as defined by the International Union for Conservation of Nature (IUCN) and other parks
and reserves. The protected area system includes both land and marine parks. The land-based parks
include 45 national parks, 26 State parks, three wilderness parks and over 2,500 conservation reserves
covering 17% or 3.45 million hectares of Victoria’s land area, with a number of these being jointly
managed or co-managed with Traditional Owners. A representative system of 24 marine national parks
and sanctuaries covers 5% of Victoria’s coastal waters (around 54,000 hectares). Details of the different
types of park purposes by IUCN classification are summarised in Appendix 1. In addition to the protected
area estate, Parks Victoria also manages a comprehensive network of 90 metropolitan, reservoir and
regional parks and has responsibilities as the local port manager for Port Phillip Bay, Western Port and
Port Campbell, and is the designated waterway manager for the Lower Yarra and Maribyrnong rivers,
and recreational manager of the Bays. The parks and reserves network is shown in Figure 1.1.
Figure 1.1 Map of Victorian parks and reserves
Source: Parks Victoria

2
The parks network includes a diverse range of natural, cultural and built assets including:
the majority of the State’s most intact natural ecosystems covering, alpine, wet forest and
rainforest, dry forest and woodland, heathland, grassland, wetland, river, coastal and marine
ecosystems;
more than 4,400 recorded native plant species and 1,000 native animal species, including 348
species not found anywhere else in the world;
much of the State’s most suitable habitat for threatened species;
many of the State’s opportunities for Aboriginal people’s cultural connection to land including
more than 11,000 recorded Aboriginal places;
over one million hectares of the State’s water supply catchments;
more than 2,500 historic heritage assets, including 150 places of national and State heritage
significance;
a complex array of more than 28,000 built assets to service visitors including visitor centre
buildings, shelters, toilets, viewing lookouts, roads, walking and cycling trails, boat ramps,
pedestrian and vehicular bridges, playgrounds and sporting facilities;
14,000 kilometres of roads and 3,700 kilometres of walking tracks; and
217 piers and jetties, water access points and around 950 navigation aids in the waterways estate.
In 2014 there were 51 million visits to Victoria’s land and marine parks and 45 million visits to bay assets.
Three-quarters of the Victorian population has visited a park managed by Parks Victoria in the previous
12 months.4
1.2 The purpose, value and benefits of Victoria’s parks
Victoria’s parks are managed in accordance with a broad range of State and Commonwealth legislative
obligations including the Victorian National Parks Act 1975 (National, State, Wilderness and some other
parks); the Crown Land (Reserves) Act 1978 (Conservation Reserves and Metropolitan Parks), the Port
Management Act 1985, Marine Safety Act 2010 and the Port of Melbourne Authority Act 1958.
Additionally it has obligations under the Commonwealth Environmental Protection and Biodiversity
Conservation Act 1999 and the State’s Flora and fauna Guarantee Act 1988.
A distinguishing feature of the Victorian parks network is that it encompasses a diverse range of park
types with different primary purposes and goals, covering nature conservation, culture and heritage
conservation and recreational objectives.
In recognising the value of parks, it is important to note that the fundamental objectives of the State’s
parks network under the legislation are to:
ensure ecological integrity and resilience by conserving representative examples of Victoria’s
ecosystems and the biodiversity contained within them;
protect and conserve culture and heritage; and,
connect people with parks by providing opportunities for appropriate use, enjoyment and learning.
In addition to being the backbone for conservation of the State’s flora and fauna and their habitats, the
Victorian parks and reserves network provides a wide range of services that benefit the State’s economy
and community wellbeing. Many of these benefits are shown in Figure 1.2. Over the past decade, there
4 Parks Victoria Community Perception Monitor

3
have been many examples in which government and non-government organisations have sought to
assess some of these benefits and describe the multiple values of parks5.
Figure 1.2 Contribution of parks to Victoria’s environment, economic and community wellbeing
Victoria’s parks are highly valued by the community with 89% of Victorians supporting the State having a
comprehensive network of national parks and other conservation reserves across land and sea6. Parks
allow people to connect with nature, enable cultural and spiritual connections and provide diverse
opportunities for outdoor recreation. Less recognised is the critical role that the Victorian parks network
plays in maintaining and improving Victoria’s liveability and supporting the economy. Parks provide
tangible benefits such as clean water, climate and heat regulation, nurseries for fish breeding,
pollination and pest control services for agriculture, storm protection for coastal communities, and
physical and mental health benefits for park visitors. They also provide benefits such as neighbourhood
amenity, social cohesion and scientific and educational opportunities. Across the world these ‘ecosystem
services’ are increasingly being recognised as critical to supporting human life and improving community
wellbeing. Both our protected areas such as national parks as well as our urban parks contribute to the
provision of these services.
5 For example, see Moyle B.D., Weiler B and Moore S.A 2014 Benefits that matter to managers: an exploratory study of three national park management agencies and Parks Forum 2008, The Value of Parks. Produced in partnership with IUCN World Commission on Protected Areas (WCPA) and The People and Parks Foundation. Printed May 2008. ISBN 978-0-646-49197-4 (http http://www.sustainabletourismonline.com/awms/Upload/Resource/Value%20of%20Parks%20Document.pdf) 6 Essential Research 2014. Attitudes to National Parks and Conservation. Survey prepared for the Victorian National Parks Association. Available in http://vnpa.org.au/admin/library/attachments/PDFs/Surveys/survey-attitudes-national-parks.pdf

4
Globally and nationally, there has been increased awareness and a rapidly increasing body of evidence
that community health and wellbeing and economic resilience are inextricably linked to having healthy
and resilient ecosystems7. In Victoria, the fundamental connection between people and nature has been
highlighted by Parks Victoria’s motto of Healthy Parks Healthy People (HPHP), which is based on a strong
body of scientific evidence that contact with nature is beneficial for physical, mental, emotional and
spiritual health and wellbeing8.
While some of the benefits of Victoria’s parks have been broadly described in the past, and some of the
economic contribution of parks has been quantified in isolated studies,9 there has not been an
overarching framework to assess the status of natural and other park assets or to indicate the
contribution of the diverse range of services provided by parks to Victoria’s economy and community
wellbeing10. Moreover, there is often limited evidence to assess the benefits of ecosystem services
under protected areas, such as parks, which is a key input in economic analysis for budget planning or
resource allocation among competing land uses. The ability to quantify and account for changes in
natural assets and the contribution that Victoria’s parks and their management make in sustaining our
society and economy is an important step in improved business practice.
1.3 Natural capital and ecosystem services
Since the United Nations led the Millennium Ecosystem Assessment of 2005 (MA), there has been a
rapidly growing global interest in the recognition, accounting and valuation of ecosystem services. This
work has highlighted the dependence of human wellbeing on healthy natural assets and the economic,
social and environmental consequences of degradation of ecosystems.
Earlier international work in environmental economics and measurement of natural resource depletion
increasingly acknowledged that individual economic behaviour in open access or public good resources
is unlikely to lead to the best social outcomes. This work went on to highlight the importance of policies
to address externalities or non-market goods or services affecting consumption and production
activities.
Through the MA, the longstanding work undertaken in environmental economics, the emerging research
under the Economics of Ecosystems and Biodiversity initiative (TEEB)11, the Intergovernmental Platform
on Biodiversity and Ecosystem Services (IPBES)12 and the System of Economic-Environmental Accounting
(SEEA)13, valuation approaches for assessing the consequences of ecosystem change for human
wellbeing have become more widely accepted. This includes the increasing recognition of ecosystems
and natural resources as natural capital, like any other capital resources.
7 Millennium Ecosystem Assessment, 2005. Ecosystems and human wellbeing: wetlands and water Synthesis. World Resources Institute, Washington, DC. Available in: http://www.unep.org/maweb/documents/document.358.aspx.pdf 8 Deakin University 2008, Healthy parks, healthy people, The health benefits of contact with nature in a park context: A review of relevant literature, 2nd edition. School of Health and Social Development, Faculty of Health, Medicine, Nursing and Behavioural Science. 9 See Price Waterhouse Coopers 2003, Economic contributions of Victoria’s parks. Parks Victoria, Melbourne. Note that based on that PWC report the economic value of “tourism and recreation” in parks was valued at $1.86 billion in 2004. This estimate used a different method of calculating economic contribution to the methods in this report and included management expenditure. 10 See Parks Forum, 2013, The economic value of parks: Establishing the need for an industry wide approach. Parks Forum, Melbourne. 11 TEEB: http://www.teebweb.org 12 IPBES: http://www.ipbes.net/ 13 SEEA: http://unstats.un.org/unsd/envaccounting/seea.asp
5
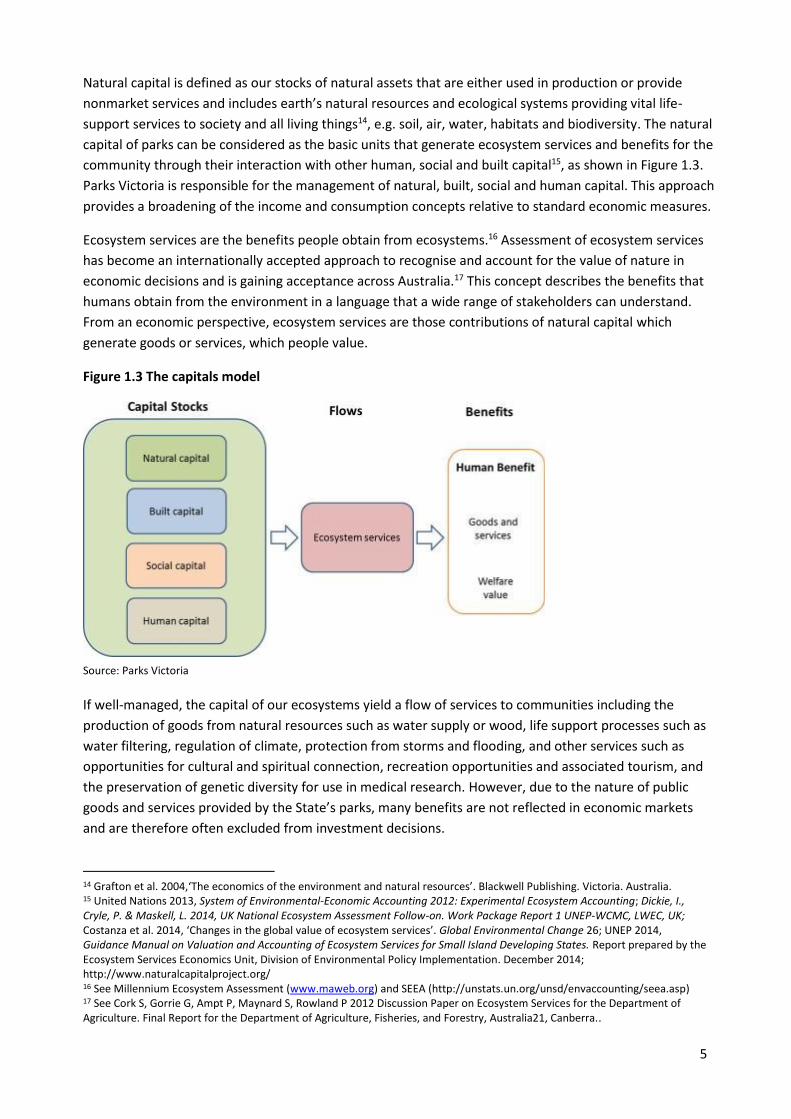
Natural capital is defined as our stocks of natural assets that are either used in production or provide
nonmarket services and includes earth’s natural resources and ecological systems providing vital life-
support services to society and all living things14, e.g. soil, air, water, habitats and biodiversity. The natural
capital of parks can be considered as the basic units that generate ecosystem services and benefits for the
community through their interaction with other human, social and built capital15, as shown in Figure 1.3.
Parks Victoria is responsible for the management of natural, built, social and human capital. This approach
provides a broadening of the income and consumption concepts relative to standard economic measures.
Ecosystem services are the benefits people obtain from ecosystems.16 Assessment of ecosystem services
has become an internationally accepted approach to recognise and account for the value of nature in
economic decisions and is gaining acceptance across Australia.17 This concept describes the benefits that
humans obtain from the environment in a language that a wide range of stakeholders can understand.
From an economic perspective, ecosystem services are those contributions of natural capital which
generate goods or services, which people value.
Figure 1.3 The capitals model
Source: Parks Victoria
If well-managed, the capital of our ecosystems yield a flow of services to communities including the
production of goods from natural resources such as water supply or wood, life support processes such as
water filtering, regulation of climate, protection from storms and flooding, and other services such as
opportunities for cultural and spiritual connection, recreation opportunities and associated tourism, and
the preservation of genetic diversity for use in medical research. However, due to the nature of public
goods and services provided by the State’s parks, many benefits are not reflected in economic markets
and are therefore often excluded from investment decisions.
14 Grafton et al. 2004,‘The economics of the environment and natural resources’. Blackwell Publishing. Victoria. Australia. 15 United Nations 2013, System of Environmental-Economic Accounting 2012: Experimental Ecosystem Accounting; Dickie, I., Cryle, P. & Maskell, L. 2014, UK National Ecosystem Assessment Follow-on. Work Package Report 1 UNEP-WCMC, LWEC, UK; Costanza et al. 2014, ‘Changes in the global value of ecosystem services’. Global Environmental Change 26; UNEP 2014, Guidance Manual on Valuation and Accounting of Ecosystem Services for Small Island Developing States. Report prepared by the Ecosystem Services Economics Unit, Division of Environmental Policy Implementation. December 2014; http://www.naturalcapitalproject.org/ 16 See Millennium Ecosystem Assessment (www.maweb.org) and SEEA (http://unstats.un.org/unsd/envaccounting/seea.asp) 17 See Cork S, Gorrie G, Ampt P, Maynard S, Rowland P 2012 Discussion Paper on Ecosystem Services for the Department of Agriculture. Final Report for the Department of Agriculture, Fisheries, and Forestry, Australia21, Canberra..
6
Ensuring the natural capital Parks Victoria manages does not degrade, and maximising the benefits
derived from ecosystem services is important for meeting the objectives of the parks network discussed
in Section 1.2. Thus, core goals for Parks Victoria are to ensure that the natural and other capital assets
of the parks network are maintained or restored. By doing this, Parks Victoria contributes to maintaining
the flow of ecosystem services and their associated benefits to the community.
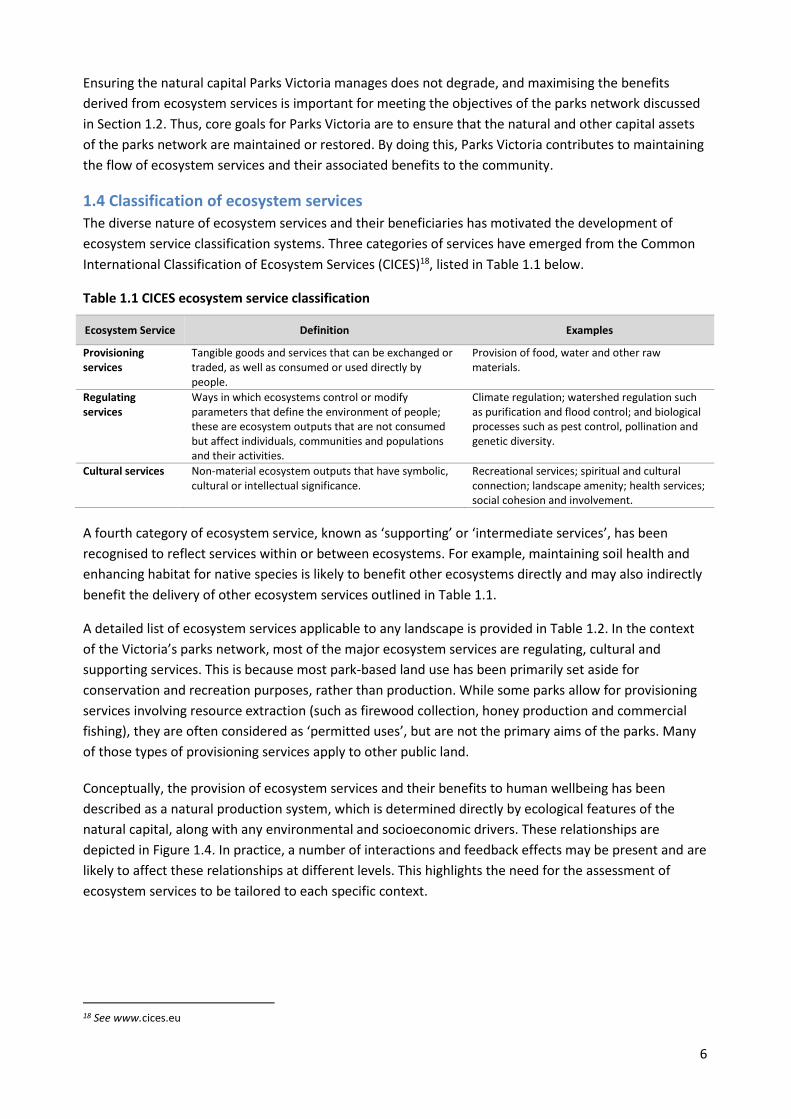
1.4 Classification of ecosystem services The diverse nature of ecosystem services and their beneficiaries has motivated the development of
ecosystem service classification systems. Three categories of services have emerged from the Common
International Classification of Ecosystem Services (CICES)18, listed in Table 1.1 below.
Table 1.1 CICES ecosystem service classification
Ecosystem Service Definition Examples
Provisioning services
Tangible goods and services that can be exchanged or traded, as well as consumed or used directly by people.
Provision of food, water and other raw materials.
Regulating services
Ways in which ecosystems control or modify parameters that define the environment of people; these are ecosystem outputs that are not consumed but affect individuals, communities and populations and their activities.
Climate regulation; watershed regulation such as purification and flood control; and biological processes such as pest control, pollination and genetic diversity.
Cultural services Non-material ecosystem outputs that have symbolic, cultural or intellectual significance.
Recreational services; spiritual and cultural connection; landscape amenity; health services; social cohesion and involvement.
A fourth category of ecosystem service, known as ‘supporting’ or ‘intermediate services’, has been
recognised to reflect services within or between ecosystems. For example, maintaining soil health and
enhancing habitat for native species is likely to benefit other ecosystems directly and may also indirectly
benefit the delivery of other ecosystem services outlined in Table 1.1.
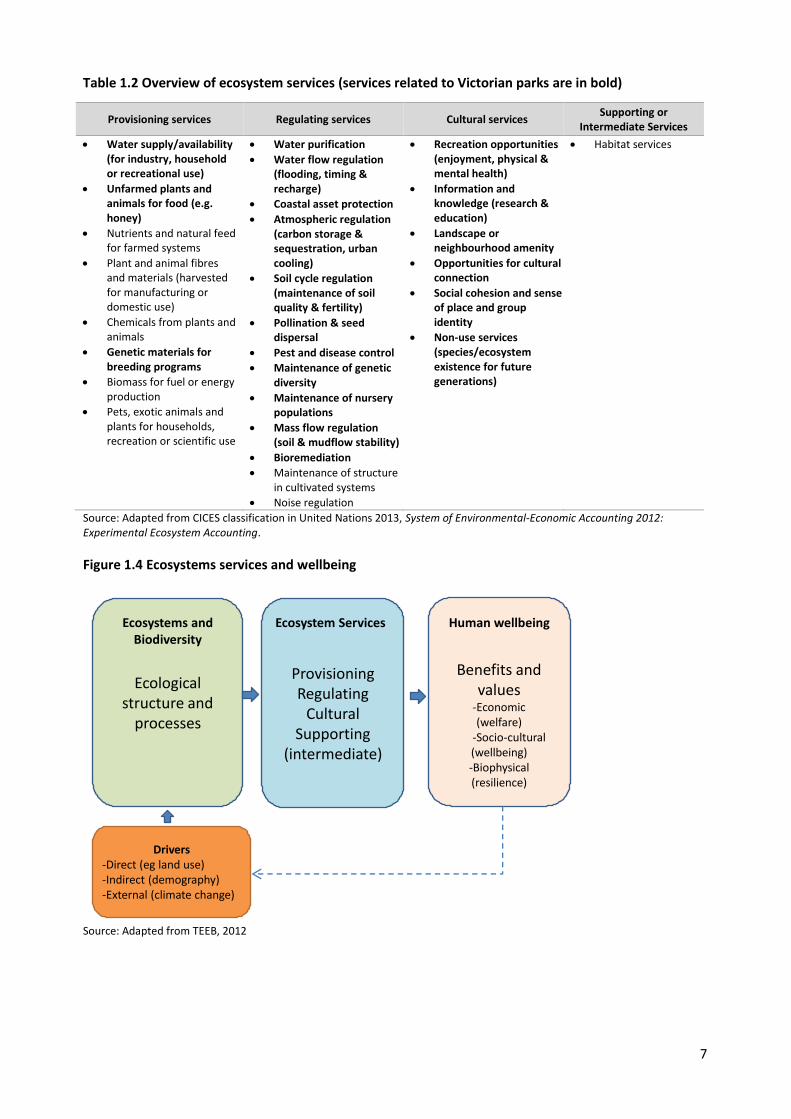
A detailed list of ecosystem services applicable to any landscape is provided in Table 1.2. In the context
of the Victoria’s parks network, most of the major ecosystem services are regulating, cultural and
supporting services. This is because most park-based land use has been primarily set aside for
conservation and recreation purposes, rather than production. While some parks allow for provisioning
services involving resource extraction (such as firewood collection, honey production and commercial
fishing), they are often considered as ‘permitted uses’, but are not the primary aims of the parks. Many
of those types of provisioning services apply to other public land.
Conceptually, the provision of ecosystem services and their benefits to human wellbeing has been
described as a natural production system, which is determined directly by ecological features of the
natural capital, along with any environmental and socioeconomic drivers. These relationships are
depicted in Figure 1.4. In practice, a number of interactions and feedback effects may be present and are
likely to affect these relationships at different levels. This highlights the need for the assessment of
ecosystem services to be tailored to each specific context.
18 See www.cices.eu
7
Table 1.2 Overview of ecosystem services (services related to Victorian parks are in bold)
Provisioning services Regulating services Cultural services Supporting or
Intermediate Services
Water supply/availability (for industry, household or recreational use)
Unfarmed plants and animals for food (e.g. honey)
Nutrients and natural feed for farmed systems
Plant and animal fibres and materials (harvested for manufacturing or domestic use)
Chemicals from plants and animals
Genetic materials for breeding programs
Biomass for fuel or energy production
Pets, exotic animals and plants for households, recreation or scientific use
Water purification
Water flow regulation (flooding, timing & recharge)
Coastal asset protection
Atmospheric regulation (carbon storage & sequestration, urban cooling)
Soil cycle regulation (maintenance of soil quality & fertility)
Pollination & seed dispersal
Pest and disease control
Maintenance of genetic diversity
Maintenance of nursery populations
Mass flow regulation (soil & mudflow stability)
Bioremediation
Maintenance of structure in cultivated systems
Noise regulation
Recreation opportunities (enjoyment, physical & mental health)
Information and knowledge (research & education)
Landscape or neighbourhood amenity
Opportunities for cultural connection
Social cohesion and sense of place and group identity
Non-use services (species/ecosystem existence for future generations)
Habitat services
Source: Adapted from CICES classification in United Nations 2013, System of Environmental-Economic Accounting 2012: Experimental Ecosystem Accounting.
Figure 1.4 Ecosystems services and wellbeing
Source: Adapted from TEEB, 2012
Ecological structure and
processes
ProvisioningRegulating
CulturalSupporting
(intermediate)
Benefits and values
-Economic(welfare)
-Socio-cultural(wellbeing)-Biophysical(resilience)
Ecosystems and Biodiversity
Ecosystem Services Human wellbeing
Drivers -Direct (eg land use)-Indirect (demography)-External (climate change)

8
1.5 About this study
1.5.1 Purpose of this work
This project was established to develop a framework to account for and value the environmental,
community and economic assets, services and benefits of Victorian Parks using international and
national best practice standards. The aim of developing improved and consistent environmental and
economic information of ecosystems is to inform park management strategic, operational and
implementation decisions for three purposes:
Monitoring of assets and trend analysis: assessment of the status of parks’ environmental (and
associated built and cultural) assets;
Understanding the contribution of ecosystem assets to current socioeconomic activities:
reporting the amount of ecosystem services, their changes over time and any associated
transactions in the economy or society; and,
Estimating benefits of parks’ ecosystem services to society: appraisal of the benefits of
ecosystem services provided in park areas as compared to alternative land uses or under
proposed changes in policy or investment.
The study marks an important development in the way that Parks are valued and managed for all
Victorians, recognising parks as significant environmental assets of the State that need to be maintained
and restored in order to provide a broad range ecosystem service benefits to the community.
In developing this project specifically for Victoria’s parks, the project is strongly aligned with ongoing
work at the Department of Environment, Land, Water and Planning to develop and implement standard
environmental-economic accounting information for integration into reporting, analysis and policy
advice to improve the accountability, effectiveness and efficiency of investments in environmental
management. This work also supports the use of consistent information to undertake valuations of
economic, community and environmental benefits provided by Victoria’s natural resources and
environment more broadly.
It is important to recognise that ecosystem services provided by parks may be measured through both
monetary and non-monetary metrics. Depending on the purpose of the assessment, both metrics are
valid and complementary.
Specifically the objectives of the study were to:
Establish a framework to recognise, quantify and value the ecosystem services provided by
Victoria’s parks and the economic, community and environmental benefits generated, based on
international best practice;
Prioritise and where possible undertake valuations for selected ecosystem services;
Establish a program of works, including prioritisation of ecosystem accounting and valuation
projects and data acquisition, to enable the ongoing assessment of the ecosystem services
provided by Victoria’s parks along with key benefits generated; and,
Develop a set of experimental ecosystem accounts for Parks Victoria that will serve as a pilot
ecosystem accounts for public land.

9
1.5.2 Study approach
The approach used in developing the accounting and valuation framework for Victoria’s parks builds on
the ongoing work of the interdisciplinary initiatives outlined in Section 1.3 (discussed in further detail
through the report). The approach adopted for this project consisted of the following stages:
1. Review international practice, literature and relevant methodologies used in ecosystem accounting and valuation frameworks
2. Link and tailor these frameworks for application to the Victorian parks network:
Develop an accounting framework for ecosystem assets and ecosystem services – ecosystem asset accounts are used for monitoring, while ecosystem service accounts present the contribution of ecosystem assets to current socioeconomic activities.
Undertake analysis of available parks data to populate a set of pilot accounts.
Develop a valuation framework to assess the current benefits of parks ecosystem services – with focus on benefits from parks to society, which involved defining a counterfactual alternative land use in the absence of parks.
Undertake analysis of selected ecosystem services to quantify their benefits in monetary and/or non-monetary metrics, where appropriate.
3. Develop case studies to illustrate application of the above accounting and valuation frameworks to park management activities
4. Identify areas of uncertainty and further work to refine the set of ecosystem accounts and underlying data over time, as well as to improve current valuation estimates.
1.5.3 How will this report be used?
The development of pilot ecosystem accounts for Victoria’s parks and the valuation of the benefits
generated by ecosystem services are intended to be used for a number of different purposes discussed
in further detail below. This report specifically introduces the foundations for both accounting and
valuation frameworks and discusses the findings from this pilot, which will be the basis for ongoing work
between DELWP and PV to improve environmental information and land management decision-making
tools.
Awareness:
Raise awareness among resource managers, policy and decision makers and the broader community
that Victoria’s parks should be valued not just for their role in ensuring ecosystem resilience,
conserving nature, protecting cultural heritage and providing enjoyment and learning for visitors and
the community; they are indeed critical assets for the State that provide a range of services that
contribute to the prosperity and improved wellbeing of Victorians.
Accounting:
Facilitate improved monitoring and reporting of the extent, status and condition of ecosystem and
other assets of Victoria’s parks and the quantity of ecosystem services provided.
Account for the improvement, maintenance or degradation of Victoria’s natural parks over time and
the flow of services they provide against organisational goals (backward-looking analysis).

10
Valuation:
Provide a stronger evidence base to inform investment decisions for parks, particularly in assessing
benefits and calculating the return on investment and the cost-effectiveness of alternative options in
meeting desired Government outcomes (forward-looking analysis).
Demonstrate the level of contribution that parks can make to current socioeconomic activities,
supporting the prosperity and wellbeing of Victoria, in addition to the range of ecosystem resilience,
biodiversity conservation and cultural and recreational functions they provide.
This work will also inform strategic directions for the management of Victoria’s public land, natural
resources and environment. The framework is aimed at supporting informed and transparent planning
and management decisions for parks and public land, particularly where trade-offs between economic,
community and environmental benefits are required.
1.5.4 Caveats on the report
The Valuing Victoria’s Parks study is an important first step in developing a new and tailored approach to
estimate and account for the quantity of ecosystems services and the value of benefits provided by
Victoria’s parks.
The approach involves the application of an environmental-economic accounting framework to assess
the status of parks assets and quantities of ecosystem service flows, which then can feed into a valuation
framework used to assess the ecosystem benefits provided to society. Although both frameworks and
their distinctive purposes are discussed in this report, it is important to note that the report does not
intend to be used as a manual and the linkages between both frameworks will continue to evolve as
more data becomes available. The application of techniques across these fields requires solid
understanding and experience in both the environmental-economic accounting and environmental
valuation areas.
The estimates of quantity and value of a selected number of services are based on available data and
valuation methods that could be undertaken during the duration of the project. A number of ecosystems
services have been recognised as potentially significant but have not been assessed in this first phase of
the program.
In viewing monetary values of selected ecosystems services provided by the report, it is important to
recognise that the economic value for different services cannot necessarily be aggregated. This can be
due to data availability, different valuation concepts and measures being used and the potential overlap
in some cases, where available values may incorporate benefits of more than one service.
It is important to note that the assessment of both the quantity and value of ecosystem services
generated by parks in this report is not definitive and is based on gathering available data in a relatively
short time period. A prioritised program of further assessments is discussed in Section 6, which will seek
to improve the quality of the assessments over time. Nevertheless, as the first assessment of the
Victorian parks network, the report provides both an accounting framework in which to populate new
information and indicative estimates of the value of key ecosystem services attributable to parks.

11
2. Review of environmental accounting and valuation frameworks
This project brings together different disciplines and analytical tools to better inform Parks Victoria
about the ecosystem assets they manage. Thus, a number of relevant frameworks and initiatives that
seek to assess ecosystem services and incorporate them into decision-making have been reviewed to
inform this project.
This section introduces concepts and frameworks for environmental-economic accounting and
environmental valuation. A detailed discussion on the distinctive use of these frameworks and related
techniques is also included in this section.
While accounting for natural capital, accounting for ecosystem assets and their services, and
environmental valuation can be linked they are generally used for different purposes, highlighted in
Table 2.1 below.
Accounting provides the capacity to systematically monitor changes in the extent and quality of
environmental resources and enables a framework for the consistent reporting on the contribution of
environmental resources to economic activity, growth and performance. Specifically, the purpose of
environmental-economic accounting is to provide consistent and comparable information on ecosystem
assets and the services they provide, along with performance measures of resource use and emissions in
the economy (e.g. water, energy, carbon). By contrast, natural capital accounting encompasses the
services of all natural resources, including abiotic services (e.g. mineral resources).
Environmental valuation is used to assess the benefits of goods and services provided by environmental
assets and places a welfare value in monetary terms, which enables appraisal of competing use of
resources, alternative policies or investments (typically conducted using cost-benefit analysis). While the
total determined value of ecosystem service benefits can be useful for strategic planning and raising
awareness about the quantum of value provided by park services, valuation is generally applied to assess
the incremental change in costs and benefits of alternative options and potential trade-offs associated
with changes in environmental quality.
Table 2.1 The purposes of natural capital accounting and environmental valuation
Features Natural capital accounting Environmental-economic accounting Environmental valuation
Scope
Consistent, comparable measurements of information on the extent and condition of natural assets, including relevant abiotic services (e.g. mineral resources)
Consistent, comparable measurements of information on the extent and condition of natural assets, along with ecosystem services
Assessment of incremental and total benefits derived from ecosystem services, under different management options
Monetary measures
Exchange value: value of economic activities and transactions observed in the economy
Exchange value: value of economic activities and transactions observed in the economy
Welfare value: non-market benefits (or costs) derived for consumers and producers
Decision-making supported
Reporting of environmental performance
Consistent reporting on the contribution of ecosystem assets and services to economic activity, growth and performance
Providing input to economic analysis for land/environmental policy
Raising awareness of parks assets and their services to the community
Comparing benefits across land uses or policy and investment options
Resource allocation across competing uses of ecosystems
Awareness of parks benefits
It is important to note that the current systems of accounting focuses on tracking stocks and service
flows in physical units and monetary terms, referring to the activity generated within society under
present social preferences and environmental and institutional conditions. By contrast, environmental
valuation focuses on the assessment of non-market costs and benefits (or externalities) due to a specific

12
intervention, which requires assessing the change in outcomes of ecosystem services with and without
the intervention (in this project, this is comparing park land use with private land use). Thus,
environmental valuation produces economic ‘welfare values’ consistent with cost-benefit analysis, while
accounting reports the current transactions in terms of ‘exchange values’. These concepts are described
in further detail in Section 2.3.
2.1 Ecosystem accounting frameworks
2.1.1 System of Environmental-Economic Accounting
The conceptual basis of accounting is defining capital (stocks) and income (flows) of assets that are
valued through time and space or between entities (e.g. people or businesses). An economic account
describes stocks and flows of economic goods and services, whereas the subject of environmental
accounts is environmental assets and flows of ecosystem goods and services.
The System of National Accounts (SNA) is jointly released by the United Nations Statistics Division
(UNSD), the European Commission, The Organisation for Economic Cooperation and Development, the
International Monetary Fund and the World Bank. The first SNA was released by the United Nations in
1953 and has been progressively updated and refined since then. The SNA provides a consistent
structured basis for reporting on economic performance. However, the accounts did not cover measures
of human, social and natural capital19. Internationally, efforts are being directed at extending national
accounts to incorporate these. The UNSD and other agencies have developed the System of
Environmental-Economic Accounting (SEEA) over the last decade to allow countries to monitor and value
their natural assets.
The SEEA Central Framework20 is a multipurpose conceptual framework for understanding the
interactions between the economy and the environment, and for describing stocks and changes in stocks
of environmental assets. It is the first iteration of a statistical standard for environmental-economic
accounting. The System of Environmental-Economic Accounting (SEEA) Experimental Ecosystem
Accounting21 complements the SEEA Central Framework.
2.1.2 SEEA Experimental Ecosystem Accounting
The SEEA Experimental Ecosystem Accounting (SEEA-EEA) is an integrated statistical framework for
organising biophysical data, measuring ecosystem services, tracking changes in ecosystem assets and
linking this information to economic and other human activity. SEEA-EEA accounts include:
Ecosystem assets, which are spatial areas containing a combination of biotic (living) and abiotic
(non-living) components and other characteristics that function together; and,
Ecosystem services, which are the contributions of ecosystems to benefits used in economic and
other human activity. They are generated through ecosystem processes reflecting the combination
of assets characteristics, intra-ecosystem and inter-ecosystem flows.
19 As discussed in Grafton et al. (2014), relying on GDP as the main measure of economic performance may encourage countries to follow unsustainable paths of development, because GDP makes no deduction for the depreciation for capital stock. Earlier solutions advocated by some economists (e.g. Repetto in 1992, Pearce and Atkinson in 1995) referred to including natural capital in the capital accounts of the SNA to derive an environmentally adjusted version of the Net Domestic Product (interpreted as the maximum level of sustainable consumption). Grafton et al. 2004,‘The economics of the environment and natural resources’. Blackwell Publishing. Victoria. Australia. 20 United Nations 2014, System of Environmental-Economic Accounting 2012: Central Framework. 21 United Nations 2013, System of Environmental-Economic Accounting 2012: Experimental Ecosystem Accounting.

13
Figure 2.1 below summarises the approach to experimental ecosystem accounting.
Figure 2.1 Experimental ecosystem accounting
Source: Eigenraam, M., Chua, J. Hasker, J. 2012 Land and Ecosystem Services: Measurement and Accounting in Practice. 18th Meeting of the London Group on Environmental Accounting, Ottawa, Canada.
Ecosystem accounting is used to measure the flows of environmental services from ecosystem assets
into the economy and society more broadly. Thus, the development of ecosystem accounts is central to
assessing the linkages and interdependencies between natural resources and human and economic
activities. In this context, ecosystems can be considered as a type of endowment supporting an
economy, but providing additionally broader non-market benefits to human wellbeing.
The development of the SEEA-EEA has been motivated by the need for:
Understanding about the extent of self-regeneration and degradation of the environment in a
consistent framework that complements the SEEA and SNA
Identifying and assessing impacts of economic and other human activity on the environment and
understanding potential trade-offs between alternative uses of a given ecosystem
Providing meaningful information about ecosystems in policy areas, such as sustainable
development, natural resource use and land management
Overall, ecosystem accounts will provide a better understanding of the contribution of ecosystem
services to the economy, and the attribution of the environmental degradation, restoration and
enhancement and will assist in the development of more complete measures of regional and national
wealth.
Ecosystem accounting supplements the information of core environmental-economic accounting (as
described in the SEEA Central Framework) by explicitly identifying and appraising each of the service
flows provided by ecosystem assets. For instance, the current application of environmental-economic
accounting focuses on the measurement of resource use/supply and footprint in each sector of the
economy under the SNA classification (e.g. in terms of water, energy, land use, air pollution and
greenhouse gas emissions), while ecosystem accounting encompasses assessing both the quantity and
economic, environmental or social value of final ecosystem services that can be linked to any production
or consumption activities beyond the SNA structure.

14
The model of flows in ecosystem accounting is presented in Figure 2.2 below. The model presents
concrete examples of key relationships between the bio-physical environment, ecosystem services and
benefits attained in economic and other human activity.
Note that in the context of ecosystem accounting there are two types of benefits: SNA benefits and non-
SNA benefits. SNA benefits are obtained from goods and services produced or distributed by economic
units (e.g. food and water), while non-SNA benefits are not (e.g. clean air). By convention, the
measurement scope of non-SNA benefits for ecosystem accounting purposes is limited to the flow of
ecosystem services with an identifiable link to human wellbeing.
Figure 2.2 Model of flows in ecosystem accounting
Source: United Nations 2013. System of Environmental-Economic Accounting 2012: Experimental Ecosystem Accounting.
2.1.3 The Victorian experience in ecosystem accounting
The Victorian Government has been contributing to the development of SEEA-EEA. Over the past ten
years, Victoria has been establishing the information systems required for government to implement a
market-based approach to manage ecosystem assets and make effective investment in increasing the
supply of ecosystem services at least cost. These systems have relied on an extensive array of
information including spatial layers, ecosystem condition assessments, ecosystem condition modelling,
ecosystem service modelling and ecosystem change modelling. As a result, Victoria’s modelling
capabilities are able to provide information about the current levels of some selected ecosystem flows
and further predict likely changes in ecosystem flows due to changes in land use and management.
A set of accounts has been developed for Victoria, building on the methodological guidance of SEEA-EEA.
The Victorian approach is based on a bottom-up methodology, which models and monitors cumulative
chains of ecological processes across a whole system. The development of the accounts is undertaken in
three stages: assessment of asset conditions, calculating the volume of inter-ecosystem flows as a

15
function of the asset condition and its context in the landscape and quantifying the volume of ecosystem
services22.
The first set of experimental accounts presented in 2013 were classified in the following groups:
Ecosystem Asset Accounts, which measured the Victorian terrestrial extent and condition across
major vegetation groups (e.g. forests, grasslands, woodlands, scrublands) for the years 1750 and
2005. These covered 24 native vegetation groups and other land categories, including sea and
estuaries, inland aquatic and cleared, non-native vegetation and buildings.
Asset Flow Accounts, which recorded the changes in the stock of ecosystem assets between
1994 and 2004, showing both additions (e.g. growth in terrestrial extent, whether via managed
revegetation or unmanaged regeneration) and reductions (e.g. extractions, normal loss of stock
and catastrophic events).
Physical Flow Accounts, which recorded the flows between ecosystem assets and used these as
proxies for the services that contribute to human benefits.
Environmental Payment Accounts, which recorded the economic transactions that affect the
stocks and flows of ecosystem assets, including the expenditures for improvement and
maintenance of ecosystem assets. Of particular importance to water quality were payments on
wastewater management, protection and remediation of soil, groundwater and surface water,
and protection of biodiversity and landscapes.
This set of experimental environmental-economic accounts used the ABS 2012 Land Account data in
Victoria, which provided a link between the ecosystem and economic land valuation data and socio-
demographic geographical units.
The accounts were instrumental in gaining an understanding of the nature of changes in ecosystem
assets in Victoria, mainly in terms of native vegetation groups and the changes in land
tenure/classifications. However, the 2013 land accounts did not look at the full range of final ecosystem
services provided by specific assets and did not include any valuation associated with environmental
services. This is a new development of this pilot for Victorian parks.
2.2 Valuation of ecosystem services
Different people attach different meanings to the word ‘value’. Economists use the word to describe the
extent to which a good or service contributes to the wellbeing of an individual or society. In other words
economists consider value from a human perspective. Ecologists often assess value by the relative
contribution or ‘significance’ of intrinsic ecological processes, functions and resilience to disturbance.
While there is ongoing debate in the context of valuing ecosystem services about the degree to which
different approaches can determine value, whichever interpretation of value is used, there is increasing
agreement that the absence of a price for ecosystem services does not indicate absence of value.
In order to quantify the contribution of the land, water and ecosystem assets of Victoria’s parks to the
Victorian economy and wellbeing of the community we need a common framework of measurement.
Many of the services provided by Victoria’s parks are public goods that provide multiple benefits. These
benefits are often not captured in market transactions, resulting in these services not being included in
many private economic decisions. The purpose of valuation is to explicitly recognise the importance of
22 Eigenraam, Chua and Hasker 2013 Environmental-Economic Accounting: Victorian Experimental Ecosystem Accounts, Version
1.0. Department of Sustainability and Environment. State of Victoria.

16
the range of assets, services and benefits provided by parks. Having a common language of value is
particularly important for decision-makers in assessing the trade-offs associated with management and
investment decisions relating to parks and their management.
In this context, it is important to distinguish between monetary values developed for economic
evaluations (or welfare analysis) and monetary values that are sought in the context of environmental-
economic accounting. These two values are different (but often related) in the accounting and valuation
of ecosystem services:
1. Exchange values are used by accountants to measure the value of economic activity or
transactions that are consistent with SNA definitions and SEEA international standards; and
2. Welfare values are used by economists to measure the net benefits (or change in welfare)
associated with a specific land use, proposed policy or investment23.
In the case of non-market goods or services (e.g. most ecosystem services not observed in market
transactions), environmental valuation is used to assess benefits. Exchange values for non-market goods
or services could be derived from specific environmental valuation techniques to provide the value of
economic activity or transactions that would occur if the ‘missing’ price were in place24.
Exchange values are consistent with all other transaction values recorded in the SNA. The main purpose
of obtaining these values could be to develop satellite accounts, in which the contribution of ecosystems
can be compared with other SNA production and consumption activities in the economy. In the context
of this project, the aim is to assess the benefits of Victoria’s parks and therefore welfare values are the
main focus.
To value Victoria’s parks we have compiled and estimated benefits based on the data and modelling
available at the time of this project. However, we further indicate where some of the data gathered
could be also suitable to derive exchange values for environmental-economic accounting.
Figure 2.3 below summarises the relationship between monetary values developed for environmental
valuation and accounting purposes. Welfare values are derived from a snapshot of market demand and
supply cost curves in the short-run, i.e. where fixed or investment costs are not taken into account. By
contrast, exchange values include fixed costs as well as taxes and subsidies. In this way, the economic
contribution or value added to an economy can be calculated directly from exchange values measuring
profit as the return to labour and capital.
23 The economic welfare of society is the total benefit measured by the consumer and producer surplus. Recent work has attempted to use welfare values for ‘inclusive wealth accounting’ as discussed in the UNEP Inclusive Wealth Report 2012: Measuring Progress Toward Sustainability. However, the assumptions required are contentious and so, this initiative should be considered as a developing area.
24 Economic theory indicates that the optimal price that maximises welfare would tend to be the same to the observed price in
in competitive markets, without any market failures. Under these market conditions, the relationships to derive exchange and welfare values may be more direct, but this is often not the case for ecosystem services.

17
Figure 2.3 Different accounting and valuation concepts
2.2.1 Environmental valuation concepts
The concept of Total Economic Value (TEV) was formally introduced in the 1990s25, but its components
have been discussed in the economics literature since the 1960s26. Figure 2.4 presents an overview of
the classification of economic values and their relevance to different ecosystem services.
Total economic value is defined as the sum of the various constituents of utilitarian value, including use
values and non-use values. Use values result from either the direct use of a good (that can be consumed
directly) or the indirect use of a good (that provides functional benefits such as a wetland treating water
for use downstream). Non-use or passive use values reflect individual’s willingness to pay to preserve a
resource aside from any actual use. These values may result for various reasons such as providing a
bequest for future generations, altruism from knowing others have access to a benefit and gaining
satisfaction from the existence of a species or ecosystem.
25 Pearce and Turner 1990, Economics of natural resources and the environment, Johns Hopkins University Press. Chapter 9. 26 Weisbrod, B. A. 1964, ‘Collective-Consumption Services of Individual-Consumption Goods’, Quarterly Journal of Economics 78, pp. 471-477. Krutilla, J. 1967, ‘Conservation Reconsidered’, American Economic Review 57, p. 777-786. Arrow, K. J. and A. C. Fisher 1974. ’Environmental Preservation, Uncertainty and Irreversibility’, Quarterly Journal of Economics 89, pp. 312-19.

18
Figure 2.4 Components of the value of parks
Source: Adapted from TEEB Foundations Report 2010 Chapter 5 The Economics of Valuing Ecosystem Services and Biodiversity.
Some commentators argue that valuation in monetary terms may have counterproductive outcomes for
biodiversity conservation27 or that valuing ecosystem services is the same as privatising or commodifying
nature. Other commentators raise ethical objections to valuing the environment based on individual or
community preferences, arguing that the environment has ‘intrinsic value’ that is unrelated to human
preferences. Others argue the concept of intrinsic value is difficult to apply in a decision-making context.
This is because once one environmental asset is assigned intrinsic value, it is difficult to see how
unavoidable trade-offs with other environmental, cultural or social assets that are also afforded intrinsic
value could be resolved28. Others point out the limitations of monetary valuation in the face of the highly
complex behaviour and high levels of uncertainty about ecosystem functions29.
In valuing ecosystem services and quantifying their benefits both monetary and non-monetary units can
be used. Increasingly economists are using monetary units to place an economic value on the benefits
obtained, however many benefits can also be expressed in non-monetary units to demonstrate absolute
or incremental level of benefits. For some benefits a monetary unit is not considered either appropriate
or feasible.
The approach in this project is to pursue valuation of the benefits of ecosystem services in monetary
terms where possible and appropriate to demonstrate the links to the economy and value provided to
the community. It is acknowledged that other valuation paradigms are also valid (e.g. the existence of
27 Gomez-Baggethun and Perez 2011 Economic Valuation and the Commodification of Ecosystem Services, Progress in Physical Geography. 28 Productivity Commission 2014 Environmental Policy Analysis: A Guide to Non-Market Valuation, Productivity Commission
Staff Working Paper, January 2014 29 Farly 2008 Valuing Natural Capital: The Limits of Complex Valuation in Complex Systems, conference paper prepared for
Economics and Conservation in the Tropics: A Strategic Dialogue.
Bequest
Option value Actual value
Non-use values Use values
Total value
Philanthropic
value
Consumptive
Indirect use Direct use
Ecological
altruism
Non-
consumptive
Altruism Existence
Eg. Water,
firewood, honey
Eg. Recreation Eg. Climate
regulation, water
purification
Future use of
known and
unknown benefits
Satisfaction of
knowing future
generations have
access to nature’s
benefits
Satisfaction of
knowing other
people have
access to nature’s
benefits
Satisfaction of
knowing a species
or ecosystem
exists
Provisioning Cultural Regulating Cultural services

19
intrinsic values separate from values to humans), but this does not negate the importance of the
monetary valuation work. Where monetary valuation of the benefits of ecosystem services is not
feasible or desirable, proxy indicators can be developed using available scientific information to reflect
the importance of the service.
Economists rely on valuation using preference-based methods to provide information about the relative
level of resource scarcity to assist in best allocating limited resources, while ecologists have traditionally
used biophysical methods. Some ecosystem services (such as recreation) have a monetary value that
relates to the contribution of tourism to the economy. Other ecosystem services may have a social value
where a monetary unit is used to reflect that value (e.g. willingness to pay). In other cases, it may be
either undesirable or not feasible to put a monetary value on the service and there will be a proxy
measurement (e.g. an index of value such as relative contribution or benefit).
Economists favour analysing policy decisions using an economic framework, ideally through a cost–
benefit analysis. This allows decisions to be informed by the trade-offs that the individuals who make up
the community would be prepared to make and aims to select options that make the community better
off overall. However, applying a cost–benefit framework is not easy where ecosystem services are
impacted. This emphasises the need to pursue monetary valuation of ecosystem services as well as
ensuring frameworks for decision making allow for different types of valuation.
Non-market valuation in the context of ecosystem accounting focuses on appraising the total economic
value derived from the ecosystem assets. The total economic value encompasses a range of use and
non-use values held by the community reflecting the range of ecosystem services that may be provided
by a single asset. Individual ecosystem services often have a single type of value – they reflect either a
use or non-use value – and therefore one valuation method can be selected to value the benefits of each
ecosystem service. Given the difficulty in measuring non-use values and linking them to economic and
social activities, use values have been the focus of valuation in this project, while selected non-use
values from the literature have been considered at the high level only.
2.2.2 Economic valuation methods
A range of techniques for valuing environmental assets in monetary terms have been developed to carry
out traditional economic evaluations to inform policies and programs aimed at improving the
environment or to feed into project appraisals with significant impacts on the environment. The main
types of techniques for estimating monetary values are briefly described in Table 2.2 below.
There are three main types of primary research techniques typically used for valuing environmental
benefits. Market based techniques provide the greatest confidence to value non-market benefits as the
monetary values are directly observed in markets. However, these methods cannot be used to value
goods or services where prices do not exist. Revealed preference techniques can capture non-market
values but require more detailed data and analysis from any existing markets that can be linked to the
goods or services of interest. Stated preference techniques are based on hypothetical markets, are
more technically difficult and require careful survey design to ensure robust outputs.
An alternative technique is based on secondary research referred to as benefit transfer (or value
transfer). Benefit transfer derives a proxy value from existing research and the original work may be
from any of the three types of techniques outlined above. Careful judgement is needed in selecting,
applying and interpreting the results of valuation techniques.

20
Table 2.2 Overview of valuation techniques
Valuation techniques Approach Examples
Primary research techniques
Market based techniques
Estimating values based on market prices where there is an existing market for the ecosystem service or market prices.
Market price approach: Determining the value based on a marketed good provided by the ecosystem directly such as fish or timber. Productivity method: Where an ecosystem service affects production levels, costs or prices. The contribution to output is used as a proxy for the value of the service. Replacement cost approach: often applied to indirect use values of ecosystem services, such as nutrient cycling or water purification, whereby the value of a service is estimated by the cost of the next best option to achieve the same outcome (e.g. a water purification plant).
Revealed preference techniques
Eliciting or deriving values based on observed behaviours and actual choices in related markets that affect the ecosystem goods or services of interest.
Hedonic pricing: used to derive values for amenity and the aesthetic qualities of environmental assets by observing how another related market changes in value due to proximity to such assets (e.g. real estate values changing in proximity to parks). Travel cost method: generally used to estimate the recreational values of particular sites by observing visitor travel patterns and the expenditure that people are willing to pay in order to enjoy such a site.
Stated preference techniques
Eliciting values based on individual statements or choices in a hypothetical market for the ecosystem service.
For non-use values, stated preference techniques are the only option available (e.g. deriving people’s willingness to pay to protect endangered species habitat by presenting sets of choices with payment mechanisms). Two techniques are used: Contingent valuation: used to elicit the perceived value of certain environmental amenities. Discrete choice modelling: used to infer trade-off values between key attributes of environmental amenities.
Secondary research
Benefit transfer Provides transferable values from other studies under the following conditions: • the study and policy site should be similar; • the environmental change under consideration at the policy site should be similar to the proposed change at the study site; and • the socioeconomic characteristics and preferences of the population should be similar.
Transfer of an average value: defensible only if ecosystem asset/service and context is very similar (e.g. filtration services valued at $x per hectare per year is applied to an ecosystem with similar characteristics). Transfer using meta-analysis: value tailored through a relationship derived from many relevant studies (e.g. on average a x% increase in water treatment costs for each y% loss in forest cover in developed countries). Transfer using a spatially explicit value function: detailed analysis of assets and services based on spatial and temporal scales (e.g. the UK National Ecosystem Assessment land use scenarios).
The prerequisite for choosing a valuation technique is to determine the purpose of the valuation.
Selecting the right technique for each situation will depend on a number of factors such as:
the motivation for the valuation
the type of economic and environmental data already available
the ecosystem service (some techniques are suited to particular types of ecosystem services)
the time and budget available
the availability of experienced practitioners
21
The Productivity Commission recently prepared a guide to non-market valuation, as an accepted
approach to assess the relative importance community places on specific environmental outcomes30. It
states that:
“Because non-market valuation methods can generally provide an objective
estimate of the value that the community places on environmental outcomes,
they offer advantages over other approaches to factoring these outcomes into
policy analysis."
In relation to individual techniques, the Productivity Commission has confirmed that revealed
preference methods are widely accepted, but there are many circumstances where they cannot provide
the estimates needed for environmental policy analysis. They advise that stated preference methods are
able to provide valid estimates for use in environmental policy analysis, noting however that:
there are many elements that practitioners need to get right to produce meaningful results; and,
value estimates are likely to be less reliable when respondents are asked about environmental
assets that are especially complex or relatively unfamiliar to them.
The Productivity Commission also advises that the accuracy of benefit transfer is likely to be low unless
the primary studies are of high quality and relate to similar environmental and policy contexts.
The Victorian Department of Treasury and Finance Technical Guidelines on Economic Evaluation for
Business Cases includes a section on valuation techniques. The guidance document acknowledges the
range of techniques available to value market and non-market impacts in monetary terms. It advises
that:
impacts should only be assigned a monetary value when this is done in a robust and neutral
manner in line with the appropriate use of existing widely accepted valuation techniques or default
values; and,
if impacts cannot be assigned monetary values then they should still be described in quantitative /
qualitative terms.
2.2.3 The Economics of Ecosystems and Biodiversity
The Economics of Ecosystems and Biodiversity (TEEB) is a global initiative focused on drawing attention
to the economic benefits of biodiversity. TEEB provides a framework to help decision-makers recognise,
demonstrate and capture the values of ecosystems and biodiversity, and incorporate those values into
decision-making.
TEEB recognises that linking biophysical aspects of ecosystems with human benefits through the notion
of ecosystem services is important for assessing trade-offs. Decisions lead to actions that have impacts
on ecosystems, causing changes in ecosystem structure and function. These changes lead to changes in
the provision of ecosystem services. Changes in ecosystem services in turn have impacts on human
welfare.
The TEEB approach to valuation of ecosystem services involves the steps shown in Figure 2.5 below.
30 Productivity Commission 2014 Environmental Policy Analysis: A Guide to Non-Market Valuation.

22
Figure 2.5 TEEB approach to valuation of ecosystem services
Source: TEEB, 2010. The Economics of Ecosystems and Biodiversity: Mainstreaming the Economics of Nature: A synthesis of the
approach, conclusions and recommendations of TEEB.
Before benefits and values can be assessed, the performance or availability of ecosystem services has to
be measured in biophysical terms. In some cases the state of ecological knowledge and the data
availability allow using some direct measures of services, while in other cases it is necessary to make use
of proxies.
TEEB adopts an economic (anthropocentric) framework with preference based values and proposes two
components to the economic value of ecosystems. The first is total economic value of the ecosystem
service benefits at a given ecological state. The second is the ecological or insurance value that lies in
sustaining the resilience of the ecosystem, which provides flows of ecosystem service benefits with
stability over a range of variable environmental conditions.
The TEEB framework recognises that some aspects of ecosystem functioning such as ecological resilience
or the proximity of tipping points are difficult to capture in valuations. In such cases it is recommended
that this information is presented alongside valuation calculations. TEEB suggests an ecological
(insurance) value is defined through a non-monetary assessment of ecosystem integrity, health, or
resilience, all of which are important indicators to determine critical thresholds and minimum
requirements for ecosystem service provision.
TEEB is a broad initiative that aims to guide practical policy responses to losses of biodiversity and
ecosystem services. TEEB identifies settings where benefits and values can inform decisions and provides
a range of case studies and examples of incorporating ecosystem service values into decision making. A
range of reports and case studies have been developed under the TEEB initiative for national and
international policy making, local and regional policy management and business and enterprise.
2.3 Synthesis of relevant valuation and accounting frameworks
A review of a range of classification, accounting, and evaluation frameworks including TEEB and SEEA
was carried out and is summarised in Table 2.3 below. The review was conducted with the following four
criteria in mind:

23
1. Clarity of definition and classification of natural capital and ecosystem services
2. Consistency of methods for converting data into information for decisions and confidence in
methods
3. Ability to audit and report on economic, community and environmental benefits
4. Ability to adapt over time
Table 2.3 Summary of Frameworks reviewed
Framework Purpose Conceptual framework Insights for this project
Ecosystem services initiatives
Millennium Ecosystem Assessment (MA)
To assess consequences of ecosystem change for human wellbeing; to establish scientific basis for sustainable use of ecosystems
Four components: direct and indirect drivers of change; ecosystem services and human wellbeing
Useful introduction; the first classification scheme
Environmental-Economic Accounting
To understand the interactions between the economy and the environment so that this can be taken into account in decision making
Describing stocks, changes in stocks of environmental assets and changes in ecosystem service flows
Provides a framework for organising physical data to assist in managing environmental assets
The Economics of Ecosystems and Biodiversity (TEEB)
To help decision makers recognise, demonstrate and capture the values of ecosystems and biodiversity
Adds to MA conceptual framework; identifies benefits and values of ecosystem services and links to decision making
Provides useful guidance on monetary and non-monetary valuation approaches with significant flexibility
Valuing Nature Network
To promote research capacity in the valuation of biodiversity, ecosystem services and natural resources and facilitate integration into policy and practice
Categorisation of values into individual wellbeing values and collective shared wellbeing values
Interesting conceptualisation of value, including shared social values
Classification frameworks
Common International Classification of Ecosystem Services (CICES)
To provide a clear classification of ecosystem services for accounting purposes
Based on the MA; focuses on final ecosystem services
Most commonly used classification; can be adapted to suit the needs of the project
Final Ecosystem Goods and Services Classification System (FEGS)
To provide a set of detailed definitions, metrics and indicators to link ecosystem services and human wellbeing
Identifies a set of beneficiary classes and services that are connected directly to what people value
Useful focus on identifying beneficiaries when classifying to avoid ambiguity and double counting
Accounting frameworks
System of Environmental-Economic Accounting (SEEA): Central Framework
To provide a statistical standard for measuring stocks and changes in stocks of environmental assets
Physical supply and use tables; functional accounts and asset accounts.
SEEA offers an international standard for environmental-economic accounting that integrates with the System of National Accounts
System of Environmental-Economic Accounting (SEEA): Experimental Ecosystem Accounting
To synthesise current knowledge regarding an accounting approach to the measurement of ecosystems
Measures flows of ecosystem services to people; measures ecosystem asset condition in terms of capacity to provide services
Offers experimental approach to ecosystem accounting that can be adapted for the project; organises physical data that can be used in estimating the value of ecosystem services for other purposes as well
The SEEA and CICES best meet the criteria of providing a clear definition and classification of ecosystem
assets and services as an internationally recognised approach. This combination will provide consistency
of methods for converting data into information for decisions, linking information with existing
evaluation frameworks and a structure for auditing and reporting on benefits. SEEA organises physical

24
data that can be used in estimating the value of environmental services using a range of valuation
concepts (for accounting or other evaluation purposes).
The scope of TEEB is very broad – it is an approach rather than a framework. The TEEB documentation
provides very useful guidance on methods to convert data on ecosystem services into information for
decisions. We draw on the methods for monetary and non-monetary valuation described in TEEB in the
sections to follow, and provide tailored guidance to assist in deciding which methods should be used for
different purposes to promote more consistency in the Victorian context. Each of the evaluation
frameworks has been developed for different purposes and can all be adapted to consider ecosystem
services.

25
3. Application of ecosystem accounting and valuation frameworks to Victorian
parks
A key aim of this project is to provide more understanding about the scope and magnitude of ecosystem
services and benefits provided by parks to inform park management priorities. For this we apply
available ecosystem accounting and valuation frameworks to the management of Victoria’s parks by
both integrating these into Parks Victoria’s business systems as well as to provide insights for the
broader application of environmental valuation and accounting to public land. This section outlines the
distinctive purpose of incorporating each of these frameworks into park management.
3.1 Park management framework in Victoria
Parks Victoria has adopted a park management framework based on the Open Standards for the Practice
of Conservation31 (Figure 3.1). Like similar adaptive management frameworks it recognises that effective
park management includes understanding the assets (or stocks) managed and the flow of ecosystem
services generated, clear measurable goals and objectives, strategies to meet those goals and evaluation
of alternative investment strategies and systems to enable evaluation of the extent to which the goals
have been met.
Within this park management framework, environmental-economic accounting frameworks are most
relevant in seeking to consistently generate accounts to record both the extent and condition of park
assets and the quantity of ecosystem services generated over time. Valuation frameworks are most
useful in being able to assess the benefits of park services under alternative management options and
assess trade-offs.
Figure 3.1 Parks Victoria park management framework
Source: Parks Victoria and DELPW
31 The Conservation Measures Partnership 2013. Open Standards for the Practice of Conservation, Version 3.0. April 2013. Available in http://cmp-openstandards.org/wp-content/uploads/2014/03/CMP-OS-V3-0-Final.pdf

26
3.2 Use of ecosystem accounting and valuation for park management
In developing accounts and valuing the ecosystem services generated by parks, it is important to note
that ecosystem services are combined with inputs from other forms of capital, as well as capital inputs
outside Parks Victoria, to provide a range of benefits to the community. Some of these benefits will be
included in the economic system, whereas other benefits will not. Figure 3.2 shows the scope of
information gathered for this pilot and the different instances in which accounting for ecosystem
services and valuation of their benefits can be used to inform Parks Victoria’s programs and strategies to
maximise the value of Victorian parks. An overview of the core components covered in this study is
illustrated in the figure below and introduced in the following sections.
Figure 3.2 Overview of ecosystem accounting and valuation uses for Victorian parks
3.2.1 Accounting for parks’ natural assets
The starting point to improve information for park management is an inventory of the natural, cultural
and built assets managed by Parks Victoria. For natural assets, the purpose is to understand what types
of ecosystems are supported by the parks network (e.g. land, rivers, wetlands, marine areas) and their
main attributes (e.g. extent, condition, biodiversity significance). This information is organised into
ecosystem asset accounts, which is the first part of our proposed accounting framework, described in
further detail in Section 4.
3.2.2 Accounting for ecosystem services provided by Victoria’s parks
Park management could improve its efficiency by better understanding the ecosystem services parks
provide to Victorians and developing more targeted interventions. The proposed accounting framework
provides a consistent approach to identify and quantify biophysical measures of a range of ecosystem

27
services provided by Victoria’s parks. This information is to be reported into ecosystem service accounts,
which focus on the contribution of ecosystems providing benefits to humans32.
Table 3.1 presents a summary of ecosystem services considered for this pilot. Each ecosystem service is
described conceptually in terms of the type of benefit it provides and its direct beneficiaries. Note that in
ecosystem accounting, beneficiaries are the direct users of the ecosystem service, e.g. producers who
extract a resource to produce goods and services.
Ecosystem service accounts could be used to summarise ecosystem services provided in terms of:
the physical quantity of ecosystem service flows;
the value of commercial or market transactions in monetary terms (for provisioning services
mainly, as these are captured under SNA sectors);
the value of non-monetary transactions (for services that can be linked to economic activities
but where market prices are not observable, e.g. education or health public infrastructure); and,
the equivalent exchange value of non-market services (for ecosystem services outside the SNA
and where exchange values can be derived from non-market valuation, as discussed in Section 5).
In the case of Victoria’s parks, ecosystem assets are dedicated for conservation and/or recreational use
and most provisioning services (extraction of resources for commercial use) are typically not part of
parks’ primary goals. Therefore, the focus of this project is on the quantity of ecosystem services, which
is to be reported and monitored through the ecosystem service accounts. However, in the case of
tourism it was possible to estimate the number of visitors attributable to parks and their expenditure,
which then enables calculating the economic contribution of parks’ tourism.
In general, services which can be linked to economic activity through the supply or use of resources in
the value chain or which involve expenditure through market transactions can be recorded in accounts,
as they align with current SNA structure. Note that an economic contribution in this sense is not a
measure of benefits, because it does not indicate whether this is the best way of spending resources as
compared to an alternative.
Although in principle it is possible to derive accounts using exchange values in monetary terms for non-
market services not covered under the SNA (as discussed in Section 5), this was not pursued in this first
stage of the project. The reasons for this is that deriving such exchange values relies on specific valuation
techniques being used33, it requires good demand data for ecosystem services which is often a
challenge, and its main purpose would be to expand the structure of current national accounts, which is
not the objective of this pilot.
The methodology used to quantify annual service flows is described in Section 4, with further details
about data sources, analysis or modelling used for each ecosystem service provided at Appendix 2.
32 Intermediary regulating services may provide benefits to other ecosystems directly and to humans indirectly only 33 Building ecosystem accounts based on constructed exchange values for non-market services is an area under current development. SEEA-EEA indicates that it is conceptually feasible to obtain exchange values from valuation techniques such as the travel cost or the replacement cost methods, in which a demand curve for the ecosystem service can be derived.

28
Table 3.1 Typology of ecosystem services observed in Victorian parks
Ecosystem service Benefits to society and economy Direct beneficiaries End users and final beneficiaries
Provisioning goods
Water supply1 Water for drinking; water for food production, energy production
Urban water consumers, food producers, energy consumers
Water, food and energy consumers
Honey supply2 Honey products Producers of honey products Honey consumers and
businesses
Regulating services
Water purification Protects human health; purifies water for water, energy and food sectors
Water, energy and food producers
Water, energy and food consumers and businesses
Flood protection Protects assets and infrastructure Local councils, Victorian
government Victorian communities and businesses
Coastal asset protection Protects coastal infrastructure and homes
Local council, Victorian government
Victorian communities and businesses
Carbon storage and sequestration
Protects human health; protects assets and infrastructure
Farmers and land managers Global community
Local climate regulation -urban cooling
Protects human health; reduces demand for energy
Urban communities Victorian communities
Air quality Protects human health Urban communities Victorian communities
Soil quality and stability Agricultural productivity Agricultural producers Consumers of agricultural
products and businesses
Pollination & seed dispersal Native and introduced pollinators assisting agricultural productivity
Agricultural producers Consumers of agricultural products and businesses
Pest and disease control Agricultural productivity Agricultural producers Consumers of agricultural
products and businesses
Habitats for species (intermediate service only)
Indirect benefit through other final services
Ecosystems and native species
Maintenance of genetic diversity
Indirect benefit to human health Medical industry Victorian communities and businesses
Maintenance of nursery populations
Agricultural productivity Agricultural producers Consumers of agricultural products and businesses
Cultural services
Recreation opportunities
Enjoyment, physical and mental health
Park visitors (locals and tourists) Victorian and global communities
Tourism Tourists Victorian and regional communities and businesses
Scientific research and education opportunities
Education, human health, economic productivity
Researchers,, students, general public
Victorian and global communities and businesses
Landscape and neighbourhood amenity
Enjoyment, mental health Residents surrounding parks Victorian communities
Opportunities for cultural connection
Spiritual health, economic productivity from Aboriginal connection to land
Traditional Owners Indigenous communities, Victorian and Australian community
Community wellbeing from connection to historic heritage
Population valuing historic heritage
Victorian and Australian community
Social cohesion and sense of place
Economic productivity, wellbeing, mental health
Communities connected through sense of place from natural parks
Victorian and Australian community
Preservation of species and ecosystems
Satisfaction of knowing a species or ecosystem exists, ecological resilience
Population valuing the preservation of ecosystems for future generations
Victorian and Australian community
1 Ecosystems in parks collect filtered water to transport and release water, which is then transferred via built infrastructure (e.g. pipes, channels) to downstream users mainly for drinking and agriculture. There is debate around the attribution of water provisioning and filtering to park land use. This issue is considered further in Section 5. Hydroelectric power stations in parks benefit from clean filtered water, which improves the durability of turbines and efficiency of power generation, however renewable generation based on abiotic resources is not an ecosystem service under the CICES classification.
2 The parks network contains many apiary sites used to produce honey. There is debate around the attribution of honey supply to parks, but this discussed in Section 5 (i.e. whether honey production could be equally provided by other land uses).

29
As the Victorian parks network is diverse and includes a range of different types of parks with different
primary purposes, the relative significance of ecosystem services will vary both across park types as
across different ecosystems. Tables 3.2 outlines the relative significance of each of the ecosystem
services by park type.
Overall, terrestrial national and State parks contribute to a large extent to all ecosystem services, with
marine parks contributing significantly to carbon storage and biodiversity services. Conservation
reserves are also important contributors of biodiversity related services (e.g. genetic diversity, habitat
for species, maintenance of nursery populations). Metropolitan parks contribute importantly to
recreation and neighbourhood amenity but also provide significant water filtration services. Recreational
management of bays and waterways contributes primarily to recreation, tourism, amenity and social
cohesion.
3.2.3 Valuing benefits from parks ecosystem services
In addition to reporting and monitoring the physical quantities of parks’ ecosystem service flows, it is
important to assess their benefits, which to a large extent are not reflected in current markets or
economic transactions.
Valuation frameworks provide economic measures to estimate the value of benefits from ecosystem
services provided by parks (the methodology is discussed in detail in Section 5). Valuation is relevant to
park management, as it can inform the types of intervention and the resource allocation both across
park management and other government services, as well as within park management across diverse
park areas, which support different types of ecosystem services.
The assessment of each ecosystem service follows a systematic approach including: identifying the
relevant benefits and beneficiaries for each ecosystem service, understanding the background context
and links to other services, calculating the quantity of services provided, selecting appropriate valuation
methods and a valuation of benefits. This approach is applied systematically to each of the ecosystem
services relevant to Victoria’s parks, covered in Appendix 2.
It is important to note that the assessment of both the quantity and value of ecosystem services
generated by parks in this report is not definitive and is based on gathering available data in a relatively
short time period. A prioritised program of further assessments is discussed in Section 6, which will seek
to improve the quality of the assessments over time. Nevertheless, as the first assessment of the
Victorian parks network, the report provides both an accounting framework in which to populate new
information and an indicative estimate of the value of key ecosystem services attributable to parks.
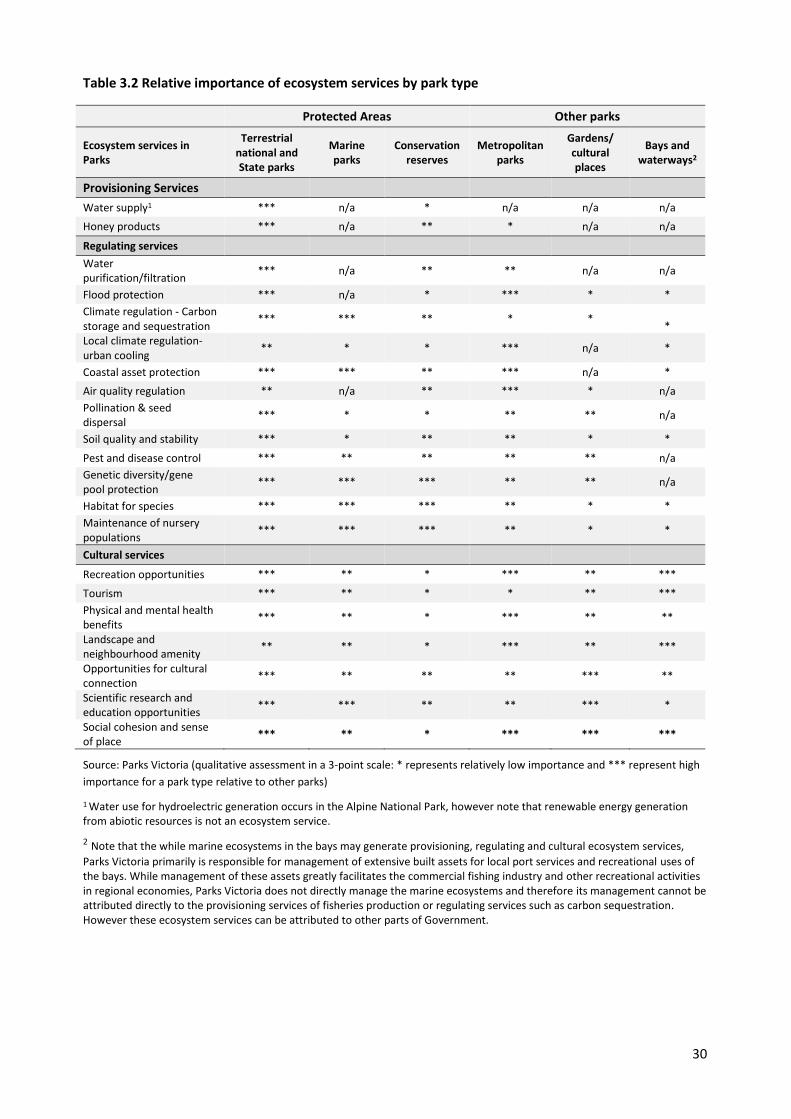
30
Table 3.2 Relative importance of ecosystem services by park type
Protected Areas Other parks
Ecosystem services in Parks
Terrestrial national and State parks
Marine parks
Conservation reserves
Metropolitan parks
Gardens/ cultural places
Bays and waterways2
Provisioning Services
Water supply1 *** n/a * n/a n/a n/a
Honey products *** n/a ** * n/a n/a
Regulating services
Water purification/filtration
*** n/a ** ** n/a n/a
Flood protection *** n/a * *** * *
Climate regulation - Carbon storage and sequestration
*** *** ** * *
* Local climate regulation- urban cooling
** * * *** n/a *
Coastal asset protection *** *** ** *** n/a *
Air quality regulation ** n/a ** *** * n/a
Pollination & seed dispersal
*** * * ** ** n/a
Soil quality and stability *** * ** ** * *
Pest and disease control *** ** ** ** ** n/a
Genetic diversity/gene pool protection
*** *** *** ** ** n/a
Habitat for species *** *** *** ** * *
Maintenance of nursery populations
*** *** *** ** * *
Cultural services
Recreation opportunities *** ** * *** ** ***
Tourism *** ** * * ** ***
Physical and mental health benefits
*** ** * *** ** **
Landscape and neighbourhood amenity
** ** * *** ** ***
Opportunities for cultural connection
*** ** ** ** *** **
Scientific research and education opportunities
*** *** ** ** *** *
Social cohesion and sense of place
*** ** * *** *** ***
Source: Parks Victoria (qualitative assessment in a 3-point scale: * represents relatively low importance and *** represent high
importance for a park type relative to other parks)
1 Water use for hydroelectric generation occurs in the Alpine National Park, however note that renewable energy generation from abiotic resources is not an ecosystem service.
2 Note that the while marine ecosystems in the bays may generate provisioning, regulating and cultural ecosystem services,
Parks Victoria primarily is responsible for management of extensive built assets for local port services and recreational uses of the bays. While management of these assets greatly facilitates the commercial fishing industry and other recreational activities in regional economies, Parks Victoria does not directly manage the marine ecosystems and therefore its management cannot be attributed directly to the provisioning services of fisheries production or regulating services such as carbon sequestration. However these ecosystem services can be attributed to other parts of Government.

31
4. Ecosystem asset and service flow accounts
Establishing core asset accounts for ecosystem, cultural and built assets managed by Parks Victoria is the
starting point to assess the current scope and status of park assets and understand their potential to
sustain underlying processes in the provision of services to the society and economy.
4.1 Methodology to construct pilot ecosystem accounts
Pilot ecosystem accounts provide a systematic approach to accounting for changes in the quantity and
quality of ecosystem assets and resulting flows of ecosystem services, which provide benefits to the
community. The development of pilot ecosystem accounts was undertaken in the following steps
(outlined in Figure 4.1 below):
STEP 1 Define ecosystem assets – the starting point is to define key ecosystem assets which are spatially
aligned with Ecosystem Accounting Units (EAU). In this pilot EAUs are individual park areas. Note that
the focus of analysis is on the biophysical environment in which their components operate as a
functional unit, implying a systems perspective is used. For the purpose of this project, we have taken
into account built and cultural/historical assets, which are not provided by the ecosystem, but provide a
more holistic overview of parks’ amenities.
STEP 2 Assess the condition of ecosystem assets – the next stage requires compiling and analysing
relevant spatial and other data for each ecosystem asset, understanding key attributes to measure and
assessing their condition (the condition is typically evaluated in comparison to a reference year or
baseline). A clearly defined typology and hierarchy of ecosystem assets in which condition scores can be
aggregated and compared is required.
STEP 3 Identify measures and quantify ecosystem service flows – in this stage the ecosystem service
flows provided by a given ecosystem asset, along with their beneficiaries, are identified and classified as
part of four main service types:
Provisioning services (e.g. food, water)
Regulating services (e.g. climate regulation, water purification, pollination)
Cultural services (e.g. recreation, cultural heritage)
Supporting services (e.g. soil formation, nutrient cycling).
The first three are final services, while supporting services are considered intermediary ecosystem
processes, providing services within and across ecosystem assets.
STEP 4 Assessment of ecosystem services flows – this stage involves assessing ecosystem services in
physical quantities or units at agreed reporting intervals. This is done through a range of available tools
including models. Only final service flows are quantified, as only these can be linked directly to
production/consumption activities and human wellbeing. The contribution to economic activity in
monetary units can also be quantified for relevant ecosystem services, if appropriate.
STEP 5 Application of ecosystem accounts – the final step seeks to present the accounting data in a way
that is consistent with the SEEA framework and is useful to inform key stakeholders managing the parks
and associated resources. This includes identifying SNA and non-SNA components, breakdowns for
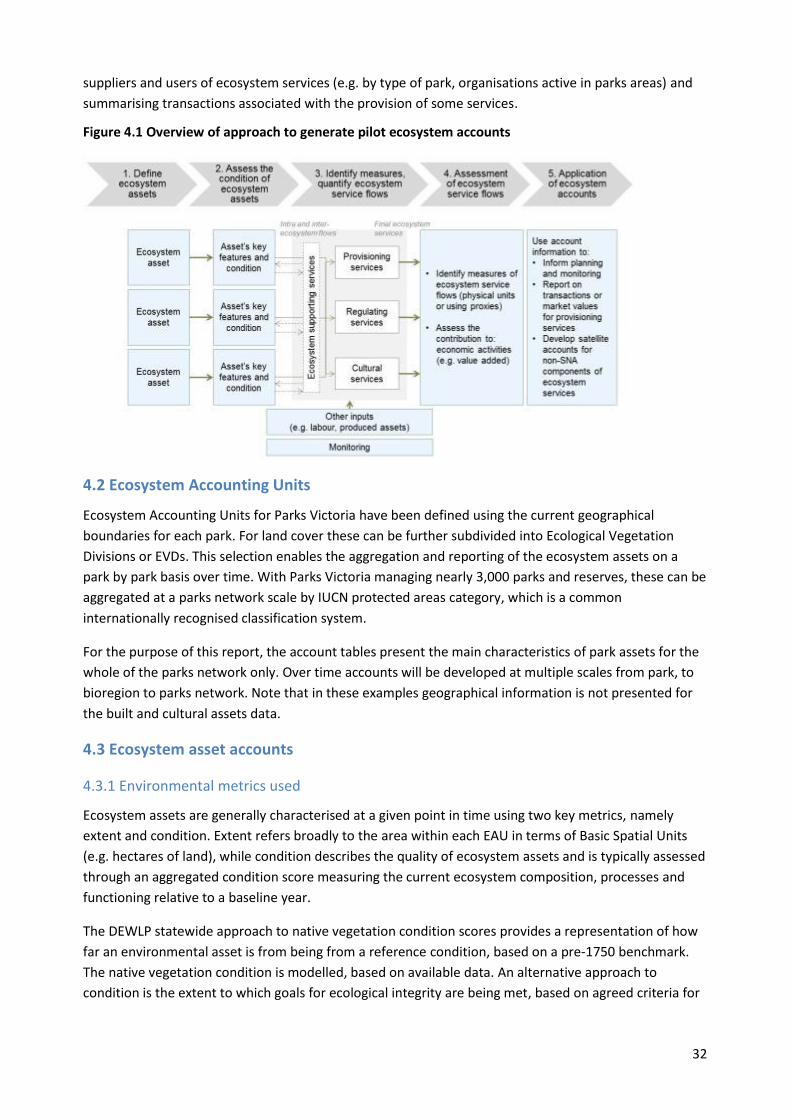
32
suppliers and users of ecosystem services (e.g. by type of park, organisations active in parks areas) and
summarising transactions associated with the provision of some services.
Figure 4.1 Overview of approach to generate pilot ecosystem accounts
4.2 Ecosystem Accounting Units
Ecosystem Accounting Units for Parks Victoria have been defined using the current geographical
boundaries for each park. For land cover these can be further subdivided into Ecological Vegetation
Divisions or EVDs. This selection enables the aggregation and reporting of the ecosystem assets on a
park by park basis over time. With Parks Victoria managing nearly 3,000 parks and reserves, these can be
aggregated at a parks network scale by IUCN protected areas category, which is a common
internationally recognised classification system.
For the purpose of this report, the account tables present the main characteristics of park assets for the
whole of the parks network only. Over time accounts will be developed at multiple scales from park, to
bioregion to parks network. Note that in these examples geographical information is not presented for
the built and cultural assets data.
4.3 Ecosystem asset accounts
4.3.1 Environmental metrics used
Ecosystem assets are generally characterised at a given point in time using two key metrics, namely
extent and condition. Extent refers broadly to the area within each EAU in terms of Basic Spatial Units
(e.g. hectares of land), while condition describes the quality of ecosystem assets and is typically assessed
through an aggregated condition score measuring the current ecosystem composition, processes and
functioning relative to a baseline year.
The DEWLP statewide approach to native vegetation condition scores provides a representation of how
far an environmental asset is from being from a reference condition, based on a pre-1750 benchmark.
The native vegetation condition is modelled, based on available data. An alternative approach to
condition is the extent to which goals for ecological integrity are being met, based on agreed criteria for

33
the key attributes of the ecosystem. This recognises that reference condition may change over time.34
While common ecosystem metrics include native vegetation extent and quality, accounts could also
include the number of recorded species by faunal (e.g. mammals, reptiles, fish) or floral (flowering vs
non flowering plant) group. While this information is available for the extent (number of recorded
species) of biodiversity assets, there are limited common standards for quality. “Conservation status” or
degree of representation is often used as a proxy measure at a State, bioregional or national scale.
The assessment of the extent and condition of ecosystem assets can be undertaken with different levels
of granularity to provide different information about the status of parks. For ecosystem asset accounting
purposes, the following three options were identified as relevant to the parks network:
Overall condition scores for different assets by park type, as outlined in Table 4.1; while this
provides a consistent index across all ecosystems and land tenures it is coarse in scale.
Specific attributes, such as biodiversity or species significance by land cover type and comparing
the condition of each EVD within and outside the parks network, as shown in Tables 4.2 and 4.3;
Providing an overview of ecosystems of high significance, e.g. Ramsar wetlands, as part of
meeting goals for conservation obligations for the parks network, as shown in Tables 4.4 and 4.5.
4.3.2 Overview of parks ecosystem assets and their condition
The stocks and composite condition scores across ecosystem assets under the IUCN Protected Area
classification for protected and other non-protected areas is summarised in Table 4.1 below.
Parks Victoria manages terrestrial parks with over 3.7 million hectares of protected areas and almost
206,000 hectares of non-protected areas, totalling around 3.9 million hectares, which is 38% of all native
vegetation areas in the State.
In addition, Victoria’s parks support over 201,000 hectares of wetlands in protected areas along with
further 73,000 hectares in non-protected areas, which altogether account for 42% of all wetland areas in
Victoria. The area of marine national parks and sanctuaries managed by Parks Victoria is over 53,000
hectares. The area within parks where rivers run through is 47,905 hectares.
The largest stocks of native vegetation from the parks network are found in national, State and
wilderness parks. Based on modelled vegetation quality, the average condition score for these parks is
good (79), compared to the whole of the parks network that has a condition score of 65.
Wetland ecosystems are evenly distributed across national and State parks, wildlife reserves and non-
protected conservation reserves. Although wetland condition is on average good, there is a small drop in
the average quality of wetlands observed in non-protected areas.
Note that the condition scores of rivers below represent direct observations taken in relevant parks, but
can be largely influenced by social and economic activities and the condition of other ecosystems
located outside of the parks network (particularly in downstream flows). The numbers reported below
are indicative of the condition of rivers in the parks area, but cannot be fully attributed to the parks’
ecosystems35.
34 See Parks Canada Ecological Integrity program, http://www.pc.gc.ca/eng/progs/np-pn/ie-ei.aspx 35 A detailed analysis of river condition scores in parks will require additional modelling and data including flow direction.

34
Table 4.1 Stocks and condition of ecosystem assets in parks network – extent and condition by IUCN category
Ecosystem assets Native vegetation Wetlands Rivers Marine
2010 2014 2011 2011 2014
Extent Condition Extent Condition Extent Condition Extent Condition
Assets measures Hectare Native
Vegetation score1
Hectare Index of wetland
condition2
Hectares with river
Index of stream
condition3 Hectare
Marine Habitat
condition4
Protected Areas (IUCN PA Categories)
IA Nature Conservation Reserves 254,255 71 16,009 7 2,911 29 - -
IB Wilderness Parks 200,094 82 22 1 1,000 41 - -
II National and State Parks 3,061,274 79 68,681 7 31,874 32 52,809 VG
III Natural Features Reserves 63,097 62 1,788 7 4,026 28 231 F
IV Bushland Reserves 41,287 61 1,821 6 512 27 - -
V Protected landscape 62
- - -
VI Wildlife Reserves 111,078 63 112,867 6 1,926 25 - -
Non-protected areas
Conservation reserve 113,140 62 61,854 6 2,600 29 - -
Port and coastal asset 1 7 194 10 - -
Urban, regional and other parks 92,784 63 11,598 7 3,056 25 - -
Parks total 3,937,010 65 274,834 7 47,905 29 53,040 -
Parks share of total assets in Victoria (%) 38% 42% 16%
1 The Native Vegetation Condition score is a normalised value in a 100-point scale to assess the quality of native vegetation, based on DEPI’s modelled condition. 2 The index of wetland condition is a hierarchical index on a 10-point score scale based on six key characteristics that define wetlands, namely wetland catchment, physical form, hydrology, soils, water properties and biota (DSE, 2005). Large wetland areas in parks are unassessed in the most recent dataset. 3 The index of stream condition is based on a 50-point score scale and is made up of five sub-indices describing the condition of a river reach, namely hydrology, streamside zone, physical form, water quality and aquatic life (DEPI 2012). 4 Marine condition based on Parks Victoria’s marine monitoring program and marine report cards which assesses condition of key habitats across multiple parks, as follows: VG = Very Good, F = Fair

35
Native Vegetation
A detailed breakdown of the extent, condition and significance (representation) of each native
vegetation type found in the parks networks (based on Ecological Vegetation Division (EVD)) is
provided in Table 4.2. The parks network contains the largest representation of Alpine Treeless
(75%) and Hummock-grass Mallee (86%) in Victoria. Other native vegetation well represented in
Victoria’s parks include Broombush Whipstick, Coastal, Granitic Hillslopes, High Altitude Wetland,
Lowan Mallee, Rocky Knoll, Saline Wetland and Saltbush Mallee. The average condition of native
vegetation established within park areas is significantly higher (65) than that of vegetation found
outside of park areas (45). The average condition within parks is higher than outside parks in all
native vegetation types.
Table 4.2 Characteristics of ecosystem assets – ecosystem level diversity/biodiversity significance of native vegetation in parks network (% of each Victorian EVD in parks)
Native veg classification Extent (Ha) Average condition score
within parks Average condition
score outside parks Proportion of area
within parks (%)
Alluvial Plains Grassland 9,398 64 47 33%
Alpine Treeless 13,037 79 53 75%
Basalt Grassland 4,760 60 43 4%
Broombush Whipstick 134,296 67 44 62%
Chenopod Shrubland 14,377 69 44 34%
Closed-forest 18,068 78 54 49%
Coastal 40,764 60 45 73%
Damp Scrub 29,535 63 45 33%
Dry Woodland (non-eucalypt)
104,677
63 43 54%
Foothills Forest 64,993 66 45 19%
Forby Forest 270,393 66 44 21%
Freshwater Wetland (ephemeral)
24,398 64 45 39%
Freshwater Wetland (permanent)
57,669 64 44 37%
Granitic Hillslopes 29,148 69 45 61%
Grassy/Heathy Dry Forest 522,093 72 47 32%
Heathland (sands) 357,740 70 46 58%
High Altitude Shrubland / Woodland
265,088 79 47 48%
High Altitude Wetland 2,852 77 46 70%
Hummock-grass Mallee 520,011 63 43 86%
Inland Plains Woodland 28,449 59 43 5%
Ironbark / Box 78,697 68 46 25%
Lowan Mallee 304,866 68 46 69%
Moist Forest 220,324 73 48 27%
Riparian (higher rainfall) 24,077 70 45 24%
Riverine Woodland / Forest 95,983 60 42 41%
Rocky Knoll 53,400 76 53 66%
Saline Wetland 98,501 58 44 60%
Saltbush Mallee 160,719 62 44 67%
Tall Mist Forest 155,245 72 52 35%
Tall Mixed Forest (Eastern) 143,061 72 47 27%
Treed Swampy Wetland 44,023 62 44 28%
Western Plains Woodland 13,528 63 43 20%
Grand total 65 45 38%

36
Wetlands
The following wetland account table describes the change in extent across Victoria’s wetlands over
time. Parks Victoria currently manages about 42% of wetland areas, consisting mostly of 160,000
hectares of permanent and semi-permanent saline wetlands, along with 114,000 hectares of other
wetland types.
Table 4.3 Assets accounts for each wetland type found in Victoria’s parks
Pre-European
wetland area in Victoria (ha)
Current statewide
wetland area (ha)
Area in the parks network (ha)
Proportion of wetlands in the parks network
Year 1750 2010 2010 2010
Deep freshwater marsh 176,601 54,861 26,548 48%
Freshwater meadow 181,246 132,455 38,753 29%
Permanent open freshwater 70,658 177,139 33,277 19%
Permanent saline 155,608 154,192 116,863 76%
Salt works 0 2,012 580 29%
Semi-permanent saline 67,404 70,276 42,755 61%
Sewerage pond 0 3,979 89 2%
Shallow freshwater marsh 127,031 54,605 14,823 27%
Total 778,548 649,519 273,688 42%
Source: Parks Victoria. The slight variation in the total wetlands area, as compared to Table 4.1, is due to differences in the parks data scale and boundaries.
Additional information to be outlined in the parks ecosystem accounts includes the extent of highly
significant ecosystem assets, as defined by international standards. For instance, the parks network
currently sustains almost 60% of all Ramsar wetland areas found in Victoria. The most significant
regions in terms of their wetland extent within the parks network include the Barmah and
Gunbower Forests, Gippsland Lakes, Corner inlet and Western District Lakes.
Table 4.4 Characteristics of ecosystem assets – significance of wetlands in parks network (area and % of area of Ramsar listed wetlands in parks)
Total area of Ramsar
wetlands in parks network (hectares)
Total area of Ramsar wetlands in Victoria
(hectares)
Proportion of current statewide area in parks network (%)
Barmah Forest 29,236 29,317 100%
Corner Inlet 59,218 67,242 88%
Edithvale-Seaford Wetlands 0 257 0%
Gippsland Lakes 24,448 61,126 40%
Gunbower Forest 10,343 20,246 51%
Hattah-Kulkyne Lakes 979 979 100%
Kerang Wetlands 5,745 9,799 59%
Lake Albacutya 5,664 5,665 100%
Port Phillip Bay (Western Shoreline)
and Bellarine Peninsula 7,839 22,637 35%
Western District Lakes 32,626 32,673 100%
Western Port 7,326 59,962 12%
Grand Total 183,424 309,903 59%

37
In terms of marine habitats, parks provide large areas of ecosystems in soft sediments, followed by
sub-tidal reefs and seagrass, which are particularly important to nursery habitats.
Table 4.5 Extent of marine habitats in Victoria’s marine parks
Marine habitat Total area (hectares)
Intertidal reef 2191
Sub-tidal reef 21,812
Soft sediment 70,125
Mangrove 3,435
Saltmarsh 3,775
Seagrass 20,164
Except for intertidal reefs, hectares are measured across marine protected areas and coastal parks. Intertidal reefs that fall
within terrestrial (coastal) parks has not been accurately estimated, but is significantly larger. Source: Parks Victoria.
Habitat for Species
An indicator of ecosystem asset significance is the number of rare or threatened species that are
supported by park ecosystems, and the quality of that habitat. Table 4.6 shows that the parks
network provides the most suitable habitat in the State for many rare and vulnerable species. Based
on an assessment of around 638 of the nearly 3,000 parks and reserves in the parks network, parks
provide around 770 of these species with at least 60% of habitat suitability in the State. Victoria’s
parks offer most suitable habitats in the State (with at least 50% suitability) to a total 888 rare and
threatened species.
Table 4.6 Characteristics of ecosystem assets – species significance (number of species for which parks provide important habitat) in national parks and nature conservation reserves
Threatened species type 2
Habitat importance in selected parks1
Critically endangered
Endangered Rare Vulnerable Not specified Total
80%-100% of best habitat 17 75 241 181 2 516
60%-80% of best habitat 4 34 158 59 2 257
40%-60% of best habitat 7 39 149 72 1 268
20%-40% of best habitat 7 58 152 96 1 314
0%-20% of best habitat 12 51 92 70 1 226
Total 47 257 792 478 7 1,581
Notes: 1 638 parks representing National Parks Act parks and larger nature conservation reserves were selected for
assessment. 2 The number of species for which parks provide important habitat was derived through a combination of
condition and species distribution importance modelling from DEPIs’ NaturePrint.
4.4 Built asset accounts
Parks Victoria currently manages over 28,000 built assets, including 44 visitor centre buildings, 703
shelters, 515 viewing lookouts and several other visitor amenities such as playgrounds, sporting
facilities and bathrooms. In addition, Parks Victoria is responsible for maintaining core infrastructure
to connect Victorian parks, comprising 14,000 km of roads, 3,700 km of walking tracks, 1,213
pedestrian and vehicular bridges and 217 piers and jetties.
The number of built assets managed by Parks Victoria increased from 25,000 to 28,000 over 2010 to
2013, mainly as result of the fire recovery program in a number of parks and included visitor facilities
as well as road infrastructure, such as culverts. Thus, the condition profile of the asset inventory

38
improved due to new assets being established as part of the fire recovery program. The following
built asset accounts from 2010 shows Victorian parks’ capacity to sustain visitor experiences through
its built asset network, as built assets provide input to the provision of cultural services and benefits.
The value of these assets is not listed below, but could be included in a separate standard account.
Table 4.7 Built assets in parks network
Asset category Number of built assets
Condition
Excellent Good Average Poor Very poor
Access 13,153 8.2% 30.2% 47.7% 10.0% 3.9%
Buildings & Services 1,411 7.0% 29.7% 40.3% 15.9% 7.1%
Cultural Heritage Assets 1,467 2.7% 20.7% 63.2% 9.5% 4.0%
Infrastructure Services 2,296 8.3% 46.1% 34.8% 5.9% 4.9%
Landscaped Assets 281 11.4% 33.8% 44.5% 8.5% 1.8%
Maritime & Waterways 1,427 12.9% 27.3% 26.8% 20.1% 12.9%
Visitor Facilities 4,540 11.3% 37.5% 36.0% 9.1% 6.1%
Total 24,575
The built assets include three local ports which make a contribution to the Victorian economy of
$300 million Gross Value Added per annum. While this contribution is not ecologically connected to
marine ecosystem assets managed by Parks Victoria, it is important to acknowledge the natural
features of these ports and associated infrastructure provide space for significant economic activity
on coastal land. For instance, Parks Victoria visitation data indicate these local ports and bays receive
45 million visits every year. Ports management and maintenance issues like dredging could have an
ecological connection, however there is insufficient data to assess these impacts at this stage.
Appendix 3 outlines the economic contribution of the three local ports managed by Parks Victoria.
4.5 Cultural assets accounts
Cultural assets include both the tangible/physical cultural assets of Aboriginal culture as well as the
physical assets of historic heritage. Further work is required to develop a standard set of metrics to
assess the condition of Aboriginal cultural places.
These tables provide a summary of the stock of cultural assets in the parks, which along with the
ecosystem and built assets provide a range of cultural services to park visitors (e.g. recreational
activities, cultural/spiritual connection and social and community cohesion).
Table 4.8 Aboriginal cultural places in the Victorian parks network
Place component Total number of sites Proportion of sites within the parks network
Historical Place 16 0.1%
Non Archaeological Place (intangible) 9 0.1%
Artefact Scatter 4,794 40.5%
Earth Feature 1,089 9.2%
Human Remains 176 1.5%
Object Collection 33 0.3%
Quarry 93 0.8%
Rock Art 131 1.1%
Scarred Tree 3,406 28.8%
Shell Midden 1,929 16.3%
Stone Feature 154 1.3%
Total 11,830
Source: Aboriginal Affairs Victoria

39
Table 4.9 Historical places in the Victorian parks network
Asset category Number of built assets
Condition
Excellent Good Average Poor Very poor
Cemeteries & burial sites 34 0% 9% 47% 9% 6%
Commercial 27 0% 0% 78% 0% 3%
Defence 33 0% 6% 36% 15% 27%
Exploration 45 31% 5% 31% 4% 0%
Government buildings 92 2% 2% 45% 14% 0%
Halls & libraries 15 0% 6% 66% 0% 0%
Huts, houses, homesteads, settlement sites & farms 464 1% 18% 46% 11% 9%
Industrial 1156 0.3% 16% 47% 7% 2%
Memorials 61 8% 21% 38% 10% 3%
Miscellaneous 56 9% 27% 26% 8% 5%
Public utilities 115 3% 31% 30% 4% 4%
Recreation & Gardens 213 6% 22% 31% 9% 9%
Religious 5 0% 0% 80% 20% 0%
Shipping & coastal 164 2% 12% 47% 13% 7%
Transport & communication 85 1% 8.2% 39% 5% 8%
Using natural resources 58 3% 15% 48% 0% 3%
Total 2,631
The following table provides a representation of the significance of historical places found in the
parks network, indicating the type of 145 heritage sites that have been listed thus far on the State
heritage register.
Table 4.10 Extent of listed historical places in the Victorian parks network by historic theme
Historic theme Number of historic places
Accessing & Appreciating Natural Wonders 3
Australian Manufacturing 3
Defending coastal Victoria 3
Dying 5
Governing & Administering Victoria 2
Living in Remote Areas 1
Living in Rural Areas 1
Moving Goods & People 3
Primary production 3
Settlement of Port Phillip 5
Shipping along the coast 16
Using resources - Energy 1
Using Resources - Forestry 6
Using Resources - Mining 81
Other 12
Total 145

40
4.6 Ecosystem service flow account
Ecosystem service accounts report on physical flows of ecosystem services provided to the
beneficiaries, as discussed in Section 3. Each of the ecosystem service flows were assessed using a
systematic approach, involving the analysis of Parks Victoria data or the application of a wide range
of analytical tools (e.g. modelling, spatial analysis, top-down analysis).
The following account table provides the total magnitude of the annual flows of ecosystem services
assessed as part of this project for the whole of the parks network. These quantities were calculated
considering the most relevant group of beneficiaries for which data was available (e.g. in the case of
water services the analysis considered both household and irrigation use). The level of confidence in
the estimates obtained from each assessment is provided at the right hand side, with services in red
requiring more or better data to support the analysis. The table also includes values if parks were
not there (the counterfactual), which highlight the relative impact of not protecting ecosystems on
each ecosystem service. Proxies were included where no suitable measures for service flows could
be found. For example, park areas jointly managed with Traditional Owners do not represent a
service, however it was the only information available to assess indigenous heritage.
Specific accounts for key services could include time series data with a breakdown of suppliers or
users for tourism and water ecosystem services (e.g. by park type, bioregion or regional areas), as
modelled data for these two services allows for a higher level of spatial granularity. For most other
services, a more detailed classification of users (e.g. households, industries) may not be appropriate
or currently feasible due to lack of data.
Following on the statewide summary of ecosystem services, Figures 4.2 to 4.3 provide maps used to
visualise any spatial variation of ecosystem service flows across the parks network. These maps
indicate that large carbon stocks are concentrated in parks around northeast Victoria, while park
areas with the largest number of species in suitable habitats include the Mallee, Grampians and
Central Highlands, Murray East and the High Country regions. Except for the Mallee, these regions
also present the largest number of park visits per year, along with other smaller coastal parks.

41
Table 4.11 Ecosystem service flows account – quantity of services or indicator
Service Quantity delivered by Victorian parks
Quantity in the counterfactual
Units Sources
Provisioning services
Water supply 3,392,000 4,244,000 ML of water runoff p.a. for nine highest yielding parks
MJA (2014)
Honey supply 1,119 - 1,615 0 Tonnes of honey supplied p.a. DSE (2012)
Regulating services
Water purification:
Pollution load (Nitrogen) 31,425 213,559 Kg of Nitrogen p.a.in metro waterways
MJA (2014)
Sediment load 4,165 50,960 Tonnes of solids entering in regulated rivers p.a. for nine highest yielding parks
MJA (2014)
Coastal protection 285 285 Km of protected shoreline near coastal communities (proxy)
PV analysis, unpublished
Flood control/protection:
Stormwater runoff in metro parks 34,372 74,162 ML of stormwater released in metro waterways p.a.
MJA (2014)
Peak flows in selected non-metro parks 49 - 3,159 54 - 3,926 Range of 100-year ARI peak flows (m3/s) across selected parks
MJA (2014)
Carbon storage:
Land ecosystem assets 270,000,000 Not estimated Tonnes of carbon stored in parks DEPI (2014)
Marine ecosystem assets (mangroves, saltmarsh, seagrass habitats)
850,000 Not estimated Tonnes of carbon stored in Marine Protected Areas in Victoria
Deakin Uni. (2014)
Carbon sequestration (from revegetation) 21,000
0 Tonnes of carbon sequestered p.a. from programs in parks
PV data, unpublished
Urban cooling Not estimated Not estimated Temperature differential -
Air quality Not estimated Not estimated Quantity of air pollution -
Soil quality Not estimated Not estimated Soil health index -
Soil stability Not estimated Not estimated Tonnes of soil erosion -
Pollination 1,235 - 1,700 0 Honeybee sites (proxy) DSE (2012)
Pest and disease control Not estimated Not estimated Abundance and diversity of insectivorous birds and bats
-
Habitat suitability for threatened species (measured across over 600 parks)
888 Not estimated Nr of threatened species where parks 50-100% habitat suitability
DELWP analysis, unpublished
Maintenance of genetic diversity 4,431 flora 1,081 fauna 333 marine
Not estimated Nr of species recorded DELWP (Victorian Biodiversity Atlas)
Maintenance of nursery populations 3,848 Not estimated Tonnes of fish stock enhanced p.a. DELWP & PV analysis
Cultural services
Recreation opportunities:
Enjoyment 33,000,000 and up to 51,000,000
45,000,000
0 Not estimated
Nr of visits to parks p.a. Nr of visits to bays p.a.
PV data, Visitor number monitor
Tourism 16,900,000 0 Nr of tourist nights attributable to parks p.a.
DAE (2014)
Health 23,091,850
1,532,090 (180,000)
0
0
Nr of visits to parks p.a. with physical exercise as main purpose Nr of Victorian visitors p.a. going to parks to do physical exercise (nr of regular visitors for physical exercise)
PV & DELWP analysis, unpublished, Parks visitation monitor
Education opportunities 183,000 Not assessed Nr of participants in education programs p.a.
PV annual report
Scientific research opportunities 215 Not assessed Nr of research permits p.a. PV data, unpublished
Amenity 12,000 Melbourne 85,000 Other
0 Nr of residential properties immediately adjacent to parks
PV data, unpublished
Opportunities for cultural connection 648,513 Not estimated Area of joint management with Traditional Owners (proxy)
PV data, unpublished
54%-69% Not estimated % Victorian households who value park-related historical heritage
PV data, unpublished
Social & community cohesion 211,000 0 Nr of volunteering hours on park related projects p.a.
PV data, unpublished
Species/ecosystem existence (non-use value to protect endangered species)
Not estimated Not estimated Nr of persons who value the species/ecosystem existence
-
Relative levels of confidence in measurement: higher medium lower
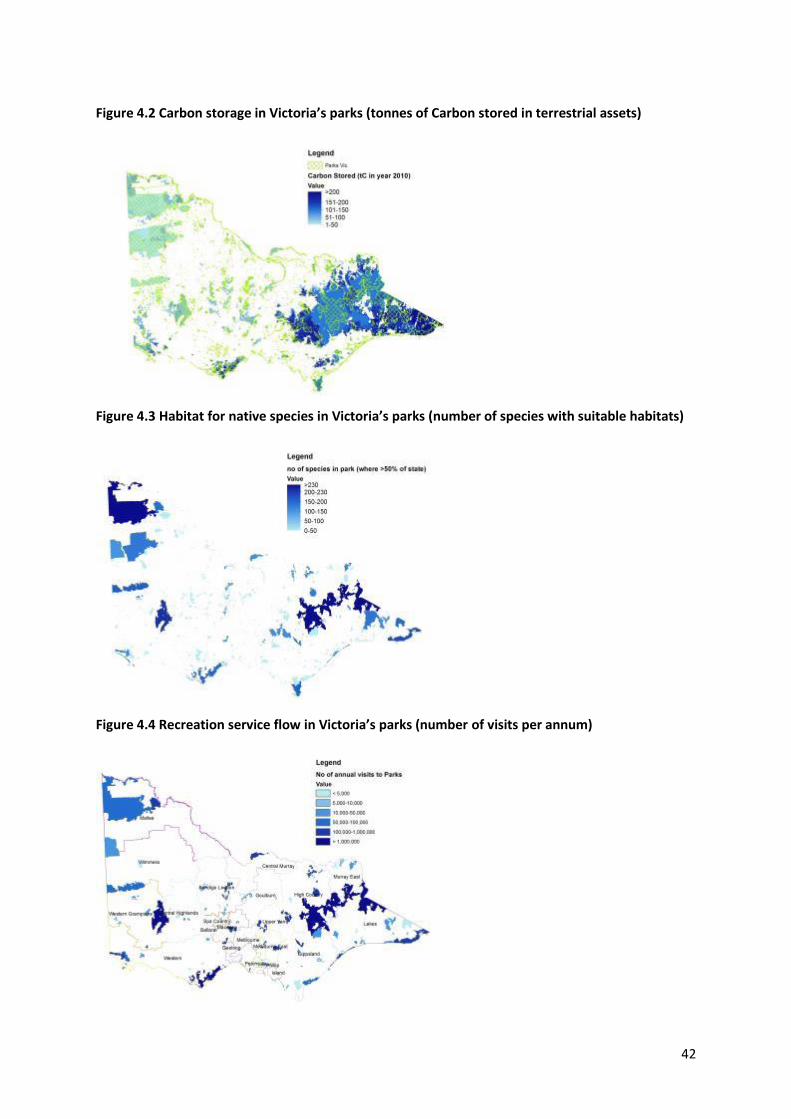
42
Figure 4.2 Carbon storage in Victoria’s parks (tonnes of Carbon stored in terrestrial assets)
Figure 4.3 Habitat for native species in Victoria’s parks (number of species with suitable habitats)
Figure 4.4 Recreation service flow in Victoria’s parks (number of visits per annum)

43
4.7 Case study: Ecosystem assets and services in the Mallee parks
This section shows how asset accounting information can be used to monitor environmental
outcomes, particularly in relation to recent native vegetation restoration programs in the Mallee
parks. This case study further provides an overview of key ecosystem services provided by these
parks, illustrating in this way the application of environmental-economic accounts as a knowledge
base to assist park management and the evaluation of environmental programs.
Background about the Mallee parks
The Mallee region of north-west Victoria has seen substantial land use change over the last 150
years. Prior to the 1990s extensive areas of public land containing significant semi-arid woodland
habitats in the Mallee region had been subject to grazing leases, and the Victorian Government
integrated additional areas into the Victoria’s national parks network in 1991 and terminated any
grazing tenures in 1996. These areas had been subject to severe impacts from not only stock grazing,
but also from rabbits and overabundant kangaroos. This process followed the recommendations
provided by the Land Conservation Council Reviews of 1977 and 1989. The group of Mallee national
parks for this case study consists of the Murray-Sunset National Park (over 665,000 ha), the
Wyperfeld National Park (about 360,000 ha) and the Hattah-Kulkyne National Park (about 50,000 ha).
The rationale and objectives for restoring native vegetation (and particularly semi-arid woodlands)
was developed in the “Restoring the Balance” program which focussed on regeneration of native
vegetation through reducing total grazing pressure. More recently a program of revegetation has
commenced through the Mallee Biofund project, a Commonwealth funded initiative. This is being
undertaken in conjunction with other State funded restoration management programs (e.g. rabbits
and overabundant kangaroos) including partnerships with the Mallee Catchment Management
Authority.
Table 4.12 presents the change in extent and condition across main native vegetation groups in the
three major Mallee parks. The table provides an overview of the status of the key ecosystem assets
across the three relevant parks over 2010 and 2013, measured through a qualitative Parks Victoria
State of the Parks score36. With the ongoing development of monitoring programs, more frequent
data will be available and it could be possible to identify the changes in extent and condition that
can be attributed to natural causes, land management measures or other human activity.
The Mallee parks include a wide range of vegetation types from riverine woodlands in the north, to
large areas of Mallee Eucalypt to semi-arid dry non-Eucalypt woodlands. While extensive areas of
Mallee eucalypt habitats are in relatively intact condition, most of the management effort has been
directed to the dry non eucalypt woodlands which have been in poor condition due to a legacy of
past land use and grazing pressure. At a broad scale, over the past decade the three national parks in
the Mallee region have seen some improvement in the condition of native vegetation. These
changes do not relate to changes in the size of native vegetation areas, but to the improvement of
land cover quality. Previously this was mainly achieved by controlling grazing from introduced
rabbits, goats and overabundant kangaroos. The current management program is introducing both
active revegetation of semi-arid dry woodland in addition to ‘passive’ restoration through reduction
of grazing pressure by goats, rabbits and kangaroos.
36 The State of the Parks assessment is a qualitative assessment by park managers based on best available knowledge. In this case the overall assessment is based on results of field based monitoring and remote sensing condition assessments.

44
Mallee Ecosystem extent and condition
Table 4.12 summarises the extent and condition scores for each of the three national parks between
2010 and 2013. Across all Mallee native vegetation Park Victoria’s assessment shows that in the
Hattah-Kulkyne and Wyperfeld National Parks only riverine woodland vegetation appears to have
improved from poor to fair categories, while in the Murray Sunset National Park, changes across
most types of native vegetation and freshwater wetlands are observed over the same period. Since
current activities of the Mallee Restoration Program have focused on dry woodland areas, the
condition changes that can be attributed to the Program at this stage should be linked to this specific
vegetation type.
Table 4.12 Changes in stocks of ecosystem assets for the Mallee parks
Mallee Parks Hattah - Kulkyne
National Park Murray - Sunset
National Park Wyperfeld National
Park
Asset extent and condition Extent (ha) PV score Extent (ha) PV score Extent (ha) PV score
OPENING BALANCE (2010) Native vegetation
Dry-woodland (non-euc) 6,546 fair 65,752 poor 16,348 poor
Riverine woodland EVDs 10,349 poor 13,577 poor 3,030 poor
Hummock grass Mallee EVDs 22,976 fair 380,337 good 64,162 good
Saltbush mallee EVDs 5,188 fair 141,591 fair 373 n/a
Broombush whipstick n/a n/a 16,713 fair 57,255 good
Chenopod shrublands n/a n/a 11,769 fair n/a
Lowan mallee n/a n/a n/a n/a 138,427 good
Heathlands n/a n/a n/a n/a 76,615 good
Wetlands
Saline wetlands 35
13,678 good 483 n/a
Freshwater wetlands 1,777 fair 10,280 poor n/a n/a
Other 3,123
11,856
3,356 Total by park 49,994 4.44 665,553 6.16 360,049 7.21
Improvements: Natural regeneration - - - - - -
Improved management - 0.55 - 0.99 - 0.02
Reductions:
Natural losses, natural events: fires
40,000 not assessed
Human activity - - - - - -
CLOSING BALANCE (2013)
Native vegetation Dry-woodland (non-euc) 6,546 fair 65,752 fair 16,348 poor
Riverine woodland EVDs 10,349 fair 13,577 fair 3,030 fair
Hummock grass Mallee EVDs 22,976 fair 380,337 good 64,162 good
Saltbush mallee EVDs 5,188 fair 141,591 good 373 n/a
Broombush whipstick n/a n/a 16,713 good 57,255 good
Chenopod shrublands n/a n/a 11,769 good n/a n/a
Lowan mallee n/a n/a n/a n/a 138,427 good
Heathlands n/a n/a n/a n/a 76,615 good
Wetlands
Saline wetlands 35
13,678 good 483 n/a
Freshwater wetlands 1,777 fair 10,280 fair n/a n/a
Other 3,123 11,856 3,356 Total by park 49,994 5.00 665,553 7.16 360,049 7.23
Sources: Extent data is from DEPI 2013 data. Parks Victoria State of the Parks score (PV score) is a qualitative assessment undertaken onsite by park managers based on best available information. The total park score is the weighted average of the data provided for each vegetation type in a ten-point scale. Blank fields represent modelling data or measurements that could not be retrieved.

45
Ecosystem services provided by the Mallee parks
The following account presents an overview of parks’ ecosystem service flows in the Mallee region.
Key services provided by the Mallee parks include carbon storage and sequestration, soil stability,
habitat for threatened species, along with recreation, tourism, scientific research and cultural
connection, particularly relevant to Traditional Owners.
The main provisioning service from the parks in the Mallee region that can be linked to agricultural
production is honey production. The three national parks contain about 237 hectares with apiary
sites. Of this, the Murray Sunset National Park accounts for over 151 hectares, which is the largest
area with apiary sites across all parks in Victoria. There is some debate as to the effect of the land
use designation as a park on honey production with some arguing that honey production as an
ecosystem service could be inconsistent with the primary conservation objectives of the park even
though it is a “permitted use”, while others other argue the park contributes significantly to honey
production due to its native vegetation being conserved.
The Mallee parks provide a number of important regulating services including soil stability, flood
regulation, water filtration and carbon storage and sequestration (mainly because of the large extent
of area available, which is approximately one million hectares of native vegetation). In flood
regulation, both the Murray-Sunset and Hattah-Kulkyne National Parks significantly reduce flood
peaks (2.2 and 1.6 times compared to an alternative land use). The Mallee Parks provide large areas
of native vegetation in north-west Victoria and play an important role in stabilising the soil of this
region. Parks Victoria plans to undertake further work to quantify the role of the improved native
vegetation in the Mallee parks in minimising soil erosion and loss.
The Mallee parks offer further intermediate services, with the Murray Sunset NP providing at least
80% of the State’s best habitat for 38 native species that are considered rare or threatened.
Finally, while the total number of tourist visits to the Mallee parks is relatively small in a statewide
context, it provides important remote recreation and tourism experiences as semi-arid parks.
Table 4.13 Service flows account for the Mallee parks (annual flows)
Ecosystem service flows
Mallee Parks
TOTAL Hattah-Kulykne National Park
Murray Sunset National Park
Wyperfleld National Park
Provisioning services Honey production [hectares with apiary sites] 52 151 34 237
Regulating services Carbon storage [tonnes carbon] 2,453,886 20,880,588 9,746,048 33,080,521
Carbon sequestration [tonnes C02 et/yr1] - revegetation (300 ha) - restoration(20,000 ha)
760 (209)
14,600 (4,022)
760 (209)
14,600 (4,022)
760 (209)
14,600 (4,022)
2280 (628)
43,800 (12,066)
Soil stability and quality [land area] Limited data Limited data Limited data -
Habitats for threatened species [nr of species having suitable habitats]
13 112 11 136
Cultural services Opportunities for cultural connection [hectares co-managed with TO]
49,994 665,553 360,049 1,075,596
Recreation enjoyment [nr of visits] 118,603 76,438 52,142 247,183
Tourism [nr of visitor nights] 278,731 179,638 122,540 580,908
Scientific research [nr of research permits] 12 15 15 20 1 Estimate of sequestration rate of mallee ecosystems is 7.6 C02 t/ha/yr for revegetation and 0.7 T C02 e-/ha/yr for restoration

46
While for this project there has not been a longer term assessment of historical or empirical data to
assess the impacts of improving the quality of native vegetation on these service flows, further
assessment of long term datasets could be undertaken. Once this data becomes available it would
be possible to link the additional investment in restoration programs with changes in environmental
outcomes and ecosystem services, in the short and longer term. To do this, the accounts could
incorporate values of the linkages between the expected improvement in the condition of park
ecosystems and the improvement in the services flows they deliver. This would require measuring
key indicators of ecosystem service flows in field experiments to assess the effects of specific
interventions (i.e. identifying control and treatment groups) or using advanced modelling tools, such
as EnSym37, to assess the outcomes of specific management scenarios.
A complete analysis of trends over time should also identify changes in ecosystem flows due to other
interventions that are not related to the programs of works by Parks Victoria (e.g. natural disasters
or change in land use in surrounding regions) or due to shifts in demand (e.g. changes in regulation
leading to restricted access to park sites). At this stage of the restoration works in the Mallee parks,
it was not possible to identify other intervening programs, economic activities or demand driven
changes in the provision of ecosystem services.
4.8 Case study: Ecosystem assets and services in the Alpine National Park
The Alpine National Park was originally established in 1979 and now covers an area of 660,550
hectares. The nationally significant park covers five bioregions, including extensive alpine and sub-
alpine, wet forest and dry forest ecosystems and contains the headwaters of most of eastern
Victoria’s river systems, including eight heritage rivers. The park has many places of Aboriginal
cultural and historic heritage significance and is a major tourism destination. While no area of the
park is currently under formal joint or co-management agreements with Traditional Owners, the
Victorian Alps Traditional Owners Reference Group advises Parks Victoria on a range of park
management and cultural issues.
The table below provides a summary of the extent and condition scores across the Alpine National
Park between 2010 and 2013. Over this period there was no reclassifications of land or other
reductions or additions in the boundary areas of the Alpine National Park. The shares of the extent
for each native vegetation type relative to the parks network total area and the State did not change
over the three years either. By contrast, there appears to be a significant improvement in the
condition of native vegetation, as the overall condition of native vegetation increased from 5.3 in
2010 to 6.3 in 2013 (this is an increase of 16% over three years). However these results are indicative
only, as the assessment has used qualitative metrics, based on available information. Nevertheless
the improvements in condition need to take into account preceding work on recovery from major
fires (2003, 2006) and ongoing restoration work undertaken in alpine wetlands.
37 The Environmental Systems Modelling Platform developed by the Department of Environment and Primary Industries

47
Table 4.14 Changes in stocks of ecosystem assets for the Alpine National Park
Alpine National Park Asset extent and condition
Extent (ha) % in parks network
% of park EVD in State
Condition score (2010) PV score (2013
OPENING BALANCE (2010) Native vegetation
Alpine Treeless 12,038 92.3 71.4 6.9
Closed Forest 29 0.2 0.1 5.5
Foothills Forest 2,890 4.5 0.8 5
Forby Forest 123,424 45.7 9.5 4.5
Freshwater wetland (permanent) 278 0.5 0.2 7
Grassy /Heathy Dry Forest 180,889 34.7 10.9 4.7
High Altitude Shrubland/woodland 222,648 84 41 6.0 High Altitude wetland 1,959 68.7 49.7 6.8 Moist forest 88,079 40.0 10.3 5.5 Riparian (high rainfall) 6,401 26.6 6.5 4.9
Ricky Knoll 9,153 17.1 11.2 5.0 Tall mist Forest 12,087 7.8 2.6 5.3 Tall mixed Forest 5 0 0 5.0
Treed Swampy Wetland 374 0.9 0.2 4.7
Total by park 660,395 5.3
Improvements: Natural regeneration - Not assessed
Improved management - Not assessed
Reductions:
Natural losses, natural events - Not assessed
Human activity - Not assessed
CLOSING BALANCE (2013)
Native vegetation
Alpine Treeless 12,038 92.3 71.4 G/I
Closed Forest 29 0.2 0.1 G/I
Foothills Forest 2,890 4.5 0.8 F/I
Forby Forest 123,424 45.7 9.5 F/I
Freshwater wetland (permanent) 278 0.5 0.2 G/M
Grassy /Heathy Dry Forest 180,889 34.7 10.9 F/I
High Altitude Shrubland/woodland 222,648 84 41 G/I High Altitude wetland 1,959 68.7 49.7 G/M Moist forest 88,079 40.0 10.3 G/I Riparian (high rainfall) 6,401 26.6 6.5 P/D Rocky Knoll 9,153 17.1 11.2 G/M Tall mist Forest 12,087 7.8 2.6 G/I Tall mixed Forest 5 0 0 F/I Treed Swampy Wetland 374 0.9 0.2 U
Total by park 660,395 6.3
Sources: Parks Victoria data. Qualitative condition acronyms: excellent (E), good (G), fair (F), poor (P), unknown (U). Parks Victoria State of the Parks score (PV score) is a qualitative assessment undertaken onsite by park managers based on available information. The total park score is the weighted average of the data provided for each vegetation type in a ten-point scale. Blank fields represent modelling data or measurements that could not be retrieved.
The table below illustrates a service flows account for the Alpine National Park. The park has by far
the largest mean annual water flow of any Victorian park at 2,631 GL per annum and supplies water
to a wide range of users including local towns and downstream irrigators. Thus, the parks
watersheds provide a major water and purification service to the community.
The park provides the largest carbon sink of any Victorian park, storing more than 70 million tonnes
of carbon or more than a quarter of the carbon of the parks network. It plays a significant role for
threatened species by providing at least 60% of the best habitat in the State for 238 species.

48
The Alpine National Park contributes to 70% of the number of tourist visitor nights in the Victoria’s
High Country tourism region, which is the third largest region providing park-attributable
expenditure as a share of total tourism. Around 20 licensed tour operators use the park.
Honey supply is another relevant service provided by this national park, particularly over summer
months. However, no production data from apiary sites at the subregional level was available.
Although this National Park contains a relatively small area with bee sites (28 hectares as compared
with a total of 3,742 hectares across the parks network), the total production from this region may
be significant due to its climate and native vegetation. The apiary industry based in this region also
provides pollination services, which are important for fruit production and can benefit other field
crops such as canola and sunflowers, along with reseeding of pastures.
Table 4.15 Service flows account for the Alpine National Park (annual flows)
Ecosystem service flows Total Alpine National Park
Provisioning services Honey production [tonnes of honey products] No data available
Water supply (regulated) [ML] 1,079,000
Water supply (unregulated) [ML] 1,547,000 Regulating services
Carbon storage [tonnes carbon] 70,582,949
Carbon sequestration [tonnes carbon] No data available
Sedimentation [tonnes p.a.] 2,940,000
Soil stability and quality [land area] No data available
Pollination [hectares of land with apiary sites] 28
Habitats for threatened species [nr of species having suitable habitats] 238 Cultural services
Recreation enjoyment [nr of visits] 1,320,618
Tourism [nr of visitor nights] 677,555
Scientific research [nr of research permits granted] 20
Social & community cohesion [nr of volunteering hours] 5400

49
5. Valuation of ecosystem service benefits from Victoria’s parks
Once environmental assets are fully described and the physical flows of ecosystems services are
quantified, valuation can be used to provide measures of non-market benefits in monetary terms.
These economic measures are very useful to communicate diverse benefit values across a range of
stakeholders and decision makers.
This section discusses the potential use of valuation measures, followed by a description of the
approach used to select relevant valuation techniques and derive the value of non-market benefits,
and concludes with a summary of all the ecosystem services assessed for Parks Victoria. Parks’
benefits are initially described in terms of physical units (e.g. avoided nitrogen in metro waterways)
and after the valuation techniques are applied, welfare values for the provision of ecosystem
services in monetary terms can be provided (e.g. the value of water filtering services).
5.1 Purpose of valuation
As discussed in Section 2, economic valuation can be used for a variety of purposes, particularly in
relation to environmental impact assessments, evaluations of investment programs, policies and
resource allocation affecting non-market goods or services. Depending on the purpose of the
valuation, two main types of benefit measures can be required:
Total values – for example to indicate the size of total non-market benefits associated with
current demand levels for an ecosystem service, or alternatively the total magnitude of
externalities currently being experienced. These values are most useful for improving
awareness and long-term strategic decision-making on competing uses of natural resources.
Marginal values – indicate the incremental benefit/cost expected from an improvement or a
reduction in the delivery of ecosystem services (e.g. as a result of policy or projects leading
to environmental improvements or losses). These values are useful to inform prioritisation
of policy/project options and decision-making, such as through cost benefit analysis.
In the first phase of this project we have focused on assessing total values for the benefits of
ecosystem services provided by Victorian parks. Assessment of marginal benefits is most appropriate
as part of the development of specific business cases relating to environmental improvements or
changes achieved from major decisions and/or investment proposals for management of parks
ecosystem and built assets, which is another potential application outlined in Section 6.
5.2 Methodology to value benefits from ecosystem services
The systematic analysis of ecosystem services and valuation of their benefits can be initiated once
the purpose of the valuation has been defined and agreed. This section outlines the main steps
followed to value the benefits of ecosystem services provided by parks, summarised in Figure 5.1.
STEP 1 Identify the ecosystem service and beneficiary
The first step is to identify the ecosystem service and beneficiary of the flow of the ecosystem
service, which should be aligned with the ecosystem service accounts discussed in Section 4. This is
useful context for any valuation work as it helps to ensure a consistent definition of final ecosystem
services contributing to human wellbeing, as defined by the CICES classification system, and any

50
double counting issues are avoided or minimised. It also helps to clearly communicate to
stakeholders about the linkages between ecosystems to the economy and community, supported by
a clear description of the benefit of the ecosystem services and who is receiving it.
STEP 2 Estimate current flows of ecosystem services
The next step is to estimate the current flow of service in physical units. For some ecosystem
services identifying the flow of services is fairly straightforward. For example the provisioning service
of water can be measured by the quantity of water supplied, the regulating service of carbon storage
as the amount of carbon stored and the cultural service of recreation through the number of visits.
These estimates of the amount of the flow (reported in the service flow accounts) can then form the
basis of any monetary valuation exercise.
Figure 5.1 Steps to value ecosystem services
For services like maintenance of genetic diversity or species existence there is no easy measure
available. In these cases estimation of service flow is much more complex and is likely to require
input from economists, ecologists and other relevant experts. For this project we have used proxy
indicators of service flow for some services where monetary estimation is not feasible. The proxy
indicators are based on the characteristics of ecosystem assets that are known to be important in
the provision of those services. While this does not provide a platform for monetary valuation, it
does offer a starting point for considering their significance in providing benefits to the community.
STEP 3 Identify a realistic counterfactual
The counterfactual describes the situation if the parks did not exist and were some other land use.
The selection of the counterfactual is a critical step that will define the level of net benefits delivered
to society as a whole. The counterfactual needs to be consistent across all ecosystem services and
should be realistic and reflect the next most likely use of land.
In the context of this project, the valuation consists of comparing the outcomes of ecosystem
services under current parks managed land versus the counterfactual that in the absence of park
land use, the land would have not been protected (i.e. private uses would have been allowed). More
specifically for metropolitan parks, the counterfactual is that parks land would have been used for
51
residential developments38, while in national and State parks the counterfactual is that parks land
would be used for low-productive agricultural uses such as grazing.
The discussion for the selection of a counterfactual considered a range of diverse alternative land
uses, but the one described above was found to be the most appropriate for the purpose of this
study. For example, changes to intensifying forestry uses are not considered, as it is unlikely that this
shift would happen widely across the State and the relevant outcomes would need to take into
account time lags in forest development.
For the purpose of this work, the analysis of the counterfactual seeks to assess parks ecosystem
service benefits for which a partial analysis of the effect of changing land use on a specific ecosystem
service is needed. We acknowledge that this approach does not provide a complete view of the total
cost or benefits achieved from projects/programs involving land use changes.
If the purpose of this project was to undertake a full assessment of projects/programs involving land
use changes, the analysis of the projects/programs would need to take into account the value of all
relevant additional costs and benefits (including externalities) arising from the alternative land use
and attributable to the project/program. For example, in the case of grazing, additional costs would
include land preparation and additional benefits would include the value of cattle/sheep and their
by-products. In the case of residential developments, additional costs would include transactions of
title transfers and benefits would include the value of properties built.
STEP 4 Choose appropriate valuation method/s
A range of valuation techniques is available, as discussed in Section 2.3.3. Selecting the right
technique to value each ecosystem service will depend on a number of factors:
the motivation for the valuation
the ecosystem service (some techniques are suited to particular types of ecosystem services)
the type of economic and environmental data available
the time and budget available
the availability of experienced practitioners
Typically provisioning services can be valued using a market-based method such as the productivity
approach. For example, deriving the benefit of timber supplied from a forest from its market price.
The first preference for valuation is often a market-based method as the values can be directly
observed in markets and there is greatest confidence in the outcomes. They can also be widely
applied in cost-benefit analyses and for deriving exchange values for accounting purposes.
Regulating services are often valued using a replacement cost method. For example, deriving the
benefit of water purification provided by a forested catchment by estimating the cost of replacing
this service. In other words, the replacement cost method requires the selection of an alternative
substitute that could provide an equivalent service at the same level.
A wide range of types of techniques is used to value the benefits of cultural services. Specific
techniques are suitable for some cultural services (such as the travel cost method39 for recreation
38 Normal density development (500-800 sq meter lots)

52
and the hedonic price method40 for amenity). Cultural services involving non-use values require
stated preference methods such as contingent valuation or choice modelling.
Note that most techniques for the estimation of benefits involving consumer’s willingness to pay –
for example using the travel cost method or stated preference methods – are not suitable for
deriving exchange values for current accounting frameworks. There is potential to use some
techniques including stated preference to describe a demand curve and then use assumptions or
other information to define a supply curve and hence identify an exchange value. For cultural
services this is a promising avenue.
If no primary data are available for the valuation, benefit transfer could be used. Any type of
ecosystem service can be valued using benefit transfer as long as certain conditions are met. The
conditions that need to be satisfied for benefit transfer to be valid include41:
The value from the original study site needs to be theoretically and methodologically valid
The beneficiaries near the study and policy sites must be similar
The difference between baseline ecosystem conditions and extent of ecosystem change must
be similar across the study and policy sites
The study and policy sites must be similar in terms of environmental characteristics (including
size)
The distribution of property rights and other institutions must be similar across sites.
A number of databases of ecosystem valuation studies exist including the Canadian Environmental
Valuation Reference Inventory42; the Ecosystem Service Valuation Database43; the Earth Economics:
Ecosystem Valuation Toolkit44; and the Catalogue of Assessments on Biodiversity and Ecosystem
Services45.
More than one valuation method can be used to derive an estimate. This allows cross checking of
results and provides greater confidence in the accuracy of the estimated value. However, this is only
valid if both applications are measuring according to the same value concept. Benefit transfer can be
particularly useful to build confidence in the estimation of the order of magnitude of a value or impact.
STEP 5 Derive benefit values
Most derivations of the benefits of ecosystem services will require advice from an experienced
practitioner. There are various manuals and guidance materials available covering best practice
techniques for each valuation method46.
39 The travel cost method uses survey information on visitor travel mode, distance and time and other travel expenditure to impute utility derived from recreation. 40 The hedonic price method derives values for amenity and the aesthetic qualities of environmental assets by observing
how another related market changes in value due to proximity to such assets (e.g. real estate values changing in proximity to parks). 41 World Resources Institute 2014, Coastal Capital: Ecosystem Valuation for Decision Making in the Caribbean. 42 www.evri.ca 43 www.es-partnership.org 44 www.esvaluation.org 45 catalog.ipbes.net 46 See for example: Eftec 2009, Valuing Environmental Impacts: Practical Guidance for the Use of Value Transfer in Policy and Project Appraisal, prepared for UK DEFRA; D. Pearce, G. Atkinson, & S. Mourato, Cost-Benefit Analysis and the

53
There are two key issues of particular relevance to valuation of provisioning services that need to be
taken into account when using current market prices:
Current market prices may overestimate the benefits from ecosystem services to the extent
that any additional human-provided inputs also contribute to the benefits; and
Current market prices may underestimate the benefits from ecosystem services to the extent
that market conditions and regulatory policies allow ecosystem degradation.
Monetary valuation of benefits of ecosystem services using market prices should recognise and
where possible adjust estimates to take these factors above into account.
In using replacement costs for regulating services it is important to ensure that the alternative
considered provides the same services; the alternative is the next best least cost option and there is
evidence that the service would be demanded by society if it was provided.
To effectively use stated preference techniques ecosystem services and expected changes must be
described in terms that people relate to and the payment vehicle must be believable.
The steps involved in benefit or value transfer include:
Understand the ecosystem service to be valued at the policy site and gather information on the
population affected.
Identify relevant studies that could potentially be used for benefit transfer.
Assess available studies for their quality and applicability.
Transfer the value measures either using a single value, function representing the relationship
between value and site conditions, or meta-analysis function where the relationship is derived
from multiple study sites.
Determine the population and spatial extent over which values at the policy site are
aggregated.
Adjust prices for inflation and purchasing power parity if using international studies.
STEP 6 Recognise limitations/uncertainties and consider the need for future research
It is important to recognise limitations and uncertainties associated with the estimated values and
describe all judgements and assumptions and their potential impact on the values derived.
In considering the type of future research to fill gaps or improve confidence it is important to
consider data availability, measurement issues, and the state of play of current knowledge in
determining how the ecological production of ecosystem services translates into economic valuation
of these benefits.
The Department of Treasury and Finance guidance on economic evaluation for business cases
recognises that deriving monetary values through primary research can be resource intensive. The
guidance advises that the additional effort and expense incurred in assigning monetary values to
costs and benefits should reflect the likely size of those impacts.
Environment: Recent Developments, OECD, Paris, 2006; HM Treasury 2011, The Green Book: Appraisal and Evaluation in Central Government, TSO, London.

54
Table 5.1 Valuation of ecosystem services in Victoria’s parks
Ecosystem service Measure of service flow Type of value Approach to valuation Priority for Parks Victoria
Confidence in monetary valuation
Provisioning goods
Water supply Quantity of water flows Direct use value Replacement cost of supplying water High High
Honey products Quantity of honey supplied Direct use value Producer surplus for honey production Medium High
Regulating services
Water purification/filtration Quantity of sediment, nutrients and pollutants retained c/w alternative land use
Indirect use value Replacement cost of water purification High High
Flood /stormwater regulation Impact on flood peaks c/w alternative land use
Indirect use value Replacement cost of flood control infrastructure High High
Climate regulation- carbon storage and sequestration
Quantity of carbon stored; Quantity of carbon sequestered
Indirect use value Indicative price under national emission reduction fund
High High
Climate regulation-local climate-urban cooling
Difference in temperature between park areas c/w non parks
Indirect use value Avoided health costs; avoided cost of energy consumption
Medium Medium
Coastal protection Area of coastal habitats providing protection to communities
Indirect use value Replacement cost of coastal protection infrastructure or restoration
High Medium
Air quality regulation Quantity of pollutants/particulates absorbed by vegetation
Indirect use value Avoided health costs of air pollution based on population exposed
Medium Future
Soil quality and stability Soil health index; Quantity of soil loss/ erosion avoided c/w alternative land use
Indirect use value Avoided costs of land degradation and rehabilitation costs
Medium Future
Pollination and seed dispersal Number of apiary sites in parks
Indirect use value Consumer and producer surplus of agricultural crops affected by pollination
High Future
Pest and disease control Diversity and abundance of insectivorous birds
Indirect use value Avoided loss of production or increased value of crops
Medium Future
Habitats for species Condition and representation of habitats
Indirect use value Non-monetary indicator: % of best habitat in the State for rare and threatened species
High High
Maintenance of nursery services Area of nursery habitats; enhancement of biomass
Indirect use value Benefit transfer (increased productivity in commercial fishing)
Medium Medium
Maintenance of genetic diversity Significance and representation of rare and threatened species
Indirect use value Non-monetary indicator: % of best habitat in the State for rare and threatened species
High Medium
Cultural services
Recreation Number of visitors; Index of satisfaction; Index of personal benefit
Direct use value Benefit transfer (travel cost method for enjoyment)
High High
Number of ‘park tourists’ (tourists contribution to State and regional employment attributable to parks);
Direct use value Difference in the contribution to economic activity attributed to method and input/output analysis, productivity method, stated preference methods
High High

55
Ecosystem service Measure of service flow Type of value Approach to valuation Priority for Parks Victoria
Confidence in monetary valuation
Number and proportion of visitors doing physical exercise; Number and proportion of parks visitors undertaking relaxation activities
Direct use value Avoided costs of physical inactivity attributable to activity in parks Mental health metrics
High
High
Medium
Low
Landscape and neighbourhood amenity
Number of neighbouring properties, average distance to parks
Indirect use value Benefit transfer (hedonic price approach or transfer of hedonic functions)
High Medium
Scientific research and education Number of participants in educational experiences in parks
Direct use value Productivity method Medium Low
Number of research programs in parks
Direct use value Productivity method High Low
Cultural and spiritual connection Area of joint and co-managed land with Traditional Owners; social capital measures
Direct use value Productivity method High Low
Community demand for heritage conservation
Non-use value Benefit transfer (willingness to pay for heritage conservation)
Medium Medium
Social cohesion and sense of place Number of volunteer equivalent FTEs
Direct use value Shadow price of volunteering time; other social capital metrics
High Low
Species existence Significance and representation of rare and threatened species in parks
Non-use value Stated preference methods: willingness to pay for species existence
High Low
Insurance Condition of park ecosystems Option value (use value) and altruism and bequest values
(non-use values)
Stated preference methods: willingness to pay for biodiversity and ecosystem resilience
Medium Low
Notes: The approach to valuation column includes either the approach used for this study or the approach generally used to value the benefits of the service (in italics)

56
5.3 Ecosystem service benefits from Victoria’s parks
Table 5.2 presents a range of measures in monetary terms or indicators used to value the services
provided by Victoria’s parks (details on how these values are derived are provided in Appendix 2).
The purpose of this table is to report consistently on the benefits of ecosystem services identified
through this project in terms of community welfare (listed in the first column, shaded). Additional
information using economic measures of park related economic activities (e.g. gross value of
production (GVP) and value added to the Gross State Product (GSP)) is also listed where this
information was available. Only monetary values under the same column may be additive.
As discussed in Section 3, the benefits are mainly in relation to the welfare gains generated to society
(to both producers and consumers) from protecting parks ecosystems or managing it as land for
conservation, as compared to the counterfactual. Conversely, the accounting or exchange measures
assess the current contribution of ecosystem assets to activities in the economy, which to some extent
may continue to be provided regardless of the land use or parks’ management strategy. We report
both measures as the information they provide are complementary: welfare values are an important
input to understand the best value of resources use, while exchange values can provide insight about
key linkages among environmental assets, the economy and society.
While the benefits of recreation are relatively large, it is important to note that the valuation of other
ecosystem services linked more directly to ecological and natural regulating processes is a relatively
new area and is therefore limited to the extent that relevant empirical literature or data for the
service was available.

57
Table 5.2 Ecosystem service benefits of protecting parks and relevant economic activity (annual)
Ecosystem services (1) BENEFITS OF
PROTECTING PARKS (2) ECONOMIC
ACTIVITY (3) VALUE ADDED IN THE
ECONOMY (4) NON-MONETARY
MEASURES
Economic values (annual): Benefits to producers and/or consumers ($)
Market output value or gross value of production ($)
Direct contribution to
GSP ($)
Total contribution
to GSP ($)
Indicators or qualitative info
Definition: What are the welfare gains as compared to the counterfactual?
Exchange value: how much would this be
worth today? (snapshot)
What is the value added generated in the economy today?
derived from (2)
What other features or measures are
suitable?
Provisioning services
Supply of clean water (from nine highest yielding non-metro parks)
$244 million (imputed) 4
Honey supply 1 $0.6-$1.0 million $3.4 -$4.6 million
Regulating services
Water purification 2
$32 million (metro parks)
$50 million (State/national parks)
Coastal protection $24-$56 million
Flood control/protection $46 million
Carbon storage Annual values not
estimated 3
Carbon sequestration (from revegetation only)
$1-5 million
Urban cooling Not estimated
Air quality Not estimated
Soil quality Not estimated
Soil stability Not estimated
Pollination $123-$167 million $0.6-1 million
Pest and disease control Not estimated
Habitat suitability for threatened species (in over 600 parks)
888 threatened species
in suitable habitats
Maintenance of genetic diversity
Maintenance of nursery populations Not estimated $1.1 million (imputed) 4
Cultural services
Recreation opportunities:
Enjoyment $600 - $1,000 million
Tourism Expenditure:
$1.4 billion $449 million
7,921 FTE $1,021 million
13,783 FTE
Health (avoided costs) $80-$200 million
Education opportunities Not estimated 183,000 participants in
educ. programs
Scientific research opportunities Not estimated 215 research permits
Amenity (Melbourne’s parks) $21-28 million
Opportunities for cultural connection (heritage)
$6-23 million 648,513 hectares
managed with TOs
Social & community cohesion $6 million $6 million (imputed) 4
Species/ecosystem existence (protect endangered species)
Not estimated
1 Honey production has lower levels of confidence in Table 4.10 because annual flows are derived from top-down estimates, however the valuation use monetary estimates based on market data for honey production. 2 Water filtration service in non-metropolitan parks is net off yield reduction as compared to the counterfactual. 3 Annual benefit values could not be assessed for carbon storage due to lack of models to assess carbon releases under the counterfactual. However, if all carbon currently stored in parks was released, the cost to offset these emissions would be valued at around $15 billion. The social cost of the emissions (without any offsets) is estimated at $63 billion. 4 Imputed values are not actual transactions, but represent the value of transaction that would be observed if there was a market for this service.
Relative levels of confidence in valuation applied: higher medium lower (not including uncertainty associated with the assessment of service flows)

58
In addition to managing park ecosystems, Parks Victoria manages infrastructure and recreational
activity in and around Victorian bays and waterways, including Port Phillip, Western Port and Port
Campbell. Access to local ports enables a range of activities such as commercial and recreational
fishing and boating. The commercial and recreational benefits provided by these waterways have not
been included in the table above as Parks Victoria has a role as infrastructure and recreational
manager rather than natural asset manager in this context. Local ports managed by Parks Victoria
(Port Phillip, Western Port and Port Campbell) are estimated to contribute over $300 million per
annum to the Victorian economy (see Appendix 3 for more detail). Part of this economic contribution
is attributable to Parks Victoria’s management of built and social capital.

59
6. Summary of findings and further work
The natural capital and ecosystem services based approaches explored in this report provide a
foundation for a new direction in recognising, quantifying, valuing and reporting on the contribution of
Victoria’s parks to Victoria’s environment, economy and wellbeing.
This project builds on, and complements, other work being undertaken within Parks Victoria on State
of the Parks management effectiveness evaluation and development of improved objectives based
evaluation and monitoring frameworks. This work also complements the development of decision-
making frameworks based on environmental-economic accounting to inform current monitoring,
evaluation and investments undertaken through environmental markets or programs led by the
Department of Environment, Land, Water and Planning.
6.1 Application for Parks Victoria
While many in the community value Victoria’s parks for their intrinsic values, and others anecdotally
recognise the benefits of parks, some people perceive parks as being restrictive and of limited social or
economic value. The accounting framework explored views parks as significant environmental assets
that provide a range of services to State and regional economies and communities, in addition to the
contribution of the parks network to conservation of habitats and biodiversity. In addition, the
valuation framework is used to understand the full range of costs and benefits of maintaining
protected public land areas, which support ecosystem assets. Thus, the outcomes of this work have
the potential to shift perceptions about why we have parks and the management requirements to
ensure that these key assets and services are maintained and/or enhanced so that services can
continue to be provided.
The proposed frameworks for ecosystem accounting and valuation present an opportunity to apply
the concepts of natural capital, ecosystem services, value and benefits more formally into
organisational business and reporting systems. This can be undertaken in three ways:
(i) By developing and applying new international standards for environmental-economic accounting
to Victorian parks. A more business-like approach to accounting for park management and investment
would highlight the dependencies between park management activity, economic prosperity, social
wellbeing and economic performance.
(ii) The development of environmental-economic accounts can bring the State’s key environmental
assets onto the balance sheet and draw a link between the management of State assets with
economic measures of Gross State Product. Environmental valuation and other economic analysis
based on these relationships can then provide a consistent base of knowledge to assess the changes
in welfare due to environmental programs or policy changes. In summary the integration of this
approach into ‘normal park management business’ will be able to more transparently demonstrate the
return on investment in meeting Government outcomes for the environment, economic growth and
community wellbeing.
(iii) The approach can align and integrate with Parks Victoria systems and measures for monitoring,
evaluation and reporting through the Parks Victoria State of the Parks management effectiveness
evaluation program.

60
6.2 Learnings and further work
Some of the key issues that have arisen that are important to this work include:
Economic issues. There are well-accepted valuation techniques used by economists. However, not all
of these techniques produce values that are consistent with accounting frameworks. Accounting
frameworks for ecosystem services are also new and developing. Selection and application of
valuation techniques can be quite complex, however primary research assessing key ecosystem
services in the Victorian context can provide a foundation for broader applications.
Some of the stated preference (survey based) valuation methods have the potential to capture values
that have been more difficult to quantify. Although their application to environmental and ecological
values is relatively new, the number of applications is increasing and the methods are improving.
Rigorous application of existing techniques and continual improvement in the performance of new
techniques is important.
This report highlights that most valuation work is piecemeal, specifically because it tends to be
location and service specific. This points out the need for more strategic level information. Some
valuation techniques lend themselves to more strategic level assessment, and precedents for this type
of exercise exist47. An important pre-requisite to any strategic studies is to identify the types of
impacts that are of most relevance and which values would be most needed in subsequent policy and
program impact assessments.
Scientific issues. All valuations of ecosystem services require good scientific information on the
physical flows of ecosystem services being provided. In order to assess changes in ecosystem services
a good understanding of ecological structure and processes is required to assess asset condition, and
good information on cause and effect relationships is required to link changes in condition to the likely
flow of ecosystem services. The science must be applied and policy relevant. Our scientists and
economists need to work together so that scientific outputs can be used in the valuation and
accounting framework. There is also a need to align modelling data and measurements to facilitate
data sharing.
Acceptance issues. The use of economic valuation to develop monetary values or consider trade-offs
can be controversial when applied to ecosystems. However, it is important to note that relative values
are always applied in making decisions (along with trade-offs made implicitly) whether there are
monetary valuations available or not. While economic and other techniques exist to quantify the
values held by the community, some people are sceptical of the capacity of the public to understand
the complexities of the issues involved, or concerned about possible biases in the development of
values. In the absence of values we need to effectively communicate that the development of values
provides an opportunity to improve decision-making.
47 An example of a precedent for the development of strategic level information is a study prepared for the NSW
Environment Protection Authority to provide information on the values held by the people of NSW for environmental and recreational attributes of rivers. The study estimated environmental values for a number of representative rivers across the State to provide a database of environmental values that could be drawn on by Water Management Committees when assessing alternative river management options. The study provided value estimates for changes in riverine vegetation, the presence of native fish and waterbirds, as well as values for improved recreational amenities (such as swimming and fishing) associated with water quality improvements.

61
Prioritising effort. Many applications of valuation techniques to develop new values have strong data
requirements and therefore significant costs. Improving scientific information to develop cause-and-
effect relationships can also be very demanding and it will be important to identify synergies with
other work. Prioritising effort will be important to maximise the applicability of values for different
contexts across Victoria.
The highest priorities for improving the quantification of individual ecosystem services for Victorian
parks are summarised in Table 6.1 below.
Table 6.1 Areas for further work identified for selected ecosystem services for Victorian parks
Ecosystem services Information gaps
Provisioning services
Further work is required to develop more detailed water accounts, outlining the not only consumption uses, but the specific ecosystems providing water flows, in terms of groundwater, surface water and soil water.
Further work is required to develop exchange values for water and honey supply services that are consistent with State and national accounts. A top down approach was used for honey supply and further work could be done to take into account spatial variation in honey supply services across the parks network.
Regulating services
Flood management - non-regulated rivers and wetlands
Recent estimates have been undertaken of the impact of metropolitan parks on stormwater regulation and the impact of some national parks with regulated rivers on peak flows. However there are information gaps on the contribution of parks in non-regulated river systems. Additionally contribution to flood regulation of the wetland ecosystems of the parks network requires further data and analysis.
Coastal asset protection
Further work could be done on the nature and costs of climate adaption measures for coastal settlements such as relocation and/or making existing buildings and infrastructure more resilient to coastal flooding for example through better drainage, on-site design changes, raising roads/bridges etc.
Carbon storage and sequestration
While Victoria has modelled estimates of above ground land carbon volumes, recent research in the central highlands has highlighted that the modelled estimates may be significantly lower that the models indicate. Additionally this research has highlighted other biomass such as woody debris and soil may contribute substantially to the role of parks as carbon sinks.
There is a need to develop improved estimates of contribution parks network in land carbon sequestration - both for revegetation across different landscape types, as well as well as the contribution of ‘passive restoration’ management interventions such as through management of grazing by introduced and overabundant native animals.
Increasingly marine and coastal wetland ecosystems are being highlighted around the world as potentially very significant for their role in storing and sequestering carbon, particularly in the organic sediment. There is a need to further understand and quantify the contribution of coastal wetlands to climate regulation.
Soil health and stability
Healthy parks are likely to play an important role within a broader landscape by minimising the volume of soil lost through soil erosion maximising soil health and productivity through the natural retention of critical soil health properties such as organic matter. There is a need to quantify the contribution of the different natural ecosystems of parks to soil stability and health.
Pest and disease control
While some international studies have sought to estimate both the volume of natural pest control services and their economic value, there have been limited local studies undertaken. The contribution that both larger intact parks and smaller reserves play in improving agricultural productivity (by providing healthy habitats for insectivorous birds, bats and native insects) is potentially very large.
Nursery services
The body of evidence for marine protected areas as nurseries for the recruitment of commercial and recreational species is growing, however there is a need to develop improved evidence on the quantity and value of coastal and marine parks in providing these nursery services.

62
Ecosystem services Information gaps
Cultural services
Recreation New studies are required to update consumer surplus values provided in earlier studies, reflecting current environmental amenities in parks and population’s preferences and activities undertaken in the parks network.
Physical and mental health benefits
While there is a large and growing body of evidence about the connection between human health and nature, there is a further need to develop improved metrics that can quantify and value the attribution of parks to both physical and mental health outcomes. While some direct use benefits can currently be measured, the contribution of parks to both use and non-use values relating to health is a challenge due to impact of many other health drivers.
Social benefits
While the current project has sought to introduce some immediately usable measures of social value such as volunteerism, there are significant information gaps in the metrics for quantifying and valuing social values such developing cultural and heritage connection to place, sense of belonging to community, social interaction and enjoyment and life satisfaction related to parks.
Connection to Country
Within the limited timeframes of this project limited data was able to be collected on the tangible social and cultural benefits of connection to country by Aboriginal communities. While there have been a number of studies undertaken in Australia, further work is required to develop consistent and comparable measures and gather suitable data on these benefits in the context of Victorian parks.
Non-use values
As a starting point, the current project has sought to wherever possible adopt market-based or other sound valuation methods to many of the use values in parks. There is currently limited data available on non-use value of Victorian parks and there are many opportunities to improve our knowledge of these values to inform decision-making. This could include valuation at different scales as the existence value of having a comprehensive and representative network of parks is likely to be much greater than the sum of the value of individual parks.
Additional priorities for further development of the pilot accounts for Parks Victoria include:
Extension of the coverage of the pilot accounts and more comprehensive assessment of the
condition of assets.
Developing technical and procedural standards for data collection to ensure robust, consistent
assumptions and quality of any modelling used to generate data for pilot ecosystem accounts.
Conceptual models linking changes in the extent and condition of ecosystem assets to the
likely future flow of services.
Further areas to expand this work to inform land policy and management include:
Identification and quantification of ecosystem services from the broader range of land uses
applicable across the public land estate.
Greater focus on marginal values associated with ecosystem services from different land uses
to support decision-making. Few decisions involve total losses of ecosystems – most will
involve modest changes in assets and service flows.
Further work on values where we have been limited in our ability to capture non-use values,
such as for biodiversity as well as spiritual and shared values.
Incorporation of stocks of natural resources and impacts of degradation or improvement into
economic analyses of policies and programs.

63
Derivation of aggregate measures of economic activity adjusted for ecosystem degradation
that could link into State and national accounting.
6.3 Implications of climate change
Going forward, park management will need to take into account potential changes in ecosystem
condition and ecosystem service flows under climate change. The current pilot assessment across the
parks network can be used as baseline, until better data becomes available.
The decision-making process can use historical data from accounts reporting on ecosystem condition
and services, as well as forward-looking assessment to understand potential risks across the
landscape. Given the nature of climate change, it would be important to assess any impacts on
ecosystems through probabilistic models and to highlight any issues at the extremes. Integrated
assessment models would be most suitable to simulate and quantify climate change impacts where
there are significant interactions across diverse ecosystems and sectors of the economy, but in their
absence regional or sectoral models could be used.
Research organisations, including the Commonwealth Scientific and Industrial Research Organisation
(CSIRO) through its Climate Adaptation Flagship, have started to work on the impact assessment of
climate change across selected ecosystem services (e.g. water and fire regimes) at a range of scales.
This area of work will be scoped and covered in further detail in the second phase of work between PV
and DELWP.
6.4 Data requirements to assess return on investment
In the process of developing the system of pilot accounts for parks and assessing parks ecosystem
services, Parks Victoria and DELWP have identified a number of recommendations to use consistent
information for the evaluation of conservation programs or ongoing natural resource management
activities from parks.
The next stage of work could provide specific applications to use the information from the pilot
accounts and benefit estimates to feed into an analysis of programs’ return on investment (ROI) across
a selection of parks and at for the whole of the parks network. The ROI presents the value of
environmental outcomes attained per dollar invested. As such, this is a cost-effectiveness measure,
not to be confused with a rate of return on the value of ecosystem assets.
To calculate the value of environmental improvements per dollar invested, two pieces of information
are required:
the net cost of a program over a predefined period; and,
outcomes measures to assess environmental improvements.
At a minimum, the program should have clear timeframe and geographical boundaries indicating
where management activities are being undertaken and where monitoring is available (or for which
modelled estimates could be obtained).
For each program, a selection of key outcomes in terms of ecosystem features or main ecosystem
services, which are likely to be affected due to the program, should be identified and data availability
for these outcomes should be assessed from the start.

64
Over time the following information should be compiled consistently as a requirement to exploit
efficiencies from the accounting and valuation works:
Program cost data
Park management programs (including environmental, culture and heritage, recreational and
educational, commercial and support programs) include activities in relation to planning, risk
management, on the ground works, stakeholder management and communications and
monitoring and evaluation – it is important to understand and document the core objectives,
desired outcomes and approach used to deliver a program to identify relevant activities to
prioritise efforts around the data analysis.
Program budgets and historical spend are the main source for the costs of the program for a
given group of parks. The budget should have a format consistent with SNA protection
expenditure accounts, which has a breakdown of operating costs (labour costs, intermediate
goods and services), fixed capital costs and revenue or any payments from/to the government.
If accounts and valuation for cost benefit analysis are to be developed for individual parks (e.g.
Alpine National Park), business management systems need to recognise this.
For the purpose of program evaluation, the net costs should also consider the full value of a
program including further government implementation costs or in kind contributions,
depreciation of any built assets should be also included.
In the program expenditure accounts, revenue payments (e.g. park entrance fees) should be
included and if possible be allocated across the relevant program of works.
If other intervening programs (in surrounding landscapes), policies or regulation are identified,
the analysis should note them and try to find a suitable attribution approach for some of the
program costs overlapping and outcomes being evaluated.
Environmental outcomes data
A hierarchy of suitable metrics must be identified to enable change in key attributes from
ecosystem assets to be compared over time (e.g. shown in the pilot ecosystem asset
accounts) and/or changes in ecosystem service flows (e.g. discussed in the pilot ecosystem
service flow accounts). Parks Victoria is currently developing ‘conservation outcome
hierarchies’ for each of its major landscapes and ecosystems.
A priority in the application of environmental-economic accounting work is to develop or use
estimates of the partial effect of changes of environmental attributes (e.g. condition, water
quality) on changes in ecosystem services (e.g. recreation, water purification)
Historical data would be the main source for an ex-post assessment, while for an ex-ante
assessment modelling of expected outcomes would be needed. If modelling is required it is
important to ensure models are calibrated and suitable to the program timeframe in which
outcomes need to be assessed.

65
Two types of outcomes can be considered in the ROI analysis: short-term outcomes are those
that are likely to be evident by the end of the program, while longer-term outcomes are those
ongoing benefits arising and/or being realised beyond the duration of the program
Assessment of ecosystem service benefits should follow the valuation methodology from
Section 5.2 or find reference values if relevant to the current status of parks and the
counterfactual. The impact of the program (defining a treatment group) should be ideally
measured as the change over time and as compared to similar areas outside the program
(control group).
Consider carefully whether aggregation is possible and if this is not the case, present the
multiple outcomes of key ecosystem services, for example in groups describing similar types
of benefit or beneficiaries:
Contribution to activities in the economy
Contribution to human wellbeing
Contribution to other ecosystem services to maintain a healthy environment
Note that these three types of benefits cannot be always aggregated, but considered
together, as a whole, can provide a more complete picture of any trade-offs involved and the
value for money provided through a program.

66
Appendix 1: Types of parks in the Victorian parks network
Table A1.1 Classification of Victorian parks
Park type Category Primary objectives
Nature Conservation Reserve International Union for Conservation of Nature Protected Areas (IUCN PA) Category IA
Set aside primarily to conserve species of plants and animals that may be rare or endangered, critical habitat, or other plant associations and animals that have conservation significance.
Wilderness Parks IUCN PA Category IB
Set aside for conservation and self-reliant recreation, these are large areas with landforms and native plant and animal communities relatively unaltered or unaffected by the influence of the European settlement of Australia.
National and State Parks IUCN PA Category II
National parks are areas of nationwide significance because of their outstanding natural environments, features, scenic landscapes, and diverse land types. They protect natural and cultural features and usually offer visitor facilities. They have limited areas for intensive recreation or development. State parks are generally smaller than national parks and make up an area of land containing natural environments and features, scenic landscapes and one or more land types that represent the major land types of the State.
Natural Features Reserves (Cave Reserves; Streamside Reserves; Scenic Reserves; some National Park Act parks)
IUCN PA Category III
Relatively small areas that are specifically allocated to protect a natural monument and its surrounding habitats. These monuments can be natural in the wholest sense or include elements that have been influenced or introduced by humans. They also provide for appropriate recreational use.
Natural features Reserves (Bushland Reserves)
IUCN PA Category IV
These reserves help to protect, or restore: flora and fauna species of international, national or local importance; or their habitats. The size of the area varies but can often be relatively small. They also provide for appropriate recreational use.
Currently none assigned in Victoria
IUCN PA Category V
Non National Park Act Regional Parks, some Schedule 3 National Park Act parks
Regional parks An area of public land, readily accessible from urban centres or a major tourist route, set aside primarily to provide recreation for large numbers of people in natural or semi-natural surroundings. Regional parks have significant value for nature conservation as habitat, as well as for their cultural heritage features.
Metropolitan Parks and Reservoir Parks and Gardens
Metropolitan Parks, Reservoir Parks and Gardens
An area of public land set aside primarily for recreation and provides for conservation of natural and cultural landscapes.
Historic Areas, Historic Parks, Historic Reserves, Lighthouse Reserves, Heritage National park
Historic areas, parks and reserves and lighthouse reserves
Places with important relics or historical associations that together with sites of historical and archaeological interest represent Victoria’s main historical themes.
Natural Features Reserve- Lake Reserve, Highway park, Education area, Coastal Reserves
Other natural features reserves
Waterway Manager for the waters of the local ports of Port Phillip, Western Port, Port Campbell, the Yarra, Maribyrnong and Patterson Rivers, Lake Moodemere and Albert Park Lake
Bay and waterways
Designated port of Port Phillip, Western Port and Port Campbell
Local Ports
Source: Parks Victoria

67
Appendix 2: Assessment of selected ecosystem services in parks
A2.1 Provisioning services from parks
(i) Provision of clean water
Benefit and beneficiary
Water supply catchments in Victoria’s parks capture water and release it cleaner to physical
infrastructure for drinking, food production and other uses such as small-scale power generation,
providing benefits to water consumers, food producers and consumers, and other industries. The
infrastructure includes pipes, channels and water storage facilities.
SEEA defines water supply as a provisioning service where the water is abstracted from water bodies,
such as rivers or lakes, that are located within a given ecosystem, despite the water itself being
generated across multiple ecosystems48. Consumption data from water diversion points located in
parks was not available for this project, but we report the volumes of water released from parks’ rivers
to assess the capacity of parks ecosystems to supply water to the State.
Context
Over one million hectares of Victorian water supply catchments are located within Victoria’s parks and
36 of the State’s water supply catchments contain at least 50% of their area as park. The living
infrastructure of these catchments enables the water run-off to be collected and distributed through
built infrastructure such as pipes, pumps and storages and is a valuable resource for consumptive and
productive uses, particularly for drinking water and agricultural use. The forest and wetland
ecosystems of parks influence the total quantity, quality and seasonal variation of flows, with intact
forests and wetlands soaking up and storing water when it is abundant and releasing it in dry periods.
Water catchments in parks capture water for many of Victoria’s cities and towns including Melbourne
and Geelong. For example 90% of Melbourne’s water supply is captured from park catchments and
the catchments of the Grampians National Park supply water to 45 towns and 7,000 rural properties49.
Market transaction values relating to water supply are already included in the System of National
Accounts (SNA) and attributed to the water supply industry. The SEEA-Water accounts aim to integrate
information on the economy, hydrology, other natural resources and social systems. The SEEA-Water
accounting framework includes physical water supply and use tables describing water flows in physical
units within the economy and between the environment and the economy (as shown in Figure A2.1
below). This requires identifying the flow of water through parks and the proportion of this that is
released to physical infrastructure for distribution to households and agricultural users.
48 United Nations 2013, SEEA 2012: Experimental Ecosystem Accounting. p. 47. 49 http://www.gwmwater.org.au/customers/publications/brochures/cat_view/170-publications/79-brochures

68
Figure A2.1 SEEA Water Flows in the physical supply and use tables
Source: SEEA-Water System of Environmental-Economic Accounting for Water, United Nations Statistics Division, 2012
The market value of water supplied in the Alpine National Park’s seven river systems was assessed by
URS in 200550. This study estimated a total annual value of water from the Alpine National Park of
around $12 million per year based on 2003 water prices. In addition, the study indicated the value of
production that would be foregone if the proportion of water currently used for irrigation were not
supplied by the Alpine National Park would be in the order of $45 million per annum in Australia’s GDP
(through irrigation alone). According to this report, the economic contribution could potentially
increase to around $110 million per year if other water uses (such as urban industrial and household
consumption, hydroelectricity and aquaculture) are included.
In 2013 Yarra Valley Water published a study prepared by Trucost estimating the economic value of
water resources and related ecosystem services51. The study estimates direct and indirect use values
for water abstracted and distributed by Yarra Valley Water to residential households, commercial and
industrial users in Melbourne. This study found that the annual indirect use value of water as a natural
asset used in the Melbourne ranges (most of which is national park) through ecological functions52 was
$2 billion on average and ranged from $570 million to $3 billion over the eight-year period analysed
(from 2003/04 to 2010/11), depending on the level of water scarcity. The $2 billion value is almost
twice the $1 billion value of Melbourne water retailers’ sales in 2010-11. Direct use values were
derived from the average prices charged and willingness to pay across different users for water supply
provided by Yarra Valley Water and amount to $1.8-2.9/m3 for residential users and $0.2-5.1/m3 for
industrial commercial users. Recreational fishing values were estimated at $126 million per annum.
However, note that this study uses a benefit transfer approach largely based on estimates and water
demand functions from overseas studies to measure the marginal value of water to different users.
50 URS 2005 The Value of Water from the Victorian Alpine National Park, prepared for the Department of Sustainability and Environment. 51 Trucost 2013 White Paper: Valuing water to drive more effective decisions, prepared for Yarra Valley Water. 52 The following ecosystem functions were included: hydrological functions (e.g. groundwater recharge and freshwater replenishment), biogeochemical functions (e.g. waste assimilation) and ecological functions (e.g. habitat maintenance)

69
Links to other services
Water is necessary to many other provisioning ecosystem services (e.g. food) and most regulating
ecosystem services (e.g. water purification, flood protection), supporting ecosystem services (e.g.
photosynthesis, nutrient cycling) and cultural ecosystem services (e.g. recreation, aesthetic experience).
Quantity of service provided
Previous estimates of the water runoff delivered by 86 of Victoria’s National and State parks have been
estimated at 7,100 Gigalitres (GL) per year, equating to 34% of Victoria’s total water runoff in 2005.53
Recent modelling of nine of Victoria’s National and State parks in non-metropolitan areas
commissioned by Parks Victoria54, including some of the State’s highest yielding parks, has estimated
that these parks provide annual water flows of about 3,392 GL per year on average (excluding any
environmental flows not captured in unregulated supply). This is about 16% of the State’s total
runoff55. The highest yielding parks are the Alpine and Yarra Ranges National Parks, but other parks
such as the Grampians National Park also contribute significantly to local water supply. Modelling of
the metropolitan parks indicated these parks supply approximately 34 GL of water per annum.
Table A2.1 Water annual mean flows across selected national and State (non-metropolitan) parks
Modelled park hectares Mean annual flow (ML/year)
Alpine National Park 2,625,000 Regulated 237,917 1,079,000
Unregulated 387,319 1,547,000
Baw Baw National Park 47,000 Greater Melbourne 8,092 47,000
Bunyip State Park 31,000 Unregulated 10,150 31,000
Great Otway National Park 28,000 Greater Melbourne 11,429 28,000
Grampians National Park 156,000 Regulated 76,231 98,000
Unregulated 45,484 58,000
Lerderderg National Park 25,000 Regulated 20,486 25,000
Lake Eildon National Park 123,000 Regulated 26,766 123,000
Warby Ovens National Park 6,000 Regulated 7,332 6,000
Yarra Ranges National Park 351,000 Greater Melbourne 44,691 243,000
Unregulated 20,429 108,000
Total Greater Melbourne 64,212 318,000 Total Regulated 368,732 1,330,000
Total Unregulated 463,423 1,744,000
Total 3,392,000
Source: Marsden Jacobs Associates (MJA) 2014, Valuing the Water Services provided by Victoria’s Parks.
Notes: analysis based on 43 of the 115 park outlets that account for 90% of total annual yield. Regulated uses are water flows from park outlets drain into regulated rivers, i.e. rivers where downstream flows are regulated by a major storage or dam. Unregulated uses are water flows from park outlets drain into unregulated rivers, i.e. rivers without a major storage or dam.
53 SKM 2005, Runoff from Victorian Parks, Report prepared Parks Victoria. About 25% of the State’s annual runoff (21,120 GL) is used for consumption in Victoria (4,993 GL in 2004-05 and 4,220 GL in 2012-13, Source: ABS 2013, Water Account, Australia, 2012-13). Entitlements for surface water was 6,423 GL in 2012-13 (Source: DEPI 2014, Victorian Water Accounts). 54 Marsden Jacobs Associates 2014, Valuing the Water Services provided by Victoria’s Parks. Report prepared for Parks Victoria 55 Available surface water in the State was 21,185 GL in 2012-13. DEPI 2014, Victorian Water Accounts.

70
Counterfactual: the world without parks
In the absence of parks, the counterfactual is that the national and State (non-metropolitan) park
areas would have been cleared and used for grazing, while current metropolitan park areas would
have been used for residential development. Under the counterfactual, cleared park areas for grazing
would see increased water runoff estimated by MJA at 852,000 ML per year across the relevant
catchments. The additional availability of surface water, however will not necessarily translate into
additional/new entitlements or water consumption at current market prices. In addition, flooding and
more sediment would arise as a result of clearing land for grazing, which will negatively impact water
quality and create some negative externalities for both productive and recreational uses.
Valuation method
The valuation of water supply is based on market-based techniques for changes in water availability
valued with equivalent entitlement prices or supply costs to water corporations. Although market
based values of water are available, prices charged for abstraction do not reflect the full value of
water. Water prices generally cover the infrastructure, maintenance and operations, including energy
costs, to distribute clean water and treat wastewater. These prices therefore largely reflect the value
of capital inputs on the supply side rather than the water itself.
From the point of view of consumers (e.g. households, irrigators using water as an input), the value of
clean water being supplied is likely to be much higher than what is implicit in current prices charged. In
other words, people would be willing to pay more in their current charges to maintain water quality
and avoid issues (e.g. pollution, salinity), which could impact on the environment, health and business
productivity. This consumer surplus value is not captured in the market-based techniques for changes
in water availability at current water quality levels.
Marsden Jacob Associates (MJA) were commissioned by Parks Victoria to value water services from
Victoria’s parks as part of this project. MJA used the market value of entitlements for the change in
water supply available to irrigation in non-metropolitan areas and the avoided cost of alternative
supply in metropolitan areas (i.e. cost of water supply from Lake Eildon via the Sugarloaf pipeline).
The modelling of catchments and rivers running through current park areas indicates that 82% of
water runoff is used in agriculture, 9% is supplied to Greater Melbourne and the remainder is used for
other unregulated consumption (likely to include a large part of environmental flows). The value of
water supply is derived from a combination of the following least-cost options: 35% of water is used
for agriculture with high reliability entitlements, 47% of water is used for agriculture with low
reliability entitlements, the 9% of urban water for Melbourne will use a combination of Sugarloaf
Reservoir and high reliability entitlements (the cost of the desalination plant was well above the other
options and therefore was not used).
Water absorption by parks’ vegetation represents about 20% of water availability that would become
available under the counterfactual, however this runoff may not necessarily have commercial value for
other uses. Under the assumptions of the MJA valuation that all runoff going through cleared parkland
in non-metropolitan areas would be valued with current entitlement prices, and after incorporating
the externalities of reduced water quality (assessed in Section A2.2), gives the value of the net benefit
for park watershed services for the supply of clean water (recreational or environmental water values
were not included).

71
Value of benefits
The value of providing clean water comprises the joint impact of change in land use on water runoff
and sediment released. Therefore, the welfare value is provided in the water filtration service (Section
A2.2), which takes into account the reduction in yield and increased water quality due to parks.
In terms of economic activity, the market value of all water runoff supplied in nine of the higher
yielding Victorian national parks was estimated at $244 million per annum, assuming it could be used
for entitlements or supply to Greater Melbourne. If the runoff would be for environmental use only,
then a welfare value would need to be derived using other valuation techniques.
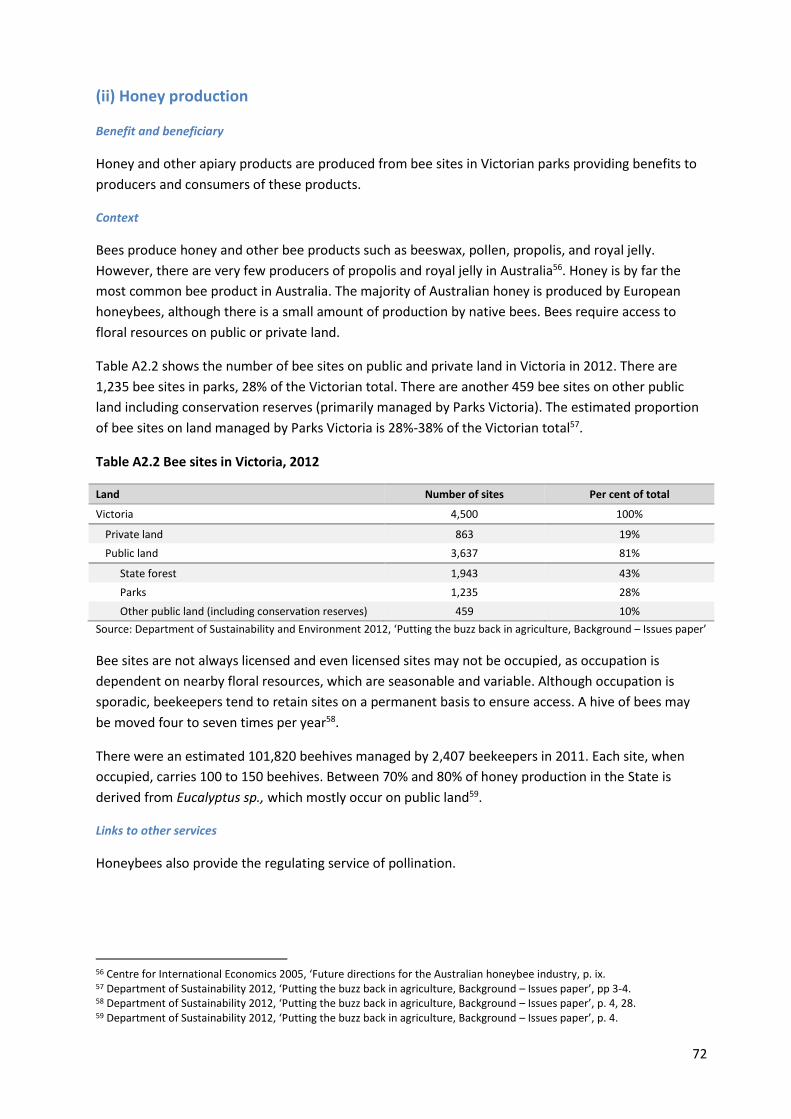
72
(ii) Honey production
Benefit and beneficiary
Honey and other apiary products are produced from bee sites in Victorian parks providing benefits to
producers and consumers of these products.
Context
Bees produce honey and other bee products such as beeswax, pollen, propolis, and royal jelly.
However, there are very few producers of propolis and royal jelly in Australia56. Honey is by far the
most common bee product in Australia. The majority of Australian honey is produced by European
honeybees, although there is a small amount of production by native bees. Bees require access to
floral resources on public or private land.
Table A2.2 shows the number of bee sites on public and private land in Victoria in 2012. There are
1,235 bee sites in parks, 28% of the Victorian total. There are another 459 bee sites on other public
land including conservation reserves (primarily managed by Parks Victoria). The estimated proportion
of bee sites on land managed by Parks Victoria is 28%-38% of the Victorian total57.
Table A2.2 Bee sites in Victoria, 2012
Land Number of sites Per cent of total
Victoria 4,500 100%
Private land 863 19%
Public land 3,637 81%
State forest 1,943 43%
Parks 1,235 28%
Other public land (including conservation reserves) 459 10%
Source: Department of Sustainability and Environment 2012, ‘Putting the buzz back in agriculture, Background – Issues paper’
Bee sites are not always licensed and even licensed sites may not be occupied, as occupation is
dependent on nearby floral resources, which are seasonable and variable. Although occupation is
sporadic, beekeepers tend to retain sites on a permanent basis to ensure access. A hive of bees may
be moved four to seven times per year58.
There were an estimated 101,820 beehives managed by 2,407 beekeepers in 2011. Each site, when
occupied, carries 100 to 150 beehives. Between 70% and 80% of honey production in the State is
derived from Eucalyptus sp., which mostly occur on public land59.
Links to other services
Honeybees also provide the regulating service of pollination.
56 Centre for International Economics 2005, ‘Future directions for the Australian honeybee industry, p. ix. 57 Department of Sustainability 2012, ‘Putting the buzz back in agriculture, Background – Issues paper’, pp 3-4. 58 Department of Sustainability 2012, ‘Putting the buzz back in agriculture, Background – Issues paper’, p. 4, 28. 59 Department of Sustainability 2012, ‘Putting the buzz back in agriculture, Background – Issues paper’, p. 4.

73
Quantity of service provided in the parks network
Victoria produces around 4,250 tonnes of honey products on average per year, around 17% of
Australia’s honey production60. Based on the 28-38% proportion of bee sites found in Victorian parks
(outlined in Table A2.2), the quantity of honey produced from parks is estimated at around 1,190-
1,615 tonnes per year.
Counterfactual: the world without parks
In the absence of parks, the counterfactual is that national and State (non-metropolitan) parks would
have been cleared and used for grazing, while metropolitan park areas would have been used for
residential development. Under the counterfactual, there would not be sufficient native vegetation
across the State to maintain production levels from bee sites currently located in non-metropolitan
parks areas.
An earlier apiary industry report concluded that without access to public land, this industry would not
be able to survive in its present form61. This dependency on public land (particularly national parks,
State forests and other conserved forests) is because public land contains the majority of native
forests on which the industry is so reliant and provides much of the network of apiary sites which the
industry needs to access in order to harvest honey flows, which occur irregularly and for short periods.
In addition, native forests on public land also provide a safe environment and clean rehabilitation area,
which is needed to rebuild the strength and health of hives.
As a result, without parks, the relocation of some beehives could be possible in the short-term, but the
increased beekeeping costs associated with limiting the current movement of hives around the State
and Australia would greatly reduce the productivity and the profitability of the industry. As a result,
producers would cease producing honey in Victoria. In the long-term, producers would adjust by
shifting to other Australian regions, while consumers would purchase imported honey or use
substitutes of honey.
Valuation method
The valuation of honey supply is based on market-based techniques. Some market data is available for
the production of honey and related products. Specifically, the average price received by Victorian
honeybee businesses for honey sold during 2006-07 was $2.80 per kg, while their cash costs were
$2.30 per kg62. The benefit of the industry in the short-term is obtained from beekeepers’ Gross
Operating Surplus ($0.50 per kg of honey) and the quantity of honey produced attributable to parks.
Value of benefits
Based on the valuation method and assumptions described above, benefits of honey production from
park managed areas is estimated to be in the range of $0.6-$1.0 million per year. Additional
potential benefits to consumers, measured as the consumer surplus, were not taken into account.
60 Department of Sustainability 2012, ‘Putting the buzz back in agriculture, Background – Issues paper’, p. 27. 61 Gibbs and Muirhead 1998, The economic value and environmental impact of the Australian beekeeping industry. A report prepared for the Australian beekeeping industry. February 1998. 62 RIRDC 2008. Australian honeybee industry survey, 2006-07. RIRDC Publication No. 08/170

74
In terms of economic activity, honey and related products worth $12 million were traded in the
Victorian economy in 201163. Based on the proportion of bee sites in parks, the contribution of park-
based apiary sector to agricultural gross output is estimated at around $3.4-$4.6 million in 2011. This
represents the economic activity associated with park-based honey production, which is larger than
the value directly attributable to Victorian parks.
63 Department of Sustainability and Environment 2012, ‘Putting the buzz back in agriculture, Background – Issues paper’, p.3.

75
A2.2 Regulating services from parks
(i) Water purification and filtration services
Benefit and beneficiary
Parks filter and purify water, which benefits water consumers and agricultural producers. Clean water
is critical for human health and is also essential for water-based recreation.
Context
The forests, woodlands and wetlands of Victoria’s parks improve water quality by naturally purifying
and filtering water and reducing the release of soil sediment, pollutants and organic matter that would
otherwise reach our waterways.
Many of Victoria’s national parks and reserves contain water catchments that are used for either
drinking water or agricultural production and these parks provide cost-effective living infrastructure to
purify and filter water before it reaches water consumers. Metropolitan parks play an important role
in reducing the level of nutrients and toxicants that affect water quality and ecosystem health in our
urban waterways and bays.
Water quality can be reduced when ecosystems are degraded or disturbed, such as through loss of
vegetation cover, trampling or overgrazing by introduced animals or introduction of pathogens or
disease. Large-scale fires can have a significant short-term impact on water quality through movement
of sediment and other matter into waterways and water supply infrastructure. The maintenance or
improvement of catchment condition can significantly lower potential water treatment costs.
In providing a water purification service, parks contribute significantly to the delivery of the State
Environment Protection Policy (Waters of Victoria) and Victoria’s Urban Stormwater Best Practice
Environmental Management Guidelines. Without parks, more water treatment infrastructure would
be needed to maintain current water quality standards, and the cost to Government and taxpayers
would be significantly higher.
Links to other services
Clean water is necessary for many other ecosystem services including provisioning ecosystem services
(e.g. food production), regulating services (e.g. carbon storage and sequestration, genetic diversity),
supporting services (e.g. photosynthesis, nutrient cycling), and cultural ecosystem services (e.g.
recreation, aesthetic experience).
Quantity of service provided
The service flows for water purification and filtration are quantified in terms of sediment output for
non-metropolitan parks and nitrogen nutrient loads for metropolitan parks.
Non-metropolitan national parks
Based on a partial assessment of the parks network using detailed hydrological models of eight of the
State’s highest water yielding national parks, these parks are estimated to provide in total around
4,165 tonnes of sediments into non-metropolitan waterways as compared with potentially 50,960
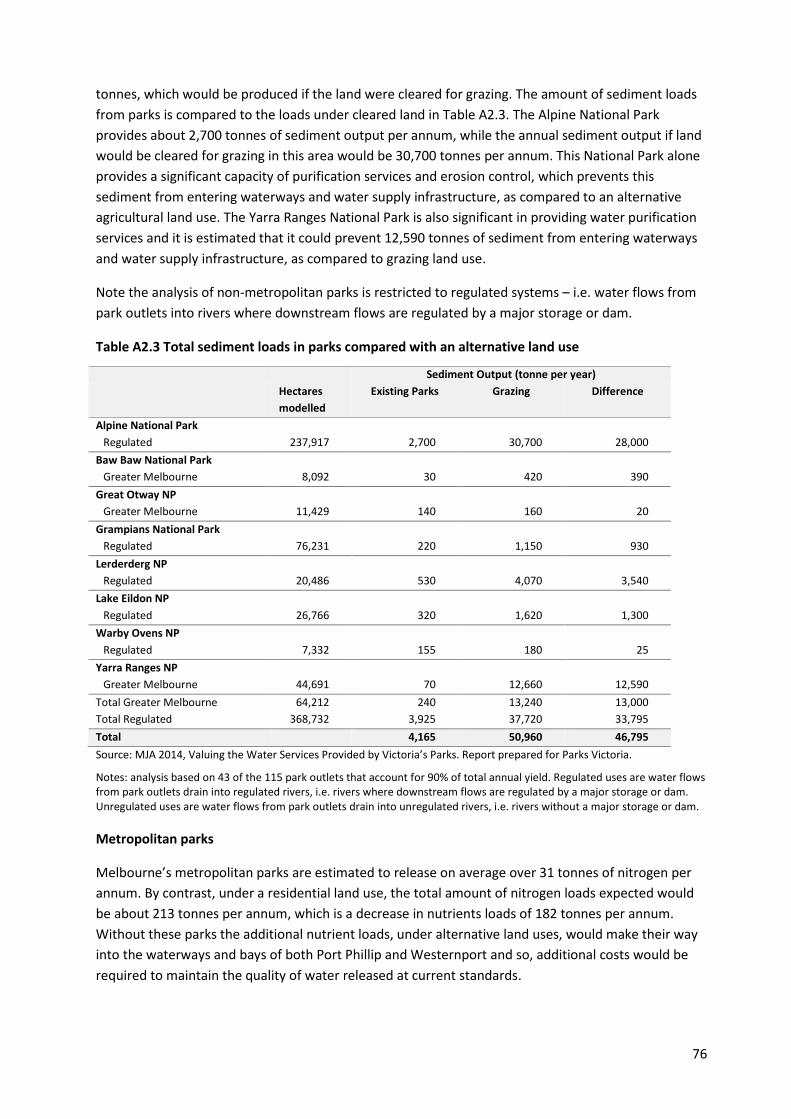
76
tonnes, which would be produced if the land were cleared for grazing. The amount of sediment loads
from parks is compared to the loads under cleared land in Table A2.3. The Alpine National Park
provides about 2,700 tonnes of sediment output per annum, while the annual sediment output if land
would be cleared for grazing in this area would be 30,700 tonnes per annum. This National Park alone
provides a significant capacity of purification services and erosion control, which prevents this
sediment from entering waterways and water supply infrastructure, as compared to an alternative
agricultural land use. The Yarra Ranges National Park is also significant in providing water purification
services and it is estimated that it could prevent 12,590 tonnes of sediment from entering waterways
and water supply infrastructure, as compared to grazing land use.
Note the analysis of non-metropolitan parks is restricted to regulated systems – i.e. water flows from
park outlets into rivers where downstream flows are regulated by a major storage or dam.
Table A2.3 Total sediment loads in parks compared with an alternative land use
Sediment Output (tonne per year)
Hectares
modelled
Existing Parks Grazing Difference
Alpine National Park
Regulated 237,917 2,700 30,700 28,000
Baw Baw National Park
Greater Melbourne 8,092 30 420 390
Great Otway NP
Greater Melbourne 11,429 140 160 20
Grampians National Park
Regulated 76,231 220 1,150 930
Lerderderg NP
Regulated 20,486 530 4,070 3,540
Lake Eildon NP
Regulated 26,766 320 1,620 1,300
Warby Ovens NP
Regulated 7,332 155 180 25
Yarra Ranges NP
Greater Melbourne 44,691 70 12,660 12,590
Total Greater Melbourne 64,212 240 13,240 13,000
Total Regulated 368,732 3,925 37,720 33,795
Total 4,165 50,960 46,795
Source: MJA 2014, Valuing the Water Services Provided by Victoria’s Parks. Report prepared for Parks Victoria.
Notes: analysis based on 43 of the 115 park outlets that account for 90% of total annual yield. Regulated uses are water flows from park outlets drain into regulated rivers, i.e. rivers where downstream flows are regulated by a major storage or dam. Unregulated uses are water flows from park outlets drain into unregulated rivers, i.e. rivers without a major storage or dam.
Metropolitan parks
Melbourne’s metropolitan parks are estimated to release on average over 31 tonnes of nitrogen per
annum. By contrast, under a residential land use, the total amount of nitrogen loads expected would
be about 213 tonnes per annum, which is a decrease in nutrients loads of 182 tonnes per annum.
Without these parks the additional nutrient loads, under alternative land uses, would make their way
into the waterways and bays of both Port Phillip and Westernport and so, additional costs would be
required to maintain the quality of water released at current standards.

77
Counterfactual: the world without parks
In the absence of parks, the counterfactual is that national and State (non-metropolitan) parks would
have been cleared and used for grazing, while current metropolitan park areas would have been used
for residential development.
As discussed in the previous section, under the counterfactual, cleared park areas for grazing would
see increased sediment loads estimated at 46,795 tonnes per year across the relevant catchments. In
the case of metropolitan parks, land use change to residential development would produce an
increase in nitrogen loads of about 182 tonnes per annum. These additional pollutant loads will
require additional infrastructure to maintain water quality at current levels.
Valuation method
Marsden Jacob Associates (MJA) were commissioned by Parks Victoria to value water services from
Victoria’s parks as part of this project. The water regulation services of selected Victorian parks have
been valued using market based approaches based on the replacement cost approach and the cost of
new water treatment infrastructure to deal with the additional sediment or nitrogen loads under the
counterfactual, as described below. For non-metropolitan national parks the assessment is based on
the cost of supplying the equivalent volume of water to replace dam storage that is lost due to
sediment accumulation. For parks servicing Greater Melbourne, this is based on the cost of sourcing
water from Lake Eildon via the Sugarloaf pipeline. For parks servicing irrigated agriculture and rural
townships, the cost is based on purchasing water entitlements for the volume of sediment taking up
storage space in dams. This is a partial estimate and does not take into account the avoided costs of
sediment affecting water distribution infrastructure, such as pumps, which would be damaged badly.
For Melbourne’s metropolitan parks the assessment is based on the avoided cost of filtration
infrastructure. The cost is based on the water quality charges component of Melbourne Water’s
developer contribution charges, designed to fund off-site infrastructure to achieve stormwater quality
requirements where on-site stormwater treatment is not possible or feasible. The cost is $2,250 per
kilogram of annual Total Nitrogen load.
Value of benefits
Based on a partial assessment of the Victorian parks network, including a selection of higher yielding
parks, the value of the sediment filtration service for regulated rivers in non-metropolitan parks is
around $125 million per annum (65% of this affects water use in Greater Melbourne, the remainder is
from other regulated water use)64. After taking into account the reduction in runoff of non-
metropolitan parks (as discussed in Section A2.1), the resulting net benefits of watershed services in
non-metropolitan parks are estimated at $50 million per annum.
Based on modelling of the quantity of nitrogen nutrients filtered and the estimated cost of filtration
infrastructure, the benefits of water filtration in Melbourne’s metropolitan parks network is in the
order of $33 million per year65. This equates to an avoided cost of $33,000 per hectare or almost
$2,150 per hectare per year.
64 Source: Marsden Jacobs Associates 2014, Valuing the Water Services provided by Victoria’s Parks, Report prepared for Parks Victoria 65 Ibid

78
In summary the water purification and filtration services of selected Victorian parks are estimated to
provide an annual value of benefits of about $83 million per year. The benefits of filtration services
provided by parks are summarised in Table A2.4.
Table A2.4 Summary of economic value of water filtration services of selected parks
Parks Water filtration services from selected Victorian parks
Capital value ($ million)
Annualised value ($ million)
National parks network $770 $50 Reduced sediment in regulated rivers $1,920 $125 Reduced sediment in unregulated rivers Not included Not included Water yield reduction -$1,150 -$75
Metropolitan parks network $500 $33
Total (metropolitan and national parks) $1,270 $83
Note: Annualised value derived from capitalised values, using a 5% discount rate over 30 years.
79
(ii) Flood and stormwater regulation services
Benefit and beneficiary
Parks help mitigate damage by floods and stormwater runoff to private and community assets and
infrastructure. The beneficiaries are Victorian communities, agricultural producers and water
consumers.
Context
The native vegetation, wetlands and green spaces of parks help regulate the flow of water in
catchments, providing protection against flooding.
In national parks and reserves, the healthy vegetation and soil of forests, woodlands, grasslands and
wetlands absorb rain and regulate water movement within the catchment. This assists in releasing
water into waterways at more natural velocities and volumes. Parks also contribute to reducing soil
loss and erosion from rain events.
Within the Melbourne area, the extensive permeable surfaces of metropolitan parks play an important
role in reducing the volume and velocity of stormwater reaching waterways. This means reduced
physical infrastructure and stormwater management actions are needed, and the cost to Government
and taxpayers is significantly lower than it would be without parks.
Links to other services
Flood and stormwater regulation services have interdependencies with a range of ecosystem
processes including the carbon cycle and nutrient cycle. Wetlands also provide essential habitats for
many species.
Quantity of service provided
The service flow for metropolitan parks is quantified in terms of stormwater runoff avoided, while for
non-metropolitan parks the measure used is reduction in peak flows.
Stormwater regulation from Metropolitan parks
Melbourne’s metropolitan parks are estimated to provide 34 GL per year under the current land use as
a park, but if the land was used for urban residential development the volume of stormwater runoff
would be 74 GL per year. Without its metropolitan parks, Melbourne’s stormwater management
infrastructure would require a major increase in capacity to cope with this doubling of stormwater
volume.
Flood regulation from national parks and reserves
Based on modelling of a number of national and State (non-metropolitan) parks, the peak flows in
selected parks vary widely from a range of 49-3,159 m3/s to 54-3,926 m3/s for peak 100-year Average
Recurrence Interval (ARI) flows66. The recurrence of peak flows under a scenario of cleared land for
grazing would increase by more than 20% across most parks, depending on their location, as described
in Table A2.5 below.
66 Measured as peak flows with 1:100 year Average Recurrence Interval (ARI)

80
Table A2.5 Peak flows (m3/s) from parks compared with alternative land use
Park Peak flows from park land use (ARI_100)
Peak flows from agricultural land use (ARI_100)
Reduction in ARI_100
Alpine NP 3,159 3,926 24%
Yarra Ranges NP 337 726 115%
Great Otway NP 321 518 61%
Grampians NP 266 416 56%
Lerderderg SP 117 154 31%
Lake Eildon NP 88 108 23%
Bunyip NP 87 116 33%
Baw Baw NP 81 87 7%
Warby Ovens NP 49 54 11%
ARI_100 = 1:100 Average Recurrence Interval. Source: MJA 2014, Valuing the Water Services Provided by Victoria’s Parks.
Report prepared for Parks Victoria.
Counterfactual: the world without parks
In the absence of parks, the counterfactual is that national and State (non-metropolitan) parks would
have been cleared and used for grazing, while current metropolitan park areas would have been used
for residential development.
As discussed in the previous section, under the counterfactual, most cleared land in current
catchments in national parks would see an increase in peak flows (100-year ARI) of 7% to 215% across
the relevant catchments (with a mean increase of 40%). In the case of metropolitan parks, land use
change to residential development would require Melbourne Water to provide additional stormwater
regulation and retention services, which may include onsite infrastructure that conveys or retards
stormwater and waterway protection works.
Valuation method
Only stormwater regulation in metropolitan parks was valued for this project, due to the complexity of
peak flows modelling and valuation for non-metropolitan parks.
For metropolitan parks, valuation is based on the per hectare avoided cost of flood detention or
retarding basin storage.67 The cost is based on the hydraulic component of Melbourne Water’s
developer contribution charges – reflecting the cost of on-site infrastructure that conveys or retards
stormwater, including waterway protection works. As the hydraulic charges are site specific, MJA
sampled recent development sites where hydraulic charges were applied to develop weighted average
cost estimates of around $28,000 per hectare east of Melbourne and $68,000 per hectare north or
west of Melbourne.
Value of benefits
Based on hydrological modelling of metropolitan parks only, the benefit of the stormwater retention
services of Parks Victoria’s metropolitan parks is estimated at $46 million per annum (or almost
$3,000 per hectare per annum). This is a partial estimate, as the avoided costs of alternative flood
retention infrastructure for non-metropolitan areas could not be assessed as part of this project.
67 Marsden Jacobs Associates 2014, Valuing the Water Services provided by Victoria’s Parks, Report prepared for Parks Victoria

81
(iii) Climate regulation services
Benefit and beneficiary
The beneficiary of climate regulation services is the Victorian community as well as the global
community more broadly.
Context
Carbon storage relates to the carbon held in plant biomass and soils (stocks). Carbon flows relate to
the process of sequestering or emitting carbon to the atmosphere.
Across the world, intact terrestrial, wetland and marine and coastal ecosystems of parks play a vital
role in regulating the earth’s climate by adding and removing carbon dioxide from the atmosphere and
storing it in the form of organic carbon in plant (trunks, branches, foliage, and roots) biomass and soil.
These ecosystems store more carbon than the atmosphere and are vital to influencing carbon dioxide-
driven climate change.
Forests and woodlands are particularly important in the global carbon cycle because they can
sequester large amounts of carbon over long time periods. Victorian parks are nationally and
internationally significant for their ability to store carbon68. For instance, the mountain ash forests of
the Central Highlands (including the Yarra Ranges National Park) have shown to contain the world’s
highest carbon biomass density of up to 1,867 tonnes of carbon per hectare, more than the forests of
the Amazon.
While there is much evidence of the role that terrestrial ecosystems play in carbon storage, there is an
increasing body of evidence that coastal and marine ecosystems, such as seagrass habitats, tidal
marshes and mangroves, store very large volumes of organic carbon. Recent estimates suggest that
these Australian coastal ecosystems can store more than five times the volume of ‘blue carbon’ than
terrestrial ecosystems and can sequester at rates of up to 66 times that of terrestrial ecosystems69.
By ensuring parks are well managed, including preventing soil erosion, large scale severe fires,
vegetation disease, impacts of introduced species and human pressure and by undertaking restoration
programs such as revegetation, parks can protect and increase carbon stocks and sequester carbon
over time. When preserved, carbon is stored in these ecosystems, however when vegetation is
destroyed or degraded, carbon is emitted back into the atmosphere.
Carbon emissions may occur from natural events through large-scale disturbances (e.g. bushfires) or
smaller scale disturbances (e.g. local habitat degradation or planned burning). Based on modelling in
Victorian forests, the loss of carbon from fire related emissions was estimated at around 2% of the
total carbon stock on public land between 2000 and 200970.
68 Norris, J., Arnold, S. and Fairman, T. 2010. ‘An indicative estimate of carbon stocks on Victoria’s publicly managed land
using the FullCAM carbon accounting model’. Australian Forestry 73. pp.209-219; Keith, H., Mackey B.g and Lindenmayer D.B. 2009, Re-evaluation of forest biomass carbon stocks and lessons from the world’s most carbon-dense forests, PNAS Vol. 106, Number 28. 69 Lawrence, A.J., Baker, E., Lovelock, C.E. 2011, Optimising and managing coastal carbon: Comparative sequestration and mitigation opportunities across Australia’s landscapes and land uses. Fisheries Research and Development Corporation (FRDC) Report 2011/084. 70 Norris et al. 2010 (Op. cit. p.82)

82
There is a school of thought that parks consist mostly of areas of older terrestrial vegetation that are
already close to their carbon carrying capacity, and therefore play a limited role in carbon
sequestration. However, new evidence is emerging suggesting that these ecosystems may play a
significant role as sequesters of carbon71.
The climate regulation service that parks can play is therefore threefold:
protection of large stocks of carbon through maintenance of intact healthy forests, woodlands, wetlands, grasslands and coastal and marine ecosystems;
sequestration of carbon in areas that are not currently at their carbon carrying capacity; and,
sequestration of carbon through direct revegetation and habitat restoration programs, such as grazer control.
A recent study assessed the contribution of US National Park Service (NPS) parks to carbon
sequestration through plant growth using baseline data over 2001 and 2005 and models to assess the
amount of carbon expected to be sequestered from 2006 to 2050. The estimates were based on parks
boundary and land cover data, along with peer-reviewed work on carbon sequestration rates. The
study found that US NPS currently sequesters an average of 17.5 million of tonnes CO2 per annum,
which is valued at $707 million dollars (using a social cost of carbon of $40.45 per tonne). The benefits
to Americans from this ecosystem service alone is about 28% of the NPS budget.
Further, the study found that projections of carbon sequestration in the US NPS are expected to drop
by 31% due to climate change and associated increase in fire hazards (this estimate assumes there are
no changes in land management). Thus, without greater intervention by NPS, the amount of carbon
sequestered will decline due to global climate trends72.
This climate regulation service fits within Australia’s international undertaking to reduce greenhouse
gas emissions by at least five per cent by 2020, compared with 2000 levels, under the Kyoto Protocol73.
At the United Nations climate change negotiations in Durban, South Africa in 2011, parties to the
Kyoto Protocol decided to establish a second commitment period from 1 January 2013. The Federal
Coalition has given ‘in-principle support’ to Australia’s involvement in a second round of the Kyoto
Protocol. At the 2011 negotiations some important decisions were made about future carbon
accounting in the land use, land use change and forestry sector. Key decisions of direct relevance to
the Department of Environment, Land, Water and Planning and Parks Victoria include:
all managed forests will be subject to carbon accounting in the next international commitment
period (starting 2013); and,
countries will be allowed to exclude emissions resulting from major natural disturbances, such
as bushfires, from their carbon accounting (force majeure).
The changes mean Australia will have to account for all forest emissions above a national reference
level, except in circumstances when the Commonwealth decides to use the force majeure provision to
exclude emissions from accounting because of natural disturbance.
71 Keith et al. 2009 (Op. cit. p.82) 72 Banasiak, Adam, Linda Bilmes, and John Loomis. “Carbon Sequestration in the U.S. National Parks: A Value Beyond
Visitation.” Discussion Paper 2015-66. Cambridge, Mass.: Harvard Project on Climate Agreements, February 2015. 73 The Kyoto Protocol is an international agreement created under the United Nations Framework Convention on Climate Change in Kyoto, Japan in 1997.

83
The extension of carbon accounting in this area means the area of Victorian public land covered is
likely to increase from the current negligible level (approximately 100,000 hectares) up to at least 1.3
million hectares (mainly State Forest), and potentially more. The ‘managed forest’ definition is not
clear at this time, but could include forests in Victoria’s parks and other public land, if they are
deemed ‘managed forests’. This will depend on how the Commonwealth will translate the
international accounting obligation into a domestic policy decision about responsibility for carbon
management of forests.
If parks were defined in the future as ‘managed forests’, this would mean that existing stocks of
carbon in Victorian parks are potential economic liabilities (if carbon is released through
environmental degradation or disturbances) or an asset (if further carbon sequestration occurs).
Links to other services
The storage and removal of carbon dioxide by a forest or wetland ecosystem are connected to other
regulating services, including habitat services, air filtration and water filtration.
Quantity of service provided
Land carbon storage
The estimated volume of carbon currently stored in Victorian terrestrial parks is around 270 million
tonnes74 (almost 1 billion tonnes of carbon dioxide equivalent75), which is equivalent to around nine
years of Victoria’s total annual greenhouse gas emissions76. The table below shows the estimated
carbon stocks in twelve national parks.
Table A2.6 Average above ground carbon stocks in selected Victorian parks
Park Estimated carbon stocks
(million tonnes) Approximate area
(hectare) Average tonnes of carbon per hectare
Alpine National Park 71 662,000 106
Murray-Sunset National Park 21 666,000 31
Snowy River National Park 16 115,000 142
Croajingalong National Park 15 87,000 176
Great Otway National Park 14 103,000 135
Yarra Ranges National Park 12 77,000 156
Wyperfeld National Park 10 360,000 27
Grampians National Park 9 168,000 54
Coopracambra National Park 7 38,000 191
Errindundra National Park 6 40,000 158
Wilsons Promontory National Park 5 47,000 107
Avon Wilderness Park 4 40,000 99
Source: Land carbon 3 model (DSE 2012) which used the National Carbon Accounting Toolbox Full Carbon Accounting Model along with DSE corporate data such as fire and harvesting history, vegetation type and soil type.
The Alpine National Park accounts for nearly one quarter of the carbon stocks in the Victorian parks
network, with around 70 million tonnes of carbon stored. The parks of eastern Victoria with their tall
74 Data on carbon stocks based on Land carbon 3 model (DSE 2012) which used the National Carbon Accounting Toolbox Full Carbon Accounting Model along with DSE corporate data such as fire and harvesting history, vegetation type and soil type. 75 1 tonne of carbon = 3.664 tonnes of carbon dioxide equivalent. 76 Victoria’s annual emissions in 2010-11 were 118 million tonnes of carbon dioxide equivalent. See Commissioner for Environmental Sustainability Victoria 2013,Victoria State of the Environment 2013 Report.
84
wet forests (such as Yarra Ranges National Park) store much larger volumes of carbon per hectare than
similar sized parks in drier landscapes. Some parks such as Murray-Sunset and Wyperfeld National
Parks provide an important role in storing large amounts of carbon, because of their large size.
The modelled estimates are likely to be conservative. Recent studies based on measured field data
indicate that the volumes of carbon from healthy forests may be significantly higher than the
modelled estimates. For example, in the Central Highlands, carbon stocks were measured to be
between two and five times that estimated by the model, depending on vegetation type and age since
the last major fire77.
Land carbon sequestration
The volume of carbon sequestered varies according to vegetation type as well as the age of the
vegetation. There are currently limited estimates available. The quantity of sequestration is thought to
be relatively small, but as discussed above, there is recent evidence suggesting that park ecosystems
may play a more significant role as sequesters of carbon than previously thought. The expected
outcomes of two major revegetation programs described below provide an indicative value of carbon
sequestration from revegetation programs in selected parks.
Greenfleet revegetation program in parks
Since 2000 approximately 1,000 hectares across 30 parks have been revegetated under the Greenfleet
revegetation program. Greenfleet has estimated that carbon sequestration across these parks due to
this program could be up to 350,000 tonnes by year 20 and 500,000 tonnes by year 100 (in tonnes CO2
equivalent, this is 1.3 and 1.8 million respectively). Based on these estimates, this would give carbon
sequestration flows of about 18,350 tonnes of carbon dioxide equivalent being sequestered every year
and an average sequestration rate of 5 tonnes of carbon per hectare per annum.
Two Million Trees program
Suitable carbon data was not available for this program. A high level analysis based on a conservative
estimate of 2 tonnes of carbon per hectare per annum78 indicates that 500 hectares of revegetation
could provide additional carbon sequestration by approximately 70,000 tonnes by year 20 and
100,000 tonnes by year 100 (this is 257,000 and 367,000 CO2 equivalent, respectively). Upon maturity
of the forest, this would give about 3,670 tonnes of carbon dioxide equivalent being sequestered
every year.
Blue carbon storage and sequestration
The Victorian parks network contains more than 25,000 hectares of mangrove, saltmarsh and seagrass
habitats. Emerging research suggests that these coastal wetland ecosystems may be significant for
both carbon storage and sequestration, with global estimates from the literature of 830 tonnes of CO2
equivalent per hectare 79.
77 Keith, H., D. Lindenmayer, B. Mackey, D. Blair, L. Carter, L. McBurney, S. Okada, and T. Konishi-Nagano. 2014. Managing temperate forests for carbon storage: impacts of logging versus forest protection on carbon stocks. Ecosphere 5. http://dx.doi.org/10.1890/ES14-00051.1 78 Based on carbon sequestration rate of revegetation sites in the dryland regions of South Australia of 7.6 CO2-e t/ha/year 79 See http://www.thebluecarboninitiative.org ; CSIRO http://www.csiro.au/Organisation-Structure/Flagships/Wealth-from-Oceans-Flagship/ORCA/Coastal-Carbon-Cluster.aspx; Fourqurean, JW., C.M Duarte, H.Kennedy, N.Marba, M.Holmer,

85
Recent studies in Victoria80 have quantified the volume of carbon within coastal habitats. Table A2.7
below highlights that in over 25,000 ha of mangrove, saltmarsh and seagrass habitats protected within
the States Marine Protected Areas, more than 850,000 tonnes of carbon or over three million of
carbon dioxide equivalent is stored.
Table A2.7 Carbon stored (tonnes) in Victoria’s Marine Protected Areas
Park name Marine ecosystem Area
(hectare) Carbon stored
per hectare Total quantity of
carbon stored
Wilsons Promontory Marine Park Saltmarsh 10 62 616
Shallow Inlet Marine & Coastal Park Saltmarsh 104 62 6,523
Seagrass 836 19 16,062
Corner Inlet Marine & Coastal Park Mangrove 817 52 42,175
Saltmarsh 362 62 22,616
Seagrass 10,656 19 204,810
Nooramunga Marine & Coastal Park Mangrove 2,082 52 107,509
Saltmarsh 3,062 62 191,146
Seagrass 2,123 19 40,799
Churchill Island Marine National Park Mangrove 15 83 1,243
Saltmarsh 3 104 293
Seagrass 445 38 16,994
Corner Inlet Marine National Park Mangrove 4 52 197
Saltmarsh 1 62 85
Seagrass 1,020 19 19,607
French Island Marine National Park Mangrove 204 83 16,897
Saltmarsh 7 104 766
Seagrass 1,039 38 39,642
Port Phillip Heads Marine National Park Saltmarsh 27 104 2,825
Seagrass 1,875 38 71,522
Yaringa Marine National Park Mangrove 313 83 25,966
Saltmarsh 149 104 15,422
Seagrass 276 38 10,538
Jawbone Marine Sanctuary Mangrove 0 83 15
Saltmarsh 1 104 58
Seagrass 2 38 67
Mushroom Reef Marine Sanctuary Seagrass 12 38 442
Ricketts Point Marine Sanctuary Seagrass 2 38 70
Total 25,445 34 854,905
Source: Deakin University, 2014
Counterfactual: the world without parks
In the absence of parks, the counterfactual is that national and State (non-metropolitan) parks would
have been cleared and used for grazing, while current metropolitan park areas would have been used
for residential development. In the case of blue carbon currently stored in wetlands and saltmarsh,
MA.mateo, E.T.Apostolaki, G.A Kendrick, D.Krause-jensen and K.J McGlathery, 2012, Seagrass ecosystems as a globally significant carbon stock, Nature Geoscience 5. Pp. 505-509. 80 Paul Carnell, Carolyn Ewers, Ellen Rochelmeyer, Daniel Ierodiaconou, and Peter Macreadie 2014, The Distribution and
Abundance of ‘Blue Carbon’ within East Gippsland A report for the East Gippsland Catchment Management Authority

86
alternative land uses if the ecosystems were not protected could include clearing or dredging for
resource extraction.
Under the counterfactual, some part of the carbon stored in parks would have been released as part
of the soil disturbance associated with the clearing process and grazing activities, while wetland and
coastal areas may be more affected by increased degradation of the ecosystems. The amount
potentially released under the counterfactual would largely depend on the use and disposal of
vegetation and trees biomass. However, at this stage it was not possible to assess the amount of
carbon that would be released under the counterfactual.
In terms of carbon sequestration, parks provide a net benefit from the forests and vegetation it
currently supports, which would be largely inexistent if parks did not exist.
Valuation method
Carbon sequestration
We consider two unit values of carbon sequestration. One is market price of reductions in emissions of
carbon dioxide equivalent in current markets and the other is the social cost of carbon, which is the
value of damage costs associated with greenhouse gas emissions. With the repeal of the
Commonwealth Government’s carbon price legislation, there is currently no legislated market price of
carbon in Australia. The current cost of purchasing emission reductions in international markets has
been estimated at AUD $0.50 to $2 per tonne of carbon dioxide equivalent for Clean Development
Mechanism credits81, while European Union Allowance (EUA) prices stabilised around EUR $5 per
tonne of carbon dioxide over 2013 and California Carbon Allowance (CCA) prices reached AUD $15 per
tonne of carbon dioxide82. Forecasts of international carbon prices for 2020 range from AUD $6 to $80
per tonne of carbon dioxide equivalent83.
In terms of carbon sequestration from forestry or revegetation projects, current market transactions
through the Carbon Farming Initiative indicate values closer to $23 per tonne carbon dioxide
equivalent, however industry stakeholders have indicated that under the newly created Emissions
Reductions Fund (ERF) these values are likely to be set at around $5-8 per tonne of carbon dioxide
equivalent84, which would be less than outlined in the original plan announced of $15 per tonne85. For
the purpose of this valuation, the originally announced $15 per tonne of carbon sequestered is used as
a lower bound for carbon sequestered in parks. This is consistent with recent voluntary carbon offset
programs such as Greenfleet.
As the upper bound, this valuation uses the social cost of carbon. The social cost of carbon is a
modelling estimate of the total cost today of a tonne of carbon emitted now, summing the full global
cost of the damage associated with carbon over the whole of its time in the atmosphere. The social
81 Commonwealth of Australia (Climate Change Authority) 2014, Reducing Australia’s Greenhouse Gas Emissions, Targets and Progress Review – Final Report. 82 Parliament of Australia 2013, Emission Trading Schemes around the world - Background note (available in www.aph.gov.au) 83 Ibid 84 Personal communication with James Schultz, CEO of GCS and Board member of the Carbon Market Institute (2 August 2014) 85 The Coalition’s proposed ‘Direct Action Plan: Environment & Climate Change 2010’ recommended using $15 per tonne for carbon sequestered in domestic forestry projects that are successful under the national Emissions Reduction Fund (ERF).

87
cost of a tonne of carbon dioxide emitted now has been estimated in a recent study published by the
US Government at US$3986 in 2011 dollars (around AUD$63 in 2014).
The valuation could be applied to specific reforestation programs undertaken in parks only, as there
was not data at the park model or suitable DELWP models available for a broader statewide
assessment of carbon sequestration across the parks network.
Carbon storage
There is no existing market mechanism for valuing carbon storage services. However, there is
increased interest in financial incentives to avoid release of carbon from ecosystems in the first place,
so-called ‘Reduced Emissions from Deforestation and Degradation’ (REDD).
There are a number of possibilities for valuing the benefits of carbon storage services from parks.
1. Some studies derive the benefit of current storage services by comparing the situation where
all carbon is released. They treat carbon storage as an investment with valuation over a
number of years using market prices or the social cost of carbon. However, if parks were not
protected areas it is unlikely that all carbon would be released and therefore this value is an
upper bound.
2. An accounting approach would treat carbon storage as a liability associated with ecosystem
assets due to the potential or expected release of emissions. If there were no chance of the
carbon being lost there would be no service flow. An estimate of the expected transaction
value of the liability could be derived based on the probability of the release of emissions
under current conditions and management. However, this provides a value for the ecosystem
asset (liability) rather than the service of carbon storage.
3. An alternative is to consider parks as providing insurance to the community by storing the
carbon. Using this approach the expected liability (i.e. the value of the carbon stock adjusted
for chance of loss) would be the expected claim. The premium would be the cost to store the
carbon some other way (using a replacement cost approach). The value of the storage service
would be the premium received less the expected claim.
None of the options outlined above was considered to be realistic and therefore this report presents
the volume of carbon stored and its monetary value only. This is not sufficient information to assess
the benefits of parks in this respect, indicating that ongoing work to progress the valuation of this
ecosystem service would require further modelling to calculate the level of carbon emissions that
would have occurred under the counterfactual.
Value of benefits
If all carbon stored in parks would be released from changing land use, the cost to offset these
emissions would be valued at around $15 billion (note this value is not annualised), based on an
announced market price of $15 per tonne CO2e. The total social cost of the emissions (without any
offsets) is estimated at $63 billion based on the social cost of carbon. These estimates are indicative
only as they reflect the upper value of the cost if all carbon stored were released, however a detailed
86 Source: US EPA 2013, The social cost of carbon. In http://www.epa.gov/climatechange/EPAactivities/economics/scc.html
88
assessment was not feasible to assess realistically how much carbon could be lost under the
counterfactual. This value is not annualised and does not take into account the likelihood of other
types of natural release.
The sequestration potential across the whole of the parks network could not be quantified, due to lack
of data. However, based on the information of two major revegetation programs in parks, it is
estimated that around 21,000 tonnes of carbon dioxide equivalent could be sequestered annually. The
sequestration through these two reforestation or revegetation programs in the first 30 years would
be potentially valued at over $1 to $5 million per annum, using a market price of $15 per tonne CO2e
as the lower bound and the social cost of carbon as the upper bound. Over the first 30 years, this gives
a Net Present Value of about $18 to $75 million.

89
(iv) Pollination and seed dispersal
Benefit and beneficiary
Native and introduced pollinators support agricultural activity providing benefits to agricultural
producers and consumers.
Context
The forest, woodland and other habitats of the parks network provide a range of pollinator species
such as insects, birds and bats that pollinate plants and trees that are essential for the development of
fruits, vegetables and seeds for human use. European honeybees are the most common pollinators of
agriculture in Australia, while other species, including native bees and other insects, also perform
some pollination for agriculture.
The extent to which agriculture is dependent on pollinators is significant with 65% of horticultural and
agricultural crops introduced in Australia requiring honeybees for pollination87. Some crops, such as
such as almonds, are highly dependent on pollination by honeybees for production (dependence on
honeybees has been estimated for 35 Australian crops, ranging from 10% for peanuts up to 100% for
almonds, i.e. the removal of honeybees would lead to loss of all almond production) 88.
Some pollination services are paid (particularly in almond orchards of Victoria and South Australia),
with beekeepers receiving income from placing hives adjacent to flowering crops. However, the large
majority of pollination services are unpaid (incidental pollination), and represent a beneficial or
positive externality derived from beekeeping activities89. Both native and introduced pollinators
provide a direct service to agriculture as well as an indirect service to the community through their
contribution to ecosystem health and resilience.
Links to other services
As well as providing a final service to agriculture, pollination is an intermediate service contributing to
the maintenance of genetic diversity and ecosystem insurance. Honeybees also provide the
provisioning service of supply of honey and other bee products.
Counterfactual: the world without parks
In the absence of parks, the counterfactual is that national and State (non-metropolitan) parks would
have been cleared and used for grazing, while metropolitan park areas would have been used for
residential development. In line with the counterfactual for honey supply in Section A2.1, under the
counterfactual, any pollination services depending on park ecosystems would be lost.
Quantity of service provided
Since different crops depend to a different extent on honeybee pollination, the quantity of service
provided is measured here by the number of bee sites within parks. As discussed in the honey supply
87 Gibbs, D. & Muirhead, I. 1998, ‘The economic value and environmental impact of the Australian beekeeping industry’, prepared for the Australian Beekeeping Industry, p. 26. 88 Gordon, J. & Davis, L. 2003, ‘Valuing honeybee pollination’, Centre for International Economics, prepared for the Rural Industries Research and Development Corporation, p 7. 89 Department of Sustainability and Environment 2012, ‘Putting the buzz back in agriculture, Background – Issues paper’, p. 3-4.

90
service section, the estimated proportion of bee sites on land managed by Parks Victoria is 28%-38%
of the Victorian total or around 1,235-1,694 sites90.
Valuation method
The valuation method used is benefit transfer from a valuation study in Australia by Gordon and
Davies (2003) applying the productivity cost method91. The Australian value for pollination was then
apportioned based on the proportion of bee sites in Victoria.
Gordon and Davis (2003) used available market data to assess the sum of the changed consumer and
producer surplus in each of domestic, import and export markets for 35 Australian agricultural
products depending on honeybee pollination. This involved developing 35 partial-equilibrium models
to obtain how prices and quantities would change after a supply shock, where pollination is an input.
Other earlier studies used Gross Value Product to measure the impact on economic activity and
focused on the expected change in production with a loss of pollination. Market data is available for
paid pollination services in Victoria ($50-$70 per hive)92, but this market value is insufficient, as it
assumes zero costs and accounts for a small share of all pollination services only.
Value of benefits
The value of pollination services across Australia has been estimated to be over $1.7 billion per annum
($877 million is the benefit to producers across 35 crops and $839 is a benefit to consumers, as
without pollination reduced supply in some agricultural products would drive higher prices or certain
products would not be available)93. Victoria has 17% of the total number of bee hives in Australia94.
Based on the proportion of bee sites in Victorian parks, the value of pollination services from parks is
estimated to be between $123 and $167 million 2014 AUD per annum.
In terms of relevant economic activity, pollinators receive payment for about $3.3 million per year
across Australia95, with early estimates for Victoria of about $0.6 to $1 million per annum96. Similar to
honey production, this represents the economic activity associated with park-based pollination, which
is larger than the value directly attributable to Victorian parks. In 2012, the gross value of Victorian
agricultural produce linked to both direct and indirect honeybee pollination was estimated to be $400
million per annum97.
90 Department of Sustainability and Environment 2012, ‘Putting the buzz back in agriculture, Background – Issues paper’, p. 4. 91 Gordon, J. & Davis, L. 2003, ‘Valuing honeybee pollination’, Centre for International Economics, prepared for the Rural Industries Research and Development Corporation. 92 Market based valuation techniques have also been used to derive an implicit price for pollination services to Australian agriculture. Department of Sustainability and Environment 2012, ‘Putting the buzz back in agriculture, Background – Issues paper’, p. 4. 93 Valuation is usually assessed in the short-term, but in the longer term, additional modelling indicates that if producers absorb some income loss or both producers and consumers shift their activities towards other sectors not dependant on pollination, this value could be reduced to between $100 million to $1.2 billion per annum. See Gordon, J. & Davis, L. 2003, ‘Valuing honeybee pollination’, Centre for International Economics, prepared for the Rural Industries Research and Development Corporation. 94 RIRDC 2008. Australian honeybee industry survey, 2006-07. RIRDC Publication No. 08/170 95 Centre for International Economics 2005, ‘Future directions for the Australian honeybee industry’, p. 9. 96 Gibbs and Muirhead 1998, The economic value and environmental impact of the Australian beekeeping industry. A report prepared for the Australian beekeeping industry. February 1998. p. 28. 97 Department of Sustainability and Environment 2012, ‘Putting the buzz back in agriculture, Background – Issues paper’, p. 27.

91
(v) Coastal asset protection
Benefit and beneficiary
Coastal wetland and dune habitats protect community assets from storm surge events, sea inundation
and coastal erosion.
Context
Around 19% of the State’s population live by the coast and many coastal communities rely on stable
and healthy coastal ecosystems, which could avoid inundation of homes and assets from storm and
tidal surges. Parks Victoria manages around 70% of the Victorian coast as national or State parks,
coastal reserve or marine national park or sanctuary.
Coastal and marine habitats including mangrove, salt marsh, seagrass and coastal dune systems can be
described as ‘living infrastructure’ that provide important coastal protection services by absorbing
wave energy, helping to minimise shoreline areas from storm damage, inundation and erosion. If
intact, these ecosystems can provide highly cost effective natural buffers against incoming waves. By
protecting against storm damage, flooding, and erosion, these habitats protect human populations
and help mitigate economic loss of coastal assets.
Coastal ecosystems are threatened by a range of human and other pressures, which can reduce the
quantity of ecosystem services provided, leading to detrimental economic impacts. Without these
functioning ecosystems, alternative infrastructure such as sea walls and breakwaters would be
required to manage storm surges and inundation events.
The frequency, extent and magnitude of coastal and river inundation is likely to be altered by climate
change over time and through the combined interactions with sea level rise, tide ranges, storm surges
and other coastal processes. These are likely to lead to greater coastal inundation and erosion that
may cause damage and loss to property, infrastructure and the environment.
The Victorian Government’s Report on Climate Change Science and Greenhouse Gas Emissions in
Victoria 2012 indicates that 100-year storm tide return periods between Cape Schanck and Wilsons
Promontory may reduce to one to two years by the end of the century98. A recent report by CSIRO99
highlighted that in Western Port Bay, storm surges that currently occur at 1:100 years may occur at 1:4
years by 2070 with at least 12,000 residential houses at threat.
The Victorian Coastal Strategy 2008 has indicated a number of priorities to deal with potential climate
change impacts in the Victorian coastlines. As a result, the Victoria Planning Provisions now require
that Victorian planning authorities plan for possible sea level rise of 0.8 metres by 2100, and allow for
the combined effects of tides, storm surges, coastal processes and local conditions. The importance of
intact and stable coastal ecosystems for coastal protection services will become more important into
the future.
98 McInnes, KL, Macadam, I and O’Grady, J 2009 The effect of climate change on extreme sea levels along Victoria’s coast. Report to the
Victorian Government Department of Sustainability and Environment, CSIRO, Australia. 99 Fletcher, CS, Taylor, BM, Rambaldi, AN, Harman, BP, Heyenga, S, Ganegodage, KR, Lipkin, F & McAllister, RRJ 2013, Costs and coasts: An
empirical assessment of physical and institutional climate adaptation pathways, National Climate Change Adaptation Research Facility, Gold Coast, 53 p

92
Links to other services
Coastal, estuarine and marine habitats play an important role in providing habitat services, including
nursery services for fisheries. Coastal wetlands provide also storage and sequestration of carbon to
regulate climate, filtering and detoxifying water and recreation services, in particular recreational
enjoyment, tourism and broader amenity benefits.
Counterfactual: the world without parks
In the absence of parks, the counterfactual is that current coastal wetlands would not be protected
and therefore cleared or be left to degrade. This would lead to their deterioration of coastal
ecosystems to a point where they would not be able to provide protection against storm surge events,
sea inundation or coastal erosion.
Quantity of service provided
Victoria’s parks protect over 80,000 hectares of intertidal and sandy coastal habitats along 722 km of
the coastline, in addition to 585 km of rocky coastline. Of this, Parks Victoria suggests that 285 km are
located around coastal townships and communities.
Table A2.8 Area and length of coastal beach and wetland systems in parks
Shoreline habitat Parks network (ha) Parks coastline total (Km) Coast near coastal communities (Km)
Coastal and sandy beach EVCs 48,720 527 160
Intertidal habitats 33,100 195 125
Total 81,800 722 285
The majority of intertidal habitats that protect coastal communities are located in Western Port Bay
(including Yaringa Marine National Park and Northern Westernport Nature Conservation Reserve,
which cover over 90km of coastline) and northern Port Phillip Bay. Both locations are vulnerable to
storm surges and very vulnerable to sea level rise.100 Sandy shore habitats that protect coastal
communities include the Mornington Peninsula National Park, Nooramunga Marine and Coastal Park,
Point Cook Coastal Park and Jawbone Flora and Fauna Reserve as well as the Gippsland Lakes Coastal
Park. For some parks with limited coastal communities, only those sections of the park that are
adjacent to communities are included in the estimate above. This includes Tidal River at Wilsons
Promontory. Note the parks network also includes approximately 550 km of rocky shoreline which,
although is subject to increasing pressure from storm surges and sea level rise, has been considered as
being of lower risk to coastal communities for this assessment.
Valuation method
The valuation method is based on deriving a high-level estimate of the replacement cost of protection
services for coastal communities through either hard engineering infrastructure (e.g. seawalls) or a
combination of hard engineering and restoration of living infrastructure (through revegetation
projects). The values are indicative and were derived for two coastal protection approaches:
Protection of all coastal assets along the park coastline through infrastructure (hard
engineering via sea wall)
100 http://www.climatechange.vic.gov.au/adapting-to-climate-change/future-coasts/victorian-coastal-inundation-dataset

93
Targeted strategy for the protection of main towns and surrounding areas with restoration of
original ecosystem for the remainder
The estimates are based on the average costs of construction for seawall/rockwall structures of $3,000
per metre as an alternative to living infrastructure, quoted to Parks Victoria for this project
(summarised in Table A2.9). Alternative protection mechanisms may include purchase of additional
land or retreat of assets further inland, however these options are likely to be more expensive.
Table A2.9 Value of coastal protection services provided by parks
Scenario 1 – Protection of all coastal assets through infrastructure (hard engineering via sea wall)
Scenario 2 – Targeted strategy for the protection of main towns with restoration of original ecosystem for the remainder
Km million $AUD Km million $ AUD
Seawall construction1 285 $855 90 $270
Intertidal restoration (mangrove, saltmarsh) replacement restoration2
n/a n/a 90 $54
Coastal dune replacement/restoration3 n/a n/a 95 $38
Total avoided capital costs 285 $855 285 $362
Avoided cost per annum4 $56 $24
1 Seawall construction @$3,000/m; 2 Intertidal wetlands replacement/restoration @$60,000/ha; 3 Coastal dune restoration @$40,000/ha; 4 externalities for the civil works could be assessed and taken into account
It should be recognised that these results are the best estimates obtained with the data available at
the time of this project, but there are a range of uncertainties associated with this assessment that
deserve further investigation. This includes confirming the physical distances required and the level of
demand for the protection services described above. One key uncertainty is how resilient and effective
marine habitats would be as a buffer, particularly as sea levels rise and ocean temperatures increase
under relevant climate change scenarios (e.g. whether newly regenerated areas die as sea levels rise
or might migrate up the coastline).
Value of benefits
Based on the valuation method and assumptions described above, the benefits of coastal protection
from parks ecosystem assets are estimated at about $24 to $56 million per annum, derived from the
following two options:
If all the intertidal and sandy coastal ecosystems of parks were lost or degraded to a point
where they were no longer providing their coastal protection service, it would cost $855
million (or $56 million per annum) in capital costs to replace these services through alternative
engineered structures (such as sea walls) to provide equivalent protection across the 285
kilometres of park coastline with local communities.
If a more targeted approach of using a combination of ‘hard engineering’ via seawalls in
priority locations with restoration of coastal systems is undertaken for the remainder of the
285 km of coast, the capital cost required would be $362 million (or $24 million per annum).

94
(vi) Maintenance of nursery habitats
Benefit and beneficiary
Parks’ ecosystems provide the environment and nutrients to support spawning and recruitment
processes, which benefit recreational and commercial fisheries along with genetic diversity.
Context
Marine and coastal parks provide an important service by providing healthy nursery habitats for the
recruitment of juvenile species used for commercial and recreational uses such as fishing. Of particular
importance is the role that parks play in protection and conservation of seagrass, mangrove and reef
habitats, which are recognised around the world as providing essential nursery and recruitment
services for many species.
Links to other services
Habitat nursery services are linked to provisioning services in fishing industries and other regulating
services such as water purification. They are also linked to cultural services, including recreational use,
cultural connection and health.
Quantity of service provided
According to Parks Victoria data, nearly 22,000 hectares of coastal wetlands that are located within
the parks network provide nursery services, including seagrass and mangrove communities. About
18,000 hectares of this area consists of seagrass communities. The Corner Inlet Marine National Park
and Corner Inlet Marine and Coastal Parks contain the majority of seagrass habitat areas comprising
nearly 12,000 hectares.
A recent study provides estimates of total annual enhancement across a number of species that are
commercially fished in Victoria, such as King George whiting. For this species, seagrass habitat are
estimated to provide an annual enhancement (across all age classes) of 0.51grams/m2 101. Across the
parks network this gives about 93 tonnes of fish stock per year. The table below shows the total fish
stock per year that parks provide for species that are commercially fished in Victoria. However, this
represents the quantity of fish stock provided by parks, as opposed to realised catch by commercial
fisheries.
Table A2.10 Quantity of fish stock per year provided by parks
Fish name Annual enhancement (g per m2) Annual enhancement by parks (tonnes)
Australian anchovy 0.012 2.19
Blue weed whiting 0.702 128.36
Southern sea garfish 0.008 x 10⁻² 0.015
Six-spined leatherjacket 8.674 1,586.00
Yellowfin leatherjacket 11.152 2,039.08
King George whiting 0.507 92.70
Total - 3,848.35
Source: Blandon and zu Ermgassen (2014)
101 Blandon, Abigayil and zu Ermgassen Philine S.E. 2014. ‘Quantitative estimate of commercial fish enhancement by seagrass
habitat in southern Australia’. Estuarine, Coastal and Shelf Science 141, pp.1-8.

95
Counterfactual: the world without parks
In the absence of parks, the counterfactual is that the non-metropolitan parks would have been cleared
and used for an alternative land use such as grazing, while metropolitan park areas would have been
used for residential development. Marine and coastal parks would no longer be protected areas and
would be subject to the same fishing, aquaculture, industry and recreational activity as non-protected
areas of Victoria’s waters and coastline. Alternative land uses if the ecosystems were not protected
could include clearing or dredging for resource extraction. Under the counterfactual, increased
commercial use would result in the degradation and loss of coastal wetlands, seagrass, mangrove and
reef, which provide nursery habitat for the recruitment of juvenile fish species.
As a result of the reduction in nursery habitat, the stock of certain fish species would diminish. Over
time this would impact on commercial fish catch and the productivity and profitability of the Victorian
fishing industry. As a result, producers would reduce their catch of local species. In the long-term,
producers would adjust by shifting to other Australian regions, while consumers would purchase fish
imported from interstate or overseas or would consume substitutes.
Valuation method
The analysis adopted for this project is based on benefit transfer of a recent assessment of abundance
of juvenile commercial species in southern Australian seagrass habitats, based on a meta-analysis of
relevant Australian research that included five Victorian studies102. This study estimated the economic
value of enhancement from juvenile commercial species applying the productivity approach on
primary data on the maintenance of nursery habitats. Species not recorded in Victoria were excluded
from the valuation. These values reported represent the stock enhancement where all fish species are
present, as opposed to realised catch. Based on this study, a value of $3,000 per hectare was used as a
central estimate103 for the value of seagrass habitats for nursery services across all seagrass habitats in
Victorian parks.
Value of service
Welfare values for this ecosystem service could not be assessed due to poor data availability.
Based on the above valuation study, the output value of seagrass habitats in parks for juvenile fish
enhancement is estimated at around $54 million, which is about $3.5 million per annum after
accounting for fish recruitment lags104. This represents the potential gross value of fish production if it
could all be caught, it does not take into account catch rates or other commercial fishing inputs. This
value therefore overestimates the likely market value that can be realised from fish enhancement.
A market value for realised catch can be calculated using price data available from the former
Victorian Department of Primary Industries (now the Department of Economic Development, Jobs,
Transport and Research). For fish identified as being recruitment enhanced in seagrass habitat105, the
102 Blandon, Abigayil and zu Ermgassen Philine S.E. 2014. ‘Quantitative estimate of commercial fish enhancement by seagrass habitat in southern Australia’. Estuarine, Coastal and Shelf Science 141, pp.1-8. 103 Most species in the above study were assessed to reach an economic value of enhancement associated with seagrass between AUD $800-7,000 per hectare. 104 The study notes that it takes at least 26 years for all fish to be fully recruited to the habitat after restoration. The annual values are calculated over a 30-year timeframe and a 5% discount rate. 105 The fish species that were included in the valuation of nursery habitat are Australian anchovy, blue weed whiting, southern sea garfish, leatherjackets, and King George whiting. These species were identified as being stock enhanced by

96
total market value of fisheries catch was $2.8 million for the whole of Victoria in 2009-10106, largely
due to King George whiting catch which was valued at $2.1 million. There are around 47,000 hectares
of seagrass in the whole of Victoria107, with 18,000 hectares located in marine parks. Based on this, the
value of fisheries catch dependent on seagrass habitat in parks is approximately $1.1 million per
annum. This represents the economic activity associated with parks’ maintenance of nursery
populations, which is larger than the value directly attributable to parks.
It is important to note that this value for seagrass habitats is based on fish prices provided by the State
Departments and relevant agencies in Australia, such as the Department of Environment and Primary
Industries, the South Australian Research and Development Institute and Department of Fisheries
Western Australia. Therefore, these values should be tracked over time to account for changes in
market trends and fish stocks, particularly in highly valued species. A comparison with other seagrass
valuation studies for fish production shows that the central estimate adopted in this analysis is
conservative108.
Further work is required to quantify the extent of the nursery service provided by both seagrass and
mangrove habitats as nursery habitats in Victoria, as well as to generate a more robust economic
value of these habitats for their nursery services. This is also the case for other marine habitats such as
sub-tidal reefs, which provide nursery services for some commercial and recreational species.
seagrass habitat and commercially fished in Victoria. See Blandon, Abigayil and zu Ermgassen Philine S.E. 2014. ‘Quantitative estimate of commercial fish enhancement by seagrass habitat in southern Australia’. Estuarine, Coastal and Shelf Science 141 and Department of Primary Industries 2012. ‘Fisheries Victoria Commercial Fish Production Information Bulletin 2012’. 106 Department of Primary Industries 2012. ‘Fisheries Victoria Commercial Fish Production Information Bulletin 2012’. p. 4. 107 Lawrence, A.J., Baker, E., Lovelock, C.E. 2011, Optimising and managing coastal carbon: Comparative sequestration and mitigation opportunities across Australia’s landscapes and land uses. Fisheries Research and Development Corporation (FRDC) Report 2011/084, p. 40. 108 A summary of valuation studies is available in: Unsworth, R. and Cullen-Unsworth, L. 2010. ‘A dollar value on seagrass’. Seagrass-Watch News. McKenzie, L. J., Yoshida R.L. and Unsworth, R. (Eds) Issue 41, June 2010. Seagrass Watch HQ. 24pp.
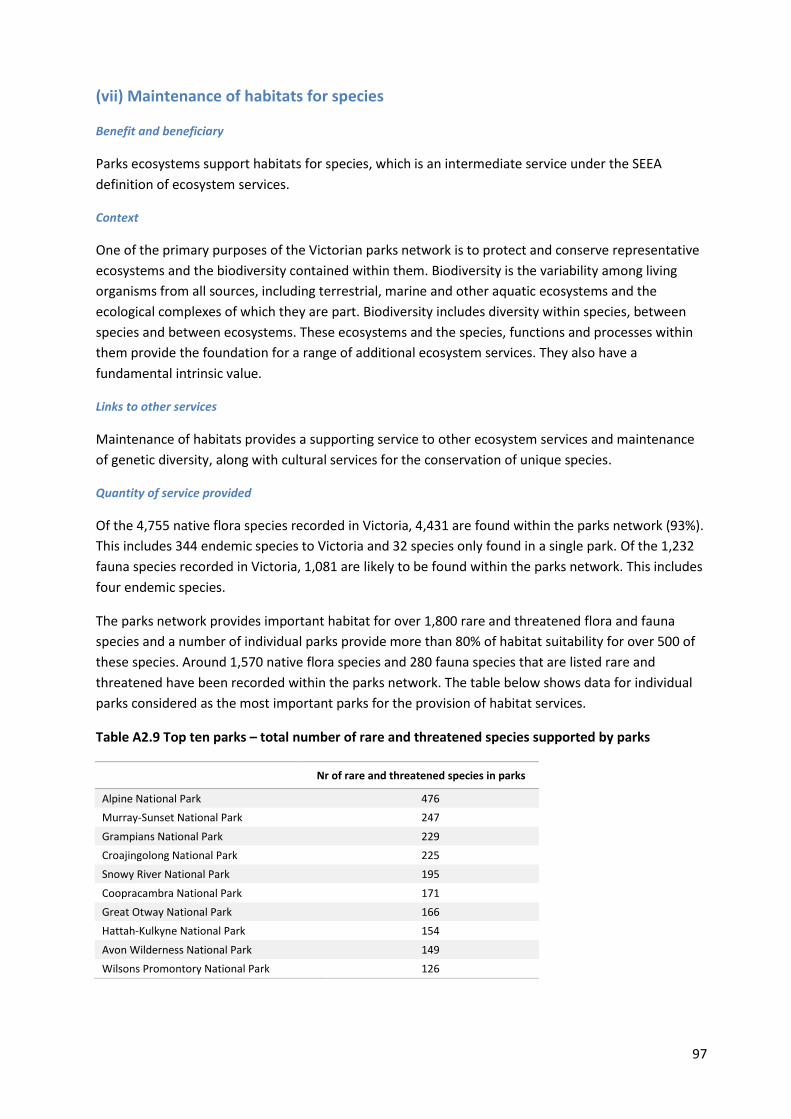
97
(vii) Maintenance of habitats for species
Benefit and beneficiary
Parks ecosystems support habitats for species, which is an intermediate service under the SEEA
definition of ecosystem services.
Context
One of the primary purposes of the Victorian parks network is to protect and conserve representative
ecosystems and the biodiversity contained within them. Biodiversity is the variability among living
organisms from all sources, including terrestrial, marine and other aquatic ecosystems and the
ecological complexes of which they are part. Biodiversity includes diversity within species, between
species and between ecosystems. These ecosystems and the species, functions and processes within
them provide the foundation for a range of additional ecosystem services. They also have a
fundamental intrinsic value.
Links to other services
Maintenance of habitats provides a supporting service to other ecosystem services and maintenance
of genetic diversity, along with cultural services for the conservation of unique species.
Quantity of service provided
Of the 4,755 native flora species recorded in Victoria, 4,431 are found within the parks network (93%).
This includes 344 endemic species to Victoria and 32 species only found in a single park. Of the 1,232
fauna species recorded in Victoria, 1,081 are likely to be found within the parks network. This includes
four endemic species.
The parks network provides important habitat for over 1,800 rare and threatened flora and fauna
species and a number of individual parks provide more than 80% of habitat suitability for over 500 of
these species. Around 1,570 native flora species and 280 fauna species that are listed rare and
threatened have been recorded within the parks network. The table below shows data for individual
parks considered as the most important parks for the provision of habitat services.
Table A2.9 Top ten parks – total number of rare and threatened species supported by parks
Nr of rare and threatened species in parks
Alpine National Park 476
Murray-Sunset National Park 247
Grampians National Park 229
Croajingolong National Park 225
Snowy River National Park 195
Coopracambra National Park 171
Great Otway National Park 166
Hattah-Kulkyne National Park 154
Avon Wilderness National Park 149
Wilsons Promontory National Park 126

98
The Alpine National Park supports the highest number of rare and threatened species at over 470
species. For over 120 of these species, the Alpine National Park provides at least 80% of the most
suitable habitat found in the State – suggesting high dependency of these species on the park.
Table A2.11 Top ten parks – number of rare and threatened species with most suitable habitats
Number of species for which park provides
over 80% of habitat suitability
Alpine National Park 127
Grampians National Park 66
Murray-Sunset National Park 38
Croajingolong National Park 32
Little Desert National Park 15
Wilsons Promontory National Park 12
Hattah-Kulkyne National Park 9
Mount Buffalo National Park 9
Wyperfeld National Park 8
Baw Baw National Park 8
Thirty-seven communities throughout Victoria that are listed as threatened under the Flora and Fauna
Guarantee (FFG) Act are contained within the park network, as outlined below.
Table A2.12 Flora and Fauna Guarantee (FFG) Act listed threatened communities
FFG-listed community Number of parks
Flora
Alpine Bog Community 8
Alpine Snowpatch Community 1
Caltha introloba Herbland Community 2
Central Gippsland Plains Grassland Community 49
Coastal Moonah (Melaleuca lanceolata subsp. lanceolata) Woodland Community 48
Cool Temperate Rainforest Community 22
Cool Temperate Mixed Forest 0
Creekline Grassy Woodland (Goldfields) Community 171
Devonian Limestone Pomaderris Shrubland Community 1
Dry Rainforest (Limestone) Community 4
Fen (Bog Pool) Community 4
Forest Red Gum Grassy Woodland Community 50
Granite Foothills Spring Wetland (North-East Victoria) Community 8
Grey Box - Buloke Grassy Woodland Community 236
Herb-rich Plains Grassy Wetland (West Gippsland) Community 13
Limestone Grassy Woodland Community 24
Limestone Pomaderris Shrubland Community 1
Montane Swamp Complex Community 1
Northern Plains Grassland Community 254
Plains Grassland (South Gippsland) Community 6
Red Gum Swamp Community No. 1 121
Rocky Chenopod Open Scrub Community 3
Sedge Rich Eucalyptus camphora Swamp Community 1
Semi-arid Herbaceous Pine Woodland Community 219
Semi-arid Herbaceous Pine - Buloke Woodland Community 219

99
FFG-listed community Number of parks
Flora
Semi-arid Northwest Plains Buloke Grassy Woodlands Community 224
Semi-arid Shrubby Pine - Buloke Woodland Community 234
Warm Temperate Rainforest (Coastal East Gippsland) Community 22
Warm Temperate Rainforest (Cool Temperate Overlap, Howe Range) Community 28
Warm Temperate Rainforest (East Gippsland Alluvial Terraces) Community 27
Warm Temperate Rainforest (Far East Gippsland) Community 41
Western (Basalt) Plains Grasslands Community 94
Western Basalt Plains (River Red Gum) Grassy Woodland Floristic Community 55-04 125
Total number of parks with FFG listed flora community 1151
Total number of flora communities 33
Fauna
Butterfly Community No. 1 1
Lowland Riverine Fish Community of the Southern Murray-Darling Basin 94
Port Phillip Bay Entrance Deep Canyon Marine Community 2
San Remo Marine Community 1
Victorian Mallee bird community 23
Victorian temperate-woodland bird community 1365
Total number of parks with FFG listed flora community 1486
Total number of fauna communities 6
Counterfactual: the world without parks
In the absence of parks, the counterfactual is that national and State (non-metropolitan) parks would
have been cleared and used for grazing, while metropolitan park areas would have been used for
residential development. In this context, rare and threatened species dependent on parks would face
increased threats and risks of loss. Some of the species may possibly need to be relocated, which
would lead to greater government expenditure. Under the counterfactual, biodiversity in the State
could be severely impacted and the access for people to enjoy of native species would be very limited.
Valuation method
To assess the value of the intermediate service of habitat service, we used an indicator describing the
relative importance of parks in providing habitats for rare and threatened species. A combination of
condition score and species distribution modelling is used to assess the relative suitability of parks in
providing habitat services. Although this indicator is a characteristic of parks ecosystem asset
condition, it provides an indication of the capability of park assets to provide this service.
Value of benefits
At this stage, the benefits of parks for species have not been assessed in monetary terms. The value of
protection of rare and threatened species could be assessed more easily for specific iconic species, for
which survey data exist or could be collected. This analysis could then take into account the habitat
suitability indicators presented above to attribute the relative contribution of parks in providing
suitable habitat for the preservation of a given species.
100
(viii) Other regulating services for further assessment
(a) Pest and disease control services
Benefit and beneficiary
Parks provide protected habitats for native species that can help controlling pests, benefiting
agricultural producers
Context
Some groups of native species such as birds and bats are major predators of insects including many
crop and forest pests. CSIRO research has found that native vegetation may provide a reservoir of
natural enemies, which have potential to suppress pest populations in crops.109
Victoria’s parks network provides suitable habitats for 20 species of insectivorous bats and more than
120 species of insectivorous birds as well as many other insect eating species such as spiders, reptiles
and mammals. These native species consume millions of insects each year and can act as natural
controllers of pests and diseases on agricultural land to improve productivity. For example, bats can
significantly reduce insects that are harmful to crops and is estimated that a large group of 1,000 bats
can eat 5kg or more of insects per night.
In addition to insectivorous species, Victorian parks provide habitats for 25 native birds of prey, which
can contribute to the management of overabundant pest species such as rabbits and mice.
Declines in the extent and quality of suitable habitats for birds, bats and native insects such as beetles,
could have significant implications for agricultural productivity. While some faunal groups such as bats
are relatively abundant and adaptable within Victoria, other groups such as woodland birds have
suffered long-term declines.
A 2011 study in the US estimated the value of bats to the agricultural industry as roughly $22.9 billion
per annum, indicating the loss of bat species could lead to agricultural losses of a minimum of USD
$3.7 billion per annum.110 Another study found that the value of insects in providing ecological services
in the US was estimated to be at least $57 billion per annum (consisting of $0.38 billion for dung
burial, $3.07 billion for pollination, $4.49 billion for pest control of native herbivores and $49.96 billion
for recreation).111
While many birds, bats and other native species provide an important service to benefit agriculture,
some species (e.g. galah, corella, flying fox, kangaroo) can also be considered as a pest.
Quantity of services and valuation approach
While currently there is limited Australian data to quantify current levels of pest and disease control
services, the value of native fauna in pest control could be estimated as the costs avoided by using
birds or bats instead of pesticides. The proportion of birds or bats, for which parks provide a suitable
habitat, could be used to attribute the total benefits from this ecosystem service to parks.
109 http://www.csiro.au/Outcomes/Environment/Biodiversity/ecosystem-service-pest-control-native-vegetation.aspx 110 Boyle J. G., Cryan P, M., McCracken G.F., and Kunz T.H., 2011. Economic Importance of Bats in Agriculture, Science 332, pp. 41-42. DOI: 10.1126/science.1201366 111 Losey.J.E., and Vaughan. M., 2006. ‘The Economic Value of Ecological Services Provided by Insects’. BioScience 56 No. 4

101
(b) Local climate regulation
Benefit and beneficiary
The vegetation of parks can regulate local climate by cooling down urban areas affected by the Urban
Heat Island (UHI) effect, alleviating any impacts of extreme heat on human health.
Context
Melbourne’s parks play an important role in cooling down the city due to the ‘urban heat island
effect’. The heat island effect is where temperatures increase due to the absorption of solar radiation
on paved and dark surfaces. The heat island effect is most pronounced in the central business district
and away from coastal areas.
With their permeable, green open spaces and mature trees, the temperature in parks can be several
degrees cooler than surrounding areas, providing shade and cooler environments. The vegetation and
waterways of parks help regulate local climate by trapping moisture and cooling the earth’s surface
and mature trees can generate the equivalent cooling effect of several air conditioners.
A recent study undertaken for the City of Melbourne with heat maps of the Greater Melbourne area
demonstrate that areas with few trees are warmer than treed areas. In Melbourne, researchers have
reported a mean UHI of around 2°C to 4°C and as high as 7°C depending on the location, season and
time of day.112
This study highlighted that the impacts of hot weather caused by climate change (both in terms of
average temperature and number of extreme hot days) is expected to produce a range of impacts on
health, transport operation and infrastructure, energy demand and infrastructure, biodiversity and
crime113. This study found that the net economic impact of hot weather within the City of Melbourne
is estimated at $1,860 million as a present value, of which approximately $300 million (or 16%) is
attributable to the UHI effect. The vast majority of these costs were related to human health costs.
Reducing impacts on human health will also decrease adverse effects on employment productivity,
e.g. through absenteeism, long-term employment conditions and premature mortality.
With CSIRO predictions that Melbourne’s climate is likely to become increasingly warm, dry, and subject
to more frequent extremes of heat and inundation over the next twenty or more years, parks and
waterways are likely to provide an increasingly important resource for the relief of heat related illness.
Quantity of services and valuation approach
While studies of temperature regulation have been undertaken in a number of cities around the
world, quantifying the urban climate regulation service of Parks Victoria’s parks needs further work. In
the first instance, this work would require assessing the difference in temperatures between city and
park areas and then linking the cooling effect to the number of incidence and prevalence cases of heat
related illness that could be avoided or delayed from metropolitan parks infrastructure.
The valuation could focus on health costs (comfort may be an additional consideration), which can be
derived from epidemiological studies and dose-response functions for specific heat related conditions.
112 AECOM 2012, Economic Assessment of the Urban Heat Island Effect, Prepared for the City of Melbourne. 113 Ibid

102
(c) Air quality regulation
Benefit and beneficiary
Parks’ vegetation help filtering air pollutants, reducing health impacts for Victorian residents.
Context
Trees and other native vegetation and waterways help filter a number of air pollutants, including
airborne particulate matter. Several studies have linked exposure to particle pollution to a number of
health problems, including respiratory diseases such as asthma. Trees help cleanse the air by
intercepting airborne particles, reducing heat and absorbing other pollutants such as carbon
monoxide, sulfur dioxide, and nitrogen dioxide. For example, studies from the US have found that a
single mature tree can filter 27 kilograms of airborne pollutants per year.114
While Melbourne’s air quality has improved since the 1980s due to improved car and industry
emissions regulations, particle-based pollution can still be an issue. This is mainly due to increased
transport use, increased trends of population exposed in inner areas of the State and localised
interactions with other pollutants from chemical industries, which could exacerbate ozone effects.
The filtering role of parks needs to be balanced against the emission of Biogenic Volatile Organic
Compounds from eucalypt dominated vegetation, which can have a role significant role in the
formation of ground ozone based photochemical smog.
Quantity of services and valuation approach
While quantity estimates of air pollution are available for the State, there is insufficient data to assess
what proportion of air filtering in metropolitan areas could be attributable to park vegetation.
In terms of the valuation approach, some relevant studies have been undertaken in a number of cities
around the world, focusing on the health costs from air pollution. However, these health costs are
typically attributable to the industries generating it – rather than ecosystems counterbalancing it.
Therefore, the impact of Parks Victoria’s parks on air quality regulation within Melbourne requires
further investigation.
114 See Nowak D.J and Heisler.G.M 2010, Air Quality Effects of Urban Trees and Parks National Park and Recreation Association, Research Series

103
A2.3 Cultural services from parks
(i) Recreation services: enjoyment, tourism and health benefits
Benefits and beneficiaries
Victoria’s parks provide diverse opportunities for nature-based recreation experiences. The direct
benefit is the personal enjoyment and appreciation of nature, which then provides additional health
and economic benefits created by visitors going to parks.
The three key recreational benefits considered for this assessment include:
- Personal enjoyment from park visits of all visitors recorded, including locals and tourists
- Economic activity and employment in the State supported by tourist visitors (i.e. not locals)
during their travel and visits to Victorian parks
- Improved physical and mental health in regular park visitors that are physically active in parks
Context
Victoria’s parks contain and conserve natural, cultural and historical values that are treasured by
Victorians and contribute to their sense of place. Our parks are conserved both for their intrinsic worth
and for the benefit, use and enjoyment of the public. Park visitors can derive a wide range of personal
benefits, including enjoyment and improved health, while contributing to the tourism industry.
Enjoyment benefits: People visit parks to gain a wide range of experiences that are mainly supported or
enhanced by the environmental amenities parks provide. These include appreciating scenic beauty or
biodiversity, to escaping the urban environment, learning about nature, culture and heritage,
experiencing adventure and self-reliance, having fun, socialising with friends and family or finding
peace and solitude. Some of the most common activities undertaken in parks include sightseeing,
walking, picnicking, running, cycling, fishing, sailing, surfing, diving, photography, birdwatching and
nature study, bushwalking, rock climbing, vehicle touring, and camping. Other activities such as
hunting occur at appropriate locations. Parks enable people of all cultures and backgrounds can share
in these experiences.
Tourism benefits: The opportunities for recreational enjoyment (previously described) motivate tourists
to travel and visit Victoria’s parks. Parks Victoria is the State’s largest provider of nature-based
tourism. An impact assessment of the closure of the Grampians National Park following the 2014 fire
illustrates the importance of parks for tourism. The impact assessment undertaken by Grampians
Tourism highlighted that 60% of tour operators were unable to trade during the park closure, there
was a 50% decline in takings and immediate bookings with a further 54% decline in forward bookings
and 100 businesses that use the park were impacted. The impacts from this closure were estimated as
a loss of at least $47 million to the regional economy with a potential further impact of $35 million115.
Health benefits: There is a large and increasing body of evidence showing that contact with nature and
parks provide a wide range of physical and mental health benefits.116 Other recent research suggests
that access to parks can help people increase their level of physical activity117 and being close to green
space is associated with reduced depression, anxiety and other related conditions. Thus, recreation
115 Parks Victoria 2015, personal communication

104
and amenity services that Victoria’s parks provide can contribute to the prevention of some physical
and mental health costs or the improvement of health outcomes that can be influenced by lifestyle.
Health benefits from park-related physical activity is relevant in Australia considering that56% of
Australians are either sedentary or have a low level of exercise118. Physical inactivity is a risk factor for
cardiovascular disease, stroke, high blood pressure, diabetes, colon cancers, osteoporosis, falls-related
injuries and mental health problems including depression. In 2008, Medibank Private indicated that
physical inactivity was costing the Australian economy $13.8 billion per year119 (about $1,660 per
person per annum for each physically inactive person), consisting of:
direct medical costs of $719 million per annum
labour productivity costs of $9,299 million per annum
people’s value to avoid burden of disease or mortality of $3,812 million per annum
The Medibank Private study also found an estimated 16,179 people die prematurely each year due to
conditions and diseases attributable to physical inactivity. In 2009, another study estimated that a 10%
reduction in physical inactivity (from 70% to 60%) of Australians would annually result in 6,000 fewer
cases of disease (13% reduction), 2,000 fewer deaths (15% reduction), loss of 114,000 additional
working days and reduced costs to the health sector of about $96 million.120
Links to other services
Recreation is linked to and often reliant on other ecosystem services including regulating services,
such as water purification, flood protection, regulation of air quality and habitat services, and other
cultural services, such as amenity, spiritual connection, social cohesion and sense of place.
Quantity of service provided
Recreation services are measured in terms of the number of visitors and visit duration times. These
measures indicate people’s interactions and use of ecosystem services. The following values of visitor
numbers are used to assess each of the three benefits identified:
Enjoyment benefits: Parks Victoria survey data indicates that more than three quarters of the Victorian
population had visited a park at least once in the previous 12 months121. Parks Victoria data for the
State indicates the number of visits to all parks (including bays and piers) has increased by 38.6% over
the period 2002 to 2013, with a compound annual growth rate of 3%.
The total number of annual visits to the Victorian parks network has been estimated at 51 million to
national, State and metropolitan parks. In addition, Parks Victoria managed bay and waterway assets
(e.g. piers in local ports) receive 45 million visits per annum.
116 Townsend M and Weerasuriya, R 2010 Beyond Blue to Green, The benefits of contact with nature for mental health and well-being. Melbourne, Australia. Maller, C., Townsend, M., Brown, P. and St Leger, L., Henderson-Wilson, C., Pryor, A., Prosser, L., Moore, M. 2008. ‘Literature Review: Healthy Parks Healthy People: The Health Benefits of Contact with Nature in a Park Context - A Review of Current Literature’. 2nd Edition. Deakin University. Melbourne, Australia. 117 Harnik. P.H. and Welle. B, 2009 Measuring the Economic Value of a City Park System, Trust for Public Land. 118 ABS 2013, Cat. 4364.0.55.004 Australian Health Survey: Physical Activity, 2011-12, Australia. 119 These are conservative estimates of the cost of physical inactivity, as they do not take into account the cost of individuals being outside the workforce or the value of unpaid work. See Medibank Private, 2008, The Cost of Physical Inactivity. Available in http://www.medibank.com.au/Client/Documents/Pdfs/The_Cost_Of_Physical_Inactivity_08.pdf. 120 Cadilhac D A, Toby B Cumming, Sheppard L, Pearce D.C, Carter R and Magnus A 2011 The economic benefits of reducing physical inactivity: an Australian example International Journal of Behavioral Nutrition and Physical Activity 2011, 8:99 121 Newspoll, 2013. Parks Visitation Monitor Quarter 1-4 – 2012/2013, July 2013. Report prepared for Parks Victoria.

105
Table A2.13 Number of visits to Victorian parks
Park type 2003/04 2012/13
National and State parks 24.9 million 34.8 million
(Marine national parks) (2.7 million) (3.8 million)
Metropolitan parks 14.1 million 16.4 million
Bays and waterways assets (piers) 27.0 million 44.6 million
Total 69.1 million 95.8 million
Source: Parks Visitation Monitor Quarter 1-4 – 2012/2013, July 2013. Note: the number of visits to marine national parks is a subset of the total number of visits to National and State parks.
Tourism benefits: Based on international and national visitation survey data by Tourism Research
Australia (TRA), Victoria averaged a total of 3.6 million ‘tourist visitors’ going to parks in 2010-11. After
accounting for the duration of the stay, this gives an average of 16.9 million park tourist visitor nights,
which corresponds to about 33-56% of the total number of visits reported by Parks Victoria.
Melbourne attracted the large majority of tourist visits in the State, as shown in the figure below.
Figure A2.1 Parks visitation rate (visitor nights) by tourist type (2010-11)
Source: Deloitte Access Economics Report on Valuing the Tourism Services provided by Victorian Parks, May 2014.
Health benefits: According to the 2011-12 ABS national survey of participation in sport and physical
recreation122, of the 3 million people who undertook some kind of exercise in Victoria, 44% used parks
and reserves and 25% used off road trails and bike paths. Walking for exercise was the most popular
activity undertaken. Across all physically-active respondents in Victoria, 52% reported to have
exercised on average at least two times per week.
The following table presents an overview of the main activities undertaken in park visits.
122 ABS 2012, Catalogue 4177.0 - Participation in Sport and Physical Recreation, Australia, 2011-12. Available online.

106
Table A2.14 Most popular recreational activities undertaken in parks
Purpose of visits to parks and activities undertaken
National and State parks (% of visits)
Metropolitan parks (% of visits)
Relevance to health benefits
Primarily for physical activity:
Long walks
Short walks
Fitness
Cycling
Jogging
Walk the dog
38 11 38 6
55
21 10 6 6 8
Physical activity
Physical activity 66 71 Physical activity
Sightseeing & Spectating 28 15 Mental health and
relaxation
Eating & Drinking 20 21
Socialising & Child’s play 18 21 Mental health and
relaxation
Journey / Tour 12 3 Physical activity, mental
health & relaxation
Passive activities 9 6
Events & Markets 2 5
Parks Visitation Monitor Quarter 1-4 – 2012/2013, July 2013.
While around 38-55% of visits to Victoria’s parks are primarily for physical activity, for people to gain
physical health benefits from exercise, they need to be physically active, which needs to be moderate
exercise for at least 2.5 hours per week preferably on most days123. An individual that does not do
regular exercise is not considered to be physically active. Parks Victoria survey data indicate there are
on average about 180,00 regular visitors to parks every year, who do exercise for more than one hour
at least three times per week.
The Parks Victoria visitation data above indicates that metropolitan and non-metropolitan parks
receive respectively around 780,000 and 750,000 Victorian visitors per annum whose main purpose is
undertaking a physical activity. For average visitors, it is estimated that parks contribute to about 11%
and 17% of their recommended physical activity each year. These high-level estimates of park
contribution to people’s annual recommended physical activity are based on an annual average of 12
and 18 visits per active visitor going to metropolitan and non-metropolitan parks, respectively, and a
benchmark of a minimum of two days per week per person to maintain regular physical activity.
While there is considerable overlap between physical and mental health benefits from visiting a park,
data from Parks Victoria’s Visitor Satisfaction Monitor has shown that the most positive aspects of a
visit to a park included: being outdoors (32%), being in nature (32%), scenery and views (32%) and
being in a peaceful, relaxing setting (21%).
Counterfactual: the world without parks
In the absence of parks, the counterfactual is that national and State (non-metropolitan) parks would
have been cleared and used for grazing, while metropolitan park areas would have been used for
residential development. Under the counterfactual visitors to parks would lose all personal enjoyment
derived from parks ecosystems. This would lead to the loss of all tourist expenditure attributable to
123 Department of Health 2014, Australia’s Physical Activity and Sedentary Behaviour Guidelines. Available in http://www.health.gov.au/internet/main/publishing.nsf/content/health-pubhlth-strateg-phys-act-guidelines

107
park visits (note that in the long-term this expenditure could be transferred to other sectors of the
economy or moved away to other areas of Australia). In the case of health, we have assumed that
without parks, non-tourist visitors whose main purpose is going to parks to do sport and physical
activities would reduce a proportion of the level of physical activity they undertake every year.
Valuation method
Different valuation techniques are required to assess the three benefits from recreation services, as
discussed in detail for each case below.
Enjoyment benefits: The valuation method is benefit transfer based on an earlier study in Australia using
the travel cost techniques by Read Sturgess (1999)124. The purpose of this valuation technique is to
measure the utility visitors receive when they visit parks. The travel cost method is a long-standing and
accepted method for estimating this type of benefit for recreational users of parks.
Read Sturgess developed travel cost models for Victoria to estimate recreation values using visitation
data from 1999 for around 70 parks and extrapolated values to another 80 parks. The study found that
recreation in Victorian parks was valued at $340 million per annum. The table below shows the
updated average values derived from the Read Sturgess study across the current park classification. It
is recognised that the original data requires review to recognise contemporary visitor use patterns and
park developments. Therefore, the updated estimates should be considered as indicative only.
Table A2.15 Indicative recreation values per visit by park type
Type of park Value per visit
National parks $32
Natural features wildlife hunting reserves $27
Wilderness parks $20
Port and coastal facilities $16
Reservoir parks $14
Natural features reserves $13
Historic reserves $12
State parks $11
Metropolitan parks $9
Other terrestrial parks $9
Tourism benefits: Tourism benefits to the State economy are measured as the economic contribution of
tourist visits to parks. The approach requires estimating park-dependent tourism expenditure (by
identifying the proportion of spending by tourists in a region that can be directly attributed to a park).
In other words, if a tourist visited the park as part of a broader trip and would have continued with
their travel arrangements had the park not existed, then this tourist’s expenditure cannot be
attributed to the park.
The contribution of parks has been disaggregated from the broader contribution of tourism for each
Victorian tourism region based on the tourism satellite accounts. The contribution of tourism to parks
is estimated using information on the expenditure patterns of tourists who visit the parks. Then, Input-
Output multiplier analysis is used to assess the economic activity generated by park tourists. The
124Read Sturgess and Associates 1999. Economic assessment of the recreational values of Victorian Parks. Consultancy
undertaken for Department of Natural Resources and Environment. April 1999.

108
contribution analysis is based on Australia’s national accounting framework. The tourism contribution
of parks has been estimated as a contribution to State’s Gross Value Added, Gross Regional Product
and employment.
Health benefits: The method used is an avoided cost approach for park visitors undertaking physical
activity in parks and uses recent estimates from the literature about the marginal effect of increased
physical activity on health conditions125.
Health benefits are quantified in terms of savings in health care, mortality and productivity.
Specifically, savings in health care relate to reduced health system (medical or treatment) costs,
savings from mortality relates to people’s willingness to pay to avoid burden of disease and savings in
productivity refers to the loss of labour income due to physical inactivity related illnesses.
While there are a number of well-established metrics to quantify the marginal effects of outdoor
activities undertaken in parks on levels and change in a number of physical and mental health benefits,
the direct attribution of parks to health outcomes including economic benefits is challenging and is an
area in need of further research. Therefore, the estimates provided in this section are indicative.
While this report has sought to initially quantify the physical health benefits of parks in monetary
value, determining the direct attribution of mental health benefits of parks can be challenging and
further work is required in this area.
Value of benefits
Enjoyment benefits: If the values generated from the Read Sturgess study are simply updated to 2014
dollars the value increases by 50% to around $515 million per annum. If the values are updated and
applied to current estimates of visits numbers to Victorian parks (with a lower bound of 33 million
visits per annum based high confidence survey data only and an upper bound of 51 million visits per
annum) the current total value of recreation services is estimated to be at least $600 - $1,000 million
per annum (increasing by 75%-200%). The range reflects the level of confidence in the estimated total
annual visits and therefore recreational value. The table below summarises the makeup of the
estimate.
Table A2.16 Estimated range for value of annual recreation services from Victorian Parks
PV confidence in visitor data
Type of data transferred from original travel cost study
Cumulative number of parks included
Cumulative value of recreation ($m pa)
Best confidence Park specific data 23 $607
Extrapolated data 33 $663
Medium confidence Park specific data 49 $731
Extrapolated data 89 $791
Lowest confidence Park specific data 99 $795
Extrapolated data 344 $1,067
Sources: PV visitation data 2013 and Read Sturgess and Associates 1999, Economic Assessment of Recreational Values of
Victorian Parks, prepared for the Department of Natural Resources and the Environment.
In valuing recreational enjoyment and tourism we are measuring different types of benefits that may
potentially be relevant to different groups of people. Park visitors derive personal benefits from
125 Warburton D. E. R., Nicol C. W., Bredin S. S. D. 2006 Health benefits of physical activity: the evidence. Canadian Medical Association Journal 174, pp. 801–809. DOI: 10.1503/cmaj.051351

109
visiting parks. Some of these park visitors are tourists (meaning visitors who are not local residents),
who generate benefits for regional communities and the broader Victorian community through their
trip-related expenditure. Information on ‘park attributable’ travel expenditure by visitors is used as a
key input to assess both enjoyment and tourism benefits. However, expenditure itself is not a measure
of either benefit. The enjoyment value is derived from visitors’ willingness to pay to access parks
beyond what they currently have to pay in entrance fees (or consumer surplus). These benefits
measure visitor utility gains (implied in part from the cost of travel), while the focus of the tourism
value is on the economic contribution of tourist spending to the Victorian economy, which can be
observed in current market transactions.
Tourism benefits: Based on an economic contribution study for Parks Victoria by Deloitte Access
Economics in 2014, the total economic contribution of park-attributable tourism has been estimated
at $1 billion of Gross Value Added (GVA) and around 14,000 jobs in 2010-11. GVA is considered the
most accurate measure of the contribution of tourism to an economy. The table below shows the
breakdown of GVA and employment by tourism region. GVA is the value of output less the value of
inputs sourced from other industries supplying goods and services to the tourism sector.
Table A2.17 Economic contribution of park-attributable tourism ($m in 2010-11)
Tourism region Economic contribution (GVA) Number of people
employed % of regional economy
Melbourne $433 6,130 0.1
Grampians $102 1,164 0.4
Great Ocean Road $87 1,235 0.3
Yarra Valley and Dandenong Ranges $85 1,103 0.3
Gippsland $82 1,112 0.3
Murray $71 894 0.2
Victoria's High Country $56 779 0.8
Mornington Peninsula $47 639 0.2
Daylesford and the Macedon Ranges $23 269 0.2
Phillip Island $20 219 0.5
Goldfields $17 240 0.1
Total $1,021 13,783
Source: Deloitte Access Economics Report on Valuing the Tourism Services provided by Victorian Parks, May 2014.
Around half of the total economic contribution relates to direct impacts, where there is a direct
relationship between the visitor and the producer of the good or service. The other half relates to
downstream flow-on and supplier effects of tourism demand for intermediary materials or services
(e.g. fruit and vegetables supplied to a restaurant visited by a tourist on a trip to visit a park).
In the absence of a specific data on the primary motivation for a park visit, the economic contribution
analysis includes assumptions about the motivation of visitors in a tourism region using a ‘drawcard
approach’ to estimate the proportion of expenditure that can be attributed to parks.
It should be noted that the economic contribution has been derived using visitor data from Tourism
Research Australia rather than Parks Victoria data. This is because use of the Parks Victoria data results
in park-attributable tourism expenditure was greater than the total tourism expenditure derived in the
regional tourism satellite accounts. This suggests that the tourism estimates above may be

110
conservative. Recent changes to Parks Victoria visitor surveys have included questions about primary
motivation of the visit, which will increase the confidence of the data and enable revised estimates. It
should also be noted that these estimates are not total economic contribution of Victoria’s parks, but
related to tourism services only.
For the purpose of environmental-economic accounting, it is important to note that the economic
contribution values cannot be used directly as exchange values. They reflect the value add generated
in the economy through the operations of a specific business in the economy.
Health benefits: Based on the estimate of health costs from physical inactivity of $1,660 per person, the
table below provides indicative high-level estimates of the avoided costs associated with physical
activity for metropolitan parks and national and State parks that could be attributed to parks.
Table A2.18 Indicative estimates of avoided health costs from park visits
Scope Urban parks National and State parks
Victorian population (aged 15 and over in 2013) 1 4.3 million
% of Victorian population that visited parks in the previous 12 months 2
33% 46%
Number of Victorian visitors to parks 1.4 million 2.0 million
Number of total park visitors with the primary purpose of fitness/physical activity 2 (number of regular physically active park visitors with at least three one-hour exercise visits per week) 2
780,450 (141,900)
751,640
Share of physically inactive visitors, i.e. doing less exercise than the minimum recommended in national health guidelines 3
56% (0%)
56%
Average number of park visits per year 12
(156) 18
Contribution of parks to recommended physical activity per year,using two sessions of exercise per week as benchmark
11% (100%)
17%
Avoided healthcare and productivity costs per person due to physical inactivity 4
$1,660
Proportion of park visit substitutes, where people decide to do exercise somewhere else outdoors – own assumption
0% (50%)
Indicative estimate of avoided costs $80.6m
($117.7 million) $118.2m
Note: the values in brackets correspond to regular park visitors, who are physically active with at least one-hour exercise
visits per week in parks. Sources: 1 ABS 2014, Australian Historical Population Statistics; 2 PV visitation data 2013; 3 ABS 2013,
Australian Health Survey: Physical Activity 2011-12; 4 Medibank Private, 2008, The Cost of Physical Inactivity.
It should be noted that the estimates above may overlap as some people may be visiting both
metropolitan parks and national/State parks. In addition, it assumes that regardless of the level of
activity, occasional visitors would decrease the risk of developing relevant diseases associated with
physical inactivity.
A more detailed and rigorous analysis would assess the level of physical activity obtained through
exercise undertaken by people in equivalent control and treatment groups (where the treatment
group includes those going to parks). The analysis would then look at the reduction in the likelihood of
prevalence or incidence of specific physical/mental health conditions (e.g. cardiovascular disease, type
2 diabetes) due to increased physical activity (this can be assessed with information from
epidemiological studies on the population attributable fraction, which measures the contribution of a
risk factor to a disease or death). However, no Australian data was available at the time of this report
to measure this more precisely.

111
The indicative analysis suggests that avoided healthcare costs and productivity impacts associated
with physical activity in Victorian parks could be in the range of $80-200 million per annum.
Sensitivity checks around potential substitution effects and the share of health costs according to
visitor’s health status could increase this range of park-related health benefits from between $40 to
around $300 million per annum.
While the costs above include savings in the treatment of depression conditions, the current project
has not attempted to quantify the avoided costs of broader mental health services by visiting parks.
Mental health benefits of contact with parks and nature have been well documented, but this is a
significant area where further research on valuing these benefits is required.

112
(ii) Landscape and neighbourhood amenity
Benefit and beneficiary
Victoria’s parks provide enjoyment and mental health benefits to surrounding residents, particularly
residents near urban and peri-urban parks in Melbourne and regional cities.
Context
Parks provide important amenity services to surrounding residents, enabling a range of personal and
community benefits. This may include both use values from having closer proximity to access
greenspace, to gaining heath and enjoyment benefits from viewing nature and wildlife as well as non-
use values by knowing that nature is being conserved nearby.
A common method of valuing the amenity value of parks is through hedonic house price modelling
which compares the sale price between homes that are in close proximity to parks against those that
are not, taking into consideration other factors, such as house features, building age, transport,
schools and other influences on home price.
A recent review of hedonic price studies from the USA, UK and Europe and has shown that there is
good evidence that parks and open space have a positive impact on nearby residential property
values126. While different types of parks may have different types of effects, proximity to parks can add
between 5% and 20% to the value of homes. Locally, an ongoing study of home values surrounding
Wattle Park in Melbourne found an increase in value of up to 20%127, while a study of Noosa National
park in Queensland (a peri-urban park) found an increase of 7% in home value128. A number of these
studies have also found a positive relationship between distance from a park and property value.
Some research has also highlighted a relationship between parks that are well maintained which have
higher increases in value.
Amenity value may also be reflected in life satisfaction of nearby residents. A recent Australian study
that examined the influence of public greenspace on the life satisfaction of residents of Australia’s
capital cities found a positive relationship between the percentage of public greenspace in a resident’s
local area and their self-reported life satisfaction. On average, it found that a resident has an implicit
willingness-to-pay of $1,168 in annual household income for a one per cent increase in public green
space.129
Links to other services
The provision of amenity is linked to other services such as recreation enjoyment (with many residents
also likely to be park visitors), health benefits (with residents also likely to be undertaking physical
126 Maruthaveeran S 2013,Konijnendijk C.C.,Annerstedt M Busse Nielsen A Copenhagen and Alnarp, January Benefits of Urban Parks A
systematic review A Report for IFPRA. This review lists a 1995 study on the Sydney’s Centennial Park, but this Sydney study used the travel cost methods and contingent valuation and cannot be compared with the findings of other international studies using hedonic price modelling. 127 D. Cochrane, personal communication, 2014 128 Pearson, L., Tisdell, C., Lisle, A., 2002. The impact of Noosa National Park on surrounding property values: An application of the Hedonic Price Method. Economic Analysis and Policy 32, 155-171
129 Fleming C and Ambrey C, 2013 Public Greenspace and Life Satisfaction in Urban Australia, Urban Studies http://usj.sagepub.com/content/early/2013/07/18/0042098013494417.abstract

113
activities in parks), other cultural services including ecosystem/species existence and a range of
regulating services including watershed and habitat services.
Quantity of service provided
In 2013, the number of immediate neighbours to Melbourne’s urban and peri-urban parks was 11,757,
which included 4,680 to urban parks and 7,077 to peri-urban parks130. This excludes residents who live
next to Port Phillip Bay. Additionally, outside the Greater Melbourne area there were 38,000
immediate neighbours to National and State parks and 47,000 neighbouring conservation reserves.
Counterfactual: the world without parks
In the absence of parks, the counterfactual is that national and State (non-metropolitan) parks would
have been cleared and used for grazing, while metropolitan park areas would have been used for
residential development. As a result, the amenity services parks provide to surrounding residents, such
as access, enjoyment or mental health benefits, would no longer be provided. This could have a negative
impact on residential value, which captures some of the landscape and amenity services parks provide.
Valuation method
The valuation method for amenity value is based on a benefit transfer of multiple hedonic home price
studies for urban and peri-urban parks only. While the international evidence suggests that the effect
of parks surrounding properties is 5-20% in increased home prices, we have used a conservative range
from 5-7%. This is in line with findings from recent published studies available in the Australian
context, such as a 2013 thesis indicating an average increase of 8.6-15.6% due an increased Enhanced
Vegetation Index (used as a proxy for green infrastructure)131.
A spatial analysis was undertaken to identify the number of immediate neighbours to urban and peri-
urban parks managed by Parks Victoria and data on surrounding median home price was reviewed for
each park. Consequently the calculation of the number of households obtaining amenity value from
Melbourne’s parks provides a conservative estimate, as research suggests that increased home prices
gradually drop with distance from the park. Only urban and peri-urban parks were assessed, as the
evidence for amenity value for other parks is more limited.
The benefits of living near a park can include both direct use benefits and non-use benefits. It is
probable that one of the direct use benefits of proximity to a park is increased health benefits and/or
recreational enjoyment associated with visiting the park more frequently.
Value of benefits
Based on the assumptions above of a 5-7% increase in home value for immediate urban and peri-
urban park neighbours, the amenity value for residents immediately surrounding Melbourne’s urban
and peri-parks is $326-438 million or $21-28 million per annum. While the assessment has been only
applied to Parks Victoria managed parks within Melbourne’s urban and peri-urban area, if applied to a
130 Parks Victoria spatial analysis 131 Rossetti 2013, Valuation of Australia’s green infrastructure: hedonic pricing model using the enhanced vegetation index. Monash University Thesis 2013.
114
regional centre such as Bendigo, amenity values associated with the Greater Bendigo National Park
which surrounds the City of Bendigo could be about $17 million.132
Further work is required to improve the quality of data for amenity value of Melbourne-based parks
and extend assessment of amenity value to other parks within Victorian regional centres.
132 Assuming a 5% increase in home value for the 1,014 residents that live adjacent to this park.

115
(iii) Social cohesion and sense of place
Benefit and beneficiary
Community members that volunteer in parks gain social connection, a sense of community
contribution and physical and mental health benefits.
Context
Increasingly, social scientists have argued that communities with higher levels of volunteer
participation and active social networks have better economic outcomes, higher educational
achievements, improved community safety, better experiences for families and children and better
health and wellbeing.
Volunteering and community participation is an important avenue through which Parks Victoria and
the community collaborate in the conservation, protection and interpretation of parks and reserves.
Volunteering contributes to social capital through individuals and communities connecting with parks
and Parks Victoria being connected with the community.
The benefits to volunteering to volunteers include:
• satisfaction, fulfilment and enjoyment from activities carried out in natural or cultural
environments;
• learning and development of new skills and experiences;
• increased knowledge about park management and Parks Victoria; and,
• social interaction with like-minded people.
The contribution of volunteers to parks includes:
• the opportunity to build and maintain positive links and understanding between Parks Victoria
and the community;
• tangible achievements towards the protection, preservation, enhancement and enjoyment of
natural and cultural environments and visitor experience;
• access to skills and abilities that may not be readily available through Parks Victoria's own
resources;
• broadening community responsibility and pride in the parks system; and,
• understanding of community expectations in relation to park management.
Links to other services
Opportunities for volunteering in parks are linked to other cultural services, including recreational
enjoyment, tourism, connection to cultural heritage, and intermediary services, such as conservation
of habitats.
Quantity of service provided
In 2013 volunteers contributed to 211,000 hours in Victoria’s parks, which is equivalent to more than
100 full time equivalent staff133.
133 Parks Victoria corporate datasets. Refer also to: Ironmonger. D. ,2012. ‘The Economic Value of Volunteering in Victoria’. A Report Commissioned by The Department of Planning and Community Development. Victorian Government.

116
Counterfactual: the world without parks
In the absence of parks, some volunteers could shift to support other social work, but those volunteers
with special interest in nature may stop or reduce their level of involvement in conservation activities.
This is because there would be more limited opportunities for engaging in unpaid work offering
activities in prominent landscapes, contact with threatened and rare species, or alternative options
available with other organisations could be in less accessible sites.
Due to the lack of data, we have assumed that current volunteers are mainly motivated in nature
related work and therefore they would cease any volunteering activities without parks.
Valuation method
The method selected for the valuation of volunteering in Victoria’s parks is an output based measure.
Based on ABS guidelines, the wage chosen for a volunteer is either (1) the opportunity cost of the time
the persons involved in unpaid work could have obtained if they had spent the time in paid work
(reflecting the use of time for equivalent activities, rather than substituting the main occupation); or
(2) the ‘specialist wage’ that would be needed to pay a specialist from the market to do the activity
(say, a botanist to do a survey) be paid to do the unpaid work.
The estimate of the value of volunteer time is based on the ‘average compensation per employee’.
These estimates have previously been calculated between 1992 and 2006, based on earlier work by
the ABS134. The equivalent hourly wage rate for volunteers was $24.09 in 2006, which has been
adjusted for inflation.
Value of benefits
The total volunteer hours of 211,000 in 2013 is equivalent to 100 full time equivalent staff, which is
valued at $6 million per annum.
Note that this initial estimate of volunteer value is limited to financial opportunity cost. The additional
health and social cohesion benefits of volunteer involvement have not been calculated and is an area
for further research.
134 Australian Bureau of Statistics 2000, Unpaid Work and the Australian Economy.

117
(iv) Opportunities for scientific research and education
Benefit and beneficiary
Victoria’s parks provide unique ecosystems as input to research and education activities that benefit
directly park visitors and scientists, and contribute indirectly to Victorian, national and global
communities who benefit from research outcomes (through progress in knowledge or technologies).
Context
Parks provide a wide range of opportunities for research and knowledge development and the
knowledge gained from parks contributes to the broader knowledge of the community about nature
and cultural heritage. Parks Victoria recognises the importance of research in parks to ensure that its
management is informed by good science and evidence.
Additionally, our parks network provides major opportunities for the community to gain a greater
appreciation of nature and heritage through formal and informal interpretation education programs.
Parks Victoria’s Research Partners Program (RPP) encourages research to be undertaken in parks
through collaboration with universities and other research institutions. The RPP encourages
researchers and park managers to
• build a strong body of knowledge to guide park management;
• improve understanding of the natural values of the park system;
• encourage research into park management issues and support tertiary students in park-based
research;
• attract support for, and encourage collaboration in, scientific research in parks and reserves;
and,
• enable scientists and park managers to work together to enhance protection of parks.
A wide range of formal and informal education and interpretation programs are undertaken in parks
to inspire and educate visitors about nature and assist them to understand how to minimise
detrimental impacts on park values. This includes a school education program, as well as summer
ranger interpretation programs.
Links to other services
Research and education services are linked with other cultural services such as recreation services and
cultural connection. They are closely connected to many regulating services, including maintenance of
habitats for species and maintenance of genetic diversity.
Quantity of service provided
Recent data from the last three years indicates that on average 215 research permits are issued in
parks every year and 183,000 people participate in parks related education programs every year.
Counterfactual: the world without parks
In the absence of parks, some research areas would become more costly as additional arrangements
would be needed to access suitable control and treatment groups across Victorian ecosystems and
access to private land could require higher transaction costs. As a result, under the counterfactual,

118
some biophysical research outcomes or genetic materials could be delayed (developed years later),
take place in other Australian regions or not occur at all. This would depend largely on the type of
research being undertaken in the parks network.
Valuation method
The valuation method for research and education, could include the productivity method, but would
greatly depend on the outcomes sought, adoption and long-term impact of research in society. The
valuation method would very much depend on the type of research being undertaken and their
impacts on society and may require a selection of case studies.
For the purpose of Parks Victoria, reporting financial contributions (as revenue stream net of any costs
from the Research Partners Program) is sufficient to indicate a lower-bound estimate of the benefits
expected by research and education partners to access parks.
Value of benefits
Assessment of the value of scientific research and education in parks could be undertaken in the
future once more data becomes available.
In a previous assessment of Parks Victoria’s Research Partners Program135 it was determined that each
dollar of Parks Victoria research funding resulted in approximately six dollars of leveraged research
funding from other research partners. This exchange value represents the costs for current research
areas only and does not take into account the actual benefits created in society or the economy from
the knowledge, materials or technologies obtained from research once they have been adopted. Some
of these benefits could include productivity or efficiency gains in the management of native species or
development of genetic material for medical research.
135 Review of the research partners program, unpublished report, Parks Victoria, 2005

119
(v) Historic place conservation
Benefit and beneficiary
Some of Victoria’s parks provide landscapes and sites of historical significance that park visitors,
Victorian, national and global communities value as part of their heritage.
Context
Conservation of historic heritage enables Victorians to connect with the rich stories of our past land
use. Parks Victoria manages more than 2,500 historic places within its parks network including 145
places listed as being of National or State heritage significance. Nationally listed sites include the
Castlemaine Diggings National Heritage Park, Werribee Park and Point Nepean National Park.
Physically, heritage places include about 260 substantial buildings and structures, 70 huts (mainly in
the high country) and more than 1,200 archaeological sites, shipwrecks and minor structures. Many
sites also hold collections, large and small, of movable heritage objects.
State listed places include lighthouses, shipwrecks, huts, gardens, historic buildings and relic mining
sites. The historic places within the parks network represent a wide range of historic themes and
stories covering use of natural resources, mining, shipping, agriculture, settlement of Port Phillip,
defence and transport. Parks Victoria manages 58% of Victoria’s historic parks and reserves (94 parks
out of 161 in total).
Links to other services
Heritage conservation is linked with other cultural services such as recreation and existence values.
Quantity of service provided
Historic heritage is the primary purpose for a significant number of visitors to Victorian parks. This is
reflected in the activities undertaken by visitors to parks, including visiting historic places. In 2009,
55% of the population had visited a heritage place managed by Parks Victoria within the previous 12
months.
Counterfactual: the world without parks
In the absence of parks, the counterfactual is that national and State (non-metropolitan) parks would
have been cleared and used for grazing, while metropolitan park areas would have been used for
residential development. Under this scenario, the historic landscapes and sites that are conserved and
managed by Parks Victoria would be significantly degraded or destroyed. As a result, the heritage
value provided to park visitors, Victorian, national and global communities would diminish or be lost
entirely.

120
Valuation method
The method adopted to value historic heritage is based on a 2009 survey on households’ willingness to
pay for conservation of park-related heritage136. In this survey, Victorian households were asked to
state their willingness to pay from a range of choices.
Value of service provided
Based on the survey data collected in 2009, 60% of Victorian households expressed they would
support a yearly charge to maintain Victoria’s park-related heritage places and 54% of respondents
stated they would support a yearly surcharge of $20 for management of heritage places in parks.
These survey results are used to estimate a value range for the conservation of park-related heritage
of $6-$23 million per annum, as shown in Table A2.19. However, these estimates are only a lower
bound of the value people place on park-related heritage, as survey participants were only asked their
willingness to pay $5, $10 or $20 once, rather than presenting higher bid values iteratively.
Table A2.19 Value of heritage conservation
Survey subsample 1 2 3
Number of Victorian households (2011) 2,154,000
Yearly surcharge on Victorian households for the management of heritage places in parks ($ AUD)
$5 $10 $20
Proportion of households that would support a yearly surcharge
59% 69% 54%
Value of Parks Victoria managed heritage places per year $6.3 million $14.8 million $23.3 million
The original study has not been reviewed in detail and therefore this estimate is indicative only. It is
not clear whether the survey was explicitly designed to elicit a value for specific or generic historic
heritage sites or whether the technical requirements for a robust stated preference method were met.
In addition, it was not possible to assess the sampling strategy used and whether the participating
households or respondents were representative of the Victorian population in order to extrapolate
the results.
136 Market Solutions 2009, Community perception of heritage management in parks

121
Appendix 3: Local ports in Victoria’s parks network
In addition to managing parks, Parks Victoria manages infrastructure and recreational activity around
some Victorian bays and waterways. Access to local ports enables a range of activities such as
commercial and recreational fishing and boating. The commercial and recreational benefits provided
by these waterways have not been included in the ecosystem accounts for Parks Victoria given their
role as infrastructure and recreational manager rather than natural asset manager in this context. Part
of this economic contribution is attributable to Parks Victoria’s management of built and social capital.
Of the 14 local ports on the Victorian coast, Parks Victoria manages three local ports: Port Phillip,
Western Port and Port Campbell. These local ports provide a range of economic and social benefits
related to recreation and tourism, through supporting recreational fishing, boating and other tourism
activities. The local ports are a focal point of economic and social activity in many regional
communities.
The ports provide essential infrastructure for fisheries and aquaculture industries along Port Phillip,
Western Port and Port Campbell, benefiting food producers and consumers. A key benefit from access
to a local port is the ability for commercial fishing and aquaculture activities to take place around local
areas. Port services include provision of mooring and navigation assets for boating and support for
vessel maintenance, boatyards, transport and marine safety.
Although the management of the port infrastructure supports a range of activities, the ecosystem
assets providing the ecosystem services are not part of the Parks Victoria network. Therefore they are
not included along with the other services provided by Parks Victoria’s ecosystem assets.
A range of the benefits associated with ports has been previously assessed through the economic
analysis of commercial fishing and other recreational activities at Victoria’s local ports by SKM in 2010
and Deloitte Access Economics in 2013137.
The analysis measured the economic contribution of local ports managed by Parks Victoria based on
the value of the local port in terms of the economic benefits the community would lose if the local
port closed.
The valuation included:
Estimation of overall expenditure based on commercial fishing, recreational fishing,
recreational boating, aquaculture, tourism, direct local expenditure directly dependent upon
ports, and other minor expenditures.
Indirect or flow on impacts to the economy including consumption of intermediary goods and
services using input output analysis.
Estimate of consumer surplus gained (i.e. how much port users value the port experience
above and beyond what they have to pay for)
Consideration, where possible, of other value including heritage values and social values,
including sense of place, sense of belonging, community ownership and heritage values.
137 SKM 2010, The Economic and Social Value of Victoria's Local Ports. Deloitte Access Economics 2013. The economic and social value of Victoria’s local ports. Report to Department of Transport, Planning and Local Infrastructure.
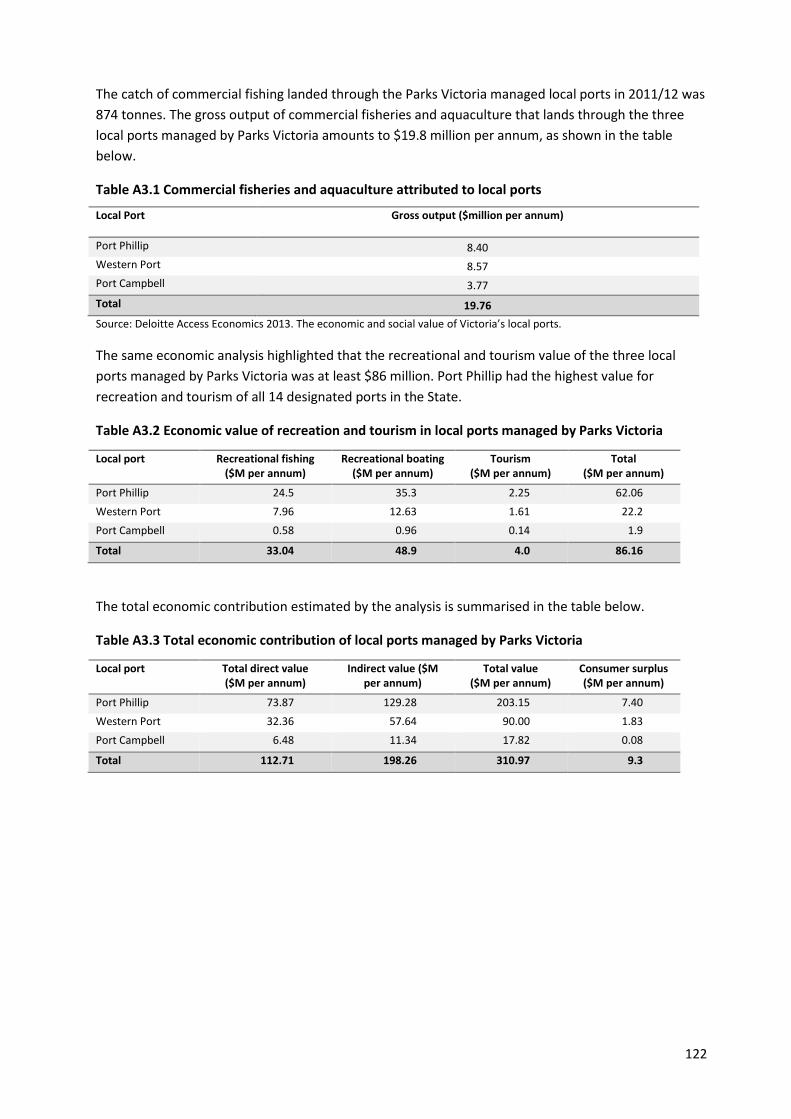
122
The catch of commercial fishing landed through the Parks Victoria managed local ports in 2011/12 was
874 tonnes. The gross output of commercial fisheries and aquaculture that lands through the three
local ports managed by Parks Victoria amounts to $19.8 million per annum, as shown in the table
below.
Table A3.1 Commercial fisheries and aquaculture attributed to local ports
Local Port Gross output ($million per annum)
Port Phillip 8.40
Western Port 8.57
Port Campbell 3.77
Total 19.76
Source: Deloitte Access Economics 2013. The economic and social value of Victoria’s local ports.
The same economic analysis highlighted that the recreational and tourism value of the three local
ports managed by Parks Victoria was at least $86 million. Port Phillip had the highest value for
recreation and tourism of all 14 designated ports in the State.
Table A3.2 Economic value of recreation and tourism in local ports managed by Parks Victoria
Local port Recreational fishing ($M per annum)
Recreational boating ($M per annum)
Tourism ($M per annum)
Total ($M per annum)
Port Phillip 24.5 35.3 2.25 62.06
Western Port 7.96 12.63 1.61 22.2
Port Campbell 0.58 0.96 0.14 1.9
Total 33.04 48.9 4.0 86.16
The total economic contribution estimated by the analysis is summarised in the table below.
Table A3.3 Total economic contribution of local ports managed by Parks Victoria
Local port Total direct value ($M per annum)
Indirect value ($M per annum)
Total value ($M per annum)
Consumer surplus ($M per annum)
Port Phillip 73.87 129.28 203.15 7.40
Western Port 32.36 57.64 90.00 1.83
Port Campbell 6.48 11.34 17.82 0.08
Total 112.71 198.26 310.97 9.3