Valuing solar farm developers -...
13
Valuing solar farm developers . August 2011
Transcript of Valuing solar farm developers -...

Valuing solar farm developers.
August 2011

Table of contents
3
4
5
7
9
10
11
12
1. Foreword
2. Executive summary
3. Introduction
4. Choice of method and identification of transactions in the solar farm industry
Appendix A: Private transaction data from the photovoltaic (solar) farm industry
Appendix B: Regression output – solar farm analysis
Appendix C: Valuation summary
About Financial Advisory Services
3Valuing solar farm developers
1. Foreword
In recent years, investors all over the world have paid increasingly attention to the renewable energy industry.
This trend has translated into rapid renewable energy commercialisation and considerable industry expansion, of which the solar photovoltaic (PV) industry is a good example. According to Clean Energy Trends 2011, investments in new capacity of solar PV energy increased from approx. USD 3bn in 2000 to approx. USD 71bn in 2010. The compounded annual growth rate (CAGR) over the period was 40%. From 2009 to 2010 the market size of solar PV almost doubled from USD 36bn to 71bn. Furthermore, the solar industry had 15.6 GW of new installations in 2010 compared to 7.1 GW in 2009.
According to the International Energy Agency, solar energy’s share of global energy generation will increase significantly in the next 10-20 years. This energy source alone is expected to generate approximately 5% of total energy generated in 2030. In 2010 this number was less than 1%. Due to great political focus on generating an increasing share of future global energy demand from renewable energy sources, combined with the major focus on the solar industry, we have found it interesting to examine how the market valuates solar farm assets.
4
In the past few years, focus on renewable energy has increased rapidly which has led to high growth in investments in renewable energy assets. Especially, wind and solar assets have been exposed to great interest from investors. Due to expectations for these 2 markets, it is interesting to identify the structure of the assets held by wind and solar farm developers and to find suitable methods to value such assets. This paper addresses how and why multiple regression analysis is a good valuation tool for solar assets and how to apply our conclusions
in solar asset valuations. We have performed a similar analysis on wind assets. We refer to “Valuing wind farm developers” for our analysis of wind assets.
Our analysis has been performed on the basis of transactions in the solar farm industry. Data accessibility has limited the size of the dataset. This has led to the exclusion of early-stage capacity as an explanatory variable as well as treating capacity under construction and in late stage as one explanatory variable, which we have named non-installed capacity.
Even though the coefficient of determination for the solar analysis has come out low compared to the wind farm analysis, it has been concluded that installed and non-installed capacity affect the enterprise value of solar assets significantly.
Since the release of the second edition of this analysis in January 2011, we have found an additional 4 trans actions suitable for our analysis of solar assets. The additional 4 transactions in the solar analysis have not led to noticeable changes in the conclusions in previous editions. The explanatory power has increased from 83% to 85%, and the EV/MW multiple for installed capacity has increased from EUR 4.0m to EUR 4.2m.
We expect that our conclusions drawn from the analysis will become stronger as we collect new transaction data and obtain a larger dataset. Especially, we expect to reduce the uncertainty associated with the EV/MW multiples and reach a similar level of uncertainty as in the wind farm analysis.
2. Executive summary
5Valuing solar farm developers
This paper addresses how multiple regression analysis of transaction multiples can be used as a benchmarking tool to support a more comprehensive valuation based on a cash flow model.
We present the technical considerations underlying the analysis followed by practical examples that illustrate how the results can be applied from a valuation perspective.
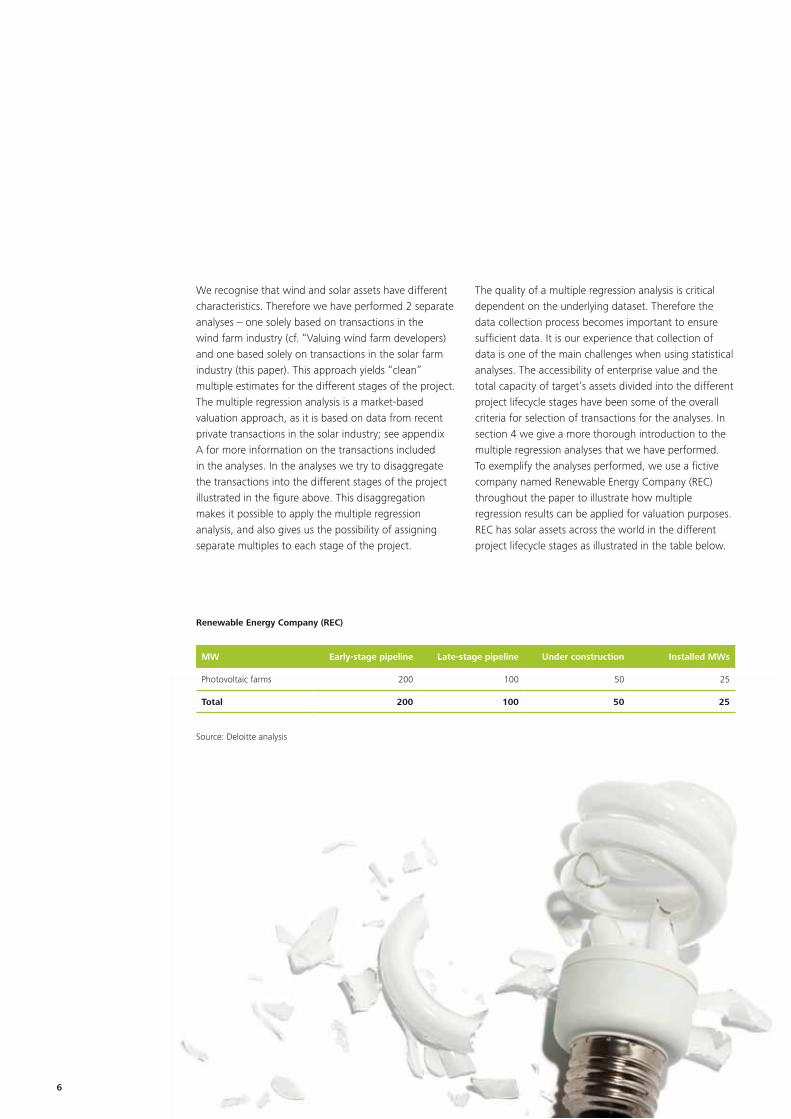
From our point of view, one of the main challenges in valuing solar farm assets is the determination of the market value of solar assets in different stages of the project lifecycle. We define a project lifecycle for solar developers as illustrated in the figure below.
We recognise that transaction prices in the development stages depend on other factors than capacity, such as geographic factors (meteorological conditions, local tax rules, subsidies, etc.), procurement capabilities, power price agreements, operating efficiency and financing. These factors should be valued in a cash flow analysis, but since the purpose of a market approach is to estimate value with a single factor of determination, we focus on capacity in this paper.
3. Introduction
Project lifecycle for solar developers
Source: Deloitte analysis
Early-stage pipeline Late-stage pipeline
Photovoltaic farm project lifecycle
ScreeningUnder approval ApprovedUnder
construction Installed MWs
EV/MW EV/MW
Non-installed MWs
6
We recognise that wind and solar assets have different characteristics. Therefore we have performed 2 separate analyses – one solely based on transactions in the wind farm industry (cf. “Valuing wind farm developers) and one based solely on transactions in the solar farm industry (this paper). This approach yields “clean” multiple estimates for the different stages of the project. The multiple regression analysis is a market-based valuation approach, as it is based on data from recent private transactions in the solar industry; see appendix A for more information on the transactions included in the analyses. In the analyses we try to disaggregate the transactions into the different stages of the project illustrated in the figure above. This disaggregation makes it possible to apply the multiple regression analysis, and also gives us the possibility of assigning separate multiples to each stage of the project.
The quality of a multiple regression analysis is critical dependent on the underlying dataset. Therefore the data collection process becomes important to ensure sufficient data. It is our experience that collection of data is one of the main challenges when using statistical analyses. The accessibility of enterprise value and the total capacity of target’s assets divided into the different project lifecycle stages have been some of the overall criteria for selection of transactions for the analyses. In section 4 we give a more thorough introduction to the multiple regression analyses that we have performed. To exemplify the analyses performed, we use a fictive company named Renewable Energy Company (REC) throughout the paper to illustrate how multiple regression results can be applied for valuation purposes. REC has solar assets across the world in the different project lifecycle stages as illustrated in the table below.
Renewable Energy Company (REC)
Source: Deloitte analysis
MW Early-stage pipeline Late-stage pipeline Under construction Installed MWs
Photovoltaic farms 200 100 50 25
Total 200 100 50 25
7Valuing solar farm developers
4. Choice of method and identification of transactions in the solar farm industry
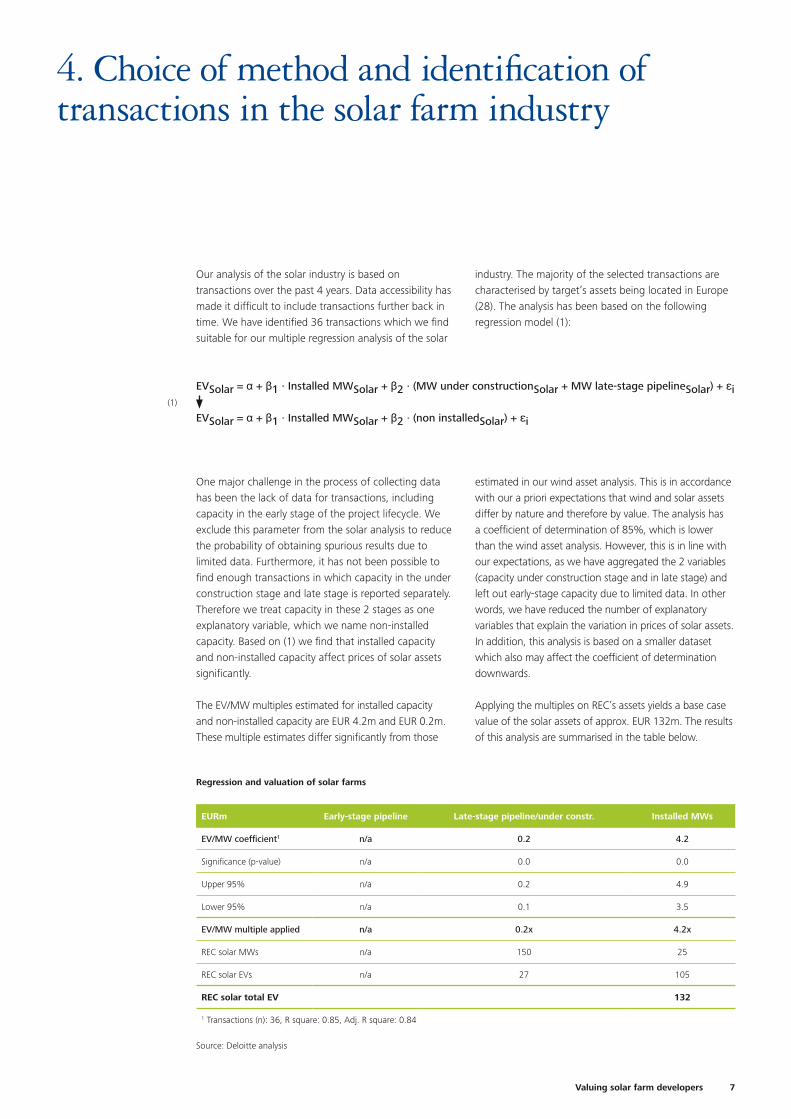
Our analysis of the solar industry is based on transac tions over the past 4 years. Data accessibility has made it difficult to include transactions further back in time. We have identified 36 transactions which we find suitable for our multiple regression analysis of the solar
industry. The majority of the selected transactions are characterised by target’s assets being located in Europe (28). The analysis has been based on the following regression model (1):
One major challenge in the process of collecting data has been the lack of data for transactions, including capacity in the early stage of the project lifecycle. We exclude this parameter from the solar analysis to reduce the probability of obtaining spurious results due to limited data. Furthermore, it has not been possible to find enough transactions in which capacity in the under construction stage and late stage is reported separately. Therefore we treat capacity in these 2 stages as one explanatory variable, which we name non-installed capacity. Based on (1) we find that installed capacity and non-installed capacity affect prices of solar assets significantly.
The EV/MW multiples estimated for installed capacity and non-installed capacity are EUR 4.2m and EUR 0.2m. These multiple estimates differ significantly from those
estimated in our wind asset analysis. This is in accordance with our a priori expectations that wind and solar assets differ by nature and therefore by value. The analysis has a coefficient of determination of 85%, which is lower than the wind asset analysis. However, this is in line with our expectations, as we have aggregated the 2 variables (capacity under construction stage and in late stage) and left out early-stage capacity due to limited data. In other words, we have reduced the number of explanatory variables that explain the variation in prices of solar assets. In addition, this analysis is based on a smaller dataset which also may affect the coefficient of determination downwards.
Applying the multiples on REC’s assets yields a base case value of the solar assets of approx. EUR 132m. The results of this analysis are summarised in the table below.
Regression and valuation of solar farms
Source: Deloitte analysis
EURm Early-stage pipeline Late-stage pipeline/under constr. Installed MWs
EV/MW coefficient1 n/a 0.2 4.2
Significance (p-value) n/a 0.0 0.0
Upper 95% n/a 0.2 4.9
Lower 95% n/a 0.1 3.5
EV/MW multiple applied n/a 0.2x 4.2x
REC solar MWs n/a 150 25
REC solar EVs n/a 27 105
REC solar total EV 132
1 Transactions (n): 36, R square: 0.85, Adj. R square: 0.84
(1)
EVSolar = α + β1 · Installed MWSolar + β2 · (MW under constructionSolar + MW late-stage pipelineSolar) + εi
EVSolar = α + β1 · Installed MWSolar + β2 · (non installedSolar) + εi
8
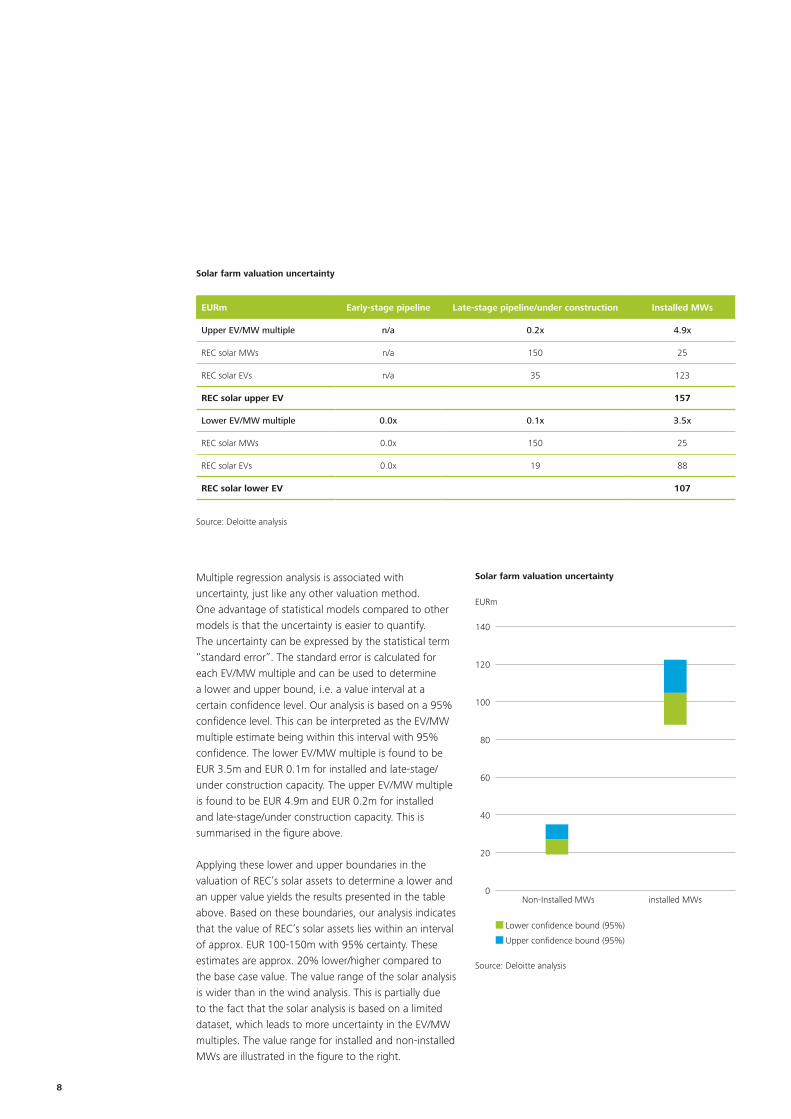
Multiple regression analysis is associated with uncertainty, just like any other valuation method. One advantage of statistical models compared to other models is that the uncertainty is easier to quantify. The uncertainty can be expressed by the statistical term “standard error”. The standard error is calculated for each EV/MW multiple and can be used to determine a lower and upper bound, i.e. a value interval at a certain confidence level. Our analysis is based on a 95% confidence level. This can be interpreted as the EV/MW multiple estimate being within this interval with 95% confidence. The lower EV/MW multiple is found to be EUR 3.5m and EUR 0.1m for installed and late-stage/under construction capacity. The upper EV/MW multiple is found to be EUR 4.9m and EUR 0.2m for installed and late-stage/under construction capacity. This is summarised in the figure above.
Applying these lower and upper boundaries in the valuation of REC’s solar assets to determine a lower and an upper value yields the results presented in the table above. Based on these boundaries, our analysis indicates that the value of REC’s solar assets lies within an interval of approx. EUR 100-150m with 95% certainty. These estimates are approx. 20% lower/higher compared to the base case value. The value range of the solar analysis is wider than in the wind analysis. This is partially due to the fact that the solar analysis is based on a limited dataset, which leads to more uncertainty in the EV/MW multiples. The value range for installed and non-installed MWs are illustrated in the figure to the right.
Solar farm valuation uncertainty
Source: Deloitte analysis
EURm Early-stage pipeline Late-stage pipeline/under construction Installed MWs
Upper EV/MW multiple n/a 0.2x 4.9x
REC solar MWs n/a 150 25
REC solar EVs n/a 35 123
REC solar upper EV 157
Lower EV/MW multiple 0.0x 0.1x 3.5x
REC solar MWs 0.0x 150 25
REC solar EVs 0.0x 19 88
REC solar lower EV 107
Lower confidence bound (95%)
Upper confidence bound (95%)
Solar farm valuation uncertainty
EURm
140
120
100
80
60
40
20
0
Source: Deloitte analysis
Non-Installed MWs installed MWs
9Valuing solar farm developers
Appendix A: Private transaction data from the photovoltaic (solar) farm industry
Solar transactionsThe world (Light Blue)
The world (10 pt Arial bold)
The world (Light Blue)
97
1
189
1
© 2011 Deloitte3 Guidelines for PowerPoint
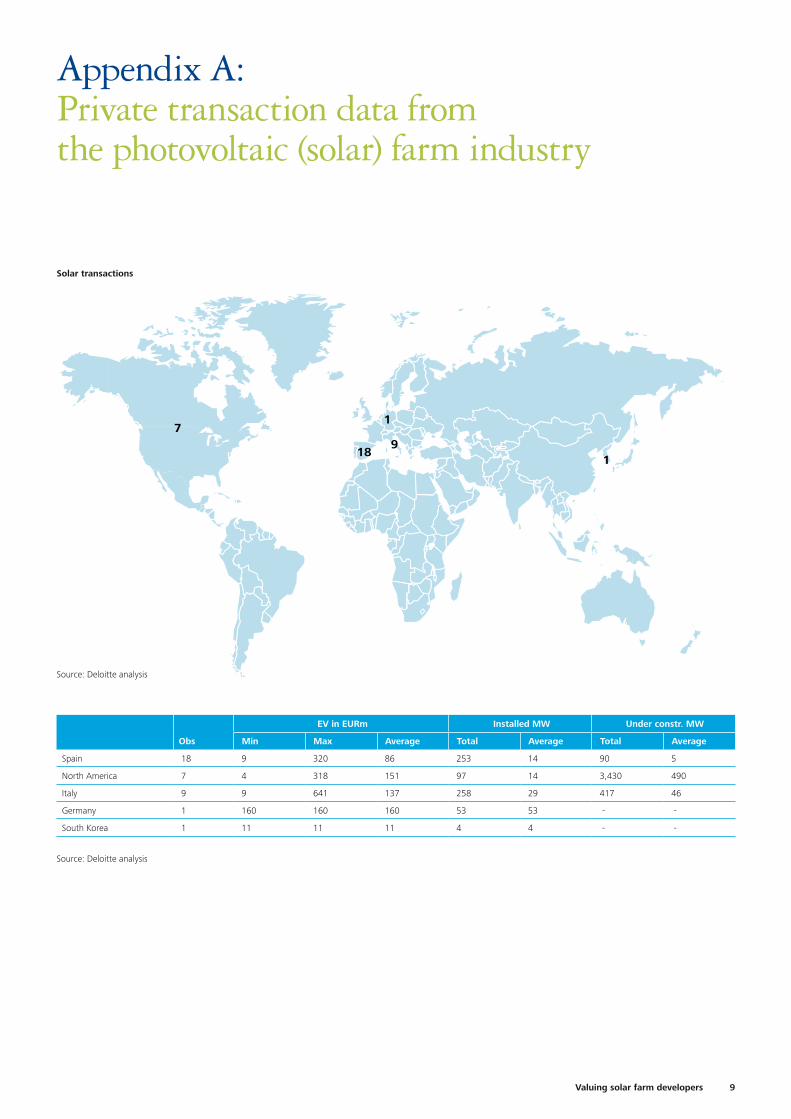
Solar transactions
Source: Deloitte analysis
Obs
EV in EURm Installed MW Under constr. MW
Min Max Average Total Average Total Average
Spain 18 9 320 86 253 14 90 5
North America 7 4 318 151 97 14 3,430 490
Italy 9 9 641 137 258 29 417 46
Germany 1 160 160 160 53 53 - -
South Korea 1 11 11 11 4 4 - -
Source: Deloitte analysis
10
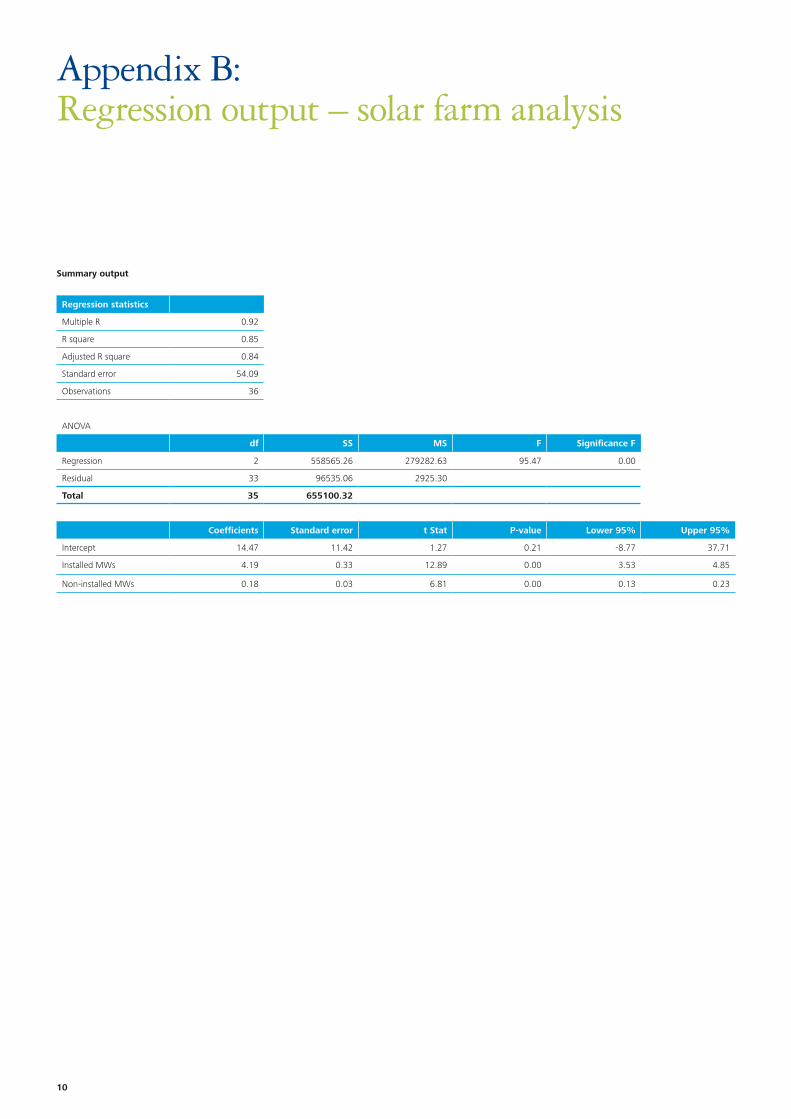
Regression statistics
Multiple R 0.92
R square 0.85
Adjusted R square 0.84
Standard error 54.09
Observations 36
ANOVA
df SS MS F Significance F
Regression 2 558565.26 279282.63 95.47 0.00
Residual 33 96535.06 2925.30
Total 35 655100.32
Coefficients Standard error t Stat P-value Lower 95% Upper 95%
Intercept 14.47 11.42 1.27 0.21 -8.77 37.71
Installed MWs 4.19 0.33 12.89 0.00 3.53 4.85
Non-installed MWs 0.18 0.03 6.81 0.00 0.13 0.23
Appendix B: Regression output – solar farm analysis
Summary output
11Valuing solar farm developers
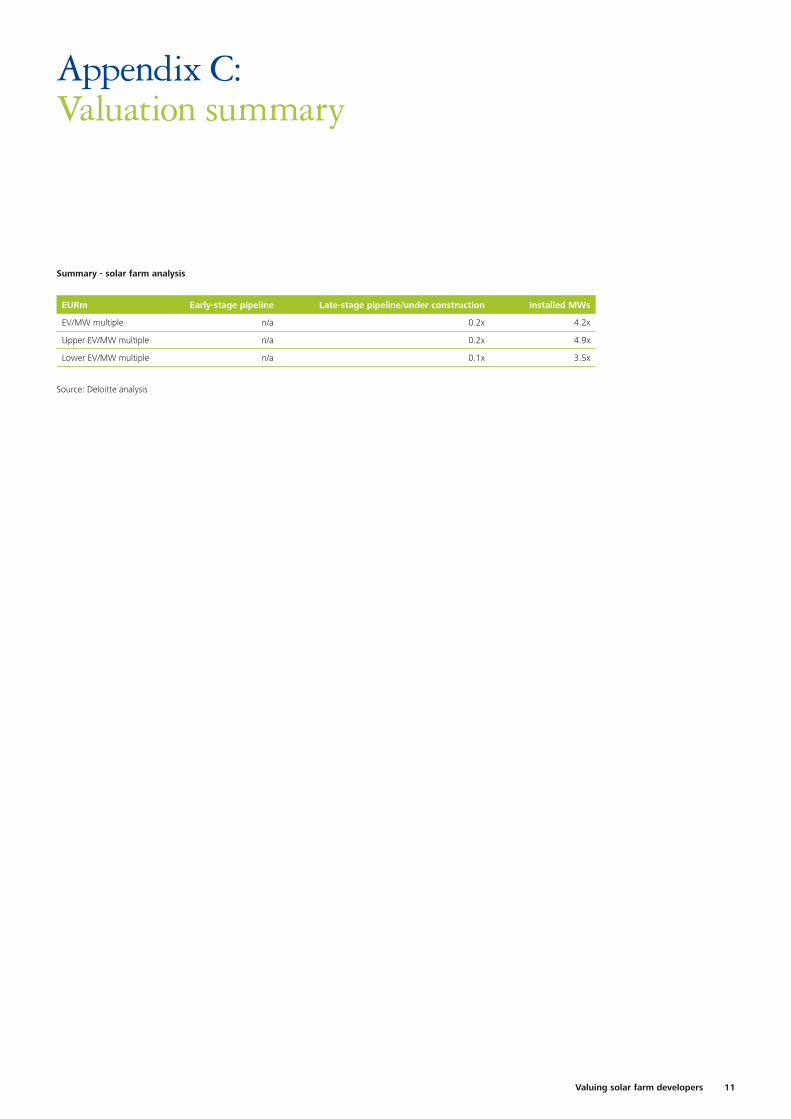
Appendix C: Valuation summary
Summary - solar farm analysis
Source: Deloitte analysis
EURm Early-stage pipeline Late-stage pipeline/under construction Installed MWs
EV/MW multiple n/a 0.2x 4.2x
Upper EV/MW multiple n/a 0.2x 4.9x
Lower EV/MW multiple n/a 0.1x 3.5x
12
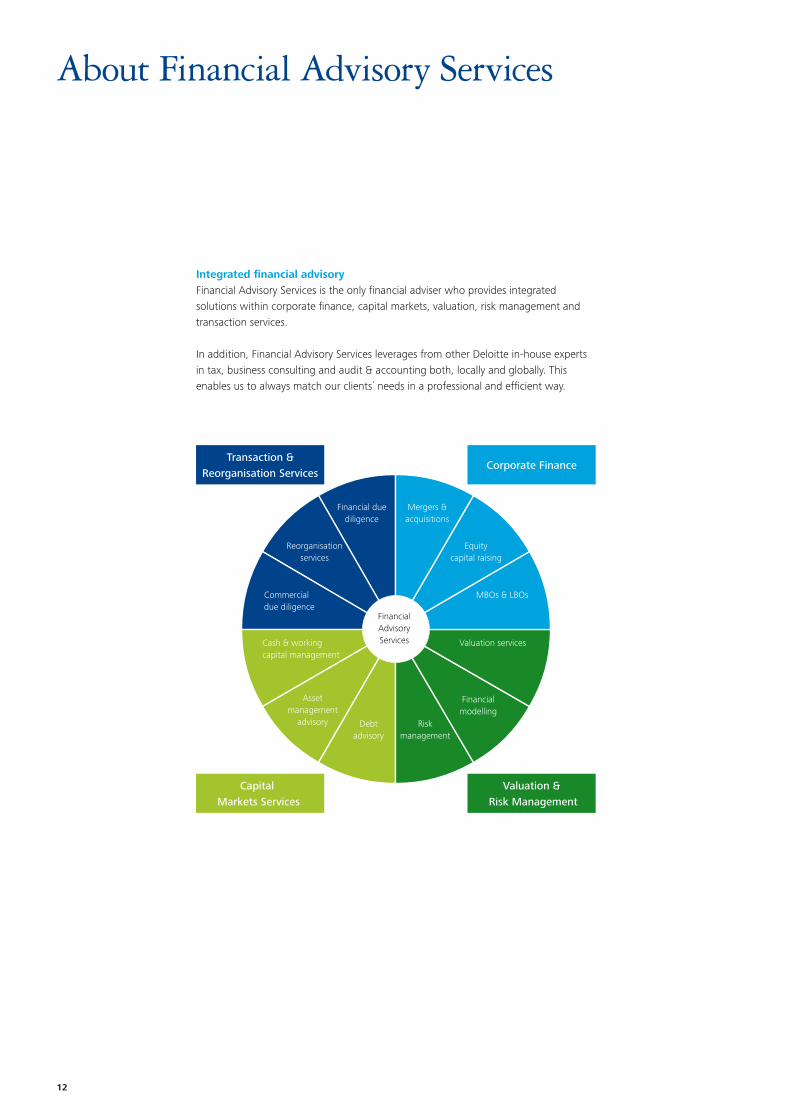
About Financial Advisory Services
Integrated financial advisoryFinancial Advisory Services is the only financial adviser who provides integrated solutions within corporate finance, capital markets, valuation, risk management and transaction services.
In addition, Financial Advisory Services leverages from other Deloitte in-house experts in tax, business consulting and audit & accounting both, locally and globally. This enables us to always match our clients´ needs in a professional and efficient way.
Transaction & Reorganisation Services
Corporate Finance
Valuation & Risk Management
Financial due diligence
Mergers & acquisitions
Equity capital raising
Financial Advisory Services
Reorganisation services
Commercial due diligence
MBOs & LBOs
Valuation servicesCash & working capital management
Asset management
advisory Debt advisory
Risk management
Financial modelling
Capital Markets Services

CopenhagenWeidekampsgade 62300 Copenhagen STel. +45 36 10 20 [email protected]
Tinus Bang ChristensenPartnerValuation & Risk ManagementTel. +45 36 10 31 [email protected]
Hans Henrik PontoppidanPartnerCorporate FinanceTel. +45 36 10 34 [email protected]
Troels Ellemose LorentzenAssistant DirectorValuation & Risk ManagementTel. +45 30 93 56 [email protected]
Thomas BertelsenAssistant ManagerValuation & Risk ManagementTel. +45 36 10 27 [email protected]
Deloitte contacts
Deloitte provides audit, tax, consulting, and financial advisory services to public and private clients spanning multiple industries. With a globally connected network of member firms in 140 countries, Deloitte brings world class capabilities and deep local expertise to help clients succeed wherever they operate. Deloitte’s 170,000 professionals are committed to becoming the standard of excellence.
Deloitte’s professionals are unified by a collaborative culture that fosters integrity, outstanding value to markets and clients, commitment to each other, and strength from diversity. They enjoy an environment of continuous learning, challenging experiences, and enriching career op-portunities. Deloitte’s professionals are dedicated to strengthening corporate responsibility, building public trust, and making a positive impact in their communities.
Deloitte Touche Tohmatsu LimitedDeloitte refers to one or more of Deloitte Touche Tohmatsu Limited, a UK private company limited by guarantee, and its network of member firms, each of which is a legally separate and independent entity. Please see www.deloitte.com/about for a detailed description of the legal structure of Deloitte Touche Tohmatsu Limited and its member firms.
© 2011 Deloitte Financial Advisory Services A/S. Member of Deloitte Touche Tohmatsu Limited