Valuing Geospatial Information : a review - INSPIRE |...
19
Valuing Geospatial Information : a review Alan Smart - Sydney Andrew Coote - London 23 June 2013
Transcript of Valuing Geospatial Information : a review - INSPIRE |...

Valuing Geospatial Information : a review
Alan Smart - Sydney Andrew Coote - London 23 June 2013

Slide 2
Topics
● Revenue/Value added approach ● Economic welfare analysis ● General equilibrium analysis ● Components of value

Slide 3
Why is it so hard to estimate ● An enabling
technology ● Public good
dimension ● Impacts occur
across a large number of sectors
● Dynamic nature of change
Spatial technologies
Agriculture
Mining and resources
Transport
Planning and Construction
Utilities
Property and services
Emergency management
National security
Natural resource management
Retail
Banking
Government

Slide 4
The value added approach
● Economic contribution of Ordnance Survey in Great Britain – Oxera 1999
● Value added is the value of output less the cost of inputs

Slide 6

Slide 8
Revenue/value added approach
● Provides information about the size of the footprint
● Difficulties in assessing the wider impacts ● Does not take account of resource shifts nor
productivity impacts ● Not as useful for assessment of net benefits
geospatial information delivers to the economy

Slide 9
Economic welfare analysis ● Consumer and
producer surplus ● Need to know what
consumers are prepared to pay Willingness to pay
surveys ● And at what price
producers are prepared to produce Usually
commercially sensitive
Consumer Surplus
Producer Surplus
P
PE
QE Q
D
S
Slide 12
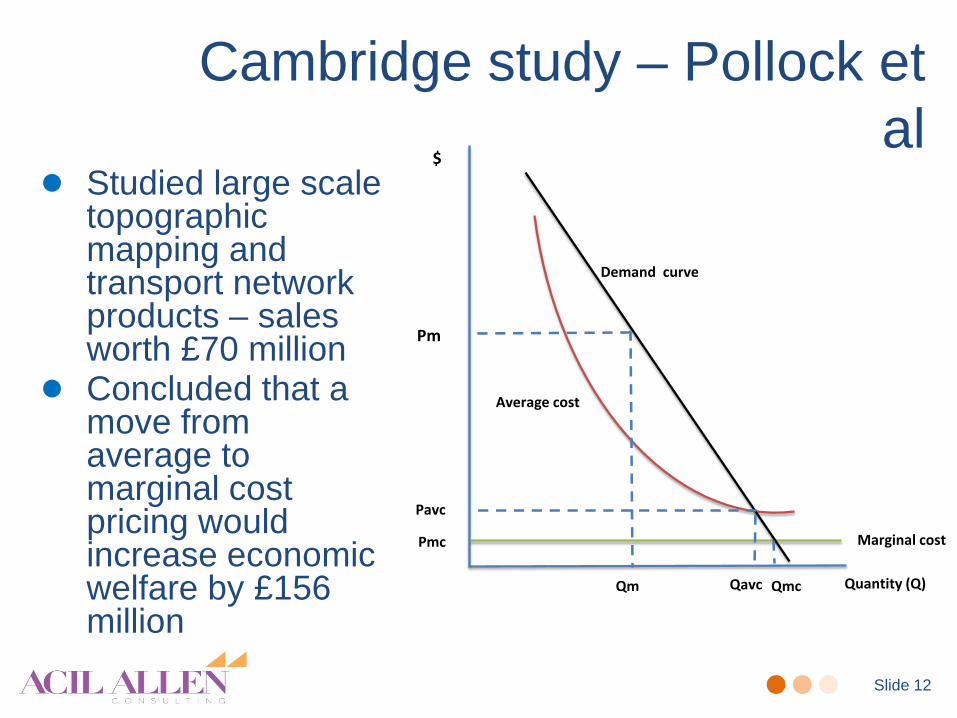
Cambridge study – Pollock et al
● Studied large scale topographic mapping and transport network products – sales worth £70 million
● Concluded that a move from average to marginal cost pricing would increase economic welfare by £156 million
Pm
Pavc
Pmc
Qm Qavc Qmc
Marginal cost
Average cost
Demand curve
Quantity (Q)
$

Slide 13
ANZLIC Study ● PWC study for ANZLIC in 2010 used a similar
methodology to address pricing policies ● Change in economic welfare (consumer surplus in this
case) by moving from cost recovery to marginal cost pricing is shown in table below
● Report notes that this would come at a loss in revenue to the agencies concerned which has consequences for custodianship of data.
Victorian topographic
Landgate topographic
Landgate arial photography
Geoscience Australia
topographic
$ million $ million $ million $ million
Change in economic welfare 3.3 1.4 1.0 4.7

Slide 16
Welfare analysis ● Demand curve may not be linear and elasticities of
demand are not likely to be constant ● A partial analysis that does not take into account
resource transfers in the economy Eg - Planning and construction gains but lawyers
lose when development approvals are streamlined ● Multiplier analysis can be fraught with difficulties “If I added up all the multiplier studies that come
across my desk we would have an economy four times the size of the one we actually have”

Slide 17
Combining approaches – Oxera 2013
● Direct effects Gross value added
$113 billion Net $40 billion
● Wider economy $10 billion cost
savings ● Consumer savings Fuel savings $22
billion Education $22 billion
Source: Oxera - Jan 2013
ECONOMIC IMPACTS
DIRECT EFFECT Economic
footprint of GEO sector
CONSUMER PERSPECTIVEEfficiency for
end user
WIDER ECONOMOYsupply side
effects

Slide 18
Productivity estimates and CGE modelling
● Economy wide approach Estimate direct impacts and use general equilibrium
model to translate into economy wide impacts Takes into account resource transfers within the
economy as a result of change ● Direct impacts changes in productivity of labour or capital or
multifactor changes in resource availability changes in income or trade

Slide 19
Productivity and adoption – sector wide impacts

Slide 20
Translates into national economy
Precise
positioning used in road
freight
Decreased price road transport sector
Lower production price in sectors using road trasnsport (such as the retail sector). Increased access to
factors .
Productivity improvement
National economic impacts
GDPConsumptionInvestment
Industry outputEmploymentIncreased output and
value added
Increased output per unit of value added
Decreased competitiveness.
Lower value added in coastal shipping due to
resource transfer to road freight
Decreased valueadded

Slide 21
Published studies Year Organisation Issue Results (GDP) 2008 ACIL Tasman Value of spatial
information in Australia $6 billion-$12 billion in 2006-07 7% higher if barriers removed
2009 ACIL Tasman/SKM/Ecological Consultants
Value of Spatial information in New Zealand
$NZ1.2 billion $NZ 1.6 million with barriers removed
2010 Consultingwhere /ACIL Tasman
Value of geospatial information for local government in England and Wales
£320 million higher in 2007-08 as a result of geospatial information
2008 Allen Consulting Value of enhanced positioning
Total value in mining, agriculture and construction $ 0.8billion-$1.9 billion
2011 ACIL Tasman/ Lester Fanks/Consultingwhere
Value of improved SDI in Tasmania
$1.5 million to the state in 2010
2013 ACIL Tasman Value of augmented positioning
Underway

Slide 23
Local Government (UK) Results
● Output of local government has increased by $400million in 2009 as a result of the accumulated productivity benefits of using geospatial application
● Gross Domestic Products (GDP) for England and Wales
was over $480 million higher in 2009
● Projecting forward to 2015, GDP for England and Wales will be an estimated $840 million higher with right policy framework
● Average annualised cost to benefit ratio of using
geospatial information and services in local government is on average 1:2.5 over 5 years.

Slide 24
CGE
● Takes account of resource shifts in the economy including trade effects
● Counterfactual requires careful thought ● Depends on good evidence for productivity
impacts and assessment of levels of adoption ● Reflects the current structure of the economy ● Does not capture intangibles

Slide 25
Components of value
TOTAL ECONOMIC VALUE
Outputs
• petroleum and minerals
• transport• communications• property and
construction• agriculture• Fishing• forestry• tourism • public
administration
Benefits
• flood control• climate• sustainable water
resources• sustainable
natural resource management
• Biosecurity• biodiversity
Benefits
• protection from fires, floods and natural disasters
• improved management of climate change
• Insurance• defence
Benefits
• satisfaction that resource is there
• preservation of environment and conservation values
• national security• Long baseline for
historical analysis
Benefits
• altruistic• preserving
national assets for the next generation
USE VALUES NON-USE VALUES
DIRECT USE VALUE
ECOLOGICAL FUNCTION
VALUE
OPTION VALUE
EXISTENCE VALUE
BEQUEST VALUE

Slide 26
Thank you