Value vs. Glamour: A Global Phenomenon - Charles · PDF filePAGE 2 While value stocks in the...
69
Original Research For Inquisitive Investors WWW.BRANDES.COM/INSTITUTE [email protected] November 2012 Value vs. Glamour: A Global Phenomenon
-
Upload
vuongxuyen -
Category
Documents
-
view
213 -
download
0
Transcript of Value vs. Glamour: A Global Phenomenon - Charles · PDF filePAGE 2 While value stocks in the...

Original Research For Inquisitive Investors
WWW.BRANDES.COM/INSTITUTE
November 2012
Value vs. Glamour:A Global Phenomenon

PAGE 1
1 Consistent with the previous versions of this study, stocks were fi rst divided into deciles based on their fundamentals (e.g., price-to-book (P/B), price-to-cash fl ow (P/CF), price-to-earnings (P/E)). Aggregate performance of each decile was tracked over the next fi ve years. This process was then repeated each year. Please see Part 1: Understanding LSV sections for a greater explanation of the study’s methodology.
Value vs. Glamour: A Global Phenomenon
Preface
In previous versions of our Value vs. Glamour study we have explored the historical performance of stocks based on their fundamental characteristics and quantifi ed a value premium. Results have shown that over the long term, unpopular “value” stocks, those that are associated with companies experiencing hard times, operating in mature industries or facing adverse circumstances have outperformed their more popular “glamour” counterparts—fast-growing companies, oft en from dynamic industries with a relatively high profi le. Expanding on the work of noted academics, we extended the scope of their research to determine if the value premium was consistent across global markets. In this update from our 2010 work, we expand our study through 2012 to include the recent worldwide economic downturn in developed markets and examine if value investing has worked in emerging markets over the long term.
Focus and Key Findings
Th is paper does not attempt to resolve why the value premium is evident, or explain its persistence. Instead, it seeks to quantify the value premium and gauge its prevalence. By examining returns for U.S. stocks from 1968-2012 and stocks outside of the U.S. from 1980-2012, this study reveals a consistent value premium across:
• valuation metrics
• geography
• market capitalizations
Y A
XIS
TITL
E
6%
16%
10
14%
12%
10%
8% 1980-2007
1980-2012
987654321
Glamour (High P/B) ------------------------------------------------------------------------- Value (Low P/B)
Ann
ualiz
ed A
vera
rge
5-Y
ear
Ret
urns
Exhibit 1: Global All Cap Value Premium (P/B Deciles, June 30, 1980–June 30, 2012)
Source: Worldscope via FactSet, The Brandes Institute; as of 6/30/2012. Past performance is not a guarantee of future results.
Exhibit 1 shows, over the long term, there remains strong evidence of a global value premium.1 However, returns for all stocks dropped on average since 2007, those in the value deciles fell more than those in the glamour deciles. Exhibit 1 shows that value decile 10 had an annualized average return of 15.7% through 2007 and 14.2% over the entire period, a diff erence of 1.5%. Th e disparity between the two periods in decile 1 was only 0.8%; refl ecting the diffi cult environment for value stocks over the past few years.

PAGE 2
While value stocks in the United States did underperform glamour stocks in the past two periods, non-U.S. value stocks (lifted by small caps) continued to outperform glamour.
Y A
XIS
TIT
LE
-10%
-8%
-6%
-4%
-2%
0%
2%
4%
6%
8%
10%
12%
14%
1 2 3 4 5 6 7 8 9 10
2012 All Years
Last 5 Periods
Last 2 Periods
Glamour (High P/B) ---------------------------------------------------------------------- Value (Low P/B)
Ann
ualiz
ed A
vera
rge
5-Y
ear
Ret
urns
Exhibit 2: U.S. Value Premium (P/B Deciles, April 30, 1968–April 30, 2012)
Source: Worldscope via FactSet, The Brandes Institute; as of 4/30/2012. Past performance is not a guarantee of future results. Charts throughout the paper may appear slightly different due to performance calculation methodology.
As seen in Exhibit 3, while value stocks in the United States underperformed glamour stocks in the past two periods, non-U.S. value stocks (lift ed by small caps) continued to outperform glamour.
Y A
XIS
TIT
LE
-20%
-10%
0%
10%
20%
30%
40%
85 87 89 91 93 95 97 99 01 03 05 07 09 11
Ending Year of Rolling 5-Year Period
Value Outperforms
Glamour Outperforms
U.S.
Non-U.S.
5-Y
ear
Ann
ualiz
ed R
elat
ive
Per
form
ance
Exhibit 3: Rolling 5-Year Annualized Relative Performance of Value vs. Glamour (P/B Deciles, June 30, 1980–June 30, 2012)
Source: Worldscope via FactSet, The Brandes Institute; as of 6/30/2012. Past performance is not a guarantee of future results.
A closer examination of the recent underperformance of U.S. value stocks off ers some evidence of what may be weighing on global results. Exhibit 2 shows a comparison between long-term results for U.S. value stocks compared to the results of the past fi ve and two year rolling periods. Th e long-term results for the overall study show evidence of a clear value premium, with the low-price-to-book (P/B)value decile 10 averaging an annualized 12.8% return, while returns for the high-P/B glamour decile 1 averaged 4.3%. Th e shorter-term results are less clear. Th e average returns for the last fi ve 5-year rolling periods appear fl at across the value/glamour spectrum, while the last two rolling periods show that glamour has outperformed value recently in the United States. In this short time frame, decile 1 stocks posted an average gain of 2.3%, while decile 10 stocks registered a -6.9% return.

PAGE 3
We believe historical analysis may shed light on the relative perfor-mance of value stocks and glamour stocks—largely because their divergent traits often manifest in their respective valuation metrics.
2 Graham, Benjamin and David L. Dodd. Security Analysis. McGraw-Hill, New York, 1934. See chapters 1 and 17.3 Lakonishok, Josef, Andrei Shleifer and Robert Vishny. 1994. “Contrarian Investment, Extrapolation, and Risk.” Journal of Finance 49 (December): page 1541-1578. 4 At the time of their study’s publication, Lakonishok taught at the University of Illinois, Shleifer at Harvard University and Vishny at the University of Chicago. Also in 1994, the trio founded their own asset management fi rm.
Background
In 1934’s Security Analysis, Benjamin Graham and David Dodd argued that out-of-favor stocks are sometimes underpriced in the marketplace, and that investors cognizant of this phenomenon could capture strong returns. Conversely, the duo theorized, prices for widely popular stocks oft en are buttressed by high expectations and could be vulnerable if these expectations prove too enthusiastic.2
Th e philosophy espoused by Graham and Dodd is now widely known as value investing, and the unpopular value stocks they advocated oft en are associated with companies experiencing hard times, operating in mature industries or facing similarly adverse circumstances. Alternatively, typically fast-growing glamour companies frequently function in dynamic industries with a relatively high profi le. Th is stark contrast in attributes leads to a natural question: which stocks have performed better, value or glamour?
While this is not a simple inquiry, we believe historical analysis may shed light on the relative performance of value stocks and glamour stocks—largely because their divergent traits oft en manifest in their respective valuation metrics.
Specifi cally, value shares typically feature low price-to-book, price-to-earnings (P/E), or price-to-cash fl ow (P/CF) ratios, while glamour stocks generally are characterized by valuation metrics at the opposite end of the spectrum. As a result, these metrics can be used to split a sample of equities into either the value or the glamour camp—and subsequently track each group’s performance over time.
Th is approach to the value versus glamour question is not novel. As early as 1977, academic studies used share price and earnings per share data to classify stocks into the value or glamour categories and compare historical performance. Th rough the 1980s, 1990s and 2000s, additional studies broadened the analysis to include book value and cash fl ow metrics.3
In 1994, academics Josef Lakonishok, Andrei Shleifer and Robert Vishny (LSV) published “Contrarian Investment, Extrapolation, and Risk,” a seminal entry in the value versus glamour canon.4 Using data from 1968 through 1994, LSV grouped U.S. stocks into value and glamour segments based on P/B, P/CF and P/E ratios, as well as sales growth. Th e researchers concluded
Y A
XIS
TIT
LE
109876543210%
5%
10%
15%
20% US (1968-2012)
Non-US (1980-2012)
EM (1980-2012)
Glamour (High P/B) ------------------------------------------------------------------------ Value (Low P/B)
Ann
ualiz
ed A
vera
rge
5-Y
ear
Ret
urns
Exhibit 4: Annualized Average 5-Year Returns
Source: Worldscope via FactSet, The Brandes Institute; as of 6/30/2012. Past performance is not a guarantee of future results.
Th is trend continues when looking at emerging markets. Exhibit 4 shows the notable outperformance of value stocks in emerging markets, both in relation to glamour stocks and to U.S. and non-U.S. value stocks. While the recent underperformance of value stocks is noteworthy, the long-term results confi rm a historically persistent value premium measurable across global equity markets.

PAGE 4
5 LSV’s conclusions are summarized on pages 1543-1544 of their report.6 United States returns are through April 30, to maintain consistency with existing research.7 While LSV’s paper connects value stocks with recognized value investing proponents like Benjamin Graham and David Dreman, it does not explicitly associate glamour stocks with “growth” investing, the value strategy’s traditional foil. Accordingly, we note that, for the purposes of our study, glamour is not necessarily synonymous with growth. While these defi nitions of value and glamour follow aca-demic precedent, we recognize their limitations. The defi nitions are not designed to be suggestive of the way in which value or growth investment managers actually pick stocks.8 Like many researchers studying value vs. glamour, LSV actually used reciprocals of the P/B, P/CF and P/E metrics to distinguish between value stocks and glamour stocks. We note that this approach yields identical results, and we focus on P/B, P/CF and P/E for simplicity.9 Price-to-book was defi ned as market value of equity on April 30 divided by book value of equity as of the most recent fi scal year-end.
that, for a broad range of defi nitions, value stocks consistently outperformed glamour stocks by wide margins. In addition, this outperformance remained robust when the stock samples under review were limited to the larger-capitalization stocks typically favored by large investors.5
Critics of LSV’s study have argued that results for U.S. stocks simply could be the byproduct of sample-specifi c happenstance. In this paper, we investigate the validity of that claim. We begin by reviewing the methodology employed in LSV’s 1994 study. Next, we duplicate one of the study’s primary components and extend its scope to include historical data through June 2012.6 We also incorporate adjustments to focus more directly on the investment opportunities typically available to large investors. Finally, we apply LSV’s methodology to non-U.S. markets and weigh in on the value versus glamour debate from a global perspective.
We fi nd that the value stocks identifi ed outperformed their glamour counterparts substantially over the long term. Th e following sections explore our results in detail. We conclude with a brief review and a discussion of issues for future consideration.
Part 1: Understanding LSV
In their study, LSV focused on companies traded on the New York Stock Exchange (NYSE) or the American Stock Exchange (AMEX) from April 1968 through April 1989.7 To incorporate a variety of defi nitions of value and glamour, the researchers classifi ed stocks using each of the following criteria:
• price-to-book (P/B)
• price-to-cash fl ow (P/CF)
• price-to-earnings (P/E)
• sales growth over the preceding fi ve years
• select pairings of the variables above8
LSV’s methodology can be condensed into three basic steps. First, the sample of companies as of April 30, 1968 was divided into deciles based on one of the criteria above. Second, the aggregate performance of each decile was tracked for each of the next fi ve years on each April 30. Finally, the fi rst and second steps were repeated for each April 30 from 1969 through 1989.
Consider the P/B criterion as an example. First, all stocks traded on the NYSE and AMEX as of April 30, 1968 were sorted into deciles based on their P/B ratios on that date.9 Stocks with the highest P/B ratios were grouped in decile 1. For each consecutive decile, P/B ratios decreased; this culminated in stocks with the lowest P/B values forming decile 10.
In essence, this process created 10 separate portfolios, each with an inception date of April 30, 1968. Th e lower deciles, which consisted of higher-P/B stocks, represented glamour portfolios. In contrast, the higher deciles—those fi lled with lower-P/B stocks—represented value portfolios.

PAGE 5
10 For performance measurement, decile weights were rebalanced annually. As a result, deciles began each year with equal weights for all stocks. 11 Appendix Part C illustrates LSV’s annualized average 5-year returns for the P/CF and P/E criteria. For additional information, see “Contrarian Investment, Extrapolation, and Risk.”12 Our source for P/B, P/CF and P/E data as well as performance information is the Compustat database, which we accessed using FactSet.
Lakonishok, Shleifer and Vishny repeated this analysis for the price-to-cash fl ow, price-to-earnings, and sales growth metrics. The trio found that, for each of these value/glamour criteria, value stocks outperformed glamour stocks by wide margins.
From there, annual performance for deciles 1 through 10 was tracked over the subsequent fi ve years.10 Additionally, new 10-decile sets were constructed based on the combined NYSE/AMEX sample as of April 30, 1969, and every subsequent April 30 through 1989. For each of these new sets, decile-by-decile performance was recorded for the fi ve years aft er the inception date. Aft er completing this process, the researchers had created 22 sets of P/B deciles, and tracked fi ve years of decile-by-decile performance for each one. Next, LSV averaged the performance data across these 22 decile sets to compare value and glamour.
As the chart above indicates, LSV found that performance for glamour stocks was outpaced by performance for their value counterparts. For instance, 5-year returns for decile 1—those stocks with the highest P/B ratios—averaged an annualized 9.3%, while returns for the low-P/B decile 10 averaged 19.8%. Th ese annualized fi gures are equivalent to cumulative rates of return of 56.0% and 146.2%, respectively.
LSV repeated this analysis for the P/CF, P/E and sales growth metrics. Th e trio found that, for each of these value/glamour criteria, value stocks outperformed glamour stocks by wide margins. Additionally, value bested glamour in experiments with groups sorted by select pairings of P/B, P/CF, P/E and sales growth.11
Part 2: Duplicating and Adjusting LSV’s Study
Th e results of LSV’s study are clear: for U.S. equities trading between 1968 and 1989, those exhibiting characteristics typically associated with value stocks (low P/B, P/CF and P/E ratios) signifi cantly outperformed those with more glamour-oriented traits (high P/B, P/CF and P/E ratios).
Given the compelling results of LSV’s study, we sought to extend and update the study. Our fi rst step involved duplicating the trio’s methodology. We started by forming ten decile sets as of every April 30 beginning in 1968. We performed this process three times, for each of the P/B, P/CF and P/E criteria. Next, we measured fi ve years of decile-by-decile returns for each of these sets. Th en we averaged the results across all sets to compare the performance of value stocks and glamour stocks.12
Y A
XIS
TITL
E
109876543218%
10%
12%
14%
16%
18%
20%
LSV's results
Glamour (High P/B) ------------------------------------------------------------------------ Value (Low P/B)
Annu
aliz
ed A
vera
rge
5-Ye
ar R
etur
ns
Source: Lakonishok, Shleifer and Vishny. “Contrarian Investment, Extrapolation, and Risk.” Journal of Finance 49 (December 1994). Past performance is not a guarantee of future results.
Exhibit 5: Annualized Average 5-Year Returns (P/B Deciles, April 30, 1968–April 30, 1994)

PAGE 6
We recognized certain limitations in the original study, namely that LSV’s sample might not accu-rately refl ect a typical large investor’s uni-verse during the period of their study.
13 We noted similar parity in tests of our P/CF and P/E methodology, as Appendix Part D illustrates. For all three criteria, our results are somewhat different than LSV’s results. We believe this may stem from minor differences in our data sources. For example, to calculate performance, LSV used returns series from the Center for Research in Securities Prices (CRSP) while we used price histories from Compustat; coverage differences between the two sources may have had some effect on comparative results for deciles 1 and 10.
To gauge the precision of our methodology, we tested it using the same time period studied by LSV. Exhibit 6 compares LSV’s fi ndings for the P/B criterion with the results yielded by our synchronized methodology. Th e conclusions are not identical, but we believe their parity is strong enough to validate our methodology as a functional approximation of the LSV framework.13
Aft er validating our methodology, we sought to update LSV’s original study. However, we recognized certain limitations in the original study, namely that LSV’s sample might not accurately refl ect a typical large investor’s universe during the period of their study. Th e sample contains many stocks with prohibitively small market capitalizations. To accommodate for this shortcoming, we adjusted our extended study’s sample in three ways.
First, we noted LSV’s sample of companies only included companies listed on the New York and American Stock Exchanges. Given the growing infl uence of other markets and exchanges through the 1990s, namely the NASDAQ market, we extended the sample by including all companies domiciled in the United States. Th is eff ectively added to our sample companies listed on U.S. exchanges outside the NYSE and AMEX.
Next we excluded the smallest 50% of all com-panies in the sample. Th e Compustat database we used includes U.S. companies with market capitalizations ranging from hundreds of billions of dollars to less than $1 million. Th e removal of micro caps, or fi rms with prohibitively small market capitalizations, yielded a sample that more accurately represented a truly “investable” universe in our opinion. Th e impact of this adjustment is refl ected in a close examination of our most recent sample, formed on April 30, 2007. Before the adjustment, the smallest stock in our universe had a market capitalization of less than $1 million. Following the adjustment, the smallest capitalization in the sample was $740 million.
Aft er removing the micro caps, we divided the remainder of the sample into large-cap and small-cap components. Specifi cally, we grouped the largest 30% of the remaining companies in a large-cap segment and assigned the smallest 70% to a small-cap segment. Th is segmentation enabled us to examine diff erences in the relationship between value and glamour at the large- and small-cap levels. Th ese segmented U.S. results are reviewed in detail in Part 5 of this paper. In the next section we fi rst examine our extended all-cap results through 2012, and then apply this methodology globally in Part 4.
Y A
XIS
TITL
E
109876543218%
10%
12%
14%
16%
18%
20%
22%
LSV's results
B.I. synchronized
results ('68-'94)
Glamour (High P/B) ------------------------------------------------------------------------ Value (Low P/B)
Ann
ualiz
ed A
vera
rge
5-Y
ear
Ret
urns
Source: Lakonishok, Shleifer and Vishny. “Contrarian Investment, Extrapolation, and Risk.” Journal of Finance 49 (December 1994); Compustat, The Brandes Institute as of 4/30/2007. Past performance is not a guarantee of future results.
Exhibit 6: Annualized Average 5-Year Returns (P/B Deciles, April 30, 1968–April 30, 1994)

PAGE 7
The researchers found that, from 1975 to 1995, value stocks outperformed glamour stocks in 12 of 13 major national equity markets. In their opinion, this laid to rest the possibility that the value outper-formance noted by LSV was sample-specifi c happenstance.
14 1968 - 2012 results for deciles based on P/CF and P/E were also very similar to results for the original period, as Appendix Part E illustrates. 15 Fama, Eugene F. and Kenneth R. French. 1998. “Value versus Growth: The International Evidence.” Journal of Finance 53 (December): pages 1975-1999.
Part 3: Extending the Results
To expand upon LSV’s fi ndings we begin with our adjusted sample, which now includes data through 2012. Specifi cally, we added decile sets formed on April 30, 1990 through April 30, 2007 and incorporated their performance into our analysis. Th is increased our sample size from 22 sets of deciles to 40. In addition, the end of the period covered by our performance calculations extended from April 30, 1994 to April 30, 2012.
Exhibit 7 compares annualized average performance for U.S. stocks from the 1968 to 2012 period for deciles based on price-to-book.14 Returns for deciles across the spectrum changed only slightly in the extended time frame from our replicated LSV results. Most notably, the overall pattern of substantial value stock outperformance persisted. During the 1968 to 2012 period, performance for decile 1 glamour stocks averaged an annualized 6.5% versus an average of 14.8% for the value stocks in decile 10. Respective cumulative performance equaled 37.2% and 99.0%.
Y A
XIS
TITL
E
All Cap
Ann
ualiz
ed A
vger
age
5-Y
ear
Ret
urns
109876543216%
8%
10%
12%
14%
16%
Glamour (High P/B) ------------------------------------------------------------------------ Value (Low P/B)
Source: Compustat via FactSet, The Brandes Institute; as of 4/30/2012. Past performance is not a guarantee of future results.
Part 4: Extending Results to Global Markets
Encouraged by our extended fi ndings in the United States, we were interested in applying this methodology globally. As noted earlier, some critics of LSV’s study have argued that results for U.S. stocks simply could be the product of random chance. Would a worldwide examination of value stocks and glamour stocks rebut this contention?
Eugene Fama of the University of Chicago’s Graduate School of Business and Kenneth French from MIT’s Sloan School of Management tackled a similar question in 1998’s “Value versus Growth: Th e International Evidence.” Th e researchers found that, from 1975 to 1995, value stocks outperformed glamour stocks in 12 of 13 major national equity markets. In their opinion, this laid to rest the possibility that the value outperformance noted by LSV was sample-specifi c happenstance. “[R]ather than being unusual,” Fama and French concluded, “the higher average returns on value stocks in the United States are a local manifestation of a global phenomenon.”15
Exhibit 7: Annualized Average 5-Year Returns (P/B Deciles, April 30, 1968–April 30, 2012)

PAGE 8
16 For eight of the listed countries – Belgium, Denmark, Ireland, Greece, New Zealand, Norway, Portugal, and Spain – limits on suffi cient data precluded them from our full country-by-country analysis in the Appendix. 17United States returns are through April 30, to maintain consistency with existing research.18Given Worldscope’s inception in 1980, the period from 1980 to the mid-1990s refl ects not only market growth, but also Worldscope’s expansion in company coverage.
Similar to Compustat, the Worldscope database includes companies with market capitalizations ranging from hundreds of billions of dollars to less than $1 million. To adjust for prohibitively small companies, we followed the identical methodology used in the extension of LSV’s original study, excluding the smallest 50% of all companies in each country. Th is removed micro caps and yielded a sample we believe to be more representative of a typical large investor’s investable universe.
To better capture non-U.S. constituent data, the reconstitution date was changed from April 30 (chosen to capture the most recent U.S. 10-K fi lings) to each June 30, corresponding to non-U.S. tax fi lings.17 Exhibit 8 illustrates the growth in the number of companies included in our sample, both in large-cap and small-cap universes, as covered by the Worldscope database.18
COUNTRIES IN GLOBAL SAMPLE
Australia Denmark Greece Japan Portugal Switzerland
Austria Finland Hong Kong Netherlands Singapore United Kingdom
Belgium France Ireland New Zealand Spain United States
Canada Germany Italy Norway Sweden
Y A
XIS
TITL
E
Tota
l # o
f C
ompa
nies
0
1000
2000
3000
4000
5000
6000
7000
80 82 84 86 88 90 92 94 96 98 00 02 04 06
Small Cap
Large Cap
Source: Worldscope via FactSet, The Brandes Institute; as of 6/30/2012.
Aft er removing micro caps, we divided the remainder of the sample into all-cap, large-cap and small-cap components. Th e largest 30% of the sample comprised the large-cap segment while the smallest 70% the small-cap segment.
We sought to build upon Fama and French’s 1998 work, examining value stocks and glamour stocks from a global perspective. Using the same methodology applied in the United States, we studied equities traded in 23 developed markets (U.S. results included) to evaluate global results. Unlike Fama and French, who focused only on large-cap non-U.S. stocks, we supplemented our analysis of large caps with a parallel review of small-cap stocks from global markets.
Our study drew on the Worldscope database, a comprehensive collection of stock prices and fi nancial information for publicly traded companies around the world. To build our sample, we started with all common stocks traded in each of the 23 markets listed below. We included these 23 markets because each is recognized as a developed market and generally off ered enough historical data to conduct our analysis.16
Exhibit 8: Sample Size (June 30, 1980–June 30, 2007)
PAGE 9
19 United States returns are through April 30, to maintain consistency with existing research.20 While these defi nitions of “value” and “glamour” follow academic precedent, we recognize their limitations. The defi nitions are not designed to be suggestive of the way in which value or glamour investment managers actually pick stocks. 21 1980–2012 segmented small-cap and large-cap results for all three metrics are available in the Appendix Part F.22 1980–2012 results for deciles based on P/CF and P/E produced similar results, as Appendix Part G illustrates.
The smallest value out-performance between decile 1 glamour stocks and decile 10 value stocks can be observed with a P/B measurment, where the average out-performance was 7.1%. Similar outperformance was noted among small-cap and large-cap segments.
As stated earlier, returns were calculated using LSV’s approach, dividing stocks into value and glamour deciles based on P/B, P/CF and P/E. For each group, decile-by-decile annualized performance, calculated in U.S. dollars, was recorded for the fi ve years aft er the inception date. Duplicating the approach used in the U.S. study, we constructed new deciles each June 30, and every subsequent June 30 through 2007.19 Annualized returns for all years were then averaged to compare value stocks with glamour stocks.20
Exhibit 9 illustrates our global all-cap fi ndings across the three price metrics reviewed. Th e results confi rmed a consistent value premium across all metrics. Th e smallest value outperformance between decile 1 glamour stocks and decile 10 value stocks can be observed with a P/B measurement, where the average outperformance was 7.1%. Similar outperformance was noted among small-cap and large-cap segments.21
Y A
XIS
TIT
LE
109876543210%
2%
4%
6%
8%
10%
12%
14%
16% P/B P/E P/CF
Glamour --------------------------------------------------------------------------------------------------- Value
Ann
ualiz
ed A
vera
rge
5-Y
ear
Ret
urns
Source: Worldscope via FactSet, The Brandes Institute; as of 6/30/2012. Past performance is not a guarantee of future results.
On an aggregate basis, our global results revealed that value stocks outperformed their glamour counterparts substantially in both the large-cap and small-cap segments. As Exhibit 10 indicates, annualized average 5-year returns for glamour deciles were signifi cantly outdistanced by returns for deciles at the value end of the spectrum. For example, large-cap stocks in decile 1—those with the highest P/B ratios—posted average returns of 9.0%. In contrast, large-cap stocks in decile 10, or those with the lowest P/B ratios, registered average gains of 14.4%. Th ese annualized fi gures are equivalent to cumulative rates of return of 54.2% and 95.7%, respectively. Returns for global small caps proved similar. While decile 1 small-cap glamour stocks delivered an annualized average return of 7.2%, decile 10 small-cap value stocks yielded 14.1%. Annualized fi gures for global small-cap stocks are equivalent to cumulative rates of return of 41.5% and 93.8%, respectively.22
Exhibit 9: Annualized Average 5-Year Returns Across Metrics (June 30, 1980–June 30, 2012)

PAGE 10
... the 5-year period of 2000–2005 marked the greatest discrep-ancy between value and glamour stock perfor-mance over the entire period of our study.
23 Rolling periods represent a series of overlapping, smaller periods within a single, longer-term period. A hypothetical example is the 20-year period from 12/31/82 through 12/31/02. This long-term period consists of 16 smaller 5-year “rolling” segments. The fi rst segment is the 5-year period from 12/31/82 to 12/31/87. The next rolling segment is the 5-year period from 12/31/83 to 12/31/88, and so on.24 United States returns are through April 30, to maintain consistency with existing research.25 More details on the 2000–2005 period is discussed in the Brandes Institute article "Value vs. Glamour: Recent Outperformance, Its Drivers and Considerations."
Y A
XIS
TITL
E
109876543216%
8%
10%
12%
14%
16%
Large Cap
Small Cap
Glamour (High P/B) ------------------------------------------------------------------------ Value (Low P/B)
Ann
ualiz
ed A
vera
rge
5-Y
ear
Ret
urns
Source: Worldscope via FactSet, The Brandes Institute; as of 6/30/2012. Past performance is not a guarantee of future results.
Exhibit 10 illustrates that average 5-year returns for value stocks exceeded average 5-year returns for glamour stocks by wide margins among both large- and small-cap stocks between 1980 and 2012. But how consistent was value stock outperformance year to year? Did value stocks beat glamour stocks fairly regularly, or did the relationship between the two exhibit more volatility?
To answer these questions, we examined our fi ndings on a rolling 5-year basis.23 In other words, we studied the relative performance of value stocks versus glamour stocks for each of the 5-year periods under review, from the period starting on June 30, 1980 through the period beginning on June 30, 2007.24 For each period, we calculated relative performance by subtracting the annualized 5-year returns of stocks in decile 1 (glamour stocks) from the annualized 5-year returns of stocks in decile 10 (value stocks).
Eff ectively, this segmented our review of the relationship of value and glamour into 28 rolling 5-year periods, starting with the 1980 through 1985 period and ending with the 2007 through 2012 span. As Exhibit 11 shows, value stocks bested glamour stocks in nearly every one of these periods, for both the large-cap and small-cap segments. In addition, value’s margin versus glamour was typically substantial: outperformance averaged 5.1% for large-cap stocks and 6.3% for small-cap stocks. In our opinion, this illustrates the consistency of value stock outperformance over time.
As shown in Exhibit 11 on the following page, the 5-year period of 2000–2005 marked the greatest discrepancy between value and glamour stock performance over the entire period of our study. We believe this 5-year span refl ects an extreme market environment characterized by sharp declines for glamour stocks that began with the bursting of the global technology stock bubble in 2000. During this period, we believe renewed enthusiasm for value stocks contributed to considerable outperformance.25
Exhibit 10: Annualized Average 5-Year Returns (P/B Deciles, June 30, 1980–June 30, 2012)

PAGE 11
In essence, this means that value stocks in both cap segments of our global sample posted higher returns with similar or even less volatility than glamour stocks. Accordingly, on a risk-adjusted basis, value’s outperformance versus-glamour was even more pronounced.
26 A higher Sharpe ratio indicates that an investment earned more “risk premium” per unit of volatility. The ratio is calculated by sub-tracting the risk-free rate from an investment’s average return, and then dividing the remainder by the standard deviation of the return. We used the average rate of 91-day U.S. Treasury bills as our risk-free rate to simulate the perspective of a U.S. investor.
Y A
XIS
TIT
LE
85 87 89 91 93 95 97 99 01 03 05 07 09 11
5-Y
ear
Ann
ualiz
ed R
elat
ive
Per
form
ance
Ending Year of Rolling 5-Year Period
-10%
0%
10%
20%
30%
40%Value Outperforms
Glamour Outperforms
Large Cap
Small Cap
Source: Worldscope via FactSet, The Brandes Institute; as of 6/30/2012. Past performance is not a guarantee of future results.
In addition to returns, we investigated volatility of those returns. As Exhibit 12 shows, the standard deviation of returns for value deciles generally was lower versus glamour deciles. As a result, Sharpe ratios for the value deciles tended to signifi cantly exceed those for glamour deciles.26
Glamour Deciles Value Deciles
1 2 3 4 5 6 7 8 9 10
Ann. Return 7.76% 9.84% 10.42% 11.22% 11.14% 11.49% 11.30% 12.47% 12.73% 14.22%
All Cap Stan. Dev. 19.16% 18.89% 18.44% 18.04% 17.74% 17.16% 15.99% 16.17% 15.82% 17.05%
Sharpe Ratio 0.15 0.26 0.30 0.35 0.35 0.38 0.40 0.46 0.49 0.54
Ann. Return 9.05% 10.64% 11.48% 11.76% 11.83% 11.73% 10.99% 12.31% 12.34% 14.37%
Large Cap Stan. Dev. 20.01% 19.52% 19.66% 18.14% 18.26% 16.27% 16.15% 16.09% 16.16% 16.74%
Sharpe Ratio 0.20 0.29 0.33 0.38 0.38 0.42 0.37 0.46 0.46 0.56
Ann. Return 7.20% 9.26% 10.12% 10.80% 11.02% 11.42% 11.44% 12.83% 12.66% 14.15%
Small Cap Stan. Dev. 19.66% 18.76% 18.43% 18.78% 17.93% 17.82% 16.46% 16.87% 16.22% 17.70%
Sharpe Ratio 0.11 0.23 0.28 0.31 0.34 0.36 0.39 0.47 0.47 0.52
Source: Worldscope via FactSet, The Brandes Institute; as of 6/30/2012. Past performance is not a guarantee of future results.
Exhibit 12: Decile-by-Decile Annualized Average 5-Year Return, Standard Deviation and Sharpe Ratio (June 30, 1980–June 30, 2012)
In essence, this means that value stocks in both cap segments of our global sample posted higher returns with similar or even less volatility than glamour stocks. Accordingly, on a risk-adjusted basis, value’s outperformance versus glamour was even more pronounced.
Exhibit 11: Rolling 5-Year Annualized Relative Performance of Value vs. Glamour (June 30, 1980–June 30, 2012)

PAGE 12
During the 1980 to 2012 period, our results confi rmed value stocks substan-tially outperformed their glamour counterparts. This outperformance was visible among both large caps and small caps, and it demon-strated consistency over time.
We agree with Fama and French that the value premium initially identifi ed by LSV was indisputably a “local manifestation of a global phenomenon” and not attributable to sample-specifi c happenstance as critics might suggest. During the 1980 to 2012 period, our results confi rmed value stocks substantially outperformed their glamour counterparts. Th is outperformance was visible among both large caps and small caps, and it demonstrated consistency over time.
In the next sections of this paper we review results on a regional basis, taking a closer look at U.S. and non-U.S. performance results. Later, we examine the value premium on a country-by-country basis
Part 5: U.S. Results
While extended aggregate results demonstrated that average returns for value stocks exceeded returns for glamour stocks by a wide margin in the United States between 1968 and 2012, we questioned whether this phenomenon still held true if we broke out performance of large- and small-cap stocks. In other words, was the value eff ect observed among U.S. stocks partially attributable to a small-cap eff ect?
Tota
l #
of
Com
pani
es
0
500
1000
1500
2000
2500
3000
3500
4000
68 70 72 74 76 78 80 82 84 86 88 90 92 94 96 98 00 02 04 06
Small Cap
Large Cap
Source: Worldscope via FactSet, The Brandes Institute; as of 4/30/2012.
With robust data available in the Compustat database for U.S. stocks back to 1968, research shown in Exhibit 14 compares average performance for large caps and small caps. Th e results affi rm that value stocks have notably outperformed their glamour counterparts in the United States both within the small-cap and large-cap universes.
We also note that the equity universe for the United States off ered an extensive universe of stocks to study. In mid-2007, the U.S. had more than 3,018 stocks, including more than 2,076 small cap stocks. Th e stock universe across time continually provided a signifi cant sample size—even for 1968, the fi rst year of this study, data was available on more than 600 stocks.
Exhibit 13: Sample Size (April 30, 1968–April 30, 2007)

PAGE 13
27 While the U.S. universe went back to 1968, the beginning date of the non-U.S. universe is 1980, refl ecting the inception of Worldscope database (the source for non-U.S. equities).
At fi rst glance, it appears the relative performance of small-cap value stocks to glamour stocks was greater than the relative performance of large-cap value stocks to large-cap glamour stocks. During the 1968 to 2012 period, performance for decile 1’s large-cap glamour stocks averaged an annualized 9.1% versus an average of 15.1% for the large-cap value stocks in decile 10. Respective cumulative performance equaled 54.6% and 101.9%. Among small-cap stocks, performance for decile 1’s glamour stocks averaged an annualized 5.8% versus an average of 14.4% for small-cap value stocks in decile 10. Respective cumulative performance for these securities equaled 32.4% and 96.0%.
Examining comparative performance decile-by-decile, the performance for both large- and small-cap stocks is similar for deciles 2–10. However, we see a divergence in decile 1, where small-cap stocks trailed large-cap stocks by nearly 334 basis points annualized. For large-cap stocks, the decline in performance for large-cap stocks from decile 2 to decile 1 is only 120 basis points; for small-cap stocks, the gap between decile 2 and decile 1 stocks is 329 basis points annualized (which represents the greatest diff erence between large- and small-cap stocks across deciles).
Th is phenomenon did not change the robustness of the value outperformance across deciles or market capitalization. For both large- and small-cap stocks, there was a consistent decline in performance as one travels from the value deciles (10, 9, 8, etc.) to the lower, glamour deciles (1, 2 and 3). Th e size of the outperformance of value stocks compared to glamour stocks was signifi cant for both large- and small-cap stocks.
Part 6: Non-U.S. Markets
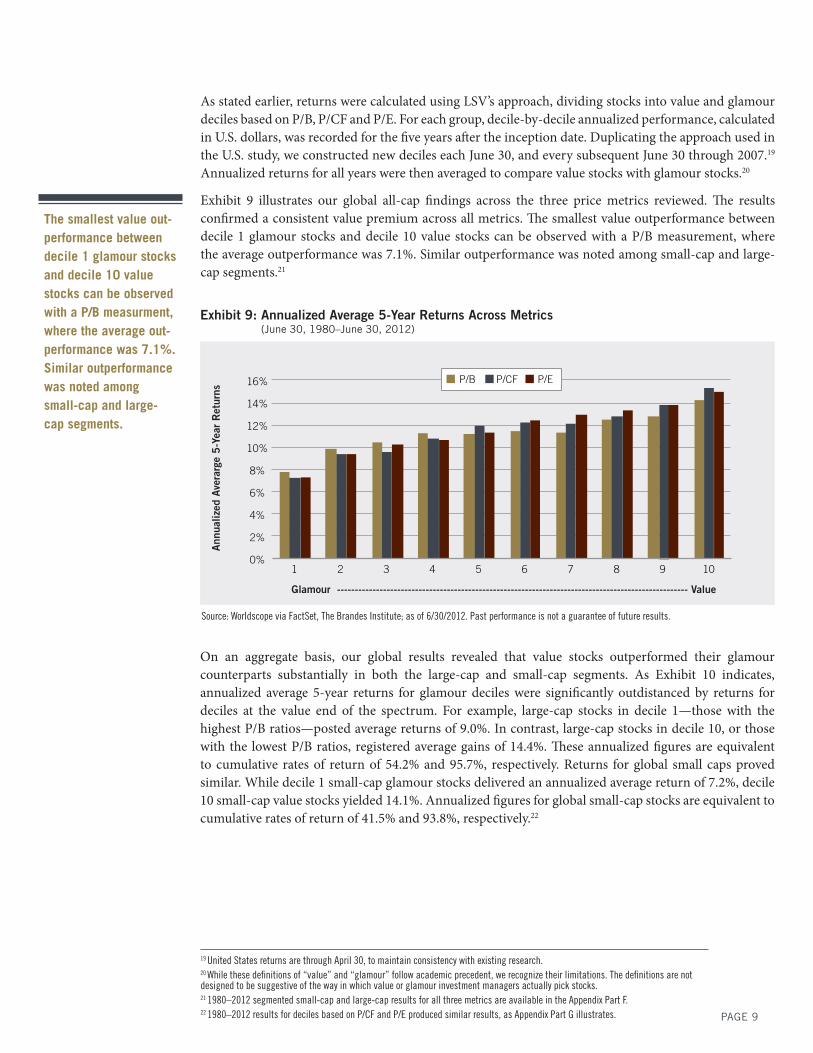
Consistent with our global and U.S. equity universes, the data set for non-U.S. markets quickly grew more robust aft er the inception of our study in 1980 (see Exhibit 15).27 For example, the total number of stocks in the non-U.S. universe more than doubled during the 1980 to 1981 period (from 156 to 415 total stocks), and grew by more than 20-fold over the full 1980–2007 test period (from 156 to 4,248 total stocks). Th is was a function of both increased database coverage through time and expansion of global markets.
While we had identifi ed a value premium in global and U.S. markets, breaking out the non-U.S. results allowed us to examine the robustness of the value premium in European and Asian
Y A
XIS
TITL
E
109876543214%
6%
8%
10%
12%
14%
16%
Large Cap
Small Cap
Glamour (High P/B) ------------------------------------------------------------------------ Value (Low P/B)
Ann
ualiz
ed A
vera
rge
5-Y
ear
Ret
urns
Source: Worldscope via FactSet, The Brandes Institute; as of 6/30/2012. Past performance is not a guarantee of future results.
Exhibit 14: Annualized Average 5-Year Returns (P/B Deciles, April 30, 1968–April 30, 2012)
PAGE 14
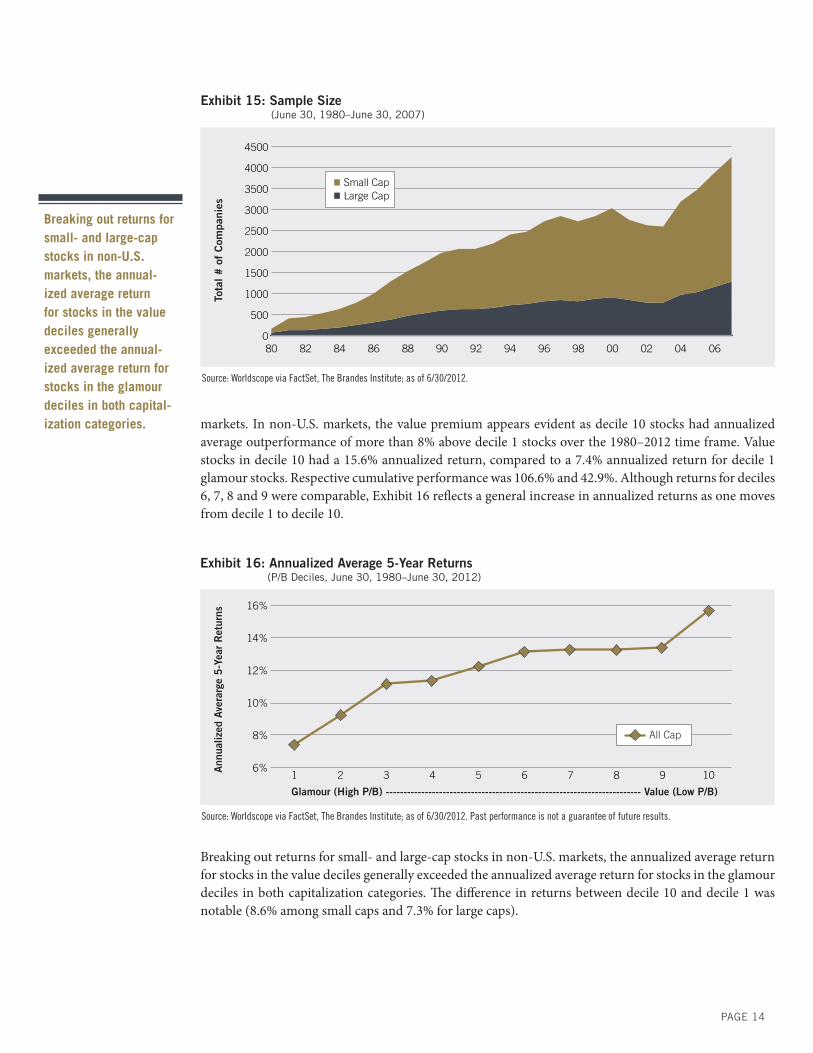
Breaking out returns for small- and large-cap stocks in non-U.S. markets, the annual-ized average return for stocks in the value deciles generally exceeded the annual-ized average return for stocks in the glamour deciles in both capital-ization categories. markets. In non-U.S. markets, the value premium appears evident as decile 10 stocks had annualized
average outperformance of more than 8% above decile 1 stocks over the 1980–2012 time frame. Value stocks in decile 10 had a 15.6% annualized return, compared to a 7.4% annualized return for decile 1 glamour stocks. Respective cumulative performance was 106.6% and 42.9%. Although returns for deciles 6, 7, 8 and 9 were comparable, Exhibit 16 refl ects a general increase in annualized returns as one moves from decile 1 to decile 10.
Tota
l #
of
Com
pani
es
0
500
1000
1500
2000
2500
3000
3500
4000
4500
80 82 84 86 88 90 92 94 96 98 00 02 04 06
Small Cap
Large Cap
Source: Worldscope via FactSet, The Brandes Institute; as of 6/30/2012.
Y A
XIS
TITL
E
All Cap
109876543216%
8%
10%
12%
14%
16%
Glamour (High P/B) ------------------------------------------------------------------------ Value (Low P/B)
Ann
ualiz
ed A
vera
rge
5-Y
ear
Ret
urns
Source: Worldscope via FactSet, The Brandes Institute; as of 6/30/2012. Past performance is not a guarantee of future results.
Breaking out returns for small- and large-cap stocks in non-U.S. markets, the annualized average return for stocks in the value deciles generally exceeded the annualized average return for stocks in the glamour deciles in both capitalization categories. Th e diff erence in returns between decile 10 and decile 1 was notable (8.6% among small caps and 7.3% for large caps).
Exhibit 15: Sample Size (June 30, 1980–June 30, 2007)
Exhibit 16: Annualized Average 5-Year Returns (P/B Deciles, June 30, 1980–June 30, 2012)

PAGE 15
Th e previous exhibits provided a snapshot of the aggregate, annualized average performance of the value deciles compared to glamour deciles across large- and small-cap market capitalization segments. While value stocks tended to outperform glamour, we examined whether value stocks’ outperformance was persistent over time or episodic.
Exhibit 18 depicts the relative performance of decile 10 stocks versus decile 1 stocks by market capital-ization across rolling 5-year periods. Th e exhibit shows decile 10 stocks consistently outperformed decile 1 stocks in both market cap segments over this 30-year period.
Source: Worldscope via FactSet, The Brandes Institute; as of 6/30/2012. Past performance is not a guarantee of future results.
Y A
XIS
TIT
LE
85 87 89 91 93 95 97 99 01 03 05 07 09 11
5-Y
ear
Ann
ualiz
ed R
elat
ive
Per
form
ance
Ending Year of Rolling 5-Year Period
-10%
0%
10%
20%
30%
40%Value Outperforms
Glamour Outperforms
Small CapLarge Cap
Source: Worldscope via FactSet, The Brandes Institute; as of 6/30/2012. Past performance is not a guarantee of future results.
Exhibit 17: Annualized Average 5-Year Returns (P/B Deciles, June 30, 1980–June 30, 2012)
Exhibit 18: Rolling 5-Year Annualized Relative Performance of Value vs. Glamour (P/B Deciles, June 30, 1980–June 30, 2012)
Y A
XIS
TIT
LE
10987654321
Glamour (High P/B) ------------------------------------------------------------------------ Value (Low P/B)
Large Cap
Small Cap
6%
8%
10%
12%
14%
16%
Ann
ualiz
ed A
vera
rge
5-Y
ear
Ret
urns
PAGE 16
Over the entire study, the 5-year period from 1995 to 2000 (which closely coincided with the tech-stock surge) was the only rolling period where glamour stocks outperformed value stocks by 5.0% or more.
Perhaps more relevant is the degree to which value outperformed glamour in most rolling periods. For example, value outperformed glamour by an average, annualized amount of 10% or more in eight instances for large-cap stocks and 15 instances for small-cap stocks. Conversely, for no rolling period did glamour stocks outperform value stocks by 10% or more, including the stock market bubble (driven by technology stocks in the United States, and by technology, media and telecom stocks outside the United States) of the late 1990s. Over the entire study, the 5-year period from 1995 to 2000 (which closely coincided with the tech-stock surge) was the only rolling period where glamour stocks outperformed value stocks by 5.0% or more. Interestingly, between 1995 and 2000, although small-cap glamour stocks outperformed small-cap value stocks, large-cap value stocks had better annualized average returns relative to large-cap glamour stocks during the same 5-year period.
Part 7: Emerging Markets
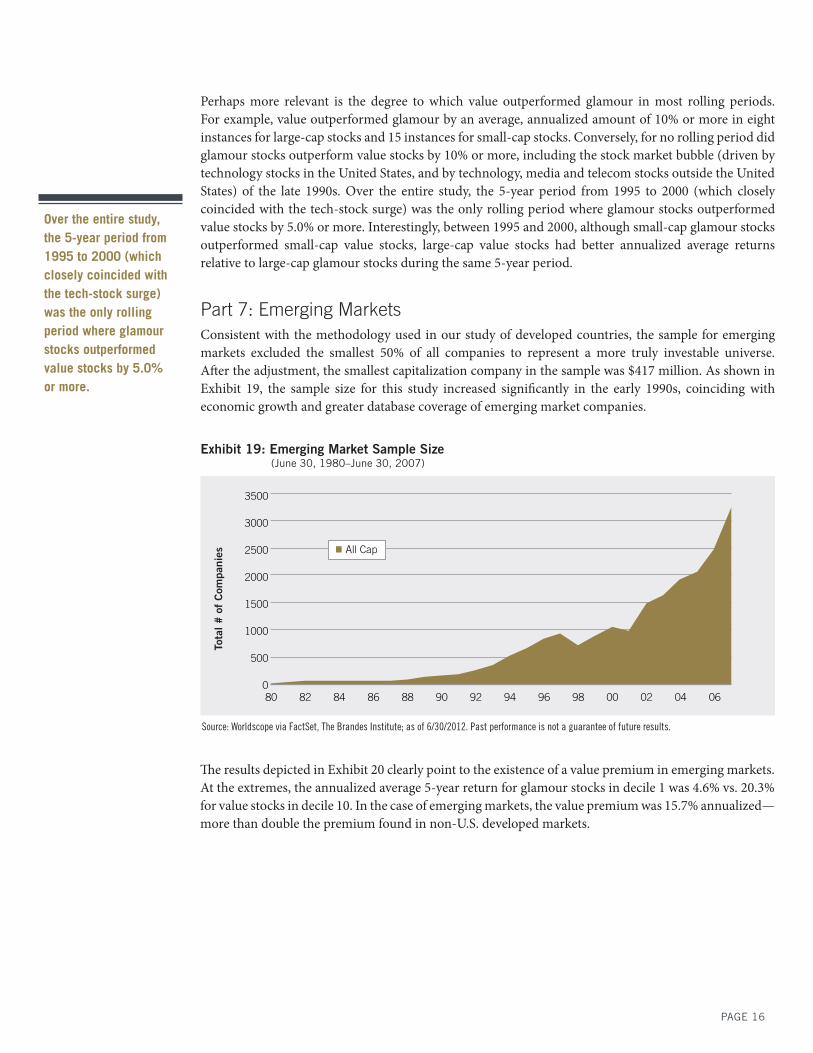
Consistent with the methodology used in our study of developed countries, the sample for emerging markets excluded the smallest 50% of all companies to represent a more truly investable universe. Aft er the adjustment, the smallest capitalization company in the sample was $417 million. As shown in Exhibit 19, the sample size for this study increased signifi cantly in the early 1990s, coinciding with economic growth and greater database coverage of emerging market companies.
Tota
l #
of
Com
pani
es
0
500
1000
1500
2000
2500
3000
3500
80 82 84 86 88 90 92 94 96 98 00 02 04 06
All Cap
Source: Worldscope via FactSet, The Brandes Institute; as of 6/30/2012. Past performance is not a guarantee of future results.
Th e results depicted in Exhibit 20 clearly point to the existence of a value premium in emerging markets. At the extremes, the annualized average 5-year return for glamour stocks in decile 1 was 4.6% vs. 20.3% for value stocks in decile 10. In the case of emerging markets, the value premium was 15.7% annualized—more than double the premium found in non-U.S. developed markets.
Exhibit 19: Emerging Market Sample Size (June 30, 1980–June 30, 2007)

PAGE 17
Given the volatility in emerging markets, we also were interested in investigating the year-over-year persistence of this premium. Did the 5-year average returns in emerging markets (illustrated in Exhibit 20) disguise a more volatile pattern in the relationship between decile 1 (glamour stocks) and decile 10 (value stocks)?
To answer this question, we examined our fi ndings on a rolling 5-year basis. For each period, we calcu-lated relative performance by subtracting the annualized average 5-year return of stocks in decile 1 (glamour stocks) from the annualized average 5-year return of stocks in decile 10 (value stocks). Exhibit 21 illustrates these fi ndings.
Exhibit 21 demonstrates the persistence of the value premium; in a clear majority of periods; decile 10 stocks outperformed decile 1 stocks based on the annualized average rolling 5-year return.
Y A
XIS
TIT
LE
All Cap
109876543214%
6%
8%
10%
12%
14%
16%
18%
20%
22%
Glamour (High P/B) ------------------------------------------------------------------------ Value (Low P/B)
Ann
ualiz
ed A
vera
rge
5-Y
ear
Ret
urns
Source: Worldscope via FactSet, The Brandes Institute; as of 6/30/2012. Past performance is not a guarantee of future results.
Y A
XIS
TIT
LE
5-Y
ear
Ann
ualiz
ed R
elat
ive
Per
form
ance
Ending Year of Rolling 5-Year Period
Value Outperforms
Glamour Outperforms -20%
-10%
0%
10%
20%
30%
40%
50%
60%
86 88 90 92 94 96 98 00 02 04 06 08 10 12
All Cap
Exhibit 21: Emerging Markets Rolling 5-Year Annualized Relative Performance of Value vs. Glamour (June 30, 1981–June 30, 2012)
Source: Worldscope via FactSet, The Brandes Institute; as of 6/30/2012. Past performance is not a guarantee of future results.
Exhibit 20: Emerging Markets Annualized Average 5-Year Returns (P/B Deciles, June 30, 1980–June 30, 2012)

PAGE 18
28 Evidence of a value premium was based on robustness of sample, aggregate all-cap results, segmented large- and small-cap results, as well as a review of relative rolling performance.
Part 8: Country Findings
During the period of our study, we found that the value premium has been consistent across market capitalization segments and across time. But has the value premium also been consistent across diff erent global markets? Of the 24 global markets we examined, results were not conclusive for three countries (see Exhibit 22), and data was not statistically robust to provide insight for eight additional countries.
Of the 16 countries where the universes provided robust data for a country-level examination, 13 countries’ returns suggested a value premium based on a review of diff ering measures.28 In nine of the 16 countries a value premium was “evident” and in a further four, there was reasonable evidence that a value premium was “probable.” In three countries results were inconclusive. A summary of our country-specifi c analysis can be found in the Appendix, Part A, while detailed country-by-country fi ndings are located in the Appendix, Part B.
Value Premium Evident
Value Premium Reasonably Evident
Results Inconclusive
Glamour Premium Reasonably Evident
Glamour Premium Evident
Data Not Statistically Robust
Australia Austria Finland Belgium
Canada Greece Hong Kong Denmark
France Sweden Netherlands Ireland
Germany Switzerland Israel
Italy New Zealand
Japan Norway
Singapore Portugal
United Kingdom Spain
United States
Source: Worldscope via FactSet, The Brandes Institute; as of 6/30/2012. Past performance is not a guarantee of future results.
Exhibit 22: Summary of Country-by-Country Findings, 1980–2012
Conclusion
In the 18 years since LSV published their landmark 1994 study evaluating the relative performance of value and glamour stocks, a number of events have transpired. In the late 1990s, glamour stocks’ share prices tended to rise dramatically amid a global technology-stock driven bull market. We also saw increased attention and investment in markets worldwide, accompanied by more robust data for various countries.
As a result of these developments, we sought to revisit conclusions drawn in LSV’s 1994 study. We extended the time period covered by performance calculations from mid-1994 through mid-2012. We also extended the reach of the study to encompass non-U.S. developed markets across the globe.
Generally, we identifi ed a persistent value premium for the world’s developed markets in aggregate and on an individual country basis, a value premium was evident or probable for the markets that off ered enough robust data to provide reasonable conclusions.

WWW.BRANDES.COM/INSTITUTE
The Brandes Institute
11988 El Camino Real,
Suite 600
P.O. Box 919048
San Diego
CA 92191-9048
858.755.0239
800.237.7119
Fax 858.755.0916
While the degree of outperformance of value stocks versus glamour stocks varied across data sets, what strikes us as most signifi cant was the consistency the value premium exhibited:
• across valuation metrics, such as P/B, P/CF, P/E and sales growth
• across time, which in this study applies to the 1968-2012 period for U.S. stocks, and the 1980–2012 period for non-U.S. stocks
• across regions, as the results indicated a value premium in developed markets in North America, Europe and Asia
• across market capitalizations, as the relative outperformance of value stocks to glamour stocks was evident among both large- and small-cap stock universes.
While this paper is not intended to resolve the question of why the value premium is evident, nor explain its persistence, we conclude with an observation made by Benjamin Graham more than 50 years ago on the divergent fortunes of value and glamour stocks that may off er some insight.
“If we assume that it is the habit of the market to overvalue common stocks which have been showing excellent growth or are glamorous for some other reason, it is logical to expect that it will undervalue—relatively, at least—companies that are out of favor because of unsatisfactory developments of a temporary nature. Th is may be set down as a fundamental law of the stock market and it suggests an investment approach [value investing] that should prove both conservative and promising.”29
29 Graham, Benjamin. The Intelligent Investor (fourth rev. ed.) New York: Harper & Row, 1973. p. 79.
This material is for informational purposes only and is not meant to be an offer, solicitation or recommendation for any product or services. Material should
not be considered a recommendation to purchase or sell any particular security. It should not be assumed that any security transactions, holdings, or sectors
discussed were or will be profi table. Stocks of small companies usually experience more volatility than mid- and large-sized companies. Investing outside
of the United States is subject to certain risks such as currency fl uctuations and social and political changes; such risks may result in greater share price
volatility. Unlike Treasury securities, stocks are not backed by the full faith and credit of the United States and will experience market fl uctuations. Indices
are unmanaged and are not available for direct investment. No investment strategy can assure a profi t or protect against loss.
The foregoing refl ects the thoughts and opinions of the Brandes Institute, a division of Brandes Investment Partners, L.P.
Copyright © 2012 Brandes Investment Partners, L.P. ALL RIGHTS RESERVED. Brandes Investment Partners® is a registered trademark of Brandes Investment
Partners, L.P. in the United States and Canada. Users agree not to copy, reproduce, distribute, publish, or in any way exploit this material, except that users
may make a print copy for their own personal, non-commercial use. Brief passages from any article may be quoted with appropriate credit to the Brandes
Institute. Longer passages may be quoted only with prior written approval from the Brandes Institute. For more information about Brandes Institute research
reports, visit our website at www.brandes.com/institute.

PAGE 20
APPENDIX
Contents
Part A: Select Country-By-Country Data, June 30, 1980–June 30, 2012
Part B: In-Depth Country-By-Country Data, June 30, 1980–June 30, 2012
Part C: LSV Annualized Average 5-year Returns, April 30, 1968–April 30, 1994 for Price-to-Cash Flow (P/CF) and Price-to-Earnings (P/E)
Part D: Brandes Institute Synchronized Results Annualized Average 5-year Returns, April 30, 1968–April 30, 1994 for Price-to-Cash Flow (P/CF) and Price-to-Earnings (P/E)
Part E: Brandes Institute Extended Results Annualized Average 5-year Returns, April 30, 1968–April 30, 2012 Price-to-Cash Flow (P/CF) and Price-to-Earnings (P/E) Large-Cap and Small-Cap Series
Part F: Brandes Institute Extended Global Results Annualized Average 5-year Returns June 30, 1980–June 30, 2012 for Price-to-Cash Flow (P/CF) and Price-to-Earnings (P/E) Deciles for Large-Cap and Small-Cap Series

PAGE 21
6/30/07 sample decile 1 (glamour) decile 10 (value)
# of co's avg. mkt. cap (US$) ann. return stan. dev. ann. return stan. dev.
Australia All 311 $4,427 9.6% 21.8% 16.3% 26.9%
Large 94 $12,518 11.1% 27.9% 14.4% 23.8%
Small 217 $923 7.4% 30.3% 16.5% 25.1%
Austria All 50 $5,619 2.1% 30.4% 12.9% 35.5%
Large 15 $15,396 1.3% 40.3% 20.5% 44.2%
Small 35 $1,428 2.0% 36.6% 6.8% 25.7%
Belgium All 54 $8,653 8.5% 22.3% 15.4% 25.8%
Large 17 $23,519 10.8% 31.3% 17.6% 29.1%
Small 37 $1,823 2.8% 30.3% 13.5% 22.9%
Canada All 469 $3,922 3.6% 24.9% 10.8% 25.8%
Large 141 $10,910 -3.1% 30.1% 13.0% 24.6%
Small 328 $918 5.6% 29.1% 10.9% 29.3%
Denmark All 100 $2,779 16.2% 27.5% 13.5% 40.2%
Large 30 $7,676 20.2% 43.2% 12.3% 27.6%
Small 70 $681 7.4% 35.1% 13.0% 31.0%
Finland All 50 $6,273 11.8% 35.6% 18.6% 37.8%
Large 15 $16,696 23.6% 63.1% 14.0% 34.5%
Small 35 $1,806 8.9% 40.9% 19.8% 42.9%
France All 228 $12,148 8.9% 27.5% 16.2% 26.2%
Large 69 $35,441 10.6% 33.0% 16.8% 39.7%
Small 159 $2,039 8.7% 28.0% 15.5% 30.8%
Germany All 214 $9,950 5.3% 25.4% 16.9% 22.0%
Large 65 $28,625 7.0% 29.0% 16.4% 28.0%
Small 149 $1,803 3.7% 23.2% 17.1% 27.0%
Greece All 78 $2,808 8.8% 53.6% 22.0% 48.1%
Large 24 $7,178 14.5% 56.1% 23.0% 62.5%
Small 54 $866 1.9% 44.9% 8.7% 42.4%
HongKong All 277 $4,187 13.3% 38.4% 20.2% 33.1%
Large 84 $11,571 17.7% 40.4% 22.0% 41.0%
Small 193 $973 8.2% 32.6% 16.6% 36.3%
Ireland All 50 $3,521 13.3% 34.2% 6.5% 37.2%
Large 15 $9,936 16.3% 52.1% 11.4% 40.7%
Small 35 $772 12.5% 45.1% 6.8% 47.1%
Italy All 129 $8,405 7.7% 41.9% 17.8% 34.1%
Large 39 $22,787 11.6% 35.4% 22.0% 50.9%
Small 90 $2,172 3.8% 31.8% 14.0% 42.6%
Source: Worldscope, The Brandes Institute; as of 6/30/2012.
Part A: Select Country-By-Country Data (June 30, 1980–June 30, 2012)

PAGE 22
6/30/07 sample decile 1 (glamour) decile 10 (value)
# of co's avg. mkt. cap (US$) ann. return stan. dev. ann. return stan. dev.
Japan All 1,086 $4,111 1.0% 25.5% 10.5% 25.6%
Large 326 $11,378 0.2% 23.7% 9.8% 25.2%
Small 760 $995 1.9% 27.7% 10.7% 26.6%
Netherlands All 79 $19,296 12.1% 32.6% 16.1% 32.2%
Large 24 $56,106 5.2% 25.9% 14.1% 30.9%
Small 55 $3,233 12.4% 44.5% 14.9% 35.4%
New
ZealandAll 50 $1,346 5.2% 28.6% 2.0% 30.4%
Large 15 $3,551 7.6% 37.4% 7.5% 34.8%
Small 35 $400 13.2% 37.0% 2.2% 28.3%
Norway All 77 $4,407 7.4% 49.4% 23.5% 35.3%
Large 24 $11,657 6.2% 48.7% 5.6% 47.4%
Small 53 $1,124 8.0% 42.5% 26.5% 58.3%
Portugal All 35 $3,901 12.7% 46.1% 17.8% 37.3%
Large 15 $8,206 14.3% 44.8% 19.1% 48.1%
Small 20 $672 5.8% 39.6% 6.9% 39.5%
Singapore All 145 $2,610 5.8% 47.2% 18.8% 34.9%
Large 44 $6,710 2.9% 37.3% 21.1% 48.8%
Small 101 $824 9.6% 38.9% 16.7% 45.4%
Sweden All 110 $5,536 10.8% 36.6% 21.7% 27.1%
Large 33 $15,162 13.8% 34.4% 22.7% 37.9%
Small 77 $1,410 8.3% 32.7% 15.8% 35.8%
Switzerland All 119 $12,236 9.0% 26.3% 15.0% 30.7%
Large 36 $34,986 1.8% 32.3% 12.3% 28.4%
Small 83 $2,369 13.0% 34.9% 15.0% 26.6%
U.K. All 547 $7,925 9.6% 19.7% 14.1% 22.1%
Large 165 $23,630 10.4% 24.3% 14.1% 22.0%
Small 382 $1,142 8.6% 23.0% 14.7% 20.4%
U.S.* All 3,018 $5 6.5% 22.9% 14.8% 23.4%
Large 942 $17,644 9.1% 20.6% 15.1% 20.6%
Small 2,076 $948 5.8% 25.6% 14.4% 23.9%
Source: Worldscope, The Brandes Institute; as of 6/30/2012. *data April 30, 1968–April 30, 2012
Part A: Select Country-By-Country Data (continued) (June 30, 1980–June 30, 2012)

PAGE 23
Part B: In-Depth Country-By-Country Data,
June 30, 1980–June 30, 2012
For certain countries, the sample size was negligible in the duration or greater part of the study period. For example, in eight countries (Belgium, Denmark, Ireland, Israel, New Zealand, Norway, Portugal and Spain) the equity sample sizes may be statistically robust at points in time, but they are not consistently robust across the study time frame. Because of this, these countries exhibit insuffi cient performance data for meaningful country-specifi c analysis. For seven countries included in the country-specifi c analysis (Austria, Finland, Greece, Hong Kong, the Netherlands, Sweden and Switzerland), sample robustness (sample size, data consistency and data availability) precluded data availability during certain periods; however, enough data was available to make limited conclusions.
Country Page(s)
Australia 23-25
Austria 26-28
Canada 28-30
Finland 31-33
France 33-35
Germany 36-38
Greece 38-40
Hong Kong 41-43
Country Page(s)
Italy 43-45
Japan 46-48
Netherlands 48-50
Singapore 51-53
Sweden 53-55
Switzerland 56-58
United Kingdom 58-60
United States* 61-63
*data April 30, 1968–April 30, 2012
Australia
Our sample size for Australia stayed constant through the fi rst half of the study period. In the mid-to late-90s, the sample expanded somewhat. As of June 30, 2007, Australia’s large-cap sample consisted of 94 companies, while the small-cap sample included 217 fi rms.
80 82 84 86 88 90 92 94 96 98 00 02 04 06
Tota
l # o
f C
ompa
nies
0
50
100
150
200
250
300
350
Small Cap
Large Cap
Source: Worldscope, The Brandes Institute; as of 6/30/2012.
Australia’s decile 1 stocks posted average returns of 9.6%, while decile 10 stocks registered average gains of 16.3%. While this pointed to a signifi cant premium for decile 10 versus decile 1, returns for deciles 2 through 9 were relatively fl at.
Australia: Sample Size (June 30, 1980–June 30, 2007)

PAGE 24
Australia’s segmented large- and small-cap universes showed similar results. Australia’s decile 1 large-cap stocks posted average returns of 11.1%, while the large caps in decile 10 registered average gains of 14.4%. In Australia’s large-cap sample, decile 3 results showed uncharacteristically loft y returns, as average performance was driven by the results of one company. Australia’s small-cap universe yielded a more substantial value premium, as the disparity between decile 1 and decile 10 stocks was 9.1%.
Y A
XIS
TIT
LE
109876543218%
10%
12%
14%
16%
18%
All Cap
Glamour (High P/B) ------------------------------------------------------------------------ Value (Low P/B)
Ann
ualiz
ed A
vera
rge
5-Y
ear
Ret
urns
Source: Worldscope, The Brandes Institute; as of 6/30/2012.
Y A
XIS
TIT
LE
10987654321
Large Cap
Small Cap
6%
8%
10%
12%
14%
16%
18%
20%
Glamour (High P/B) ------------------------------------------------------------------------ Value (Low P/B)
Ann
ualiz
ed A
vera
rge
5-Y
ear
Ret
urns
Source: Worldscope, The Brandes Institute; as of 6/30/2012.
Value bested glamour in a clear majority of the rolling 5-year periods between 1980 and 2012. In addition, value’s margin versus glamour was typically substantial: outperformance averaged 4.2% for large-cap stocks and 10.1% for small-cap stocks.
Australia: Annualized Average 5-Year Returns (June 30, 1980–June 30, 2012)
Australia: Annualized Average Rolling 5-Year Returns (June 30, 1980–June 30, 2012)

PAGE 25
\
For both large- and small-cap stocks in Australia, a similar value premium was evident. While glamour stocks have recently outperformed value in both large- and small-cap stocks, Australia’s value stocks consistently outperformed their glamour counterparts over the majority of the study. However, we hesitate to draw fi rm conclusions from the data, due to the lack of a robust sample over the entire study period.
Y A
XIS
TIT
LE
Ending Year of Rolling 5-Year Period
Value Outperforms
Glamour Outperforms -20%
-10%
0%
10%
20%
30%
40%
85 87 89 91 93 95 97 99 01 03 05 07 09 11
All Cap
5-Y
ear
Ann
ualiz
ed R
elat
ive
Per
form
ance
Source: Worldscope, The Brandes Institute; as of 6/30/2012.Years with no performance listed on the chart may refl ect that the country universe was not robust enough to provide data for 10 deciles.
85 87 89 91 93 95 97 99 01 03 05 07 09 11
Ending Year of Rolling 5-Year Period
Value Outperforms
Glamour Outperforms -30%
-20%
-10%
0%
10%
20%
30%
40%
50%
60%
Small Cap
Large Cap
5-Y
ear
Ann
ualiz
ed R
elat
ive
Per
form
ance
Source: Worldscope, The Brandes Institute; as of 6/30/2012. Years with no performance listed on the chart may refl ect that the country universe was not robust enough to provide data for 10 deciles.
Australia: Rolling 5-Year Annualized Relative Performance of Value vs. Glamour (June 30, 1980–June 30, 2012)
Australia: Rolling 5-Year Annualized Relative Performance of Value vs. Glamour (June 30, 1980–June 30, 2012)

PAGE 26
Austria
Our Austria sample size grew throughout the study period. As of June 30, 2007, Austria’s large-cap sample consisted of 15 companies, while the small-cap sample included 35 fi rms.
80 82 84 86 88 90 92 94 96 98 00 02 04 06
Tota
l # o
f C
ompa
nies
0
10
20
30
40
50
60
Small Cap
Large Cap
Source: Worldscope, The Brandes Institute; as of 6/30/2012.
Decile-by-decile returns for Austria clearly pointed to the existence of a value premium. Decile 1 stocks posted average returns of 2.1%, while decile 10 stocks registered average gains of 12.9%.
Y A
XIS
TIT
LE
Glamour (High P/B) ------------------------------------------------------------------------ Value (Low P/B)
0%
2%
4%
6%
8%
10%
12%
14%
16%
18%
All Cap
10987654321
Ann
ualiz
ed A
vera
rge
5-Y
ear
Ret
urns
Source: Worldscope, The Brandes Institute; as of 6/30/2012.
Austria’s segmented large- and small-cap universes showed similar results. Austria’s decile 1 large-cap stocks posted average returns of 1.3%, while the large caps in decile 10 registered average gains of 20.5%. Austria’s small-cap universe yielded a more modest value premium, as the disparity between decile 1 and decile 10 stocks was 4.8%.
Austria: Sample Size (June 30, 1980–June 30, 2007)
Austria: Annualized Average 5-Year Returns (June 30, 1980–June 30, 2012)

PAGE 27
Y A
XIS
TIT
LE
10987654321
Large Cap
Small Cap
0%
2%
4%
6%
8%
10%
12%
14%
16%
18%
20%
22%
Glamour (High P/B) ------------------------------------------------------------------------ Value (Low P/B)
Ann
ualiz
ed A
vera
rge
5-Y
ear
Ret
urns
Source: Worldscope, The Brandes Institute; as of 6/30/2012.
On a 5-year rolling basis, glamour outperformed value in the most recent six periods in the 1980 to 2012 span. Value’s relative outperformance exceeded 20% for nine periods, while periods of glamour outperformance exceeding 20% only occurred twice.
Similar results are evident for the the small- and large-cap segments in a majority of the rolling 5-year periods. However, due to the lack of a robust sample over the entire study period, we hesitate to draw fi rm conclusions from the data.
Y A
XIS
TIT
LE
Ending Year of Rolling 5-Year Period
Value Outperforms
Glamour Outperforms
85 87 89 91 93 95 97 99 01 03 05 07 09 11 -40%
-30%
-20%
-10%
0%
10%
20%
30%
40%
50%
All Cap
5-Y
ear
Ann
ualiz
ed R
elat
ive
Per
form
ance
Source: Worldscope, The Brandes Institute; as of 6/30/2012.Years with no performance listed on the chart may refl ect that the country universe was not robust enough to provide data for 10 deciles.
Austria: Annualized Average 5-Year Returns (June 30, 1980–June 30, 2012)
Austria: Rolling Annualized 5-Year Relative Performance of Value vs. Glamour (June 30, 1980–June 30, 2012)

PAGE 28
Canada
Our sample size for Canada grew throughout the study period. As of June 30, 2007, Canada’s large-cap sample consisted of 141 companies, while the small-cap sample included 328 fi rms.
Y A
XIS
TIT
LE
85 87 89 91 93 95 97 99 01 03 05 07 09 11
Ending Year of Rolling 5-Year Period
Value Outperforms
Glamour Outperforms -50%
-40%
-30%
-20%
-10%
0%
10%
20%
30%
40%
50%
60%
Small CapLarge Cap
5-Y
ear
Ann
ualiz
ed R
elat
ive
Per
form
ance
Source: Worldscope, The Brandes Institute; as of 6/30/2012.Years with no performance listed on the chart may refl ect that the country universe was not robust enough to provide data for 10 deciles.
80 82 84 86 88 90 92 94 96 98 00 02 04 06
Tota
l # o
f C
ompa
nies
0
50
100
150
200
250
300
350
400
450
500
Small Cap
Large Cap
Source: Worldscope, The Brandes Institute; as of 6/30/2012.
In Canada’s all-cap universe decile 1 glamour stocks returned 3.6%, while decile 10 value stocks yielded 10.8%. A decile-by-decile comparison revealed even better returns for deciles 5–9.
Austria: Rolling 5-Year Annualized Relative Performance of Value vs. Glamour (June 30, 1980–June 30, 2012)
Canada: Sample Size (June 30, 1980–June 30, 2007)

PAGE 29
Th e segmented large- and small-cap universes yielded equally compelling results. Th e performance of large-cap stocks was particularly substantial with value stocks in decile 10 returning 13.0%, while glamour stocks in decile 1 returned -3.1%. Results for small caps were not as dramatic, but followed the same pattern with deciles 6-8 registering better returns than decile 10.
Y A
XIS
TIT
LE
10987654321
All Cap
2%
4%
6%
8%
10%
12%
14%
16%
Glamour (High P/B) ------------------------------------------------------------------------ Value (Low P/B)
Ann
ualiz
ed A
vera
rge
5-Y
ear
Ret
urns
Source: Worldscope, The Brandes Institute; as of 6/30/2012.
Y A
XIS
TIT
LE
10987654321
Large Cap
Small Cap
-4%
-2%
0%
2%
4%
6%
8%
10%
12%
14%
16%
18%
Glamour (High P/B) ------------------------------------------------------------------------ Value (Low P/B)
Ann
ualiz
ed A
vera
rge
5-Y
ear
Ret
urns
Source: Worldscope, The Brandes Institute; as of 6/30/2012.
In Canada, value bested glamour in a clear majority of the rolling 5–year periods from 1980 to 2010. For the periods where glamour outperformed value, the diff erence never exceeded 10%, while value stocks outperformed by this amount 10 times. While glamour outperformed value for the rolling periods ending 2001–2004, this was followed by a stong rally by value that began with a 40.7% outperformance for the rolling period ending in 2005.
Canada: Annualized Average 5-Year Returns (June 30, 1980–June 30, 2012)
Canada: Annualized Average 5-Year Returns (June 30, 1980–June 30, 2012)

PAGE 30
While both small- and large-cap value outperformed their glamour counterparts over the long term, large cap far exceeded small cap. Overall, Canadian small-cap value averaged a 7.7% outperformance, while large-cap value returned 17.2%.
Y A
XIS
TIT
LE
Ending Year of Rolling 5-Year Period
Value Outperforms
Glamour Outperforms
85 87 89 91 93 95 97 99 01 03 05 07 09 11 -10%
0%
10%
20%
30%
40%
50%
All Cap
5-Y
ear
Ann
ualiz
ed R
elat
ive
Per
form
ance
Source: Worldscope, The Brandes Institute; as of 6/30/2012.Years with no performance listed on the chart may refl ect that the country universe was not robust enough to provide data for 10 deciles.
Y A
XIS
TIT
LE
85 87 89 91 93 95 97 99 01 03 05 07 09 11
Ending Year of Rolling 5-Year Period
Value Outperforms
Glamour Outperforms -20%
-10%
0%
10%
20%
30%
40%
50%
60%
70%
Small CapLarge Cap
5-Y
ear
Ann
ualiz
ed R
elat
ive
Per
form
ance
Source: Worldscope, The Brandes Institute; as of 6/30/2012.Years with no performance listed on the chart may refl ect that the country universe was not robust enough to provide data for 10 deciles.
Canada: Rolling 5-Year Annualized Relative Performance of Value vs. Glamour (June 30, 1980–June 30, 2012)
Canada: Rolling 5-Year Relative Annualized Performance of Value vs. Glamour (June 30, 1980–June 30, 2012)

PAGE 31
Finland
As of June 30, 2007, Finland’s large-cap sample consisted of 15 companies, while the small-cap sample included 35 fi rms. Our sample size for Finland grew rapidly at the beginning of the study period; however, it plateaued in the mid-80s for large cap and in the mid-90s for small cap and has remained unchanged for over 10 years.
80 82 84 86 88 90 92 94 96 98 00 02 04 06
Tota
l # o
f C
ompa
nies
0
10
20
30
40
50
60
Small Cap
Large Cap
Source: Worldscope, The Brandes Institute; as of 6/30/2012.
A clear value premium was evident among Finland’s all-cap sample. Glamour stocks in decile 1 averaged an 11.8% return, while value stocks in decile 10 returned an average of 18.6%.
Y A
XIS
TIT
LE
1098765432110%
12%
14%
16%
18%
20%
All Cap
Glamour (High P/B) ------------------------------------------------------------------------ Value (Low P/B)
Ann
ualiz
ed A
vera
rge
5-Y
ear
Ret
urns
Source: Worldscope, The Brandes Institute; as of 6/30/2012.
Among the segmented small-cap and large-cap samples, results were mixed. Note that decile 1 stocks represented the lowest performing decile for small-cap stocks, consistent with the aggregate results, but conversely represented the strongest performing decile for large-cap stocks. However, the lack of a robust sample for Finland tempered the signifi cance of these results.
Finland: Sample Size (June 30, 1980–June 30, 2007)
Finland: Annualized Average 5-Year Returns (June 30, 1980–June 30, 2012)

PAGE 32
Y A
XIS
TIT
LE
10987654321
Large Cap
Small Cap
4%
6%
8%
10%
12%
14%
16%
18%
20%
22%
24%
Glamour (High P/B) ------------------------------------------------------------------------ Value (Low P/B)
Ann
ualiz
ed A
vera
rge
5-Y
ear
Ret
urns
Source: Worldscope, The Brandes Institute; as of 6/30/2012.
On a rolling basis, value and glamour outperformance seemed to vacillate over the rolling 5-year periods between 1988 and 2012. In recent periods glamour deciles have outperformed value; how-ever, throughout the study, periods of value outperformance tended to be more robust than periods of glamour outperformance.
Segmented returns for small and large-cap stocks in Finland were mixed and due to the lack of a robust sample over the entire study period, we hesitate to draw fi rm conclusions from the data.
Y A
XIS
TIT
LE
Ending Year of Rolling 5-Year Period
Value Outperforms
Glamour Outperforms
85 87 89 91 93 95 97 99 01 03 05 07 09 11 -30%
-20%
-10%
0%
10%
20%
30%
40%
50%
60%
All Cap
5-Y
ear
Ann
ualiz
ed R
elat
ive
Per
form
ance
Source: Worldscope, The Brandes Institute; as of 6/30/2012.Years with no performance listed on the chart may refl ect that the country universe was not robust enough to provide data for 10 deciles.
Finland: Annualized Average 5-Year Returns (June 30, 1980–June 30, 2012)
Finland: Rolling 5-Year Annualized Relative Performance of Value vs. Glamour (June 30, 1980–June 30, 2012)

PAGE 33
Y A
XIS
TIT
LE
85 87 89 91 93 95 97 99 01 03 05 07 09 11
Ending Year of Rolling 5-Year Period
Value Outperforms
Glamour Outperforms -80%
-70%
-60%
-50%
-40%
-30%
-20%
-10%
0%
10%
20%
30%
40%
50%
60%
70%
80%
Small CapLarge Cap
5-Y
ear
Ann
ualiz
ed R
elat
ive
Per
form
ance
Source: Worldscope, The Brandes Institute; as of 6/30/2012.Years with no performance listed on the chart may refl ect that the country universe was not robust enough to provide data for 10 deciles.
France
Our sample size for France grew throughout the study period. As of June 30, 2007, France’s large-cap sample consisted of 69 companies, while the small-cap sample included 159 fi rms.
80 82 84 86 88 90 92 94 96 98 00 02 04 06
Tota
l #
of
Com
pan
ies
0
50
100
150
200
250
Small Cap
Large Cap
Source: Worldscope, The Brandes Institute; as of 6/30/2012.
Decile-by-decile returns for France clearly pointed to the existence of a value premium. Decile 1 glamour stocks returned an average of 8.9%, while decile 10 value stocks gained 16.2% on average.
Finland: Rolling 5-Year Annualized Relative Performance of Value vs. Glamour (June 30, 1980–June 30, 2012)
France: Sample Size (June 30, 1980–June 30, 2007)

PAGE 34
Large- and small-cap deciles demonstrated a similar pattern, with returns for small cap exhibiting a greater disparity between glamour and value deciles.
Y A
XIS
TIT
LE
109876543218%
10%
12%
14%
16%
18%
All Cap
Glamour (High P/B) ------------------------------------------------------------------------ Value (Low P/B)
Ann
ualiz
ed A
vera
rge
5-Y
ear
Ret
urns
Source: Worldscope, The Brandes Institute; as of 6/30/2012.
Y A
XIS
TIT
LE
109876543218%
10%
12%
14%
16%
18%
Large Cap
Small Cap
Glamour (High P/B) ------------------------------------------------------------------------ Value (Low P/B)
Ann
ualiz
ed A
vera
rge
5-Y
ear
Ret
urns
Source: Worldscope, The Brandes Institute; as of 6/30/2012.
France’s value stocks also bested glamour with greater frequency and by wider amounts during the rolling 5-year periods between 1980 and 2012; however, glamour has outperformed value in the last four periods.
France: Annualized Average 5-Year Returns (June 30, 1980–June 30, 2012)
France: Annualized Average 5-Year Returns (June 30, 1980–June 30, 2012)

PAGE 35
In addition, value stocks' relative outperformance of glamour stocks tended to be substantial for small caps and, to a lesser extent, for large cap stocks. In our opinion, this suggests that France’s value stocks consistently outperformed their glamour counterparts over time.
Y A
XIS
TIT
LE
Ending Year of Rolling 5-Year Period
Value Outperforms
Glamour Outperforms
85 87 89 91 93 95 97 99 01 03 05 07 09 11 -20%
-10%
0%
10%
20%
30%
40%
All Cap
5-Y
ear
Ann
ualiz
ed R
elat
ive
Per
form
ance
Source: Worldscope, The Brandes Institute; as of 6/30/2012.Years with no performance listed on the chart may refl ect that the country universe was not robust enough to provide data for 10 deciles.
Y A
XIS
TIT
LE
85 87 89 91 93 95 97 99 01 03 05 07 09 11
Ending Year of Rolling 5-Year Period
Value Outperforms
Glamour Outperforms -30%
-20%
-10%
0%
10%
20%
30%
40%
50%
Small CapLarge Cap
5-Y
ear
Ann
ualiz
ed R
elat
ive
Per
form
ance
Source: Worldscope, The Brandes Institute; as of 6/30/2012.Years with no performance listed on the chart may refl ect that the country universe was not robust enough to provide data for 10 deciles.
France: Rolling 5-Year Annualized Relative Performance of Value vs. Glamour (June 30, 1980–June 30, 2012)
France: Rolling 5-Year Annualized Relative Performance of Value vs. Glamour (June 30, 1980–June 30, 2012)

PAGE 36
Germany
Our sample size for Germany mostly grew throughout the study period, with a modest decline in the number of companies in the early 2000s. As of June 30, 2007, Germany’s large-cap sample consisted of 65 companies, while the small-cap sample included 149 fi rms.
80 82 84 86 88 90 92 94 96 98 00 02 04 06
Tota
l #
of
Com
pan
ies
0
50
100
150
200
250
300
Small Cap
Large Cap
Source: Worldscope, The Brandes Institute; as of 6/30/2012.
Decile-by-decile returns for Germany clearly pointed to the existence of a value premium, with decile 10 providing three times the annualized average performance of decile 1 over the 30-year period. Th e chart below shows the stark contrast between value and glamour deciles during the study, while also showing how those deciles that are somewhere between value and glamour tended to cluster together and generate similar returns. In this sample the value premium was not the result of outliers as value stocks in deciles 9 and 10 registered strong performance compared to their glamour counterparts in deciles 1 and 2.
Y A
XIS
TIT
LE
10987654321
All Cap
4%
6%
8%
10%
12%
14%
16%
18%
Glamour (High P/B) ------------------------------------------------------------------------ Value (Low P/B)
Ann
ualiz
ed A
vera
rge
5-Y
ear
Ret
urns
Source: Worldscope, The Brandes Institute; as of 6/30/2012.
Large caps in decile 1 posted average returns of 7.0% while large caps in decile 10 registered average gains of 16.4%. Results for small caps followed a similar pattern with decile 10 registering an average gain of 17.1%, while decile 1 only returned 3.7%.
Germany: Sample Size (June 30, 1980–June 30, 2007)
Germany: Annualized Average 5-Year Returns (June 30, 1980–June 30, 2012)

PAGE 37
Y A
XIS
TIT
LE
109876543212%
4%
6%
8%
10%
12%
14%
16%
18%
Large Cap
Small Cap
Glamour (High P/B) ------------------------------------------------------------------------ Value (Low P/B)
Ann
ualiz
ed A
vera
rge
5-Y
ear
Ret
urns
Source: Worldscope, The Brandes Institute; as of 6/30/2012.
In Germany, value bested glamour in a clear majority of the rolling 5-year periods in the 1980 to 2010 span. Value’s outperformance exceeded 25% on an annualized basis four times during the study with the greatest outperformance taking place during the 5-year rolling period ending in 2005, where value outperformed glamour by 42.9%. In contrast, glamour outperformed value only three times during the study, with its greatest outperformance of 8.6% taking place in 2002.
For both large-cap and small-cap stocks, value continued to best glamour in a majority of the rolling 5-year periods. Even during the recent adverse market environment where value has lagged glamour in select countries, value stocks in Germany continue to outperform their glamour counterparts.
Y A
XIS
TIT
LE
Ending Year of Rolling 5-Year Period
Value Outperforms
Glamour Outperforms
85 87 89 91 93 95 97 99 01 03 05 07 09 11 -10%
0%
10%
20%
30%
40%
50%
All Cap
5-Y
ear
Ann
ualiz
ed R
elat
ive
Per
form
ance
Source: Worldscope, The Brandes Institute; as of 6/30/2012.Years with no performance listed on the chart may refl ect that the country universe was not robust enough to provide data for 10 deciles.
Germany: Annualized Average 5-Year Returns (June 30, 1980–June 30, 2012)
Germany: Rolling 5-Year Annualized Relative Performance of Value vs. Glamour (June 30, 1980–June 30, 2012)

PAGE 38
Y A
XIS
TIT
LE
85 87 89 91 93 95 97 99 01 03 05 07 09 11
Ending Year of Rolling 5-Year Period
Value Outperforms
Glamour Outperforms
Small CapLarge Cap
-10%
0%
10%
20%
30%
40%
50%
5-Y
ear
Ann
ualiz
ed R
elat
ive
Per
form
ance
Source: Worldscope, The Brandes Institute; as of 6/30/2012.Years with no performance listed on the chart may refl ect that the country universe was not robust enough to provide data for 10 deciles.
Greece
Our sample size for Greece grew throughout the study period with a sharp increase of small-cap companies from 1996 until 2000. As of June 30, 2007, Greece’s large-cap sample consisted of 24 companies, while the small-cap sample included 54 fi rms.
80 82 84 86 88 90 92 94 96 98 00 02 04 06
Tota
l #
of
Com
pan
ies
0
20
40
60
80
100
Small Cap
Large Cap
Source: Worldscope, The Brandes Institute; as of 6/30/2012.
Returns across deciles for Greece point to a value premium. Decile 10 value stocks returned 22.0%on an annualized basis, more than twice the 8.8% performance of decile 1 glamour stocks.
Germany: Rolling 5-Year Annualized Relative Performance of Value vs. Glamour (June 30, 1980–June 30, 2012)
Greece: Sample Size (June 30, 1980–June 30, 2007)

PAGE 39
Large-cap stocks largely exhibited a value premium pattern, although decile 1 glamour stocks performed well on a comparative basis. Performance appeared more random for Greece’s small-cap stocks. However, the lack of a continually robust sample for Greece tempered the signifi cance of these results.
Y A
XIS
TIT
LE
10987654321
All Cap
-2%
0%
2%
4%
6%
8%
10%
12%
14%
16%
18%
20%
22%
24%
Glamour (High P/B) ------------------------------------------------------------------------ Value (Low P/B)
Ann
ualiz
ed A
vera
rge
5-Y
ear
Ret
urns
Source: Worldscope, The Brandes Institute; as of 6/30/2012.
Y A
XIS
TIT
LE
10987654321
Large Cap
Small Cap
0%
2%
4%
6%
8%
10%
12%
14%
16%
18%
20%
22%
24%
Glamour (High P/B) ------------------------------------------------------------------------ Value (Low P/B)
Ann
ualiz
ed A
vera
rge
5-Y
ear
Ret
urns
Source: Worldscope, The Brandes Institute; as of 6/30/2012.
For the brief history available for Greece equities, value stocks outperformed glamour stocks for 5-year periods through the end of 2005; in recent years, glamour stocks have tended to outperform, although by smaller percentages.
Greece: Annualized Average 5-Year Returns (June 30, 1980–June 30, 2012)
Greece: Annualized Average 5-Year Returns (June 30, 1980–June 30, 2012)

PAGE 40
Th e dichotomy of two periods, as exhibited in the previous chart, is also present in small- and large-cap stock performance.
Y A
XIS
TIT
LE
Ending Year of Rolling 5-Year Period
Value Outperforms
Glamour Outperforms
85 87 89 91 93 95 97 99 01 03 05 07 09 11 -20%
-10%
0%
10%
20%
30%
40%
50%
60%
All Cap
5-Y
ear
Ann
ualiz
ed R
elat
ive
Per
form
ance
Source: Worldscope, The Brandes Institute; as of 6/30/2012.Years with no performance listed on the chart may refl ect that the country universe was not robust enough to provide data for 10 deciles.
Y A
XIS
TIT
LE
85 87 89 91 93 95 97 99 01 03 05 07 09 11
Ending Year of Rolling 5-Year Period
Value Outperforms
Glamour Outperforms -30%
-20%
-10%
0%
10%
20%
30%
40%
50%
60%
Small CapLarge Cap
5-Y
ear
Ann
ualiz
ed R
elat
ive
Per
form
ance
Source: Worldscope, The Brandes Institute; as of 6/30/2012.Years with no performance listed on the chart may refl ect that the country universe was not robust enough to provide data for 10 deciles.
Greece: Rolling 5-Year Annualized Relative Performance of Value vs. Glamour (June 30, 1980–June 30, 2012)
Greece: Rolling 5-Year Annualized Relative Performance of Value vs. Glamour (June 30, 1980–June 30, 2012)

PAGE 41
Hong Kong
Our sample size for Hong Kong stayed constant through the fi rst half of the study period. In the mid- to late-90s, the sample expanded and then contracted slightly. In 2003, the sample expanded again, more than doubling in size in less than three years. As of June 30, 2007, Hong Kong’s large-cap sample consisted of 84 companies, while the small-cap sample included 193 fi rms.
80 82 84 86 88 90 92 94 96 98 00 02 04 06
Tota
l # o
f C
ompa
nies
0
50
100
150
200
250
300
Small Cap
Large Cap
Source: Worldscope, The Brandes Institute; as of 6/30/2012.
Hong Kong stocks can be characterized by a performance lag for the glamour stocks with the highest valuations, rather than a value premium. Over the period, deciles 1 and 2 clearly underperformed the rest of the universe. Returns were fairly compressed between deciles 3 and 10. However, the lack of a continually robust sample for Hong Kong tempered the signifi cance of these results.
Y A
XIS
TIT
LE
10987654321
All Cap
10%
12%
14%
16%
18%
20%
22%
24%
Glamour (High P/B) ------------------------------------------------------------------------ Value (Low P/B)
Ann
ualiz
ed A
vera
rge
5-Y
ear
Ret
urns
Source: Worldscope, The Brandes Institute; as of 6/30/2012.
Breaking the sample down to large- and small-cap stocks reveals a similar pattern with the exception of robust performance of decile 1 for large-cap stocks.
Hong Kong: Sample Size (June 30, 1980–June 30, 2007)
Hong Kong: Annualized Average 5-Year Returns (June 30, 1980–June 30, 2012)

PAGE 42
While glamour outperformed value from 1996 through 2002, value has subsequently outperformed glamour in the past 10 years, with four consecutive years of greater than 25% returns starting in 2005.
Large and small cap relative performance showed a similar pattern. A notable small-cap premium can be observed in recent years; however, we hesitated to draw fi rm conclusions from these results because the lack of a robust sample.
Y A
XIS
TIT
LE
Ending Year of Rolling 5-Year Period
Value Outperforms
Glamour Outperforms
85 87 89 91 93 95 97 99 01 03 05 07 09 11 -30%
-20%
-10%
0%
10%
20%
30%
40%
All Cap
5-Y
ear
Ann
ualiz
ed R
elat
ive
Per
form
ance
Source: Worldscope, The Brandes Institute; as of 6/30/2012.Years with no performance listed on the chart may refl ect that the country universe was not robust enough to provide data for 10 deciles.
Y A
XIS
TIT
LE
109876543218%
10%
12%
14%
16%
18%
20%
22%
24%
26%
Large Cap
Small Cap
Glamour (High P/B) ------------------------------------------------------------------------ Value (Low P/B)
Ann
ualiz
ed A
vera
rge
5-Y
ear
Ret
urns
Source: Worldscope, The Brandes Institute; as of 6/30/2012.
Hong Kong: Annualized Average 5-Year Returns (June 30, 1980–June 30, 2012)
Hong Kong: Rolling 5-Year Annualized Relative Performance of Value vs. Glamour (June 30, 1980–June 30, 2012)

PAGE 43
Y A
XIS
TIT
LE
85 87 89 91 93 95 97 99 01 03 05 07 09 11
Ending Year of Rolling 5-Year Period
Value Outperforms
Glamour Outperforms -60%
-50%
-40%
-30%
-20%
-10%
0%
10%
20%
30%
40%
50%
60%
Small CapLarge Cap
5-Y
ear
Ann
ualiz
ed R
elat
ive
Per
form
ance
Source: Worldscope, The Brandes Institute; as of 6/30/2012.Years with no performance listed on the chart may refl ect that the country universe was not robust enough to provide data for 10 deciles.
Italy
Our sample size for Italy grew throughout the study period. As of June 30, 2007, Italy’s large-cap sample consisted of 39 companies, while the small-cap sample included 90 fi rms.
80 82 84 86 88 90 92 94 96 98 00 02 04 06
Tota
l #
of
Com
pan
ies
0
20
40
60
80
100
120
140
Small Cap
Large Cap
Source: Worldscope, The Brandes Institute; as of 6/30/2012.
At first glance, evidence of a value premium in Italy appeared strong. Decile 1 stocks posted average returns of 7.7%, while decile 10 stocks registered average gains of 17.8%. However, the lack of a robust sample for Italy made us hesitate to draw any firm conclusions.
Hong Kong: Rolling 5-Year Annualized Relative Performance of Value vs. Glamour (June 30, 1980–June 30, 2012)
Italy: Sample Size (June 30, 1980–June 30, 2007)

PAGE 44
Similar results were found among large- and small-cap segements of the Italy sample. Again, however, the signifi cance of these results was tempered on the basis of the sample’s robustness.
Y A
XIS
TIT
LE
10987654321
All Cap
6%
8%
10%
12%
14%
16%
18%
Glamour (High P/B) ------------------------------------------------------------------------ Value (Low P/B)
Ann
ualiz
ed A
vera
rge
5-Y
ear
Ret
urns
Source: Worldscope, The Brandes Institute; as of 6/30/2012.
Y A
XIS
TIT
LE
109876543212%
4%
6%
8%
10%
12%
14%
16%
18%
20%
22%
24%
Large Cap
Small Cap
Glamour (High P/B) ------------------------------------------------------------------------ Value (Low P/B)
Ann
ualiz
ed A
vera
rge
5-Y
ear
Ret
urns
Source: Worldscope, The Brandes Institute; as of 6/30/2012.
It is important to note that during the study there were 13 periods where value outperformed glamour by more than 10%, while there were only two instances when glamour outperformed value by more than 10%.
Italy: Annualized Average 5-Year Returns (June 30, 1980–June 30, 2012)
Italy: Annualized Average 5-Year Returns (June 30, 1980–June 30, 2012)

PAGE 45
For both large- and small-cap stocks in Italy, value bested glamour in the majority of the rolling 5-year periods for which a robust sample was available. However, the lack of a robust sample for Italy tempered the signifi cance of these results.
Y A
XIS
TIT
LE
Ending Year of Rolling 5-Year Period
Value Outperforms
Glamour Outperforms
85 87 89 91 93 95 97 99 01 03 05 07 09 11 -20%
-10%
0%
10%
20%
30%
40%
50%
All Cap
5-Y
ear
Ann
ualiz
ed R
elat
ive
Per
form
ance
Source: Worldscope, The Brandes Institute; as of 6/30/2012.Years with no performance listed on the chart may refl ect that the country universe was not robust enough to provide data for 10 deciles.
Y A
XIS
TIT
LE
85 87 89 91 93 95 97 99 01 03 05 07 09 11
Ending Year of Rolling 5-Year Period
Value Outperforms
Glamour Outperforms -20%
-10%
0%
10%
20%
30%
40%
50%
Small CapLarge Cap
5-Y
ear
Ann
ualiz
ed R
elat
ive
Per
form
ance
Source: Worldscope, The Brandes Institute; as of 6/30/2012.Years with no performance listed on the chart may refl ect that the country universe was not robust enough to provide data for 10 deciles.
Italy: Rolling 5-Year Annualized Relative Performance of Value vs. Glamour (June 30, 1980–June 30, 2012)
Italy: Rolling 5-Year Annualized Relative Performance of Value vs. Glamour (June 30, 1980–June 30, 2012)

PAGE 46
Japan
Th e sample size for Japan grew at a steady rate from 1980–1990. Since 1990, the sample experienced several brief periods of expansion and contraction. As of June 30, 2007, Japan’s large-cap sample consisted of 326 companies, while the small-cap sample included 760 fi rms.
80 82 84 86 88 90 92 94 96 98 00 02 04 06
Tota
l #
of
Com
pan
ies
0
200
400
600
800
1000
1200
1400
Small Cap
Large Cap
Source: Worldscope, The Brandes Institute; as of 6/30/2012.
Not only did Japan’s decile 10 value stocks notably outperform decile 1 glamour stocks, with 10.5% average returns for the former and only 1.0% for the latter, but the slope of the line moving from decile 1 to decile 10 showed a consistent upward slant, suggesting the value premium was clear and linear.
Y A
XIS
TIT
LE
10987654321
All Cap
0%
2%
4%
6%
8%
10%
12%
Glamour (High P/B) ------------------------------------------------------------------------ Value (Low P/B)
Ann
ualiz
ed A
vera
rge
5-Y
ear
Ret
urns
Source: Worldscope, The Brandes Institute; as of 6/30/2012.
Japan’s large-cap universe also exhibited a consistent upward slope between glamour and value stocks. Japan’s decile 1 large-cap stocks posted average returns of 0.2%, while the large caps in decile 10 registered average gains of 10.0%. In addition, Japan’s small-cap value stocks in decile 10 returned 10.7%, while small-cap glamour stocks in decile 1 averaged performance of 2.0%.
Japan: Sample Size (June 30, 1980–June 30, 2007)
Japan: Annualized Average 5-Year Returns (June 30, 1980–June 30, 2012)

PAGE 47
Japan’s value stocks consistently generated higher returns than glamour in the rolling 5-year periods between 1980 and 2010. For the four periods where glamour stocks outperfomed over rolling 5-year periods, the level of outperformance tended to be smaller than the typical outpeformance generated by value stocks.
Value’s performance above glamour was consistently robust, especially in the past decade among small-cap stocks.
Y A
XIS
TIT
LE
Ending Year of Rolling 5-Year Period
Value Outperforms
Glamour Outperforms
85 87 89 91 93 95 97 99 01 03 05 07 09 11 -10%
0%
10%
20%
30%
All Cap
5-Y
ear
Ann
ualiz
ed R
elat
ive
Per
form
ance
Source: Worldscope, The Brandes Institute; as of 6/30/2012.Years with no performance listed on the chart may refl ect that the country universe was not robust enough to provide data for 10 deciles.
Y A
XIS
TIT
LE
109876543210%
2%
4%
6%
8%
10%
12%
Large Cap
Small Cap
Glamour (High P/B) ------------------------------------------------------------------------ Value (Low P/B)
Ann
ualiz
ed A
vera
rge
5-Y
ear
Ret
urns
Source: Worldscope, The Brandes Institute; as of 6/30/2012.
Japan: Annualized Average 5-Year Returns (June 30, 1980–June 30, 2012)
Japan: Rolling 5-Year Annualized Relative Performance of Value vs. Glamour (June 30, 1980–June 30, 2012)

PAGE 48
Y A
XIS
TIT
LE
85 87 89 91 93 95 97 99 01 03 05 07 09 11
Ending Year of Rolling 5-Year Period
Value Outperforms
Glamour Outperforms -60%
-50%
-40%
-30%
-20%
-10%
0%
10%
20%
30%
40%
50%
60%
Small CapLarge Cap
5-Y
ear
Ann
ualiz
ed R
elat
ive
Per
form
ance
Source: Worldscope, The Brandes Institute; as of 6/30/2012.Years with no performance listed on the chart may refl ect that the country universe was not robust enough to provide data for 10 deciles.
Netherlands
Th e sample size for the Netherlands grew from the 1980–1987 and 1994–1998 periods, while leveling off in other periods. As of June 30, 2007, the Netherlands’ large-cap sample consisted of 24 companies, while the small-cap sample included 55 fi rms. However, the lack of a continually robust sample for the Netherlands tempered the signifi cance of these results.
80 82 84 86 88 90 92 94 96 98 00 02 04 06
Tota
l #
of
Com
pan
ies
0
10
20
30
40
50
60
70
80
90
100
Small Cap
Large Cap
Source: Worldscope, The Brandes Institute; as of 6/30/2012.
Decile-by-decile returns demonstrated a jagged and non-linear pattern. However, the country’s all-cap universe decile 1 glamour stocks returned 12.1%, while decile 10 value stocks recorded performance of 16.1%.
Japan: Rolling 5-Year Annualized Relative Performance of Value vs. Glamour (June 30, 1980–June 30, 2012)
Netherlands: Sample Size (June 30, 1980–June 30, 2007)

PAGE 49
Between the segmented large- and small-cap universes, the large-cap universe exhibited a more pronounced value eff ect. Among large caps, decile 1 posted average returns of 5.2% vs. large caps in decile 10, which registered average gains of 14.1%. Small-cap stock performance did not exhibit a discernable pattern.
Y A
XIS
TIT
LE
1098765432110%
12%
14%
16%
18%
All Cap
Glamour (High P/B) ------------------------------------------------------------------------ Value (Low P/B)
Ann
ualiz
ed A
vera
rge
5-Y
ear
Ret
urns
Source: Worldscope, The Brandes Institute; as of 6/30/2012.
Y A
XIS
TIT
LE
109876543214%
6%
8%
10%
12%
14%
16%
18%
Large Cap
Small Cap
Glamour (High P/B) ------------------------------------------------------------------------ Value (Low P/B)
Ann
ualiz
ed A
vera
rge
5-Y
ear
Ret
urns
Source: Worldscope, The Brandes Institute; as of 6/30/2012.
Th e diff erence in rolling period results for all caps are rather muted until 2000, when a notable outperformance year was registered for glamour, followed by value besting glamour for 11 of the next 12 periods, oft en by wide margins.
Netherlands: Annualized Average 5-Year Returns (June 30, 1980–June 30, 2012)
Netherlands: Annualized Average 5-Year Returns (June 30, 1980–June 30, 2012)

PAGE 50
For both large-cap and small-cap stocks, relative outperformance between value and glamour stocks appears to alternate over time. However, large-cap value stocks provided four periods of besting glamour stocks by 20% or more; there were no periods where large-cap glamour stocks outperformed by this level. For small-cap stocks, the level of dispersion between value and glamour seemed more evenly distributed. In recent years, small-cap stocks have outperformed their glamour counterparts, while large-cap returns have been relatively fl at.
Y A
XIS
TIT
LE
Ending Year of Rolling 5-Year Period
Value Outperforms
Glamour Outperforms
85 87 89 91 93 95 97 99 01 03 05 07 09 11 -40%
-30%
-20%
-10%
0%
10%
20%
30%
All Cap
5-Y
ear
Ann
ualiz
ed R
elat
ive
Per
form
ance
Source: Worldscope, The Brandes Institute; as of 6/30/2012.Years with no performance listed on the chart may refl ect that the country universe was not robust enough to provide data for 10 deciles.
Y A
XIS
TIT
LE
85 87 89 91 93 95 97 99 01 03 05 07 09 11
Ending Year of Rolling 5-Year Period
Value Outperforms
Glamour Outperforms
Small CapLarge Cap
-60%
-50%
-40%
-30%
-20%
-10%
0%
10%
20%
30%
40%
50%
60%
5-Y
ear
Ann
ualiz
ed R
elat
ive
Per
form
ance
Source: Worldscope, The Brandes Institute; as of 6/30/2012.Years with no performance listed on the chart may refl ect that the country universe was not robust enough to provide data for 10 deciles.
Netherlands: Rolling 5-Year Annualized Relative Performance of Value vs. Glamour (June 30, 1980–June 30, 2012)
Netherlands: Rolling 5-Year Annualized Relative Performance of Value vs. Glamour (June 30, 1980–June 30, 2012)

PAGE 51
Singapore
Th e sample size for Singapore has grown sharply since 2003. As of June 30, 2007, the large-cap sample consisted of 44 companies, while the small-cap sample included 101 fi rms.
80 82 84 86 88 90 92 94 96 98 00 02 04 06
Tota
l #
of
Com
pan
ies
0
20
40
60
80
100
120
140
160
Small Cap
Large Cap
Source: Worldscope, The Brandes Institute; as of 6/30/2012.
Th e value premium among Singapore’s all-cap sample was one of the most evident throughout the entire study. Glamour stocks in decile 1 averaged 5.8%, while value stocks in decile 10 returned an average of 18.8%. Note that the value premium was not the result of outliers, but a trend that was most robust across deciles 6–10. Th e lack of a robust sample for Singapore somewhat tempered the signifi cance of these results.
Y A
XIS
TIT
LE
10987654321
All Cap
4%
6%
8%
10%
12%
14%
16%
18%
20%
Glamour (High P/B) ------------------------------------------------------------------------ Value (Low P/B)
Ann
ulai
zed
Aver
arge
5-Y
ear
Ret
urns
Source: Worldscope, The Brandes Institute; as of 6/30/2012.
Among Singapore’s large-cap stocks, decile 10 stocks outperformed decile 1 stocks, averaging 21.1% annualized performance for the value decile compared to 2.9% for decile 1. For small-cap stocks, the results were slightly less compelling, with decile 1 and 10 stocks returning 9.6% and 16.7% annualized respectively.
Singapore: Sample Size (June 30, 1980–June 30, 2007)
Singapore: Annualized Average 5-Year Returns (June 30, 1980–June 30, 2012)

PAGE 52
On a rolling basis, value bested glamour for all periods ending from 1985–1991, and those ending in 2003-2010. Between 1992–2002, glamour stocks tended to outperform, but by smaller margins than those recorded by value stocks.
Among large-cap stocks in Singapore, there was a clear majority of the rolling 5-year periods where value outperformed glamour, and the margin was typically notable. Th e most signifi cant was the 5-year rolling period ending 2008 where large-cap value outperformed glamour by 78%. For small-cap stocks, value stocks also tended to outperform, although the performance relative to glamour stocks was narrower. However, a less robust small-cap sample tempers any fi rm conclusions.
Y A
XIS
TIT
LE
Ending Year of Rolling 5-Year Period
Value Outperforms
Glamour Outperforms
85 87 89 91 93 95 97 99 01 03 05 07 09 11 -20%
-10%
0%
10%
20%
30%
40%
50%
All Cap
5-Y
ear
Ann
ualiz
ed R
elat
ive
Per
form
ance
Source: Worldscope, The Brandes Institute; as of 6/30/2012.Years with no performance listed on the chart may refl ect that the country universe was not robust enough to provide data for 10 deciles.
Y A
XIS
TIT
LE
10987654321
Large Cap
Small Cap
2%
4%
6%
8%
10%
12%
14%
16%
18%
20%
22%
Glamour (High P/B) ------------------------------------------------------------------------ Value (Low P/B)
Ann
ualiz
ed A
vera
rge
5-Y
ear
Ret
urns
Source: Worldscope, The Brandes Institute; as of 6/30/2012.
Singapore: Annualized Average 5-Year Returns (June 30, 1980–June 30, 2012)
Singapore: Rolling 5-Year Annualized Relative Performance of Value vs. Glamour (June 30, 1980–June 30, 2012)

PAGE 53
Y A
XIS
TIT
LE
85 87 89 91 93 95 97 99 01 03 05 07 09 11
Ending Year of Rolling 5-Year Period
Value Outperforms
Glamour Outperforms -30%
-20%
-10%
0%
10%
20%
30%
40%
50%
60%
70%
80%
Small CapLarge Cap
5-Y
ear
Ann
ualiz
ed R
elat
ive
Per
form
ance
Source: Worldscope, The Brandes Institute; as of 6/30/2012.Years with no performance listed on the chart may refl ect that the country universe was not robust enough to provide data for 10 deciles.
Sweden
Our sample size for Sweden was relatively stable for periods of time, while expanding dramatically in both 1986, 1996 and from 2004 through 2007. As of June 30, 2007, Sweden’s large-cap sample consisted of 33 companies, while the small-cap sample included 77 fi rms.
80 82 84 86 88 90 92 94 96 98 00 02 04 06
Tota
l #
of
Com
pan
ies
0
20
40
60
80
100
120
Small Cap
Large Cap
Source: Worldscope, The Brandes Institute; as of 6/30/2012.
Although the deciles for Sweden exhibited a jagged line in performance for deciles, decile 1 glamour stocks returned an average gain of 10.8%, trailing the annualized performance for decile 10 value stocks, which was 21.7%.
Singapore: Rolling 5-Year Annualized Relative Performance of Value vs. Glamour (June 30, 1980–June 30, 2012)
Sweden: Sample Size (June 30, 1980–June 30, 2007)

PAGE 54
Large- and small-cap deciles demonstrated a similar pattern. Decile 1 glamour stocks for both large- and small-cap stocks were the lowest performing deciles, while the value deciles for large-cap stocks had the greatest performance among all deciles.
Y A
XIS
TIT
LE
1098765432110%
12%
14%
16%
18%
20%
22%
24%
All Cap
Glamour (High P/B) ------------------------------------------------------------------------ Value (Low P/B)
Ann
ualiz
ed A
vera
rge
5-Y
ear
Ret
urns
Source: Worldscope, The Brandes Institute; as of 6/30/2012.
Y A
XIS
TIT
LE
10987654321
Large Cap
Small Cap
8%
10%
12%
14%
16%
18%
20%
22%
24%
Glamour (High P/B) ------------------------------------------------------------------------ Value (Low P/B)
Ann
ualiz
ed A
vera
rge
5-Y
ear
Ret
urns
Source: Worldscope, The Brandes Institute; as of 6/30/2012.
Value stocks outperformed glamour stocks in the majority of the rolling 5-year periods, and oft en by wide amounts, with the primary exception being the periods ending in 1998–2001.
Sweden: Annualized Average 5-Year Returns (June 30, 1980–June 30, 2012)
Sweden: Annualized Average 5-Year Returns (June 30, 1980–June 30, 2012)

PAGE 55
Large-cap and small-cap value stocks consistently outperformed their respective glamour stock counter-parts over the period.
Y A
XIS
TIT
LE
Ending Year of Rolling 5-Year Period
Value Outperforms
Glamour Outperforms
85 87 89 91 93 95 97 99 01 03 05 07 09 11 -30%
-20%
-10%
0%
10%
20%
30%
40%
50%
All Cap
5-Y
ear
Ann
ualiz
ed R
elat
ive
Per
form
ance
Source: Worldscope, The Brandes Institute; as of 6/30/2012.Years with no performance listed on the chart may refl ect that the country universe was not robust enough to provide data for 10 deciles.
Y A
XIS
TIT
LE
85 87 89 91 93 95 97 99 01 03 05 07 09 11
Ending Year of Rolling 5-Year Period
Value Outperforms
Glamour Outperforms -30%
-20%
-10%
0%
10%
20%
30%
40%
50%
60%
Small CapLarge Cap
5-Y
ear
Ann
ualiz
ed R
elat
ive
Per
form
ance
Source: Worldscope, The Brandes Institute; as of 6/30/2012.Years with no performance listed on the chart may refl ect that the country universe was not robust enough to provide data for 10 deciles.
Sweden: Rolling 5-Year Annualized Relative Performance of Value vs. Glamour (June 30, 1980–June 30, 2012)
Sweden: Rolling 5-Year Annualized Relative Performance of Value vs. Glamour (June 30, 1980–June 30, 2012)

PAGE 56
Switzerland
With the exception of a plateau in the sample size between 1987–1993, the number of Swiss stocks in our universe grew throughout the study period. As of June 30, 2007, Switzerland’s large-cap sample consisted of 36 companies, while the small-cap sample included 83 fi rms.
80 82 84 86 88 90 92 94 96 98 00 02 04 06
Tota
l #
of
Com
pan
ies
0
20
40
60
80
100
120
140
Small Cap
Large Cap
Source: Worldscope, The Brandes Institute; as of 6/30/2012.
While decile-by-decile returns for Switzerland tended to be fl at among the glamour deciles, the aggregate performance pointed to a value premium.
Y A
XIS
TIT
LE
10987654321
All Cap
6%
8%
10%
12%
14%
16%
Glamour (High P/B) ------------------------------------------------------------------------ Value (Low P/B)
Ann
ualiz
ed A
vera
rge
5-Y
ear
Ret
urns
Source: Worldscope, The Brandes Institute; as of 6/30/2012.
Th e results for decile 1 stocks were dramatically diff erent for small and large cap. While large-cap glamour stocks in decile 1 posted average returns of 1.8%, small-cap glamour stocks registered average gains of 13.0%. However, starting with decile 2, small- and large-cap stocks tended to move together, displaying evidence of a value premium.
Switzerland: Sample Size (June 30, 1980–June 30, 2007)
Switzerland: Annualized Average 5-Year Returns (June 30, 1980–June 30, 2012)

PAGE 57
In Switzerland, value bested glamour in a majority of the rolling 5-year periods where a robust sample was available although relative performance over the last decade has tended to be mixed.
For both large- and small-cap stocks, value consistently outperformed glamour among the rolling 5-year periods. As with the all-cap universe depicted in Chart 4 above, over the last ten years the relative outperformance of value stocks to glamour stocks was less defi nitive.
Y A
XIS
TIT
LE
Ending Year of Rolling 5-Year Period
Value Outperforms
Glamour Outperforms
85 87 89 91 93 95 97 99 01 03 05 07 09 11 -20%
-10%
0%
10%
20%
30%
All Cap
5-Y
ear
Ann
ualiz
ed R
elat
ive
Per
form
ance
Source: Worldscope, The Brandes Institute; as of 6/30/2012.Years with no performance listed on the chart may refl ect that the country universe was not robust enough to provide data for 10 deciles.
Y A
XIS
TIT
LE
10987654321
Large Cap
Small Cap
0%
2%
4%
6%
8%
10%
12%
14%
16%
Glamour (High P/B) ------------------------------------------------------------------------ Value (Low P/B)
Ann
ualiz
ed A
vera
rge
5-Y
ear
Ret
urns
Source: Worldscope, The Brandes Institute; as of 6/30/2012.
Switzerland: Annualized Average 5-Year Returns (June 30, 1980–June 30, 2012)
Switzerland: Rolling 5-Year Annualized Relative Performance of Value vs. Glamour (June 30, 1980–June 30, 2012)

PAGE 58
Y A
XIS
TIT
LE
85 87 89 91 93 95 97 99 01 03 05 07 09 11
Ending Year of Rolling 5-Year Period
Value Outperforms
Glamour Outperforms -20%
-10%
0%
10%
20%
30%
40%
50%
Small CapLarge Cap
5-Y
ear
Ann
ualiz
ed R
elat
ive
Per
form
ance
Source: Worldscope, The Brandes Institute; as of 6/30/2012.Years with no performance listed on the chart may refl ect that the country universe was not robust enough to provide data for 10 deciles.
United Kingdom
Th e United Kingdom had a healthy sample size, and saw the number of companies increase throughout most of the period. As of June 30, 2007, the U.K.’s large-cap sample consisted of 165 companies, while the small-cap sample included 382 fi rms.
80 82 84 86 88 90 92 94 96 98 00 02 04 06
Tota
l #
of
Com
pan
ies
0
100
200
300
400
500
600
Small Cap
Large Cap
Source: Worldscope, The Brandes Institute; as of 6/30/2012.
Evidence of a value premium in the United Kingdom appeared in the diff erence between decile 1 stocks, which posted average returns of 9.6%, while stocks in decile 10 registered average gains of 14.1%. Th e slope of the line shows a clear upward trend as the deciles move from glamour to value.
Switzerland: Rolling 5-Year Annualized Relative Performance of Value vs. Glamour (June 30, 1980–June 30, 2012)
United Kingdom: Sample Size (June 30, 1980–June 30, 2007)

PAGE 59
While the decile breakouts for the U.K.’s small- and large-cap universes indicated a healthy value premium, for both market capitalizations the slopes of the lines tended to meander between deciles 1 and 10.
Y A
XIS
TIT
LE
10987654321
All Cap
8%
10%
12%
14%
16%
Glamour (High P/B) ------------------------------------------------------------------------ Value (Low P/B)
Ann
ualiz
ed A
vera
rge
5-Y
ear
Ret
urns
Source: Worldscope, The Brandes Institute; as of 6/30/2012.
Y A
XIS
TIT
LE
109876543218%
10%
12%
14%
16%
Large Cap
Small Cap
Glamour (High P/B) ------------------------------------------------------------------------ Value (Low P/B)
Ann
ualiz
ed A
vera
rge
5-Y
ear
Ret
urns
Source: Worldscope, The Brandes Institute; as of 6/30/2012.
On a rolling 5-year basis, value stocks clearly outperformed glamour stocks a majority of the time, and oft en by wide diff erences in performance.
United Kingdom: Annualized Average 5-Year Returns (June 30, 1980–June 30, 2012)
United Kingdom: Annualized Average 5-Year Returns (June 30, 1980–June 30, 2012)

PAGE 60
For both large- and small-cap stocks in the United Kingdom, value stocks tended to outperform glamour across the period, with interruptions during the years ending 1998–2000 and, for large-cap stocks, the four most recent periods.
Y A
XIS
TIT
LE
Ending Year of Rolling 5-Year Period
Value Outperforms
Glamour Outperforms
85 87 89 91 93 95 97 99 01 03 05 07 09 11 -10%
0%
10%
20%
30%
40%5
-Yea
r A
nnua
lized
Rel
ativ
e P
erfo
rman
ce
All Cap
Source: Worldscope, The Brandes Institute; as of 6/30/2012.Years with no performance listed on the chart may refl ect that the country universe was not robust enough to provide data for 10 deciles.
Y A
XIS
TIT
LE
85 87 89 91 93 95 97 99 01 03 05 07 09 11
Ending Year of Rolling 5-Year Period
Value Outperforms
Glamour Outperforms -20%
-10%
0%
10%
20%
30%
40%
Small CapLarge Cap
5-Y
ear
Ann
ualiz
ed R
elat
ive
Per
form
ance
Source: Worldscope, The Brandes Institute; as of 6/30/2012.Years with no performance listed on the chart may refl ect that the country universe was not robust enough to provide data for 10 deciles.
United Kingdom: Rolling 5-Year Annualized Relative Performance of Value vs. Glamour (June 30, 1980–June 30, 2012)
United Kingdom: Rolling 5-Year Annualized Relative Performance of Value vs. Glamour (June 30, 1980–June 30, 2012)

PAGE 61
United States
Our U.S. sample size grew throughout the study period, peaking in the late 90s. While the sample is the largest in our study, it has steadily declined for the past 15 years. As of April 30, 2007, the United States’ large-cap sample consisted of 942 companies, while the small-cap sample included 2,076 fi rms.
Tota
l #
of
Com
pan
ies
0
500
1000
1500
2000
2500
3000
3500
4000
Small Cap
Large Cap
68 70 72 74 76 78 80 82 84 86 88 90 92 94 96 98 00 02 04 06
Source: Worldscope, The Brandes Institute; as of 6/30/2012.
Decile-by-decile returns for the United States clearly pointed to the existence of a value premium. Th e decile 10 value stocks outperformed the decile 1 glamour stocks in the period, and a clear upward trend can be observed as the deciles move from glamour to value. In the United States, the all-cap universe decile 1 glamour stocks returned 6.5%, while decile 10 value stocks recorded performance of 14.8%
Y A
XIS
TIT
LE
10987654321
All Cap
6%
8%
10%
12%
14%
16%
Glamour (High P/B) ------------------------------------------------------------------------ Value (Low P/B)
Ann
ualiz
ed A
vera
rge
5-Y
ear
Ret
urns
Source: Worldscope, The Brandes Institute; as of 6/30/2012.
Th e value premium was evident for both market capitalizations. Large-cap glamour stocks in decile 1 posted average returns of 9.1% while large caps in decile 10 registered average gains of 15.1%. For small caps, the value premium between decile 1 and decile 10 stocks averaged an impressive 8.6%.
United States: Sample Size (June 30, 1980–June 30, 2007)
United States: Annualized Average 5-Year Returns (June 30, 1980–June 30, 2012)

PAGE 62
Prior to 2010, there were only four rolling 5-year periods where glamour bested value among U.S. stocks, and these four instances involved much smaller outperformance than the periods when value stocks outperformed their glamour counterparts. In the last two periods, year ending 2011 and 2012, glamour has outperformed value by 7.4% and 10.9%.
Th e value premium remained evident among both large-cap and small-cap stocks in a clear majority of the rolling 5-year periods. In our opinion, this suggests that U.S. value stocks consistently outperformed their glamour counterparts over time; however, recently glamour has outperformed value for both large- and small-cap stocks in the United States.
Y A
XIS
TIT
LE
Ending Year of Rolling 5-Year Period
Value Outperforms
Glamour Outperforms -20%
-10%
0%
10%
20%
30%
40%
73 75 77 79 81 83 85 87 89 91 93 95 97 99 01 03 05 07 09 11
All Cap
5-Y
ear
Ann
ualiz
ed R
elat
ive
Per
form
ance
Source: Worldscope, The Brandes Institute; as of 6/30/2012.Years with no performance listed on the chart may refl ect that the country universe was not robust enough to provide data for 10 deciles.
Y A
XIS
TIT
LE
109876543214%
6%
8%
10%
12%
14%
16%
Large Cap
Small Cap
Glamour (High P/B) ------------------------------------------------------------------------ Value (Low P/B)
Ann
ualiz
ed A
vera
rge
5-Y
ear
Ret
urns
Source: Worldscope, The Brandes Institute; as of 6/30/2012.
United States: Annualized Average 5-Year Returns (June 30, 1980–June 30, 2012)
United States: Rolling 5-Year Annualized Relative Performance of Value vs. Glamour (June 30, 1980–June 30, 2012)

PAGE 63
Y A
XIS
TIT
LE
Glamour Outperforms
Ending Year of Rolling 5-Year Period
Value Outperforms
-20%
-10%
0%
10%
20%
30%
40%
Small CapLarge Cap
73 75 77 79 81 83 85 87 89 91 93 95 97 99 01 03 05 07 09 11
5-Y
ear
Ann
ualiz
ed R
elat
ive
Per
form
ance
Source: Worldscope, The Brandes Institute; as of 6/30/2012.Years with no performance listed on the chart may refl ect that the country universe was not robust enough to provide data for 10 deciles.
United States: Rolling 5-Year Annualized Relative Performance of Value vs. Glamour (June 30, 1980–June 30, 2012)

PAGE 64
Part C: LSV Annualized Average 5-year Returns,
April 30, 1968–April 30, 1994 for
Price-to-Cash Flow (P/CF) and Price-to-Earnings (P/E)Y A
XIS
TIT
LE
Glamour (High P/B) ------------------------------------------------------------------------ Value (Low P/B)
109876543218%
10%
12%
14%
16%
18%
20%
22%
LSV's Results
All Cap
Ann
ualiz
ed A
vera
rge
5-Y
ear
Ret
urns
Source: Lakonishok, Shleifer and Vishny. “Contrarian Investment, Extrapolation, and Risk.” Journal of Finance 49 (December 1994).
Y A
XIS
TIT
LE
10987654321
LSV's Results
All Cap
10%
12%
14%
16%
18%
20%
Glamour (High P/B) ------------------------------------------------------------------------ Value (Low P/B)
Ann
ualiz
ed A
vera
rge
5-Y
ear
Ret
urns
Source: Lakonishok, Shleifer and Vishny. “Contrarian Investment, Extrapolation, and Risk.” Journal of Finance 49 (December 1994).
Part C: Annualized Average 5-Year Returns, Price-to-Cash Flow (P/CF) Deciles (April 30, 1968–April 30, 1994)
Part C: Annualized Average 5-Year Returns, Price-to-Earnings (P/E) Deciles (April 30, 1968–April 30, 1994)

PAGE 65
Part D: Brandes Institute Synchronized Annualized Average
5-year Returns, April 30, 1968 – April 30, 1994 for
Price-to-Cash Flow (P/CF) and Price-to-Earnings (P/E)Y A
XIS
TIT
LE
109876543218%
10%
12%
14%
16%
18%
20%
22%
24%
LSV's Results
B.I. Synchronized
Results ('68-'94)
Glamour (High P/B) ------------------------------------------------------------------------ Value (Low P/B)
Ann
ualiz
ed A
vera
rge
5-Y
ear
Ret
urns
Source: Lakonishok, Shleifer and Vishny. “Contrarian Investment, Extrapolation, and Risk.” Journal of Finance 49 (December 1994); Compustat, The Brandes Institute; as of 4/30/2007.
Y A
XIS
TIT
LE
10987654321
LSV's Results
B.I. Synchronized
Results ('68-'94)
10%
12%
14%
16%
18%
20%
Glamour (High P/B) ------------------------------------------------------------------------ Value (Low P/B)
Ann
ualiz
ed A
vera
rge
5-Y
ear
Ret
urns
Source: Lakonishok, Shleifer and Vishny. “Contrarian Investment, Extrapolation, and Risk.” Journal of Finance 49 (December 1994); Compustat, The Brandes Institute; as of 4/30/2007.
Part D: Annualized Average 5-Year Returns, Price-to-Cash Flow (P/CF) Deciles (April 30, 1968–April 30, 1994)
Part D: Annualized Average 5-Year Returns, Price-to-Earnings (P/E) Deciles (April 30, 1968–April 30, 1994)

PAGE 66
Part E: Brandes Institute Extended Results Annualized Average
5-year Returns, April 30, 1968 - April 30, 2012
Price-to-Cash Flow (P/CF) and Price-to-Earnings (P/E)
Large-Cap and Small-Cap SeriesY A
XIS
TIT
LE
109876543216%
8%
10%
12%
14%
16%
All Cap
Glamour (High P/B) ------------------------------------------------------------------------ Value (Low P/B)
Ann
ualiz
ed A
vera
rge
5-Y
ear
Ret
urns
Source: Compustat, The Brandes Institute; as of 4/30/2012.
Y A
XIS
TIT
LE
109876543216%
8%
10%
12%
14%
16%
All Cap
Glamour (High P/B) ------------------------------------------------------------------------ Value (Low P/B)
Ann
ualiz
ed A
vera
rge
5-Y
ear
Ret
urns
Source: Compustat, The Brandes Institute; as of 4/30/2012.
Part E: Annualized Average 5-Year Returns, Price-to-Cash Flow (P/CF) Deciles (April 30, 1968–April 30, 1994)
Part E: Annualized Average 5-Year Returns, Price-to-Earnings (P/E) Deciles (April 30, 1968–April 30, 1994)

PAGE 67
Part F: Brandes Institute Extended Global Results Annualized Average
5-year Returns June 30, 1980 – June 30, 2012 for
Price-to-Cash Flow (P/CF) and Price-to-Earnings (P/E) Deciles
for Large-Cap and Small-Cap SeriesY A
XIS
TIT
LE
109876543216%
8%
10%
12%
14%
16%
Large Cap
Small Cap
Glamour (High P/B) ------------------------------------------------------------------------ Value (Low P/B)
Ann
ualiz
ed A
vera
rge
5-Y
ear
Ret
urns
Source: Worldscope, The Brandes Institute; as of 6/30/2012.
Y A
XIS
TIT
LE
10987654321
LSV's Results
B.I. Synchronized
Results ('68-'94)
10%
12%
14%
16%
18%
20%
Glamour (High P/B) ------------------------------------------------------------------------ Value (Low P/B)
Ann
ualiz
ed A
vera
rge
5-Y
ear
Ret
urns
Source: Worldscope, The Brandes Institute; as of 6/30/2012.
Part F: Annualized Average 5-Year Returns, Price-to-Cash Flow (P/CF) Deciles (April 30, 1968–April 30, 1994)
Part F: Annualized Average 5-Year Returns, Price-to-Earnings (P/E) Deciles (April 30, 1968–April 30, 1994)

WWW.BRANDES.COM/INSTITUTE
The Brandes Institute
11988 El Camino Real,
Suite 600
P.O. Box 919048
San Diego
CA 92191-9048
858.755.0239
800.237.7119
Fax 858.755.0916
DISCLOSURES
Past performance is not a guarantee of future results.
Price/Book: Price per share divided by book value per share.
Price/Cash Flow: Price per share divided by cash fl ow per share.
Price/Earn: Price per share divided by earnings per share.
Rolling periods represent a series of overlapping, smaller time periods within a single, longer-term time period. For example, over a 20-year period, there is
one 20-year rolling period, eleven 10-year rolling periods, sixteen 5-year rolling periods, and so forth.
This material is for informational purposes only. Material should not be considered a recommendation to purchase or sell any particular security. It should
not be assumed that any security transactions, holdings, or sectors discussed were or will be profi table. Stocks of small companies usually experience
more volatility than mid- and large-sized companies. International and emerging markets investing is subject to certain risks such as currency fl uctuation
and social and political changes; such risks may result in greater share price volatility. Unlike Treasury securities, stocks are not backed by the full faith
and credit of the United States and will experience market fl uctuations. Indices are unmanaged and are not available for direct investment. No investment
strategy can assure a profi t or protect against loss.
The following refl ects the thoughts and opinions of the Brandes Institute, a division of Brandes Investment Partners, L.P.
Copyright © 2002-2012 Brandes Investment Partners, L.P. ALL RIGHTS RESERVED. Brandes Investment Partners® is a registered trademark of Brandes
Investment Partners, L.P. in the United States and Canada. Users agree not to copy, reproduce, distribute, publish, or in any way exploit this material, except
that users may make a print copy for their own personal, non-commercial use. Brief passages from any article may be quoted with appropriate credit to the
Brandes Institute. Longer passages may be quoted only with prior written approval from the Brandes Institute. For more information about Brandes Institute
research reports, visit our website at www.brandes.com/institute.
NOVEMBER 2012