
Value Relevance of Firm Specific Corporate Governance and ... · Muhammad Farhan Malik...
22
Pak J Commer Soc Sci Pakistan Journal of Commerce and Social Sciences 2013, Vol. 7 (2), 276-297 Value Relevance of Firm Specific Corporate Governance and Macroeconomic Variables: Evidence from Karachi Stock Exchange Muhammad Farhan Malik (Corresponding Author) MS Scholar, Shaheed Zulfikar Ali Bhutto Institute of Science and Technology, Islamabad, Pakistan E-mail: [email protected] Syed Muhammad Amir Shah Assistant Professor, Allama Iqbal Open Uuniversity, Islamabad, Pakistan E-mail: [email protected] Abstract This study examines the value relevance of firm specific corporate governance and macroeconomic variables of public listed non-financial companies in Karachi stock exchange (KSE) and also answers how a firm can increase its value relevance by incorporating most value relevant drivers in their financial management systems. The sample of the study is drawn by stratified systematic sampling technique to capture most representative sample on the basis of market capitalization. A total 12 years secondary data from 2000 to 2011 is used as the study period. This time frame is chosen because the Securities and Exchange Commission of Pakistan (SECP) issued corporate governance code in year 2002; moreover this time frame also covers the mandatory adoption of International Financial Reporting Standards (IFRSs) in 2005. The results of the study found that book value, earnings per share; quality corporate governance and real gross domestic product growth rate significantly determine the stock price. But the regression coefficients of inflation and money supply are statistically insignificant. The study also found that there is a positive and significant impact of the issuance of code of corporate governance and mandatory adoption of IFRSs on the value relevance of book value and earnings. This implies that the relevance of published financial statement has been increased for the investors. Keywords: Value relevance; Karachi Stock Exchange; macroeconomic variables; quality corporate governance. 1. Introduction Investors in stock markets use financial data to ascertain firms’ fundamental value. In doing so, they analyze firms by evaluating stock prices. In fundamental analysis the major task is to find out the most relevant information that can be used for calculating firm’s value. The firm value has a great importance for investors, as stock price increases
Transcript of Value Relevance of Firm Specific Corporate Governance and ... · Muhammad Farhan Malik...
Pak J Commer Soc Sci Pakistan Journal of Commerce and Social Sciences 2013, Vol. 7 (2), 276-297
Value Relevance of Firm Specific Corporate Governance and Macroeconomic Variables: Evidence from Karachi
Stock Exchange
Muhammad Farhan Malik (Corresponding Author) MS Scholar, Shaheed Zulfikar Ali Bhutto Institute of Science and Technology,
Islamabad, Pakistan E-mail: [email protected]
Syed Muhammad Amir Shah
Assistant Professor, Allama Iqbal Open Uuniversity, Islamabad, Pakistan E-mail: [email protected]
Abstract This study examines the value relevance of firm specific corporate governance and macroeconomic variables of public listed non-financial companies in Karachi stock exchange (KSE) and also answers how a firm can increase its value relevance by incorporating most value relevant drivers in their financial management systems. The sample of the study is drawn by stratified systematic sampling technique to capture most representative sample on the basis of market capitalization. A total 12 years secondary data from 2000 to 2011 is used as the study period. This time frame is chosen because the Securities and Exchange Commission of Pakistan (SECP) issued corporate governance code in year 2002; moreover this time frame also covers the mandatory adoption of International Financial Reporting Standards (IFRSs) in 2005. The results of the study found that book value, earnings per share; quality corporate governance and real gross domestic product growth rate significantly determine the stock price. But the regression coefficients of inflation and money supply are statistically insignificant. The study also found that there is a positive and significant impact of the issuance of code of corporate governance and mandatory adoption of IFRSs on the value relevance of book value and earnings. This implies that the relevance of published financial statement has been increased for the investors. Keywords: Value relevance; Karachi Stock Exchange; macroeconomic variables; quality corporate governance. 1. Introduction Investors in stock markets use financial data to ascertain firms’ fundamental value. In doing so, they analyze firms by evaluating stock prices. In fundamental analysis the major task is to find out the most relevant information that can be used for calculating firm’s value. The firm value has a great importance for investors, as stock price increases

Malik and Shah
277
it contributes towards the wealth which is the major goal of long term investors. Different models and techniques are employed by the analysts to ascertain the firm value. Frequently used models are Dividend Discount Model (DDM), Binomial Pricing Model, Linear Information Model, Ohlson (1995) model, and Black Scholes Option Pricing Model (BSOPM). The validity and applicability of these models and development of new ones is extensively found in value relevance literature. The basic idea of value relevance is that the accounting data has worth for the investor who wishes to determine the firm value. The modern research in value relevance however also considers the information other than accounting data. In classical finance the valuation theory states that the firm value equals to the present value of expected dividends (Gordon, 1959). This model is also known as dividend discount model. However this model has been revised and updated in many dimensions. For example Feltham and Ohlson (1995) showed that the share value is equal to the net financial assets plus present value of all expected free cash flows from operations. Ohlson (1995) states that under the clean surplus relation, the dividend and cash flow model can be expressed as the function of accounting variables. The clean surplus relation states that the variation in stock value is the function of net income and dividends. 1.1 Research Problem and Objectives The value relevance researches try to find out those factors which help to determine the stock prices. In general the movements in stock prices change on daily basis, in certain timeframes it increases daily and for some companies it appreciates many times in a day and vice versa. This non-linear movement shows that demand and supply is the major factor which fluctuate stock prices. This theory also favors the general economic equilibrium in the market. However there is no comprehensive model which defines this price movements and changes in demand and supply. But many factors have been considered in the research such as company’s fundamentals, economic situation, non-financial variables and investor sentiments (Malgharni et al. 2010; Shah et al. 2009; Amir and Lev, 1996; Nieh and Lee, 2001; Kahneman et al. 1991). This study considers the most value relevant factors from the literature studied such as firm fundamentals, quality governance and economic variables for the determination of stock prices. All of these factors have been studied individually but still lacks a comprehensive model of value determination. The Pakistani capital market is one of the developing markets in the world. There are three stock exchanges in the country; Islamabad stock exchange (ISE), Lahore stock exchange (LSE) and Karachi stock exchange (KSE). The Karachi stock exchange is the oldest one (established in 1947) and the major trading also takes place there. Investors are more concerned with the proper functionality of KSE as such it works efficiently and effectively. This study examines the most value relevant variables that affect the stock prices and present a comprehensive model for stock price determination. The proposed model considers the three major value relevant drivers; accounting fundamentals, quality corporate governance and macroeconomic variables. The prior studies conducted found a significant relationship with the stock prices. Based on the previous literature reviewed and gap identified the study has the following objectives:

Value Relevance, Corporate Governance and Macroeconomic Variables
278
i. To examine the value relevance of corporate governance code issued by SECP in 2002.
ii. To examine the value relevance of mandatory adoption IFRSs in 2005. iii. To examine the value relevance of book value and earnings. iv. To examine the value relevance of quality corporate governance. v. To examine the value relevance of macroeconomic variables.
2. Literature Review 2.1 Ohlson (1995) Model of Equity Valuation James A. Ohlson made a remarkable contribution in measuring the value relevance of information by developing a rigorous valuation model and refining the same in many stages. There is an evidence that the value relevance studies were expanded, both in the US as well as in other markets, with the models developed by Ohlson (Chen et al., 2001) such as Ohlson (1995); Feltham and Ohlson (1995); Feltham and Ohlson (1996); Ohlson (1999), followed by the review of models developed by Ohlson. The following equation describes the Ohlson (1995) model of equity valuation:
Pit = α0 + α1Eit + α2BVit + ε
Whereas α0 is the intercept, Pit is the market value of firm stock, Eit is earnings for the period ending date t of firm i, BVit book value of net assets of firm i at date t and ε is random error term. The basis for the development of the first valuation model by Ohlson is the clean surplus relationship. Ohlson (1995) argued that any change in the stockholder’s equity section in the balance sheet is due to the bottom line figures in the income statement and balance sheet i.e. book value and earnings. Moreover any changes in book value are equal to the net income less dividends. Ohlson states this as the clean surplus relation, as expressed that all the changes in assets and liabilities are not linked to dividends and should pass through the income statement. Value relevance theory usually holds this pattern deprived of drawing any connection to accounting data users. However the fundamental is that the net asset value is settled with the value creation and its distribution. This originates an important question i.e. one can develop a solid theory about the firm value to rely on the clean surplus relation to recognize a discrete part for earnings, book value and dividends. Contrast to clean surplus relations, dirty surplus items occur when some items are adjusted from shareholder’s equity without passing through the income statement. Ohlson (1995) proposed a model of equity valuation to ascertain the firm value which relates to the current and expected earnings, book values and dividends. The stockholder’s equity accounting develops supporting approach that the clean surplus relation applies and dividends decrease present book value but do not affect the present earnings. Moreover, Ohlson states that this model fulfills many attractive properties and delivers a valuable standard when one studies how stock value relates to accounting figures and other information. Book value and earnings are used in value relevance literature and has positive and significant impact on stock prices. Malik et al. (2012) tested the applicability of Ohlson (1995) model on listed companies in Karachi stock exchange (KSE) and found that book value and earnings successfully determine the stock prices. Papadaki and Siougle (2007) studied the impact of book value and earnings on the firm value. They found a positive

Malik and Shah
279
significant impact for firms reporting profits and negative impact for firms reporting losses. Similar results are also provided by Collins et al. (1999). Davis-Friday et al. (2006) studied the Asian crisis, corporate governance and accounting system on the valuation of book value and earnings. They found that value relevance of book value and earnings declines in the crisis period. Moreover the study also found that the value relevance of book value declines when corporate governance is weak. Florou and Chalevas (2010) studied the accounting value drivers in Athens exchange. By employing cross-sectional analysis between critical accounting ratios and stock return they found that firm’s earnings capabilities and its growth opportunities affect stock returns. Ismail (2006) investigated the economic value (EVA) added with accounting earnings in the determination of stock returns. They found that firm’s net profits outperform EVA and residual income in the determination of stock returns. 2.2 Stock Prices and Corporate Governance Today’s financial analysis procedures are facing the issue of trust because of the agency problem. Many of the corporations are now family owned because of this conflict but still the agency problem exists not only in general but between family owned businesses also. The management is answerable to shareholders but because of the presence of other stakeholders, with each one having his own interests in the business try to have results those favoring them. Earnings management is the example by which accountants try to minimize variations in the earnings. The need of proper corporate governance has been realized through which the security and exchange commission of Pakistan (SECP) issued corporate governance code in March 2002 and revised updated code issued in 2012. The better governance is needed to make better performance. Recent financial issues of earning restatements, breakdown of basic corporate governance, excessive CEO compensation, backdating of stock options have pushed up “corporate governance” in the global markets as never before. Many global markets are now debating the corporate governance measures and reforms. Several international legislative initiatives are developed for the purpose to improve the financial transparency and accountability in global capital markets, all of which presume that good corporate governance gives better performance and firm value. Most relevant variables studied are: board composition, observing managers via managerial compensation, ownership distribution, and market for corporate control (Gupta, Kennedy and Weaver, 2009). However the findings of these studies differ across countries (Maher and Andersson, 1999). But in latest research the scholars are trying to discover whether the corporate governance is related to the firm value (e.g. Wang and Hussainey, 2013; Wang, 2013; Hsu, Chao and Chen, 2013; Fiador, 2013). Bloomfield (2002) hypothesis concludes that figures and statistics that are cost worthy to pull out from government data sources are least likely disclosed by market prices. The governance data is publicly available in different disclosures but to change these disclosures into valuable figures to make investment choices seems costly to investors. Numerous scholars have found the connection between the corporate governance and firm value. Patel and Dallas (2002) was one of the US researchers finding the association among the corporate governance and value of firm. The data collected for this study was from annual reports, proxy fillings of 460 of the S&P 500 firms on 98 characteristics allocated into three major categories (financial transparency and information disclosures, board and management structures and process, ownership structure and investor rights).

Value Relevance, Corporate Governance and Macroeconomic Variables
280
The study concluded that by providing higher transparency and disclosures to financial markets the firms can decrease their equity cost. Francis et al. (2004) found that the value relevance increases when cost of equity decreases because it contributes lower information risk for investors. And this decrease in information risk also decreases the estimated investment structure based upon the available information. In simple words the lower risk means lower cost of equity capital. Gompers et al. (2003) found a significant association between the corporate governance and the firm value. Bauer et al. (2004) also found a positive significant correlation between and corporate governance and firm value that were measured by Tobin’s Q. They used the approach of Gompers et al. (2003) of good and bad governance portfolios. Brown and Caylor (2006) constructed the governance index by studying 51 factors from the Institutional Shareholder Services Database (ISSD). They found a positive significant relationship between corporate governance and firm value measured by Gov-Score index and Tobin’s Q. They also concluded that their Gov-Score index is more associated with firm value than G-Index which established by Gompers, Ishii and Metrick (2003). Agarwal et al. (2007) studied institutional shareholders services data for 2005 for the comparison of the corporate governance of US and overseas firms having similar characteristics and concluded that overseas firm had poorer corporate governance compared to US firms. They studied the association among corporate governance and firm value and found that the gap in the overseas firms and US firm’s corporate governance was significantly associated to the firm value. Foerster and Huen (2004) explored the 2002 rankings to study the association among the corporate governance scores and stock prices by a number of various time spans and reported a positive significant relationship in the two day window around the announcement of governance scores. Klein et al. (2005) studied the impact of ownership concentration and firm value by using 2002 rankings and found a positive significant relationship. 2.3 Stock Prices and Macroeconomic Variables Capital markets play a significant role in mobilization of national resources which is the crucial part of economic development and ultimately this leads to profitable investments. From this view the stock markets must have significant relationship with the economy. This relationship is of twofold; one is the stock market as the important indicator of the economy and secondly related to the impact of macroeconomic variables on stock market fluctuations such as Exchange Rate (ER), Inflation, Gross Domestic Product (GDP) and others. The relationship between stock prices and macroeconomic variables are considered and found by (Bailay, 1990; Sadeghi, 1992; Kwon and Shin, 1999). Ralph and Eriki (2001) studied the impact of macroeconomic variables on Nigerian stock exchange. They found that inflation has a strong negative relation with the stock prices. Moreover their study suggests that GDP, interest rate, monetary shocks have a significant impact of stock prices. Their study supported the work of Zhao (1999) who found the similar results in the capital markets of China. Mookerjee and Yu (1997) studied the impact of macroeconomic variables on the stock prices in Singapore stock market. They found that money supply (narrow and broad) and foreign exchange reserves reveal a long-run relationship with stock prices. Gunasekarager et al. (2004) studied the impact of money supply, Treasury bill rate, inflation and exchange rate on stock prices in Sri Lankan stock market. They found that all the variables except exchange rate influence stock prices. Al-Tamimi et al. (2011) studied the company fundamentals and

Malik and Shah
281
macroeconomic factors affecting the stock prices in the UAE financial markets. Their findings suggest that the earnings capability of firm has a significant impact; moreover inflation and interest rate are negatively related with stock prices. The study also found that money supply and GDP have positive estimated coefficients but statistically insignificant. Akbar et al. (2012) studied relationship between stock prices and macroeconomic variables in Karachi stock exchange (KSE). They applied co-integration, granger causality and error correction tests to analyze this relationship. Their study found that there is a long-run relationship between stock prices and macroeconomic variables. Tsoukalas (2003) employed four macroeconomic variables; industrial production, inflation, money supply (M2) and exchange rates to determine stock returns and found significant relationships. The relationship between foreign exchange rate and stock prices have considered by a number of researchers for many theoretical and empirical reasons, because this relationship between the rates and prices play a vital role in the development of any country’s economy. Moreover the relationship is widely used by many fundamental analysts or investors to forecast the future exchange rate trends. A significant relationship was found between macroeconomic variables and exchange rates by (Meese and Rogoff, 1983; Wolf, 1988; Baillie and Selover, 1987; Ghartey, 1998). However Nieh and Lee (2001) found that there is no long-run significant impact of exchange rates on stock prices in G-7 countries. 2.4 Variables of the Study This study used three crucial factors from the literature review that drives the stock prices. The major factors include firm specific fundamentals, quality corporate governance and macroeconomic variables. The Ohlson (1995) model is used to ascertain the determination power of accounting information. It predicts that the stock price is the function of book value and earnings (e.g. Malik et al. 2012; Papadaki and Siougle, 2007; Gallizo and Salvador, 2006). Moreover to capture the impact of quality corporate governance this study used the model made in line with the Klapper and Love (2002). This model predicts that ownership concentration, managerial ownership, board independence and audit committee independence is essential for quality corporate governance (Shah et al. 2009). Four key macroeconomic variables are taken in this study for stock price determination; inflation, exchange rate, gross domestic product (GDP) and money supply (measured by M2). The macro variables are also considered in value relevance literature and found a significant relationship (such as Al-Tamimi et al. 2011; Al-Qenae et al. 2002; Ralph and Eriki, 2001; Zhao, 1999). The firm specific, stock prices and corporate governance variables are taken on annual basis at year end for each company whereas the macroeconomic variables are taken on annual basis and converted into panel data type. Table I shows the description of the selected variables:

Value Relevance, Corporate Governance and Macroeconomic Variables
282
Table 1: Description of Variables Variables Definition Book Value (BV) Total equity of common shareholders divided by
total number of common shares outstanding. Earnings (EPS) Net income after tax divided by total number of
common shares outstanding.
Ownership Concentration (OC) Total shares held by top 10 shareholders divided the total number of shares.
Managerial Ownership (MO) Total shares held by board of directors divided by total number of shares.
Board Independence (BI) Independent directors divided by total number of directors.
Audit Committee Independence (ACI)
Number of independent directors on the audit committee divided by the total number of director on the audit committee.
Inflation (INF) Inflation rate (INF).
Exchange Rate (EX) Measured by Pakistani rupees per US dollar.
Gross Domestic Product (GDP) Real GDP growth rate. Money Supply (M2) Broad money supply growth rate.
Stock Price (SP) The closing share value at year end for each company.
2.4.1 Scoring Corporate Governance A quality corporate governance score is used in this study being in line with Shah et al. (2009) and Klapper and Love (2002). The following equations describe the governance score:
QCG = f (Ownership, Independence) Eq. 1 QCG = f (OC, MO, BI, ACI) Eq. 2 QCG score = [(OC+MO)*w1 + [(BI+ACI)*w2] Eq. 3
Where; QCG is the quality corporate governance, OC is the ownership concentration, BI is the board independence and ACI is the audit committee independence. Eq. 1 describes that the QCG is the function of ownership and independence. Eq. 2 describes that ownership is divided into ownership concentration and managerial ownership and independence is also distributed into board independence and audit committee independence. Eq. 3 describes the weights (w1 = 45% and w2 = 55%) for ownership and independence measures respectively and by adding them to get QCG score. In this study the higher the QCG score describes the better corporate governance. Appendix II describes the scoring criteria for corporate governance variables adopted Shah et al. (2009).

Malik and Shah
283
2.5 Hypotheses of the Study Following are the hypotheses of this study to check the value relevance of the corporate governance code (2002) issued by SECP, the mandatory adoption of IFRSs and firm specific, macroeconomic and quality corporate governance variables:
H1: There is a positive and significant impact of the issuance of code of corporate governance in 2002 by SECP on the value relevance of published financial statements.
H2: There is a positive and significant impact of the mandatory adoption of IFRSs on the value relevance of published financial statements.
H3: Firm specific, macroeconomic and quality corporate governance variables significantly determine the Stock Price.
3. Research Design This section includes the type of study, sampling methodology, and data collection techniques. 3.1 Type of Study This study is quantitative and explanatory in nature in which secondary data is used to check the stock price determination power of firm’s fundamentals, economic variables and quality corporate governance. The results provide useful implications for mangers and investors but however this study is intended to conduct from academic point of view so the motive is pure research. 3.2 Sampling Methodology To draw the inference about the stock price determination power of firm specific fundamentals, macroeconomic variables and quality corporate governance the study uses stratified systematic sampling approach for collecting the sample. The population of the study is the public listed companies in the Karachi stock exchange (KSE) whose shares have been traded during the study period [2000-2011]. This time frame is chosen because the security and exchange commission of Pakistan (SECP) issued corporate governance code in March 2002 and it also covers the mandatory adoption of IFRSs in 2005. Sampling is based on the market capitalization of firms. We determined the weights of each sector’s capitalization towards the total market capitalization, and then arranged the companies within a sector on the basis of their proportionate market capitalization. Companies are selected from a sector on the basis of the proportion of that sector’s total market capitalization. Appendix 1 shows the detailed sampling procedure and number of companies that are qualified for sampling. 3.3 Data Collection The current study is a secondary and explanatory in nature and it used 12 years secondary data from different sources such as the data regarding firm fundamentals and corporate governance is collected from the balance sheet analyses issued by State Bank of Pakistan (SBP) and annual reports of selected firms. The data regarding macroeconomic variables is collected from World Bank and economic surveys of Pakistan. Moreover the data regarding dependent variable i.e. stock prices is gathered from the website of Karachi stock exchange (KSE).

Value Relevance, Corporate Governance and Macroeconomic Variables
284
4. Data Analysis Techniques Stock Price = f (firm specific fundamentals, quality corporate governance and macroeconomic variables)
Spit = β0 + β1 (BVit) + β2 (EPSit) + β3 (d1) + αi + eit (Model 1)
Spit = β0 + β1 (BVit) + β2 (EPSit) + β3 (d1) + αi + eit (Model 2)
Spit = β0 + β1 (BVit) + β2 (EPSit) + β3 (QCGit) + β4 (INFit)
+ β5 (Exit) + β6 (GDPit) + β7 (M2it) + αi + eit (Model 3)
Whereas SP represents the dependent variable i.e. the stock price, BV represents the book value per share, EPS represents the earnings per share, QCG is quality corporate governance score, GDP is the gross domestic product and M2 is the money supply, αi is the fixed parameter, it is done by adding dummy variables for (n-1) cross-sectional units and eit is the random error term. All the variables are taken on annual basis for each firm, however the GDP and M2 are the only time variant regressors and are converted into panel data form. Equation of model 1 is used to check the value relevance of the issuance of corporate governance code in Pakistan. This is done by adding a dummy variable (i.e. d1 in model 1) before and after the issuance of code. The total time period for model 1 is 6 years [2000 to 2005]. Model 2 represents the value relevance of mandatory adoption of IFRSs in Pakistan. This is also done by adding a dummy variable (i.e. d1 in model 2) before and after the mandatory adoption of IFRSs. The total time period for model 2 is 12 years [2000 to 2011]. The model 3 is a comprehensive model proposed in this study for the stock price determination. The total time frame for model 3 is 9 years [2003 to 2011]. This model is tested after confirming the significant impact of corporate governance code and mandatory adoption of IFRSs on the value relevance of published financial statements. The Ohlson (1995) model is also used to check the relevance of published financial statements (e.g. Kadri et al. 2009; Callao et al. 2007; Gaston et al. 2010). For statistical analysis different packages are used such as SPSS, Gretl and EViews. The data used in this study is balanced panel type. Results are inferred on the basis of panel data regression however correlation coefficient is also calculated between the stock price and the independent variables. The panel data regression includes different types such as pooled ordinary least squares, fixed effects regression and random effects regression, the choice of correct panel regression i.e. suitable for analysis the Chow-test (Restricted F-test) for data pooling and Hausman test are used. The Heteroscedasticity in panel data is checked through the Wald test for Group-Wise Heteroscedasticity. Also the Autocorrelation is checked by Durbin-Watson statistic. 5. Empirical Findings This section provides the empirical results of the study. Firstly in table II the descriptive statistics is shown. Table III shows the Jarque-Bera test1, applied on each variable before and after log-transformation. After testing normality of variables the correlation matrix is
1 For a normal distribution the skewness coefficient equals to zero and kurtosis coefficient equals to three. Therefore the Jarque-Bera statistic for the normally distributed variable is expected to be zero. Here the null hypothesis is that the data is normally distributed.

Malik and Shah
285
presented in table IV. The diagnostic tests are presented in table V, VI and VII for each model. Diagnostic tests include Restricted F-Test2, Hausman Test3 and Wald test for Group-Wise Heteroscedasticity4. The diagnostic tests concluded that fixed effects (robust standard errors) regression is appropriate for each model. Moreover the Autocorrelation is checked through the Durbin-Watson test5. Table VIII, IX and X shows the results of value relevance of corporate governance code, mandatory IFRSs adoption and the value relevance of firm specific, macroeconomic and quality corporate governance variables respectively. Table II shows the descriptive statistics for study sample that includes the total 468 observations for each variable. Firstly the SP shows the highest mean and median value of 161 and 88 while GDP has the lowest value of 0.05 in both mean and median. The dispersion in the data is measured through standard deviation which shows that SP has the highest value of 216 while GDP has the lowest standard deviation of 0.02. Furthermore the minimum and maximum value of 0.02 and 1300 is provided for GDP and SP respectively.
Table II: Descriptive Statistics BV EPS QCG INF EX GDP M2 SP Mean 102 21 5 0.11 68 0.05 0.15 161 Median 62 12 4 0.09 60 0.05 0.15 88 St. Dev. 97 27 1.6 0.05 11 0.02 0.04 216 Min 3 0.4 2.0 0.03 57 0.02 0.06 2.81 Max 556 162 9 0.20 85 0.09 0.21 1300 Count 468 468 468 468 468 468 468 468
Before the correlation analysis the variables are tested for normal distribution. Table III shows the Jarque-Bera test for normality of variables before and after the log-transformation. Firstly the SP shows the highest JB-test statistic of 2453.69 while INF has the lowest value of 0.39 before log transformation and all of the four macroeconomic variables are normally distributed while BV, EPS, QCG are not. To improve the normality the log transformation is done for each variable. Table III shows that after log transformation the normality is significantly increased (i.e. JB-test statistic is reduced for not normally distributed data) and all the variables are normally distributed except BV but JB-test statistic is reduced from 404.18 to 8.61 which shows the improved normality.
2 The null hypothesis of F-Test here is that all the differential intercepts are equal to zero. 3 The null hypothesis of Hausman test is that the fixed effects model and random effects model estimators do not differ substantially. 4 The null hypothesis of Wald test for Group-Wise Heteroscedasticity is that the units have a common error variance. 5 The Durbin-Watson Stat ranges from 0 (perfect positive autocorrelation) to 4 (perfect negative autocorrelation), whereas if D.W stat equals to 2 then it shows no autocorrelation.

Value Relevance, Corporate Governance and Macroeconomic Variables
286
Table III: Jarque-Bera Test for Normality of Variables Before Log
Transformation After Log Transformation
Variable JB-Test Statistic Sig. JB-Test Statistic Sig. BV 404.18 0.00 8.61 0.02 EPS 1562.13 0.00 2.40 0.30 QCG 29.73 0.00 3.22 0.20 INF 0.39 0.82 1.01 0.61 EX 1.27 0.52 1.25 0.53 GDP 0.51 0.77 0.61 0.74 M2 1.42 0.48 5.53 0.63 SP 2453.69 0.00 6.04 0.06
After data normalization the correlation matrix is shown in table IV. The EPS and M2 show the highest and lowest correlation coefficient of 0.73 and -0.009 with the dependent variable i.e. SP. Moreover the correlation matrix also shows the problem of multicollinearity between the GDP and EX. For this reason the EX is omitted from further analysis. The major reason for selecting the GDP is that it includes the impact of most of the macroeconomic variables (e.g. expenditures, oil prices etc.). The overall result of correlation matrix indicates that the BV, EPS and QCG are positively and significantly correlated with the SP while all the macroeconomic variables have insignificant correlation coefficient. Moreover INF and GDP are positively correlated while EX and M2 are negatively correlated with SP.
Table IV: Correlation Matrix BV EPS QCG INF EX GDP M2 EPS .72** QCG .03 .14** INF .16** .08 .03 EX .14** .08 .01 .67** GDP -.11* -.02 .01 -.44** -.84** M2 -.10* -.04 -.01 -.65** -.39** .42** SP .71** .73** .10* .06 -.03 .05 -.009 **, and * denote significance level of 1% and 5% respectively.
After correlation analysis the diagnostic tests are performed on each model. Table V shows the diagnostics tests for model 1 i.e. the value relevance of corporate governance code. The F-Statistic of 13.93 under Restricted F-Test is significant at 1% level which rejects the null hypothesis and concludes that the fixed effects estimators are preferred to pooled OLS. The Chi-square statistic of 15.88 under Hausman test is significant at 1% level which rejects the null hypothesis and concludes that fixed effects estimators are efficient to random effects estimators. Moreover the Chi-square statistic of 2141.29 under Wald test for Group-Wise heteroscedasticity is also significant at 1% level which shows that the error term is heteroscedastic. The tests in table V conclude that the fixed effect regression (robust standard errors) is most appropriate for model 1.

Malik and Shah
287
Table V: Diagnostic Tests for Model 1 – Value Relevance of Corporate Governance Code
Diagnostic Test F-Stat Chi-square Stat Restricted F-Test 13.93*** Hausman Test 15.88*** Wald Test for Group-Wise Heteroscedasticity 2141.29*** *** denote significance level of 1%
Table VI shows the diagnostic tests for the model 2 i.e. the value relevance of IFRS mandatory adoption in Pakistan. The F-Statistic of 13.31 under Restricted F-Test is significant 1% level which rejects the null hypothesis and concludes that the fixed effects estimators are preferred to pooled OLS. Moreover the Chi-square statistic of 8.67 under Hausman test is significant at 5% level which rejects the null hypothesis and concludes that the fixed effects estimators are efficient to random effects estimators. Furthermore the Chi-square statistic of 457.59 under Wald test for Group-Wise heteroscedasticity is significant at 1% level which indicates that the error term is heteroscedastic. The diagnostic tests in table VI conclude that the fixed effect (robust standard errors) is most appropriate.
Table VI: Diagnostic Tests for Model 2 – Value Relevance of IFRSs Mandatory Adoption
Diagnostic Test F-Stat Chi-square Stat Restricted F-Test 13.31*** Hausman Test 8.67** Wald Test for Group-Wise Heteroscedasticity
457.59***
***, and ** denote significance level of 1% and 5% respectively.
Table VII shows the diagnostic test for the model 3 i.e. the value relevance of firm specific, macroeconomic and quality corporate governance variables. The F-Statistic of 18.91 under Restricted F-Test is significant at 1% level which rejects the null hypothesis and concludes that the fixed effects estimators are preferred to pooled OLS. The chi-square statistic of 24 under Hausman test is significant at 1% level; it also rejects the null hypothesis and concludes that the fixed effects estimators are efficient to random effects estimators. Moreover the Chi-square statistic of 1614.73 under Wald test for Group-Wise heteroscedasticity is also significant at 1% level which indicates that the error term is heteroscedastic. The diagnostic tests in table VII concludes that the fixed effect (robust standard errors) is most appropriate for model 3.
Table VII: Diagnostic Tests for Model 3 – Value Relevance of Firm Specific, Corporate Governance and Macroeconomic Variables
Diagnostic Test F-Stat Chi-square Stat Restricted F-Test 18.91*** Hausman Test 24.00*** Wald Test for Group-Wise Heteroscedasticity
1614.73***
*** denote significance level of 1%

Value Relevance, Corporate Governance and Macroeconomic Variables
288
After the diagnostic tests the regression equations are estimated. Table VIII shows the results of fixed effects regression for the model 1. The method used is the LSDV, the time series length is 6 years i.e. 3 years before and after the issuance of code of corporate governance in Pakistan in 2002. Total observations used in this model are 312 for 52 companies. The R-squared 0.90 while the Adjusted R-squared is 0.88 which shows the high determination power. The Durbin-Watson Stat is 1.86, which is close to 2 and indicates that there is very less negative autocorrelation, so it can be ignored. The F-Statistic of 45.69 is significant at 1% level which shows the significance of overall model. The coefficient of BV is 0.25 which has no statistical significance whereas the coefficients of EPS and d1 are 0.26 and 0.38 respectively and are significant at 1% level. The results suggest that the corporate governance code has a positive and significant impact on the value relevance of earnings. Moreover this indicates that the relevance of published financial statements has been increased for the investors after the issuance of corporate governance code in year 2002.
Table VIII: Fixed Effects Regression (Robust Standard Errors) Results for Model 1- Value Relevance of Corporate Governance Code
Dependent Variable: Stock Price (SP) Method: Least Square Dummy Variable Regression (LSDV) using 312 Observations Time Series Length: 6 Cross-Sectional Units: 52 R-squared: 0.90 Adjusted R-squared: 0.88 Durbin-Watson Stat: 1.86 F-Statistic: 45.69 P-value(F): 0.000 Coefficient Std. Error t-ratio Const 0.82*** 0.21 3.88 BV 0.25 0.14 1.78 EPS 0.26*** 0.08 3.27 d1 0.38*** 0.03 11.65 ***, denote significance level of 1%
Table IX shows the results of the fixed effects regression for the model 2. The method used is the LSDV, the time series length is 12 years i.e. 6 years before and after the issuance of mandatory adoption of IFRSs by ICAP in 2005. Total observations used in this model are 624 for 52 companies. The R-squared is 0.81 and Adjusted R-squared is 0.79 which shows the high determination power of independent variables. Durbin-Watson Stat is 1.84 which shows that the residuals in this model indicate no serious problem of autocorrelation. The F-Statistic of 46.23 is significant at 1% level which shows the significance of overall model. The coefficients of BV, EPS and d1 are 0.54, 0.27 and 0.13 respectively and all are significant at 1% level. The results suggest that the mandatory adoption of IFRSs has a positive and significant impact on the value relevance of book value and earnings. Furthermore the investors’ relevance regarding published financial statements is increased after the mandatory adoption of IFRSs in 2005 in Pakistan.

Malik and Shah
289
Table IX: Fixed Effects Regression (Robust Standard Errors) Results for Model 2 - Value Relevance of IFRSs Mandatory Adoption
Dependent Variable: Stock Price (SP) Method: Least Square Dummy Variable Regression (LSDV) using 624 Observations Time Series Length: 12 Cross-Sectional Units: 52 R-squared: 0.81 Adjusted R-squared: 0.79 Durbin-Watson Stat: 1.84 F-Statistic: 46.23 P-value(F): 0.000 Coefficient Std. Error t-ratio Const 0.54*** 0.19 2.79 BV 0.54*** 0.12 4.45 EPS 0.27*** 0.07 3.63 d1 0.13*** 0.03 3.81 ***, denote significance level of 1%
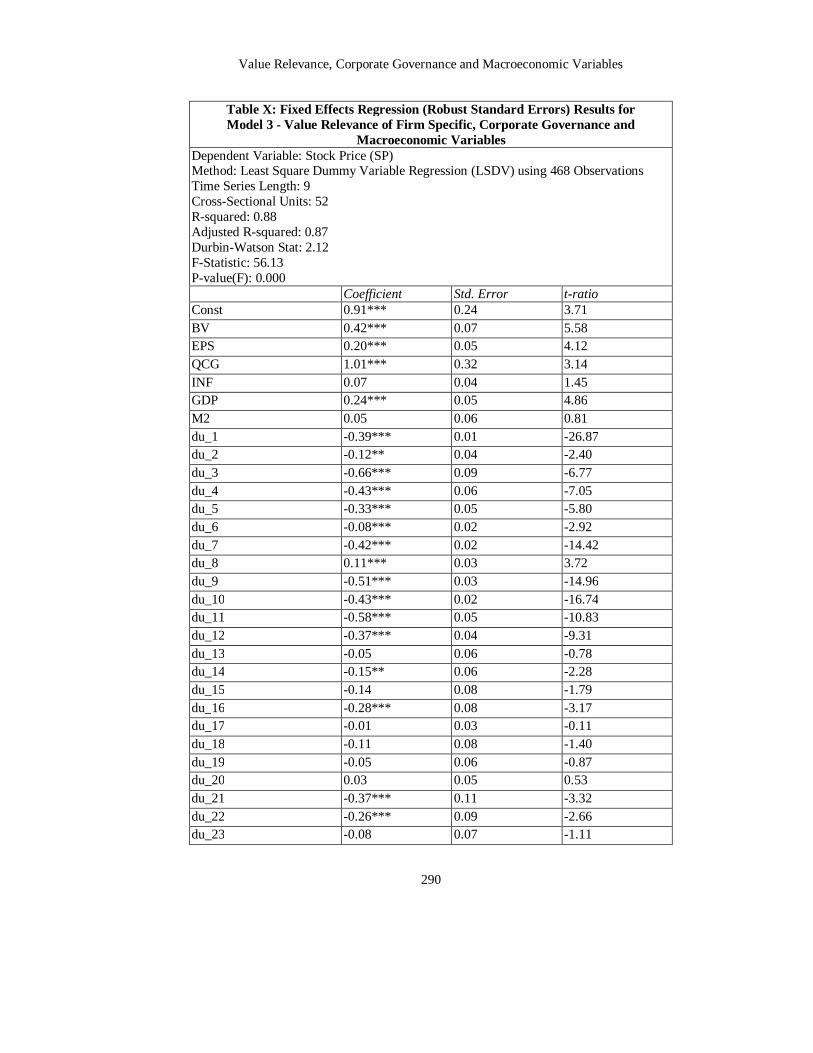
Knowing the increased value relevance after issuance of the corporate governance code and mandatory adoption of IFRSs, a comprehensive model in table X is used to check the value relevance of firm specific, corporate governance and macroeconomic variables. The method used is LSDV, the time series length is 9 years (from 2003 to 2011), and the number of observations is 468 for 52 companies. The R-squared is 0.88 and Adjusted R-squared is 0.87 which shows the high determination power of overall model. The Durbin-Watson Stat is 2.12, which indicates that the residuals do not have a serious autocorrelation problem as the value is close to 2. The F-Statistic of 56.13 is significant at 1% level which shows the significance of overall model. Most of the cross-sectional dummies are significant at 1% and 5% level which indicates the differential intercept among cross-sectional units. The coefficients of BV, EPS, QCG and GDP are 0.42, 0.20, 1.01 and 0.24 respectively and are significant at 1% level. The coefficients of INF and M2 are 0.07 and 0.05 respectively having no statistical significance. The QCG shows the highest and positive impact on stock prices while M2 shows the lowest positive impact.
Value Relevance, Corporate Governance and Macroeconomic Variables
290
Table X: Fixed Effects Regression (Robust Standard Errors) Results for Model 3 - Value Relevance of Firm Specific, Corporate Governance and
Macroeconomic Variables Dependent Variable: Stock Price (SP) Method: Least Square Dummy Variable Regression (LSDV) using 468 Observations Time Series Length: 9 Cross-Sectional Units: 52 R-squared: 0.88 Adjusted R-squared: 0.87 Durbin-Watson Stat: 2.12 F-Statistic: 56.13 P-value(F): 0.000
Coefficient Std. Error t-ratio Const 0.91*** 0.24 3.71 BV 0.42*** 0.07 5.58 EPS 0.20*** 0.05 4.12 QCG 1.01*** 0.32 3.14 INF 0.07 0.04 1.45 GDP 0.24*** 0.05 4.86 M2 0.05 0.06 0.81 du_1 -0.39*** 0.01 -26.87 du_2 -0.12** 0.04 -2.40 du_3 -0.66*** 0.09 -6.77 du_4 -0.43*** 0.06 -7.05 du_5 -0.33*** 0.05 -5.80 du_6 -0.08*** 0.02 -2.92 du_7 -0.42*** 0.02 -14.42 du_8 0.11*** 0.03 3.72 du_9 -0.51*** 0.03 -14.96 du_10 -0.43*** 0.02 -16.74 du_11 -0.58*** 0.05 -10.83 du_12 -0.37*** 0.04 -9.31 du_13 -0.05 0.06 -0.78 du_14 -0.15** 0.06 -2.28 du_15 -0.14 0.08 -1.79 du_16 -0.28*** 0.08 -3.17 du_17 -0.01 0.03 -0.11 du_18 -0.11 0.08 -1.40 du_19 -0.05 0.06 -0.87 du_20 0.03 0.05 0.53 du_21 -0.37*** 0.11 -3.32 du_22 -0.26*** 0.09 -2.66 du_23 -0.08 0.07 -1.11

Malik and Shah
291
du_24 -0.17*** 0.04 -3.59 du_25 0.06 0.03 1.74 du_26 0.16 0.11 1.51 du_27 -0.02 0.04 -0.44 du_28 -0.16*** 0.02 -6.77 du_29 -0.45*** 0.07 -6.35 du_30 -1.10*** 0.15 -7.04 du_31 -0.10 0.06 -1.55 du_32 -0.62*** 0.12 -5.20 du_33 -0.38*** 0.12 -3.11 du_34 -0.51*** 0.03 -13.46 du_35 -0.73*** 0.08 -8.18 du_36 -0.12 0.07 -1.62 du_37 -0.09*** 0.01 -5.12 du_38 0.23*** 0.08 2.69 du_39 0.21*** 0.02 8.20 du_40 0.51*** 0.05 8.80 du_41 0.09 0.04 1.95 du_42 0.28*** 0.08 3.39 du_43 -0.24*** 0.05 -4.25 du_44 -0.02 0.03 -0.80 du_45 -0.37*** 0.04 -8.64 du_46 -0.32*** 0.04 -7.89 du_47 -0.49*** 0.04 -10.02 du_48 0.29*** 0.04 6.71 du_49 -0.08** 0.03 -2.19 du_50 -0.57*** 0.04 -13.42 du_51 0.05*** 0.01 3.91 ***, and ** denote significance level of 1% and 5% respectively.
6. Conclusions and Discussion The capital markets play an important role in the economic development of a country such as, circulation of wealth and provision of investment opportunities. For the proper working of stock market it is necessary that the correct the essential information must be provided to the investors for their effective decision making. There are majorly two types of investors that invest in the stock markets; one is short-term who are more curious about company’s profitability and dividends, secondly there are long-term investors who are more interested in the capital gains. The only way to earn the capital gain is that the stock returns must be increasing. The stock returns increase with the increase in stock prices, this also fulfills the basic motive of financial management system i.e. to increase the wealth of shareholders. If investors successfully determine that the stocks they are purchasing will be profitable in the future, this contributes towards their wealth maximization. For this reason a comprehensive stock price determination model is

Value Relevance, Corporate Governance and Macroeconomic Variables
292
needed. In literature different models of value relevance are there which test the stock price determination power of different variables. This study has suggested a model of stock price determination which considers three major factors affecting stock prices i.e. firm specific, quality corporate governance and macroeconomic variables. The model is valuable for investors when considering these variables in their stock price determination process. Moreover the financial managers would create the value by improving company’s value relevant fundamentals and incorporating quality corporate governance in their financial management system. This study examines the impact of firm specific, macroeconomic and quality corporate governance variables on stock price. Moreover we also tested the value relevance code of corporate governance and mandatory adoption of IFRSs. We used correlation analysis to check the relationship between dependent and independent variables. Moreover the regression analysis is employed to check the determination power of independent variables. Three models are tested; model 1 is used to check the value relevance of corporate governance code, model 2 is used to check the value relevance of IFRSs mandatory adoption and model 3 is used to check the determination power of independent variables. To test model 1 and 2 the Ohlson (1995) model is employed. Different diagnostic tests are used to choose an appropriate panel regression model such as Restricted F-Test, Hausman Test and Wald Test for Group-Wise Heteroscedasticity. Diagnostic tests reveal that fixed effects (robust standard errors) regression is appropriate for each model. Moreover the Durbin-Watson Stat is also used to check the autocorrelation.
Firstly correlation analysis reveals that the correlation coefficient of firm specific fundamentals (BV and EPS) and QCG have positively and significantly correlated with SP. Moreover the correlation coefficients of macroeconomic variables show no statistical significance with the dependent variable. The two independent variables (GDP, EX) are highly correlated with each other and introducing the problem of multicollinearity. In this case we have dropped EX for further analysis. GDP is retained because it covers the impact of most of the macro-variables (e.g. expenditures, oil prices etc.). After correlation analysis and diagnostic tests the regression equations are estimated for each model. Regression estimation for model 1 and 2 concludes that issuance of code of corporate governance and mandatory adoption of IFRSs has a positive and significant impact on the value relevance of book value and earnings. This implies that investors’ relevance is increased for the published financial statements. After confirmation of the significant of model 1 and 2 we then tested the regression estimation for model 3. Finally the results reveal that BV, EPS, QCG and GDP significantly determine stock prices while the regression coefficients of EX and M2 are insignificant. Our results support the previous literature (e.g. Malik et al. 2012; Papadaki and Siougle, 2007; Klein et al. 2005; Gompers et al. 2003; Al-Tamimi et al. 2011; Al-Qenae et al. 2002). The study concludes that firms must focus on enhancing their real assets, earnings capability and adopt good governance practices to increase their share value and ultimately the wealth of shareholders. The macroeconomic indicators are however uncontrollable at individual level but are unavoidable when valuing assets. Investors must incorporate firm specific, corporate governance and macroeconomic variables for the determination of stock prices.

Malik and Shah
293
REFRENCES
Aggarwal, R., Erel, I., Stulz, R.M. and Williamson, R. (2007). Do U.S. firms have the best corporate governance? A cross-country examination of the relationship between corporate governance and shareholder wealth. National Bureau of Economic Research, Working Paper No. 12819. Akbar, M., Ali, S. and Khan, M.F. (2012). The relationship of stock prices and macroeconomic variables revisited: evidence from Karachi stock exchange. African Journal of Business Management, 6(4), 1315-1322. Al-Qenae, R., Carmen, L. and Bob, W. (2002). The information content of earnings on stock prices: the Kuwait Stock Exchange. Multinational Finance Journal, 6(3), 197-221. Al-Tamimi, H.A.H., Alwan, A.A. and Rahman, A.A.A. (2011). Factors affecting stock prices in the UAE financial markets. Journal of Transnational Management, 16(1), 3-19. Amir, E. and Lev, B. (1996). Value-relevance of nonfinancial information: The wireless communications industry. Journal of Accounting and Economics, 22, 3-30. Bailey, W. (1990). U.S. money supply announcements and Pacific Rim stock markets: evidence and implications. Journal of International Money and Finance, 9(3), 344–356. Baillie, T.R. and Selover, D.D. (1987). Co-integration and model of exchange rate determination. International Journal of Forecasting, 3, 43–51. Bauer, R., Gunster, N. and Otten, R. (2004). Empirical evidence on corporate governance in Europe: the effect on stock returns, firm value and performance. Journal of Asset Management, 5, 91-104. Bloomfield, J.R. (2002). The incomplete revelation hypothesis and financial reporting. Accounting Horizons, 16(3), 233-243. Brown, D.L. and Caylor, L.M. (2006). Corporate governance and firm valuation. Journal of Accounting and Public Policy, 25(4), 409-434. Callao, S., Jarne, J. and Lainez, J. (2007). Adoption of IFRS in Spain: effect on the comparability and relevance of financial reporting. Journal of International Accounting, Auditing and Taxation, 16(2), 148-178. Chen, C.J.P., Chen, S. and Su, X. (2001). Is accounting information value-relevant in the emerging Chinese market? Journal of International Accounting, Auditing and Taxation, 10(1), 1-22. Collins, D., Pincus, M. and Xie, X. (1999). Changes in value-relevance of earnings and book values over the past forty years. Journal of Accounting and Economics, 24, 39-67. Davis-Friday, P.Y., Eng, L.L. and Liu, C.S. (2006). The effects of the Asian crisis, corporate governance and accounting system on the valuation of book value and earnings. The International Journal of Accounting, 41, 22-40. Feltham, G.A. and Ohlson, J.A. (1995). Valuation and clean surplus accounting for operating and financial activities. Contemporary Accounting Research, 11, 689-731.

Value Relevance, Corporate Governance and Macroeconomic Variables
294
Feltham, G.A. and Ohlson, J.A. (1996). Uncertainty resolution and the theory of depreciation measurement. Journal of Accounting and Research, 34(2), 209-234. Fiador, V.O. (2013). Corporate governance and value relevance of financial information: evidence from the Ghana Stock Exchange. Corporate Governance, 13(2), 208-217. Florou, C. and Chalevas, C. (2010). Key accounting value drivers that affect stock returns: evidence from Greece. Managerial Finance, 36(11), 921-930. Foerster, S.R. and Huen, B.C. (2004). Does corporate governance matter to Canadian investors? Canadian Investment Review, Fall, 19-25. Francis, J., LaFond, R., Olsson, M.P. and Schipper, K. (2004). Costs of equity and earnings attributes. Accounting Review, 79, 967-1010. Gallizo, J.L. and Salvador, M. (2006). Share prices and accounting variables: a hierarchical Bayesian analysis. Review of Accounting and Finance, 5(3), 268-278. Gaston, C.S., Garcia, C.F., Jarne, J.I.J., and Gadea, L.A.L. (2010). IFRS adoption in Spain and the United Kingdom: Effects on accounting numbers and relevance. Advances in Accounting: Incorporating Advances in International Accounting, 26(2), 304-313. Ghartey, E.E. (1998). Monetary dynamics in Ghana: evidence from cointegration, error correction modelling, and exogeneity. Journal of Development Economics, 57(2), 473–486. Gompers, P., Ishii, J. and Metrick, A. (2003). Corporate governance and equity prices. The Quarterly Journal of Economics, 118, 107-155. Gordon, M.J. (1959). Dividends, Earnings, and Stock Prices. The Review of Economics and Statistics, 41(2), 99-105. Gunasekarage, A., Pisedtasalasai, A. and Power, M.D. (2004). Macroeconomic influence on the stock market: evidence from an emerging market in South Asia. Journal of Emerging Market Finance, 3(3), 285-304. Gupta, P.P., Kennedy, D.B. and Weaver, S.C. (2009). Corporate governance and firm value: Evidence from Canadian capital markets. Corporate Ownership and Control, 6(3), 293-307. Hsu, C.C., Chao, C.F. and Chen, M.C. (2013). The value relevance of the development of a corporate governance system. International Journal of Economics and Business Research, 5(3), 302-318. Ismail, A. (2006). Is economic value added more associated with stock return than accounting earnings? The UK evidence. International Journal of Managerial Finance, 2(4), 343-353. Kadri, H.M., Aziz, A.R. and Mohamed, I.K. (2009). Value relevance of book value and earnings: evidence from two different financial reporting regimes. Journal of Financial Reporting & Accounting, 7(1), 1-16. Kahneman, D., Knetsch, L.J., and Thaler, H.R. (1991). Anomalies: The Endowment Effect, Loss Aversion, and Status Quo Bias. The Journal of Economic Perspectives, 5 (1), 193-206. Klapper, F.L. and Love, I. (2002). Corporate Governance, Investor Protection and Performance in Emerging Markets. World Bank Working Paper 2818.

Malik and Shah
295
Klein, P., Shapiro, D. and Young, J. (2005). Corporate governance, family ownership and firm value: The Canadian evidence. Corporate Governance: An International Review, 13(6), 769-784. Kwon, S.C. and Shin, S.T. (1999). Cointegration and causality between macroeconomic variables and stock market returns. Global Finance Journal, 10(1), 71–81. Maher, M. and Andersson, T. (1999). Corporate governance: Effects on firm performance and economic growth. Organization for Economic Co-operation and Development. [Online] Available: http://www.oecd.org/dataoecd/10/34/2090569.pdf (October 10, 2011). Malgharni, A.M., Soomasundaram, N.R. and Muthaiyah, S. (2010). Non-financial performance for firm’s evaluation. European Journal of Economics, Finance and Administrative Sciences, 23, 123-138. Malik, M.F., Qureshi, M.U. and Azeem, M. (2012). Determination of share price: evidence from Karachi stock exchange. The Romanian Economic Journal, 15(43), 95-112. Meese, A.R., and Rogoff, K. (1983). Empirical exchange rate models of the seventies: are any fit to survive? Journal of International Economics, 14, 3–24. Mookerjee, R. and Yu, Q. (1997). Macroeconomic variables and stock prices in a small open economy: the case of Singapore. Pacific-Basin Financial Journal, 5, 377-388. Nieh, C.C. and Lee, C.F. (2001). Dynamic relationship between stock prices and exchange rates for G-7 countries. The Quarterly Review of Economics and Finance, 41, 477-490. Ohlson, J.A. (1995). Earnings, book values, and dividends in equity valuation. Contemporary Accounting Research, 11, 661-687. Ohlson, J.A. (1999). On transitory earnings. Review of Accounting Studies, 4(3), 144-162. Papadaki, A. and Siougle, G. (2007). Value relevance of price, earnings and book value in the Athens stock exchange. Managerial Finance, 33(5), 309-320. Patel, A.S. and Dallas, G. (2002). Transparency and disclosures: Overview of methodology and study results United States. Standard & Poor’s. USA. Ralph, U.I., and Eriki, P.O. (2001). Inflation and stock prices behavior: evidence from Nigerian stock market. Journal of Financial Management and Analysis, 14(1), 1-10. Sadeghi, M. (1992). Stock market response to unexpected macroeconomic news: the Australian evidence. IMF Working Paper, 61, 9. Shah, S.Z.A., Butt, S.A., and Hasan, A. (2009). Corporate governance and earnings management an empirical evidence from Pakistani listed companies. European Journal of Scientific Research, 26(4), 624-638. Tsoukalas, D. (2003). Macroeconomic factors and stock prices in the emerging Cypriot market. Managerial Finance, 29(4), 87-92. Wang, M. and Hussainey, K. (2013). Voluntary forward-looking statements driven by corporate governance and their value relevance. Journal of Accounting and Public Policy, 32(3), 26-49.
Value Relevance, Corporate Governance and Macroeconomic Variables
296
Wang, M.C. (2013). Value relevance on intellectual capital valuation methods: the role of corporate governance. Quality and Quantity, 47(2), 1213-1223. Wolff, P.C.C. (1988). Exchange rates, innovations and forecasting. Journal of International Money and Finance, 7, 49–61. Zhao, Q.X. (1999). Stock prices, inflation and output: evidence from China. Applied Economic Letters, 6(8), 509-511.
Appendix
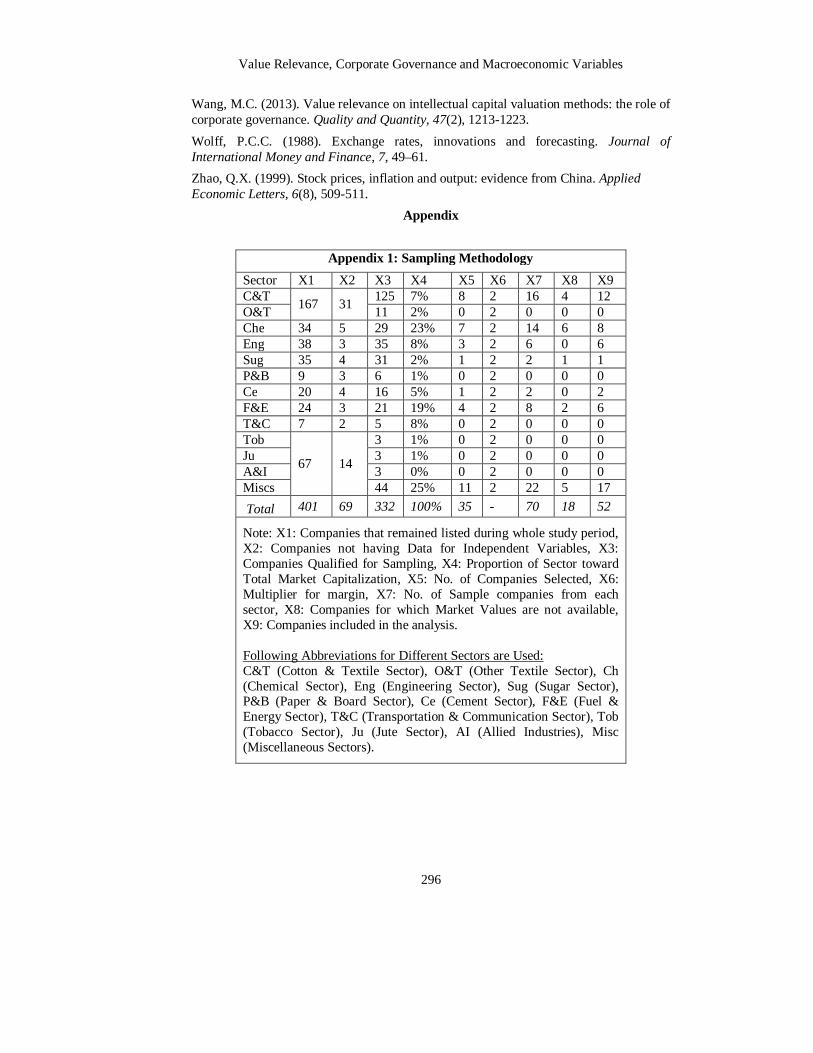
Appendix 1: Sampling Methodology Sector X1 X2 X3 X4 X5 X6 X7 X8 X9 C&T 167 31 125 7% 8 2 16 4 12 O&T 11 2% 0 2 0 0 0 Che 34 5 29 23% 7 2 14 6 8 Eng 38 3 35 8% 3 2 6 0 6 Sug 35 4 31 2% 1 2 2 1 1 P&B 9 3 6 1% 0 2 0 0 0 Ce 20 4 16 5% 1 2 2 0 2 F&E 24 3 21 19% 4 2 8 2 6 T&C 7 2 5 8% 0 2 0 0 0 Tob
67 14
3 1% 0 2 0 0 0 Ju 3 1% 0 2 0 0 0 A&I 3 0% 0 2 0 0 0 Miscs 44 25% 11 2 22 5 17 Total 401 69 332 100% 35 - 70 18 52
Note: X1: Companies that remained listed during whole study period, X2: Companies not having Data for Independent Variables, X3: Companies Qualified for Sampling, X4: Proportion of Sector toward Total Market Capitalization, X5: No. of Companies Selected, X6: Multiplier for margin, X7: No. of Sample companies from each sector, X8: Companies for which Market Values are not available, X9: Companies included in the analysis. Following Abbreviations for Different Sectors are Used: C&T (Cotton & Textile Sector), O&T (Other Textile Sector), Ch (Chemical Sector), Eng (Engineering Sector), Sug (Sugar Sector), P&B (Paper & Board Sector), Ce (Cement Sector), F&E (Fuel & Energy Sector), T&C (Transportation & Communication Sector), Tob (Tobacco Sector), Ju (Jute Sector), AI (Allied Industries), Misc (Miscellaneous Sectors).

Malik and Shah
297
Appendix II: Scoring Criteria for Corporate Governance Variables - Adopted Shah et al. (2009)
1. Ownership Structure:
1.1. Ownership Concentration 0%------------20% 21%----------40% 41%----------60% 61&----------80% 81% and above. 1.2. Managerial Ownership 0%------------20% 21%----------40% 41%----------60% 61&----------80% 81% and above.
Score
5 4 3 2 1
Score 5 4 3 2 1
2. Independence: 2.1. Board Independence 0%------------20% 21%----------40% 41%----------60% 61&----------80% 81% and above. 2.2. Audit Committee Independence 0%------------20% 21%----------40% 41%----------60% 61&----------80% 81% and above.
Score 1 2 3 4 5
Score 1 2 3 4 5
Note: Ownership weight = 45% , Independence weight = 55%


