Value Oriented IT Process Design and Definition - PNSQC
13
____________________________________________________________________________________ Excerpt from PNSQC 2013 Proceedings PNSQC.ORG Copies may not be made or distributed for commercial use Page 1 Value Oriented IT Process Design and Definition: Integrating Customer Value into Process Quality Shivanand Parappa and Mangesh Khunte [email protected] , [email protected] Abstract Today’s competitive environment and increased customer demands require companies to respond quickly and effectively to market opportunities. Business organizations are leveraging Information Technology (IT) solutions as a means to accomplish the business objectives and to fulfill the growing customer demands. As business always expects significantly higher return and value on investment made for IT, it is critical for IT division to demonstrate the quality and value added deliverables. Hence, it is extremely important to understand the concept of value from a process design and definition perspective while formulating IT processes that create and deliver value to the business and customers. This paper details a framework named Value Oriented Process Paradigm (VOPP) that provides adoptable guidance for designing value oriented IT processes and integrating customer value with process quality. This proven framework has been developed by leveraging the lean concepts and value creating techniques. This paper focuses on value analysis in line with Dr. Genichi Taguchi’s loss function theory and opportunities for creation of value utilizing the lean principles while defining the processes. This paper details a technique named Potential Waste and Impact Analysis (PWIA) that provides guidance towards identifying potential waste during process definition and prioritizing them to put in place controls to reduce or eliminate them. The approach and concepts detailed in this paper would be useful for process consultants involved in process design and definition. Biography Shivanand Parappa is a Senior Consultant at Cognizant Technology Solution, currently working with Process and Quality Consultancy team. He has over 16 years of experience in Manufacturing / Software Quality Management and Consultancy. He has extensively worked on driving process improvement projects through Six Sigma and Lean methodologies to deliver tangible results. Shivanand holds a Bachelor’s degree in Industrial Engineering and a Master’s degree in Production Engineering. He is a certified professional with Six Sigma Black Belt (DMAIC and DFSS), PMP and PRINCE2 Practitioner. Mangesh Khunte is a Senior Manager – Consulting at Cognizant Technology Solution, currently working with Process and Quality Consultancy team. He has a total professional experience of more than 15 years across process consulting and project delivery areas. He has considerable experience and proven expertise in process consulting, interfacing with clients to get business, perform business analysis. Mangesh holds a Bachelor’s degree in Electronics and Telecommunications and a Master’s degree in Marketing. He is a PMP certified Project Manager and PMI-ACP SM.
Transcript of Value Oriented IT Process Design and Definition - PNSQC

____________________________________________________________________________________
Excerpt from PNSQC 2013 Proceedings PNSQC.ORG Copies may not be made or distributed for commercial use Page 1
Value Oriented IT Process Design and Definition: Integrating Customer Value
into Process Quality
Shivanand Parappa and Mangesh Khunte
[email protected] , [email protected]
Abstract
Today’s competitive environment and increased customer demands require companies to respond quickly and effectively to market opportunities. Business organizations are leveraging Information Technology (IT) solutions as a means to accomplish the business objectives and to fulfill the growing customer demands. As business always expects significantly higher return and value on investment made for IT, it is critical for IT division to demonstrate the quality and value added deliverables. Hence, it is extremely important to understand the concept of value from a process design and definition perspective while formulating IT processes that create and deliver value to the business and customers.
This paper details a framework named Value Oriented Process Paradigm (VOPP) that provides adoptable guidance for designing value oriented IT processes and integrating customer value with process quality. This proven framework has been developed by leveraging the lean concepts and value creating techniques. This paper focuses on value analysis in line with Dr. Genichi Taguchi’s loss function theory and opportunities for creation of value utilizing the lean principles while defining the processes. This paper details a technique named Potential Waste and Impact Analysis (PWIA) that provides guidance towards identifying potential waste during process definition and prioritizing them to put in place controls to reduce or eliminate them. The approach and concepts detailed in this paper would be useful for process consultants involved in process design and definition.
Biography
Shivanand Parappa is a Senior Consultant at Cognizant Technology Solution, currently working with Process and Quality Consultancy team. He has over 16 years of experience in Manufacturing / Software Quality Management and Consultancy. He has extensively worked on driving process improvement projects through Six Sigma and Lean methodologies to deliver tangible results. Shivanand holds a Bachelor’s degree in Industrial Engineering and a Master’s degree in Production Engineering. He is a certified professional with Six Sigma Black Belt (DMAIC and DFSS), PMP and PRINCE2 Practitioner.
Mangesh Khunte is a Senior Manager – Consulting at Cognizant Technology Solution, currently working with Process and Quality Consultancy team. He has a total professional experience of more than 15 years across process consulting and project delivery areas. He has considerable experience and proven expertise in process consulting, interfacing with clients to get business, perform business analysis. Mangesh holds a Bachelor’s degree in Electronics and Telecommunications and a Master’s degree in Marketing. He is a PMP certified Project Manager and PMI-ACP
SM.

____________________________________________________________________________________
Excerpt from PNSQC 2013 Proceedings PNSQC.ORG Copies may not be made or distributed for commercial use Page 2
1. Introduction
Business organizations are leveraging Information Technology (IT) solutions as a means to accomplish the business objectives and to fulfill the growing customer demands. Business needs are formulated based on the customer requirements that come from customers in terms of their business needs. These needs are fulfilled by providing value add solutions through appropriate business and IT processes. The business and customer requirements are triggers for producing IT solutions that enable business to achieve its objectives and customer satisfaction. Timely delivery of IT solutions assists in enhancing business efficiency, improving quality of services and products and increasing the value provided to the customer.
Process can help an organization’s workforce to meet business objectives by helping them to work smarter, not harder, and with improved consistency [CMMI-DEV v1.3 2010]. Processes are critical entities in an organization and its operational success is tied with the effective performance of the processes. One of the never ending challenges for an organization is to act on customer requirements and translate them into product or service with agreed quality attributes at low cost. The actions involved in conversion of the requirements to products/services are enabled and supported by well-defined processes coupled with adequate resources. Processes can be grouped and classified into: core; enabling; governance; or support processes. This classification is only to bring the distinctions in the organization process asset instead of indicating its priority or ranking. Each of the organizational processes has equal importance with respect to achieving the objectives and goals of the organization [Shivanand Parappa 2012].
2. Value Definition and Analysis
2.1 Value versus Quality
The perception of value varies based on the customer’s needs and changes in their business objectives. Also, we can see in the Kano model (a tool used for categorizing the customer needs into basic, performance and delighters) [Basem and David 2005] that the basic and performance needs are more sensitive to the value as compared to the delighter needs. Customers expect more value from the basic and performance needs. Value is always defined from the customer’s perspective. The customer value perception can be derived from the requirement attributes like speed & responsiveness, accuracy & quality, flexibility, capacity, compliance, stability & reliability, availability, security & risk, etc. From the Lean concept perspective, value is “a capability provided to a customer at the right time at an appropriate price, as defined in each case by the customer.” If we take a closer look at the value attributes, one can visualize that quality is an inherent characteristic within the value attributes. For example, the value perception against the requirement attribute ‘capacity’ in a service provider company will have a negative impact on quality of service if the service quality character fails in terms of not providing services within the agreed SLA.
On the other hand, the quality is defined as “Degree to which a set of inherent characteristics fulfills requirements” [ISO-9000:2005]. In this definition: degree refers to a level to which a product or service satisfies the requirements, inherent characteristics are those features that are a part of the product and are responsible to achieve satisfaction, and requirements refer to the needs of customer, needs of organization & those of other interested parties (e.g. regulatory bodies, suppliers, employees, community & environment). The quality of products or services can be determined by comparing a set of inherent characteristics with a set of requirements. The quality depends on a set of inherent characteristics and a set of requirements and how well the former complies with the latter.
It is apparent that it is the customer who defines the value of a product or service by making an analysis of the performance of the product/service relative to its cost. On the other hand, the quality of a product or service is always in the hands of the organization, governed by the processes that are adopted by organization and it depends upon the ability of an organization to provide a product or service that gives a performance that customer is seeking.
____________________________________________________________________________________
Excerpt from PNSQC 2013 Proceedings PNSQC.ORG Copies may not be made or distributed for commercial use Page 3
2.2 Understanding the Process Value Creation
In order to produce quality and value added product or service, it is necessary to define the value oriented processes that enable the value added outputs with desired quality. So what is the qualification of the value oriented process? A value oriented process should produce the required outputs, without defects, as efficiently as possible, and at the right time [Dr. Hugh L. McManus 2005]. Value oriented processes should enable the organizations to provide value to the internal and external customers and to its stakeholders as well. To ensure this, value must be understood in two different contexts: the value of the process output to the entire organization and the creation of that value during carrying out the individual sub-processes/tasks that make up the process.
In an organization, the processes are organized based on the core operations, support functions and line of businesses. These processes collectively produce the outputs to meet the customer requirements. Customer requirements and expectations are gathered from market survey, research, and customer interactions and converted into products or services with the specified attributes to be provided back to the customers. During the formulation of customer requirements, the customer value/perception is also captured and carried all along the conversion process. Each of the processes that are involved in producing the services or products are responsible for ensuring that the customer value is integrated with the process outputs along with specified quality. The value is created along with quality outputs during the execution of the processes and transformed to the downstream processes for their consumption and to enable them to add value to their outputs and subsequently the final product.
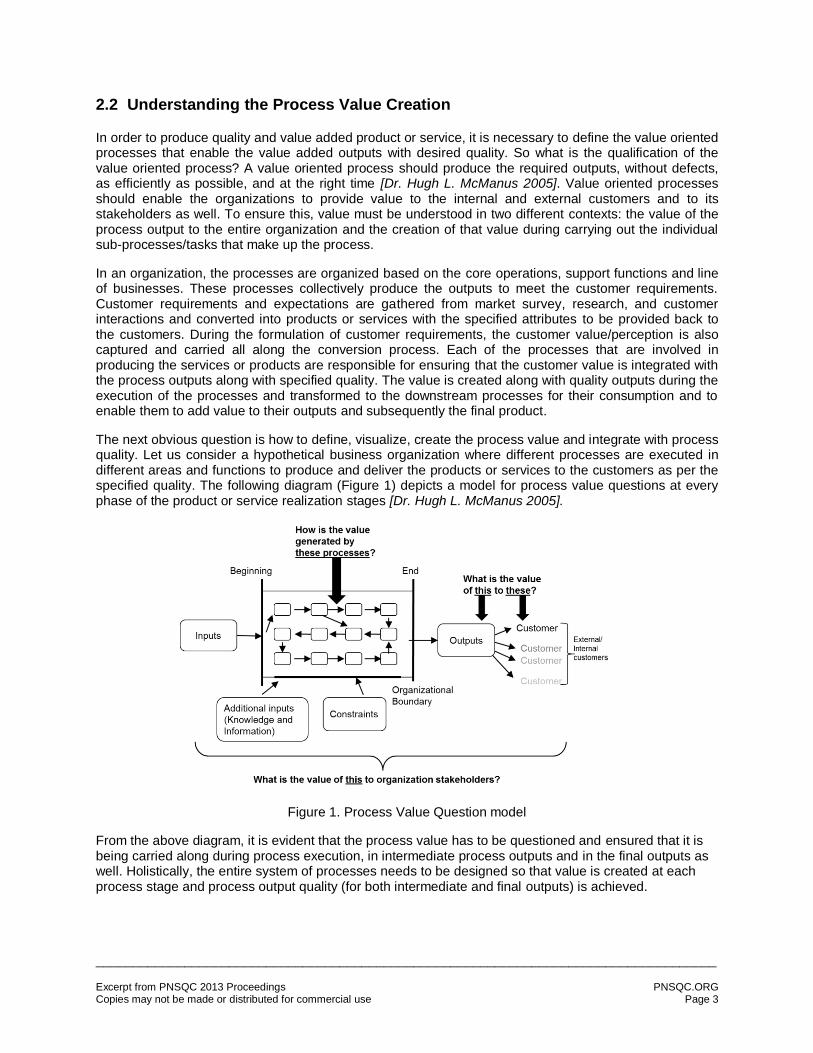
The next obvious question is how to define, visualize, create the process value and integrate with process quality. Let us consider a hypothetical business organization where different processes are executed in different areas and functions to produce and deliver the products or services to the customers as per the specified quality. The following diagram (Figure 1) depicts a model for process value questions at every phase of the product or service realization stages [Dr. Hugh L. McManus 2005].
Figure 1. Process Value Question model
From the above diagram, it is evident that the process value has to be questioned and ensured that it is being carried along during process execution, in intermediate process outputs and in the final outputs as well. Holistically, the entire system of processes needs to be designed so that value is created at each process stage and process output quality (for both intermediate and final outputs) is achieved.

____________________________________________________________________________________
Excerpt from PNSQC 2013 Proceedings PNSQC.ORG Copies may not be made or distributed for commercial use Page 4
2.3 Sources of Process Value Loss
From the Lean perspective, the process value is significantly impacted by the waste generated during individual process execution and this subsequently leads to a greater value loss in the entire enterprise value chain. In order to achieve the maximum value for the process, the waste has to be identified and eliminated from the process in all of its forms during process definition. The seven forms of waste sources in the IT process ecosystem have been tabulated in the following table (Figure 2). These wastes have to be analyzed, addressed and eliminated through appropriate process controls during defining and designing the IT processes.
Type of Waste Examples in IT
1. Over production
Adding extra features to functionalities.
While designing and developing an application, adding more features which are not asked by customer/requester. For example, in search functionality, including extra criteria/filters for search function in addition to what customer asked for. This leads to more test cases and requires more testing effort.
2. Over processing
Performing extra processing steps
During application development through SDLC, performing extra processes like multiple reviews, checks, etc. Examples of extra processes include all kinds of requirements, analysis, design, and test documents that no-one will ever read, the endless meetings with more people than are really needed.
3. Defects Defects not caught by reviews/tests
Defects not captured in early stages due to ineffective reviews and testing. The longer a defect is allowed to stay in the system, the more it costs to fix it. Also, defects leads to do a costly recall, repeat a lot of manual testing, revise the documentation, etc.
4. Motion
Effort in finding information
Spending more time and effort in getting/ finding required information and clarification. Searching of the documents. It occurs when we need to go somewhere else to get information/clarifications- if the customer or an expert is not at hand when we need answers to questions or if the team is spread out over multiple offices, floors, buildings or even time-zones.
5. Waiting
Waiting for resources, information, approvals. Mismatch between the in-flow of tasks and the production capability
Most of the features to be included in an application/ software spend their lives sitting in queues, waiting for the next Change Control Board meeting, living in Requirements documents, waiting in Analysis documents before being implemented, waiting for system integration, waiting for the testers to test them, or waiting in a bug tracking system to be corrected or waiting for the next bi-annual deployment window.
6. Transportation
Too many handoffs related to work and information
Handoffs can be identified as assigning people to multiple projects which is a source of waste. Every time software developers switch between tasks, a significant switching time is incurred as they get their thoughts gathered and get into the flow of the new tasks. Anytime you hand a deliverable off to a different party, there is some loss in the transfer of knowledge 1. Developer hands off to another developer. 2. Developers hand off code to testers to test 3. Handing the code over to deployment teams 4. Handing off to customers.
7. Inventory Partially done work
In software development, inventory is anything that you’ve started and you haven’t gotten done. It’s “partially done” work. Partially done work is essentially work-in-progress. Until this work is done, you don't know that there are quality issues i.e. you don't know that the customer will be happy. So the idea should be to complete work-in-progress as soon as possible i.e. minimize work-in-progress as much as possible. 1. Code that is completed but not checked in to your version control system 2. Undocumented code 3. Untested code (both unit tests and functional tests)
Figure 2. Seven Forms of Waste in Information Technology

____________________________________________________________________________________
Excerpt from PNSQC 2013 Proceedings PNSQC.ORG Copies may not be made or distributed for commercial use Page 5
2.4 IT Process Value Analysis
Before moving to process value analysis, let us understand how the customer value can be visualized and mapped with IT processes. Let us consider a hypothetical software service organization where the IT solutions are being provided the customers to meet their business needs and run the business. The customer business needs and software requirements are captured in terms of functional and non-functional requirements by the software solution provider organization. These requirements are processed through various processes and converted into useful software as per the customer specifications. The following Figure 3 depicts the schematic diagram of value attributes that need to be addressed during execution of the processes.
Figure 3. IT Process Value Attributes
During the process execution, it is necessary to measure the performance of the processes through appropriate performance metrics to ensure quality and value of the process outputs. For example, during execution of testing process, the performance of the test case preparation sub-process must be measured in terms of appropriate metrics like schedule, review defects and productivity.
According to Dr. Genichi Taguchi’s quality loss function theory [James and William, 2008], any deviation from a quality characteristic’s target level results in a loss; a higher quality characteristic measurement is one that results in minimal variation from the target level. Specifically, if a quality characteristic measurement is the same as the target value, the loss is zero, otherwise there exists value loss that can be measured using a quadratic function. Extension of this theory to process performance characteristics of a process provides an insight on process value analysis. That means a process or sub-process that is responsible for achieving product quality results in process value loss if it fails to perform at its target level of performance metric. Specifically, in order to attain maximum process output value, it has to be executed with zero deviation from target value.
In order to achieve maximum process value, the process should perform at its target level of identified performance metrics. Any deviation of performance metric from its target level indicates the existence of factors impacting the output value. These factors are due to the presence of waste in the process that hampers the process execution and there by impacts the process output value.
Let us consider the scenarios where the process performance targets are different for different processes depending on the process output objectives. The following figures (Figures 4 to 6) depict various scenarios in which the value zones are positioned with respect to the different locations of performance metrics. The ‘X’ axis represents the performance metric location and the ‘Y’ axis represents the location of process value against the corresponding performance metric. As the performance metric deviates from

____________________________________________________________________________________
Excerpt from PNSQC 2013 Proceedings PNSQC.ORG Copies may not be made or distributed for commercial use Page 6
the target, the process value start decreasing and reaches to minimum value at the given limits and beyond the limits results into total value loss. This value loss is due to the presence of process waste that impacts the performance and quality of process outputs. When plotted the locus of deviation points in a Cartesian coordinate plane, the resulting graph is a parabola (quadratic function), with maximum value when the performance metric is equal to the target ‘T’.
Scenario 1: Target is the Best
Figure 4. Target is the Best
Scenario 2: Lower the Better
Figure 5. Lower the Better

____________________________________________________________________________________
Excerpt from PNSQC 2013 Proceedings PNSQC.ORG Copies may not be made or distributed for commercial use Page 7
Scenario 3: Higher the Better
Figure 6. Higher the Better
3. Approach for Value Oriented Process Design
The following diagram depicts an approach that has been used to develop the detailed methodology for designing and defining the value oriented IT processes. This approach highlights the components that need to be considered during process definition.
Figure 7. Approach for Value Oriented Process Design

____________________________________________________________________________________
Excerpt from PNSQC 2013 Proceedings PNSQC.ORG Copies may not be made or distributed for commercial use Page 8
In the Figure 7, business needs and customer value (left side boxes) are critical and important inputs for formulating IT processes that create and deliver value to the business and customers. The IT process ecosystem consists of process groups (indicated in four boxes within a big box with dotted boundaries in the center) that include the processes responsible collectively for producing IT solutions. However, the business processes (the box outside the IT process ecosystem) will have interactions with the IT process groups to ensure the business and customer values are integrated with IT processes. The industry process standards and models (bottom box) like ISO, CMMI and ITIL provide inputs for adopting best practices and process compliance requirements while defining the processes. The Value Oriented Process Paradigm (VOPP) (top box, discussed in detail in following sections) provides a structured methodology including phases and activities to define value oriented processes.
4. Value Oriented Process Paradigm (VOPP)
4.1 Value Based Process Definition Model
In this model (Figure. 8), the traditional process definition approach has been enhanced by addressing value creation concept during defining the processes to produce value add outputs with specified quality. This proven process definition model consists of four phases and the objective of each phase is achieved by performing various activities and tasks in that particular phase.
Figure 8. Value Based Process Definition Model
The phases of this methodology detailed out in the following paragraphs:
Qualifying Phase: This is the first phase of the model, which includes the activities to set up preliminary requirements for process definition. The objective of this phase is to establish scope and objectives of the proposed process and define the process value. The process boundaries and objectives are formulated in this phase and corresponding outputs are determined. The process value enablers are derived based on the business/customer value and mapped with the process outputs.
Organizing Phase: This is the second phase of the model with a focus on corroborating the information and inputs that required for process definition. The objective of this phase is to identify and gather required information and mobilize resources. In this phase, the suppliers, stakeholders and customers of

____________________________________________________________________________________
Excerpt from PNSQC 2013 Proceedings PNSQC.ORG Copies may not be made or distributed for commercial use Page 9
the process outputs are identified. The inputs, infrastructure, tools and resources are assessed and qualified for using them during the process definition. The interfacing is established with other processes as required.
Constructing: This is the third phase of the model in which the process definition is carried out by using the information and resources from the previous phases. The objective of this phase is to design and develop process architecture with a value proposition. The tasks, activities and steps are defined, and the sequence and interfaces of the activities are established. The process is critically evaluated from the value creation and waste elimination perspective by a technique called ‘Potential Waste and Impact Analysis (PWIA)’ highlighted with a circle in the Figure 8. This technique is discussed in detail under subsection 4.2. Appropriate actions are identified to eliminate potential waste in process and suitable controls are incorporated as part of the process definition. The associated process performance metrics are identified and defined to monitor the performance of the process and its outputs.
Validating: This is the fourth and final phase of the model, which includes the activities for piloting and implementing the defined process. The objective of this phase is to pilot and implement the defined processes and to refine the processes as required. The defined processes are piloted in the selected area and the outputs and performance are assessed against the identified value and quality. Based on the results, the processes are refined and fine-tuned before the rollout and implementation across the process groups.
4.2 Potential Waste and Impact Analysis (PWIA) Tool
This tool is developed to identify the potential waste during process definition that affects the process value and thereby impact the quality of process outputs. The objective of this technique is to identify and assess the waste, and to identify and incorporate the controls to eliminate or reduce the impact of waste on process value during process definition stage itself.
Figure 9. Potential Waste and Impacts Analysis (PWIA)
The usage of the above tool is as described below:
Column 1- Key Process Step: Indicate the name of process activity or step
Column 2- In what ways can the Process Step or Input produce waste? : Mention various possible ways this step or inputs can produce waste

____________________________________________________________________________________
Excerpt from PNSQC 2013 Proceedings PNSQC.ORG Copies may not be made or distributed for commercial use Page 10
Column 3- Which type of waste? : Mention the type of waste. Select the types of waste from the 7 types of waste (Transportation/Hand-offs, Inventory, Motion, Waiting, Overproduction, Over processing and Defects)
Column 4- Potential Waste Effects: Mention the impacts on the process performance, quality of outputs and subsequent processes
Column 5- Intensity (INT): Assess the intensity on scale 1 – 10 and mention that how severe is the waste impact to process performance and quality of outputs
Column 6- Potential Causes: Mention the potential causes for the identified waste
Column 7- Frequency (FRE): On the scale 1 – 10, indicate the rating on how often does cause or waste may occur
Column 8- Current Controls: Mention what the current controls are e.g. checklists and procedures that prevent either the cause or waste
Column 9- Controllability (CON): On the scale 1 – 10, indicate the rating on how well the planned controls prevent the cause or waste
Column 10- Waste Priority Number (WPN): Calculate the product of the ratings of column 5, column 7 and column 9 and mention the product number (WPN = INT * FRE * CON)
Column 11- Additional actions/Controls Recommended: Provide the additional actions/controls recommended for reducing the occurrence of the cause, or improving controllability for higher WPNs
Column 12- Action Owner and Due Date: Mention the names of persons responsible for the actions and target dates for completion
Column 13- Actions Taken: Provide status of actions/ controls incorporated in process design/ definition
The identified potential wastes are prioritized based on the Waste Priority Numbers by arranging them from highest to lowest. The highest WPNs will be given priority while developing and incorporating the controls to reduce/eliminate the process waste.
4.3 Case Study- Usage of Potential Waste and Impact Analysis (PWIA) Tool
In this section, usage of PWIA tool during the process definition using Value Oriented Process Paradigm (VOPP) framework for an IT division of a large Insurance client at one of its global locations is elaborated
Scope of the engagement: To define and implement the processes of service operation life cycle stage of ITIL framework
Client: One of the leading Insurance Providers.
Process in scope: Incident Management Process, Investigation and Diagnosis Subprocess
Approach: During this process definition engagement, VOPP framework is leveraged for Incident Management process definition. The process consultants have referred to all the phases of the VOPP framework and performed the activities mentioned in each of the phases to produce the process package (relevant artifacts that required completing the process definition). The PWIA tool has been extensively used to establish appropriate controls to reduce process waste and thereby to ensure that the process value and output quality is integrated together before implementation and roll out of the defined process.
Sample Artifacts: Following are the two sample artifacts Process Tree and PWIA worksheet from Organizing and Constructing phases of VOPP framework respectively.

____________________________________________________________________________________
Excerpt from PNSQC 2013 Proceedings PNSQC.ORG Copies may not be made or distributed for commercial use Page 11
1. Process Tree: The following figure (Figure 10) depicts on how the subprocess ‘Investigation and Diagnosis’ is rolling up to the IT Process Group ‘IT Service Support Management’. The objective of this exercise to understand how and which of the upstream components/processes will be impacted (either positive or negative) by the performance and output quality of the subprocess ‘Investigation and Diagnosis’
Figure 10. Process Tree
2. PWIA Worksheet: The following figure (Figure 11) depicts the snapshot of the PWIA worksheet created to identify the process waste and create relevant controls to put in place while designing and defining the subprocess ‘Investigation and Diagnosis’. Column 10 contains the Waste Priority Number (WPN) for each of the waste mode and the top 3 WPNs are circled for prioritization purpose. Column 11 contains the recommended additional process controls/actions to eliminate/reduce the waste.

____________________________________________________________________________________
Excerpt from PNSQC 2013 Proceedings PNSQC.ORG Copies may not be made or distributed for commercial use Page 12
Figure 11. PWIA Worksheet
5. Conclusion
In this paper, the process value and quality were discussed extensively by providing insight on process value definition. The IT process value creation was discussed in detail through a process value question model. The sources of waste responsible for process value loss in IT ecosystem were presented and extensively discussed with examples.
An approach for visualizing the customer value and mapping these value attributes with IT processes has been explained to understand value flow across IT process groups. Extension of Dr. Genichi Taguchi’s quality loss function theory to analyze the process value loss has been extensively discussed with different scenarios. These scenarios were elaborated further to demonstrate the pattern of value deviation against the variation of process performance metric from the target level and corresponding process value.

____________________________________________________________________________________
Excerpt from PNSQC 2013 Proceedings PNSQC.ORG Copies may not be made or distributed for commercial use Page 13
An approach for value oriented process design was presented. This approach helps process practitioners to understand the components that need to be focused on during value integrated process definitions. Also presented was a framework named Value Oriented Process Paradigm that provides adoptable guidance for designing value oriented IT processes and integrating customer value with process quality.
Finally, a technique named Potential Waste and Impacts Analysis (PWIA) that provides guidance towards identifying potential waste during process definition and prioritizing them to put controls to reduce or eliminate waste has been demonstrated. Also, a practical case has been presented to demonstrate the usage of PWIA tool to identify waste and establish relevant process controls.
The authors feel that the importance of process value analysis and the value oriented process definition model used to ensure value addition across the enterprise value chain, as detailed in this paper, can be useful for a process group involved in process definition and process improvement initiatives.
References
Dr. Hugh L. McManus, “Product Development Value Stream Mapping (PDVSM) Manual 1.0.” Lean Aerospace Initiative September 2005. http://lean.mit.edu/downloads/cat_view/94-products/575-product-development-value-stream-mapping-manual International Organization for Standardization, ISO 9000:2005 Quality management systems -- Fundamentals and vocabulary. 2005. CMMI Product team, CMMI® for Development, Version 1.3, Software Engineering Institute. 2010. Basem El-Haik, David M. Roy, Service Design for Six Sigma—A Road Map for Excellence, John Wiley & Sons Inc., 2005. James Robert Evans, William M. Lindsay, Managing for Quality and Performance Excellence, Thomson Learning Inc., 2008. Shivanand Parappa, “Process Dynamics, Variations, and Controls in Software Engineering,” 30
th Annual
Pacific Northwest Software Quality Conference Oct 8 – 10, 2012. http://www.uploads.pnsqc.org/2012/papers/t-74_Parappa_paper.pdf