Export Merchandising and Merchandising for (Garment Units) # 3
Value of IT in Online Visual Merchandising: A Randomized
Experiment to Estimate the Value of Online Product Video
Anuj Kumar Assistant Professor of Information Systems Management
Warrington College of Business Administration University of Florida
Tan Yinliang
Warrington College of Business Administration University of Florida
December 2012
Abstract
Product-videos are widely emerging as a dominant method of merchandising products and services in e-Commerce. However, there is no compelling empirical evidence of its impact on product sales. On the one hand, product-videos provide a virtual product experience that is closer to a physical shopping experience, and thus help customers make more informed choices. On the other hand, product-videos can be used to bundle a focal product with its coordinating products and accessories to make the overall bundle appear more desirable. To test the hypothesis that such visual bundling will increase the sales of both the focal and the coordinating products, a randomized experiment is conducted on the live website of a mid-size fashion retailer in the US. It is found that the introduction of product-videos lead to a 15 percent increase in focal product sales. A surprising spillover effect of product-videos is a 31 percent increase in the sales of coordinating products and accessories. Therefore, visually bundling the coordinating products in focal product-videos helps bring these products in customers consideration set and hence increases the sales of coordinating products. This research thus highlights and estimates a relatively unexplored value of IT in online visual merchandising.
Key Words: Electronic commerce, Online video advertising, Online visual merchandising, Natural experiment, Visual bundling, Value of IT

2
“Visual merchandising is an art of product presentation that communicates product concepts with customers in order to optimize product sales and profits”
M. Pegler (2001)
1.0 Introduction
Visual merchandising refers to vivid presentation of product features that clarifies its distinctive
benefits and thereby stimulates interest and provokes consumers buying decision. Product
presentation is the key driver of sales and profitability in retail industry and therefore retailers
pioneered the concept of visual merchandising long before the advent of the Internet. With
advances in the Internet and Web technologies, websites now utilize rich information technology
(IT) applications to provide a virtual touch and feel of the products that is similar to a physical
shopping environment. For instance, retailers ranging from J Crew to Zappos are displaying their
products online in short high-definition videos with features such as zoom, full screen, and
background music, or evocative human narrative about the product. Automotive company
websites such as (www.mbusa.com) allow customers to watch online videos of their cars in
motion with realistic driving sounds and human narrative to give the virtual experience of
driving. Real Estate firms offer three-dimensional walkthroughs to their home buyers/renters to
help them imagine themselves in the real house. Hotel and travel firm’s websites such as
(www.ichotelsgroup.com) provide a guided high-definition video tour by the concierge
outlining their rooms and hotel facilities, and even the major attractions of the city.
Online product videos have emerged as the most popular IT application for online visual
merchandising. As quoted by a recent Press Release of ComScore, Inc., a global Internet
marketing research company.1
1 http://www.comscore.com/Press_Events/Press_Releases/2012/5/comScore_Releases_April_2012_U.S._Online_Video_Rankings
3
“84.5 percent of the U.S. Internet audience viewed online video. 181 million U.S. Internet users watched nearly 37 billion online content videos in April, 2012. Among these, American users viewed 9.5 billion video ads in April, representing 1 in 5 videos viewed online in April.”
Do product videos help increase online product sales? If product videos lead to higher sales,
what is the underlying mechanism for this? There has been little academic work to systematically
address these questions. Yet, these are relevant questions for an IS researcher, as these highlight
the value of IT in visually presenting the products on a firm’s website. This value is different
from the previously studied values of IT such as transactional value (increasing transactional
efficiency), analytical value (helping firms make better decisions), and relational value
(enhancing within and across organization communications and relations). There are a few
studies that evaluate the effect of online product presentation on consumer’s purchase intentions
rather than actual purchase (Jiang and Benbasat 2007, Khakimdjanova and Park 2005). These
studies, however, are based on either a survey of recruited subjects or content analysis of
websites in laboratory settings. It is hard to answer this question on transactional data without a
randomized experiment, because in most real- life settings the decision to introduce a product-
video is endogenous.2
In online product videos, firms typically bundle the focal products and services with their
complementary products and services to make it visually more attractive to consumers. For
instance, online fashion retailers present videos of the model wearing dresses with matching
purse, jewelry, and sunglasses. Hotel websites present videos of the virtual tour of hotel rooms
with other hotel facilities and attractions. Such bundling of the focal product with its matching
products may make the focal product look more attractive to the consumer and thus increase its
2 For instance a firm may introduce a product-video around the time when it is endorsed by a celebrity. Such celebrity endorsement may not be recorded in the data and hence unobserved to the researcher that may result in increase in sales being wrongly attributed to product-video when it is at-least partly due to celebrity endorsement.
4
sales. Moreover, the consumers that purchase the focal product may also want to purchase the
matching products to realize the attractive appearance of the whole bundle, and this may increase
the sales of the matching products. Such bundling of coordinating products in the focal product-
videos may also enhance their visibility and likelihood of introduction in customers
consideration set.3 Therefore, introducing product videos could be doubly beneficial to firm, as it
increases the sales of both the focal product and its complementary products.
A natural experiment was designed and conducted on the live website of a mid-size fashion
retailer in the US to estimate the impact of product videos on its sales.4 The treatment of product
videos was randomly assigned to 66 out of the 571 products in the firm’s spring collection. After
being sold on the website for a few weeks (pre-treatment period), product videos of the selected
products were hosted on the firm’s website for another few weeks (treatment switch-on period).
Thereafter, these videos were removed and the products were sold on the firm’s website for
another few weeks (treatment switch-off period). A difference-in-difference design with fixed-
effect specifications was employed to estimate the switch-on and switch-off effects of product
videos on sales. Similar values were found for these two effects, which indicate that the
estimated effect due to introduction of the product videos disappears once the videos are
removed. This in turn indicates that the estimated effects are caused by the product videos.
Specifically, the introduction of product video results in on average 14.56 percent increase in
focal products sales. The randomized experiment was further extended to estimate the impact of
focal products videos on the sales of their matching coordinating products. The introduction of
focal products videos led to 30.89 percent increase in coordinating products sales. Furthermore, a
3 Consumers typically visit the firm’s website to purchase focal products (such as tops, dresses, and pants) and are less likely to visits the coordinating products’ pages (such as an earring product page) on the website in absence of their visual bundling in the focal-product videos. 4 The firm’s identity is not disclosed due to a non-disclosure agreement.
5
multi-category purchase incidence model was developed and estimated to account for the
competition among similar products on the firm’s website. Estimates from multi-category
purchase incidence model suggest similar increase in focal and coordinating products sales as the
linear fixed effect model, which indicates the robustness of results.
This research makes several contributions to the literature. First and foremost, a unique
randomized experiment on the live website of a firm was conducted to estimate both the switch-
on and switch-off effects of product videos on sales. Based on the similar estimated values of
these two effects, one can infer that the introduction of product videos causes the increase in
product sales. Second, this paper provides a surprising result that the introduction of focal
products videos actually leads to higher gains in their coordinating products sales than their own
sales. This highlights the potential of product videos to inform customers about firm’s lesser
known products (such as accessories) and thus increase sales of such products. Last but not the
least, unlike previous survey based research, which were limited to measuring consumer’s
attitude towards product, shopping experience and purchase intentions in laboratory settings; the
present work captures the actual buying behavior of the consumers and thus measures the actual
increase in product sales due to product videos in a real-life setting. Thus, the paper contributes
to the literature on the value of IT by highlighting a relatively unexplored aspect of IT value in
online product presentation.
The rest of the paper is organized as follows. The next section sets the theoretical framework
based on previous literature. Section 3 describes research setting and data. Section 4 outlines the
empirical strategy, specifications and results. Section 5 concludes with the managerial
implications of the results and an outline for future research directions.
6
2.0 Theoretical Framework and Related Literature
Customers require realistic product information to make informed choices (O’Keefe and
McEachern 1998). How effectively product information is communicated to the consumer
depends on the quality of product presentation, which is found to be an important antecedent of
customer satisfaction and one’s online shopping experience (Szymanski and Hise 2000). Product
presentation is particularly crucial in an online environment, as customers cannot touch, feel and
try the products in this environment, unlike a physical shopping experience. For this reason,
customers face higher uncertainty about product attributes in an online environment (Liang and
Huang 1998). This uncertainty about product attributes leads to higher perceived risk and hence
lower purchase intentions and less-frequent purchase (Cox and Rich 1964, Jasper and Ouellelte
1994). This problem is especially acute in case of experience goods such as apparel, footwear,
and fashion accessories, which customers can only evaluate completely by physically trying
them out.
The retailing literature on visual merchandising examines methods of product presentation to
effectively communicate product offerings/attributes to customers. Then and Delong (1999)
show that visual displays such as the variety of product angles (e,g. 3-D), image enlargement,
and garment coordination with other items may positively contribute to consumer information
gathering and processing. They report that about 89 percent of the respondents preferred a
realistic human model to examine the garment silhouette among the garment presentations on a
fashion model, a mannequin, and a flat surface. Studies also show that the human visual system
is sensitive to relative movement and flicker (Yantis and Jonides 1984). For this reason,
customers pay more attention and select information from the moving element in the display, 3-
7
D animated presentations, and dynamic visual cues (Dahan and Srinivasan 2000, Nakayama and
Silverman 1986, Cheal and Chastain 1998).
The IS Literature on virtual reality also examines the effect of online product presentation.
Steuer (1992) defines two major characteristics of virtual reality, media richness and
interactivity. Media richness is determined by the sensory depth (quality of presented
information) and sensory breadth (number of sensory dimensions simultaneously stimulated such
as vision and hearing). Interactivity is defined as the degree to which users can manipulate the
form and content of the mediated environment in real time. Using these constructs on their
websites, firms now provide their customers with the virtual product experience (VPE), which
depicts product information in a more realistic manner and thus enables customers to “feel,
touch, and try” products similar to a physical shopping environment (Jiang and Benbasat 2005,
Li et al. 2001, Suh and Lee 2005, Klein 2003). Several studies have investigated the extent to
which different presentation formats (such as a static format, a video format, and a VPE format)
affect customers’ product understanding, attitude towards products, shopping enjoyment, and
flow (Lightner and Eastman 2002, Raney et al. 2003, Li et al. 2003, Jiang and Benbasat 2005).
Jiang and Benbasat (2007) identify two functional mechanisms, vividness and interactivity, in
the different presentation formats that influence customers’ return to a website and their purchase
intentions. No prior study estimates the actual increase in sales due to VPE in a real-life setting.
In the product videos in present setup, a model walks around wearing the dress (product) in a
brief high-definition video to provide a clear 360 degree (3-D) view, shape, fall, and silhouette of
the dress on a live human being. This video should help a customer to imagine herself in the
dress and thus provide her with an experience akin to VPE. Such videos also offer limited
interactivity to the customers such as video pause and image enlargement facilities. The prior
8
literature suggests that product videos should effectively communicate product information and
thus mitigate customer’s uncertainty and perceived risk in an online environment. In contrast,
excessive product attribute information can cause information overload and thus degrade choice
accuracy, as measured by an ideal additive compensatory decision model (Malhotra 1982).
Therefore, the effect of product videos on sales is unclear and needs empirical validation in a
real-life setting.
Online product videos bundle the focal products with their matching coordinating products. For
instance, in a video for a women’s dress – the focal product – in the present setup, a model also
wears a matching pair of sunglasses and jewelry. This is a form of product bundling (i.e.
integration of two or more separate product in such a way that such integration provides some
added value to customers) as opposed to pure price bundling (i.e. selling two or more separate
products in a package at a discount) (See Stremersch and Tellis 2002 for review on bundling).
Some of the previously examined customer added values from product bundling are compactness
in an integrated stereo system, non-duplicating coverage in a one-stop insurance, reduced risk in
mutual funds, and convenience from integrated bills in telecom calling plans. The added value of
product bundling in the present setup is the visually enhanced appearance of focal products by
bundling them with their matching coordinating products. This should increase customers’
valuations and thus sales of the focal product. The visual bundling of coordinating products in
the focal products videos can influence their sales by two mechanisms. First, the customers may
also purchase the matching coordinating products with the focal products to realize the superior
looks of the product bundle and hence it may increase the sales of coordinating products.
Second, the focal products are the mainstay of firm’s sales i.e. customers usually visit firm’s
website with an intention to purchase focal products and thus typically visit focal products

9
webpages. Visual bundling of coordinating products in video at the focal product’s page may
thus enhance the likelihood of a customer registering the coordinating products and thus
introduce them in the customer’s consideration set. In absence of such visual bundling the
customers were less likely to explore the coordinating products’ webpages and hence buy them.
Thus the focal product videos should not only increase the sales of the focal products but also the
sales of their coordinating products shown in the video. This suggests that focal products’ videos
can be used to visually create a network of complementary products on websites. In the present
setup, the pricing of the products are same (exogenous) whether they are purchased together or
separately.5 This allows a clean identification of the effect of visually bundling the products in
videos.
3.0 Research Setting and Data Description
A field study was conducted at a publicly traded fast growing women’s apparel retailer in the
US. The firm sells its products through over 300 specialty apparel stores, a catalog and a website.
The firm has annual revenue of over US $300 million with retail stores, catalog, and website
contributing approx. 75 percent, 10 percent, and 15 percent, respectively. The firm’s online sales
have been steadily growing and therefore it is interested in understanding how to effectively
promote sales on its website.
The firm sells its products in spring and fall collections corresponding to the two main seasons of
the year. The firm’s products are classified into five categories – tops, dresses, bottoms,
footwear, and accessories. Tops, dresses, and bottoms are called principal products. Accessories
and footwear are called auxiliary products, as they complement/complete the looks of the
principal products. For instance, accessories such as jewelry, hats, sunglasses, and belts are 5 Customers may get limited shipping cost advantage in ordering the bundle

10
articles that are worn with tops, bottoms and dresses. Each category is further classified into
subcategories such as tops into shirts, tees, sweaters, blazers, cardigans, and vests, or bottoms
into pants, capris, shorts, skirts, and leggings.
The firm promotes some of the products by hosting their pictures on the home page of its
website. The home page also hosts icons for the five product categories. By clicking on the
category icon, a customer can navigate to the front page of that product category. The category
front page hosts a large picture of a model wearing the featured product in the center, and several
thumbnail size pictures of the models wearing other products of that category around it.6 Besides
the front page, products of a category are displayed in several pages with each such page hosting
several thumbnail pictures of models wearing the products. On surfing through the pages of a
category, if the customer likes a particular product, she can click on its picture to navigate to that
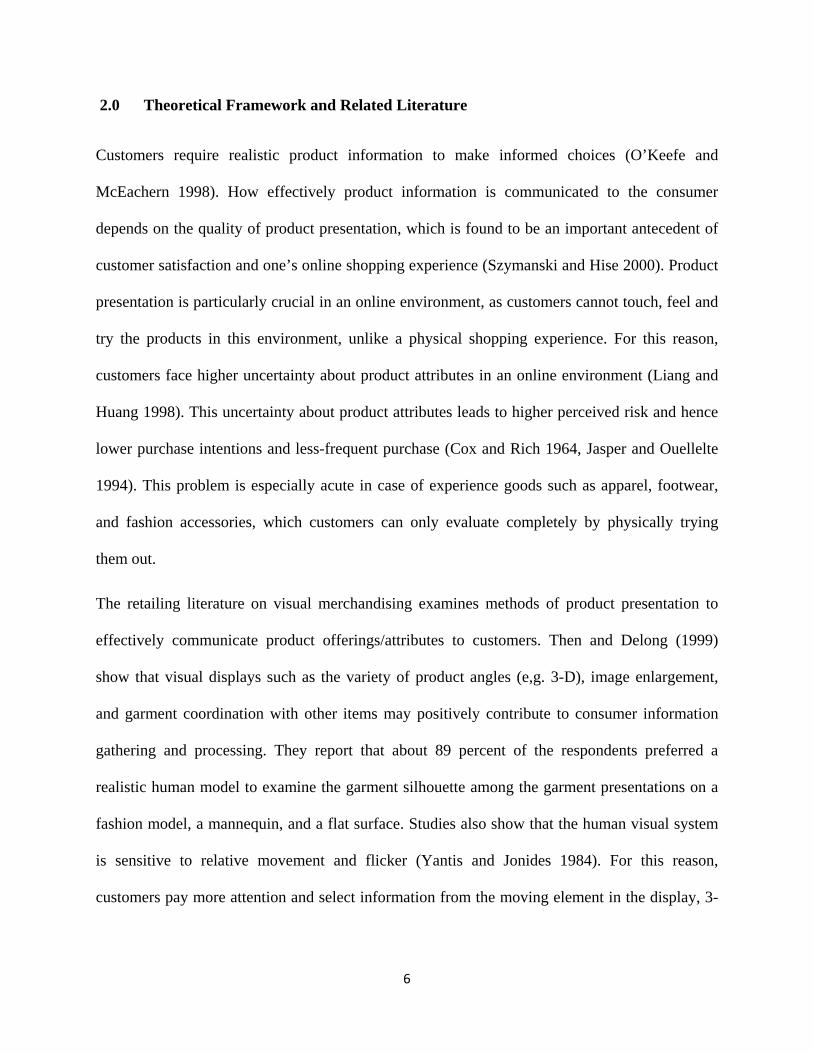
product’s page. For example, Figure 1 displays the product page of a top.
The product page displays the enlarged version of the focal product’s picture that appears in its
category page, such as the picture of a model wearing the top in Figure 1. Therefore, all products
have separate product pages on the firm’s website and the products are called focal products at
their product page. For some focal products, its product page also hosts the pictures of matching
products that completes the looks of the focal product. These matching products are called the
coordinating products of the focal product. A customer can navigate to the product page of the
coordinating product by clicking on its picture on the focal product’s page. For instance in Figure
1, top is the focal product while its matching pants, bracelet, and sandals are the coordinating
products for the top. The customer can navigate to the product page of bracelet by clicking on its
image at the top’s product page as shown in Figure 1. Not all focal products have coordinating
6 In some weeks a category’s front page may have no featured products with the large picture
11
products. For instance, most of the auxiliary products such as accessories and footwear have no
coordinating products. Therefore, the firm creates a network of different combinations of focal
products and its matching coordinating products out of the total assortment of products on its
website.7
Figure 1: Product page with video description and coordinated products
In order to effectively advertise its products online, the firm introduced short (18-20 seconds)
videos of some of its products in the fall 2011. In these videos, a model walks around to give a
360-degree view and a clear feel of the silhouette of the product. These videos can be played by
clicking on the video icon beside the enlarged picture of the focal product (as shown in Figure 1)
at the product page. In these videos, the model also wears and thus displays the matching
coordinating products such as pants, sandals and bracelet. As shown in Figure 1, the bundling of
coordinating products with their focal product is already there in the enlarged picture of the focal 7 The coordinating products to a focal product are themselves the focal product on their product page such as the pants, coordinating product to the top in Figure 1, are the focal product on its product page.
12
product. The focal product video further accentuates this bundling by a dynamic 3-D
presentation of coordinating products with the focal product. The firm is interested in
understanding how the introduction of product videos on the website affects its products’ online
sales.
The spring collection sales started on the firm’s website from the second Friday of January
(January 13th 2012). Between January 13th and July 26th 2012, the firm sold a total of 571
different products on its website: 204 tops, 88 dresses, 27 bottoms, 11 footwear, and 241
accessories. Out of the total 319 principal products (i.e. tops, bottoms and dresses), the firm
randomly selected 66 products (42 tops, 8 bottoms, and 16 dresses) for creation of videos, and
introduced these product videos on three different dates: 25 products on February 17th, 30
products on March 23rd, and 11 products on May 18th 2012. 8 The firm took special care to shoot
the videos with limited number of similar models and similar background settings so that any
heterogeneity in product videos is mainly due to differences in product characteristics. After
being hosted on the website for over two months, these videos were randomly removed in three
phases, on May 4th, June 6th, and July 18th 2012.
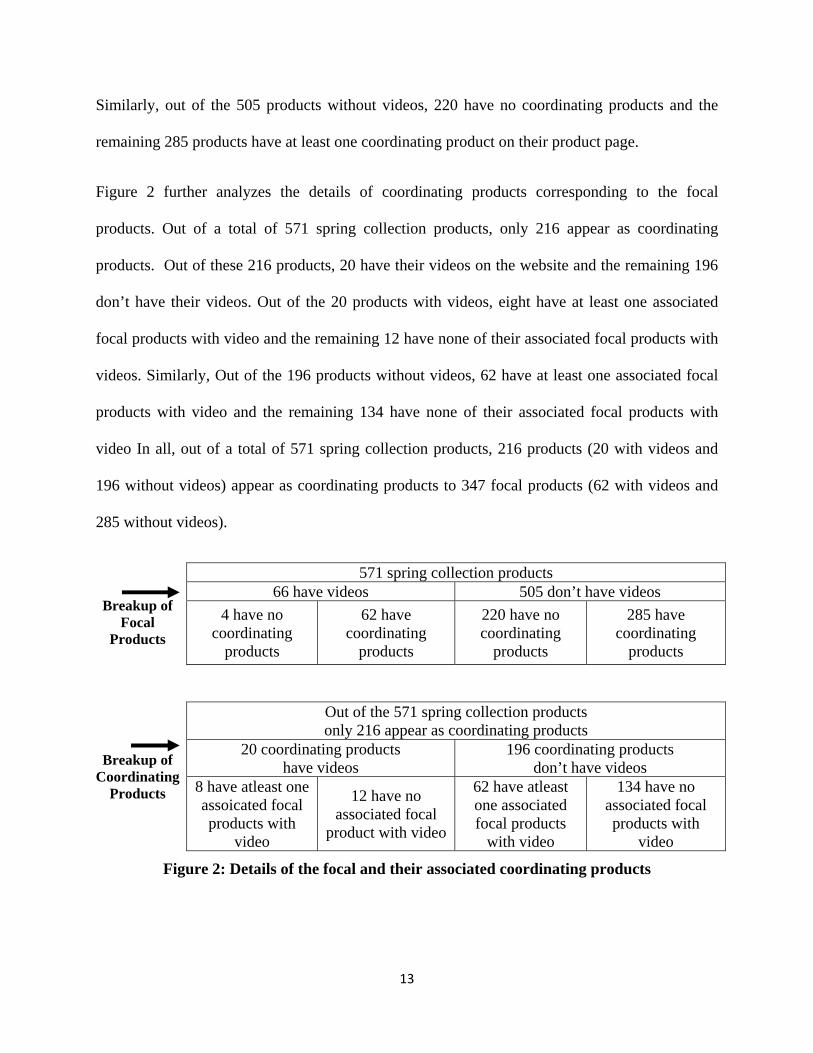
Figure 2 describes the detailed breakup of a total of 571 spring collection products appearing as
focal products and their associated coordinating products on their product page at the website.
Out of the 571 products, 66 have video descriptions and the remaining 505 have no video
descriptions on their product page. Out of the 66 products with videos, four have no coordinating
products and the remaining 62 have at least one coordinating product on their product page.
8 The firm did not introduce product videos for the auxiliary products because majority of products in this category had the picture of the product on its product page, instead of the picture of a model wearing it. For instance, a bracelet’s product page has a picture of only bracelet and not a model wearing bracelet.
13
Similarly, out of the 505 products without videos, 220 have no coordinating products and the
remaining 285 products have at least one coordinating product on their product page.
Figure 2 further analyzes the details of coordinating products corresponding to the focal
products. Out of a total of 571 spring collection products, only 216 appear as coordinating
products. Out of these 216 products, 20 have their videos on the website and the remaining 196
don’t have their videos. Out of the 20 products with videos, eight have at least one associated
focal products with video and the remaining 12 have none of their associated focal products with
videos. Similarly, Out of the 196 products without videos, 62 have at least one associated focal
products with video and the remaining 134 have none of their associated focal products with
video In all, out of a total of 571 spring collection products, 216 products (20 with videos and
196 without videos) appear as coordinating products to 347 focal products (62 with videos and
285 without videos).
Breakup of Focal
Products
571 spring collection products 66 have videos 505 don’t have videos
4 have no coordinating
products
62 have coordinating
products
220 have no coordinating
products
285 have coordinating
products
Breakup of
Coordinating Products
Out of the 571 spring collection products only 216 appear as coordinating products
20 coordinating products have videos
196 coordinating products don’t have videos
8 have atleast one assoicated focal products with
video
12 have no associated focal
product with video
62 have atleast one associated focal products
with video
134 have no associated focal products with
video
Figure 2: Details of the focal and their associated coordinating products
14
The weekly online sales for all 571 spring collection products for a 28 weeks period from
January 13th -19th 2012 to July 20th -26th 2012 was collected.9 To estimate the net effect of
product videos on sales, one needs to control for other factors that may influence sales.
Accordingly, all promotions (both price and non-price), either for specific product or for all
products, conducted by the firm were identified. Below details of these promotions are discussed.
The firm promotes its products by periodically mailing product catalogues to its customers.
During the period of study, six different catalogues of the spring collection products were mailed
on six different dates: 1.5 million copies on 25th January, 2.2 million on 15th February, 2.7
million on 7th March, 3 million on 2nd April, 2.7 million on 3rd May, and 1.8 million on 6th June
2012. Although the catalogues contained pictures of a majority of spring collection products with
their coordinating products in several pages, the products that feature on the front and back
covers of the catalogue are expected to catch greater customer attention and thus may have
higher sales.10 From discussions with the firm’s representatives, it was learnt that it takes about
seven to ten days for the catalogue to reach customers by mail, and thus the effect of catalogue
on product sales is mainly expected for two weeks after approximately 10 to 14 days from the
catalogue drop date. During the study, 29 products appeared as featured products in one
catalogue and one product appeared as a featured product in two catalogues. With the
assumption that a catalogue drop influences the sales of featured products for two weeks, there
are 62 product-weeks of effected sales for 30 featured products in the data.11
Besides catalogues, the firm also sends e-mails to its customers promoting specific products
called the e-mail featured products. Details of all such featured products were collected with the 9 Weekly sales is captured as the number of products sold in a week 10 Around the time of catalogue receipt, it is plausible that sales of all products appearing in it may be influenced. The econometric specifications proposed in the next section accounts for it by inclusion of the week fixed-effects. 11 Product-weeks are computed by adding up the number of weeks that each product appears as a featured product.
15
date on which the e-mails were sent for the period of study. Another way the firm promotes its
products is by placing them as featured products at either the website home page or the category
front pages. It is plausible that during the time a product features on the website’s home page or
with large picture on the category front pages, it is likely to attract more customer eyeballs and
thus may have higher sales. Accordingly, details of all products were collected with the duration
for which they appear as featured product on the home page or with a large picture on the front
pages of each category of products. During the period of study, 58 products appeared on the
home page of the website for 112 product-weeks and 72 products featured on the front page of
product categories for 124 product-weeks.
The firms also ran several across-the-board promotions for its product during the period of study,
such as free shipping for all orders over $75 during Mother’s Day (May 10th) or Tax filing days
(April 16th – 18th) and a summer sale of $10 off on $75 and above orders in the month of June.
Since such a sale equally applies to all products in a specific time period, it can be accounted for
by inclusion of time fixed-effects in the econometric specifications in the next section. Apart
from the price promotion applicable to all products, the firm also runs product-specific price
markdowns to boost the sales of its slow-moving products. As product sales are expected to be
higher during a price markdown, data on price markdowns with its duration for the period of
study were collected. In all 300 products (70 tops, 14 bottoms, 18 dresses, eight footwear, and
190 accessories) received the price markdown for 1072 product-weeks. Out of these 300
products, prices for 279 products were marked down in the month of July 2012 i.e. in the last
three to four weeks of the 28 weeks study period.
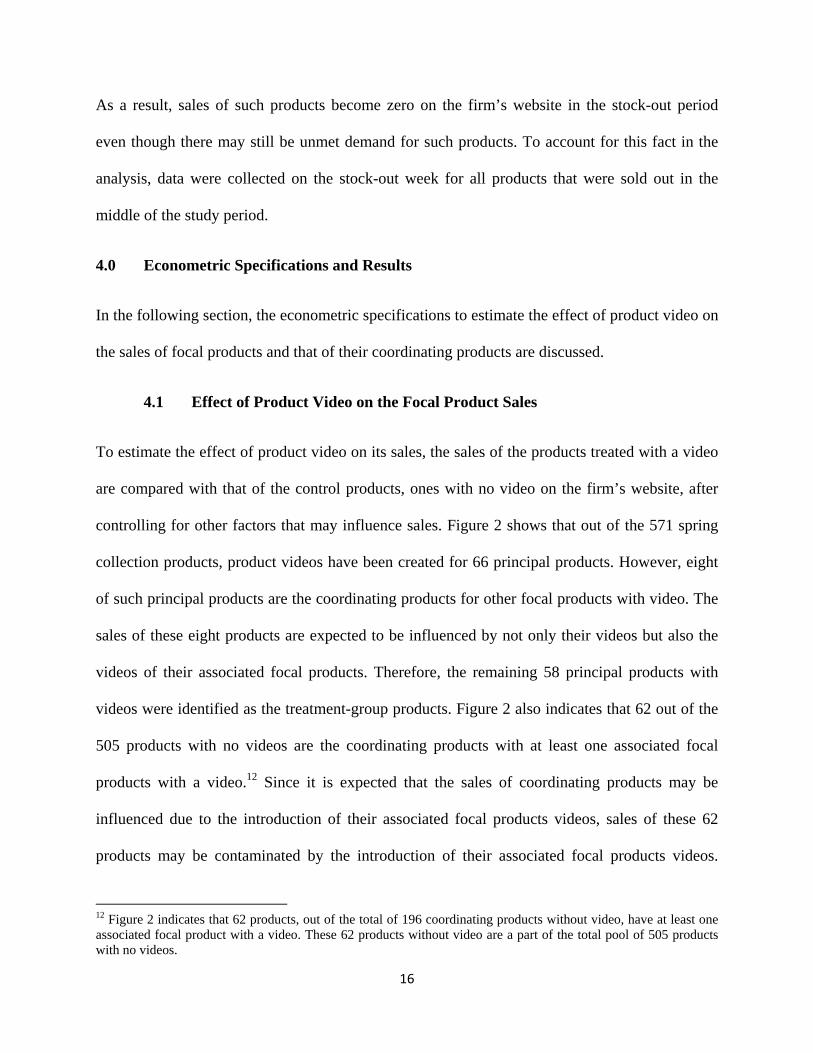
Some fast-moving products are completely sold out (or stocked out) towards the later period of
the study. Such products are removed from the website when their physical inventory is sold out.
16
As a result, sales of such products become zero on the firm’s website in the stock-out period
even though there may still be unmet demand for such products. To account for this fact in the
analysis, data were collected on the stock-out week for all products that were sold out in the
middle of the study period.
4.0 Econometric Specifications and Results
In the following section, the econometric specifications to estimate the effect of product video on
the sales of focal products and that of their coordinating products are discussed.
4.1 Effect of Product Video on the Focal Product Sales
To estimate the effect of product video on its sales, the sales of the products treated with a video
are compared with that of the control products, ones with no video on the firm’s website, after
controlling for other factors that may influence sales. Figure 2 shows that out of the 571 spring
collection products, product videos have been created for 66 principal products. However, eight
of such principal products are the coordinating products for other focal products with video. The
sales of these eight products are expected to be influenced by not only their videos but also the
videos of their associated focal products. Therefore, the remaining 58 principal products with
videos were identified as the treatment-group products. Figure 2 also indicates that 62 out of the
505 products with no videos are the coordinating products with at least one associated focal
products with a video.12 Since it is expected that the sales of coordinating products may be
influenced due to the introduction of their associated focal products videos, sales of these 62
products may be contaminated by the introduction of their associated focal products videos.
12 Figure 2 indicates that 62 products, out of the total of 196 coordinating products without video, have at least one associated focal product with a video. These 62 products without video are a part of the total pool of 505 products with no videos.
17
Therefore, the remaining (505 – 62 = 443) products are considered for control products. As, only
principal products were randomly selected for the treatment of videos from the total pool of
principal products in the spring collection, only 239 principal products (154 tops, 13 bottoms,
and 72 dresses) that are randomly left out from assignment of videos, out of remaining 443
products, are identified as the control-group products.
Pre-video Period
Video Switch-on Period
Video Switch-off Period
Products with Video (Treatment group)
• Weekly sales • Control
variables
• Weekly sales • Control variables
• Weekly sales • Control
variables Products with no Video (Control group)
• Weekly sales • Control variables
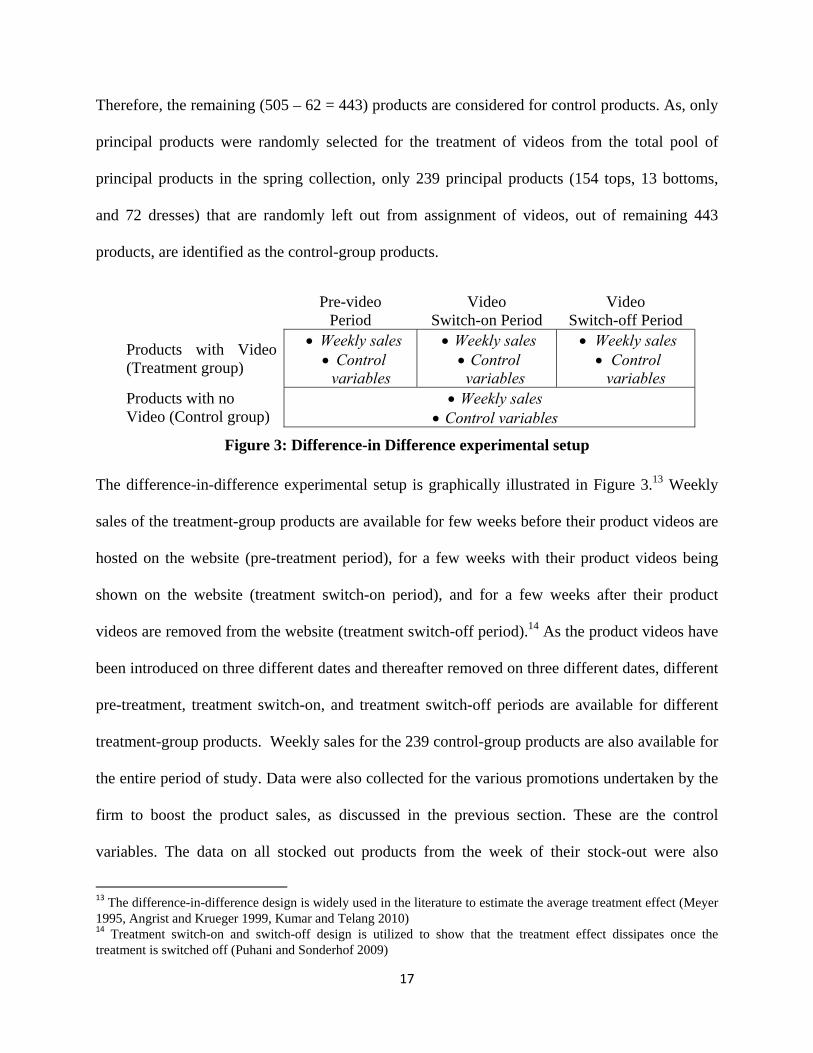
Figure 3: Difference-in Difference experimental setup
The difference-in-difference experimental setup is graphically illustrated in Figure 3.13 Weekly
sales of the treatment-group products are available for few weeks before their product videos are
hosted on the website (pre-treatment period), for a few weeks with their product videos being
shown on the website (treatment switch-on period), and for a few weeks after their product
videos are removed from the website (treatment switch-off period).14 As the product videos have
been introduced on three different dates and thereafter removed on three different dates, different
pre-treatment, treatment switch-on, and treatment switch-off periods are available for different
treatment-group products. Weekly sales for the 239 control-group products are also available for
the entire period of study. Data were also collected for the various promotions undertaken by the
firm to boost the product sales, as discussed in the previous section. These are the control
variables. The data on all stocked out products from the week of their stock-out were also
13 The difference-in-difference design is widely used in the literature to estimate the average treatment effect (Meyer 1995, Angrist and Krueger 1999, Kumar and Telang 2010) 14 Treatment switch-on and switch-off design is utilized to show that the treatment effect dissipates once the treatment is switched off (Puhani and Sonderhof 2009)
18
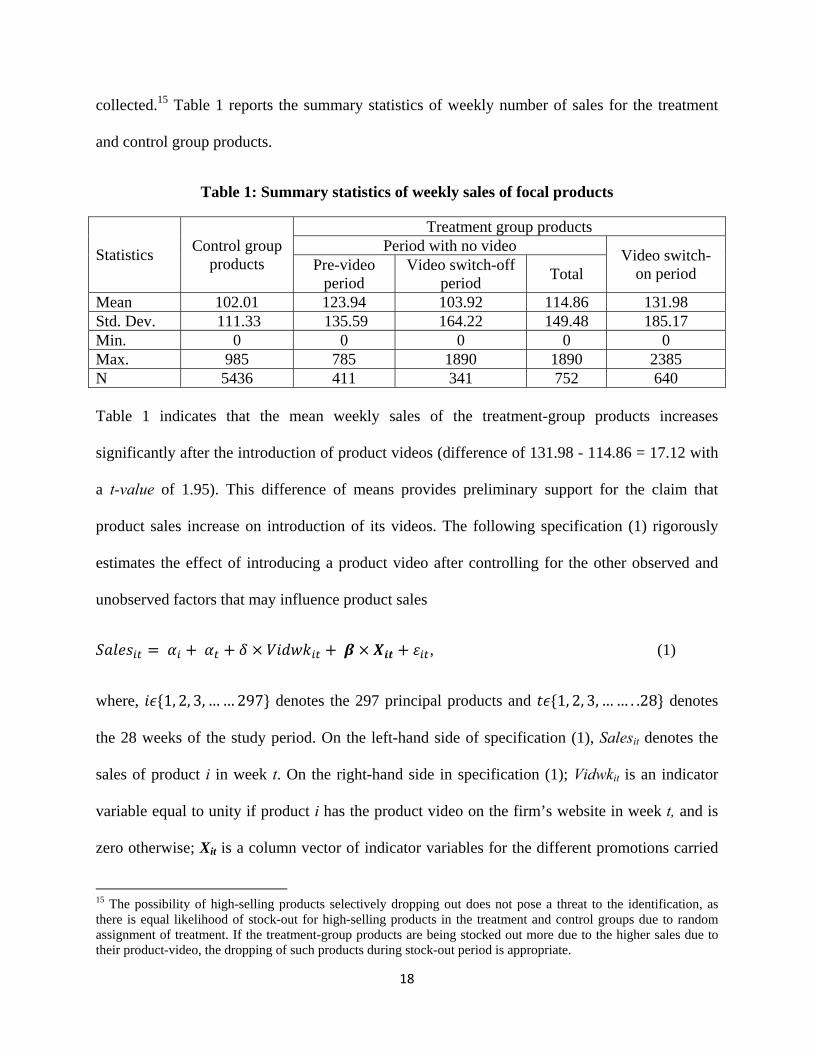
collected.15 Table 1 reports the summary statistics of weekly number of sales for the treatment
and control group products.
Table 1: Summary statistics of weekly sales of focal products
Statistics Control group products
Treatment group products Period with no video Video switch-
on period Pre-video period
Video switch-off period Total
Mean 102.01 123.94 103.92 114.86 131.98 Std. Dev. 111.33 135.59 164.22 149.48 185.17 Min. 0 0 0 0 0 Max. 985 785 1890 1890 2385 N 5436 411 341 752 640
Table 1 indicates that the mean weekly sales of the treatment-group products increases
significantly after the introduction of product videos (difference of 131.98 - 114.86 = 17.12 with
a t-value of 1.95). This difference of means provides preliminary support for the claim that
product sales increase on introduction of its videos. The following specification (1) rigorously
estimates the effect of introducing a product video after controlling for the other observed and
unobserved factors that may influence product sales
, (1)
where, 1, 2, 3, … … 297 denotes the 297 principal products and 1, 2, 3, … … . .28 denotes
the 28 weeks of the study period. On the left-hand side of specification (1), Salesit denotes the
sales of product i in week t. On the right-hand side in specification (1); Vidwkit is an indicator
variable equal to unity if product i has the product video on the firm’s website in week t, and is
zero otherwise; Xit is a column vector of indicator variables for the different promotions carried
15 The possibility of high-selling products selectively dropping out does not pose a threat to the identification, as there is equal likelihood of stock-out for high-selling products in the treatment and control groups due to random assignment of treatment. If the treatment-group products are being stocked out more due to the higher sales due to their product-video, the dropping of such products during stock-out period is appropriate.
19
out by the firm for product i in week t. The Xit specifically includes; Catwkit is equal to unity if
product i appears on the front or back covers of the catalogue and week t falls in the two-weeks
period immediately after 10 to 14 days from the catalogue drop dates, and is zero otherwise;
Pricewkit is equal to unity if there has been a price markdown for product i in week t, and is zero
otherwise; Emailwkit is equal to unity if the firm sends a promotional e-mail featuring product i
in week t, and is zero otherwise; Homepgwkit is equal to unity if product i appears on the home
page of the website in week t, and is zero otherwise; Catpgwkit is equal to unity if product i
appears with large picture on the front page of its category in week t, and is 0 otherwise; αi and
αt denotes the product and week fixed-effects , respectively.
The main coefficient of interest represents the impact of the introduction of a product video on
its weekly sales. The row vector β are the coefficients that account for the various product-
specific observed promotions that may influence product sales. In addition, the product fixed-
effects account for the scale differences in weekly sales of different products due to time
invariant unobserved product-specific factors. The week fixed-effects accounts for any
unobserved time-specific shocks equally applicable to the demand of all products such as
seasonality or promotions for all products at a specific time period.16 Note that if there is a
promotion for some products for the entire duration of study, its effect will be subsumed in
product fixed-effects.
The coefficient in specification (1) represents the average treatment effect (ATE) of the product
video. By definition the average treatment effect of product i in week t (ATEit) = SalesitT –
SalesitC, where Salesit
T is the weekly sales for product i with videos in week t and SalesitC is the
weekly sales of product i with no video in week t. Since product i cannot simultaneously have a
16 Across-the-board promotions such as price markdowns for all products on Mother’s Day and Tax Filing Day.
20
video and also not have a video on the website in week t, its counterfactual sales on the website
in week t is inferred from the average sales of all products that do not have product videos on the
website in week t.17
There are two requirements for clean identification of the ATE. First, for each week t with
product videos in the period of study, there should be enough products that do not have videos on
the firm’s website (overlap assumption).18 This ensures that there are sufficient control products
for each week t inside the treatment of product videos to estimate the treatment effect. Appendix
A provides the number of products with and without videos for each week with video in the
study period to show that this condition is well met in the data.
The second and more crucial identification requirement is that the treatment of product videos
should be randomly assigned to the products, i.e. each product in the spring collection should
have equal likelihood of assignment of a product video (ignorability of treatment assumption).
As product videos were randomly assigned to 66 principal products from the entire spring
collections of 319 principal products, this assumption is satisfied. To further alleviate any
possible concerns on this requirement, it is shown in Appendix B that the mean values and the
trends in weekly sales for the treatment- and control-group products are statistically
indistinguishable in the period without treatment.19 Moreover, as the product videos were first
17 The products for which videos are introduced after week t also act as control-group products for products for which videos are introduced on or before week t. This further makes the specification robust to any possibility of selection of product for creation of video. 18 See Wooldridge (2002) for the overlap and ignorability assumptions in estimating the average treatment effect 19 The average prices of treatment‐ and control‐group products are also found to be statistically indistinguishable.
21
introduced and then removed in phases, it further minimizes the possibility of the time of product
videos coinciding with any unobserved events that may influence product sales.20
Inclusion of control variables in specification (1) results in more precise estimates of the product-
video coefficient by weeding out the effect of promotions on product sales, so long as these
promotions can be regarded as exogenous. It is plausible that the firm selects products for
promotions based on its sales trend at a given time i.e. timing of product promotions may be
endogenous. For example, price markdowns may be given for slow-moving products or high-
selling and popular products may be selected as featured items in catalogue or website’s home
page. As the treatment of product videos is randomly assigned, there is equal likelihood for the
treatment- and control-group products to receive these promotions. Taking the difference
between the treatment- and control-group products in specification (1) somewhat mitigates the
potential endogeneity in product promotions.21
Specification (1) is estimated for three subsets of data. First, the full dataset is used with two
periods without treatment of a product video (pre-treatment and treatment switch-off periods)
and one period with a products video (treatment switch-on period). In addition, two partial
datasets were used: first with the pre-treatment period and the treatment switch-on period, and
the second with the treatment switch-on and treatment switch-off periods only. Similar estimates
(in magnitude and significance) for the treatment effect from the three datasets would indicate
that the two periods without treatment are statistically indistinguishable from each other, and
each of them is statistically distinguishable from the treatment period. Put another way, this
suggests a treatment effect of the introduction of product videos on their sales (switch-on effect) 20 If some unobserved events that may influence product sales coincide with the duration of product videos, the estimated effect on sales during the time of product video could be partly due to such unobserved events. 21 The difference-in-difference design may not completely address the endogeneity of promotional control variables. This is a limitation to the present work.
22
but this effect dissipates when the product videos are removed from the website (switch-off
effect). This design provides strong evidence that the estimated treatment effect is caused by the
introduction of product videos only and not by any other unobserved events.22 The coefficient
estimates for estimation on the three datasets are reported in Table 2.23 Table 2 reports cluster-
and White’s heteroskedasticity-corrected robust standard errors.
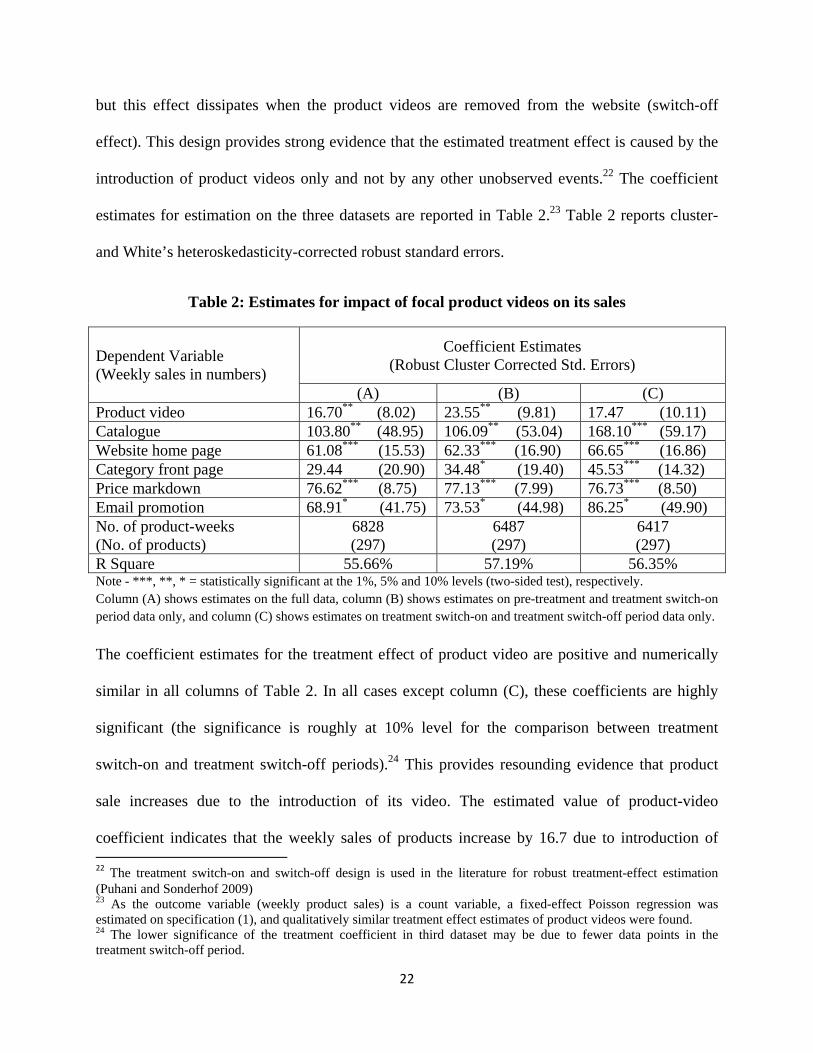
Table 2: Estimates for impact of focal product videos on its sales
Dependent Variable (Weekly sales in numbers)
Coefficient Estimates (Robust Cluster Corrected Std. Errors)
(A) (B) (C) Product video 16.70** (8.02) 23.55** (9.81) 17.47 (10.11) Catalogue 103.80** (48.95) 106.09** (53.04) 168.10*** (59.17) Website home page 61.08*** (15.53) 62.33*** (16.90) 66.65*** (16.86) Category front page 29.44 (20.90) 34.48* (19.40) 45.53*** (14.32) Price markdown 76.62*** (8.75) 77.13*** (7.99) 76.73*** (8.50) Email promotion 68.91* (41.75) 73.53* (44.98) 86.25* (49.90) No. of product-weeks (No. of products)
6828 (297)
6487 (297)
6417 (297)
R Square 55.66% 57.19% 56.35% Note - ***, **, * = statistically significant at the 1%, 5% and 10% levels (two-sided test), respectively. Column (A) shows estimates on the full data, column (B) shows estimates on pre-treatment and treatment switch-on period data only, and column (C) shows estimates on treatment switch-on and treatment switch-off period data only.
The coefficient estimates for the treatment effect of product video are positive and numerically
similar in all columns of Table 2. In all cases except column (C), these coefficients are highly
significant (the significance is roughly at 10% level for the comparison between treatment
switch-on and treatment switch-off periods).24 This provides resounding evidence that product
sale increases due to the introduction of its video. The estimated value of product-video
coefficient indicates that the weekly sales of products increase by 16.7 due to introduction of 22 The treatment switch-on and switch-off design is used in the literature for robust treatment-effect estimation (Puhani and Sonderhof 2009) 23 As the outcome variable (weekly product sales) is a count variable, a fixed-effect Poisson regression was estimated on specification (1), and qualitatively similar treatment effect estimates of product videos were found. 24 The lower significance of the treatment coefficient in third dataset may be due to fewer data points in the treatment switch-off period.
23
their product videos, which translates into a 14.56 percent increase over the mean weekly sales
value of 114.86 in the pre-treatment period.
The coefficient estimates for the promotional control variables have direct managerial
implications and thus are reported in Table 2. A positive and significant value of 103.8 for the
indicator variable for catalogue-featured products indicates that by being featured on either the
front or back page of a catalogue, the weekly sales of a product increase by 103.80 during the
two-week period when a catalogue influences product sales. Similarly, the estimated values of
61.08, 29.44 and 68.91, respectively, for the coefficient of indicator variables for the home page,
category front page, and email featured products indicates that on being featured on the website’s
home page, categories front page, and in the firm’s promotional email, the weekly sales of a
product increase by 61.08, 29.44, and 68.91 respectively. The positive and significant estimate
for the coefficient of the indicator variable of price markdown indicates that the weekly sales of a
product increases by 76.62 in the weeks when its price is marked down.25 The expected signs and
reasonable magnitudes for estimates of promotions-related control variables lend further face
validity to the estimation.
4.2 Effect of Focal Product Videos on the Coordinating Products Sales
To estimate the effect of focal product videos on its coordinating products sales, one requires to
compare the sales of coordinating products whose associated focal products have a video
(treatment-group) with the sales of coordinating products whose associated focal products have
no video (control group). The coordinating products should not have their own videos; as such
videos will also influence their sales besides the videos of their focal products. Accordingly, 196 25 Out of the total 7078 product-weeks of data of our study, the price markdown were undertaken for 113 product-weeks, home page and category front page featured products were on for 108 and 103 product-weeks respectively, and effect of catalogue promotions was for 44 product-weeks.
24
coordinating products without their own videos, as shown in Figure 2, have been identified for
this analysis. Out of these 196 coordinating products, 62 products have at least one associated
focal product with a video, and are thus identified as the treatment-group products. The
remaining 134 products, which do not have any of their associated focal products with videos,
are identified as the control-group products.
As shown in Figure 1, a focal product can have more than one associated coordinating products,
similarly, a coordinating product may be associated with more than one focal product. Therefore,
each coordinating product in the treatment-group products may be associated with more than one
focal product, some with and others without videos. For instance, a pair of sunglasses can be the
coordinating product for a top with a video and a bottom without a video. For these treatment-
group products with multiple focal products, the treatment of the focal product videos is assumed
to start from the week when video for one of their associated focal products is first hosted on the
website and the treatment lasts till the week before video of their last associated focal product is
removed from the website. Weekly sales of the treatment-group products are observed for a few
weeks before the introduction of their focal products videos (pre-treatment period), for a few
weeks during which the videos of at least one of their focal product is on the website (treatment
switch-on period), and for a few weeks after the videos of all of their focal products are removed
from the firm’s website (treatment switch-off period). The weekly sales of 134 control-group
coordinating products are also observed for the entire duration of the study.
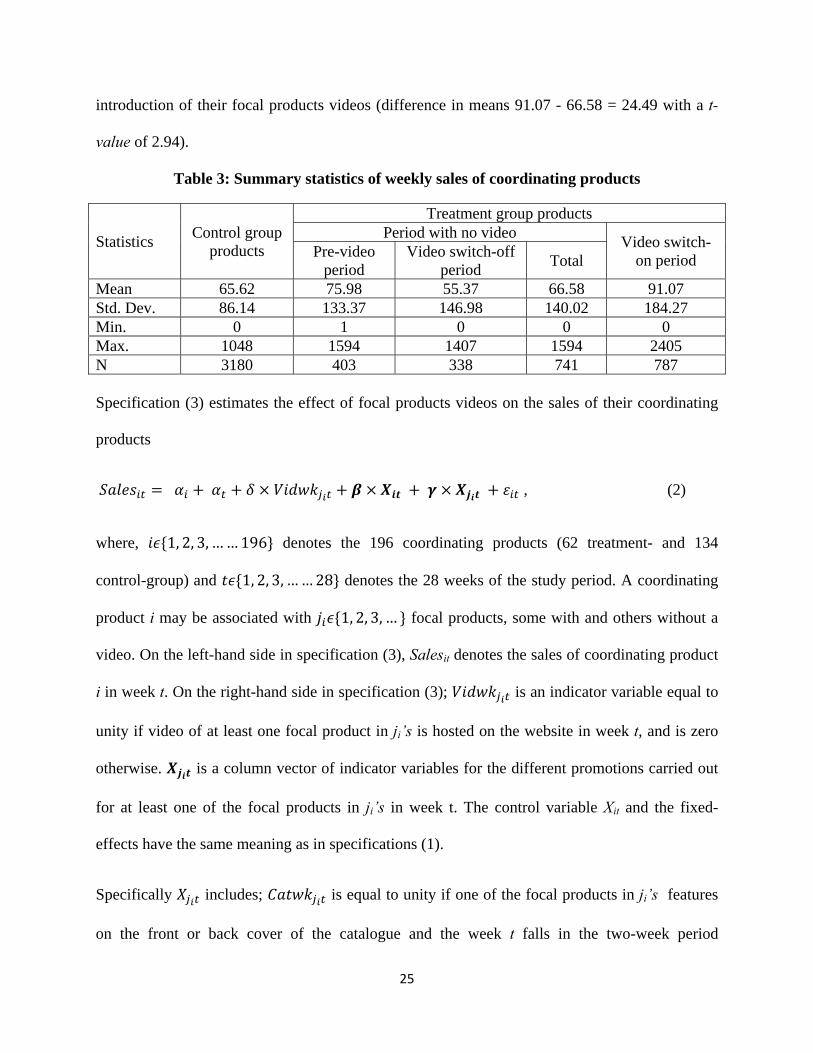
The same experimental setup as shown in Figure 3 is used for the coordinating products sales
analysis. The summary statistics for the weekly sales, as reported in Table 3, shows a
statistically-significant increase in the weekly sales of coordinating products after the
25
introduction of their focal products videos (difference in means 91.07 - 66.58 = 24.49 with a t-
value of 2.94).
Table 3: Summary statistics of weekly sales of coordinating products
Statistics Control group products
Treatment group products Period with no video Video switch-
on period Pre-video period
Video switch-off period Total
Mean 65.62 75.98 55.37 66.58 91.07 Std. Dev. 86.14 133.37 146.98 140.02 184.27 Min. 0 1 0 0 0 Max. 1048 1594 1407 1594 2405 N 3180 403 338 741 787
Specification (3) estimates the effect of focal products videos on the sales of their coordinating
products
, (2)
where, 1, 2, 3, … … 196 denotes the 196 coordinating products (62 treatment- and 134
control-group) and 1, 2, 3, … … 28 denotes the 28 weeks of the study period. A coordinating
product i may be associated with 1, 2, 3, … focal products, some with and others without a
video. On the left-hand side in specification (3), Salesit denotes the sales of coordinating product
i in week t. On the right-hand side in specification (3); is an indicator variable equal to
unity if video of at least one focal product in ji’s is hosted on the website in week t, and is zero
otherwise. is a column vector of indicator variables for the different promotions carried out
for at least one of the focal products in ji’s in week t. The control variable Xit and the fixed-
effects have the same meaning as in specifications (1).
Specifically includes; is equal to unity if one of the focal products in ji’s features
on the front or back cover of the catalogue and the week t falls in the two-week period
26
immediately after 10-14 days from the catalogue drop dates, and is zero otherwise;
is equal to unity if one of the focal products in ji’s features in the e-mail in week t, and is zero
otherwise; is equal to unity if one of the focal products in ji’s features on the
website’s home page in week t, and is zero otherwise; is equal to 1 if one of the
focal products in ji’s features on the category front page in week t, and is zero otherwise; and
is equal to unity if there has been a price mark down for one of the main products in
ji’s in week t, and is zero otherwise.
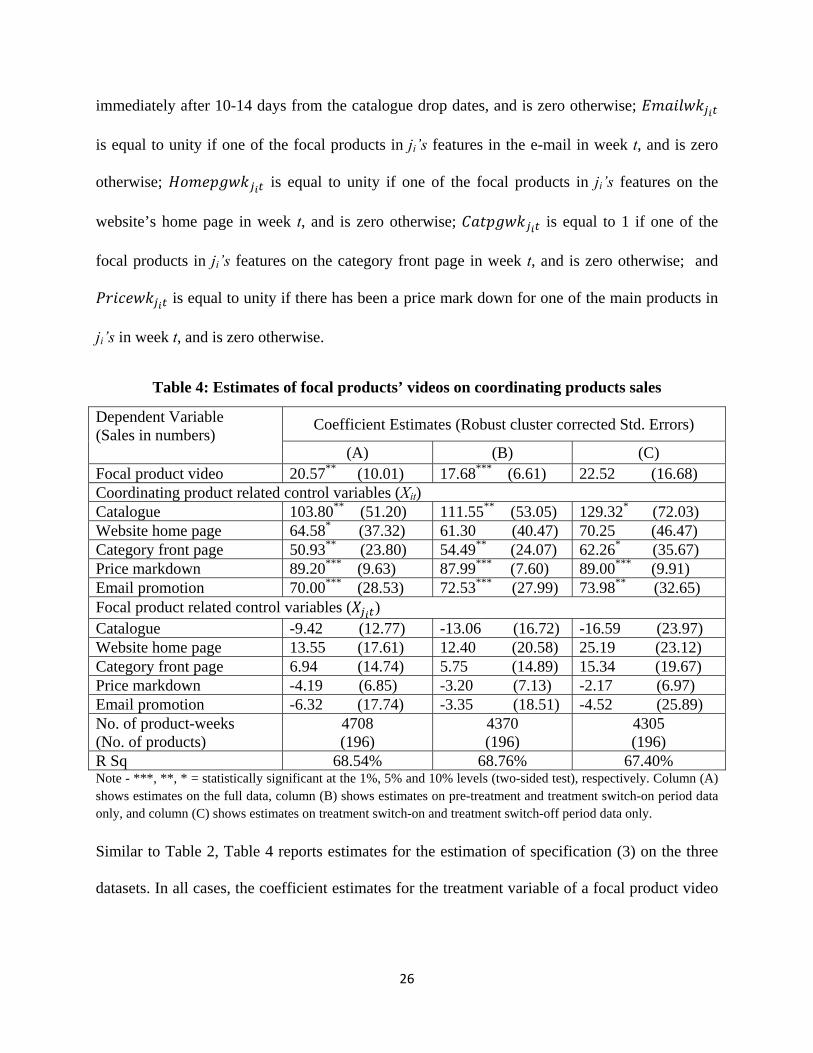
Table 4: Estimates of focal products’ videos on coordinating products sales
Dependent Variable (Sales in numbers)
Coefficient Estimates (Robust cluster corrected Std. Errors)
(A) (B) (C) Focal product video 20.57** (10.01) 17.68*** (6.61) 22.52 (16.68) Coordinating product related control variables (Xit) Catalogue 103.80** (51.20) 111.55** (53.05) 129.32* (72.03) Website home page 64.58* (37.32) 61.30 (40.47) 70.25 (46.47) Category front page 50.93** (23.80) 54.49** (24.07) 62.26* (35.67) Price markdown 89.20*** (9.63) 87.99*** (7.60) 89.00*** (9.91) Email promotion 70.00*** (28.53) 72.53*** (27.99) 73.98** (32.65) Focal product related control variables ( ) Catalogue -9.42 (12.77) -13.06 (16.72) -16.59 (23.97) Website home page 13.55 (17.61) 12.40 (20.58) 25.19 (23.12) Category front page 6.94 (14.74) 5.75 (14.89) 15.34 (19.67) Price markdown -4.19 (6.85) -3.20 (7.13) -2.17 (6.97) Email promotion -6.32 (17.74) -3.35 (18.51) -4.52 (25.89) No. of product-weeks (No. of products)
4708 (196)
4370 (196)
4305 (196)
R Sq 68.54% 68.76% 67.40% Note - ***, **, * = statistically significant at the 1%, 5% and 10% levels (two-sided test), respectively. Column (A) shows estimates on the full data, column (B) shows estimates on pre-treatment and treatment switch-on period data only, and column (C) shows estimates on treatment switch-on and treatment switch-off period data only.
Similar to Table 2, Table 4 reports estimates for the estimation of specification (3) on the three
datasets. In all cases, the coefficient estimates for the treatment variable of a focal product video
27
are positive, similar in magnitude, and significant.26 This indicates that the coordinating products
weekly sales increase on the introduction of their focal product videos.27 The estimated
coefficient estimate indicates that the weekly sales of coordinating products increase by 20.57
due to the introduction of their focal product videos, which translates into a 30.89 percent
increase over the mean weekly sales of 66.58 without treatment.
Table 4 shows that the weekly sales of coordinating products increase by 103.8 if it is featured
on either the front or the back cover of a catalogue. The coordinating products sales increase by
64.58, 50.93, and 70 when it features on the website’s home page, category front pages, and
promotional email by the firm, respectively. The coordinating products sales increase by 89.95 in
the weeks of its price markdown. All these estimates have reasonable magnitudes and expected
signs. Interestingly, there is no statistically-significant increase in weekly sales of coordinating
products due to either a price or a non-price promotion for their associated focal products. Thus,
the sales of coordinating products increase by the introduction of their focal product videos but
not by any form of promotions on their focal products.
As indicated in Figure 1, the coordinating products are already bundled in the still picture at the
focal product’s page on the website. The estimate for the coefficient of focal product video in
Table 2 suggests that the introduction of focal product video in addition to the existing bundling
in still picture results in a 30 percent increase in coordinating products sales. This highlights the
incremental value of product videos in visually bundling the focal products with their
coordinating products. A higher estimated value of coefficient for the focal product video (20.57
to 16.70) in specification (2) as compared to specification (1) indicates a higher additional 26 Recognizing the count nature of the outcome variable, a fixed-effect Poisson regression is estimated. The estimates from Poisson regression are qualitatively similar to the results from OLS. 27 The coefficient estimate for treatment switch-off data with OLS is not significant at 10% level but its sign and magnitude are very similar to estimates on the overall treatment and treatment switch-on effect
28
number of coordinating products sales than that of additional number of focal products sales on
introduction of focal products’ videos. This higher increase in coordinating products sales from
the introduction of focal product videos may come from either some customers purchasing the
coordinating product when they were only purchasing the focal products without product videos
or some customers only purchasing the coordinating products when they were purchasing
nothing without product videos. Both of these scenarios suggest that the focal products’ videos
enhance the visibility of coordinating products to customers by visually bundling them with the
focal products.
4.3 Multi-category Purchase Incidence Model
The method of estimating treatment-effect in the previous sections does not account for the
competition among the products on the website. For example, on introduction of product videos,
customers may shift their choice from products without videos to the ones with videos. The
treatment-effect in difference-in-difference design is computed by taking the difference of
differences in mean sales between the products with and without videos after the introduction of
product videos from that of its corresponding value before the introduction of product videos.
Therefore, the treatment-effect includes both the increase in sales of products with videos as well
as any possible decrease in sales of products without videos. In the following, a utility based
consumer choice model is proposed to specifically incorporate the competition among various
products on the firm’s website and thus estimate the gains in sales due to product videos.
The website usage statistics reveal that on average a customer browses 7.9 pages in a visit to the
firm’s website, and the average basket size of a customer’s purchase is about 2.4 products.28
28 Customers buy products in only 3% of their total visits but when they buy products, they on average buy 2.4 products.
29
These statistics also reveal that a customer on average browses through pages of more than one
category of products in a visit. Based on these facts, it is assumed that in every visit a customer
considers each category of products separately, and in each category she decides which product
to buy along with the outside option of not buying anything from that category.29 Accordingly, a
multi-category purchase incidence model for a representative customer is developed.
The utility that a representative customer derives from a product jc in a category c [where
1, 2, . . and 1, 2, … , ] in week t [ 1, 2, . . . , ] is given as
, (3)
where, is a vector of firm’s promotional control variables for product jc in category c in
week t (such as prime placement on website, price markdowns, and catalog featured
product); is an indicator variable equal to unity if a video for product jc in category c has
been hosted on the firm’s website in week t, and is zero otherwise (in case of coordinating
product analysis, denotes an indicator variable of whether video for the focal product for
product jc in category c has been hosted on the firm’s website in week t); are the product
specific unobserved factors (fixed-effects), such as style, quality, and conformance of products
with the popular appeal that remain unchanged in the study period; and captures the time-
related shocks in product demand such as seasonality. It is assumed that after controlling for the
product-level and week-level unobserved factors, the error term is uncorrelated across
products and weeks.
29 It is possible that customers more often search for the principal category products (tops, dresses, and bottoms) as compared to the auxiliary category products (accessories and footwear), or customers consideration-set for each category may comprise of only products on the first few pages of that category. In absence of customer-level actual browsing data, all products under a category are assumed in customers’ consideration-set for that category.
30
Probability that a representative customer purchases product jc in category c in week t
,
where, signifies all products other than product in category c. This will include the
option of not purchasing any product from that category i.e. the outside option (so there are
1 options in all to choose from in a category). Utility of the outside option is normalized to
0. Since the error terms for the products are uncorrelated across products and across weeks, the
probability that a representative customer purchases product jc in category c in week t can be
expressed as a simple Logit probability
∑
, (4)
The likelihood of the observed choice of products in all categories over the total time period for a
representative customer is
∏ ∏ ∏ , (5)
where, is equal to unity if the customer purchases product jc in category c in week t, and is
zero otherwise. In the present setup, individual customer’s choice is not observed. However, the
total number of customers who visit the firm’s website in a week and the aggregate weekly sales
of each product are observed. If a homogeneous population of representative customers visits the
firm’s website, the likelihood of observed choice in the aggregate data is30
30 Assumption of homogeneous customer population is appropriate in present setup as the objective here is to estimate the average effect of product videos on customers’ utility. Note that customer heterogeneity plays an important role in determining substitution among products when the products’ utility is modeled on common characteristics that interact with customer characteristics (see Berry et al. 1995 for details)
31
∏ ∏ ∏ , (6)
where, is the number of customers who purchase product jc in category c in week t. If is
the total number of customers visiting the firm’s website in week t, then the number of customers
who do not purchase any product in category c in week t is ∑ , which is captured as
the choice of outside option.
Therefore, products in a category compete for customer’s attention, and the customer makes a
multinomial choice among options in each category in each week in our data.31 However,
purchases in multiple categories by a customer in a visit are allowed in this model to
accommodate the observed customer’s average purchase basket of 2.4 products in the present
setup. The prices of the products are pre-decided and they don’t change over the period of study
(except price markdowns for some products towards the end of study period).
Estimating product-specific unobserved characteristics ( ) for each products would mean
estimating over 300 product–level dummies from the data for just 28 weeks. As it is not feasible
to identify such large numbers of parameters, as a next best option a dummy variable for each
subcategory of products under a category is estimated. As described before, different product
categories on the firm’s website are further divided into several sub-categories. For example,
tops are sub-categorized in blouse, shirts, cami, tanks, tops, tees, jackets and outerwear, blazers,
sweaters and cardigans. Similarly, bottoms are divided into denims, pants, jeans, leggings,
shorts, skirts, and capris. Estimating product sub-category level dummies (average unobserved
characteristics) would allow a more realistic substitution pattern among the products within a
31 Purchase of more than one product from a category in a visit will be incorporated as separate purchases made over multiple visits.
32
category on the firm’s website. For instance an introduction of product video for a skirt is more
likely to affect the sales of other skirts without videos on the firm’s website. Moreover,
correlation among these sub-category dummies ( ) are allowed by assuming them to be
multivariate normally distributed as
~ , , (7)
where, 1, 2, . . denotes various product sub-categories on the firm’s website; denotes
a vector of mean unobserved characteristics values for product sub-categories; and denotes the
variance-covariance matrix for these unobserved characteristics values.
Two sets of parameters are estimated: (1) parameters of individual product utility ( , , δ), and
(2) hyper-parameters that determine heterogeneity across product sub-category-level unobserved
characteristics ( , ). Hierarchical Bayes framework for model estimation (Gelman et al.
2009) is used with the following Markov Chain Monte Carlo (MCMC) chains
• Draw ( , , δ | , , , data) using the Metropolis-Hastings algorithm;
• Draw ( , | ) using conjugate family distribution.
The estimation results for the focal- and coordinating-product analysis are reported in Table 5.
For the focal product analysis, the three principal categories of products ( 1, 2,3 ) were used
for the customer multi-category purchase model. For the coordinating product analysis, a
customer choose form the three principal categories and one category for the accessories and
footwear combined ( 1, 2,3,4 ). Moreover, in the coordinating product analysis includes
the indicator variables if the focal product with video corresponding to the coordinating product
has been given any promotion (same as in specification (2)).
33
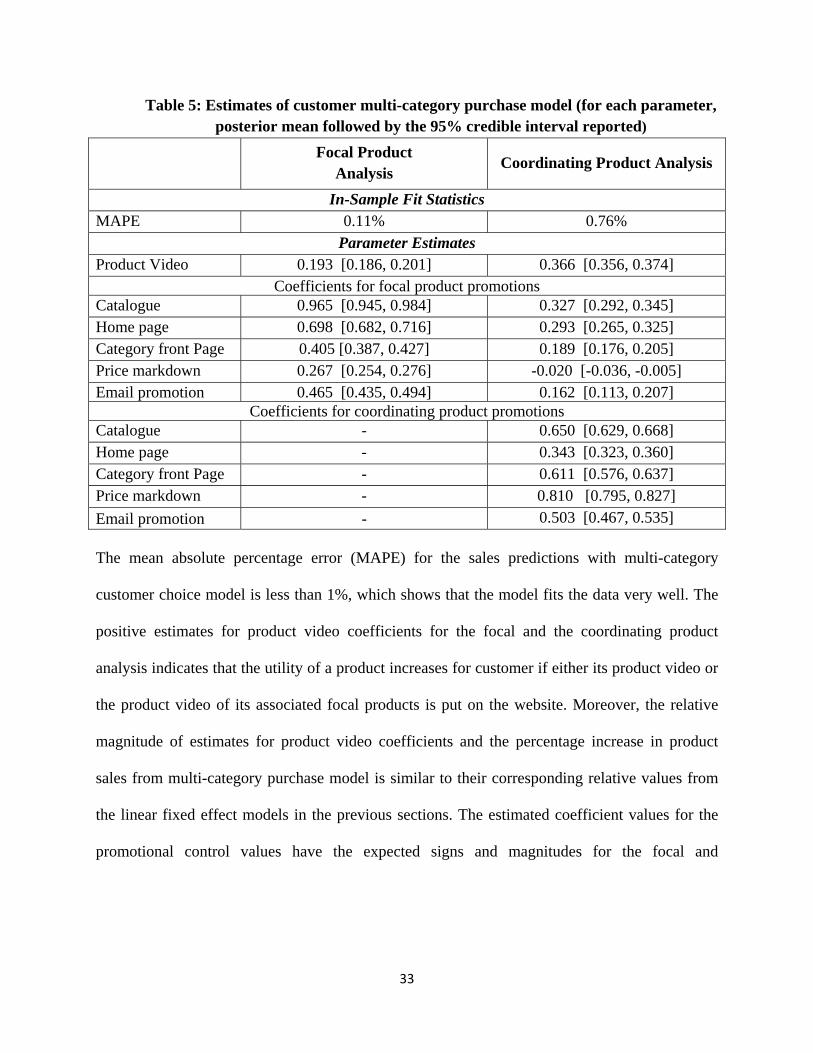
Table 5: Estimates of customer multi-category purchase model (for each parameter, posterior mean followed by the 95% credible interval reported)
Focal Product
Analysis Coordinating Product Analysis
In-Sample Fit Statistics MAPE 0.11% 0.76%
Parameter Estimates Product Video 0.193 [0.186, 0.201] 0.366 [0.356, 0.374]
Coefficients for focal product promotions Catalogue 0.965 [0.945, 0.984] 0.327 [0.292, 0.345] Home page 0.698 [0.682, 0.716] 0.293 [0.265, 0.325] Category front Page 0.405 [0.387, 0.427] 0.189 [0.176, 0.205] Price markdown 0.267 [0.254, 0.276] -0.020 [-0.036, -0.005] Email promotion 0.465 [0.435, 0.494] 0.162 [0.113, 0.207]
Coefficients for coordinating product promotions Catalogue - 0.650 [0.629, 0.668] Home page - 0.343 [0.323, 0.360] Category front Page - 0.611 [0.576, 0.637] Price markdown - 0.810 [0.795, 0.827] Email promotion - 0.503 [0.467, 0.535]
The mean absolute percentage error (MAPE) for the sales predictions with multi-category
customer choice model is less than 1%, which shows that the model fits the data very well. The
positive estimates for product video coefficients for the focal and the coordinating product
analysis indicates that the utility of a product increases for customer if either its product video or
the product video of its associated focal products is put on the website. Moreover, the relative
magnitude of estimates for product video coefficients and the percentage increase in product
sales from multi-category purchase model is similar to their corresponding relative values from
the linear fixed effect models in the previous sections. The estimated coefficient values for the
promotional control values have the expected signs and magnitudes for the focal and
34
coordinating product analysis in the customer multi-category purchase model.32 These results
suggest that even after accounting for the competition among the products under a category on
the firm’s website, the introduction of product videos leads to increase in focal and the
coordinating products sales.
5.0 Conclusions
A randomized experiment on the live website of a mid-size fashion retailer in the US was
conducted to estimate the impact of product videos on its sales. In this experimental setup, both
the switch-on and the switch-off effects of the treatment of product videos on product sales were
estimated. Similar and significant estimates for the two effects indicate that the estimated effect
on sales is caused by the product videos. Specifically, the focal products sales increase by 14.56
percent on introduction of their product videos. The same experimental-setup was further utilized
to estimate that the introduction of focal product videos on average increases the sales of the
coordinating products by 30.89 percent. A utility based customer multi-category purchase model
was also developed and estimated to account for the competition among products on the firm’s
website. The estimates from this model provide similar increase in the focal and coordinating
products sales due to introduction of focal product videos.
The results of this research have significant managerial implications in online presentation of
products by multiproduct retailers. As these retailers usually offer a large number of products
and accessories for sales, presenting products on their website in such a way to catch limited
customers’ attention is crucial for their sales and profitability. The results indicate that visually
bundling the accessories (coordinating products) in the focal products videos may make the focal
32 The estimated values of increased product sales from multi‐category purchase model are a little higher than the values obtained from the linear specifications (1 & 2).
35
product look more attractive to the customers and thus increase the sales of focal products. But,
more importantly, product videos can be a great tool to bundle its numerous auxiliary products
and accessories with the matching focal products and thus increase the visibility and hence sales
of such auxiliary products and accessories. A significant increase in products sales by
introducing their videos furthers informs managers of the additional benefit of dynamic product
presentation (videos) over the static presentation (still pictures). With net dollar gains from
introducing product videos, present research provides valuable insights to the practitioners on
how much they should invest in creating such videos. In all, the present research highlights and
estimates the value of an IS artifact (product videos) in online visual merchandising.
The present research is not without limitations. First, the endogenous assignment of product
promotions may not be fully addressed by the equal possibility of promotions for the products
with and without product videos. Second, the aggregate sales data limits the analysis in several
ways. The increased aggregate focal and coordinating product sales do not necessarily mean that
a customer, who purchases the focal product, also purchases the coordinating products. There is
an outside possibility that these results may come from one set of customers buying the focal
products and a different set of customers buying the coordinating products. However, this
possibility still indicates that product videos increase the visibility of focal and coordinating
products and hence the sales of these products. Moreover, the multi-category purchase model
assumes a homogeneous population of representative customers. Availability of customer-level
choice data would allow estimation of more realistic substitution pattern among products due to
introduction of product videos.
36
References
Angrist, J. D., A. B. Krueger. 1999. Empirical strategies in labor economics. O. Ashenfelter, D. Card, eds. Handbook of Labor Economics, Vol. 3A. Elsevier, Amsterdam, 1277-1366
Berry, S., James Levinsohn, Ariel Pakes. 1995. Automobile prices in market equilibrium. Econometrica, 63(4) 841-890. Cheal, M., G. Chastain 1998. Attention effects of moving and stationary single element and multiple elements precues: Limits of automaticity. Perception and Psychophysics. 60(5) 873-887
Cox, D. F., S. U. Rich. 1964. Perceived risk and consumer decision-making: The case of telephone shopping. J. Marketing Res. 32-39.
Dahan, E. and V. Srinivasan. 2000. The predictive power of Internet based product concept testing using visual depiction and animation. J. Innovative Management 17 99-109.
Jasper, C. R., S. J. Ouellelte. 1994. Consumers’ perception of risk and the purchase of apparel from catalogs. J. Direct Marketing, 8(2), 23-36.
Jiang, Z., I. Benbasat. 2005. Virtual product experience: Effects of visual and functional control of products on perceived diagnocity and flow in electronic shopping. J. Management Inform. System 21(3) 111-148.
Jiang, Z., I. Benbasat. 2007. Investigating the influence of the functional mechanisms of online product presentations. Inform. Systems Res. 18(4) 454-470.
Khakimdjanova, L., Jihye Park 2005. Online visual merchandising practice of apparel e-merchant. J. Retailing and Consumer Services 12 307-318.
Klein, L. R. 2003. Creating virtual product experiences: The role of telepresence. J. Interactive Marketing 7(1) 41-55.
Kumar, A., R. Telang. 2011. Does Web Reduce Customer Service Cost? Empirical Evidence from a Call Center. Inform. Systems Res. Articles in Advance, 1-17. http://dx.doi.org/10.1287/isre.1110.0390.
Li, H., T. Daugherty, F. Biocca. 2001. Characteristics of virtual experience in electronic commerce: A protocol analysis. J. Interactive Marketing 15(3) 13-30.
Li, H., T. Daugherty, F. Biocca. 2003. The role of virtual experience in consumer learning. J. Consumer Psych. 13(4) 395-407.
Liang, T. P., J. S. Huang. 1998. An empirical study on consumer acceptance of products in electronic markets: A transaction cost model. Decision Support Systems, 24(1), 29-43.
Lightner, N. J., C. Eastman 2002. User preference for product information in remote purchase environment. J. Electronic Commerce Res. 3(3) 175-185.

37
Malhotra, N. K. 1982. Information load and consumer decision making. J. Consumer Res. 419-430.
Meyer B. D. 1995. Natural and Quasi Experiment in Economics. J. Bus. Econom. Statist. 13(2) 151-161.
Nakayama, K., G. H. Silverman 1986. Serial and parallel processing of visual feature conjunctions. Nature, 320, 264-265.
O’Keefe, R. M., T. McEachern. 1998. Web-based consumer decision support systems. Comm. ACM. 41(3) 151-167
Pegler, M. 2001. Visual merchandising and display. Fairchild Pub. New York
Puhani, P. A., K. Sonderhof. 2010. The effects of a sick pay reform on absence and on health-related outcomes J. Health Econom. 29(2) 285-302.
Raney, A. A., L. M. Arpan, K. Pashupati, D. A. Brill. 2003. At the movies, on the web: An investigation of the effects of entertaining and interactive web content on site and brand evaluation. J. Interactive Marketing 17(4) 38-53.
Szymanski, D. M., R. J. Hise. 2000. e-Satisfaction: An initial examination. J. Retailing 76(3) 309-322.
Stremersch, Stefan, Gerald J. Tellis. 2002. Strategic bundling of products and prices: A new synthesis for marketing. J. Marketing. 66, 55-72.
Steuer, J. 1992. Defining Virtual Reality: Dimension determining telepresence. J. Comm. 42(4). 73-93.
Suh, K-S., Y. E. Lee 2005. Effects of virtual reality on consumer learning: An empirical investigation in web based electronic commerce. MIS Quart. 29(4) 673-697.
Then, N. K., M. R. DeLong 1999. Apparel shopping on the web. Journal of Family and Consumer Sc. 91, 65-68.
Wooldridge, J. 2002. Econometric Analysis of Cross-Section and Panel Data. Cambridge, MA: MIT Press.
Yantis, S., J. Jonides 1984. Abrupt visual onsets and selective attention: Evidence from visual search. J. Experimental Psychology: Human Perception and Performance. 10 601-621

38
Appendix A: Testing Overlap Assumption
The Overlap assumption for estimating the average treatment-effect in specification (1) requires
that for each week t with product videos in the period of the study, there should be enough
control products that don’t have the videos on the firm’s website. Table A1 reports the number of
products with and without videos available for estimation in each week of the study period with
product videos. The Table A1 clearly shows the phased switching-on (February 17th, March 23rd,
and May 18th) and switching-off (May 4th, June 6th, and July 18th) of the product videos that
ensures that the overlap assumption is well met.
Table A1: Week wise breakup of treatment and control products
Week No. of Product without Video No. of Product with Video17th – 23rd Feb 200 25 24th Feb – 1st Mar 205 25 2nd – 8th Mar 213 25 9th – 15th Mar 217 25 16th – 22nd Mar 222 25 23rd – 29th Mar 218 55 30th Mar – 5th Apr 215 55 6th – 12th Apr 212 55 13th – 19th Apr 210 55 20th – 26th Apr 218 55 27th Apr – 3rd May 217 55 4th – 10th May 238 35 11th – 17th May 239 35 18th – 24th May 219 44 25th – 31st May 212 44 1st – 7th Jun 219 42 8th – 14th Jun 219 15 15th – 21st Jun 219 15 22nd – 28th Jun 219 15 29th Jun – 5th Jul 219 15 6th – 12th Jul 219 15 13th – 19th Jul 217 15 20th – 26th Jul 224 3
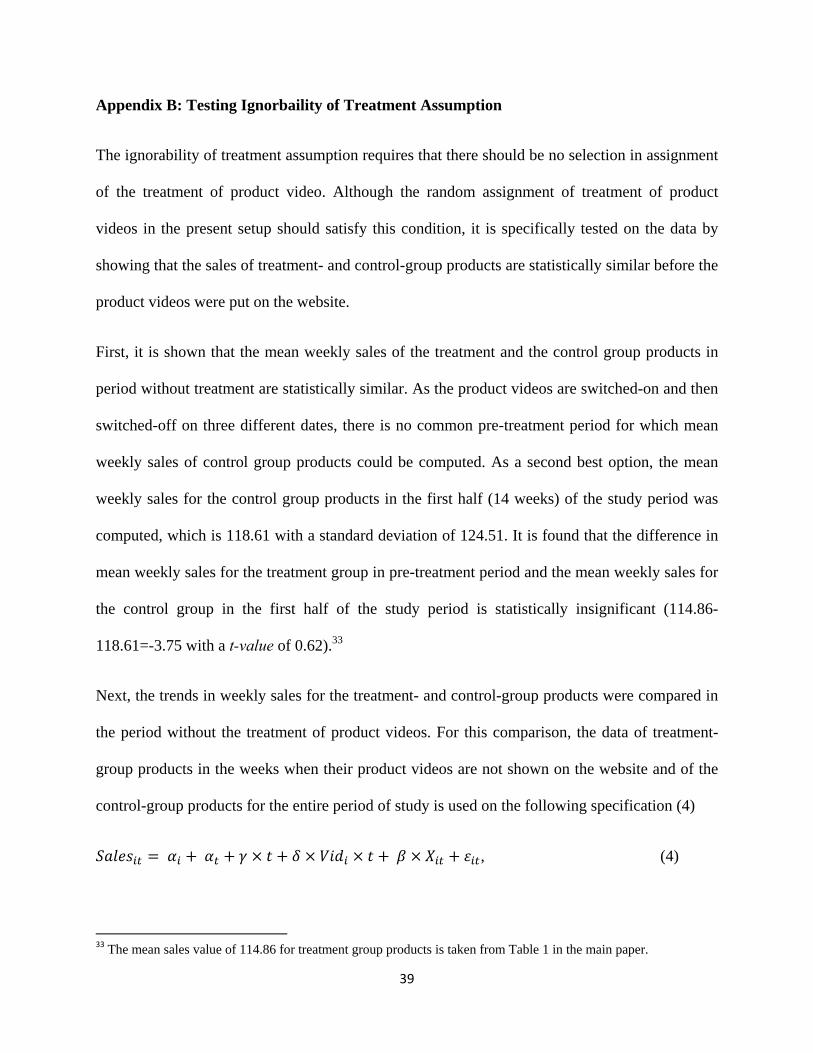
39
Appendix B: Testing Ignorbaility of Treatment Assumption
The ignorability of treatment assumption requires that there should be no selection in assignment
of the treatment of product video. Although the random assignment of treatment of product
videos in the present setup should satisfy this condition, it is specifically tested on the data by
showing that the sales of treatment- and control-group products are statistically similar before the
product videos were put on the website.
First, it is shown that the mean weekly sales of the treatment and the control group products in
period without treatment are statistically similar. As the product videos are switched-on and then
switched-off on three different dates, there is no common pre-treatment period for which mean
weekly sales of control group products could be computed. As a second best option, the mean
weekly sales for the control group products in the first half (14 weeks) of the study period was
computed, which is 118.61 with a standard deviation of 124.51. It is found that the difference in
mean weekly sales for the treatment group in pre-treatment period and the mean weekly sales for
the control group in the first half of the study period is statistically insignificant (114.86-
118.61=-3.75 with a t-value of 0.62).33
Next, the trends in weekly sales for the treatment- and control-group products were compared in
the period without the treatment of product videos. For this comparison, the data of treatment-
group products in the weeks when their product videos are not shown on the website and of the
control-group products for the entire period of study is used on the following specification (4)
, (4)
33 The mean sales value of 114.86 for treatment group products is taken from Table 1 in the main paper.
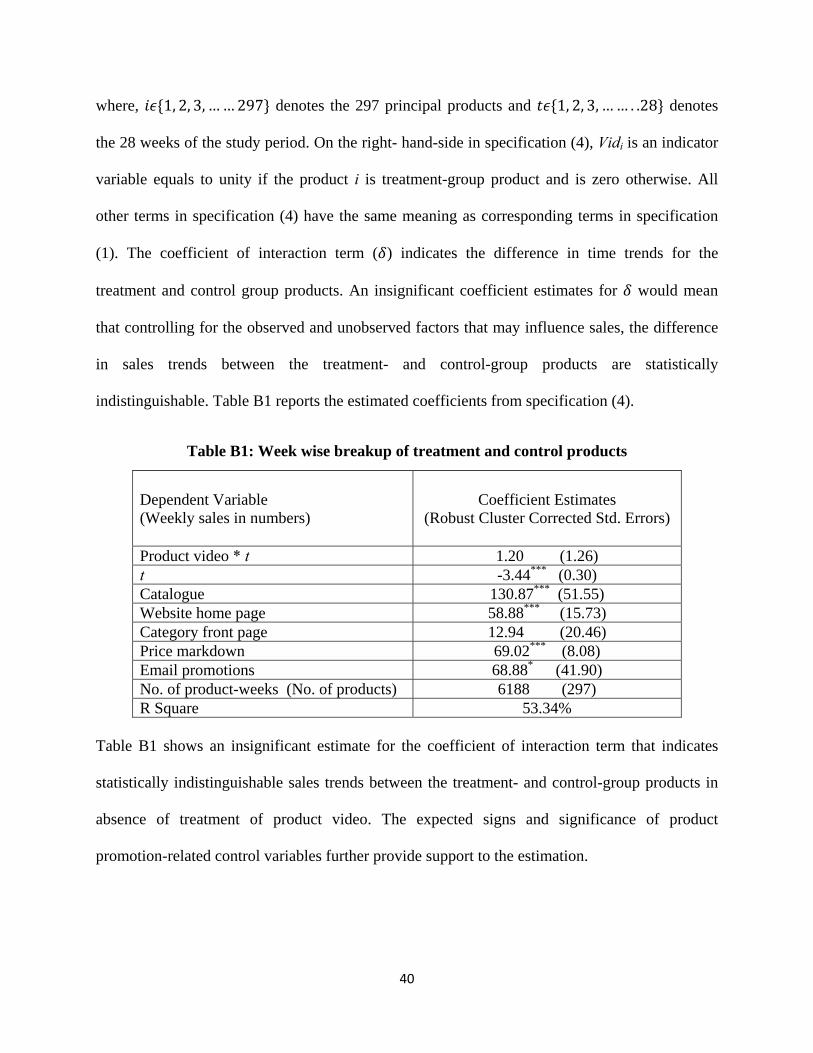
40
where, 1, 2, 3, … … 297 denotes the 297 principal products and 1, 2, 3, … … . .28 denotes
the 28 weeks of the study period. On the right- hand-side in specification (4), Vidi is an indicator
variable equals to unity if the product i is treatment-group product and is zero otherwise. All
other terms in specification (4) have the same meaning as corresponding terms in specification
(1). The coefficient of interaction term ( ) indicates the difference in time trends for the
treatment and control group products. An insignificant coefficient estimates for would mean
that controlling for the observed and unobserved factors that may influence sales, the difference
in sales trends between the treatment- and control-group products are statistically
indistinguishable. Table B1 reports the estimated coefficients from specification (4).
Table B1: Week wise breakup of treatment and control products
Dependent Variable (Weekly sales in numbers)
Coefficient Estimates (Robust Cluster Corrected Std. Errors)
Product video * t 1.20 (1.26) t -3.44*** (0.30) Catalogue 130.87*** (51.55) Website home page 58.88*** (15.73) Category front page 12.94 (20.46) Price markdown 69.02*** (8.08) Email promotions 68.88* (41.90) No. of product-weeks (No. of products) 6188 (297) R Square 53.34%
Table B1 shows an insignificant estimate for the coefficient of interaction term that indicates
statistically indistinguishable sales trends between the treatment- and control-group products in
absence of treatment of product video. The expected signs and significance of product
promotion-related control variables further provide support to the estimation.