Value Framework Net Health Benefit Worksheet: Adjuvant Setting
12
Value Framework Net Health Benefit Worksheet: Adjuvant Setting
Transcript of Value Framework Net Health Benefit Worksheet: Adjuvant Setting

Value Framework Net Health Benefit Worksheet:
Adjuvant Setting

About This Worksheet
The American Society of Clinical Oncology (ASCO) Value Framework assesses the relative value of
cancer therapies by calculating Net Health Benefit scores (NHBs) using measures of clinical benefits and
toxicities, as demonstrated in randomized clinical trials.
ASCO has developed this “Value Framework Net Health Benefit Score Worksheet: Adjuvant Setting,” to provide step-by-step guidance for reliably calculating NHBs. ASCO acknowledges that trial interpretation is complex and that the accurate use of the framework requires a thorough understanding of its design and purpose. To assist users, the worksheet is heavily footnoted with guidance on resolving situations that may occur at extreme parameters within the framework and provides worked examples of calculations. The “Notes” field at the bottom of each page is intended to help users keep important information at-a-glance to assist with performing the framework’s calculations.
This worksheet is divided into the following sections:
• Study Information (p. 2)• Step 1 - Clinical Benefit Scoring (p. 3)• Step 2 - Toxicity Scoring (p. 7)• Step 3 - Tail of the Curve Bonus Points (p. 9)• Step 4 - Net Health Benefit (p. 10)
You may contact ASCO regarding this worksheet at [email protected].
More information on ASCO’s efforts to achieve high-quality, high-value care for all patients with cancer
is available at www.asco.org/value.
1
ASCO Value Framework Net Health Benefit Worksheet: Adjuvant Setting

Study Information
Name of the StudyA
Published references usedB
Experimental/New TreatmentC
Standard/Control TreatmentD
Relevant Population/Indication
A Typically a trial acronym (e.g. AFFIRM trial) or the first author and year of the most important trial publication (e.g. Scher 2012). B There may be more than one relevant reference for the NHB calculation. For example, a later publication may provide quality of life data for which a QoL bonus may be given, or a later publication may provide more detailed
toxicity data or overall survival data. List all publications that were used in calculating the NHB. C The term “experimental/new treatment” is used for consistency throughout the NHB worksheet to refer to thetreatment whose net health benefit is of interest. It may be neither experimental or new in context. D The term “standard/control treatment” is used for consistency throughout the NHB worksheet to refer to the
reference treatment against which the treatment of interest’s health benefits are being compared. It may not be
a standard treatment in context, and it may not be a treatment at all, per se (i.e. placebo, “usual care”,
“surveillance”).
Notes
2
ASCO Value Framework Net Health Benefit Worksheet: Adjuvant Setting

Step 1 – Clinical Benefit Scoring
Answer each question in Step 1 and follow the instructions depending on the answer. E
1. A. Is a hazard ratio (HR) for overall survival reported AND was it statistically significant?
• If YES, continue with this section below the line.
• If NO, go to 1. B. NO means EITHER there was no HR of overall survival reported OR one was
reported but it was not statistically significant.
Enter the Hazard Ratio for overall survival in box 1 (e.g. 0.84)F:
BOX 1 Subtract the value in Box 1 from 1 and enter it in Box 2 (e.g. 1-0.84 = 0.16).
BOX 2 Multiply the value in Box 2 by 100 and enter it in the box labelled “HR Score (Death)” (e.g. 0.16 x 100 = 16)
HR Score (Death)
Copy this value to Step 4 into the box labeled “Clinical Benefit Score”. Continue with the instructions in Step 2. Skip 1.B., 1.C., and 1.D.
E While the JCO article upon which this worksheet is based makes reference to potential use of objective
response rate as a clinical benefit outcome, in practice using this outcome in non-comparative studies is
impossible, as toxicity scores can not be calculated for single-arm studies. Therefore, the use of objective
response rate when it is the ONLY outcome reported is not covered by the worksheet.F The hazard ratio should be in such a form that a value less than 1 shows benefit for the experimental/new treatment for which a net health benefit is being calculated. If it is not in this form (e.g. a value greater than 1
shows benefit) put the reciprocal of the hazard ratio in box 1 (i.e. Box 1 = 1/HR).
Notes
3

1. B. Is the median overall survival (OS) reported for both arms of the trial AND is there a reported
statistically significant differenceG between these values?
• If YES, continue with this section below the line.
• IF NO, go to 1.C. NO means EITHER the median overall survival is not reported for one or both
arms OR there is no reported statistically significant difference in median overall survival
between the arms.
Enter the median overall survival for the experimental/new arm in the box labelled “Median New” and
the value for the control/standard arm in the box labelled “Median Control” (e.g. Median New = 8.1
months, Median Control = 6.3 months)H.
Median New
Median Control
Subtract Median Control from Median New and enter the value in Box 1 (e.g 8.1-6.3 = 1.8)
BOX 1 Divide Box 1 by Median Control, and enter the value in Box 2 (e.g. 1.8/6.3 = 0.286)
BOX 2 Multiply Box 2 by 100 and enter the value into the box labelled “OS Score”. (e.g. 0.286 x 100 = 28.6)
OS Score Copy this value to Step 4 into the box labeled “Clinical Benefit Score”. Continue with the instructions in Step 2. Skip 1.C. and 1.D.
G A statistically significant difference will likely be reported as either a log-rank p-value or as an increase in overall survival with a confidence interval that does not include no difference (e.g. improved survival of 3 months (95% CI 1-6 months). If a statistically significant HR for overall survival is reported, go back to section 1.A.H Ensure that the two values are in the same units (i.e. both months, both days).
Notes
4

1. C. Is a hazard ratio (HR) for disease-free survival Ireported AND was it statistically significant?
• If YES, continue with this section below the line.
• If NO, go to 1. D. NO means EITHER there was no HR for disease-free survival reported OR one
was reported but it was not statistically significant.
Enter the Hazard Ratio for disease-free survival in box 1 (e.g. 0.84)J:
BOX 1 Subtract the value in Box 1 from 1 and enter it in Box 2 (e.g. 1-0.84 = 0.16).
BOX 2 Multiply the value in Box 2 by 100 and enter it in the box labelled “HR Score (DFS)” (e.g. 0.16 x 100 = 16)
HR Score (DFS)
Copy this value to Step 4 into the box labeled “Clinical Benefit Score”. Continue with the instructions in Step 2. Skip 1.D.
I This hazard ratio may be reported as event-free survival; the exact definition, but the event definitions should be reviewed to ensure that the outcome is measuring disease-free status. However, do not use: time to recurrence, time to disease-related death, or other measure that does not incorporate death from all causes as part of its definition. If a statistically significant hazard ratio for overall survival or statistically significant difference in median overall survival are reported, go back to section 1.A. and/or 1.B. J The hazard ratio should be in such a form that a value less than 1 shows benefit for the experimental/new treatment for which a net health benefit is being calculated. If it is not in this form (e.g. a value greater than 1 shows benefit) put the reciprocal of the hazard ratio in box 1 (i.e. Box 1 = 1/HR).
Notes
5

1. D. Is the median disease-free survival reported for both arms of the trial AND is there a reported
statistically significant difference Kbetween these values?
• If YES, continue with this section below the line.
• IF NO, then a Net Health Benefit cannot be calculated from this trial. NO means EITHER the
median disease-free survival is not reported for one or both arms OR there is no reported
statistically significant difference in median disease-free survival between the arms.
Enter the median disease-free survival for the experimental/new arm in the box labelled “Median New”
and the value for the control/standard arm in the box labelled “Median Control” (e.g. Median New = 8.1
months, Median Control = 6.3 months) L.
Median New
Median Control
Subtract Median Control from Median New and enter the value in Box 1 (e.g 8.1-6.3 = 1.8)
BOX 1 Divide Box 1 by Median Control, and enter the value in Box 2 (e.g. 1.8/6.3 = 0.286)
BOX 2 Multiply Box 2 by 100 and enter the value into the box labelled “DFS Score”. (e.g. 0.286 x 100 = 28.6)
DFS Score
Copy this value to Step 4 into the box labeled “Clinical Benefit Score”. Continue with the instructions in Step 2.
K A statistically significant difference will likely be reported as either a log-rank p-value or as an increase in disease-free survival with a confidence interval that does not include no difference (e.g. improved survival of 3 months (95% CI 1-6 months). Disease-free survival may be reported as event-free survival., but the event definitions should be reviewed to ensure that the outcome is measuring disease-free status. Do not use median time to recurrence, median time to cancer-related death, or similar measures that do not incorporate death from all causes as part of the definition. If a statistically significant HR for overall survival, median overall survival difference, or HR for disease-free survival is reported, go back to section 1.A., section 1.B. and/or section 1.C. L Ensure that the two values are in the same units (i.e. both months, both days).
Notes
6

Step 2 – Toxicity Scoring
2. A. For each toxicity that was reported that is considered clinically relevantM, determine the
percentage of patients in each arm that experienced a Grade 1 or 2 toxicity (G1-2) and the percentage of
patients that experienced a Grade 3 or 4 toxicity (G3-4) of that type.N
TABLE 1 – Experimental/New Treatment Toxicity
Grade 1 and 2 percentage >=10%
Grade 1 and 2 percentage >0% and <10%
Grade 3 and 4 percentage >=5%
Grade 3 and 4 percentage >0% and<5%
Total Experimental/New (Sum of Totals by
Category)
Toxicities (list out)
Number of Toxicities
Weight 1 0.5 2 1.5
Total by Category (Number * Weight)
TABLE 2 – Standard/Control Treatment Toxicity
Grade 1 and 2 percentage >=10%
Grade 1 and 2 percentage >0% and <10%
Grade 3 and 4 percentage >=5%
Grade 3 and 4 percentage >0% and<5%
Total Standard/Control (Sum of Totals by
Category)
Toxicities (list out)
Number of Toxicities
Weight 1 0.5 2 1.5
Total by Category (Number * Weight)
2.B. Continue below.
M For this purpose, a clinically relevant toxicity is a toxicity that is experienced by the patient, as opposed to a laboratory value, physiological measurement, or similar. N These percentages may need to be calculated by the rater from the published information. For example, if the percentage of patients that experienced a G3-4 toxicity and the percentage that experienced toxicity of any grade are reported, the G1-2 toxicity may be calculated as the difference between those values (assuming no Grade 5 toxicity). Or, if toxicity is reported by Grade, the sum of the Grade 1 and 2 percentages is the G1-2 toxicity percentage, and the sum of the Grade 3 and 4 percentages is the G3-4 toxicity. However, if toxicities are only reported in aggregate form, or if only a limited number of toxicities are reported separately, calculating a toxicity score, and therefore the overall net health benefit score, may not be possible.
7
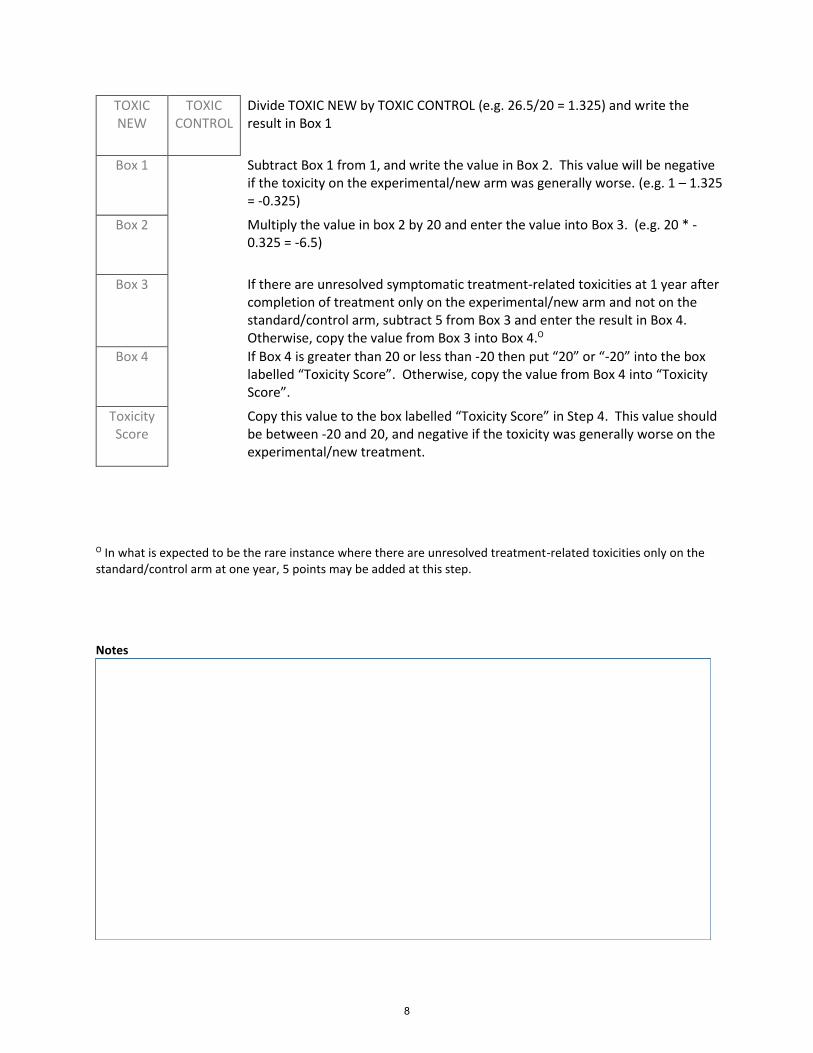
TOXIC NEW
TOXIC CONTROL
Divide TOXIC NEW by TOXIC CONTROL (e.g. 26.5/20 = 1.325) and write the result in Box 1
Box 1 Subtract Box 1 from 1, and write the value in Box 2. This value will be negative if the toxicity on the experimental/new arm was generally worse. (e.g. 1 – 1.325 = -0.325)
Box 2 Multiply the value in box 2 by 20 and enter the value into Box 3. (e.g. 20 * -0.325 = -6.5)
Box 3 If there are unresolved symptomatic treatment-related toxicities at 1 year after completion of treatment only on the experimental/new arm and not on the standard/control arm, subtract 5 from Box 3 and enter the result in Box 4. Otherwise, copy the value from Box 3 into Box 4.O
Box 4 If Box 4 is greater than 20 or less than -20 then put “20” or “-20” into the box labelled “Toxicity Score”. Otherwise, copy the value from Box 4 into “Toxicity Score”.
Toxicity Score
Copy this value to the box labelled “Toxicity Score” in Step 4. This value should be between -20 and 20, and negative if the toxicity was generally worse on the experimental/new treatment.
O In what is expected to be the rare instance where there are unresolved treatment-related toxicities only on the standard/control arm at one year, 5 points may be added at this step.
Notes
8

Step 3 – Tail of the Curve Bonus Points
If no Kaplan-Meier curves are reported for overall or disease-free survival, go on to Step 4. No bonus
points can be awarded.
Record the median overall survival, or the median disease-free survival if overall survival is not reported,
for the standard/control arm in Box 1. (e.g. 12.3 months)
Box 1 Multiply the value in Box 1 by 2 and record in Box 2. (e.g. 12.3 months * 2 = 24.6 months)
Box 2 Locate the value in Box 2 on the time axis of the published Kaplan-Meier curve of overall (or disease-free, if appropriate) survival.P Determine the OS or DFS at this time point for the standard/control arm and enter in Box 3. If this value is less than or equal to 20%, stop the calculation; no Tail of the Curve Bonus should be awarded.
Box 3 Determine the OS or DFS for the experimental/new arm at the same time point and enter in Box 4.
Box 4 If Box 3 is >= 1.5 times the value of Box 4, then enter 20 in the box labelled “Tail of Curve Bonus”.
Tail of Curve Bonus
Copy this value to the box labelled “Tail of Curve Bonus” in Step 4.
P This process should be done either using paper and ruler or in imaging editing software unless the tail of the curve bonus is self-evidently applicable. See the worked examples.
Notes
9

Step 4 – Net Health Benefit
Clinical Benefit Score
The Clinical Benefit Score was calculated in steps 1.A., 1.B., 1.C., 1.D. or 1.E.
Toxicity Score
The Toxicity score was calculated in step 2. It will be negative if the experimental/new treatment is generally more toxic than the standard/control treatment and will be positive if it is generally less toxic.
Tail of the
Curve Bonus
The Bonus points were calculated in step 3.
Add the Clinical Benefit Score, Toxicity Score, and Bonus Points together and put the result into the box labelled “Net Health Benefit”
Net Health Benefit
This is the Net Health Benefit (NHB) of the experimental/new treatment compared to the standard/control treatment.
NOTE: The ASCO NHB Score Advanced Worksheet has a worked example that will be useful in
understanding how the worksheet can be used.
Notes
10
ASCO Value Framework Net Health Benefit Worksheet: Adjuvant Setting

© 2019 American Society of Clinical Oncology (ASCO). All Rights Reserved Worldwide.For more information, visit asco.org/value.
11