Value Chain Analysis Soybean - … · COMPETITIVENESS PROJECT ... Land Preparation 21 ... for...
95
RAJASTHAN AGRICULTURAL COMPETITIVENESS PROJECT Value Chain Analysis Soybean Prepared by: AGRI BUSINESS PROMOTION FACILITY
Transcript of Value Chain Analysis Soybean - … · COMPETITIVENESS PROJECT ... Land Preparation 21 ... for...

RAJASTHAN AGRICULTURAL COMPETITIVENESS PROJECT
Value Chain Analysis
Soybean
Prepared by:
AGRI BUSINESS PROMOTION FACILITY
Value Chain Analysis – Soybean i
Contents
Page
List of Table iii
List of Figure iv
Executive Summary: Soybean 1
1.1. Global Scenario 7
1.2. Indian Scenario 12
1.3. State Scenario: Rajasthan 15
1.4. District & Cluster Scenario 16
1.5. Approach to Value Chain Analysis 17
1.6. Resourcing mapping of value chain 17
1.7. Marketable surplus of Soybean in Cluster 18
Chapter 2- Pre Harvest Management 20
2.1. Major Commercial Varieties Grown in Rajasthan 20
2.2. New Initiatives & Practice 20
2.3. Seasonality Pattern of Soybean in Rajasthan visa-vis other parts of the world 21
2.4. Land Preparation 21
2.5. Sowing/Planting/Cultivation 21
2.6. Climatic & Soil Requirement 22
2.7. Nutrient Management 22
2.8. Water Management 23
2.9. Weed Management 23
2.10. Disease & pest Management 23
2.11. Recommended Good Agricultural Practices 26
2.12. Harvesting 26
2.13. Pre-Harvesting Constraints 27
Chapter-3: Post-Harvest Management 28
3.1. Post-Harvest Losses, Harvesting Care and Post–Harvest Equipment 28
3.2. Grade Specification & Grading at Producer Level 30
3.3. Major Storage Disease and Pest and their Control Measure 34
Chapter4. Cost of production & Net accruals to producer 36
Chapter 5- Supply Chain of commodity 37

Value Chain Analysis – Soybean ii
5.1. Seasonal Availability & Price Pattern 37
5.2. Existing Marketing Channels 39
5.3. Alternative System of Marketing 40
Chapter 6- Processing Infrastructure availability and utilization 43
6.1. Processing 43
6.2. Stakeholder’s Share in Consumer Rupee 48
6.3. Price build up & Marketing Efficiency Analysis 49
6.4. Consumer Preference Analysis 49
Chapter 7- Existing Institutional support and Infrastructure facility 51
7.1. Support at Cultivation stage 51
7.2. Support at post-harvest, Primary and Secondary Processing stage 56
Chapter 8- Gap & Constraint Analysis 59
8.1. As Perceived by Producers and Other Stakeholder 59
8.2. SWOT Analysis of the Pre-intervention Value Chain 61
8.3. Key constraints in Soybean crop 62
8.4. PIESTEC Framework 65
8.5. Impact of GST over Soybean value chain: 67
Chapter 9- Proposed Intervention and Investments 68
9.1. Intervention areas for Value chain strengthening 68
9.2. Envisaged Post-intervention Value Chain Map of Soybean 72
9.2.1. Proposed Post Intervention Value Chain Map 72
9.2.2. Intervention through FPC in the Soybean Value Chain Crop 74
9.3. Outcomes of value chain study 76
9.4. Conclusion 77
Annexure 1: Stakeholder’s consulted over the study 79
Annexure 2: List of Central Warehousing Corporation (CWC) Warehouses in Rajasthan 80
Annexure 3: List of State Warehousing Corporation (SWC) Warehouses in Rajasthan 82
Annexure 4: Product wise GST rates of Food Products 84
Annexure 5: Detailed PIESTEC Analysis of Soybean 88
Value Chain Analysis – Soybean iii
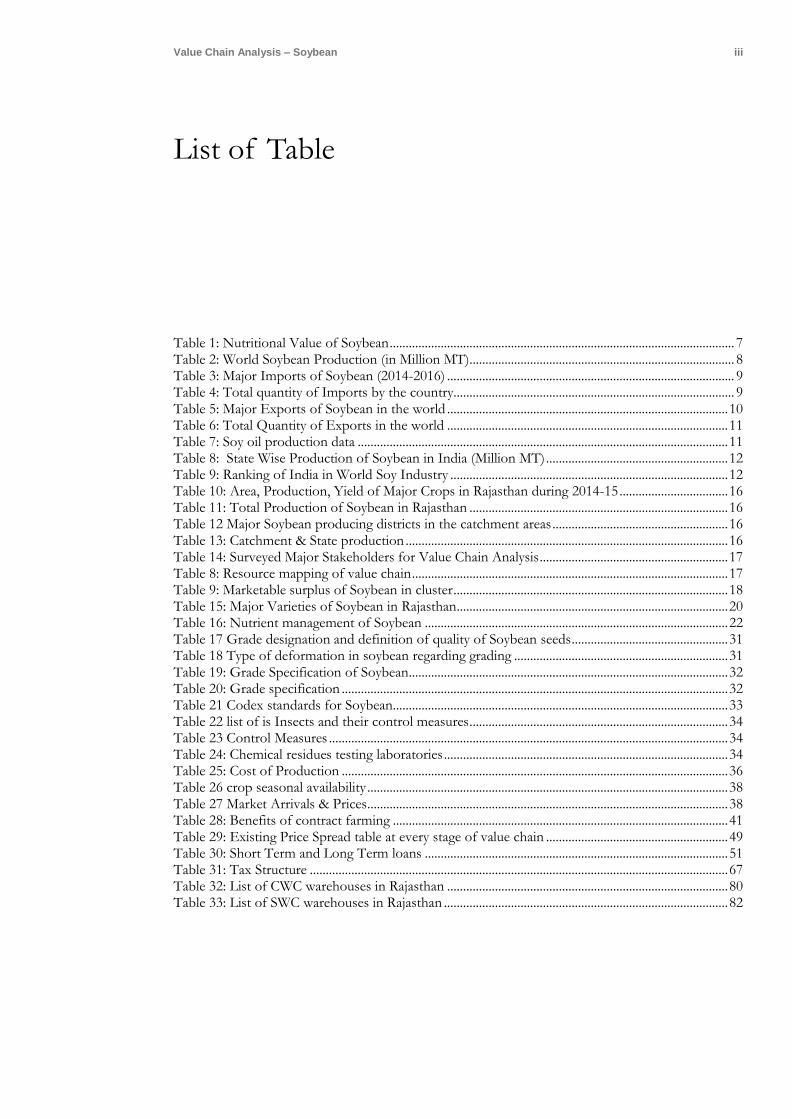
List of Table
Table 1: Nutritional Value of Soybean ............................................................................................................ 7 Table 2: World Soybean Production (in Million MT)................................................................................... 8 Table 3: Major Imports of Soybean (2014-2016) .......................................................................................... 9 Table 4: Total quantity of Imports by the country........................................................................................ 9 Table 5: Major Exports of Soybean in the world ........................................................................................ 10 Table 6: Total Quantity of Exports in the world ........................................................................................ 11 Table 7: Soy oil production data .................................................................................................................... 11 Table 8: State Wise Production of Soybean in India (Million MT) ......................................................... 12 Table 9: Ranking of India in World Soy Industry ....................................................................................... 12 Table 10: Area, Production, Yield of Major Crops in Rajasthan during 2014-15 .................................. 16 Table 11: Total Production of Soybean in Rajasthan ................................................................................. 16 Table 12 Major Soybean producing districts in the catchment areas ....................................................... 16 Table 13: Catchment & State production ..................................................................................................... 16 Table 14: Surveyed Major Stakeholders for Value Chain Analysis ........................................................... 17 Table 8: Resource mapping of value chain ................................................................................................... 17 Table 9: Marketable surplus of Soybean in cluster ...................................................................................... 18 Table 15: Major Varieties of Soybean in Rajasthan ..................................................................................... 20 Table 16: Nutrient management of Soybean ............................................................................................... 22 Table 17 Grade designation and definition of quality of Soybean seeds ................................................. 31 Table 18 Type of deformation in soybean regarding grading ................................................................... 31 Table 19: Grade Specification of Soybean .................................................................................................... 32 Table 20: Grade specification ......................................................................................................................... 32 Table 21 Codex standards for Soybean......................................................................................................... 33 Table 22 list of is Insects and their control measures ................................................................................. 34 Table 23 Control Measures ............................................................................................................................. 34 Table 24: Chemical residues testing laboratories ......................................................................................... 34 Table 25: Cost of Production ......................................................................................................................... 36 Table 26 crop seasonal availability ................................................................................................................. 38 Table 27 Market Arrivals & Prices ................................................................................................................. 38 Table 28: Benefits of contract farming ......................................................................................................... 41 Table 29: Existing Price Spread table at every stage of value chain ......................................................... 49 Table 30: Short Term and Long Term loans ............................................................................................... 51 Table 31: Tax Structure ................................................................................................................................... 67 Table 32: List of CWC warehouses in Rajasthan ........................................................................................ 80 Table 33: List of SWC warehouses in Rajasthan ......................................................................................... 82

Value Chain Analysis – Soybean iv
List of Figure
Figure 1: Total value of Imports by the countries......................................................................................... 9 Figure 2 Total quantities of Imports by the country .................................................................................. 10 Figure 3: Major Exporters of Soybean in World (Million MT) ................................................................. 10 Figure 4: Total quantity of exports in the world ......................................................................................... 11 Figure 5: Imports of Soybean ........................................................................................................................ 13 Figure 6: Average Prices of Soybean ............................................................................................................. 14 Figure 7: Major Soybean Producing Parts in India ..................................................................................... 15 Figure 8: Seasonal Availability Pattern .......................................................................................................... 21 Figure 9: Post Harvest Management ............................................................................................................ 28 Figure 10 Post Harvest Losses of Soybean .................................................................................................. 29 Figure 11: Supply Chain of Commodity ....................................................................................................... 37 Figure 12: Proposed Post Intervention Value chain map of Soybean ..................................................... 39 Figure 13: Soy Oil ............................................................................................................................................. 43 Figure 14: Animal Feed .................................................................................................................................. 43 Figure 15: Process flow chart of Soya Oil .................................................................................................... 44 Figure 16: Process Flow chart of Soy oil ...................................................................................................... 45 Figure 17: Process Flow chart of Soya Flakes.............................................................................................. 46 Figure 18: Process Flow chart of Soya Tofu ................................................................................................ 47 Figure 19: Process Flow chart of Soya Sauce ............................................................................................... 48 Figure 20: Discussion with Farmers at village Samlopur, Pratapgarh ..................................................... 59 Figure 21: Discussion with Mr. Goyal .......................................................................................................... 61 Figure 22: PIESTEC Analysis of Soybean ................................................................................................... 66 Figure 23: Intervention Plan of soybean along with stakeholders’ matrix .............................................. 71 Figure 24: Proposed Post Intervention Value chain map of Soybean ..................................................... 73 Figure 25: FPC Development Approach ...................................................................................................... 74
Value Chain Analysis – Soybean 1
Executive Summary: Soybean
Soybean (Glycine max) is known as the “Golden Bean” of the 20th century. It is grown in tropical,
subtropical, and temperate climates and is the world’s largest cultivated oilseed. It is the world's
foremost provider of protein having a significant amount of essential amino acids and oil. Soybean
is a legume crop, yet it is widely cultivated as oilseed crop. It is now the second largest oilseed in
India after groundnut. Due to its popularity, the international trade is importing Soybean to
supplement their domestic requirement for human consumption and cattle feed.
Notably, the commodity has been commercially exploited for its utility as edible oil and animal feed.
On crushing the mature beans, around 18% oil could be obtained, the rest being oil cake/meal,
which forms the prime source of protein in animal feeds. Of late, the commodity is being exploited
for manufacturing of a variety of value added snack foods like edible grade soya meal, soya milk,
tofu, nuggets, flour, extruded proteins, etc.
In the global context, US, Brazil, Argentina, China and India are the major producers in decreasing
order of production of soybean. USA is followed by France, Canada, UK and South Korea in the
global export of Soybean. Ukraine is followed by Benin, Germany, India and USA in the global
import of Soybean.
With 12 million tonnes of production, soybean is one of the fastest growing crops in India. Soybean
is grown in the Kharif season in India. Importantly, The top three largest soybean growing states are
Madhya Pradesh, Maharashtra and Rajasthan. Madhya Pradesh and Maharashtra have 45% and 40%
share in production respectively. Indore, Ujjain, Dewas, Mandsore in Madhya Pradesh, Nagpur in
Maharashtra, Kota in Rajasthan are the major trading centres of Soybean.
Baran is the highest soybean cultivating district in Rajasthan with a production of 155787 MT. Other
major soybean producing districts are Kota, Jhalawar, Pratapgarh, Chittorgarh and Bundi..The major
clusters in the RACP project where Soybean is cultivated are Kushalgarh, Palayatha, Orai Bassi,
Jakham and Sangod Among the pool of varieties, the highest yielding early variety of soybean
grown is JS95-60 which yields around 2000-3000 kg/ha. It is followed by the variety JS93-05 which
yields around 2500-3000 kg/ha.
Post-harvest losses occur at different stages viz. harvesting, threshing, winnowing, storage,
packaging, and transportation, processing and marketing of soybean. Harvesting of soybean is done
manually. After harvesting, thresher is the main post harvest equipment used. During storage at
farmer’s level, spoilage and losses may occur due to mishandling, use of very old and damaged
gunny bags and rodents. The post- harvest losses from harvesting ascribed to threshing are 1 to 2%
Value Chain Analysis – Soybean 2
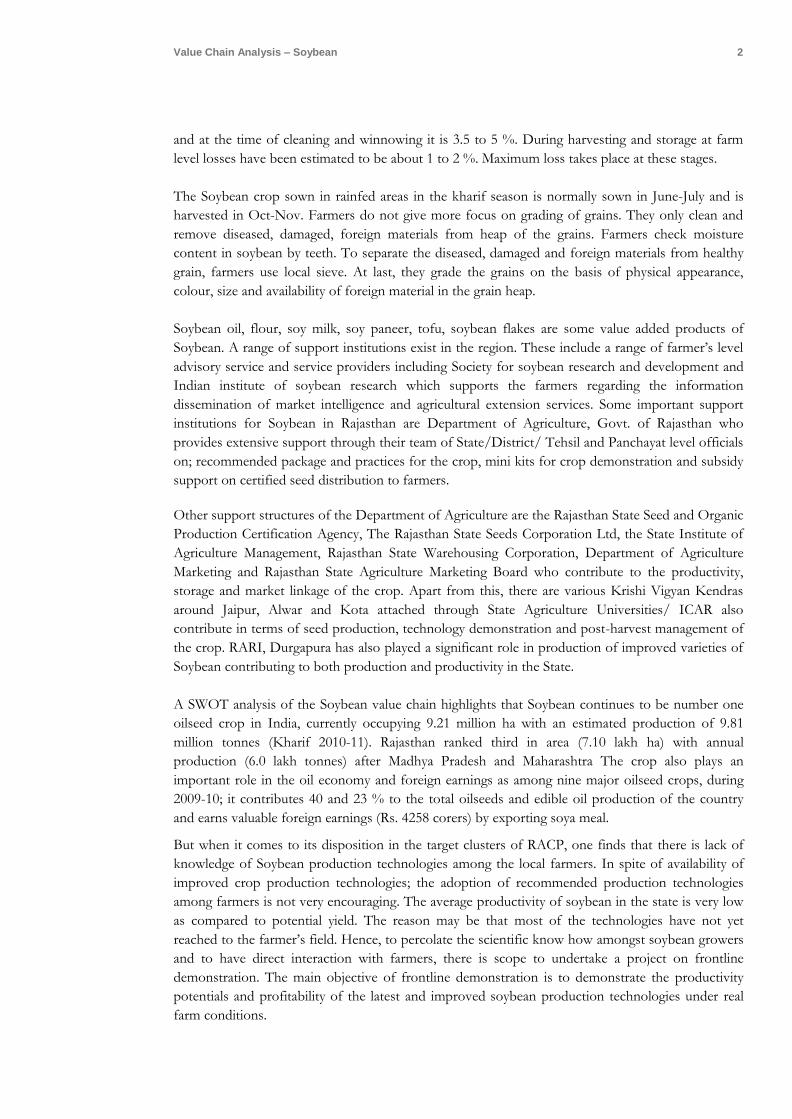
and at the time of cleaning and winnowing it is 3.5 to 5 %. During harvesting and storage at farm
level losses have been estimated to be about 1 to 2 %. Maximum loss takes place at these stages.
The Soybean crop sown in rainfed areas in the kharif season is normally sown in June-July and is
harvested in Oct-Nov. Farmers do not give more focus on grading of grains. They only clean and
remove diseased, damaged, foreign materials from heap of the grains. Farmers check moisture
content in soybean by teeth. To separate the diseased, damaged and foreign materials from healthy
grain, farmers use local sieve. At last, they grade the grains on the basis of physical appearance,
colour, size and availability of foreign material in the grain heap.
Soybean oil, flour, soy milk, soy paneer, tofu, soybean flakes are some value added products of
Soybean. A range of support institutions exist in the region. These include a range of farmer’s level
advisory service and service providers including Society for soybean research and development and
Indian institute of soybean research which supports the farmers regarding the information
dissemination of market intelligence and agricultural extension services. Some important support
institutions for Soybean in Rajasthan are Department of Agriculture, Govt. of Rajasthan who
provides extensive support through their team of State/District/ Tehsil and Panchayat level officials
on; recommended package and practices for the crop, mini kits for crop demonstration and subsidy
support on certified seed distribution to farmers.
Other support structures of the Department of Agriculture are the Rajasthan State Seed and Organic
Production Certification Agency, The Rajasthan State Seeds Corporation Ltd, the State Institute of
Agriculture Management, Rajasthan State Warehousing Corporation, Department of Agriculture
Marketing and Rajasthan State Agriculture Marketing Board who contribute to the productivity,
storage and market linkage of the crop. Apart from this, there are various Krishi Vigyan Kendras
around Jaipur, Alwar and Kota attached through State Agriculture Universities/ ICAR also
contribute in terms of seed production, technology demonstration and post-harvest management of
the crop. RARI, Durgapura has also played a significant role in production of improved varieties of
Soybean contributing to both production and productivity in the State.
A SWOT analysis of the Soybean value chain highlights that Soybean continues to be number one
oilseed crop in India, currently occupying 9.21 million ha with an estimated production of 9.81
million tonnes (Kharif 2010-11). Rajasthan ranked third in area (7.10 lakh ha) with annual
production (6.0 lakh tonnes) after Madhya Pradesh and Maharashtra The crop also plays an
important role in the oil economy and foreign earnings as among nine major oilseed crops, during
2009-10; it contributes 40 and 23 % to the total oilseeds and edible oil production of the country
and earns valuable foreign earnings (Rs. 4258 corers) by exporting soya meal.
But when it comes to its disposition in the target clusters of RACP, one finds that there is lack of
knowledge of Soybean production technologies among the local farmers. In spite of availability of
improved crop production technologies; the adoption of recommended production technologies
among farmers is not very encouraging. The average productivity of soybean in the state is very low
as compared to potential yield. The reason may be that most of the technologies have not yet
reached to the farmer’s field. Hence, to percolate the scientific know how amongst soybean growers
and to have direct interaction with farmers, there is scope to undertake a project on frontline
demonstration. The main objective of frontline demonstration is to demonstrate the productivity
potentials and profitability of the latest and improved soybean production technologies under real
farm conditions.

Value Chain Analysis – Soybean 3
They also face the non-availability of improved & good quality seed. There is lack of grading and
storage facilities. There is inadequate infrastructure/ facilities with producers, traders, millers and at
market level resulting in marketing inefficiencies. The large number of intermediaries in the chain
leads to low income to producer which eats into the margins of farmers. Obsolete techniques are
being used in processing, which reduces output. Fluctuations in supply (based on production),
coupled with export-import dynamics, make prices of Soybean unstable which obviously affects
producers and consumers both. Inadequate sorting, grading facility near production site fetches
lesser price to farmers. There are sizeable post-harvest losses due to in-efficient storage practices.
The procurement is mostly controlled by large players apart from State governments. There is also
non-availability of private storage facilities/ silos near production centres for storing round the year.
These weaknesses can be removed with the intervention opportunities such as setting up a FPC in
the cluster which would then have a scope for tie up of FPCs through FCSC with firms like adani
wilmar, Ruchi soya, local processors, MSME firms, housing societies in urban areas and retail
outlets. There is also scope for facilitation of start-ups from amongst FPCs or individual
entrepreneurs, in secondary processing of value added products of Soybean like flour, bakery
products, etc. There is also scope for establishment of quality sorting and grading facilities as part of
FCSC, along with facilities for packaging and vehicle to facilitate transportation. The FPC can then
promote good agricultural practices with regard to planting, harvesting, use of inputs, disease
management, pest control, etc. through FCSC. FPCs can also undertake joint input sourcing
activities for seeds, fertilizers, pesticides, etc. under the umbrella of CFC or FCSC as well as facilitate
custom hiring services and hence lead farm mechanization through CFC.
The price spread and values accrued to stakeholders across the chain reflects the profit margins
accrued to different stakeholders. Farmer shares 25% of the consumer’s rupee while the shares of
traders, processors, wholesalers and retailers are about 1%, 13%, 4% and 57% respectively. 74% of
the value accruals are accrued to processors, wholesalers and retailers. Producers’ incomes are
apparently dependent on yield as well as their dependency on the type of end product (eg. Soybean
seeds, oil, soy tofu, soy milk, etc.). Here in the existing value chain of Soybean, the price build up
has been calculated for the important first channel where the target consumers are urban households
and institutional buyers. The product considered is soybean oil.
Typically farmers sell the raw Soybean at about Rs 3000 per quintal to traders. In the local mandis, it
was sold by traders to the processors at Rs 3150 per quintal (with commission about 3.5% and cess
of 1.5%). The processors, upon primary and secondary value addition, sell soybean oil to
wholesalers at Rs 4725 (gross margin about 50%). Thereafter the wholesale and retail prices are set
up at Rs 5150 per quintal and 12000 per quintal with a gross margin of 9% and 133% respectively.
Due to limited infrastructure facilities at the dispersal of various stakeholders, marketing efficiency is
adversely affected. Due to limited infrastructure facilities at the dispersal of various stakeholders,
marketing efficiency is adversely affected.
The pre and post intervention value chain for the commodity may be viewed as follows:
Pre Intervention Value Chain: Soybean
The present pre-intervention or value chain for Soybean may be viewed as one with three critical
production-distribution or activity-marketing channels. The product is largely marketed by farmers
through the APMC. Channel 1 may be viewed in terms of one for soybean oil while channel 2 is for
feed market. The producers market their produce in both value chains through local traders/
processors and APMC Commission agents largely. Channel 3 is meant for export. The producers
Value Chain Analysis – Soybean 4
market their produce in both value chains through local traders and APMC Commission agents
largely. There are total post-harvest losses of 5-9% in the storage, handling, transportation of
soybean at every stakeholder’ point.
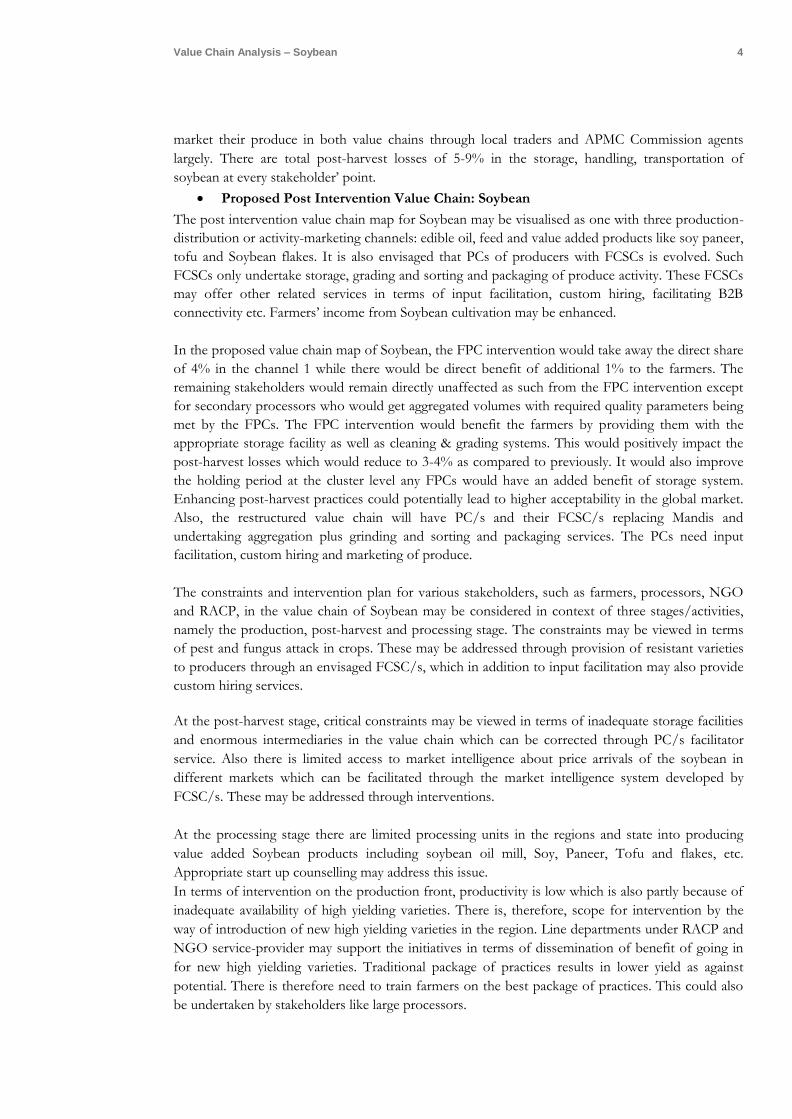
Proposed Post Intervention Value Chain: Soybean
The post intervention value chain map for Soybean may be visualised as one with three production-
distribution or activity-marketing channels: edible oil, feed and value added products like soy paneer,
tofu and Soybean flakes. It is also envisaged that PCs of producers with FCSCs is evolved. Such
FCSCs only undertake storage, grading and sorting and packaging of produce activity. These FCSCs
may offer other related services in terms of input facilitation, custom hiring, facilitating B2B
connectivity etc. Farmers’ income from Soybean cultivation may be enhanced.
In the proposed value chain map of Soybean, the FPC intervention would take away the direct share
of 4% in the channel 1 while there would be direct benefit of additional 1% to the farmers. The
remaining stakeholders would remain directly unaffected as such from the FPC intervention except
for secondary processors who would get aggregated volumes with required quality parameters being
met by the FPCs. The FPC intervention would benefit the farmers by providing them with the
appropriate storage facility as well as cleaning & grading systems. This would positively impact the
post-harvest losses which would reduce to 3-4% as compared to previously. It would also improve
the holding period at the cluster level any FPCs would have an added benefit of storage system.
Enhancing post-harvest practices could potentially lead to higher acceptability in the global market.
Also, the restructured value chain will have PC/s and their FCSC/s replacing Mandis and
undertaking aggregation plus grinding and sorting and packaging services. The PCs need input
facilitation, custom hiring and marketing of produce.
The constraints and intervention plan for various stakeholders, such as farmers, processors, NGO
and RACP, in the value chain of Soybean may be considered in context of three stages/activities,
namely the production, post-harvest and processing stage. The constraints may be viewed in terms
of pest and fungus attack in crops. These may be addressed through provision of resistant varieties
to producers through an envisaged FCSC/s, which in addition to input facilitation may also provide
custom hiring services.
At the post-harvest stage, critical constraints may be viewed in terms of inadequate storage facilities
and enormous intermediaries in the value chain which can be corrected through PC/s facilitator
service. Also there is limited access to market intelligence about price arrivals of the soybean in
different markets which can be facilitated through the market intelligence system developed by
FCSC/s. These may be addressed through interventions.
At the processing stage there are limited processing units in the regions and state into producing
value added Soybean products including soybean oil mill, Soy, Paneer, Tofu and flakes, etc.
Appropriate start up counselling may address this issue.
In terms of intervention on the production front, productivity is low which is also partly because of
inadequate availability of high yielding varieties. There is, therefore, scope for intervention by the
way of introduction of new high yielding varieties in the region. Line departments under RACP and
NGO service-provider may support the initiatives in terms of dissemination of benefit of going in
for new high yielding varieties. Traditional package of practices results in lower yield as against
potential. There is therefore need to train farmers on the best package of practices. This could also
be undertaken by stakeholders like large processors.

Value Chain Analysis – Soybean 5
There have been limited efforts in capacity building of farmer leaders (entrepreneurs) and BODs at
the field- level. In this regard, it may be appropriate for ABPF to enable formation of FPCs to meet
minimum scale requirements for upgrading as well as developing alternate market channels. Also,
bank linkages under KCC scheme etc. may be explored. The RACP and line departments need also
work in coordination with the NGO/service providers and the KVK etc. on high moisture content
in harvested Soybean, harvesting of immature grains and inadequate post-harvest infrastructure
facilities for storage and drying at farm level. The storage facility may be established as an FCSC
with assistance under the project.
There is also need for awareness seminars and B2B meets amongst processors and producers on the
options for Special Licence and to source directly from producers (effectively aggregated into FPCs/
FPCs). Scope for re-orientation of Agri- marketing policy with reduced mandi taxes on direct
procurement; and related capacity building interventions for farmers is a necessity that may be
facilitated by the ABPF.
It is felt that the project has further scope of strengthening Soybean value chain by (a) creation of
more FPCs (b) incentivizing FPCs to undertake activities such as primary processing, custom hiring
centre and seed production programme (c) convergence among State Govt. of Rajasthan,
Universities, industry and FPCs regarding supply of breeder seed and building strategies for
conversion of breeder to foundation and certified seeds. Connecting farmers to Commodity
exchange, scientific storage under Central/state warehousing corporation and linking farmers to
banks as all farmers who transact with large processors would hold bank account and have
improved marketability of Soybean under PPPP model. This should be promoted in big way.
The report on the value chain analysis of Soybean clearly brings out that unlike any other
enterprises, agriculture is highly dependent on external factors like nature for its success. This
perpetual environment of high risk and vulnerability has significantly lowered farmers’ confidence
and suppressed their entrepreneurial instincts as was depicted in the discussions held at the cluster
level meetings. In soybean value chain, farmers have not been able to gain higher
remuneration/value for their produce due to lack of direct linkages with processors/consumer
market. Thus RACP along with the market driven intervention of ABPF, aims to integration of
farmers to join hands for a collective cause, help and even push them move up the agriculture value
chains to actively participate in market functions, an unexplored lucrative territory for them so far.
This would spur vertical business integration and diversify portfolios to reduce their vulnerabilities.
Thus in the Common facility centre of FPC as per the proposed intervention, cleaning, grading and
packaging would primarily be done, leading to uniform grades of soybean seeds with appropriate
quality and packaging. Moreover, the moisture content would be monitored to avoid any infestation
during storage. Moreover, the harvesting process would also be more mechanized, which reduces
losses due to post harvest farm activities (threshing, separating, etc.). Storage would largely be done
in the large silos/bins which are monitored & treated regularly to prevent losses from pest attacks.
The transportation would primarily through closed locked and tracked vehicles. This reduces both
the natural losses and pilferage
The major role of ABPF- GT would in this circumstance also be to carry out capacity building
initiatives of the potential leaders (BoDs) of the FPC, NGO staff and PMU staff line, conducting
value chain studies of the crops (market led), plan interventions to improve the returns to the
farmers in the 17 project clusters, develop the business plan for registered producer companies in
clusters, support and assist agri start-ups in the region, and thus develop overall market linkages.

Value Chain Analysis – Soybean 6
The formation of FPC supported by RACP ABPF, local NGOs and facilitation centres like KVKs,
provides the much needed opportunity to farmers to favourably and positively change their outlook
in years to come.

Value Chain Analysis – Soybean 7
Chapter 1- Introduction
The soybean (Glycine max) is known as the “Golden Bean” of the 20th century. It is grown in
tropical, subtropical, and temperate climates. Soybean is the world’s largest cultivated oilseed. The
soybean is often called the miracle crop. It is the world's foremost provider of protein and oil. It is a
good source of protein because it contains a significant amount of essential amino acids. Soybean is
a legume crop, yet it is widely used as oilseed. Due to its very poor cook ability and digestibility on
account of inherent presence of trypsin inhibitor, it cannot be utilized as a pulse. It is now the
second largest oilseed in India after groundnut. It has emerged as one of the important commercial
crop in many countries. Due to its popularity, it is also being imported to supplement the domestic
requirement for human consumption and cattle feed, soy mill/Deoiled cake is being exported to
many countries.1
Table 1: Nutritional Value of Soybean
Sr. No. Components Percentage
1 Proteins 40
2 Carbohydrates 30
3 Fiber 5
4 Lecithin 0.5
5 Saponin 4
6 Oil 18-20
The commodity has been commercially exploited for its utility as edible oil and animal feed. On
crushing the mature beans, around 18% oil could be obtained, the rest being the oil cake/meal,
which forms the prime source of protein in animal feeds of late, the commodity is being exploited
for manufacturing of various snack foods like edible grade soy meal, soya milk, tofu, nuggets, flour,
extruded proteins, etc.
1.1. Global Scenario
1.1.1. Continent Wise Production, Area and Yield of Soybean
Soybean is an important global crop and processed soybean is the largest source of protein feed and
second largest source of vegetable oil in the world. The major portion of the global and domestic
crop is solvent-extracted with hexane to yield soy oil and obtain soymeal, which is widely used in the
animal feed industry. It is estimated that above 85% of the output is crushed worldwide. Though, a
very small proportion of the crop is consumed directly by humans, soybean products appear in a
large variety of processed foods.

Value Chain Analysis – Soybean 8
The cultivation of soybean is successful in climates with hot summers, with temperatures between
20°C to 30°C being optimum. Temperatures below 20°C and over 40°C are found to retard growth
significantly. It can grow in a wide range of soils, with optimum growth in moist alluvial soils with a
good organic content. Modern soybean varieties generally reach a height of around 1 m (3 ft), and
take 80-120 days from sowing to harvesting. The annual global soybean production has been in the
range of 278-342 million tonnes in the recent years (2013-14 to 2015-16), accounting for 55-58% of
total global oilseed output of around 390-400 million tonnes. US, Brazil, Argentina, China and India
are the major soybean producing countries with production in order of 91-117, 82-107, 49-56, 12-13
and 10-12 million tonnes in the recent couple of years. Weather, acreage under other competitive
crops like corn, cotton and pests & diseases are the major factors influencing production. While in
US, India and China crop starts arriving from Aug-Sept, it starts from Jan-Feb in U.S. America.
1.1.2. World Soybean Production2
As per recent SOPA statistics, it has been observed that USA was the global leader in Soybean
production with a production quantity of 116 Million MT for the year 2016-17. USA has been the
consistent leader since past 5 years followed by Brazil and Argentina. Other major countries with
respect to production are China, India, Paraguay, Canada, Mexico and other EU countries. The
following table shows the exact figures of the Global Production of Soybean country wise.
Table 2: World Soybean Production (in Million MT)
Year US Brazil Argentina China India Paraguay Canada Other Total
2016-17 117 107 57 13 10 9 6 20 333
2015-16 107 97 57 12 7 9 6 18 313
2014-15 107 97 61 12 9 8 6 19 320
2013-14 91 87 53 12 9 8 5 16 282
2012-13 83 82 49 13 12 8 5 16 269
Source http://www.sopa.org/statistics/
1.1.3. Important World Soy Markets
Chicago Mercantile Exchange, which acquired Chicago Board of Trade - the world's oldest soy
futures market; Dalian Commodity Exchange - trades the most liquid soybean contracts in the world
Argentina and Brazil FOB determine the physical prices
1.1.4. Major Imports of Soybean in World (Million MT)3
As per reports of January 2014 to November 2016, the global leader in imports of Soybean was
Ukraine with an import value of USD 5,492,361 followed by Benin, Germany, India and USA. The
detailed numerical of the global import value of the top 5 countries and their share percentage have
been given in the table below. Ukriane, being the leader, accounts for 33.6% of the total value of
global soybean imports for the period January 2014 to November 2016. The figure given below
represents the share of the top 5 countries which lead in total value of global soybean imports:
2 http://www.sopa.org/statistics/world-soybean-production/ (Retrieved on 10th April 2017)
3 Zauba technologies & data search( https://www.zauba.com/import-soybean-hs-code.html)(Retrieved on 11th April 2017)

Value Chain Analysis – Soybean 9
Table 3: Major Imports of Soybean (2014-2016)
Country Total Value of Imports (USD) Total Share in Imports Value (In %)
Ukraine 5,492,361 33.6
Benin 2,166,897 15.2
Germany 1,966,517 13.8
India 1,693,583 11.9
USA 1,012,393 7.1
Others 1,889,922 18.4
Figure 1: Total value of Imports by the countries
With respect to the country’s leading in terms of quantity of global Soybean imports, Saudi Arabia
topped the list and forms 18% of the global share with export value of 12,419,930 MT. It is
followed by Benin and further India and so on. The following table shows the top 5 countries in
terms of total quantity of global imports of Soybean and their global share. It is observed that
Ukraine, being the global leader, accounts for 55.3% share in the total quantity of global soybean
imports. It is succeeded by Benin with 20.1% share and further by India with 12.5% share. The
following figure shows the distribution of the top 5 countries with respect to the quantity of global
Soybean imports during the period January 2014 to November 2016:
Table 4: Total quantity of Imports by the country
Country Total Quantity of Imports (In MT) Total Share in Imports Quantity (In %)
Ukraine 12,419,930 55.3
Benin 4,519,825 20.1
India 2,802,912 12.5
Ethiopia 1,168,000 5.2
USA 805,522 3.6
Others 731,298 3.3
34%
15% 14%
12%
7%
18%
Value of Import
Ukraine
Benin
Germany
India
USA
Others

Value Chain Analysis – Soybean 10
Figure 2 Total quantities of Imports by the country
1.1.5. Major Exporters of Soybean in World (Million MT)4
As per reports of January 2014 to November 2016, the global leader in exports of soybean was USA
with an export value of USD 66,329,577. USA is followed by France, Canada, UK and South Korea.
The detailed numerical of the global export value of the top 5 countries and their share percentage
have been given in the table below. USA, being the leader, accounts for 18.8% of the total value of
global soybean exports for the period January 2014 to November 2016. The figure given below
represents the share of the top 5 countries which lead in total value of global soybean exports.
Table 5: Major Exports of Soybean in the world
Country Total Value of Exports (USD) Total Share in Exports Value (In %)
USA 66,329,577 18.8
France 38,590,505 10.9
Canada 36,568,234 10.4
UK 28,967,464 8.2
South Korea 25,035,971 7.1
Others 157,100,826 44.6
Figure 3: Major Exporters of Soybean in World (Million MT)
4 Zauba technologies & data search(https://www.zauba.com/export-indian+soybean+meal-hs-code.html) ( Retrieved on 11th April 2017)
55% 20%
13%
5% 4% 3%
Quantity of Import
Ukarine
Benin
India
Ethiopia
USA
Others
19%
11%
10%
8% 7%
45%
Value of Export
USA
France
Canada
UK
South Korea
Others

Value Chain Analysis – Soybean 11
With respect to the countries who are leading in terms of quantity of global soybean exports, USA
tops the list and forms 16.4% of the global share with export value of 91,872,507 MT. It is followed
by France and further Canada and others. The following table shows the top 5 countries in terms of
total quantity of global exports of soybean and their global percent share. USA is succeeded by
France with 11.8% share and further by Canada with 9.3% share. The following figure shows the
distribution of the top 5 countries with respect to the quantity of global soybean exports during the
period January 2014 to November 2016:
Table 6: Total Quantity of Exports in the world
Country Total Quantity of Exports Total Share in Exports Quantity (In %)
USA 91,872,507 16.4
France 66,368,273 11.8
Canada 52,115,169 9.3
South Korea 48,939,580 8.7
UK 41,070,256 7.3
Others 261,111,779 46.5
Figure 4: Total quantity of exports in the world
Source http://www.sopa.org/statistics/
Considering the world Soy oil production data for the past 5 years, it can be observed that the year
2011-2012 witnessed the highest quantity of soy oil production with a total production quantity of
21.03 Million MT. Since 2011-2012, the soy oil production has seen a declining trend as the
production quantity has been decreasing gradually. The exact figures for the past 5 years have been
given in the table below.
Table 7: Soy oil production data
Oil Year Soybean Crushed (In Million Metric Ton)
Extraction Produced (In Million Metric Ton)
Oil Produced (In Million Metric Ton)
Total
2015-16 5.75 4.715 1.035 11.5
2014-15 6.8 5.576 1.224 13.6
2013-14 8.126 6.664 1.462 16.25
16%
12%
9%
9% 7%
47%
Quantity of Export
USA
France
Canada
South Korea
UK
Others

Value Chain Analysis – Soybean 12
2012-13 10.121 8.299 1.822 20.24
2011-12 10.516 8.623 1.893 21.03
Source: http://www.sopa.org/statistics/
1.2. Indian Scenario
1.2.1. Major Trading Centres
Indore, Ujjain, Dewas, Mandsore in Madhya Pradesh, Akola, Sangli, Nagpur in Maharashtra and
Kota in Rajasthan are major trading centres in India.
1.2.2. State Wise Production of Soybean in India (Million MT)5
Table 8: State Wise Production of Soybean in India (Million MT)
Name of State
2009-10 2010-11 2011-12 2012-13 2013-14 2014-15 2015-16 2016-17
Madhya Pradesh
6.41 5.6 6 5.7 5.24 6.35 3.41 5.72
Maharashtra 2.2 2.7 3.75 4.65 4.75 2.38 2.2 3.95
Rajasthan 0.91 1.1 0.65 1.01 0.97 0.96 0.79 0.95
Andhra Pradesh
0.13 0.16 0.15 0.34 0.4 0.26 0.16 0.24
Karnataka 0.08 0.18 0.18 0.3 0.27 0.19 0.18 0.25
Others 0.24 0.06 0.06 0.24 0.23 0.23 1.83 3.01
All India 9.96 9.5 11.5 12.24 11.86 10.37 8.57 14.12
Source: Directorate of Economics and Statistics, Department of Agriculture and Cooperation5
With 14.12 million tonnes of production, soybean is one of the fastest growing crops in India.
Soybean is grown as a kharif crop in India. The top three largest soybean growing states are Madhya
Pradesh, Maharashtra and Rajasthan. Madhya Pradesh having 41% and 28% share in production
respectively. Soybean is recognized as one of the premier crops around the world. It’s a major
source of vegetable oil, protein and animal feed.
1.2.3. Major Indian Markets
Indore, Ujjain, Dewas, Mandsore in Madhya Pradesh, Nagpur in Maharashtra, Kota in Rajasthan are
the major trading centers. India’s main growing areas are Madhya Pradesh and Maharashtra, which
account for 80% percent of production.
Table 9: Ranking of India in World Soy Industry
India (In Million tonnes) World (In Million tonnes) % Share
Annual Seed Production 6 180 3
Annual Oil Production 1 30 3.3
Annual Oil Imports 1.5 9 16.7
Annual Oil Consumption 2.5 30 8.3
Annual Meal Production 3.5 130 3.5
Annual Meal Exports 2.5 43 5.8
5 Directorate of Economics and Statistics, Department of Agriculture and Cooperation

Value Chain Analysis – Soybean 13
Annual Meal Consumption 1 130 0.7
1.2.4. Imports of Soybean 6
As per statistics from January 2014 to November 2016, the total value of global soybean imports has
been calculated to be USD 14,221,673. The soybean market has seen huge changes with respect to
the value of soybeans imported globally. During the year 2016, the prices have drastically increased
above previous levels. The following figure shows the total values (in USD) of global soybean
imports month wise for the period January 2014 to November 2016. The total quantity of global
soybean imports for the period January 2014 to November 2016 amounts to 22,447,487 MT. The
year 2016 has witnessed an increase in the quantity metric tonnes of global soybean import.
Compared to the previous years, the year 2016 has seen the highest quantity of global soybean
imports. The details of global imports of soybean in terms of quantity for the period January 2014 to
November 2016 have been given in the figure below
Figure 5: Imports of Soybean
1.2.5. Export of Soybean7
It has been observed that global prices trend for soybean export has not improved much as there are
no significant increases in the value of global soybean exports over the past few months. Instead,
the year 2014 proved to be good in terms of value of global soybean exports. During the year 2016,
the prices have more or less remained at normal levels as compared to the previous years though
there has been some value addition towards the end of the year. The following figure shows the
total values (in USD) of global soybean exports month wise for the period January 2014 to
November 2016. The total quantity of global Soybean exports for the period January 2014 to
November 2016 amounts to 561477564 MT. The year 2016 was initially stable in terms of quantity
of global soybean export but increased during the period of October-November 2016. The details of
global exports of soybean in terms of quantity for the period January 2014 to November 2016 have
been given in the figure below:
5 Source: Directorate of Economics and Statistics, Department of Agriculture and Cooperation
7 Zauba technologies & data search(https://www.zauba.com/export-indian+soybean+meal-hs-
code.html) ( Retrieved on 11th April 2017)
0500000
100000015000002000000250000030000003500000400000045000005000000
Total Value USD
Total Quantity
Value Chain Analysis – Soybean 14
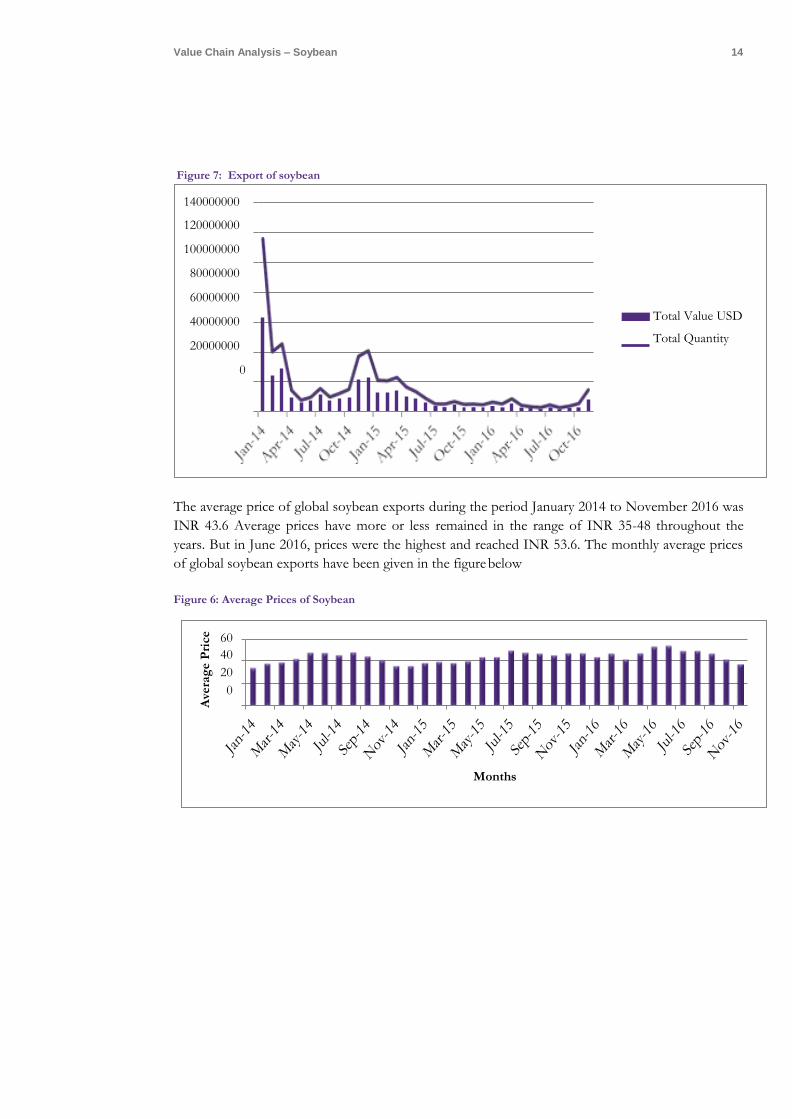
Figure 7: Export of soybean
The average price of global soybean exports during the period January 2014 to November 2016 was
INR 43.6 Average prices have more or less remained in the range of INR 35-48 throughout the
years. But in June 2016, prices were the highest and reached INR 53.6. The monthly average prices
of global soybean exports have been given in the figure below
Figure 6: Average Prices of Soybean
140000000
120000000
100000000
80000000
60000000
40000000
20000000
Total Value USD
Total Quantity
60
40
20
Months
Ave
rag
e P
rice
Value Chain Analysis – Soybean 15
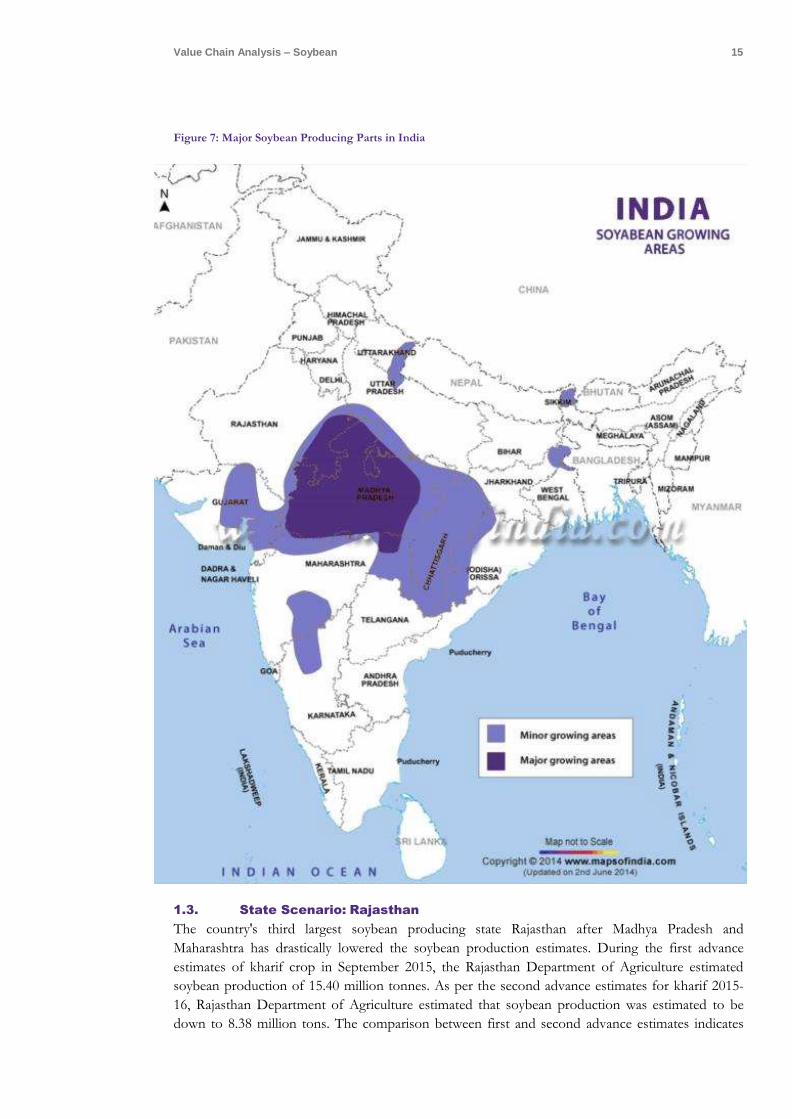
Figure 7: Major Soybean Producing Parts in India
1.3. State Scenario: Rajasthan
The country's third largest soybean producing state Rajasthan after Madhya Pradesh and
Maharashtra has drastically lowered the soybean production estimates. During the first advance
estimates of kharif crop in September 2015, the Rajasthan Department of Agriculture estimated
soybean production of 15.40 million tonnes. As per the second advance estimates for kharif 2015-
16, Rajasthan Department of Agriculture estimated that soybean production was estimated to be
down to 8.38 million tons. The comparison between first and second advance estimates indicates
Value Chain Analysis – Soybean 16
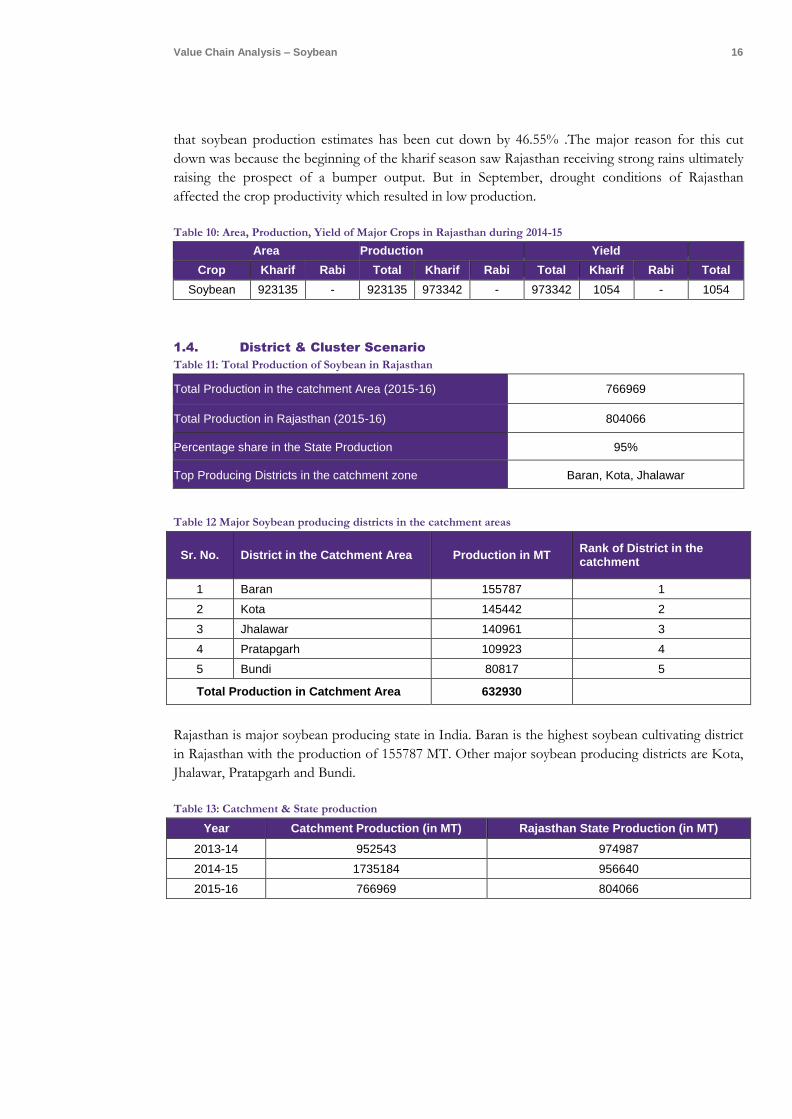
that soybean production estimates has been cut down by 46.55% .The major reason for this cut
down was because the beginning of the kharif season saw Rajasthan receiving strong rains ultimately
raising the prospect of a bumper output. But in September, drought conditions of Rajasthan
affected the crop productivity which resulted in low production.
Table 10: Area, Production, Yield of Major Crops in Rajasthan during 2014-15
Area Production Yield
Crop Kharif Rabi Total Kharif Rabi Total Kharif Rabi Total
Soybean 923135 - 923135 973342 - 973342 1054 - 1054
1.4. District & Cluster Scenario
Table 11: Total Production of Soybean in Rajasthan
Total Production in the catchment Area (2015-16) 766969
Total Production in Rajasthan (2015-16) 804066
Percentage share in the State Production 95%
Top Producing Districts in the catchment zone Baran, Kota, Jhalawar
Table 12 Major Soybean producing districts in the catchment areas
Sr. No. District in the Catchment Area Production in MT Rank of District in the catchment
1 Baran 155787 1
2 Kota 145442 2
3 Jhalawar 140961 3
4 Pratapgarh 109923 4
5 Bundi 80817 5
Total Production in Catchment Area 632930
Rajasthan is major soybean producing state in India. Baran is the highest soybean cultivating district
in Rajasthan with the production of 155787 MT. Other major soybean producing districts are Kota,
Jhalawar, Pratapgarh and Bundi.
Table 13: Catchment & State production
Year Catchment Production (in MT) Rajasthan State Production (in MT)
2013-14 952543 974987
2014-15 1735184 956640
2015-16 766969 804066

Value Chain Analysis – Soybean 17
1.5. Approach to Value Chain Analysis
Evaluation of the value chain of the commodity was held in consultations with major stakeholders
in the chain including Farmers, Consumers, Processors, Traders, supporting public and private
service providers and institutions etc. Some major clusters were considered for the survey within the
state.
Table 14: Surveyed Major Stakeholders for Value Chain Analysis
Surveyed Markets for the Value Chain Analysis
Within and Outside Rajasthan
Soyabean 1. Farmers in Bansur cluster (5) 2. Framer in Baswara cluster (5) 3. Farmer in Baran cluster (5) 4. Farmer in Orai-Basii cluster (5) 5. Farmers in Jakham cluster (5) 6. Farmers in Sangod cluster (5) 7. Shyam Dhani Industries Pvt Ltd., Jaipur 8. MDH Masala, Nagaur 9. M/S Premchand, Kota 10. Sohan Agro Mills PVT. LTD, Kota 11. Manish Enterprises, Kota 12. Khnana Khazana Foods, Ajmer 13. Mr. Mukesh Agrawal, Nagaur 14. Azad Agro Enterprises, Kota (Trader) 15. Bansilal Nagar, Palathya 16. Vinay Bansal, Anaj Mandi, Kota 17. Kamlesah Dhamani,Anaj Mandi, Kota 18. Ankit Mehta, Kota 19. DPM,Dep.of Agriculture , Palathya 20. DC,Water recourses, Palathya 21. PC, KVK. Baran 22. SMS, KVK, Baran 23. DD, Dept. of Agriculture, Baran 24. JD, Dept. of Agriculture, Palathya 25. T.L, NGO, Palathya 26. CMS, NGO, Palathya 27. PC, KVK, Baran 28. Director, Agriculture University, Kota 29. PD, ATMA, Kota 30. T.L, NGO, Sangod 31. SMS,NGO, Sangod
1.6. Resourcing mapping of value chain
Resource mapping of Soybean value chain is done by identification cluster, major mandis, major
markets, warehouses, etc. Following is the detail resource mapping of value chain:
Table 15: Resource mapping of value chain
Cluster Major mandi/s around cluster Distance from major cities nearby
Major Markets
Warehouses/ Cold store with Capacity in MT
No of FPCs targeted

Value Chain Analysis – Soybean 18
Palayatha (Baran)
a. Atru b. Baran c. Kawai Salpura
60 km 30 km 80 Km
Baran (3), Jalore (1), Chittorgarh (2), Kota (2), Bundi
Baran (27520) Antah (9200) Atru (5400) Chhabra (11550) Siswali (6750)
2
Kushalgarh (Banswara)
a. Bundi, b. Kota
83 km 88 km
Bhilwara (4), Chittorgarh (6), Pali (3), Kota (3)
Banswara (12200 MT)
2
Gudha (Bundi)
a. Bundi b. Kishoraipatan c. Sumerganj d. Dei
-17 km -70 km -120 km -70 km
Ajmer (6), Baran (4), Kota (3), Sawai Madhopur (1), Tonk (4)
Bundi (24620 MT) Kapren (6750 MT) Keshoraipatan (6000 MT)
2
Jakham (Pratapgarh)
a. Pratapgarh b. Dhariawad c. Nimbaheda
-20 Km -10 Km -20 km
Baran (4), Bundi (4), Chittorgarh (6), Kota (3)
Pratapgarh (18450)
2
Orai bassi (Chittorgarh)
a. Chittorgarh b. Nimbahera c. Pratapgarh d. Begu e. Badisadri f. Neemuch
-25-40 km -55 km -145 km -20 Km -60 Km -60-70 km
Ajmer (6), Bhilwara (4), Bundi (4), Chittorgarh (6), Kota (3), Tonk (4)
Chittorgarh (17250 MT) Nimbahera (13500 MT)
2
Manoharthana (Jhalawar)
a. Aklera b. BhawaniMandi c. Jhalarapatan d. Khanpur
Bhavanimandi (14550 MT) Jhalrapatan (18900 MT) Khanpur (6750 MT)
2
Sangod (Kota)
a. Kota b. Baran c. Sangod d. Khanpur
Itawa (4400 MT) Ramganjmandi (9650 MT) MT) Sultanpur
2
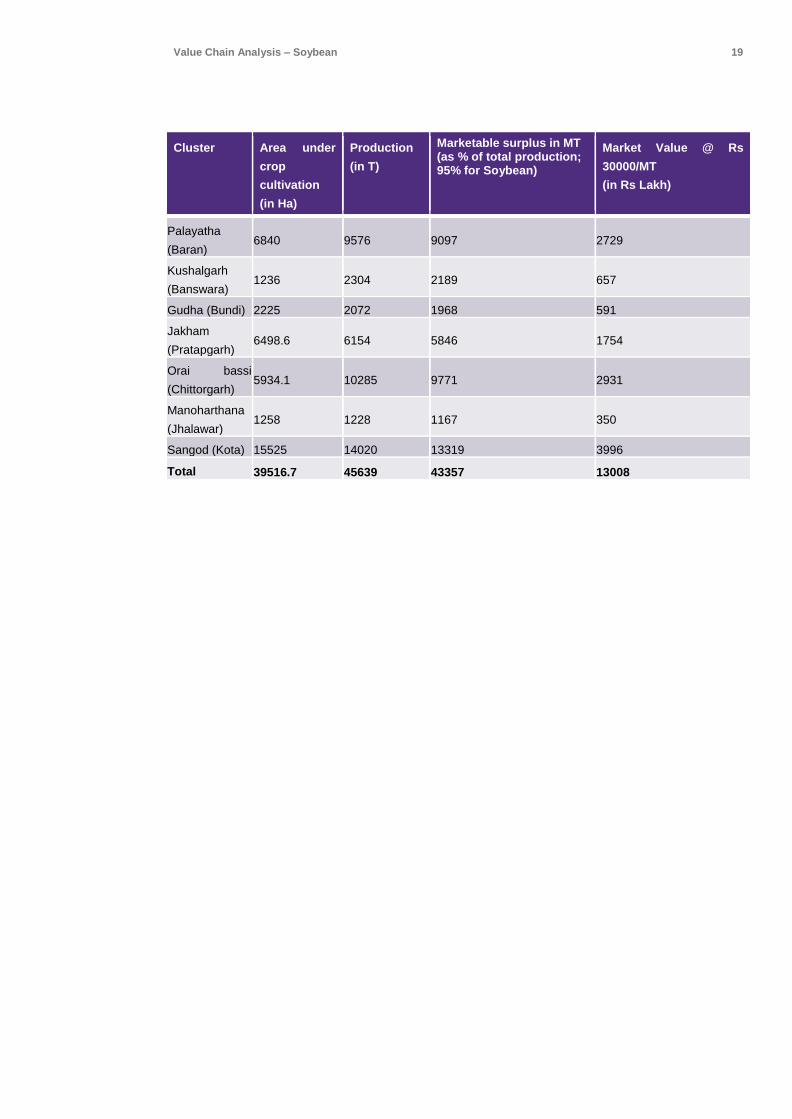
1.7. Marketable surplus of Soybean in Cluster
Following is the marketable surplus of Soybean in cluster:
Table 16: Marketable surplus of Soybean in cluster
Value Chain Analysis – Soybean 19
Cluster Area under
crop
cultivation
(in Ha)
Production
(in T)
Marketable surplus in MT (as % of total production; 95% for Soybean)
Market Value @ Rs
30000/MT
(in Rs Lakh)
Palayatha
(Baran) 6840 9576 9097 2729
Kushalgarh
(Banswara) 1236 2304 2189 657
Gudha (Bundi) 2225 2072 1968 591
Jakham
(Pratapgarh) 6498.6 6154 5846 1754
Orai bassi
(Chittorgarh) 5934.1 10285 9771 2931
Manoharthana
(Jhalawar) 1258 1228 1167 350
Sangod (Kota) 15525 14020 13319 3996
Total 39516.7 45639 43357 13008

Value Chain Analysis – Soybean 20
Chapter 2- Pre Harvest Management
2.1. Major Commercial Varieties Grown in Rajasthan
There are numerous varieties, both traditional, hybrid and newly developed of soybean grown in the
state of Rajasthan. Among the pool of varieties, the highest yielding variety of soybean grown is PK-
416 which yields around 3200-3800 kg/ha. Also, this variety has the highest oil percent which ranges
from 41% to 56%. It is followed by the variety PK-1042 which yields around 3300 kg/ha. Detailed
yields and oil percentages of the major commercial varieties grown in Rajasthan are given below:8
Table 17: Major Varieties of Soybean in Rajasthan
State Name of Variety Yield (Kg./ha.) Oil percent
Uttar Pradesh and Rajasthan
Alankar 2200 --
Ankur 2300 --
Clark – 63 1800 --
PK-1042 3300 --
PK-262 2800 --
PK-308 2600 20-23
PK-327 2300 --
PK-416 3200-3800 41-56
PK-564 3000 --
Shilajeeth 2200 --
2.2. New Initiatives & Practice
Soybean is filled with a variety of products designed to provide significant yield improvements,
improved weed- and insect-control options, as well as products designed to produce the
nutritionally-improved oil profiles that consumers are demanding. Soybean breeding research
focuses on developing varieties that improve yield and yield stability while providing resistance to
insects and disease.
Nutritionally-Improved Oils on the Horizon
Consumers and food companies are increasingly demanding better oils and farmers are eager to
deliver them. Vistive® Gold high oleic and Soymega™ SDA Omega-3 Soybeans are two of the
soybean products in that are designed to help farmers deliver on that demand. Vistive® Gold
Soybeans combine breeding and biotechnology to produce soybean oil with mono-unsaturated fat
levels similar to olive oil and the low saturated fat content of canola oil. This would allow the food
industry to cost-effectively eliminate trans fats and significantly lower saturated fat content in food
8 http://agmarknet.gov.in

Value Chain Analysis – Soybean 21
products to help consumers meet recent dietary guidelines. This oil product would also significantly
improve frying stability of the oil while maintaining the flavor and economics of soybean oil.
Vistive® Gold would allow farmers to help meet the growing demand for better oils with a
domestically produced soybean-based option. Soymega™ SDA Omega-3 Soybeans are designed to
produce oil with omega-3 fatty acids. Omega-3 fatty acids traditionally found in fatty fish have
reported health benefits including heart health*. Similar to soybean oil in taste and shelf life, oil from
these soybeans could be used as an ingredient in a wide range of food applications such as yogurt,
granola bars and spreads. Soymega™ SDA Omega-3 Soybeans could provide consumers a new
option to obtain desirable omega-3 fatty acids from foods rich in SDA omega-3—a further
opportunity for farmers to help deliver health benefits to consumers.
2.3. Seasonality Pattern of Soybean in Rajasthan visa-vis other parts of the
world
Soybean is sown in the period of June to July. The harvesting time for soybean in Rajasthan is from
October and continued till November.
Figure 8: Seasonal Availability Pattern
Crop Calendar Jan Feb Mar April May June July Aug Sept Oct Nov Dec
US Sowing Harvesting
Brazil Harvesting Sowing
Argentina Harvesting Sowing
China Sowing Harvesting
India Sowing Harvesting
Rajasthan Sowing Harvesting
2.4. Land Preparation9
It requires a good seedbed with a reasonable fine texture and not too many clods. Land should be
well levelled and be free from crop stubble. One deep ploughing with mould board plough followed
by two harrowing or two ploughing with local plough are sufficient. There should be optimum
moisture in the field at the time of sowing.
2.5. Sowing/Planting/Cultivation10
A. Seed Rate
1) CO 1 - 80 kg/ha Optimum plant population 3, 33,000/ha.
2) CO 2 (irrigated) Pure crop: 60-70 kg/ha; Inter crop: 25 kg/ha
3) CO (Soy) 3 Pure crop: 50 kg/ha
B. Seed Treatment with Fungicides
1) Treat the seeds with Carbendezim or Thiram @ 2g/kg of seed 24hrs before sowing or with
talc formulation of Trichoderma viride @ 6 g/kg seed (or) Pseudomonas fluorescens @ 10
g/kg seed.
2) Biocontrol agents are compatible with bio fertilizers.
3) First treat the seeds with biocontrol agents and then with Rhizobium.
4) Fungicides and biocontrol agents are incompatible.
9 http://www.thepatriot.co.zw/old_posts/preparation-and-planting-of-soybeans/
1010 http://www.thepatriot.co.zw/old_posts/preparation-and-planting-of-soybeans/

Value Chain Analysis – Soybean 22
C. Seed Treatment with Bio fertilizer
1) Treat the seeds at least 24 hours before sowing.
2) Treat the seeds with 3 packets (600 g/ha) of Rhizobial culture and 3 packets (600 g/ha) of
Phosphobacteria P5B using surfacants rice kanji as binder. If the seed treatment is not
carried out apply 10 packets of Rhizobium (2000 g/ha) and 10 packets (2000 of
Phosphobacteria with 40-50 kg of FYM before sowing. Dry the bacterial culture treated
seeds in shade for 15 minutes before sowing.
D. Plant Spacing
The planting depth is critical. In sandy or light soils, seeds can be placed up to four centimetres (cm)
deep. In heavy soils (high clay content) a depth of two – three cm is adequate. If planted too deep,
soybean will fail to emerge. If it rains soon after planting, a crust may form that will hinder
germination. A light spike harrowing across the rows will aid germination. Line rowing is generally
preferred and seed drill is required to grow soybean in appropriate depth in line keeping row to row
30-45 cm and plant to plant 10-15 cm.
2.6. Climatic & Soil Requirement11
Soybean grows well in warm and moist climate. A temperature of 26.5°C to 30°C appears to be the
optimum for most of the varieties. Soil temperatures of 15.5°C or above favour rapid germination
and vigorous seedling growth. The minimum temperature for effective growth is about 10°C. A
lower temperature tends to delay the flowering. Day length is the key factor in most of the soybean
varieties as they are short day plants and are sensitive to photo-periods. Most of the varieties will
flower and mature quickly if grown under condition where the day length is less than 14 hours
provided that temperatures are also favourable.
Well drained and fertile loam soils with a pH between 6.0 and 7.5 are most suitable for the
cultivation of soybean. Sodic and saline soils inhibit germination of seeds. In acidic soils, liming has
to be done to raise the pH up to seven. Water logging is injurious to the crop and resistant to the
soybean growth.
2.7. Nutrient Management
It is recommended to apply 20 kg of Nitrogen/ha, 40 kg P2O5/ha and 40 kg K2O/ha as basal
application for higher yield. The application of 10 tonnes FYM/ha is also recommended during the
field preparation. The seed of soybean treated with biofertilizer (Rhizobium) then 20 kg N/Ha is
sufficient but in case of no seed enoculation then apply 40 kg N/Ha as base dose.
Table 18: Nutrient management of Soybean
Sr. No Fertilizers Average Dose
1 Urea 20-40
2 SSP 250
3 MOP 66
4 ZnSO4 25
5 Borax 5.0
(Source: Agmarknet)
11 www.spuvvn.edu

Value Chain Analysis – Soybean 23
2.8. Water Management
The soybean crop generally does not require any irrigation during kharif season. However, if there is
a long spell of drought at the time of pod filling, irrigation would be desirable. During excessive
rains, proper drainage is also equally important.
2.9. Weed Management12
Alachlor may be applied to the irrigated crop at 2 kg ai/ha or Pendimethalin 1 kg ai/ha after sowing
followed by one hand weeding at 30 days after sowing. If herbicide spray is not given it requires two
hands weeding at 20 and 35 days after sowing.
2.10. Disease & pest Management
The various insects, diseases, and pests infecting the soybean crop at various stages of cultivation are
given below-
1. Steam Fly
This is major pest of soybean in all the soybean growing
areas in India as well as in world.
Symptoms of damage: The adult flies are shining black
and about 2 mm long. The damaging stage is maggot which
is white in colour and remains inside the stem. Female adults
lay eggs inside the cotyledon or leaves. After hatching from
eggs, the maggots mine through the leaf and reach the
petiole. From petiole, they enter the branch and stem, and feed on xylem and phloem. This results
in non-availability of food material to the plants. When the plant are attacked in an early stage of
leaf, then upper half of the leaf show sign of gradual withering. When grown up plants are attacked,
they do not show any external symptoms of damage except the exit holes made by the maggots for
emergence of adults. Infestation due to flies reduces the grain yield by 16 to 20%. With proper
control measures at least 12% yield loss can be avoided.
Control Measures: Soil application of Phorate 10 G @ 10 kg/ha or Carbofuran 3 G @ 30 kg/ha at
the time of sowing will prevent early infestation by stem fly. One or two sprays of 0.07%, or 0.03%,
Dimethoate 30 EC or 0.05%, Quinalphos 25 EC can stop the damage. Thimethoxam 30 FS 5-6
ml/kg seed treatment is applied.
2. Thrips
They attack soybean from August to October during
Kharif. Long, hot and humid atmosphere during Kharif
season is found to be more congenial for their
multiplication. Adults are minute, yellowish brown in
colour wit feeble wings.
12 https://www.spuvvn.edu/academics/academic_centres/agro_economic_centre/research_studies/R.%20 No.%20152%20Pre%20&%20Post%20Harvets%20Losses-%20Raj.pdf
Value Chain Analysis – Soybean 24
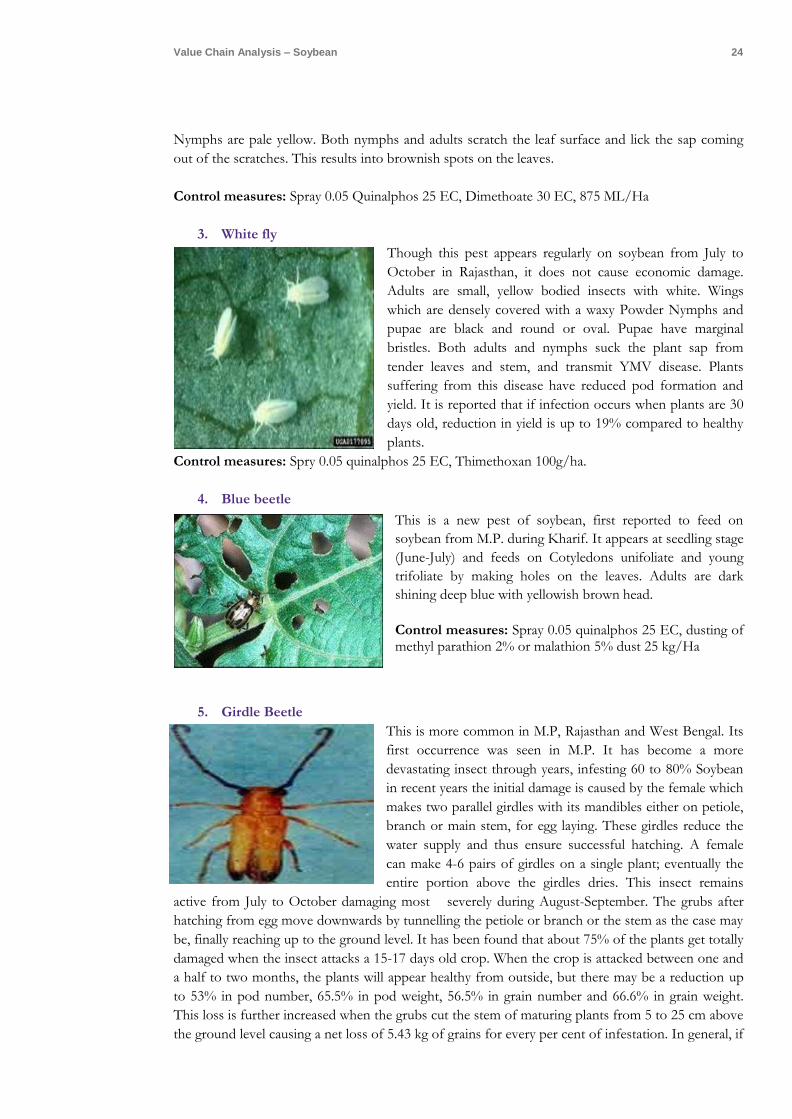
Nymphs are pale yellow. Both nymphs and adults scratch the leaf surface and lick the sap coming
out of the scratches. This results into brownish spots on the leaves.
Control measures: Spray 0.05 Quinalphos 25 EC, Dimethoate 30 EC, 875 ML/Ha
3. White fly
Though this pest appears regularly on soybean from July to
October in Rajasthan, it does not cause economic damage.
Adults are small, yellow bodied insects with white. Wings
which are densely covered with a waxy Powder Nymphs and
pupae are black and round or oval. Pupae have marginal
bristles. Both adults and nymphs suck the plant sap from
tender leaves and stem, and transmit YMV disease. Plants
suffering from this disease have reduced pod formation and
yield. It is reported that if infection occurs when plants are 30
days old, reduction in yield is up to 19% compared to healthy
plants.
Control measures: Spry 0.05 quinalphos 25 EC, Thimethoxan 100g/ha.
4. Blue beetle
This is a new pest of soybean, first reported to feed on
soybean from M.P. during Kharif. It appears at seedling stage
(June-July) and feeds on Cotyledons unifoliate and young
trifoliate by making holes on the leaves. Adults are dark
shining deep blue with yellowish brown head.
Control measures: Spray 0.05 quinalphos 25 EC, dusting of methyl parathion 2% or malathion 5% dust 25 kg/Ha
5. Girdle Beetle
This is more common in M.P, Rajasthan and West Bengal. Its
first occurrence was seen in M.P. It has become a more
devastating insect through years, infesting 60 to 80% Soybean
in recent years the initial damage is caused by the female which
makes two parallel girdles with its mandibles either on petiole,
branch or main stem, for egg laying. These girdles reduce the
water supply and thus ensure successful hatching. A female
can make 4-6 pairs of girdles on a single plant; eventually the
entire portion above the girdles dries. This insect remains
active from July to October damaging most severely during August-September. The grubs after
hatching from egg move downwards by tunnelling the petiole or branch or the stem as the case may
be, finally reaching up to the ground level. It has been found that about 75% of the plants get totally
damaged when the insect attacks a 15-17 days old crop. When the crop is attacked between one and
a half to two months, the plants will appear healthy from outside, but there may be a reduction up
to 53% in pod number, 65.5% in pod weight, 56.5% in grain number and 66.6% in grain weight.
This loss is further increased when the grubs cut the stem of maturing plants from 5 to 25 cm above
the ground level causing a net loss of 5.43 kg of grains for every per cent of infestation. In general, if

Value Chain Analysis – Soybean 25
25% of the total plant population is infested by girdle beetle, an inevitable loss of about 136 kg/ha is
observed. Early sowing is more prone to attack. The grubs of this insect which tend to fail to
complete their development within the same season enter into diapauses during winter. The grubs
cut small portion of the stem and crawl along with it by remaining inside and closing one end of it.
Finding a suitable place in the crevices they close the other end also and remain till the onset of
monsoon (July) when the grubs develop into pupae from which adults emerge out in 8-11 days and
again start infesting the crop.
Control Measures
Mechanical removal of dried (infested) leaves can reduce the population of eggs and grubs of girdle
beetle and grow resistant varieties. Soil application of Phorate 10 G @ 10 kg/ha or Carbofuran 3G
@ 30 kg/ha at the time of sowing will prevent early infestation by girdle beetle and stem fly. One or
two sprays of 0.03% Dimethoate 30 EC or 0.05% Quinalphos 25 EC or 0.05% Methyl demethon 25
EC or 0.04% Monocrotophos 36 SC can check further damage. These insecticides have been
reported to have detrimental effect on eggs and newly hatched grubs of girdle beetle reducing 90%
of their population.
Diseases
1. Bacterial Pustule
This disease is caused by Xanthomonas Campestris Pv. Glycine Dowson. This is one of the most
important diseases of soybean in India and causes up to 18 % losses to the soybean crops. Small
yellowish- green spots with reddish brown Centre are formed at upper surface of the leaf lamina.
The individual spot in the Centre appears slightly raised. Small bacterial Pustules are also found on
the lower lamina of the leaves. The necrotic tissues some time rupture and tear away. Heavy infected
leaves turn yellow in highly susceptible cultivars leading to complete defoliation.
Management: Seed treatment with mixture of copper oxychloride+streptocycline @1.15% + 200
ppm could control the disease effectively. Copper fungicides alone or in combination with the
antibiotic were equally effective. Stabilized Bordeaux mixture spray was also effective against
bacterial pastule, pod blight and brown spot of soybean. Bacterial pastule of soybean can be
effectively controlled through the sprays of a mixture of Fytolan (0.3%) + Streptocycline (300 ppm)
or copper oxychloride 50 wp (1.6 kg) + streptocycline (160g)
2. Bacterial Blight
Bacterial blight is distributed widely and appears on the leaves, stems and pods as light to dark-
brown irregular spots without any marginal halo. The lesions become confluent as they enlarge the
necrotic tissues dry and drop out. With humidity, limited amount of grey or brown exudates
accumulates on the surface of lesions. Defoliation and injury to the pods are rarely found due to this
disease.
Management: Infected crop residues should invariably be burnt. Foliar sprays immediately after the
initiation of the disease symptoms should be given with a mixture of copper oxychloride @0.3%
and streptocycline @100 pm.
3. Seed and Seedling Rot
Seed rot, pre and post emergence seedling mortality and root rot of soybean in the field cause major
problems for soybean cultivation. Majority of these seed and seedling diseases are caused by various

Value Chain Analysis – Soybean 26
species of fungi available in the seed or soil. Seed rotting fungi cause damage to the crop to the
extent of 25.8% and allowed only 39-40% seed germination.
Management: Selection of disease free healthy seeds with less than 5-6% moisture is the first
criteria for the desired disease management. Use only certified disease free seeds; seeds should
always be stored in a cool and dry place to avoid any fungal growth in a seed lot.
2.11. Recommended Good Agricultural Practices
A New Weed Management Option for Soybeans
Dicamba is an economical herbicide that controls a wide spectrum of broadleaf weed species,
including tough-to-control and glyphosate-tolerant weeds. The addition of dicamba tolerance to the
existing Genuity® Roundup Ready 2 Yield® soybean platform would provide soybean farmers with
another important tool for a highly-effective and high-yielding weed management system.
The Next Level of Soybean Yield Potential
Collaboration with BASF
One of the most important priorities to a soybean farmer is higher yield. That’s why scientists are
developing multiple generations of higher-yielding soybeans that are designed to boost the intrinsic
yield potential of soybeans through the insertion of key genes. These yield traits are expected to be
stacked with Genuity® Roundup Ready 2 Yield®, dicamba tolerance and other traits in soybean
pipeline, to provide farmers with a significant yield boost over today’s Roundup Ready® soybean
varieties on a highly-effective weed management platform.
In some parts of the world, soybean farmers face costly yield losses due to insect damage. Insect-
protected soybeans use the same Bt technology widely adopted in corn and cotton. The Bt soybean
trait is envisioned to be stacked with Genuity® Roundup Ready 2 Yield® to provide excellent insect
control, weed control and yield enhancement. The second- generation insect-protected trait is
designed to enhance the insect spectrum, to provide enhanced durability and to provide the
opportunity to reduce the refuge for the first-generation insect- protected trait.
Breeding for Resistance to Disease and pests
Scientists use the most advanced technologies available to evaluate the progression of several
damaging soybean diseases globally. This helps to identify which soybeans possess disease resistance
genes and the specific regions of DNA within these soybeans that can be bred into our elite soybean
varieties to enhance resistance to specific diseases. In addition, Monsanto breeders are working on a
family of products with resistance to soybean cyst nematode, as well as phytophthora root rot
resistance.
2.12. Harvesting13
Soybean grows best in temperate, tropical and subtropical regions. They can be grown throughout
the year in the tropics and subtropics, if water is available. It requires well-drained and fertile soil,
400 to 500 mm of precipitation in a season for a good crop. High moisture requirement is critical at
the time of germination, flowering and pod forming stage. Dry weather is essential for ripening. The
flow of grains from the field to consumers includes several operations. All of these operations have
to be appropriately done in order to reduce the risk of altering negatively the quality of the grain.
13 http://unctad.org/en/PublicationsLibrary/INFOCOMM_cp10_Soybeans_en.pdf
Value Chain Analysis – Soybean 27
Because of the availability of harvesting machinery, handling and loading equipment, all operations
from cultivation to transportation, are done in the shorter time possible to avoid grain condition
changes or damages that might affect its conservation and storage. It is necessary to highlight the
importance cultivation processes, including pre-harvest operations (preparation of the land, planting,
irrigation) and post-harvest operations (transport, threshing, drying, cleaning, processing, packaging
and storage).
2.13. Pre-Harvesting Constraints
The constraints faced in cultivation of soybean crop are presented in indicating the severity of
various constraints faced by the selected households in cultivation of soybean crop.
The most important constraint in soybean cultivation as reported by the producers is pests and
disease problem which was also followed by poor seed quality and high cost of inputs. Low output
price and water deficiency was also important constraints faced by farmers in cultivation of soybean.
The major problems of these constraints as reported by producer are as below.
1. Pests and disease problem
The Pests and diseases are not easily controllable Pesticides and fungicides sometimes fail to control
pests and disease. The cost of purchasing pesticides and other medicines is on the higher end,
making them inaccessible to the farmers.
2. Poor seed quality Duplicate seeds or high price of seeds, low quality or low pest resistance power of seeds Producers
face problems regarding the poor seed quality, seed delicacy and low pest resistance.
3. High cost of inputs High price of pesticides, fungicides and fertilizer; Shortage of farm inputs and labour not available
due to high wage rate.
4. Low price of output The farmers do not get expected price for their produce, there is a high fluctuation of crop price.
Government should interfere in price decision.
5. Water deficiency There is a constant lack of irrigation facility electricity and water logging in soybean.
6. Others
At times the climate is not suitable. The wild animals such as blue bulbs and dry cows destroy the
crop. There is even a lack of knowledge in farmers on scientific cultivation of soybean
Value Chain Analysis - Soybean 60
Chapter-3: Post-Harvest Management
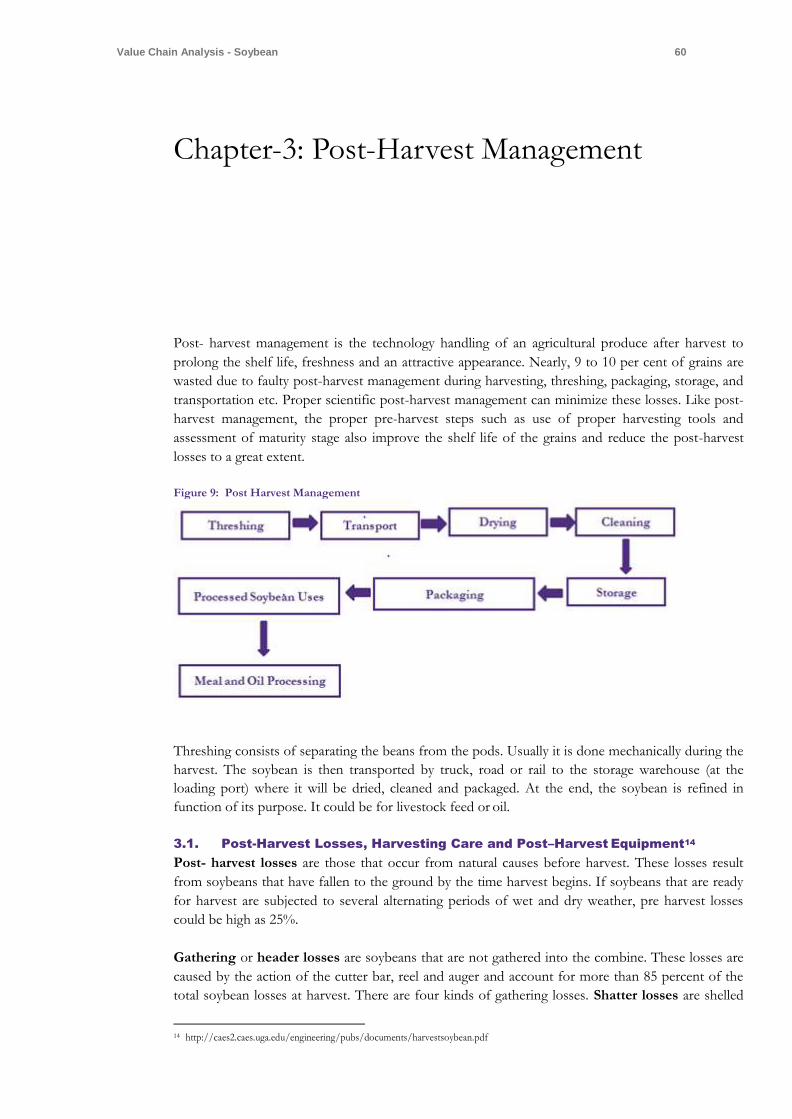
Post- harvest management is the technology handling of an agricultural produce after harvest to
prolong the shelf life, freshness and an attractive appearance. Nearly, 9 to 10 per cent of grains are
wasted due to faulty post-harvest management during harvesting, threshing, packaging, storage, and
transportation etc. Proper scientific post-harvest management can minimize these losses. Like post-
harvest management, the proper pre-harvest steps such as use of proper harvesting tools and
assessment of maturity stage also improve the shelf life of the grains and reduce the post-harvest
losses to a great extent.
Figure 9: Post Harvest Management
Threshing consists of separating the beans from the pods. Usually it is done mechanically during the
harvest. The soybean is then transported by truck, road or rail to the storage warehouse (at the
loading port) where it will be dried, cleaned and packaged. At the end, the soybean is refined in
function of its purpose. It could be for livestock feed or oil.
3.1. Post-Harvest Losses, Harvesting Care and Post–Harvest Equipment14
Post- harvest losses are those that occur from natural causes before harvest. These losses result
from soybeans that have fallen to the ground by the time harvest begins. If soybeans that are ready
for harvest are subjected to several alternating periods of wet and dry weather, pre harvest losses
could be high as 25%.
Gathering or header losses are soybeans that are not gathered into the combine. These losses are
caused by the action of the cutter bar, reel and auger and account for more than 85 percent of the
total soybean losses at harvest. There are four kinds of gathering losses. Shatter losses are shelled
14
http://caes2.caes.uga.edu/engineering/pubs/documents/harvestsoybean.pdf

Value Chain Analysis - Soybean 60
soybeans and detached soybean pods that are shattered from stalks by the header. Stubble losses
are soybeans in pods remaining on the stubble because of operating the cutter bar too high, etc.
Stalk losses are soybeans remaining in pods attached to stalks that were cut but not delivered into
the combine. Lodged losses are soybeans remaining in pods attached to stalks that were not cut or
that were cut at heights greater than that of the stubble.
Soybeans are easy to thresh, separate and clean. Soybeans can be rubbed out of the pod readily and
their size and shape are ideal for cleaning. Even so, small errors in the adjustment of the combine
can result in disastrous losses during the threshing, separating, and cleaning operations. Threshing
or cylinder losses occur when shelled soybeans are carried out the back of the machine with the
stalks. Separating losses are usually insignificant unless the combine is overloaded. Cleaning or
shoe losses occur when shelled soybeans are carried over the chaffer or top sieve and out the back
of the combine.
Post-harvest losses occur at different stages viz. harvesting, threshing, winnowing, storage,
packaging, and transportation, processing and marketing of soybean. Harvesting of soybean is done
manually. After harvesting, thresher is main post harvest equipment used. During storage at farmer’s
level, spoilage and losses may occur due to mishandling, use of very old and damaged gunny bags
and rodents. The post- harvest losses from harvesting to threshing are 1 to 2% and at the time of
cleaning and winnowing it is 3.5 to 5 %. During storage at farm level have been estimated to be
about 1 to 2 %. Maximum losses take place at this place. The losses during storage and
transportation are very low and limited to 0.7 to 1 %. During transport of soybean from the farm
house to the markets and from assembling markets to the secondary markets or consuming centers,
losses occur on account of pilferage, leakage of gunny bags and rough handling. The pest damage to
the soybean is less because of its hard teste. Some losses also occur due to rodents. The losses at the
processing units have been estimated to be about 5 to 15 % only.
Figure 10 Post Harvest Losses of Soybean

Value Chain Analysis - Soybean 60
Harvesting care
Pre harvest losses can be minimized by planting of shatter-resistant varieties and early harvest.
Soybeans should be harvested shortly after their moisture content first reaches 14-16 percent.
Header designs play an important role in reducing harvesting losses. The row-crop header has
proven to be more efficient than platform type headers. Of the platform type headers, the flexible
floating cutter bar header is the most efficient but slightly less efficient than the row-crop header. To
prevent excessive threshing and separating losses and to still keep the soybean clean, the threshing
and separating mechanisms must be kept properly adjusted. The single most important item to
check is the separator speed.
As per Agmarknet recommendations, to minimize post -harvest losses, the following
measures should be followed:
Timely harvest at optimum moisture percentage (Not more than 15 %).
Use of proper method of harvesting.
Adopt modern mechanical methods of threshing and winnowing.
Use of improved technique of processing
Cleaning and grading of produce as per standards.
Use of efficient and good packaging for storage as well as for transportation i.e. B-T will
Jute bags or HDPE bags.
Use of proper technique in storage.
Use of pest control measures in storage.
Proper care in handling (loading and unloading) of package.
Avoid use of hooks during handling.
During a field visit to the sampled districts, it was observed during discussions that few of the
farmers were adopting new methods such as fan for winnowing, thresher etc. However, 25 sampled
reported using only threshers cleaning and sieving of grains before marketing.
3.2. Grade Specification & Grading at Producer Level15
Grading at Producer Level
Farmers do not give more focus on grading of grains. They only clean and remove diseased,
damaged, foreign matters from heap of the grains. Farmers check moisture content in soybean by
teeth. To separate the diseased, damaged and foreign materials from healthy grain, farmers use local
sieve. At last, they grade the grains on the basis of physical appearance, colour, size and availability
of foreign material in the grain heap. During the survey, all sampled farmers reported to be
practicing grading.
Packaging by Producers Farmers in Rajasthan use only Jute gunny bags as a packing material. The Government of India has
also made it mandatory to pack food grains cereals, pulses etc., in Jute bags and an official
15 http://agmarknet.nic.in/soybean-profile.pdf
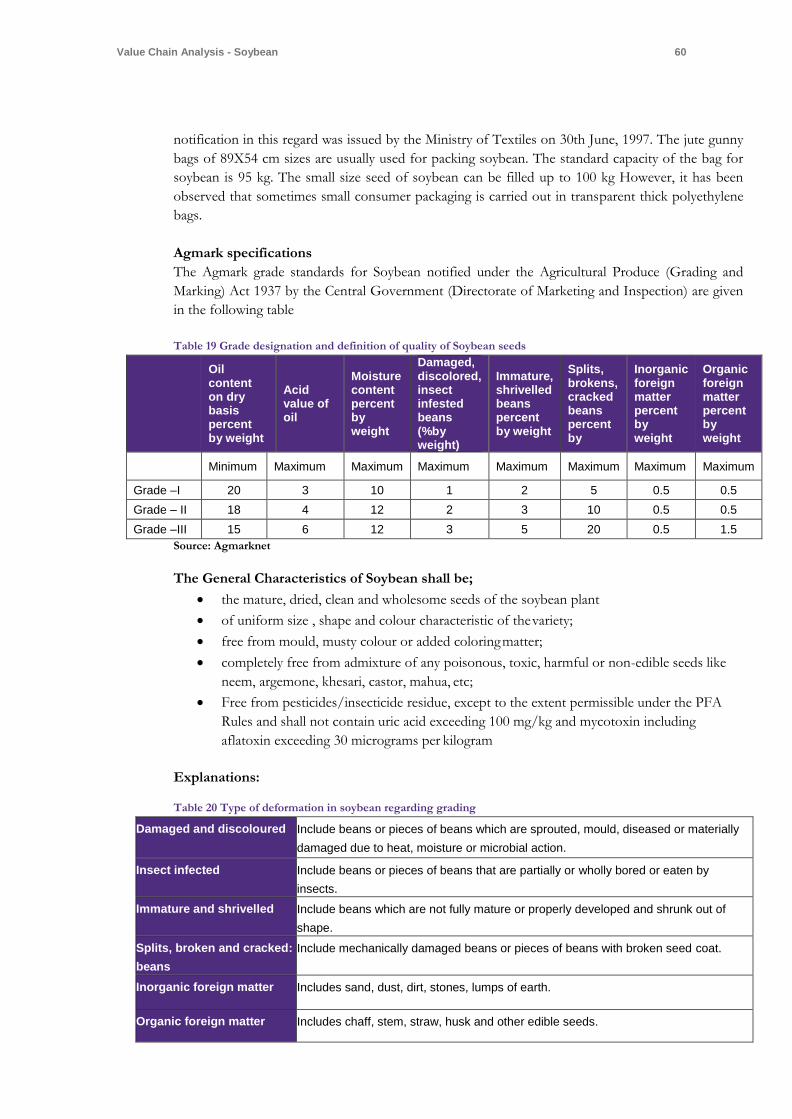
Value Chain Analysis - Soybean 60
notification in this regard was issued by the Ministry of Textiles on 30th June, 1997. The jute gunny
bags of 89X54 cm sizes are usually used for packing soybean. The standard capacity of the bag for
soybean is 95 kg. The small size seed of soybean can be filled up to 100 kg However, it has been
observed that sometimes small consumer packaging is carried out in transparent thick polyethylene
bags.
Agmark specifications
The Agmark grade standards for Soybean notified under the Agricultural Produce (Grading and
Marking) Act 1937 by the Central Government (Directorate of Marketing and Inspection) are given
in the following table
Table 19 Grade designation and definition of quality of Soybean seeds
Oil content on dry basis percent by weight
Acid value of oil
Moisture content percent by weight
Damaged, discolored, insect infested beans (%by weight)
Immature, shrivelled beans percent by weight
Splits, brokens, cracked beans percent by
Inorganic foreign matter percent by weight
Organic foreign matter percent by weight
Minimum Maximum Maximum Maximum Maximum Maximum Maximum Maximum
Grade –I 20 3 10 1 2 5 0.5 0.5
Grade – II 18 4 12 2 3 10 0.5 0.5
Grade –III 15 6 12 3 5 20 0.5 1.5
Source: Agmarknet
The General Characteristics of Soybean shall be;
the mature, dried, clean and wholesome seeds of the soybean plant
of uniform size , shape and colour characteristic of the variety;
free from mould, musty colour or added coloring matter;
completely free from admixture of any poisonous, toxic, harmful or non-edible seeds like
neem, argemone, khesari, castor, mahua, etc;
Free from pesticides/insecticide residue, except to the extent permissible under the PFA
Rules and shall not contain uric acid exceeding 100 mg/kg and mycotoxin including
aflatoxin exceeding 30 micrograms per kilogram
Explanations:
Table 20 Type of deformation in soybean regarding grading
Damaged and discoloured Include beans or pieces of beans which are sprouted, mould, diseased or materially
damaged due to heat, moisture or microbial action.
Insect infected Include beans or pieces of beans that are partially or wholly bored or eaten by
insects.
Immature and shrivelled Include beans which are not fully mature or properly developed and shrunk out of
shape.
Splits, broken and cracked:
beans
Include mechanically damaged beans or pieces of beans with broken seed coat.
Inorganic foreign matter Includes sand, dust, dirt, stones, lumps of earth.
Organic foreign matter Includes chaff, stem, straw, husk and other edible seeds.

Value Chain Analysis - Soybean 60
Source: GOI, Ministry of Agriculture and cooperation.
I) Specifications followed by NAFED for procurement:
National Agricultural Co-operative Marketing Federation (NAFED) is the central nodal agency of
Government of India, which arranges procurement of Soybean under Price Support Scheme
(P.S.S.). The grade specifications followed during marketing season is given in following table.
Grade specifications of Soybean followed by NAFED for price support scheme during 2003-
04 marketing season
Table 21: Grade Specification of Soybean
Sr. No.
Special Characteristics Maximum limits of tolerance(percentage by weight per quintal) for FAQ
1 Foreign matter and impurities 2
2 Shrivelled and immature beans 5
3 Damaged and Weevilled beans 3
4 Mechanically damaged beans (split, broken and
15
5 Moisture content 12
Source: GOI, Ministry of Agriculture and cooperation.
Definitions:
Foreign material means dust, dirt, stones, and lumps of earth, chaff, stem, straw or any
other impurity.
Damaged and weevilled beans are the beans or pieces of these which have sprouted or are
internally damaged as a result of heat, moisture, insect or microbial action.
Shrivelled and immature beans are the beans that are shrunk, out of shape, or are not fully
mature or developed and are often discolored.
Grade Specifications of Soybean Processors Association of India (SOPA)16:
SOPA has a vision to focus on quality of Indian soybean products marketed both in domestic and
international markets to ensure reliable, consistent and uniform quality and to create brand equity in
both the markets. SOPA certifies those soybean products which are covered by SOPA standards.
Specifications for soybean seed followed by SOPA are as follows:
Table 22: Grade specification
Sr. No Characteristics (% by mass) Limit Requirement
1 Moisture Maximum 12.00%
2 Protein (N x 6.25) Minimum 36.00%
3 Crude fat or ether extract Minimum 18.00%
4 Acid insoluble ash Maximum 1.50%
16 http://agmarknet.nic.in/soybean-profile.pdf

Value Chain Analysis - Soybean 60
5 Damaged Seeds Maximum 5.00%
6 Foreign matter Maximum 4.00%
CODEX standards:
A. The CODEX standards for Soybean are also given below
Maximum residue limits for pesticides as per Codex for Soybean (dry) are given in the following
table below.
Table 23 Codex standards for Soybean
Sr. No. Pesticides MRL ( Mg / Kg.)
1 Azinphos-methyl 0.05*
2 Carbaryl 1
3 Diquat 0.2
4 Fenitrothion 0.1
5 Paraquat 0.1
6 Parathion 0.05*
7 Carbondazim 0.2
8 Fenamiphos 0.05*
9 Methomyl 0.02
10 Acephate 0.5
11 Carbafurans 0.2
12 Methamidophos 0.05
13 Phorate 0.05
14 Aldicarb 0.02*
15 Cypermethrin 0.05*
16 Fenvalerate 0.1
17 Permethrin 0.05*
18 Oxamyl 0.1
19 Diflubenzuron 0.1
20 Metalaxyl 0.05*
21 Triozophos 0.05*
22 Ethoprophos 0.02*
23 Glyphospate 2.0
24 Terbufos 0.05*
25 Profenofos 0.05*
26 Bentazone 0.05*
27 Glufosinate ammonium 0.1
28 Cycloxydim 2
Note:
MRL -Maximum Residue Limit.33v
*-- At or about the limit of determination

Value Chain Analysis - Soybean 60
3.3. Major Storage Disease and Pest and their Control Measure17
The details of the major insects and their control measures for the storage of soybean are given in
the following table
Table 24 list of is Insects and their control measures
Rodents:
Besides above, rodent causes mechanical damage to stored
soybean gunny bags by cutting, which results in bleeding and
quantitative loss of the produce. Moreover, the rodent’ excreta,
hair, etc., deteriorate the hygiene of Soybean.
Table 25 Control Measures
a) Use of Rat cage Different types of rat cages are available in the market. Rats caught by these rat
cages can be killed by dipping into water.
b) Use of poison baits
For killing the rats, poison baits are used. In this process, anti-coagulant pesticide
like Zinc Phosphide is mixed with bread or any other food stuff used as bait. This
kind of pesticide affects gradually the body of rodents which ultimately kills them.
c) Rat burrow
fumigation
To control the rat hazards, the rat holes/burrows if any found inside the godown or
surrounding areas may be fumigated by putting two Aluminium Phosphide tablets
into it and sealing the mouth of the hole/burrow by mud mixture.
Sanitary & Phytosanitary Majors Requirements and Quality Standard18
Efficient quality control and food safety is most important in improving the export potential of
soybean in India. These efforts will help in achieving the quality standards of foreign countries
comprising of European and other developed countries. The major export certificates required for
the export of soybean are as follows;
Chemical Residual and Quality Testing Certificate:
Test report for the quality standards of Insecticides, pesticides and other chemical residual analysis is
demanded by the importing countries to meet the prevalent standards like NOP, JAS & EU
standards etc. The list of chemical residues testing laboratories is listed in table below
Table 26: Chemical residues testing laboratories
Sr. No Name of lab Location
1 Sanitary and Phytosanitary lab Agriculture Research station, Kota
2 Sanitary and Phytosanitary lab Agriculture Research station, Mangalore
3 Sanitary and Phytosanitary lab Agriculture Research station, Durgapura
17 http://agmarknet.nic.in/soybean-profile.pdf
18 http://agmarknet.nic.in/soybean-profile.pdf

Value Chain Analysis - Soybean 60
Phyto-sanitary Certificate:
Phyto-sanitary certificates are mandatory certificate for the export of soybean like the other
agriculture commodities. The exporter has to apply to the officer-In-charge (Plant Protection and
Quarantine Authority, Department of Agriculture and Cooperation) for Phyto-Sanitary Certificate
(PSC) in prescribed application form at least 7 to 10 days in advance of the export. Before
submitting the application for issue of PSC, it should be ensured that the cargo is treated properly
by the licensed PCO’s.
Organic Transaction Certificate:
It is procured from the Control Union when the produce is claimed to organic in nature as
demanded.

Value Chain Analysis - Soybean 60
Chapter4. Cost of production & Net accruals to producer
A typical farmer in the region with about 2.4 acres’ land holding has 0.8 acres deployed to Soybean production. The gross yield per hectare is 1.44 ton per hectare. The market rate of the sale is about Rs. 30000 per ton or Rs. 43,200 per hectare. The cost of cultivation is about Rs. 10,045 per hectare. Net realization per hectare is about Rs. 18,087.5 per hectare. Out of this about Rs. 7,500 is cost of land preparation per hectare, seed cost is about Rs. 2,700 per hectare, fertilizer and pesticide cost is about Rs. 1,000 per hectare, weeding related (labour cost) is about Rs. 1,400 per hectare and harvesting cost is about Rs. 1,400 per hectare. Packing cost is Rs. 70 per 90 kg or about Rs. 1120 per hectare. Transportation cost to mandi is about Rs. 187 per hectare- all totalling is around Rs. 25,112 per hectare. Fertilizer and pesticides are procured from local input supplier. The farmer is selling produce at local mandi @ price range of Rs 3,000 per quintal. Farmers in the region are not satisfied with the market price. Sometimes the production also gets reduced due to sudden change in climate.
Table 27: Cost of Production
Sr. No. Particular Amount (in Rs. Per ha)
A. Income (1.44 Ton per ha @ Rs. 30000 per Ton) 43200
B. Cost of Production 1 Land Preparation Cost 7500
2 Seed Cost 6750
3 Input Cost 2500
4 Weeding Cost 3500
5 Harvesting Cost 3500
6 Packing and Transportation Cost 1362.5
Total Cost of Production 25112.5
Net Profit 18087.5
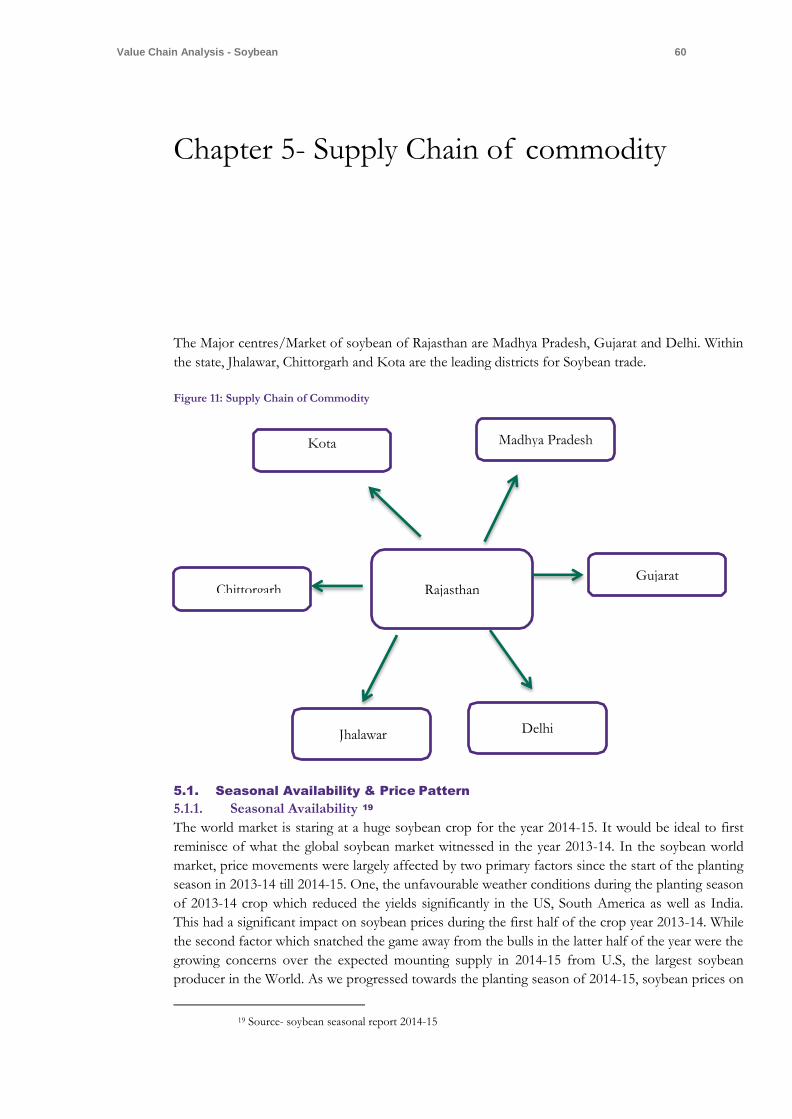
Value Chain Analysis - Soybean 60
Chapter 5- Supply Chain of commodity
The Major centres/Market of soybean of Rajasthan are Madhya Pradesh, Gujarat and Delhi. Within
the state, Jhalawar, Chittorgarh and Kota are the leading districts for Soybean trade.
Figure 11: Supply Chain of Commodity
5.1. Seasonal Availability & Price Pattern
5.1.1. Seasonal Availability 19
The world market is staring at a huge soybean crop for the year 2014-15. It would be ideal to first
reminisce of what the global soybean market witnessed in the year 2013-14. In the soybean world
market, price movements were largely affected by two primary factors since the start of the planting
season in 2013-14 till 2014-15. One, the unfavourable weather conditions during the planting season
of 2013-14 crop which reduced the yields significantly in the US, South America as well as India.
This had a significant impact on soybean prices during the first half of the crop year 2013-14. While
the second factor which snatched the game away from the bulls in the latter half of the year were the
growing concerns over the expected mounting supply in 2014-15 from U.S, the largest soybean
producer in the World. As we progressed towards the planting season of 2014-15, soybean prices on
19 Source- soybean seasonal report 2014-15
Madhya Pradesh
Gujarat Chittorgarh Rajasthan
Jhalawar Delhi
Kota

Value Chain Analysis - Soybean 60
the CBOT plummeted below the three-year low and then other nations followed the suit. In the
spot markets of India, soybean prices which were trading at Rs 4000 per quintal during the
beginning of third quarter have fallen by over 17 percent to Rs 3300 per quintal till now. Apart from
this, the other major event witnessed in the trade was the tough stance taken by China on a widely
used U.S Deoiled cake (DOC) on concerns that the shipments may contain a genetic modification
that Beijing hasn't approved. This resulted in a sharp fall in prices of DDGs which had its impact on
the soy meal prices as well. Since both of them are protein rich, livestock feeders substitute soy meal
with DOCs, pressurising the soyameal prices in the world market. The oil industry also remained
under pressure as stocks around the world remained high while a glut like scenario emerged for
palm in Malaysia and Indonesia. Lower global prices had attracted larger imports to India in the
recent times. While some defaults in palm shipments were noted in China as palm oil prices on the
Bursa and Malaysia fell to five year low.
Maximum support Price of Soybean for kharif (2016-17):
Table 28 crop seasonal availability
Commodity 2016-17 Season
Soybean*
MSP Rs/ Quintal Bonus Rs./ Quintal
Total (MSP + bonus) Rs/
Quintal
2675 100 2775
5.1.2. Market Arrivals & Prices of Soybean in Major Markets of Rajasthan
Table 29 Market Arrivals & Prices
Sr. no
District name APMC name Arrival
Quantity (in MT)
1 Baran Anta, Atru, Atru (Kawai Salpura), Baran, Chhabra, Chhabra (Chhipabadod)
69,279.2
2 Bhilwara Bhilwara, Bijolia, Mandalgarh 189.8
3 Bundi Bundi, DEI (Bundi), Keshoraipatan, Sumerganj 6,629
4 Chittorgarh Badrisadri, Begu, Fatehnagar, Kapasan Nimbahera, Pratapgarh
79,533.8
5 Jaipur Jaipur(Grain) (Chandpole) 0.3
6 Jhalawar Aklera, Bhawani, Mandi, Bhawani, Mandi (Choumehla), Bhawani, Mandi (Raipur), Jhalarapatan, Khanpur
1,78,247
7 Kota Chechat, Itawa, Kota, Ramaganj, Mandi, Ramgang, Mandi (Bapawar kala), Ramgang, Mandi (Samod)
1,63,054
8 Swai Madhopur Sawai Madhopur 1,701.64
9 Tonk Deoli 227.8
10 Udaipur Udaipur 396.6
Grand Total 4,99,259.14
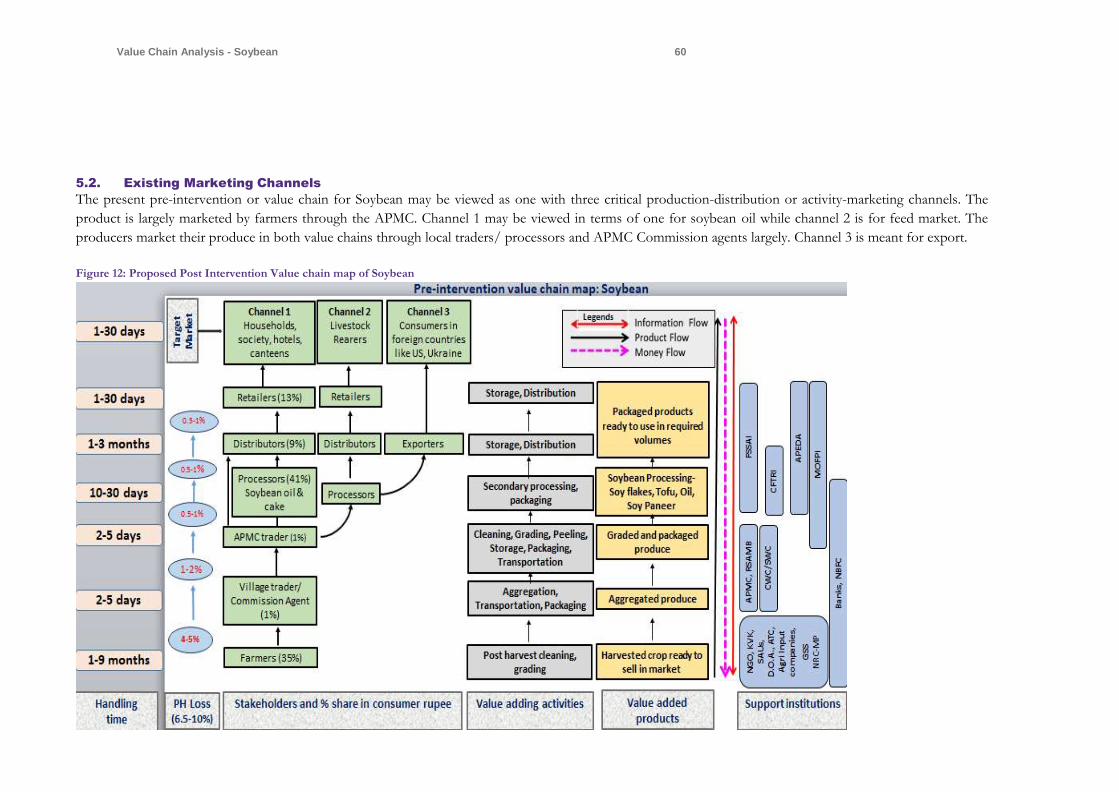
Value Chain Analysis - Soybean 60
5.2. Existing Marketing Channels
The present pre-intervention or value chain for Soybean may be viewed as one with three critical production-distribution or activity-marketing channels. The
product is largely marketed by farmers through the APMC. Channel 1 may be viewed in terms of one for soybean oil while channel 2 is for feed market. The
producers market their produce in both value chains through local traders/ processors and APMC Commission agents largely. Channel 3 is meant for export.
Figure 12: Proposed Post Intervention Value chain map of Soybean

Value Chain Analysis - Soybean 60
The producers market their produce in both value chains through local traders and APMC
Commission agents largely. There are total post-harvest losses of 5-9% in the storage, handling,
transportation of soybean at every stakeholder’ point.
The figure presented above represents all the production – distribution channels possible for soybean. These channels were identified based on the consultation with various stakeholders.
5.3. Alternative System of Marketing
5.3.1. Direct Marketing20
Direct marketing is an innovative concept, which involves marketing of produce i.e. soybean by the
farmers directly to the consumers/processors without any middlemen. Direct marketing enables
producers and processors and other bulk buyers to economic on transportation cost and improve
price realization. It also provides incentive to large scale marketing companies’ i.e. processors and
exporters to purchase directly from producing areas. Direct marketing by farmers to the consumers
has been experimented in the country through Apni Mandis in Punjab and Haryana. The concept
with certain improvements has been popularized in Andhra Pradesh through Rythu Bazars. At
present, these markets are being run at the expense of the state exchequer, as a promotional
measure, to encourage marketing by small and marginal producers without the involvement of the
middlemen. In these markets, many commodities are marketed along with fruits and vegetables.
Recently, the Govt. of Andhra Pradesh has proposed to privatize some of the non-viable Rythu
Bazars.
20 agmarknet.nic.in

Value Chain Analysis - Soybean 60
5.3.2. Contract Farming 21
Contract farming essentially includes the tie-up for agricultural marketing, wherein the prospective
buyer or any trading / processing agency enters into a contract with the farmer and promises to
purchase the farmer’s produce under pre-negotiated condition and prices. In this type of contract,
the trading / processing agency support the farmers through supply of inputs and other technical
support and the farmers can get the assured market at a fixed or pre-determined price. By entering
in this type of contract, farmers do not require relying on middleman and risk of price also reduces.
In present context of economic liberalization and global scenario, contract farming opens the venue
to adopt new-technologies and access to present global market.
Table 30: Benefits of contract farming
Benefits To Producer To Contracting agency
Risk It minimizes the price risk. It minimizes risk of raw material supply.
Price Price stability ensuring fair price. Price stability as per pre-agreed contract.
Quality Use of quality seed and inputs. Get good quality produce and control on
quality.
Payment Assured and regular payments
through bank tie up.
Easy handling and better control
on payment.
Post- harvest Minimizes risk and cost of handling. Control and efficient handling.
New technology Facilitates in farm management and
practices.
For better and desired produce to meet
consumer needs.
Fair trade Practices Minimizes malpractices and no
involvement of middle man.
Better control on trade practices.
Crop insurance Reduces risk. Reduces risk.
Mutual relationship Strengthens. Strengthens.
Profit Increases. Increases.
5.3.3. Private Market Yard
Market yard can be classified into three categories according to the mode of sellers i.e. primary,
secondary and terminal. Sellers of a primary market yard are mainly farmers of the command area; in
case of secondary market yard, farmers and traders beyond the command area bring their
commodities for sale and in the terminal market yard mainly the traders bring in their commodities
for marketing.
A primary market yard should be suitably located for easy accessibility and have provisions to sell
produces grown by farmers in the command area and have sundry shops to meet the immediate
requirements of a farmer when he comes there to sell his produce. It should also have facilities for
the traders, commission agents and other market functionaries to facilitate easy trading and smooth
price realisation to the farmers. The facilities should match to the functional requirements of the
21 agmarknet.nic.in

Value Chain Analysis - Soybean 60
commodities to be traded and also to the surrounding locality where the market yard is to function.
Secondary and terminal market yards are located in semi urban and urban areas and the facilities are
planned for the commodities to be traded. Considering all these aspects the requirements of a
market yard are elaborated in the following paragraphs.

Value Chain Analysis - Soybean 60
Chapter 6- Processing Infrastructure availability and utilization
6.1. Processing22
Food for Humans
Nearly all soybeans are processed for their oil. Soy processors
(such as Cargill & ADM) take the raw soybeans and separate the
oil from the meal. The oil may be refined for cooking and other
edible uses, or sold for biodiesel production or industrial uses.
Soybean oil is used in cooking and frying foods. Margarine is a
product made from soybean oil. Apart from Oil, various extracts
of Soy i.e. Soy milk, Soy tofu etc. are major share in vegetarian
diet pattern in South East Asia. Figure 13: Soy Oil
Feed for Animal
The processors bake the high-protein fiber that is left after the
oil is removed and sell it for animal feed. The high-protein fibre
(that which remains after processing has removed the oil) is
toasted and prepared into animal feed for poultry, pork, cattle,
other farm animals and pets. The poultry and swine industries
are major consumers of soybean meal. Over half of the soybeans
processed for livestock feed are fed to poultry, about one-
quarter is fed to swine, and the rest is used for beef cattle, dairy
cattle and pet food. Soy protein is increasingly found in fish
food, both for home aquariums and for the fish grown for
eating. Most marine species were fed fish meal at one time, but
the scarcity and increasing cost of fish meal has led producers to
switch to high protein soymeal for a variety of marine species.
Around the world, soy protein may be found in feed for most
animals
Figure 14: Animal Feed
22 http://ncsoy.org/media-resources/uses-of-soybeans/
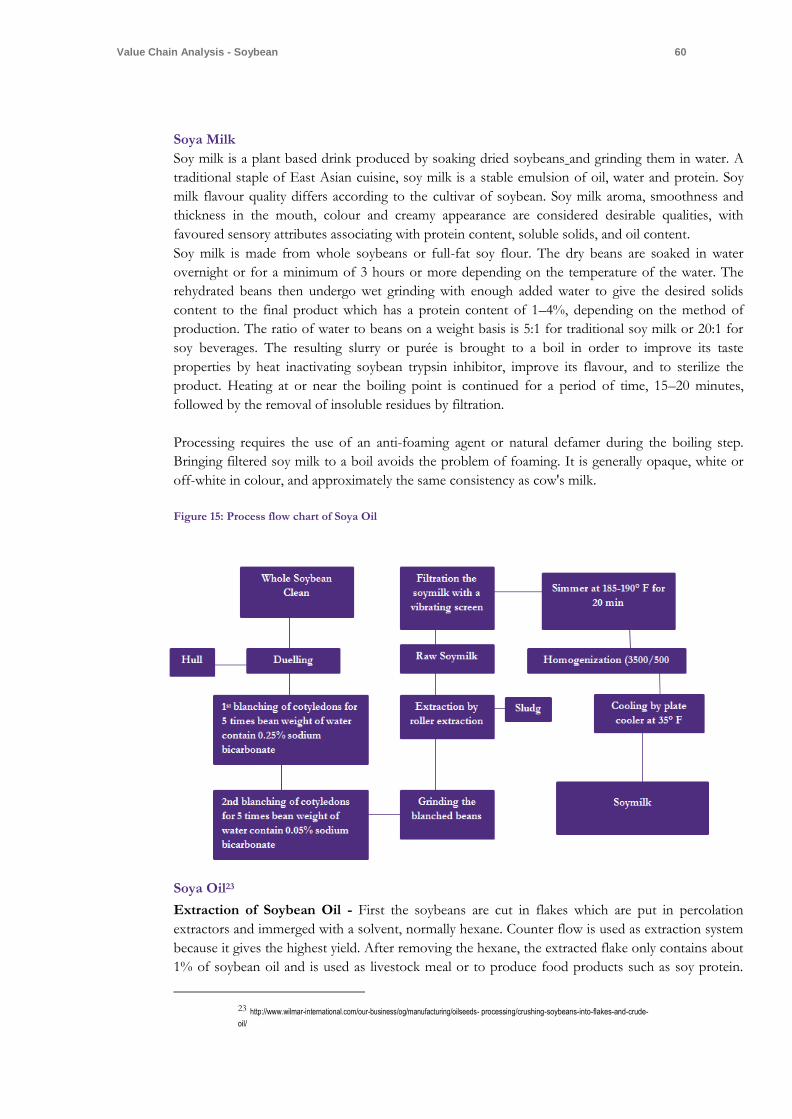
Value Chain Analysis - Soybean 60
Soya Milk
Soy milk is a plant based drink produced by soaking dried soybeans and grinding them in water. A
traditional staple of East Asian cuisine, soy milk is a stable emulsion of oil, water and protein. Soy
milk flavour quality differs according to the cultivar of soybean. Soy milk aroma, smoothness and
thickness in the mouth, colour and creamy appearance are considered desirable qualities, with
favoured sensory attributes associating with protein content, soluble solids, and oil content.
Soy milk is made from whole soybeans or full-fat soy flour. The dry beans are soaked in water
overnight or for a minimum of 3 hours or more depending on the temperature of the water. The
rehydrated beans then undergo wet grinding with enough added water to give the desired solids
content to the final product which has a protein content of 1–4%, depending on the method of
production. The ratio of water to beans on a weight basis is 5:1 for traditional soy milk or 20:1 for
soy beverages. The resulting slurry or purée is brought to a boil in order to improve its taste
properties by heat inactivating soybean trypsin inhibitor, improve its flavour, and to sterilize the
product. Heating at or near the boiling point is continued for a period of time, 15–20 minutes,
followed by the removal of insoluble residues by filtration.
Processing requires the use of an anti-foaming agent or natural defamer during the boiling step.
Bringing filtered soy milk to a boil avoids the problem of foaming. It is generally opaque, white or
off-white in colour, and approximately the same consistency as cow's milk.
Figure 15: Process flow chart of Soya Oil
Soya Oil23
Extraction of Soybean Oil - First the soybeans are cut in flakes which are put in percolation
extractors and immerged with a solvent, normally hexane. Counter flow is used as extraction system
because it gives the highest yield. After removing the hexane, the extracted flake only contains about
1% of soybean oil and is used as livestock meal or to produce food products such as soy protein.
23 http://www.wilmar-international.com/our-business/og/manufacturing/oilseeds- processing/crushing-soybeans-into-flakes-and-crude-
oil/

Value Chain Analysis - Soybean 60
The hexane is separated from the soybean oil in evaporators. The evaporated hexane is recovered
and returned to the extraction process. The hexane free crude soybean oil is then further purified.
The crude soybean oil still contains many oil-insoluble and oil-soluble impurities that need to be
removed. The oil-insoluble material are removed with filtration and the soluble materials is removed
with different processes including degumming (removing of phosphatides), alkali refining (washing
with alkaline solution to remove free fatty acids, colorants, insoluble matter and gums) and
bleaching (with activated earth or activated carbon to remove colour and other impurities.
Figure 16: Process Flow chart of Soy oil
Soybean Flake
Soybeans, received from vessels or rail cars (for local beans) are transferred to silos for storage.
From here, the beans are fed into the preparation plant for processing. 32 The process begins with
the cleaning of soybeans to remove impurities. The beans are then heated to adjust for moisture
content and to loosen the hull for improved dehulling. They are then cracked by passing through
roller mills and the hulls are removed. The dehulled/cracked soybeans are heated to high
temperature to soften and condition them, after which they are rolled into flakes. The flakes are then
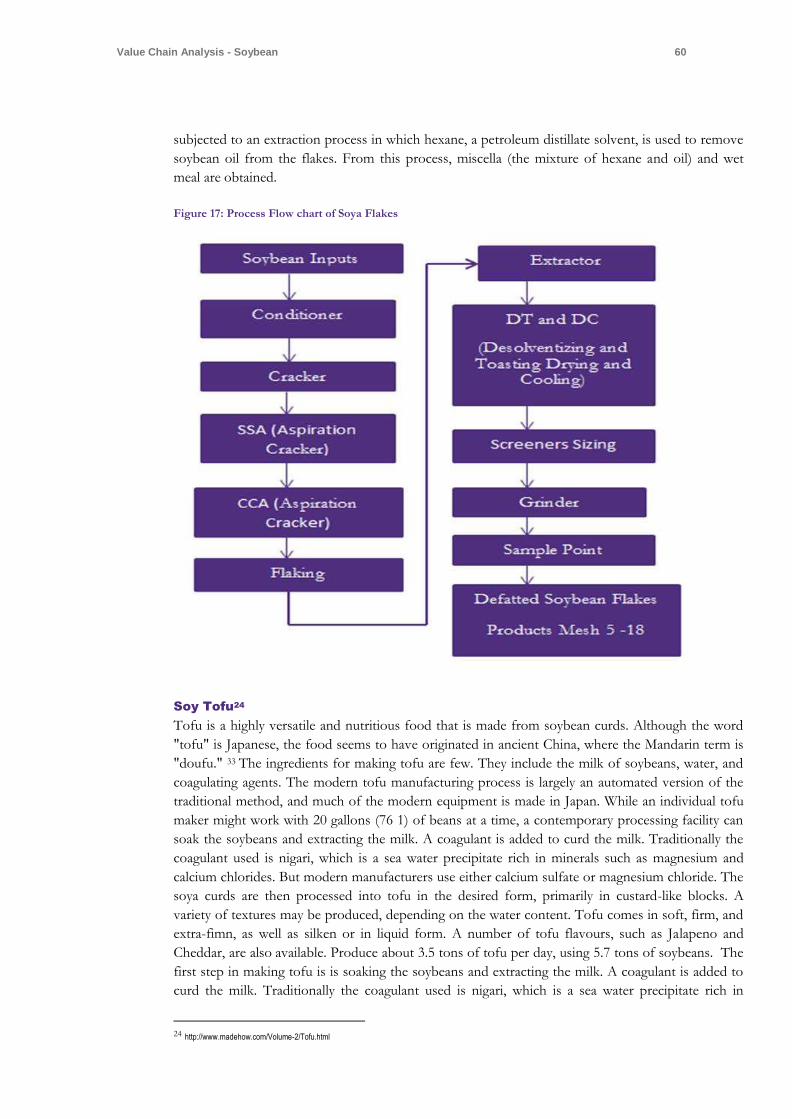
Value Chain Analysis - Soybean 60
subjected to an extraction process in which hexane, a petroleum distillate solvent, is used to remove
soybean oil from the flakes. From this process, miscella (the mixture of hexane and oil) and wet
meal are obtained.
Figure 17: Process Flow chart of Soya Flakes
Soy Tofu24
Tofu is a highly versatile and nutritious food that is made from soybean curds. Although the word
"tofu" is Japanese, the food seems to have originated in ancient China, where the Mandarin term is
"doufu." 33 The ingredients for making tofu are few. They include the milk of soybeans, water, and
coagulating agents. The modern tofu manufacturing process is largely an automated version of the
traditional method, and much of the modern equipment is made in Japan. While an individual tofu
maker might work with 20 gallons (76 1) of beans at a time, a contemporary processing facility can
soak the soybeans and extracting the milk. A coagulant is added to curd the milk. Traditionally the
coagulant used is nigari, which is a sea water precipitate rich in minerals such as magnesium and
calcium chlorides. But modern manufacturers use either calcium sulfate or magnesium chloride. The
soya curds are then processed into tofu in the desired form, primarily in custard-like blocks. A
variety of textures may be produced, depending on the water content. Tofu comes in soft, firm, and
extra-fimn, as well as silken or in liquid form. A number of tofu flavours, such as Jalapeno and
Cheddar, are also available. Produce about 3.5 tons of tofu per day, using 5.7 tons of soybeans. The
first step in making tofu is is soaking the soybeans and extracting the milk. A coagulant is added to
curd the milk. Traditionally the coagulant used is nigari, which is a sea water precipitate rich in
24 http://www.madehow.com/Volume-2/Tofu.html

Value Chain Analysis - Soybean 60
minerals such as magnesium and calcium chlorides. But modern manufacturers use either calcium
sulfate or magnesium chloride. The soya curds are then processed into tofu in the desired form,
primarily in custard-like blocks. A variety of textures may be produced, depending on the water
content. Tofu comes in soft, firm, and extra-fimn, as well as silken or in liquid form. A number of
tofu flavours, such as Jalapeno and Cheddar, are also available.
Figure 18: Process Flow chart of Soya Tofu

Value Chain Analysis - Soybean 60
Soya Sauce25
Soy sauce is one of the world's oldest condiments and has been used in China for more than 2,500
years. It is made from fermenting a mixture of mashed soybeans, salt, and enzymes. It is also made
artificially through a chemical process known as acid hydrolysis. 34
Figure 19: Process Flow chart of Soya Sauce
6.2. Stakeholder’s Share in Consumer Rupee
The price spread along with margin at every stage of the value chain starting from the farmer till to
the retailer is presented in the table below.
25 http://www.madehow.com/Volume-3/Soy-Sauce.html

Value Chain Analysis - Soybean 60
Table 31: Existing Price Spread table at every stage of value chain
Activity Value per Quintal (Rs.)
Existing Stakeholder's
share in Consumer's Rupee (%)
Retailing: Sale by retailer to consumer
About Rs. 85,00 per quintal (soybean oil) which makes a gross profit margin of 133%
Retailers 13%
Wholesaling: Sale by wholesalers to retailers
Rs. 7409 per quintal with a gross margin of 9%
Wholesalers 9%
Processing: Sale after processing to wholesalers
Rs. 6615 per quintal (Gross value on sale with gross profit margin in processing 50%)
Processors 41%
APMC: Sale upon trading at Mandi
Rs. 3,150 per quintal (Gross value on sale from Mandi @ 5%) Traders
2%
Production: Cost of production is Rs. 25,112.5 per ha
Rs. 3,000 per quintal (Gross value on procurement at Rs. 3000; gross value accrual to producers after cultivation costs is Rs. 18087 per ha
Farmers 35%
6.3. Price build up & Marketing Efficiency Analysis
The price spread and values accrued to stakeholders across the chain reflects the profit margins
accrued to different stakeholders. Much of the value accruals are accrued to processors and retailers.
Producers’ incomes are apparently dependent on yield as well as their dependency on the type of
end product. ( i.e. Soy milk, oil, tofu, flakes, sauce etc.)
The price spread and values accrued to stakeholders across the chain reflects the profit margins
accrued to different stakeholders. Farmer shares 35% of the consumer’s rupee while the shares of
traders, processors, wholesalers and retailers are about 2%, 41%, 9% and 13% respectively. 65% of
the value accruals are accrued to processors, wholesalers and retailers. Producers’ incomes are
apparently dependent on yield as well as their dependency on the type of end product (eg. Soybean
seeds, oil, soy tofu, soy milk, etc.). Here in the existing value chain of Soybean, the price build up
has been calculated for the important first channel where the target consumers are urban households
and institutional buyers. The product considered is soybean oil.
Typically farmers sell the raw Soybean at about Rs 3000 per quintal to traders. In the local mandis, it
was sold by traders to the processors at Rs 3150 per quintal (with commission about 3.5% and cess
of 1.5%). The processors, upon primary and secondary value addition, sell soybean oil to
wholesalers at Rs 6615 (gross margin about 110%). Thereafter the wholesale and retail prices are set
up at Rs 7409 per quintal and 8500 per quintal with a gross margin of 12% and 15% respectively.
Due to limited infrastructure facilities at the dispersal of various stakeholders, marketing efficiency is
adversely affected. Due to limited infrastructure facilities at the dispersal of various stakeholders,
marketing efficiency is adversely affected.
6.4. Consumer Preference Analysis
The market segmentation of the cluster level soybean oil consuming population could be done
based upon the geographical differences in the clusters of RACP project- rural, rurban and urban as
well as the taste preferences of these households.
Value Chain Analysis - Soybean 60
Among the legumes, the soybean is valued for its high (38–45%) protein content as well as its high
(approximately 20%) oil content. Soybean is mainly consumed in the form of Soy oil, Soy milk, Tofu
and flour by human beings. The bulk of the crop is solvent extracted for vegetable oil and defatted
Soy meal which is used for animal feed.
The extracted Soy oil is one of the major sources of edible oil in the world. Soy oil remnant i.e.
Soybean meal, after oil extraction is rich source of protein for livestock. In addition to their use in
livestock feed, soybean products are widely used for human consumption.
Common soybean products include soy sauce, soy milk, tofu, soy meal, soy flour, textured vegetable
protein (TVP), tempeh, soy lecithin. Soy flour has 50% protein and 5% fibre. It has higher levels of
protein, thiamine, riboflavin, phosphorus, calcium, and iron than wheat flour. It does not contain
gluten.
As a result, yeast-raised breads made with soy flour are dense in texture. Among many uses, soy
flour thickens sauces, prevents staling in baked food, and reduces oil absorption during frying.
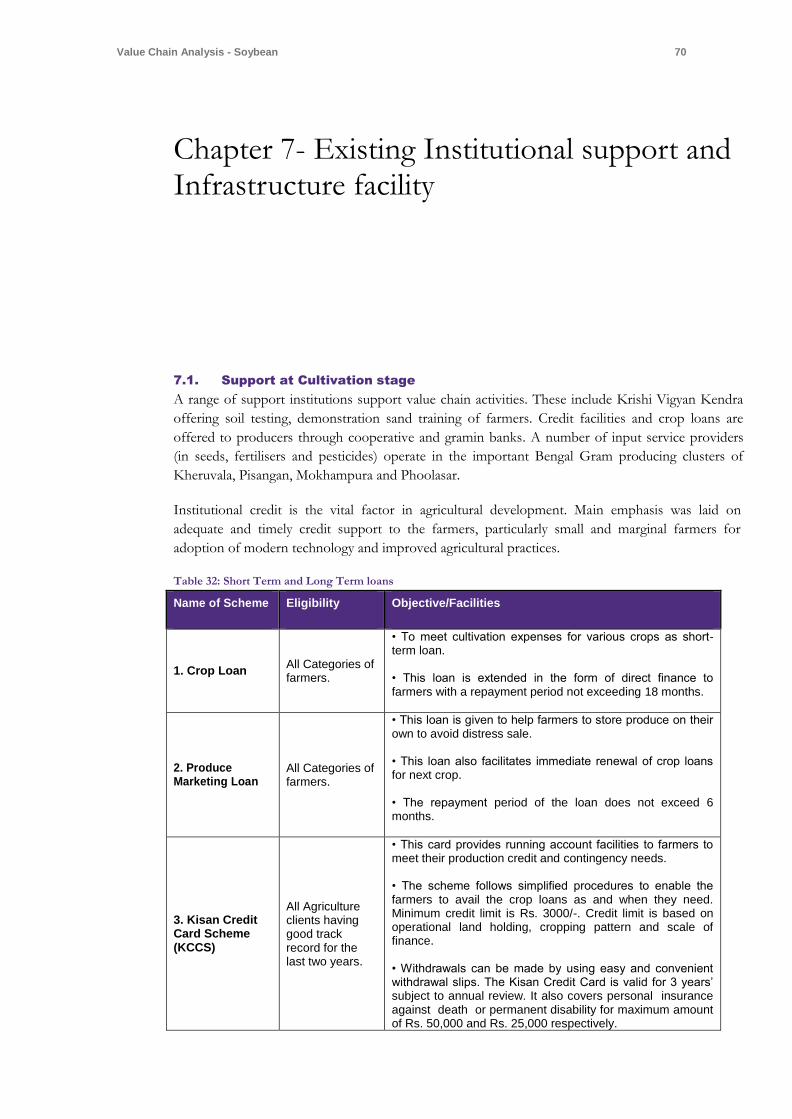
Value Chain Analysis - Soybean 70
Chapter 7- Existing Institutional support and Infrastructure facility
7.1. Support at Cultivation stage
A range of support institutions support value chain activities. These include Krishi Vigyan Kendra
offering soil testing, demonstration sand training of farmers. Credit facilities and crop loans are
offered to producers through cooperative and gramin banks. A number of input service providers
(in seeds, fertilisers and pesticides) operate in the important Bengal Gram producing clusters of
Kheruvala, Pisangan, Mokhampura and Phoolasar.
Institutional credit is the vital factor in agricultural development. Main emphasis was laid on
adequate and timely credit support to the farmers, particularly small and marginal farmers for
adoption of modern technology and improved agricultural practices.
Table 32: Short Term and Long Term loans
Name of Scheme Eligibility Objective/Facilities
1. Crop Loan All Categories of farmers.
• To meet cultivation expenses for various crops as short-term loan. • This loan is extended in the form of direct finance to farmers with a repayment period not exceeding 18 months.
2. Produce Marketing Loan
All Categories of farmers.
• This loan is given to help farmers to store produce on their own to avoid distress sale. • This loan also facilitates immediate renewal of crop loans for next crop. • The repayment period of the loan does not exceed 6 months.
3. Kisan Credit Card Scheme (KCCS)
All Agriculture clients having good track record for the last two years.
• This card provides running account facilities to farmers to meet their production credit and contingency needs. • The scheme follows simplified procedures to enable the farmers to avail the crop loans as and when they need. Minimum credit limit is Rs. 3000/-. Credit limit is based on operational land holding, cropping pattern and scale of finance. • Withdrawals can be made by using easy and convenient withdrawal slips. The Kisan Credit Card is valid for 3 years’ subject to annual review. It also covers personal insurance against death or permanent disability for maximum amount of Rs. 50,000 and Rs. 25,000 respectively.

Value Chain Analysis - Soybean 70
A range of support institutions support value chain activities as described below.
7.1.1. Department of Agriculture, Govt. of Rajasthan:
The department has various verticals through which it supports production, productivity and market
linkage in the state. It has a well-established structure and network of State/District and panchayat
level officials to provide extension services to farmers. The department issues licenses to various
agri-input marketing companies including seeds, fertilizers and insecticides and ensures quality
assurance to farmers through regular reporting from suppliers and random quality checks of agri
inputs. The licenses are issued first at the State level by registering input/service providers. The
registered companies can only supply inputs to district and regional level distributors who in turn
make availability of the products at the retailors. All handlers of agri inputs and produce have to take
license from competent authority either at district or state level. Similarly, the department also issues
mandi licenses for traders at different APMCs for trading in specific commodities. The same are
described below.
A. Extension vertical:
Extension support: The extension wing recommends good agricultural practices for various
crops as per various agro-economic zones, Promotes seed replacement through distribution
of Minikits containing improved variety of seeds. It also provides grant support of up to 50
percent of the price of notified varieties of soybean of less than 10 years or Rs 1500 per quin
whichever is less. For hybrid varieties subsidy is - 50% of the price of seeds notified for less
than 10 years or Rs 5000 per quin whichever is less. The department also provides up to 50%
subsidy on micro-nutrient (50% of total cost or up to Rs 500/ha) and bio-fertilizer
application (50% of total cost or Rs 300/ha) under various schemes viz. National Agriculture
Development Scheme/ National Composite Safety Mission/ National Food Security
Mission. The application can be submitted to the office of Agriculture Supervisor-Asst.
Agriculture Officer/ Asst. Director (Extension)/ Dy. Director (Extension) by eligible
farmers at Panchayat/Sub-district and District level respectively. Under the head “Subsidy on
Crop Demonstrations”, subsidy up to Rs 5000/ha is available for soybean cultivation
through flagship programs like State Plan/NFSM.
District level farmer help desk: Under this head, farmer help line are established at district
level with nominated district level officials from the office of Dy. Director, Agriculture
Extension to support farmers on various farming related problems. Apart from this, a state
level help desk is also maintained whose telephone no is 0141-5102578
Agriculture information dissemination: At the state level, , technical dissemination is
being done through the daily newspapers, agricultural papers, monthly publication of "Kheti
Ri Bataan" bulletin is also being done. Apart from this, information about advanced
agricultural methods of major crops during crop season, publishing posters, agricultural
guides on various topics, and Rabi / Kharif package of practice books at the block level and
farmers, people's representatives and farmers by producing farmer friendly literature. Is being
distributed to the institutions related to. From day-to-day basis to all the radio stations of the
state, from 7.45 to 8.15, share the information related to farming and phone in these
programs is being broadcast on Tuesday, Thursday and Saturday. The program is being
sponsored by the Department of Agriculture on Monday, Tuesday and Wednesday for three
days a week. "Farming" program on Doordarshan- produced by the Agriculture Department,
is broadcast from Doordarshan Kendra, Jaipur on every Thursday from 7.30 am to 8.00 pm.
In this program, information about departmental schemes / programs being executed by the
Value Chain Analysis - Soybean 70
Agriculture Department, discussions with experts, problem-solving, confusion-solving,
fortnightly work, message, success stories, innovation, short films, eclipse etc. The tax
program is made simple, interesting and farm-making. The technical information on
agriculture and related subjects to the farmers has been done by the Indian government to
provide "Kisan Call Center" in the state through telephone. Farmers can get any kind of
information related to farming by making free calls to phone number 1800 180 1551/1551,
from basic / mobile telephone to 6.00 pm to 10.00 pm.
Water use efficiency promotion: Under the Farm Pond Program, rain water harvesting is
promoted with the provisioning of 50% subsidy or maximum amount of Rs 52,000/- on raw
farm pond and Rs 75,000/- on farm pond with plastic lining whichever is less. This scheme
is available under the Rashtriya Krishi Vikas Yojana.
For Dighi construction (under National Agriculture Development Scheme/RKVY), 50% of
the unit cost or 350 / - per cubic meter filling capacity and 50% of the cost of the unit cost,
on the construction of plastic lining (raw) diggings, by constructing a minimum of 4.00 lakh
liters of Filler capacity and more than 50% of the unit cost. The amount of rupees 100 / -
per cubic meter will be filled up or maximum Rs 2.00 lakh, whichever is less the grant will be
payable.
For Water Houze construction under the national Agriculture Development Scheme,
support is provided for areas where deep water is used for irrigation. For constructing a
minimum of one lakh litres of Fill Capacity water shed Houz for all categories of farmers, 50
percent of the unit cost or Rs. 350 / - per cubic meter fill capacity or maximum Rs. 75000 / -
whichever is less is the subsidy element.
Under the irrigation pipeline head (of National Agricultural Development Plan, National
Food Security Mission, NMOP) water use efficiency is promoted for irrigation water. Under
this scheme, PVC / HDPE of prescribed size for carrying water from source to farm on
irrigation pipeline is supported. On the purchase of pipes, the farmers of all categories are
given 50 percent of the cost or maximum amount Rs. 50 / - per meter on HDPE pipes or
Rs. 35 / - per meter on PVC pipe or Rs. The maximum amount of Rs.15000 / - on the 20 /
- per meter HDPE laminated le-flat tub pipe will be payable, whichever is less proportionate.
Under the Fountain Irrigation program through National Food Security Mission; Pulses and
Wheat - Under the Fountain Irrigation Program, subsidy is 50% or the amount is Rs. 10000
/ - per ha, whichever is less.
Under the Mobile Raingun support program, for irrigation of grains and pulses crops,
subsidy of 50 percent of the cost under the Mobile Renganization program or Rs.15000 / -
per unit whichever is less, grant is payable. This subsidy is available under the NFSM scheme
Agricultural equipment grant distribution program: Grants up to 40 to 50 per cent are
given as per the category of farmers on the purchase of approved agricultural machinery viz.
Seed cum Fertilizer Drill, Plow, and Thresher etc.
Gypsum distribution program: 50% Subsidy is given to farmers on district-wise rate of
Gypsum for maximum area of 2 hectare. This support is for soil reclamation of alkali soils.
Plant protection inputs: Segment, viz. Plant Protection Chemicals / Bio Agents / Bio
Pesticides / Pheromone Trap / Liyos Distribution, including weeds in crops; 50% of the
price or Rs. 500 any less per hectare is payable as subsidy.

Value Chain Analysis - Soybean 70
Plan Protection equipments segment: Human transport * (napsek, foot sprayer, duster
etc.) are given 40-50 percent of the cost or maximum 600-800 / - Per device as subsidy.
Under Power Drivesegment * (Nepasek Power Sprayer) are given 50-60 percent of the price
or maximum 3000-3800 / - Per device. For tractor mounted sprayers, 50% of the price or Rs
10,000 per device is subsidized. These schemes are as per targets allotted for respective
districts.
Assistance for area specific integrated farming systems like livestock based, horticulture
based and tree based farming systems: Assistance is provided for farmers of selected
village/cluster having land from 0.25 to 2 ha area per farmer. It is implemented on cluster
basis with 100 ha of land. Subsidy applicable is: 50% of cost or 52500/-for farm pond, 50%
of cost or 468/-per SQM for green house, 50% of cost or 30/- per SQM for low tunnel,
40% of cost or 800/-per colony for bee keeping, 50% of cost or 15000/-for diesel pump,
50% of cost or 50000/-for vermi-compost unit Pucca @ 125/ per cubic feet, 50% of cost or
8000/-for HDPE vermi bed
Organic production: Organic Barley also has a great potential. For support under the head,
Promotion of Organic Farming, subsidies are available for heads like Conversion of land
Cropping systems and organic seeds, traditional organic input production unit, botanical
extracts production unit, use of phosphate rich organic manure, construction of vermi-
compost pit, use of liquid bio fertilizer and support for packing labelling and branding
material support are subsidized for consecutive two years at a rate specified in the manual.
Prime-minister Crop insurance scheme: Farmer have to pay 2% of insured amount in
Kharif, 1.5% of insured amount in Rabi and 5% of insured amount in horticulture &
commercial crops, subject to maximum of 7 hectare per farmer. Rest of the premium
amount will be borne by central and state government in equal ratio. Beyond 7 hectare,
farmer has to pay whole premium amount, i.e. without any subsidy.
Soil health card: Under this, component, district level soil and water testing labs support
farmers on soil testing and providing soil health card for integrated nutrient management.
B. Rajasthan State Seed Production and Certification agency helps in ensuring production of
certified seeds for farmers. The department is mandated to; Recognize varieties eligible for Seed
Certification and annually publish lists indicating the names of such varieties, Maintain a list of
sources of Breeder & Foundation seeds approved by the Central Seed Certification Board,
Outline the procedure for submission of application for growing, harvesting, processing,
labelling and tagging of seeds intended for certification, Undertake inspection of seed fields,
seed processing plants and lots in accordance with the procedures outlined by the Central Seed
Certification Board in accordance with Indian minimum seed certification standard (IMSCS),
Regulate the processing of seeds at seed processing units and Ensure that the seeds certified by
it conforms to the standards prescribed by the Central Seed Certification Board. Thus the
department ensures availability of quality seeds for growers.
C. Rajasthan State Seeds Corporation helps availability of quality seeds at affordable prices
through the cooperative network and private distributorship channel under the trade name “Raj
Seeds”. During Rabi and Kharif seasons Rajseeds are made available at the door steps of the
farmers through Beej raths operating at almost every panchayat samitttee of the state. The
department sold around 6520 quintals of barley seeds in Rabi 2016-17.
Value Chain Analysis - Soybean 70
D. Rajasthan Kisan aayog (Rajasthan State farmer Commission): It is mandated to
Investigate and review of agriculture and allied sectors, keeping in mind the economic ecology
and environment for sustainable development of agriculture and To inform the State
Government for taking necessary measures to solve timely problems of agriculture, animal
husbandry and fisheries, so that farmers can be protected against difficult situations, Talk to
different farming organizations / associations to make the government aware of their demands
and suggestions and To bring the difference in demand and supply to the attention of the State
Government, so that its adverse effects are not on the peasantry.
E. State Agricultural Management institute (SIAM), Durgapura Jaipur: The institute is
mandated to organize training programmes on functional areas of Agriculture and its allied
sector namely; Induction courses on fresh recruitees, Refresher courses for in service officials ,
Crop production technologies, Management of Technology and Input, Irrigation Management,
Dry land Farming, Crop Economics, Extension technique, Communication skills, National
Workshop / Seminars etc.
F. Agricultural Conservation Testing Centers (ATCs): The department of Agriculture has ten
ATCs who are mandated to find out the usefulness of the research recommendations received
from the agricultural research centers under the agricultural universities of the state in various
agricultural and regional conditions and local conditions and to amend the tests in the research
recommendations according to local conditions. On the basis of the tests, preparations of
agricultural climatic package of practice and amendment of the advanced agricultural methods
are amended. Apart from this, the agri-certified testing centres also solve the technical problems
in the day-to-day work of the extension workers.
7.1.2. ICAR and allied institutions:
The Indian Council of Agricultural Research (ICAR) is an autonomous organisation under the
Department of Agricultural Research and Education (DARE), Ministry of Agriculture and Farmers
Welfare, Government of India. The Council is the apex body for co-ordinating, guiding and
managing research and education in agriculture including horticulture, fisheries and animal sciences
in the entire country. With 101 ICAR institutes and 71 agricultural universities spread across the
country this is one of the largest national agricultural systems in the world. The ICAR has played a
pioneering role in ushering Green Revolution and subsequent developments in agriculture in India
through its research and technology development that has enabled the country to increase the
production of food grains by 5 times, horticultural crops by 9.5 times, fish by 12.5 times , milk 7.8
times and eggs 39 times since 1951 to 2014, thus making a visible impact on the national food and
nutritional security. It has played a major role in promoting excellence in higher education in
agriculture. It is engaged in cutting edge areas of science and technology development and its
scientists are internationally acknowledged in their fields.
State Agriculture Universities (SAUs):
The four major Agriculture Universities of the state namely 1. Swami Keshwanand Rajasthan
Agricultural University, Bikaner, 2. Maharana Pratap University of Agriculture and Technology,
Udaipur, 3. Sri Karan Narendra Agriculture University, Jobner, 4. Agriculture University, Kota; and
affiliated colleges who contribute to research, education, training and knowledge dissemination on
agriculture technology. The Agriculture Universities also provide research and extension support
through attached Krishi Vigyan Kendras and Agriculture Research Stations.
Following are the varieties of Barley developed by various Agriculture Universities in Rajasthan.
Value Chain Analysis - Soybean 70
ARS Kota is a pioneer institute supporting crops in the region. It has a well-equipped laboratory
containing various testing investments, Kisan call centre and a post-harvest technology lab. More
than 20 scientists and 80 other support staff are engaged in various research activities.
Pratap Soy 1, Pratap Soy 2, Pratap Raj soy-24, RKS 45, RKS 113 are the major varieties
recommended by ARS Kota.
Krishi Vigyan Kendras;
The State has 42 Krishi Vigyan Kendras affiliated through ICAR. The mandate of the KVKs is to: 1.
Organize Frontline Demonstrations (FLDs) to establish production potential of various crops and
enterprises on farmers field (Facilitate technology dissemination from Lab to field) 2. to conduct on
farm testing to identify the location specificity of agricultural techniques under various farming
systems, 3. Organize need based training to farmers on agri and allied activities, 4. production and
supply of good quality seeds and planting materials and various farming products to the farming
community and 5. Work as resource centre of agricultural technology for supporting initiatives of
private, public and voluntary sector for improving agricultural economy of the district. The KVKs
also offer soil testing facilities to farmers.
Agriculture Research Stations: Apart from the above, there are several agriculture research
stations and sub-stations attached to the universities to undertake research/trial and demonstration
of agriculture technologies.
Society for Soybean Research affiliated to ICAR- IISR (Indian Institute of Soybean
Research)
Society for Soybean Research and Development (SSRD) is a registered society with its headquarters
located at the ICAR-Indian Institute of Soybean Research, Khandwa Road, Indore-452001, Madhya
Pradesh, India. The objectives of the Society are- All authors in a manuscript (MS) for publication in
Soybean Research should be member of the society. Provide and promote opportunities for
interaction and fellowship amongst scientists interested/engaged in different scientific pursuits.
Publish a journal in English which shall be called “Soybean Research” and bulletins, reports, books
and newsletters as decided from time to time, for the advancement of aims of the SSRD. Hold
seminars, symposia, colloquia and provide forum for interaction of different scientific and
educational organizations working in soybean production. Discuss inter-disciplinary R&D
Programmes relevant to soybean production and utilization, etc. Undertake any activity that directly
or indirectly serves the cause of the SSRD.
National Research Centre for Soybean, Madhya Pradesh
Established during the year 1987 for the needed centralised research to support soybean production
systems research with basic technology and breeding material.
7.2. Support at post-harvest, Primary and Secondary Processing stage26
Following are the major support institutions for post-harvest handling of agriculture produce in the
state.
A. Department of Agriculture marketing (DAM): The department offers up to 50% subsidy on
various sorting/grading machines as specified in the circular dated 19/07/2017.
26 agmarknet.nic.in
Value Chain Analysis - Soybean 70
B. Post-harvest storage: Department of Agriculture provides subsidy for metal storage bins to
farmers. Apart from this, following storage infrastructure is available in the state.
Rural Godowns: There are 139 rural godowns in Rajasthan which stores mustard, gram,
wheat, bajra, gaur, soybean, groundnut etc. The list of godowns in Rajasthan that store barley is
attached in Annexure-5
Central Warehousing Corporation27:
The Central Warehousing Corporation (CWC) is the largest public sector warehouse operator
with their godowns established in almost all the states of the country. At present, CWC have
already established and operating more than 450 warehouses with a capacity of 93.25 lakh
tonnes (as on 29/02/2004). These are scientifically constructed warehouses which facilitate the
farmers to store their produce safely and to derive the benefit of pledge finance during the
period of glut situation in the markets. (Annexure - 2 List out CWCs in Rajasthan)
State Warehousing Corporation
State Warehousing Corporations (SWCs) were established in different states under the purview
of concerned state governments and constructed godowns at distant places. The total share
capital of SWCs is contributed equally by CWC and concerned state governments and SWCs
under dual control. The SWCs also provide storage facilities for green gram. (Annexure – 3
Lists of SWCs in Rajasthan)
C. Market information through Agmarknet:
The Directorate of Marketing and Inspection (DMI), an attached Office of the Department of
Agriculture, Cooperation and Farmers Welfare under Ministry of Agriculture & Farmers Welfare,
was set up in the year 1935 to implement the agricultural marketing policies and programmes for the
integrated development of marketing of agricultural and other allied produce in the country with a
view to safeguard the interests of farmers as well as the consumers. It maintains a close liaison
between the Central and the State Governments.
The Directorate is headed by Agriculture Marketing Adviser to Government of India and has its
Head Office at Faridabad (Haryana), Branch Head Office at Nagpur (Maharashtra) and 11 Regional
Offices at Delhi, Mumbai, Chennai, Kolkata, Hyderabad, Chandigarh, Jaipur, Lucknow, Bhopal,
Kochi and Guwahati and the Central Agmark Laboratory at Nagpur28
D. Support on agri produce marketing through APMCs29
The state has 136 Krishi upaz mandi samitis (KUMS) and 310 market sub yards for trade of
agriculture commodities. Among them, grain mandis in Jaipur, Ganganagar, Kota, Bikaner,
Hanumangarh, Alwar and Sikar are major grain mandis in the state as far as Barley is concerned.
These APMCs are intended to be responsible for:
Ensuring transparency in pricing system and transactions taking place in market area;
Providing market-led extension services to farmers;
Ensuring payment for agricultural produce sold by farmers on the same day;
Promoting agricultural processing including activities for value addition in agricultural
produce;
27Farmers’ portal, CWC Link (http://farmer.gov.in/CWC_Link.aspx) (retrieved on April 9,2017) 28 Agmarknet (http://agmarknet.gov.in/) (retrieved on April 9,2017) 29APMC,Indian Economic Service, Arthapedia (http://www.arthapedia.in) (Retrieved On April 9,2017)
Value Chain Analysis - Soybean 70
Publicizing data on arrivals and rates of agricultural produce brought into the market area
for sale; and setup and promote public private partnership in the management of
agricultural markets
E. Support on post-harvest value addition: The Farm Gate Agro processing and Agri-
marketing scheme of Govt. of Rajasthan has provisioning for subsidy up to Rs 20 lakh for a
sorting/grading/ value addition project of Rs 50 lakh. Ministry of Food Processing, Govt. of India
also has a scheme in the name of Kisan Sampada (Backward & forward linkage scheme) through
which there is a provisioning of 35% subsidy for Farmers/Farmer Groups for establishing value
addition facility for agri produce.

Value Chain Analysis - Soybean 70
Chapter 8- Gap & Constraint Analysis
8.1. As Perceived by Producers and Other Stakeholder
Producer’s Circumstances
A typical farmer in the region with about 2.4 acres’ land holding has 0.8 acres deployed to Soybean production. The gross yield per hectare is 1.44 ton per hectare. The market rate of the sale is about Rs. 30000 per ton or Rs. 43,200 per hectare. The cost of cultivation is about Rs. 10,045 per hectare. Net realization per hectare is about Rs. 18,087.5 per hectare. Out of this about Rs. 7,500 is cost of land preparation per hectare, seed cost is about Rs. 2,700 per hectare, fertilizer and pesticide cost is about Rs. 1,000 per hectare, weeding related (labour cost) is about Rs. 1,400 per hectare and harvesting cost is about Rs. 1,400 per hectare. Packing cost is Rs. 70 per 90 kg or about Rs. 1120 per hectare. Transportation cost to mandi is about Rs. 187 per hectare- all totalling is around Rs. 25,112 per hectare. Fertilizer and pesticides are procured from local input supplier. The farmer is selling produce at local mandi @ price range of Rs 3,000 per quintal. Farmers in the region are not satisfied with the market price. Sometimes the production also gets reduced due to sudden change in climate
Varieties available in Soybean are NRC 37 (Ahilya 4). Also there is no storage facility for farmers. Farmers in the region are procuring seeds from big farmers. Their source of getting fertilizer and pesticides is village society. Farmers Seed facilitation services are also requested as seed rates are on the higher side. Such farmer is selling produce at local Mandi @ price range of Rs 3000.
Figure 20: Discussion with Farmers at village Samlopur, Pratapgarh

Value Chain Analysis - Soybean 70
Processor case study
Goyal Proteins Limited is among the largest soybean processor in Rajasthan, based at Kasar
Industrial area, Kota. They are a trusted name behind brand “Deep-Jyoti” and serve multiple
products including soya refined oil, Soya flour and Soya Nuggets. Goyal Group Founder Shri
Ramavtar Goyal formed Goyal Group in 1970. Based on their effort, soybean Processing Complex
was set up in 2001 at kasar, Kota Rajasthan, This is the only soybean processing plant in Western
India which intergrates the world's best technologies to process soybean produces value added
products which later was merged with Goyal Vegoils Limited in 2007 equipped with Chillax
technology as its Mustard Processing division. The manufacturing facilities are constructed of land
comprising. The Seed Preparation Plant, Solvent Extraction Plant facilitated with Flash
Desolventizer, Oil Refinery, Flour Milling Plant and Texturized Soya Protein Plant. The Texturized
soya defatted products like defatted soya DOC, Hydro DOC, Mustard DOC is the first product of
its kind to have the license to use the ISI quality mark from the Bureau of Indian Standards. Deep
Jyoti and Jyoti Kiran are widely acclaimed consumer edible oil among the western Indian populace.
Goyal Group is also engaged in crop developmental work like soybean variety trials, mustard variety
trails, seed multiplication and seed based agronomy, entomology and plant pathology experiments.
The Biometric observations are made with statistical analysis. They have a modern seed processing
unit to supply high quality soya Seeds for sowing purposes.
Goyal Proteins Limited has capacity to crush soybean up to 1300 Ton every day. They procure
soybean from nearby APMC Mandies like kota,Baran and Ramganj. For procurement they have
deputed their own employees who ensure constant Supply of the raw material. For this year
procurement was done at the price between Rs. 2800-Rs. 3100. April to September appears as lean
months for procurement so procurements are done at higher prices After Processing soya oil is
packed into 15 ltrs, 5 ltrs,2 ltrs and 1 ltrs of packaging which cost Rs. 10-Rs. 12. They have huge
network of wholesale dealers and suppliers across Rajasthan for selling their produce. They sell at
the price of Rs. 65-Rs. 75 per litre. They have all kind packaging like polypack, Jar and tin. The
entire process of soybean processing ends up with 5% of dual cake which is sold to the
manufacturer of Poultry feed As per the talk had with Mr. Trilok Goyal, Manager, Goyal Proteins
Limited it was highlighted that raw soybean Market is highly volatile and Prices keeps changes every
hour so every time you need to track the prices to mark prices at each marketing level.

Value Chain Analysis - Soybean 70
Figure 21: Discussion with Mr. Goyal
8.2. SWOT Analysis of the Pre-intervention Value Chain
Strength Weakness
Multiple uses both as oil seed and
protein supplement
Heavy demands of Soy oil in India
Low risk crop
Lower water requirement
Cost of cultivation is low
Low incidence of pest and disease
attack
High demand for value added soya
products in the market
High net returns for value added
products
High value for the soya products at
National and International level
Chances of reducing Nitrogen
containing fertilizers as it fixes N into
the soil
Soya products are considered as the
best way to combat malnutrition
Crop prone to replacement with pulses
Soy flour prone to indigestion and hence not
suitable
Lack of proper and adequate market
intelligence system
Low yielding locally available varieties of
soybeans are favoured by the farming
community.
Limited farmers have access to information
about price and arrivals of soybean in
different markets
Dearth of adequate good storage facilities for
producers
Most farmers sell their produce without any
grading which fetches poor price in the
market
Lack of facilities for oil testing to determine
the oil content in produce leads to poor value
accruals to producers/ farmers
Inadequate processing units for soybean
such as soymilk processing units, certified
seed production units, etc.
Picking (harvesting) of soybean pods is
difficult; labour constraints
Non availability of quality seed
Opportunity Threat
Ties with firms like Reliance,
Orion Commodities and
Services Pvt. Ltd., Ruchi Soya
Industries Ltd-Indore, Gujarat
Ambuja Exports Ltd-Pithambur,
Prestige Food Ltd-Indore and
Agro Solvent Products Pvt. Ltd-
Gwaliar, Adani Wilmar, Mahyco,
Eagle Seeds & Biotech, Gokul
Refoils & Solvent, etc.
Growing consciousness of the
public on processed products of
• Abrupt rise of temperature during crop
maturing stage i.e. September month
• Non availability of seed in time
• Stiff competition in increasing the
cultivable area from hybrids varieties
of Soybean/ cotton/pulses
• Rains immediately after sowing
damages crop
• Heavy rainfall during harvest
damages pods.

Value Chain Analysis - Soybean 70
soybean
Entry of branded companies into
the soya market (like Reliance,
Orion commodities and services
Pvt. Ltd., Ruchi Soya Industries
Ltd-Indore, Gujarat Ambuja
Exports Ltd-Pithambur, Prestige
food Ltd-Indore and Agro
Solvent Products Pvt. Ltd-
Gwaliar, Adani Wilmar, Mahyco,
Eagle Seeds & Biotech, Gokul
Refoils & Solvent, etc.) Facilitate
start-ups in secondary
processing (production of value
added products of soybean like
soya flour, oil, milk, chunks,
etc.) from amongst PC
members or individual
entrepreneurs
Establishment of quality sorting
and grading facilities by PCs as
part of Farmer Common
Services Centres (FSCS), along
with facilities for packaging and
vehicle to facilitate
transportation and connectivity
Establishment of storage
facilities by PCs as a part of
FCSC
PCs to undertake joint input
sourcing activities for seeds,
fertilizers, pesticides, etc.
PCs to also undertake custom
hiring services and hence lead
farm mechanisation
Chance to explore the market to
meet existing demand and
supply requirement
• Predominance of monoculture in
cultivation.
• Fluctuation in market prices
• Intense competition from other states
to market the soya produce
8.3. Key constraints in Soybean crop
Certain general loopholes observed in the cluster which indirectly impact the value chain of the crops are as follows-
Mobilization- As farmers are scattered across cluster and reside in the farm itself which makes it difficult to mobilize and federate them.
Migration- Male farmers migrate to the nearby states for labour work and women farmers are more active in farm practices.
Literacy- Banswara is largely tribal belt where education level is very poor.
Cultural issues- Male farmers tend to consume local liquor and waste lot of time in getting social rather than focusing on farming. It ultimately reduces their efficiency as well.
Rigidity- Due to low literacy level, the farmers are reluctant towards adoption of advance and scientific farming practices.
Economic condition- Very poor economic condition of farmers compels them to sell their produce in small parts to local traders and middlemen for immediate credit requirements.

Value Chain Analysis - Soybean 70
The constraints observed under Soybean value chain crop in the cluster are divided under from different categories, viz Production related constraints, Post-Harvest related constraints and Processing and market infrastructure related constraints.
8.3.1. Production related constraints:
In Kharif season Soybean has largest area under cultivation in the Palayatha cluster. Productivity & production level in the cluster is low for following reasons
a. Use of new high yielding certified, truthful varieties of Soybean, SRR (seed replacement ratio) is low in the cluster.
b. No seed treatment practice followed. c. Improper field preparation, Timely sowing, Proper row and plant
spacing, seed rate is not maintained d. Improper IPM (Integrated Pest Management) . e. Improper irrigation at critical stage and inadequate use of water. f. Improper weed management
8.3.2. Post-Harvest related constraints:
Soybean cannot be harvested directly through Combine harvester hence manually harvesting and threshing takes place which is laborious and tedious task. Sun drying is difficult due to cloudy conditions and high humidity at the time of harvesting. Unavailability of labour, threshers and commercial dryers in peak harvesting period hampers the quality of produce
Inadequate storage facilities in rural areas: Storage facilities in villages are found to be
inadequate which contributes leads to distress sale. Due to lack of storage facilities, substantial
quantity of commodity is also lost. Distress sale is obligatory on some farmers as they have to repay
the loan availed from traders during the time of sowing for seed, fertilisers etc.
Transportation facilities at producers’ level: Due to inadequate facilities of transportation at the
village level, producers are forced to sell in the village itself to itinerant merchants or traders directly
at low prices. Aggregation and negotiation with buyers is only possible if farmers have volume to
trade and transport up to procurement centre.
8.3.3. Processing and market infrastructure related constraints:
Processing facility is set up at about 25 to 35 km from the cluster area by the private ltd companies
like Ruchi soya who are procuring material from traders from APMC with advance payments. They
are interested to procure from farmers through farmer producer organisations only and not from
individual farmers at Factory level .
Traditional system of marketing: In the clusters, there is an absence of alternate channels of
marketing. So farmers typically sell only through APMCs or village level traders
Lack of market intelligence services: Farmers do not receive information on market prices. Some
farmers sell crops through village level traders, because due to which they are not realising fair price.
Lack of primary processing infrastructure:
i. There is a non-availability of facilities for primary processing: cleaning, grading & sorting at
the farm level.
ii. There is no practice and provision of producer level storage.
iii. There is acute lack of awareness among farmers regarding FAQ (Fair Average Quality)
standards.
iv. Farmers do not practice the usage of basic equipment like moisture meter and weighing
machine.

Value Chain Analysis - Soybean 70
Distant markets: Long distance market leads to farm gate selling where farmers receive non-
competitive prices for their produce.
Fluctuations in prices: Generally, the prices of commodities go down in the post-harvest period
due to heavy arrivals in the market and later shoots up. Farmers in the catchment area do not have
storage facility to store and they also don’t use a warehouse receipt system.
Lack of marketing information: Due to a lack of market information regarding prevailing prices,
arrivals etc., most of the producers’ market their produce in the Mandi without studying the price
trends. This creates glut in market during harvesting period which leads conflict between farmer and
traders on rate issue.
Adoption of grading: Grading of Soybean at the producers’ level ensures better prices to
producers and better quality to consumers. At present there is no infrastructure available at the
farmers’ level for primary processing.
Malpractices in markets: Many malpractices prevail in the markets i.e. excess weighment, delay in
payment, high commission charges, delay in weighing and auction, different kinds of arbitrary
deductions for religious and charitable purposes etc.
Hundekari System : farmers are compelled to sell the produce to the trader from whom he
has received credit for sowing of crops. It was observed that even MSP procurement is facilitated by
the respective trader of that farmer for weighing and bagging of his produce to FCI through Indian
warehousing corporation.
Infrastructure facilities: Due to inadequate infrastructural facilities available with the producers,
traders, millers and at market level, the marketing efficiency is affected adversely
Long Supply Chain: The existence of a long chain of middlemen also reduces the producer’s share
in consumer’s rupee.
8.3.4. Agribusiness policy related constraints:
Contract farming: Rajasthan has adopted a model APMC Act, 2007. In Rajasthan Contract
farming of desired variety and quantity as per buyer’s/processor’s need, has been allowed.
Buyer/processors may supply inputs and technical know-how and farmers may produce the crop
for sale to buyers at an agreed price. However, this price shall not be lower than minimum
support price and title of land shall remain with farmer. Produce will be purchased at
buyer/processor’s business/factory place. But processors found less interested in registering
under contract farming. Team ABPF discussed contract farming issues with some of the
processors and related challenges are given below:
i. Rule 5 – Each agreement shall be written on stamp paper of the value of Rs.100. This
increases cost of procurement and procurement time.
ii. Rule 9 – Separate registration form shall be filled for each agreement. Large amount of paper
work can be reduced by group registrations or procurement directly from FPCs.
iii. Rule 17-In case the contract farming buyer fails or refuses to purchase the agreed quantity of
the agriculture produce from the contract farming producer, he is to pay the amount of the
difference between the agreed price and the actual sale price of the contracted produce in the
market committee concerned to the producer. Mutual termination of contract should be
allowed.

Value Chain Analysis - Soybean 70
iv. Rule 19 – The contract farming buyer need furnish an undertaking equal to 20% of the value
of the contracted amount. This amount can be reduced and this will motivate big players to
participate in contract farming.
8.4. PIESTEC Framework
Soybean can be summarily considered within the adapted PIESTEC framework as follows:
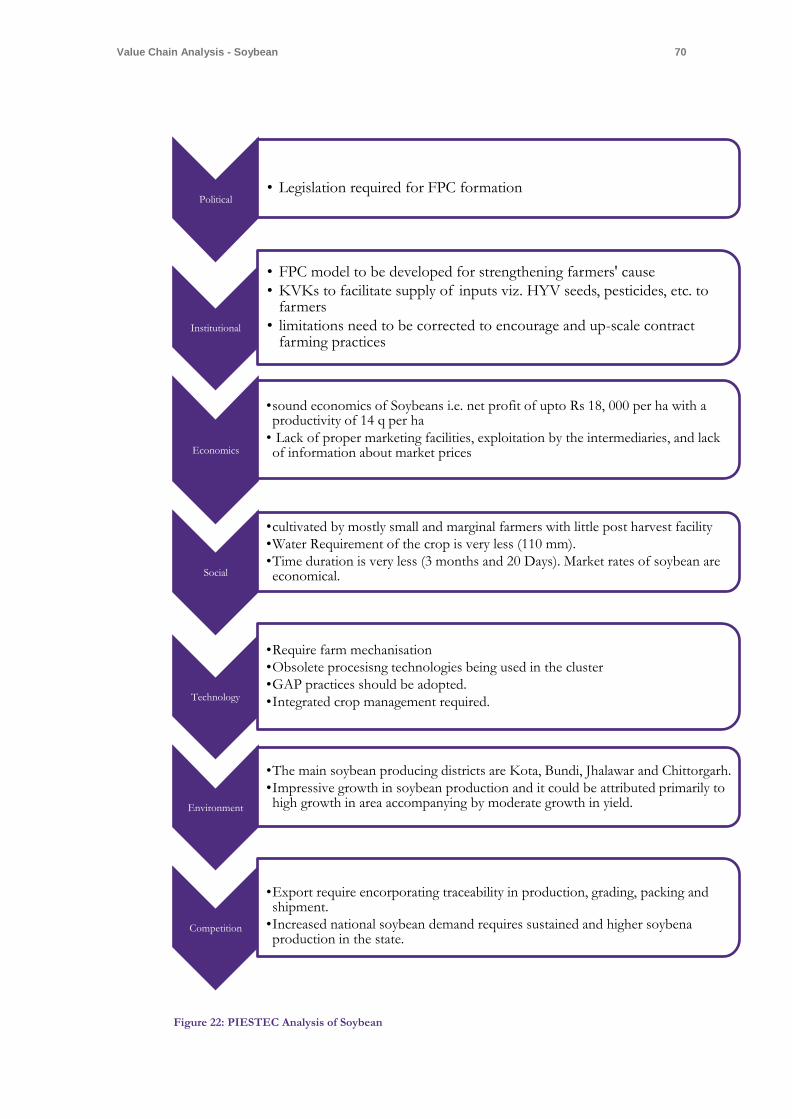
Value Chain Analysis - Soybean 70
Figure 22: PIESTEC Analysis of Soybean
Political
• Legislation required for FPC formation
Institutional
• FPC model to be developed for strengthening farmers' cause
• KVKs to facilitate supply of inputs viz. HYV seeds, pesticides, etc. to farmers
• limitations need to be corrected to encourage and up-scale contract farming practices
Economics
•sound economics of Soybeans i.e. net profit of upto Rs 18, 000 per ha with a productivity of 14 q per ha
• Lack of proper marketing facilities, exploitation by the intermediaries, and lack of information about market prices
Social
•cultivated by mostly small and marginal farmers with little post harvest facility
•Water Requirement of the crop is very less (110 mm).
•Time duration is very less (3 months and 20 Days). Market rates of soybean are economical.
Technology
•Require farm mechanisation
•Obsolete procesisng technologies being used in the cluster
•GAP practices should be adopted.
•Integrated crop management required.
Environment
•The main soybean producing districts are Kota, Bundi, Jhalawar and Chittorgarh.
•Impressive growth in soybean production and it could be attributed primarily to high growth in area accompanying by moderate growth in yield.
Competition
•Export require encorporating traceability in production, grading, packing and shipment.
•Increased national soybean demand requires sustained and higher soybena production in the state.

Value Chain Analysis - Soybean 70
8.5. Impact of GST over Soybean value chain:
The Goods and Services Tax is one indirect tax for the whole nation. GST is a single tax on the supply of goods and services, right from the manufacturer to the consumer. It will be levied at every stage of the product distribution chain by giving the benefit of Input Tax Credit (ITC) of the tax remitted in the previous stages. Therefore, the final consumer will bear only the GST charged by the last dealer in the supply chain, with set-off benefits at all previous stages. GST will replace all Central level taxes such as excise, service tax and custom duty as well as state level taxes like VAT, CST and entertainment tax among others. Table 33: Tax Structure
Transaction New Regime Old Regime Remarks
Sale within the state CGST+SGST VAT+ Central Excise/Service tax
Revenue will be shared equally between the Centre and the State
Sale to another state IGST Central Sales Tax + Excise/Service Tax
There will only be one type of tax (central) in case of inter-state sales. The Center will then share the IGST revenue based on the destination of goods.
The impact on the Food Processing Businesses:
With the latest information suggesting that the minimum GST rates will be 18% on all
products.
Implementation of the GST is said to increase the prices of agricultural goods. However,
the products will be able to reach the consumer faster due to state-level taxes such as Octroi
and entry taxes which will significantly reduce the time and hassle of transporting goods
across state borders.
GST will also favour the National Agricultural Market on merging all the different taxation
on agricultural goods will improve the marketing and virtual market growth.
Because GST is a consumption tax, it will be levied only when food products are sold by
the manufacturer and not when they are manufactured.
The Confederation of Indian Industries (CII) has also in its representation called for a zero
rate tax on products which have a rate of up to Rs. 10/- and Rs. 20/-. It also demanded that
all packaged material used as inputs by the food processing industry should have a zero-
percent rate.
Impact on Restaurants and Food Joints: Service tax liability with the credit of input VAT on goods consumed will get submerged into GST and irrespective of goods and services, the credit of input will be available for adjustment against the output liability. This will further optimize the working capital of these restaurants and consumers can expect the superior quality of goods and services.
Please refer to Appendix 4 for product wise GST rates of Food Products.

Value Chain Analysis - Soybean 70
Chapter 9- Proposed Intervention and Investments
9.1. Intervention areas for Value chain strengthening
The constraints and intervention plan for various stakeholders, such as farmers, processors, NGO and RACP, in the value chain of Soybean may be considered
in context of three stages/activities, namely the production, post-harvest and processing stage. The constraints may be viewed in terms of pest and fungus attack
in crops and use of obsolete farming technologies by small and marginal farmers. These may be addressed through provision of resistant varieties to producers
through an envisaged FCSC, which in addition to input facilitation may also provide custom hiring services.
At the post-harvest stage, critical constraints may be viewed in terms of inadequate storage facilities and enormous intermediaries in the value chain which can be
corrected through PCs facilitating service. Also there is limited access to market intelligence about price arrivals of the soybean in different markets which can be
facilitated through the market intelligence system developed by FCSC. At the processing stage there are limited processing units in the regions and state into
producing value added Soybean products including Soybean oil mill, Soy paneer, Tofu and flakes, etc. Appropriate start up counselling may address this issue.
In terms of intervention on the production front, productivity is low which is also partly because of inadequate availability of high yielding varieties. There is,
therefore, scope for intervention by the way of introduction of new high yielding varieties in the region. Line departments under RACP and NGO service-
provider may support the initiatives in terms of dissemination of benefit of going in for new high yielding varieties. Apt amendments in the contract farming Act
could further facilitate this initiative.
Traditional package of practices results in lower yield as against potential. There is therefore need to train farmers on the best package of practices. This could
also be undertaken by stakeholders like large processors. There have been limited efforts in capacity building of farmer leaders (entrepreneurs) and BODs at the
field- level. In this regard, it may be appropriate for ABPF to enable formation of FPCs to meet minimum scale requirements for upgrading as well as
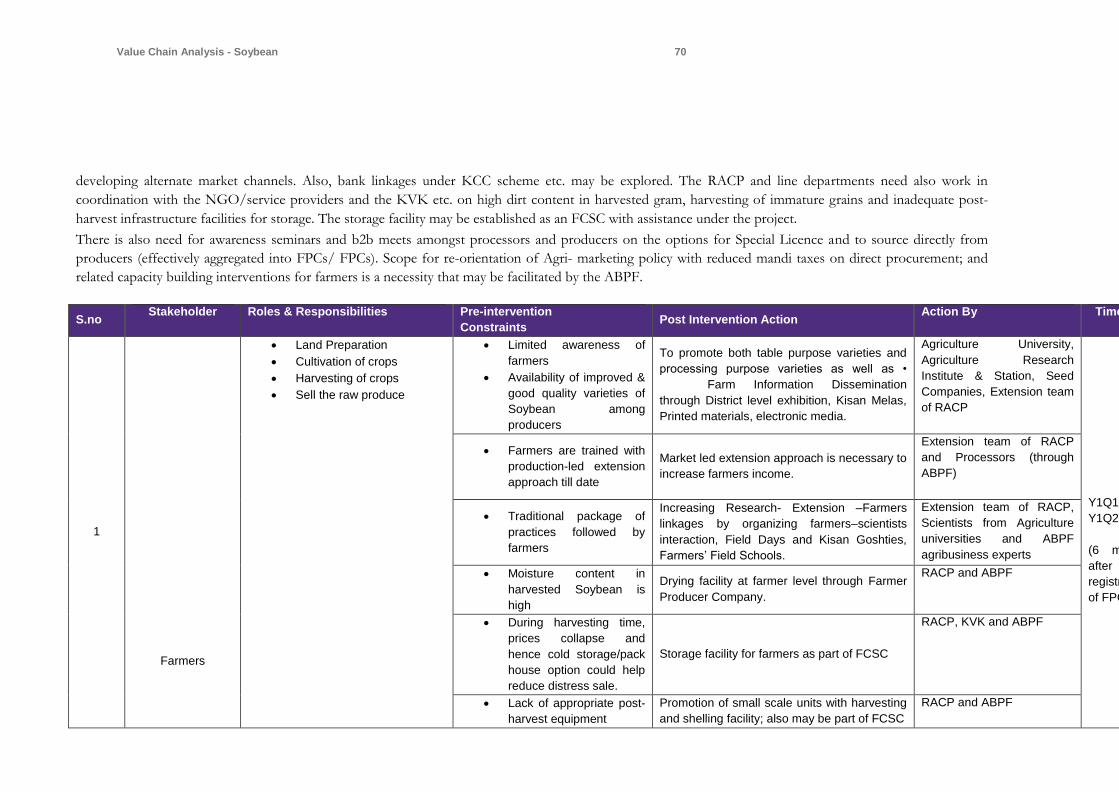
Value Chain Analysis - Soybean 70
developing alternate market channels. Also, bank linkages under KCC scheme etc. may be explored. The RACP and line departments need also work in
coordination with the NGO/service providers and the KVK etc. on high dirt content in harvested gram, harvesting of immature grains and inadequate post-
harvest infrastructure facilities for storage. The storage facility may be established as an FCSC with assistance under the project.
There is also need for awareness seminars and b2b meets amongst processors and producers on the options for Special Licence and to source directly from
producers (effectively aggregated into FPCs/ FPCs). Scope for re-orientation of Agri- marketing policy with reduced mandi taxes on direct procurement; and
related capacity building interventions for farmers is a necessity that may be facilitated by the ABPF.
S.no Stakeholder Roles & Responsibilities Pre-intervention
Constraints Post Intervention Action
Action By Timeline
1
Farmers
Land Preparation
Cultivation of crops
Harvesting of crops
Sell the raw produce
Limited awareness of
farmers
Availability of improved &
good quality varieties of
Soybean among
producers
To promote both table purpose varieties and
processing purpose varieties as well as •
Farm Information Dissemination
through District level exhibition, Kisan Melas,
Printed materials, electronic media.
Agriculture University,
Agriculture Research
Institute & Station, Seed
Companies, Extension team
of RACP
Y1Q1-
Y1Q2
(6 months
after
registration
of FPC)
Farmers are trained with
production-led extension
approach till date
Market led extension approach is necessary to
increase farmers income.
Extension team of RACP
and Processors (through
ABPF)
Traditional package of
practices followed by
farmers
Increasing Research- Extension –Farmers
linkages by organizing farmers–scientists
interaction, Field Days and Kisan Goshties,
Farmers’ Field Schools.
Extension team of RACP,
Scientists from Agriculture
universities and ABPF
agribusiness experts
Moisture content in
harvested Soybean is
high
Drying facility at farmer level through Farmer
Producer Company.
RACP and ABPF
During harvesting time,
prices collapse and
hence cold storage/pack
house option could help
reduce distress sale.
Storage facility for farmers as part of FCSC
RACP, KVK and ABPF
Lack of appropriate post-
harvest equipment
Promotion of small scale units with harvesting
and shelling facility; also may be part of FCSC
RACP and ABPF

Value Chain Analysis - Soybean 70
S.no Stakeholder Roles & Responsibilities Pre-intervention
Constraints Post Intervention Action
Action By Timeline
Due to inadequate
facilities of transportation
at the village level,
producers are forced to
sell local merchants or
traders directly at low
prices
Provision of Pick-up van as part of
FPC services to the farmers.
ABPF, RACP
Lack of scientific sorting
system and
cleaning/grading facilities
To make farmer aware about quality
parameters of Soybean for
processing like value added
products; washing/Cleaning &
Grading facilities as part of FCSC/s .
Additionally, mini pulveriser plants
could also be established as part of
FCSC/s
RACP, SPs with inputs from
ABPF
Higher level of dirt and
impurities in harvested
Soybean
Provide cleaning and grading facility to farmers as part of FCSC
ABPF, RACP
2
Processors Process the raw produce
Value addition
Packaging of value added
product
Limited adoption of direct
procurement and contract
farming
Setting up alternate channel to sell
directly from PC to processor or large
retail shops.
Large Processor/ Buyer and
ABPF, RACP
Y1Q3-
Y2Q2
(6 months
after
registration
of FPC)
Limited processed
product available in the
market which limits the
marketing potential of the
commodity
Facilitate the entrepreneur
development to set up small scale
processed product like Soybean
powder
ABPF, RACP
Many existing processors
and budding
entrepreneurs are not
aware of schemes of the
GoI Including CLCSS,
cluster Development
scheme or “Sampada” for
Awareness seminars for processors
ABPF, RACP

Value Chain Analysis - Soybean 70
S.no Stakeholder Roles & Responsibilities Pre-intervention
Constraints Post Intervention Action
Action By Timeline
technology upgrading.
3
NGO Extension services to
farmers
Disseminate RACP
Schemes to the farm level
Distribution of seeds and
farm kits as per various
schemes
Hand holding support to the
farmers regarding
Lack of skilled personnel
Poor field-farm level
coordination
Outdated extension
activities
Lower level of interaction
and adoption of
RACP/govt. schemes
Training of NGO field staff on market
led extension services
Business planning training
Monthly/Fortnightly review meetings
with RACP
Feedback of farmers from service
area
Exposure visits of NGO staff to
successful FPCs
RACP
ABPF
KVKs
Y1Q1-
Y2Q4
4.
RACP establish the feasibility of
sustainably increasing
agricultural productivity and
farmer income
integrate agriculture water
management and
agricultural technology,
Establish farmer
organizations (FPCs) and
market innovations in
selected locations
Lack of clarity on the form
of FPO- Cooperative or
FPC
Selections of capable
leaders for the proposed
FPO
Low level of awareness
among the PMU staff and
farmers regarding the
concept of FPC
Poor or no Market
linkages of the value
chain crops in clusters
Lack of active NGO staff
deployed in the cluster
Create basic understanding among
the RACP PMU staff about concepts
of FPC
Clear understanding on fundamental
differences between FPC &
Cooperative
Create market linkages by bringing
more big players and processors to
the cluster
Conduct training of the potential
farmer leaders about FPC and its
functioning
Capacity building training of the NGO
staff regarding the extension services
to be provided to the farmers
ABPF
RACP PMU Line
staff
NGO
Y1Q1-
Y2Q4
Figure 23: Intervention Plan of soybean along with stakeholders’ matrix
Value Chain Analysis - Soybean 70
9.2. Envisaged Post-intervention Value Chain Map of Soybean
9.2.1. Proposed Post Intervention Value Chain Map
The post intervention value chain map for Soybean may be visualised as one with three production-
distribution or activity-marketing channels: edible oil, feed and value added products like soy paneer,
tofu and Soybean flakes. It is also envisaged that PCs of producers with FCSCs is evolved. Such
FCSCs only undertake storage, grading and sorting and packaging of produce activity. These FCSCs
may offer other related services in terms of input facilitation, custom hiring, facilitating B2B
connectivity etc. Farmers’ income from Soybean cultivation may be enhanced.
As it is clear in the below given proposed value chain map of Soybean, the FPC intervention would
take away the direct share of 4% in the channel 1 while there would be direct benefit of additional
1% to the farmers. The remaining stakeholders would remain directly unaffected as such from the
FPC intervention except for secondary processors who would get aggregated volumes with required
quality parameters being met by the FPCs. The FPC intervention would benefit the farmers by
providing them with the appropriate storage facility as well as cleaning & grading systems. This
would positively impact the post-harvest losses which would reduce to 3-4% as compared to
previously. It would also improve the holding period at the cluster level any FPCs would have an
added benefit of storage system. Enhancing post-harvest practices could potentially lead to higher
acceptability in the global market. Also, the restructured value chain will have PC/s and their
FCSC/s replacing Mandis and undertaking aggregation plus grinding and sorting and packaging
services. The PCs need input facilitation, custom hiring and marketing of produce.
Thus in the Common facility centre of FPC, cleaning & grading would primarily be done in large
scale processing units, leading to uniform moisture loss. Moreover, the moisture content would be
monitored to maintain the soybean oilseed quality. Moreover, the harvesting process would also
comparatively more mechanized, which would reduce losses due to post harvest farm activities
(threshing, separating, etc.). Storage would largely be done in the large silos/bins which are
monitored & treated regularly to prevent losses from pest attacks. The transportation would
primarily through closed locked and tracked vehicles. This reduces both the natural losses and
pilferage The major role of ABPF- GT as a major influencer and support institution would in this
circumstance also be to carry out capacity building initiatives of the potential leaders (BoDs) of the
FPC, NGO staff and PMU staff line, conducting value chain studies of the crops (market led), plan
interventions to improve the returns to the farmers in the concerned project clusters.
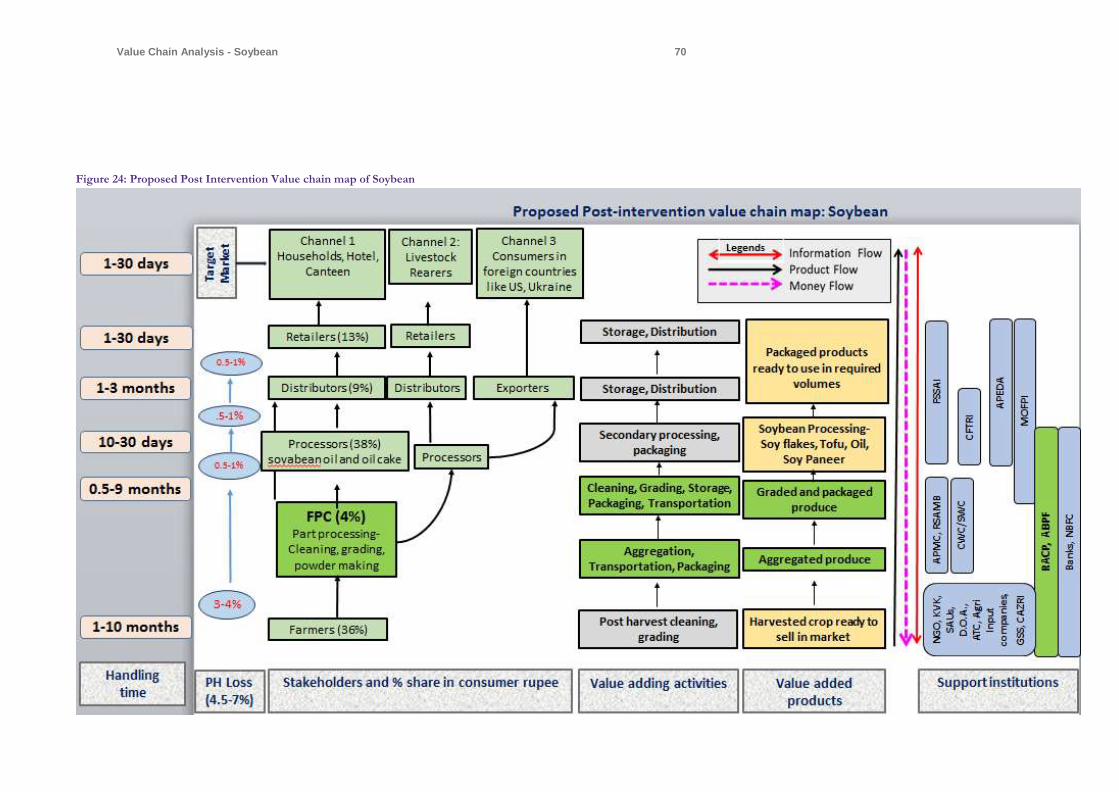
Value Chain Analysis - Soybean 70
Figure 24: Proposed Post Intervention Value chain map of Soybean

Value Chain Analysis - Soybean 70
9.2.2. Intervention through FPC in the Soybean Value Chain Crop
Introduction to FPC Model
Aggregation is the proposed solution of the constraints farmers are facing at present. It is proposed to form Farmers Producers’ Company by bringing farmers together in the form of voluntary groups of about 15 to 20 active farmers and federating 20 to 25 such groups into a Producer Company. These Producer Companies will be functioning on behalf of member farmers and will strive to undertake a range of activities which will result in added value accruals to farmers and value to farmers produce. To form a producer company, producer groups will be mobilized (in some cases, this initiative may have already been completed by NGO’s).
It is envisaged that an elected committee of members of Producers Groups will form a management committee and oversee the performance of an incentivized manager/CEO. The manager will be trained in technical issues of post-harvest management, marketing and in operating a transparent accounting system. The ABPF will support the operation of the Producer Company, and accelerate the cross learning of best practices.
FPC Development Approach
The FPC development approach may be viewed as depicted below:
Figure 25: FPC Development Approach
Following are the steps to be followed for formation of the FPC:
PRI of the MTG: The MTGs will be made aware on the FPC model through PRI and
individual farmers will be motivated to join the FPC as shareholder through respective
MTGs.

Value Chain Analysis - Soybean 70
Initial discussions with MTG leaders: After PRI is done; initial discussion will be done
with the MTG leaders for further orientation on FPC concept.
Identification of MTG leaders: MTG leaders who show inclination to the concept will be
selected in the executive committee for FPC formation.
Resource mobilization and FPC planning: The executive committee will meet 2-3 times to
plan further activities of FPC viz. crops, strategy for business etc.
Election of BoD and Share collection: 10-12 BoD will be identified along with 2-3 expert
directors one each from Agri, Horti, AH and WS dept. The BoD will decide on share value
and initiate collection of share through MTG leaders.
FPC registration: Following identification of FPC BoD, registration will be done. This
may take 1-2 months as DIN no of BoD has to be generated first. Care should be take that
all elected BoD should have PAN no so that there is no delay in paper formalities for
registrations.
FPC business: Following registration of FPC, ABPF will prepare business plan for the
FPC and facilitate market linkage for input and output.
Setup of processing/ financing – ABPF will further facilitate establishment of processing
unit setup along with feasibility studies and planning business linkage with market players.
Policy and Management
A FPC will function within the overall policy and regulatory framework as per the Producer
Company Act. The management of a FPC will vest with the elected Board from amongst the
members. The provision about constitution of managing committee will be made in the byelaws.
The management of FPCs will be by an elected Board of Directors. Therefore, the representatives
of farmers will actually oversee and manage the affairs of a FPC..
The selection criteria for membership of FPC may be viewed as follows:
1. A member will express his willingness to become a member of MTG.
2. A member will actively participate in all functions and activities of MTG
3. A member will contribute his equity to the FPC
4. A member will bring all or part of his produce to the FPC for sale.
5. A member will purchase all or part of his farm inputs through the FPC.
6. A member will produce and prepare his produce for marketing as per directions of
FPC.
7. A member will contribute his share to the Producer Association as upfront payment for
the business development plan of a FPC as needed.
8. A member will contribute his share to the Producer Company towards the reserves of
FPC as needed.
Illustrative list of components of a common facility of a Producer Company (Food Grain)
Godown for storage, drying platforms
2-3 MT per hour grain cleaning, grading, and packing machinery with shed
Additional need based Agricultural Equipment
Computer with internet connectivity for market information
Display Board with Accessories
Auction Hall
Input Suppliers Shops
Toilets
Value Chain Analysis - Soybean 70
Drinking water & Electricity
Note: Though the illustrative infrastructure proposed is shown in the above tables, the actual infrastructure to be developed will be need based and on participative consultation process.
Typically, start-up may be involved in secondary and tertiary processing activities while FPC’s may be involved in post-harvest and primary processing activity. In many cases, start-up may emerge firm within FPC members.
The evaluation of success should be evaluated on the parameters as under:
I. PCs operating without financial support by the end of 36 months.
II. The PC operates with a reserve fund to cover short term cash flow deficit and with
potential for reinvestment in various activities
III. The PC has an effective governing structure.
IV. The PC has a transparent accounting system.
V. The PC can function as a working example for other farmer organizations to observe and
learn from.
VI. Contribution towards increasing farmers’/members incomes.
FPC Revenue model
The revenue model for typical FPCs may be viewed in terms of revenue from:
1. Input facilitation services (this could imply revenue by virtue of service such as
dealership/distributorship for seeds, pesticides or fertilizers). About 50% of the dealer’s
discount may be perhaps is retained by FPC and 50 % be passed on to FPC farmer member
as to reduce their input costs.
2. Processing and storage services through FCSCs to be offered to FPC members and other
providers in the region and user/service change collected (typically) at perhaps the rate of 1
to 3 percent of value of commodity.
3. Marketing service may be offered in terms of facilitating charges typically @ between 1-2
percent of sales value.
4. MSP facilitation service in terms of facilitating procurement and supply to NAFED/SFAC
etc. after, a 1 percent service charges is levied for such activity by FPCs.
5. NCDEX related farmers trading may be facilitated by FPCs as a risk hedging option and
user charges collected at a negotiated rate with members.
6. Custom hiring services may be provided either through tying up with service providers or
including equipment as part of FCSC.
Working capital service would be in terms of FPC providing and marketing of produce from
member farmers. Here, the FPC may retain the price spread as service charge.
9.3. Outcomes of value chain study
1. Increase in farmers share by 5% through FPC
2. Higher price realization for crops by farmers
3. Lower cost of production adds to the farmer's net profit through
i. Acquire quality inputs at discounted price
ii. Farm Demos on GAP, PoP
iii. Dissemination of advanced technology through contract farming with
MNCs & their likes
iv. Custom hiring to increase farm mechanisation
4. FPC led intervention to establish Processing and storage infrastructure

Value Chain Analysis - Soybean 70
5. Potential Services by FPC
i. Marketing service with facilitating charges typically @ between 1-2%of
sales value.
ii. NCDEX- linked commodity trading with user charges at a negotiated
rate
iii. Custom hiring services with nominal charges
MSP facilitation service with 1 % service charges
9.4. Conclusion
This value chain analysis of Soybean clearly brings out that unlike any other enterprise, agriculture is
critically dependent on external factors like the bounties of nature for its success; be it unseasonal
rain, hailstorm, delayed monsoon, less rain, no rain, or excess rain, all of which makes agriculture a
high risk and vulnerable proposition. This perpetual environment of high risk and vulnerability has
significantly lowered farmers’ confidence and suppressed their entrepreneurial instincts as was amply
reflected in the discussions held over cluster level meetings.
Till date, farmers have benefitted mainly from government’s input driven schemes while market
access interventions such as mandis have created more barriers (middlemen) than benefits and
resulted into market inefficiencies that eventually exploited farmers. Despite being at the receiving
end of market barriers and inefficiencies for generations, individually, small farmers may perhaps
never muster enough strength to overcome market challenges. In such a scenario, the intervention
of establishing Farmer Producer Companies in the clusters has potential to unleash their suppressed
energies and to promote rural entrepreneurship. It would encourage farmers to collectively delve
into market operations to compete and design specific market solutions such as aggregation and
sales of produce, operate custom hiring and composite input sales centres.
For the farmer, increase in input costs, without corresponding increase in output prices, has
rendered agriculture unviable. And, in the absence of any other locally available alternate livelihood
options farmers cannot even move away from agriculture. Thus, RACP along with the market
driven intervention of ABPF also aims towards integration of farmers and help them join hands for
a collective cause, assist them to move up the agriculture value chains as to actively participate in
market functions, an unexplored but lucrative territory for them so far. This would spur vertical
business integration and diversify their market portfolios to reduce their vulnerabilities.
Value chain actors or stakeholders decide sale prices of their produce/products and compete
effectively in the markets whereas farmers often depend on Minimum Support Price (MSP) fixed by
government agencies to sell grains. Trader’s cartelisation ensures that MSP becomes the Maximum
Gain Price (MGP) fetched by farmers, further squeezing their revenues. The end result has been a
declining contribution of agriculture to the national economy. It is also true that given farmers’
inability to deal effectively with market forces, in the absence of MSP, farmers would have been
possibly in an much worse off situation.
Thus in the Common facility centre of FPC, cleaning, grading and packaging would primarily be
done, leading to uniform grades of soybean seeds with appropriate quality and packaging. Moreover,
the moisture content would be monitored to avoid any infestation during storage. Moreover, the
harvesting process would also be more mechanized, which reduces losses due to post harvest farm
activities (threshing, separating, etc.). Storage would largely be done in the large silos/bins which are
Value Chain Analysis - Soybean 70
monitored & treated regularly to prevent losses from pest attacks. The transportation would
primarily through closed locked and tracked vehicles. This reduces both the natural losses and
pilferage
The major role of ABPF- GT would in this circumstance also be to carry out capacity building
initiatives of the potential leaders (BoDs) of the FPC, NGO staff and PMU staff line, conducting
value chain studies of the crops (market led), plan interventions to improve the returns to the
farmers in the 17 project clusters, develop the business plan for registered producer companies in
clusters, support and assist agri start-ups in the region, and thus develop overall market linkages.
The formation of FPC supported by RACP ABPF, local NGOs and facilitation centres like KVKs,
provides the much needed opportunity to farmers to favourably and positively change their outlook
in years to come.

Value Chain Analysis - Soybean 70
Annexure 1: Stakeholder’s consulted over the study
Producers Processors Traders Government agencies
Others
1. 15 Framer in Kushalgarh cluster
2. 5 farmer in Palayatha cluster
3. 5 farmer in Orai-Bassi cluster
4. 5 Farmers in Jakham cluster
5. 5 Farmers in Sangod cluster
6. 5 Farmers in Manoharthana cluster
7. 5 Farmers in Gudha cluster
Ruchi oil industries, Mr Dinesh Vyas, Jaipur, 995507191 Goyal Group Trilok Chand Goyal Kota 9414176361 ITC E-Chaupal Mr Prakash Dhanvijay Jaipur 9011009545 Adani Group Pradeep Dhaiya, Kota 9672999101
1.Java Trading Company, Jaipur Contact: 9785169735 2. Kawarlal Mahendra kumar Manoharthan 9929726070 3. Jain Traders Babit Jain Playatha 9414191228 4. NemiChand APMC Trader, Jakham 9414418655 5. Purshottam Khandelwal APMC Trader, Pisangan 9414388718 6. kamal kumar Jain Anaj mandi, Kota 9772529854 7. Gokulchand Bhagwati Prasad APMC Trader, Pratapgarh 9414009723
1.K. C. Meena (DPM) Dep. of Agriculture, Jahlawar 9571569638 2. Jitendra Jahangir (DCA) Dep. of Agriculture , Jhalawad 7014812577 3. Nitin Shinde (DC) Dep. of Agriculture, Jhalawad 9946229354 4. Harimohan Berwa (Secretary) APMC, Patan 9461788564 5. N.N. Jinadal (President) DIC, Chittorgarh 9414734834 6. Sitaram Meena (Director) Dep. of Horticulture, Palathya 9928491095 7.Suneel Kumar Chaudhary (DPM)
1. SMPCL, Bundi, Abhik, CEO of FPC 2. Kirti Kumar porwal (T.L) NGO, Manoharthan 9166722007 3. Bhupendra Singh (DD) ATAM, Bassi 9414660448 4. Virendra Singh (Director ) ATSC, Bassi 9694635060 5. D. K.Singh (PC) KVK, Baran 9414662038 6. G.L Keshwa (Director) Agriculture University, Kota 7442321204 7. Hemraj Verma ( Agriculture Expert) NGO, Banswara 941415973

Value Chain Analysis - Soybean 70
Annexure 2: List of Central Warehousing Corporation (CWC) Warehouses in Rajasthan
Table 34: List of CWC warehouses in Rajasthan
Warehouse Project Description Manager Phone Capacity
BHIWADI C/o Jaquar & Company Pvt. Ltd., SP-496, RIICO Inld Area, Bhiwadi – 301019
A. C. Yadav 01493 297825 4356
ALWAR A-315, NSC, Oppt. ED, Paryware Pvt. Ltd. Co. Alwar
R. N. Meena 0144 23721 3574
BARAN Spl. No. 01 ,RIICO Indl Area, Baran Road, Baran
V. K. Jaiswal 9460079493 5000
BHARATPUR
Plot No. G-162 to 165 & F-166 to 171, Brij Ind. Area, Behind Nafed Plant, Phase-II, Hathni Road, Bharatpur
Devendra Prakash
05644-228654 9674
BIKANER Behind Sabzi Mandi, Pugal Road, Unit-I, Bikaner
Prit Pal 0151 2212399 25400
BIKANER-II Opposite Govt. Engineering College, Karni Indutrial Area, Ph.II Bikaner-334004
R. D. Punia 0151 211003 5000
SRIGANGANGR-I Near Power House Sriganganaga-335001
S.S. Brar 0154 2440107 25200
SRIGANGANGR-II Udyog Vihar Plot No. E-194 to202 Sriganganaga-335001
N.K. Chabra 0154 2494403 10000
KESARISINGHPUR C/o ARDC Godown,Mizewali Road,Kesrisinghpur Distt.Srigangar
Dhanwat Singh
01501-233710 10176
HANUMANGARH TOWN
C/o FCI, Opp. Railway Station, Hanumangarh Town
K. D. Dhiman, FCI
13262
HANUMANGARH-I Sector - 8, New Mandi, Hanumangarh Junction, Hanumangarh
J. R. Sharma 01552 260602 21200
HANUMANGARH-II RICCO Phase-II , Opposite RICCO, Water Works, Hanumangarh
Bhart Bhushan
01552 211794 15000
TIBBI 10, GGR, Hanumangarh Road, Tibbi, Distt. Hanumangarh
Anupam Kumar
01539 224111 1000
SITAPURA-I Plot No.SPL-1296,EPIP Sitapura, Ind. Area, Jaipur-302002
S.K. Sharma 0141 2771710 , 2770227
14870
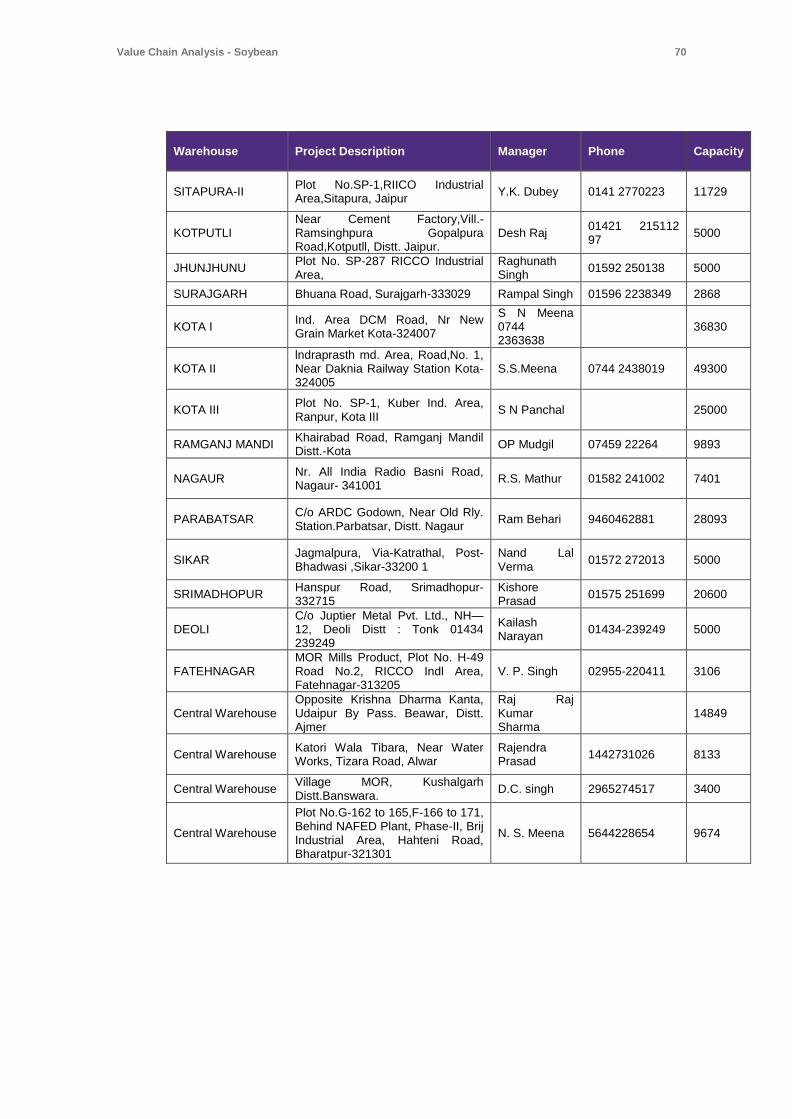
Value Chain Analysis - Soybean 70
Warehouse Project Description Manager Phone Capacity
SITAPURA-II Plot No.SP-1,RIICO Industrial Area,Sitapura, Jaipur
Y.K. Dubey 0141 2770223 11729
KOTPUTLI Near Cement Factory,Vill.-Ramsinghpura Gopalpura Road,Kotputll, Distt. Jaipur.
Desh Raj 01421 215112 97
5000
JHUNJHUNU Plot No. SP-287 RICCO Industrial Area,
Raghunath Singh
01592 250138 5000
SURAJGARH Bhuana Road, Surajgarh-333029 Rampal Singh 01596 2238349 2868
KOTA I Ind. Area DCM Road, Nr New Grain Market Kota-324007
S N Meena 0744 2363638
36830
KOTA II lndraprasth md. Area, Road,No. 1, Near Daknia Railway Station Kota-324005
S.S.Meena 0744 2438019 49300
KOTA III Plot No. SP-1, Kuber Ind. Area, Ranpur, Kota III
S N Panchal 25000
RAMGANJ MANDI Khairabad Road, Ramganj Mandil Distt.-Kota
OP Mudgil 07459 22264 9893
NAGAUR Nr. All India Radio Basni Road, Nagaur- 341001
R.S. Mathur 01582 241002 7401
PARABATSAR C/o ARDC Godown, Near Old Rly. Station.Parbatsar, Distt. Nagaur
Ram Behari 9460462881 28093
SIKAR Jagmalpura, Via-Katrathal, Post-Bhadwasi ,Sikar-33200 1
Nand Lal Verma
01572 272013 5000
SRIMADHOPUR Hanspur Road, Srimadhopur-332715
Kishore Prasad
01575 251699 20600
DEOLI C/o Juptier Metal Pvt. Ltd., NH—12, Deoli Distt : Tonk 01434 239249
Kailash Narayan
01434-239249 5000
FATEHNAGAR MOR Mills Product, Plot No. H-49 Road No.2, RICCO Indl Area, Fatehnagar-313205
V. P. Singh 02955-220411 3106
Central Warehouse Opposite Krishna Dharma Kanta, Udaipur By Pass. Beawar, Distt. Ajmer
Raj Raj Kumar Sharma
14849
Central Warehouse Katori Wala Tibara, Near Water Works, Tizara Road, Alwar
Rajendra Prasad
1442731026 8133
Central Warehouse Village MOR, Kushalgarh Distt.Banswara.
D.C. singh 2965274517 3400
Central Warehouse
Plot No.G-162 to 165,F-166 to 171, Behind NAFED Plant, Phase-II, Brij Industrial Area, Hahteni Road, Bharatpur-321301
N. S. Meena 5644228654 9674

Value Chain Analysis - Soybean 70
Annexure 3: List of State Warehousing Corporation (SWC) Warehouses in Rajasthan
Table 35: List of SWC warehouses in Rajasthan
SWC Warehouses Project Description Capacity
Bhiwadi C/o Jaquar & Company Pvt. Ltd., SP-496, RIICO Inld
Area, Bhiwadi - 301019 4356
Alwar A-315, NSC, Oppt. ED, Paryware Pvt. Ltd. Co. Alwar 3574
Baran Spl. No. 01 ,RIICO Indl Area, Baran Road, Baran 5000
Bharatpur Plot No. G-162 to 165 & F-166 to 171, Brij Ind. Area,
Behind Nafed Plant, Phase-II, Hathni Road, Bharatpur 9674
Bikaner Behind Sabzi Mandi, Pugal Road, Unit-I, Bikaner 25400
Bikaner-Ii Opposite Govt. Engineering College, Karni Indutrial
Area, Ph.II Bikaner-334004 5000
Srigangangr-I Near Power House Sriganganaga-335001 25200
Srigangangr-Ii Udyog Vihar Plot No. E-194 to202 Sriganganaga-335001 10000
Kesarisinghpur C/o ARDC Godown,Mizewali Road,Kesrisinghpur
Distt.Srigangar 10176
Hanumangarh Town C/o FCI, Opp. Railway Station, Hanumangarh Town 13262
Hanumangarh-I Sector - 8, New Mandi, Hanumangarh Junction,
Hanumangarh 21200
Hanumangarh-Ii RICCO Phase-II , Opposite RICCO, Water Works,
Hanumangarh 15000
Tibbi 10, GGR, Hanumangarh Road, Tibbi, Distt.
1000
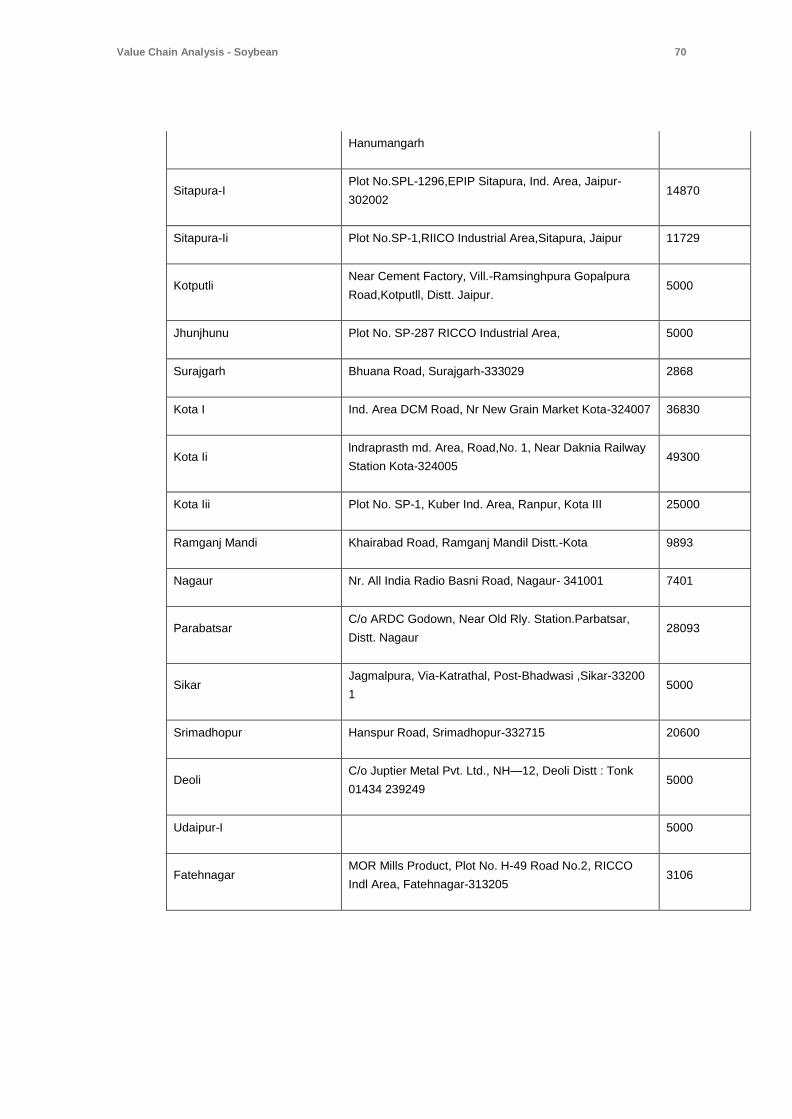
Value Chain Analysis - Soybean 70
Hanumangarh
Sitapura-I Plot No.SPL-1296,EPIP Sitapura, Ind. Area, Jaipur-
302002 14870
Sitapura-Ii Plot No.SP-1,RIICO Industrial Area,Sitapura, Jaipur 11729
Kotputli Near Cement Factory, Vill.-Ramsinghpura Gopalpura
Road,Kotputll, Distt. Jaipur. 5000
Jhunjhunu Plot No. SP-287 RICCO Industrial Area, 5000
Surajgarh Bhuana Road, Surajgarh-333029 2868
Kota I Ind. Area DCM Road, Nr New Grain Market Kota-324007 36830
Kota Ii lndraprasth md. Area, Road,No. 1, Near Daknia Railway
Station Kota-324005 49300
Kota Iii Plot No. SP-1, Kuber Ind. Area, Ranpur, Kota III 25000
Ramganj Mandi Khairabad Road, Ramganj Mandil Distt.-Kota 9893
Nagaur Nr. All India Radio Basni Road, Nagaur- 341001 7401
Parabatsar C/o ARDC Godown, Near Old Rly. Station.Parbatsar,
Distt. Nagaur 28093
Sikar Jagmalpura, Via-Katrathal, Post-Bhadwasi ,Sikar-33200
1 5000
Srimadhopur Hanspur Road, Srimadhopur-332715 20600
Deoli C/o Juptier Metal Pvt. Ltd., NH—12, Deoli Distt : Tonk
01434 239249 5000
Udaipur-I 5000
Fatehnagar MOR Mills Product, Plot No. H-49 Road No.2, RICCO
Indl Area, Fatehnagar-313205 3106

Value Chain Analysis - Soybean 70
Annexure 4: Product wise GST rates of Food Products
GST-28%
1. Molasses
2. Chewing gum/bubble gum and white chocolate
3. Cocoa butter, fat and oil
4. Cocoa powder
5. Cocoa chocolates
6. Malt extract (other than for infant use and mixes and doughs of bakers)
7. Waffles and wafers coated with or containing chocolate
8. Extract, essences and concentrates of coffee
9. Mustard flour and sauces thereof
10. Sugar, lactose and glucose syrups
11. Food flavouring material
12. Churan for pan
13. Custard powder
14. Aerated waters containing added sugar or other sweeting matter
GST-18%
1. Condensed milk
2. Malt, whether or not roasted
3. Refined sugar, sugar cubes
4. Sugar confectionery
5. All preparations of cereals, flour, starch or milk for infant use and sold retail
6. Pasta, spaghetti, macaroni, noodles
7. Corn flakes and other cereal flakes
8. Waffles and wafers (other than chocolate coating)
9. Pastries and cakes
10. Extracts, essences and concentrates of tea or mate

Value Chain Analysis - Soybean 70
11. Soups and broths
12. Ice cream and other edible ice
13. Instant food mixes, soft drink concentrates, sharbat, betel, supari, packaged food
14. Water, including natural or artificial mineral waters and aerated waters not sweetened
15. Ethyl alcohol and other spirits
16. Vinegar and substitutes
17. Curry paste, mayonnaise and salad dressing; mixed condiments and mixed
GST – 12 %
1. All meat in unit containers put up in frozen, salted, dried, smoked state
2. All meat and marine products, prepared or preserved.
3. Butter, ghee, butter oil, cheese
4. All goods under Chapter 20 (preparations of vegetables, fruits, nuts or other parts of plants, including pickle, murabba, chutney, jam, jelly)
5. Ketch-up & sauces, Mustard sauces
6. Dry fruits 2
7. Starches
8. Animal fats and oils
9. Fruit and vegetable juices
10. Roasted chicory and coffee substitutes
11. Yeasts and prepared baking powders
12. Namkeens, bhujiya, mixture, chabena
13. Bari made of pulses including mungodi
14. Soya milk drinks
15. Fruit pulp or fruit juice based drinks
16. Tender coconut water (in unit container with brand name)
17. Beverages containing milk
GST – 5 %
1. All fish variants (except seeds of fish, prawn& shrimp) processed, cured, frozen state
2. Ultra-high temperature milk
3. Milk and cream including skimmed milk powder but excluding condensed milk
4. Yoghurt and other fermented milk and cream
5. Chena or paneer in unit container and branded
6. Egg yolk, fresh or dried
7. Natural honey in branded unit container
8. Vegetables frozen or preserved (but unsuitable in that state for immediate consumption)
9. Edible fruits and nuts; peel of citrus fruit or melons, in frozen or preserved state
10. Coffee, tea, pepper, vanilla, cloves, cardamoms
Value Chain Analysis - Soybean 70
11. Seeds of anise, coriander, cumin
12. Ginger (other than fresh ginger), saffron, turmeric, other spices
13. Cereal groats, meal and pellets in branded unit container
14. Cereal grains worked upon (hulled, rolled, flaked)
15. Meal, powder, flakes, granules and pellets of potatoes
16. Meal and powder of the dried leguminous vegetables (pulses, sago, tamarind)
17. Wheat gluten
18. Soya beans
19. Ground nuts
20. Copra
21. Linseed, rape seeds, sunflower seeds, other oilseeds like mustard, poppy,
22. Flour and meals of oilseeds
23. Sugar beet and sugar cane (frozen and dried)
24. Vegetable fats and oils (groundnut, olive, palm, sunflower oil etc)
25. Beet sugar, cane sugar, khandsari sugar
26. Cocoa beans, shells and paste
27. Mixes and doughs for preparation of bread, pastry and other baker’s wares
28. Pizza bread
29. Seviyan
30. Rusks, toasted bread
31. Sweetmeats
32. Flours, meals, and pellets of meat, fish meant for animal consumption
33. Cashew nuts and cashew nut in shell
34. Raisin 3
35. Ice and snow
GST – Nil %
1. Meat (Other than in frozen state and put up in container)
2. Bones and horn cores, bone grist, bone meal etc., hoof meal, horn meal, etc
3. Fish, prawn and shrimp seeds
4. All fish, fresh or chilled (but not processed, cured and frozen)
5. Fresh milk, pasteurized milk but not concentrated, sweetened
6. Eggs (in shell)
7. Curd, lassi, buttermilk
8. Chena or paneer (except in unit container with brand name)
9. Natural honey (no container-no brand)
10. Fresh fruits and vegetables, roots and tubers (except in frozen state or preserved)
11. Dried fruits
Value Chain Analysis - Soybean 70
12. Leguminous vegetables, shelled or unshelled
13. Dried leguminous vegetables, shelled, whether or not skinned or split (pulses)
14. Coffee beans, unprocessed tea leaves, fresh spices
15. All cereals (no container-no brand)
16. Cereal grains hulled
17. Flour
18. Atta, maida, besan (no container-no brand)
19. Wheat or meslin flour
20. Cereal flour, groats and meals (no container-no brand)
21. Flour of potato, dried leguminous vegetables (no container-no brand)
22. Oilseeds of seed quality
23. Cane jiggery (gur)
24. Palmyra jaggery
25. Puffed, flattened and parched rice
26. Pappad (except when served for consumption)
27. Bread (branded or otherwise) (except when served for consumption and pizza bread)
28. Prasadam
29. Water (other than aerated, sealed etc)
30. Non-alcoholic toddy
31. Tender coconut powder
32. Aquatic, poultry and cattle feed
33. Salt, all types

Value Chain Analysis - Soybean 70
Annexure 5: Detailed PIESTEC Analysis of Soybean
Political circumstance
The small and marginal farmers can hardly be expected to invest in better farming technologies, nor
aggregate adequate volumes of commodities as to develop alternate marketing channels away from
typical APMC or multiple-trader led channel in vogue. There is, therefore, need for aggregation of
such farmers into FPCs / FPCs. Typically, such FPCs may have a combined holding of 1000-1500
acres.
Institutional context
The globally preferred high income yielding form of Soybean is Soybean oil. As per the Agro
Economic research centres in the state, there is an urgent need to increase productivity of soybean
through provision of irrigation, quality seeds and extension regarding correct mix of quality inputs.
Farmers do not know if they are using recommended doses of fertilizers and whether the price
received by them is greater than or lower than the MSP declared for soybean. The former
information is important for the farmers for increasing yield whereas the latter is needed for
maintaining market information. The extension machinery of the state needs to be strengthened.
Economics
There is sound economics in Soybean seed production and processing with appropriate technical
know-how and marketing set up. The gross yield per hectare is 1.44 ton per hectare. The market rate
of the sale is about Rs. 30000 per ton or Rs. 43,200 per hectare. The cost of cultivation is about Rs.
10,045 per hectare. Net realization per hectare is about Rs. 18,087.5 per hectare. Improved
technology of soybean cultivation offered higher yields and profit as compared to farmers practice.
Lack of proper marketing facilities, exploitation by the intermediaries, and lack of information about
market prices are some other constraints. In view of this, dissemination of market information by
state agencies and private agencies assumes great significance in order to help farmers get better
remunerations.
The major constraints faced by the soybean cultivators are the economic constraints. This includes
high input costs, shortage of human labour and price related risks. It is also found that the severity
of the constraints is higher for the marginal farmers. It is therefore felt that the existing government
schemes relating to provision of inputs/ input subsidies should be implemented properly.
Social
Small farmers and fragmented land holdings in soybean cultivation pose an immense challenge
towards generation of economically viable volumes of raw soybean to be traded and negotiated with
the large processors/buyers like ADM, etc. Soybean continues to be the preferred Kharif crop for
farmers due to its high net returns. Small-scale and marginal farmers constitute almost half of the
Value Chain Analysis - Soybean 70
farmers of Maharashtra who depend on soybean as a Kharif crop. An increase in the yield of
soybean could have significant impact on the livelihoods of such small and marginal farmers.
Soybean is grown as a rainfed crop in Kharif Season, as Soybean is a high yielding crop compared to
other crops. Water Requirement of the crop is very less (110 mm). Time duration is very less (3
months and 20 Days). Market rates of soybean are economical.
Technology
Currently, most soybean farmers in the state follow traditional package of practices for the crop
cultivation. It is high time that they are made disseminated modern technologies and advance
cropping practices like integrated crop management. This would not only increase the yield but also
improve the output seed quality.
Environment
Area under soybean crop increased significantly in Rajasthan and in few districts of the state during
the last two decades. The state has achieved an impressive growth in soybean production and it
could be attributed primarily to high growth in area accompanying by moderate growth in yield. The
main soybean producing districts are Kota, Bundi, Jhalawar and Chittorgarh.
Competition
In view of the growing demand for edible oils and growing dependence on imports for satisfying
domestic demand, it is important to sustain and increase production of this crop. The surge in
soymeal demand from India can be attributed to the increased availability, right pricing for export
market and the renewed avenues of export destinations. The additional benefit is the non-GM
soymeal, which is widely accepted across markets and commands better prices, too.
90
© 2016 Grant Thornton India LLP. All rights reserved. References to Grant Thornton are to Grant Thornton International Ltd (Grant Thornton International) or its member firms. Grant Thornton International and the member firms are not a worldwide partnership. Services are delivered independently by the member firms.
Grant Thornton India LLP is registered with limited liability with identity number AAA-7677 and its registered office at
L-41 Connaught Circus, New Delhi, 110001


![UKRAINAN SOYA SECTOR A VALUE CHAIN … › fileadmin › user_upload › Activity › ...UKRAINAN SOYA SECTOR A VALUE CHAIN ANALYSIS [FINAL REPORT] FEBRUARY 2016 201 6 FINAL REPORT](https://static.fdocuments.in/doc/165x107/5f0f94857e708231d444ddd6/ukrainan-soya-sector-a-value-chain-a-fileadmin-a-userupload-a-activity-a.jpg)