Value Chain Analysis for the Coffee Sector in Rwanda · Value Chain Analysis for the Coffee Sector...
93
Value Chain Analysis for the Coffee Sector in Rwanda Report for the CBI – 27 July 2018
Transcript of Value Chain Analysis for the Coffee Sector in Rwanda · Value Chain Analysis for the Coffee Sector...
Value Chain Analysis for the Coffee Sector in Rwanda Report for the CBI – 27 July 2018
Prepared by Page 2
Contents
Glossary .................................................................................................................................................. 4
Introduction .................................................................................................................................................. 6
Executive Summary ....................................................................................................................................... 9
Export Market and Value Chain Competitiveness ..................................................................... 11
1.1 Specialty coffee ............................................................................................................................ 11
1.2 Coffee production in Rwanda ....................................................................................................... 12
1.3 Exports ......................................................................................................................................... 16
1.4 European market demand ............................................................................................................ 19
1.5 Trends .......................................................................................................................................... 27
1.6 European requirements ................................................................................................................ 32
1.7 Comparative and competitive advantage...................................................................................... 33
1.8 Potential for local value addition .................................................................................................. 36
1.9 Conclusion to Element 1 ............................................................................................................... 37
Structure, Governance and Sustainability of the Value Chain ................................................... 39
2.1 The coffee value chain .................................................................................................................. 39
2.2 Coffee farmers ............................................................................................................................. 41
2.3 Primary processing ....................................................................................................................... 43
2.4 Secondary processing & export .................................................................................................... 47
2.5 Roasters ....................................................................................................................................... 48
2.6 Enabling environment .................................................................................................................. 49
2.7 Sustainability of the value chain ................................................................................................... 53
Identification and Analysis of Opportunities and Obstacles ...................................................... 59
3.1 Mapping the value chain opportunities and obstacles .................................................................. 59
3.2 Key opportunities & challenges .................................................................................................... 59
Possible Interventions and Support Activities in the Value Chain .............................................. 63
Conclusions ................................................................................................................................................ 67
References ................................................................................................................................................ 68
Annex I Map of Rwanda ........................................................................................................................ 76
Annex II List of Exporters (2017) ............................................................................................................ 77
Annex III List of Roasters......................................................................................................................... 80
Annex IV Members of CEPAR .................................................................................................................. 80
Annex V Stakeholder Assessment Grid ................................................................................................... 81
Prepared by Page 3
Annex VI List of Coffee Projects .............................................................................................................. 82
Annex VII Washed, Natural and Honey Coffee ......................................................................................... 84
Annex VIII Quality Standards in Rwanda ................................................................................................... 85
Annex IX Competitive & Comparative Advantage Scoring ....................................................................... 86
Annex X Constraints in the Value Chain ................................................................................................. 89
Annex XI SWOT Specialty Coffee Sector Rwanda ..................................................................................... 92
Annex XII Value Chain Baseline Measurement ......................................................................................... 93

Prepared by Page 4
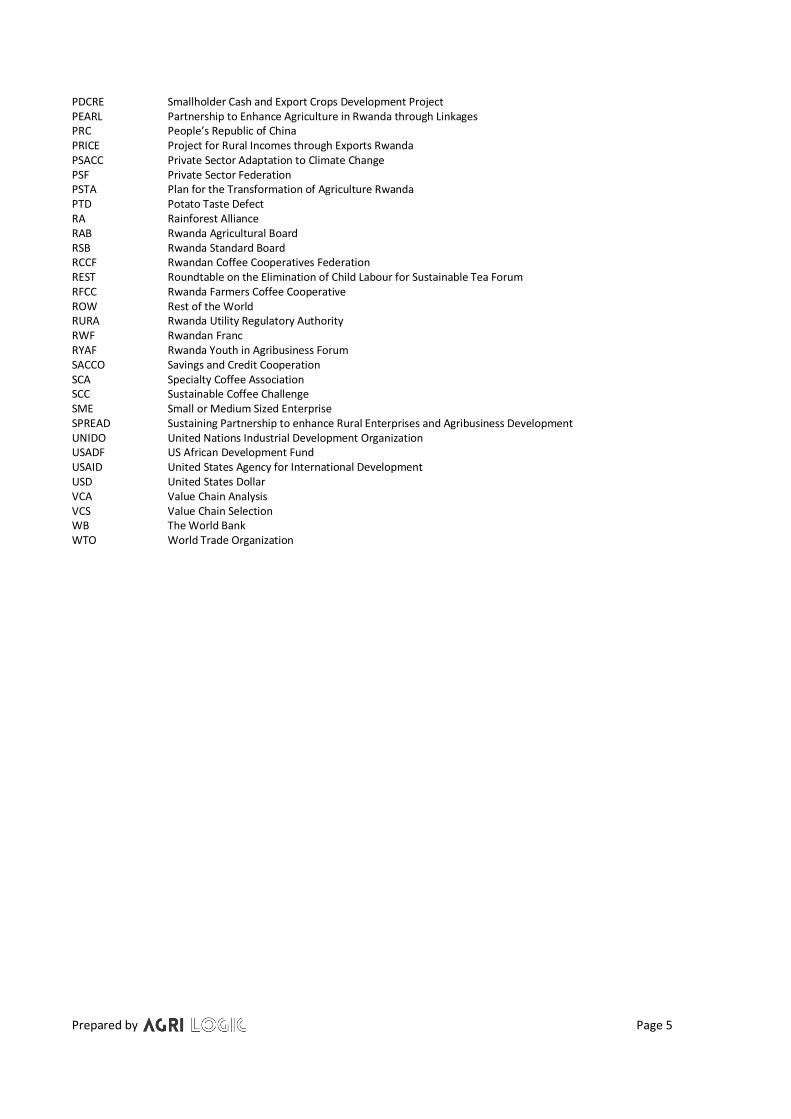
Glossary AFI Alliance for Financial Inclusion AGLC Africa Great Lakes Region Coffee Support Program ARFIC L'Autorité de Régulation de la Filière Café (Coffee Board Burundi) BCI Business Case Idea BRD Rwanda Development Bank BSO Business Support Organisation CAGR Compound Annual Growth Rate CBD Coffee Berry Disease CBI Centre for the Promotion of Imports from developing countries CCAFS CGIAR Research Program on Climate Change, Agriculture and Food Security CEPAR Coffee Exporters and Processors Association of Rwanda CGIAR Consultative Group on International Agricultural Research CHF Swiss Franc CIAT International Centre for Tropical Agriculture CSR Corporate Social Responsibility CWS Coffee Washing Station DFID Department for International Development (UK) DRC Democratic Republic of Congo EDPRS Economic Development and Poverty Reduction Strategy Rwanda ESA European Space Agency EUR Euro (currency) FAO Food and Agricultural Organization of the United Nations FiBL Forschungsinstitut für biologischen Landbau (Research Institute of Organic Agriculture) FOB Free on Board FOT Free on Truck FSC Farmer Support Centre FTA Free Trade Agreement GCP Global Coffee Platform GIS Geographic Information System GiZ Deutsche Gesellschaft für Internationale Zusammenarbeit (German Corporation for International Cooperation) ICO International Coffee Association IFAD International Fund for Agricultural Development IFOAM Organics International IGC International Growth Center IMF International Monetary Fund IT Information Technology ITC International Trade Centre IWCA International Women’s Coffee Alliance JDE Jacob Douwe Egberts JICA Japan International Cooperation Agency KfW German Government-Owned Development Bank KOICA Korea International Cooperation Agency KPI Key Performance Indicator LPI Logistics Performance Index MFI Micro Finance Institution MIFOTRA Ministry of Public Service and Labour MIGEPROF Ministry of Gender and Family Promotion MINAGRI Ministry of Agriculture and Animal Resources MINEACOM Ministry of Trade and East African Community Affairs MINICOM Ministry of Commerce MT Metric Tonne MYICT Ministry of Youth and ICT NAEB National Agricultural Export Development Board NCA National Coffee Association NISR National Institute of Statistics Rwanda NYC National Youth Council OCIBU Office du Café du Burundi OOH Out of Home OYE Opportunities for Youth Employment
Prepared by Page 5
PDCRE Smallholder Cash and Export Crops Development Project PEARL Partnership to Enhance Agriculture in Rwanda through Linkages PRC People’s Republic of China PRICE Project for Rural Incomes through Exports Rwanda PSACC Private Sector Adaptation to Climate Change PSF Private Sector Federation PSTA Plan for the Transformation of Agriculture Rwanda PTD Potato Taste Defect RA Rainforest Alliance RAB Rwanda Agricultural Board RSB Rwanda Standard Board RCCF Rwandan Coffee Cooperatives Federation REST Roundtable on the Elimination of Child Labour for Sustainable Tea Forum RFCC Rwanda Farmers Coffee Cooperative ROW Rest of the World RURA Rwanda Utility Regulatory Authority RWF Rwandan Franc RYAF Rwanda Youth in Agribusiness Forum SACCO Savings and Credit Cooperation SCA Specialty Coffee Association SCC Sustainable Coffee Challenge SME Small or Medium Sized Enterprise SPREAD Sustaining Partnership to enhance Rural Enterprises and Agribusiness Development UNIDO United Nations Industrial Development Organization USADF US African Development Fund USAID United States Agency for International Development USD United States Dollar VCA Value Chain Analysis VCS Value Chain Selection WB The World Bank WTO World Trade Organization

Prepared by Page 6
Introduction
Rationale CBI (Centre for the Promotion of Imports from developing countries) is part of the Netherlands Enterprise
Agency, funded by the Dutch Ministry of Foreign Affairs. The mission of CBI is to connect small and medium-
sized enterprises (SMEs) in developing countries with the European market and so contribute to sustainable
and inclusive economic growth. CBI does this by implementing three to five-year projects in a specific export
value chain (VC) in a specific country, focusing on seizing opportunities for exports to Europe and tackling
obstacles that hamper or hinder these exports. They are integrated projects, meaning they involve both SME
exporters and the enabling environment.
CBI develops and implements projects in several consecutive phases.
1. Value Chain Selection (VCS) phase: based on preliminary research, the most promising value chain in
the target country is selected
2. Business Case Idea (BCI) phase: an initial idea for a project is formulated focusing on the selected value
chain
3. Value Chain Analysis (VCA) phase: an in-depth analysis of the VC is conducted
4. Business Case phase: a detailed business case for a project is developed
5. Implementation and Performance Management phase: the project is implemented and the success of
the project is monitored
6. Audit and Evaluation phase: after completion, the project is audited and evaluated.
The second phase led to the third phase of this Value Chain Analysis, with the specialty coffee sector in Rwanda
being selected for the following reasons:
• The European market for specialty coffee is growing.
• There are opportunities for Rwanda to increase exports of speciality coffee. The average quality and
intrinsic value of the coffee in Rwanda is good, meaning it meets specialty coffee requirements.
• The organisation of the coffee VC in Rwanda is strong, meaning opportunities can be seized and issues
addressed collectively. Some issues related to quality are already being addressed, such as final quality
coffee control through the National Agricultural Export Board and the provision of inputs to farmers.
A new strategy for the coffee sector is being developed.
• Many of the coffee exporters in Rwanda are motivated to grow their business by exporting to Europe.
However, they lack knowledge of and access to the European market. There is also a lack of awareness
on the European market that Rwanda is an interesting source of specialty coffee.
• Other economic development projects in the sector in Rwanda are not connecting coffee companies
to the European market or providing follow-up coaching.

Prepared by Page 7
Objective The objective of this Value Chain Analysis study is to conduct an in-depth analysis in order to provide answers
to the following questions.
• What does the European export market look like? This information is required to both confirm findings
in the earlier phases of project development and to gain a better understanding of the specific markets
and segments a project could focus on.
• What is the composition of the value chain? This should include an analysis of the key actors, chain
supporters and influencers.
• What are the salient corporate social responsibility (CSR) issues?
• What are the main opportunities for export to Europe and which obstacles prevent export?
• What interventions and support activities are needed to seize opportunities and tackle obstacles?
• How and to what extent will these interventions and support activities help seize opportunities and
tackle obstacles?
• Who can take up which interventions and support activities?
• What the risks are for a project and how can these risks be mitigated?
Approach The approach used was a multi-stage one in which six phases were identified.
Phase 1: Developing an action plan which includes a description of the value chain, time frame of the
study, roles and responsibilities and methodologies used.
Phase 2: Conducting desk research based on documentation and research provided by CBI,
documentation already available at Agri-Logic and internet research.
Phase 3: Conducting field research in which key stakeholders in Rwanda are interviewed, as well as
European buyers of Rwandan coffees.
Phase 4: Validating information as final part of the study itself, whereby the collected data and
information is validated with the coffee stakeholders in Rwanda.
Phases 5 & 6: Incorporating feedback from the validation workshop in the report, which can then be
publicised.
Structure The Value Chain Analysis comprises four elements, which is reflected in the chapter titles.
Element 1. Export market and value chain competitiveness
Element 2. Structure, governance and sustainability of the value chain
Element 3. Opportunities and obstacles in the value chain
Element 4. Possible interventions and support activities in the value chain
Limitations Specialty coffee is not well defined, and each market and sometimes even each buyer has a slightly different
definition of what specialty coffee is. Statistics also do not differentiate between the specialty qualities and
the more commercial grades, which makes it difficult to find data on consumption, production and trade for
Rwanda, but also for the European market.
Prepared by Page 8
Data was obtained from different sources, such as Rwanda’s National Agricultural Export Development Board
(NAEB), the International Trade Centre (ITC), International Coffee Organisation (ICO) and the US Department
of Agriculture (USDA). Figures such as volumes and values differed depending on the source, so for the analysis
it was decided to mainly use one source, in order to be able to show trends. Absolute figures therefore might
differ from other existing sources.
Unlike for some of its neighbouring coffee-producing countries, such as Burundi and Uganda, export figures
are hard to come by in Rwanda and are not published by the NAEB. In addition, the sector other than the large
buyers is very fragmented. We have tried to speak with and interview as diverse a group of stakeholders as
possible, to cross-check data found during the secondary data research; however, unintentional bias might
still exist.
Prepared by Page 9
Executive Summary
The mission of CBI (Centre for the Promotion of Imports from developing countries) is to connect small and
medium-sized enterprises (SMEs) in developing countries with the European market and thereby contribute
to sustainable and inclusive economic growth. The goal of this value chain analysis is to serve as input for the
development of a detailed business case for a three to five-year project that focuses on seizing opportunities
for exports to Europe and tackling obstacles that hamper or hinder these exports.
In Element 1, the export market and value chain competitiveness is explored. Almost all of Rwanda’s coffees
are exported, amounting to 18,000 metric tonnes (MT). Rwanda exports its semi-washed coffees mostly to
Switzerland, and the fully washed and higher grades coffees mostly to the US. Other coffees exported from
Rwanda are robusta varieties, roasted coffees, and since recently also natural and honey processed coffees.
Over the years production has slightly decreased, but qualities have gone up considerably: from 30% fully
washed coffees in 2010, to 60% in 2016. However, this was not directly translated into value, because of low
coffee prices and declining volume. Wet processing facilities are considered of good quality, and have shown
an enormous increase in numbers: from two coffee washing stations (CWSs) in 2002 to nearly 300 today. In
addition, since 2012 Rwanda has gone from five trade partners worldwide to over 40, showing the
effectiveness of the investments made over the years in processing capacity and marketing.
The growth of the European coffee market is slower than other markets, although a clear premiumisation
trend can be identified. Certification is important as a way to access the market, reflecting credibility.
However, for the specialty buyer this is less relevant, as quality prevails. Organic might be the exception
though, as there is a clear trend in all markets towards more organically produced and certified products.
According to trade statistics, countries within Europe showing potential growth in the specialty market
segment are the UK, France, the Netherlands, Norway and Poland. This is backed up by the buyers, who
indicate both the Scandinavian countries and eastern Europe to be good growth markets for specialty.
Germany shows potential according to the ITC, but the value per kilogram and value growth is relatively low.
Since Rwanda is a small country, volume is less relevant. Opportunities probably mostly lie in focusing on the
smaller consumer countries exhibiting faster growth, countries that appreciate high-value coffees. Targeting
these markets will help increase market share and improve brand recognition.
If only quality and volume are taken into consideration, Rwanda has little competitive advantage compared to
the other specialty coffee producing countries in East Africa. Its competitive advantage is very much related
to its relatively consistent good qualities, its “storytelling” capacity, its (current) pricing, its CWS infrastructure,
and the ease of traveling and doing business. Rwanda does show high potential though for further quality
improvements, as well as improvements in processing efficiencies.
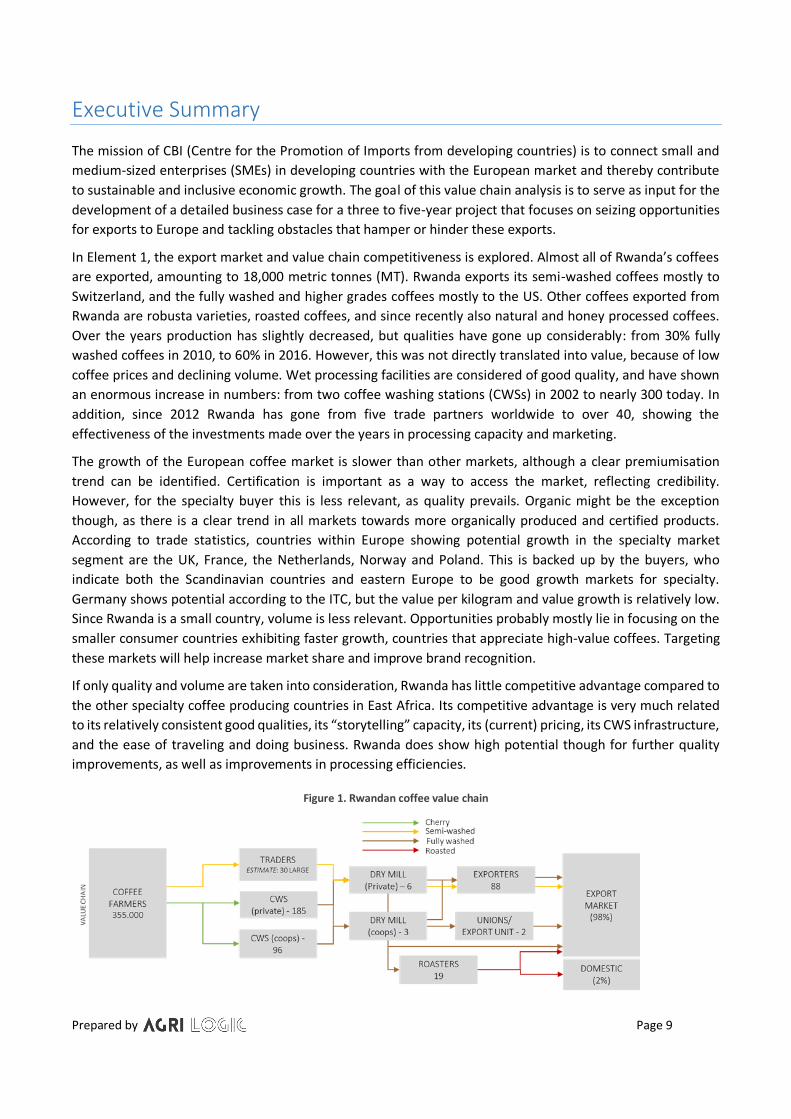
Figure 1. Rwandan coffee value chain

Prepared by Page 10
In Element 2, the structure, governance and sustainability of the value chain was elaborated upon (see also
Figure 1). On the production side, there is an asymmetry to be observed between the fragmented small coffee
washing stations (CWSs) and the other larger processors and exporters. Rwanda’s coffee industry is dominated
by a few medium to large traders and exporters, such as RTC, IMPEXCOR, Dormans and RWACOF. Many of
them are related to the larger international trading houses. Together they control 64% of the theoretical
capacity, but they are thought to be responsible for at least 85% of the exported volume. Their vertical
integration into the value chain has reduced the bargaining power of suppliers and considerably increased
competition for the raw material (cherries). The smaller processors and exporters are seen struggling in such
an environment.
There are different challenges at each level of the supply chain. On the farmer side they relate to low
productivity, which has multiple causes, such as low soil fertility and increased pest and disease pressure, and
which is also due to changing weather patterns. Farmers are tempted to invest in other subsidised crops that
fetch higher prices in the market, including horticultural crops and irrigated crops, such as maize and rice.
Due to the highly competitive environment, the scarcity and quality of raw material, the lack of business skills
and the very small size of the operations, smaller CWSs have a weak position in the market. They have difficulty
obtaining finance and accessing the services and knowledge required to be able to successfully compete.
Although operating costs will always be relatively high for Rwanda, given that it is a landlocked country with
limited resources, there are many improvements that can be made in terms of efficiency. Both at the CWS
itself, by applying better cost control systems, as well as more sector-wide, by improving the coordination
between the smaller processors and exporters.
With regard to sustainability, climate change interventions are still very small-scale, though it is a serious
threat to the sector and is already being felt by many of the growers. There seems to be limited focus on youth
employment. Opportunities here lie especially in improving the skills of labourers, increasing employment as
business service providers to the sector and potentially also as promotors of Rwandan coffee domestically, as
well as in the tourism industry as baristas and/or guides.
Labour risks can be identified at CWS level, including occupational health & safety hazards for workers and
unfair terms of employment. This is because labourers work in the informal sector and are therefore not
protected by law. Interventions should support CWSs to obtain certification, such as Rainforest Alliance/UTZ
or Fairtrade, as these apply strict labour standards which are audited regularly.
Rwanda’s enabling environment provides a lot of opportunities. It is structured, there is a supportive
government and it is easily accessible, so many possible synergies can be created. It has a relatively high level
of internet and mobile phone penetration, supporting communication and helping to monitor business
performance. Intervention activities for the specialty value chain should, as this analysis concludes, focus on
improved coordination between the smaller processors and exporters, improved access to finance, and
improved processing efficiencies, in order to achieve better qualities, better business relationships and
increased competitiveness. Improving quality and volume at farmer level also greatly depends on policy
developments. In the meantime, farmers and labourers should be supported to further contribute to a thriving
specialty sector in the country of a thousand hills.
As there are many major coffee projects ongoing and planned for the near future, we advise CBI to first and
foremost link up with the most important stakeholders involved, to align activities and find the synergies
needed to bring the SMEs in the sector to a higher level.

Prepared by Page 11
Export Market and Value Chain Competitiveness
1.1 Specialty coffee
Specialty coffee refers to the entire process, from farmer to cup, and includes the roasting, packaging, grind
and brew. Although the term specialty does not have a strict definition, a high cupping score is a common
characteristic of specialty coffee.
Specialty, as defined by the Specialty Coffee Association (SCA) Q grading, comprises coffees with a cupping
scores of over 80. Specialty coffee can be further classified as “Very Good”, “Excellent” or “Outstanding”
(Figure 2). However, markets and even individual buyers have shown that they differ in their perception of
what specialty coffee entails. Generally speaking, in the US and Asia we see that a cupping score over 85 is
required to qualify as specialty coffee. For Europe, when talking to buyers, this seems to be over 80.
Figure 2. Varying definitions of specialty coffee based on cupping scores
Source: SCA
Total production of specialty coffee is estimated at 14% of the total coffee volume including the premium,
mostly sold under a brand (see Table 1).
Table 1. Global coffee volume in % per market segment
SPECIALTY 85+ 0%
3%
1%
4%
SPECIALTY (80–85) 1%
7%
2%
10%
Mainstream 5%
45%
15%
65%
Low quality 2%
15%
4%
21%
Private label
Brand owners
Out of home
TOTAL
Source: ITC in TWIN&TMEA, 2018

Prepared by Page 12
1.2 Coffee production in Rwanda
1.2.1 General
Rwanda is a low-income country with a population of 12.5 million (2018) and GDP of USD 8.4 billion. Goods
and services account for respectively 50.8% and 49.2% of exports. During the last five years the exports of
Rwanda have increased at an annualised rate of 9.7%, from USD 554 million in 2011 to USD 869 million in
2016. The most recent exports are led by gold, which represents 20.5% of total Rwandan exports, followed by
tea, which accounts for 13.3%. Coffee represents about 7% of total export value, and 20% of the total
agricultural export value from Rwanda (OEC, 2016).
The total coffee production for Rwanda ranges between 15,000 MT and 22,000 MT and has been relatively
stable, but is slightly on the decline (ICO, 2017; NAEB, 2017). The volume represents about 0.2% of the global
coffee production. Of this volume about 98% is arabica, mainly of the “Bourbon” variety, and the rest is
robusta, according to the National Agricultural Export Development Board (NAEB). The NAEB data show that
the coffee is grown on 37,500 hectares by about 355,000 coffee farmers. Coffee represents about 2% of the
total agricultural production area in Rwanda (OEC, 2016). The average farm size in Rwanda is 0.08 hectares
(GCP, 2016; NAEB, 2017). Productivity is 450 kg/ha, or about 2–3 kg per tree, and consistent with the average
for Sub-Saharan Africa (GCP, 2016). The harvesting season is between April and July, with coffee arriving in
Europe between August and November.
Figure 3. Production vs exports of green coffee Figure 4. Arabica productivity from Rwanda and global exports 2000–2017
The number of coffee washing stations (CWSs) has shown impressive growth over the last decade, due to the
efforts by the government and its partners to improve the quality of Rwanda’s coffees. From only two in 2002,
there are now 282 CWSs operational in the country. Of these 282, some 186 (66%) are privately owned. More
information on the CWSs can be found in the next chapters.
Although production volumes over time have fluctuated, over the last five years total production seems to
have stabilised and has even shown a small increase. According to the experts interviewed, this is mainly due
to the impact of recent large-scale coffee projects, which will further be elaborated on in Element 2.
Source: GCP, 2016 Source: NAEB, ICO

Prepared by Page 13
1.2.2 Coffee quality
Coffees in Rwanda can be classified into semi-washed, or “Ordinary Coffee”, and fully washed. The semi-
washed is processed at home and generally traded via middlemen and not via coffee washing stations. As can
be seen from Figure 3, the percentage of fully washed coffees over the total production has increased from
35% in 2011/12 to about 60% of production for the 2016/17 season. Fully washed represents about 75% of
the earnings from coffee. The NAEB estimates 75% is premium and specialty grades.
The Rwandan government discourages semi-washed coffee, in order to control quality and make Rwanda’s
coffee more competitive on the world market, which means that the Rwanda Development Bank (BRD) does
not finance semi-processed coffee purchases. However, the Ordinary Coffees are still an important market
outlet for the farmers in Rwanda, representing about 24% of the volume and 17% of the value (Figure 3).
The main reason for semi-washed coffee still being produced is that farmers find that they often cannot rely
on their CWS due to issues such as bankruptcy (caused by overenthusiastic investors, ignorant of how the
sector works) or just due to the generally poor CWS management (Twin & TMEA, 2018). Earlier research by
the International Growth Centre (IGC) based on 2011–2012 data also finds similar constraints, while also
mentioning lack of contract enforcement mechanisms, which includes tracking purchases, sales and
inventories, and the limited access to working capital (Macchiavello & Morjaria, 2015).
A notable issue is that broken beans (triage) have not significantly decreased. This is thought to be mainly due
to the low quality of the cherries delivered to CWSs. However, inefficient processing and poor quality control
at the wet mills could also cause this. Beans that are too dry, for example, break easily.
Natural & honey processed coffees
Innovations in coffee processing in Rwanda are the natural processed coffees and honey processed coffees
which have been exported in small quantities over the last years. Natural processing means that the coffee is
dried and no layers are removed. With the honey process, skin and pulp are removed, but some or all of the
mucilage (honey) remains (see Annex VII for more explanation on the processing). The NAEB has only officially
included it in its statistics in 2017, when it indicated an export of 130 MT of “Naturals” and a little under 50 MT
of “Honey”.
According to their website, the first Rwandan honey and natural processed coffees which were officially
recognised by the NAEB came from Muraho Trading Company, from the coffee washing stations Kilimbi and
Rugali. Through sister company Rwanda Trading Company (RTC), Falcon Coffee have also experimented with
natural and honey processed coffees at the Gatare, Nyungwe, Muhura and Gishyita CWSs. Others include Buf
Coffee with coffee washing station Umurage and Twongerekawa Coko in the Gakenke district (honey
processed). Exports from Rwanda of natural processed coffees have increased exponentially over the last few
years according to experts, though figures from previous seasons have not been made available.

Prepared by Page 14
Figure 5. Coffee qualities as percentage of total coffee production in Rwanda
Source: NAEB Annual Reports
Table 2. Value in USD/kg of green coffee
USD/kg 2010/11 2011/12 2012/13 2013/14 2014/15 2015/16 2016/17
Fully Washed 6.13 3.72 3.98 3.45 4.31 4.01 4.42
Semi-Washed 4.79 3.04 2.63 2.54 2.64 2.54 2.59
Broken beans 1.77 1.06 1.07 1.20 1.80 1.54 1.77
Robusta 1.80 1.49 1.74 1.14 0.89 1.28 2.31
Source: NAEB
Certification
Although not a quality in itself, certification has often been considered a quality spec by the market, and
premium levels are generally lower than of the mainstream certified coffees, which are UTZ/Rainforest
Alliance and Fairtrade certified. Since 2014 a large share of the Rwandan coffee production has been certified
or verified (e.g. 4C and CAFE practices). Currently production in Rwanda of UTZ is 1,372 MT (UTZ/RA), while
for Fairtrade this is 3,340 MT (of which 60% organic certified). The two already represent 30% of production.
According to FiBL statistics (2016), the total area under organic coffee production is 203 ha, which is less than
1% of the total area on which coffee is produced. Other certifications are C.A.F.E. Practices initiated by
Starbucks, Nespresso’s AAA Sustainable Quality Program and 4C Compliant Coffee.
The share of certified coffees is expected to continue to rise, especially organic certified due to the growing
demand for organic, further elaborated upon in the section “Trends”.
1.2.3 Developments
National policy
In order to gauge future developments, it is necessary to view the sector’s political context. The overall
development framework of the Government of Rwanda is set out in the Economic Development and Poverty
Reduction Strategy (EDPRS), stemming from the country’s Vision 2020. The agricultural component of the
EDPRS is operationalised in Strategic Plans for the Transformation of Agriculture (PSTA), developed and
implemented by the Ministry of Agriculture and Animal Resources (MINAGRI).
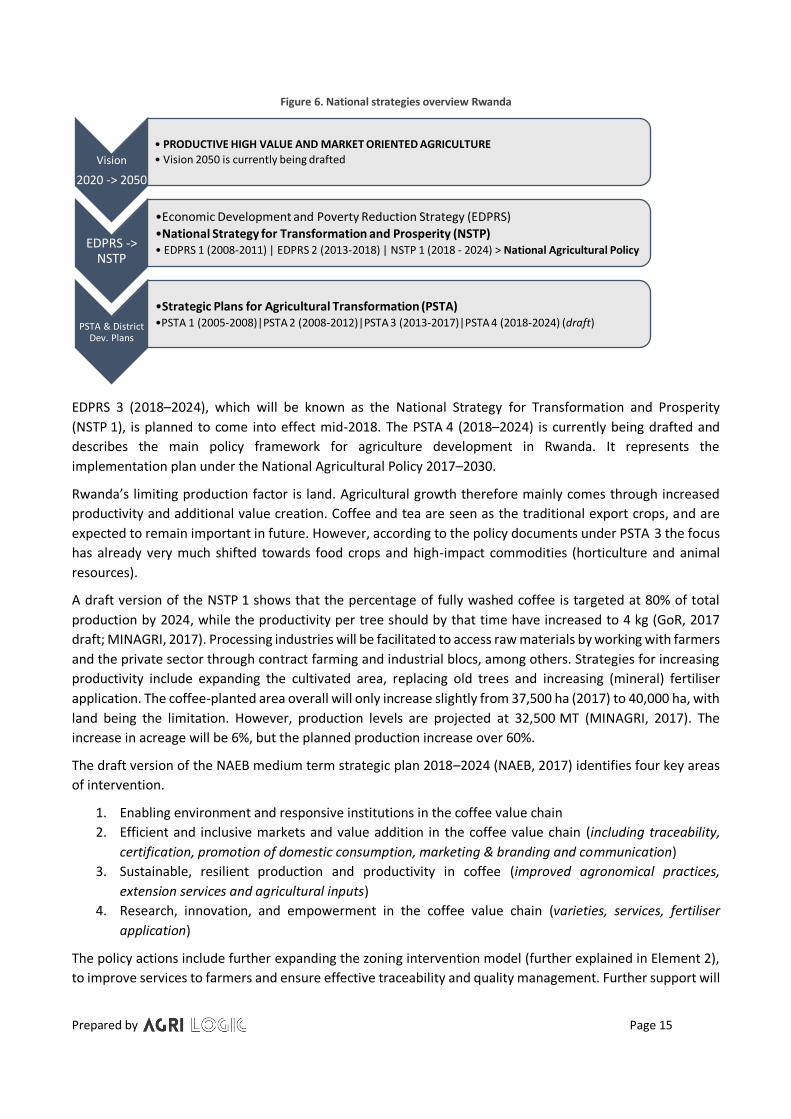
The below figure depicts the relationship between the strategies, which go from long to short term.
0%
20%
40%
60%
80%
100%
2010/2011 2011/12 2012/13 2013/14 2014/15 2015/16 2016/17
Fully Washed Semi-Washed Broken beans Robusta Honey Roasted Natural
Prepared by Page 15
Figure 6. National strategies overview Rwanda
EDPRS 3 (2018–2024), which will be known as the National Strategy for Transformation and Prosperity
(NSTP 1), is planned to come into effect mid-2018. The PSTA 4 (2018–2024) is currently being drafted and
describes the main policy framework for agriculture development in Rwanda. It represents the
implementation plan under the National Agricultural Policy 2017–2030.
Rwanda’s limiting production factor is land. Agricultural growth therefore mainly comes through increased
productivity and additional value creation. Coffee and tea are seen as the traditional export crops, and are
expected to remain important in future. However, according to the policy documents under PSTA 3 the focus
has already very much shifted towards food crops and high-impact commodities (horticulture and animal
resources).
A draft version of the NSTP 1 shows that the percentage of fully washed coffee is targeted at 80% of total
production by 2024, while the productivity per tree should by that time have increased to 4 kg (GoR, 2017
draft; MINAGRI, 2017). Processing industries will be facilitated to access raw materials by working with farmers
and the private sector through contract farming and industrial blocs, among others. Strategies for increasing
productivity include expanding the cultivated area, replacing old trees and increasing (mineral) fertiliser
application. The coffee-planted area overall will only increase slightly from 37,500 ha (2017) to 40,000 ha, with
land being the limitation. However, production levels are projected at 32,500 MT (MINAGRI, 2017). The
increase in acreage will be 6%, but the planned production increase over 60%.
The draft version of the NAEB medium term strategic plan 2018–2024 (NAEB, 2017) identifies four key areas
of intervention.
1. Enabling environment and responsive institutions in the coffee value chain
2. Efficient and inclusive markets and value addition in the coffee value chain (including traceability,
certification, promotion of domestic consumption, marketing & branding and communication)
3. Sustainable, resilient production and productivity in coffee (improved agronomical practices,
extension services and agricultural inputs)
4. Research, innovation, and empowerment in the coffee value chain (varieties, services, fertiliser
application)
The policy actions include further expanding the zoning intervention model (further explained in Element 2),
to improve services to farmers and ensure effective traceability and quality management. Further support will
Vision
2020 -> 2050
• PRODUCTIVE HIGH VALUE AND MARKET ORIENTED AGRICULTURE
• Vision 2050 is currently being drafted
EDPRS -> NSTP
•Economic Development and Poverty Reduction Strategy (EDPRS)
•National Strategy for Transformation and Prosperity (NSTP) • EDPRS 1 (2008-2011) | EDPRS 2 (2013-2018) | NSTP 1 (2018 - 2024) > National Agricultural Policy
PSTA & District Dev. Plans
•Strategic Plans for Agricultural Transformation (PSTA)•PSTA 1 (2005-2008)|PSTA 2 (2008-2012)|PSTA 3 (2013-2017)|PSTA 4 (2018-2024) (draft)

Prepared by Page 16
include a conducive regulatory and legal framework, developing infrastructure and increasing the
competitiveness of the Rwandan coffees through certification (i.e. organic, Rainforest Alliance, Fairtrade), as
well as the promotion of specialty, traceability and local coffee consumption as forms of value addition.
Even though coffee is still mentioned in all major agricultural policy documents, it does seem to have lost its
priority status to other crops, such as maize, beans, rice, wheat and cassava (Clay & Bizoza, 2018).
International Organisation
There is much interest from the international organisations, both private and public, in investing in coffees
from Africa. In Annex VI, an overview is included of the publicly known projects that are currently being
implemented in coffee. The private initiatives by specialty buyers, such as those of This Side Up, Union hand-
Roasted Coffee, Taylors of Harrogate, GEPA, etc., are not addressed here. This, however, is not something only
taking place in recent years.
How these projects and policies will influence productivity and quality remains to be seen, and will depend on
how the enabling environment will develop itself, how well Rwanda will be able to control the quality defects
and how efficiently it can run its coffee production units compared to East African neighbours in order to keep
its competitive advantage.
1.3 Exports
While the Asian regions were able to obtain significant growth rates in exports, the African exports suffered a
significant decrease (−18%) due to an average 50% reduction in coffee production in most African countries
(although Ugandan exports increased by 14% and Ethiopian exports stand out with a strong growth of 134%).
Rwanda showed a decline of −27% in 1992–1996 and 2012–2016 (ICO, 2018). There is no single reason that
can be put forward for this: it seems to be a combination of many different factors that have a negative
influence (i.e. old trees, production practices, policies, climate change, prices).
Figure 7. Growth of coffee exports by country in 1992–1996 and 2012–2016 in %
Source: ICO, 2018

Prepared by Page 17
In Rwanda in 2017 there were 88 registered
exporters (Annex II). The largest importer of
Rwandan coffee is Switzerland, with an average
over the last three years of almost 40% of total
export value (NAEB, 2015; NAEB, 2016; NAEB,
2017; ITC, 2017). Almost all of the semi-washed
and low grades go to Europe, estimated at more
than 80%. This is mostly done through Sucafina
and Supremo. An estimated one third of the fully
washed goes to Europe.
After Switzerland, the US is the major importer
of Rwandan coffee in terms of volume. Growth
in this market, both in tons and export revenue
is due in large part to the successful
implementation of the USAID coffee projects,
such as PEARL I and II 1 (2000–2006) and
SPREAD2 (2006–2011), as well as the support of
STABEX 3 (2004–2008), a previous EU
programme supporting the modernisation of Rwanda’s coffee and tea sectors.
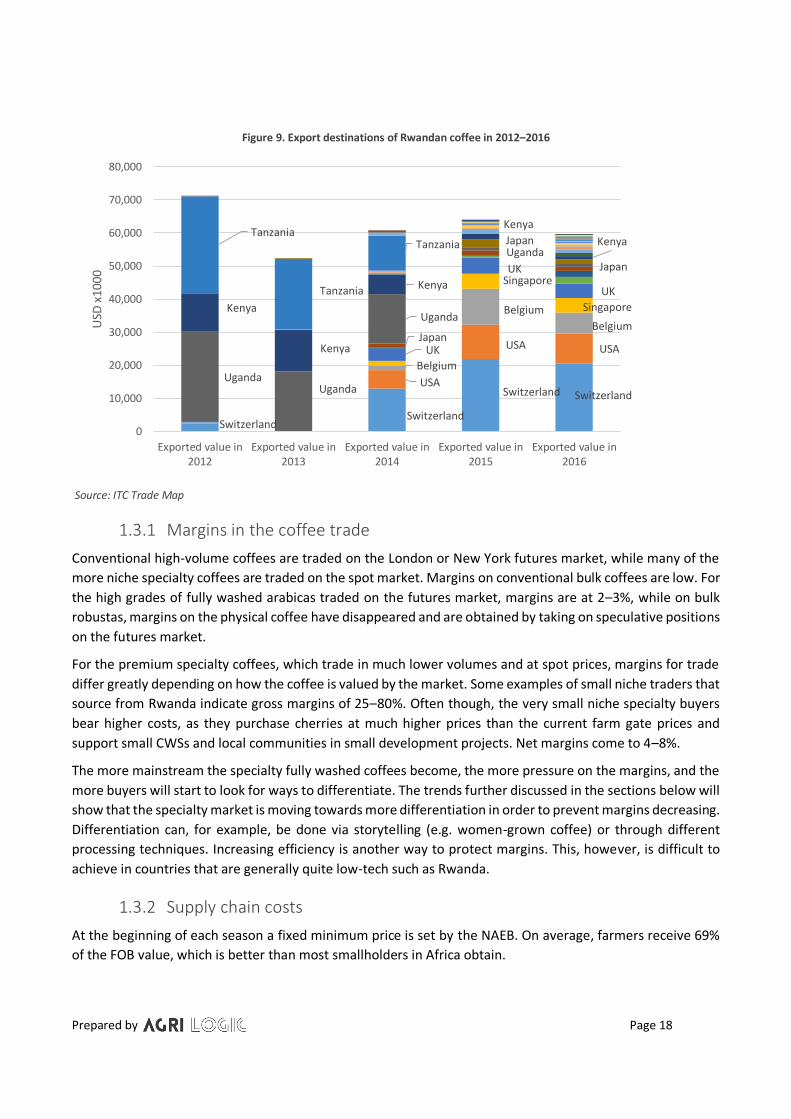
Since 2012, Rwanda went from five trade partners to over 40 (Figure 9). It shows the effectiveness of the
investments made in the CWSs and the marketing efforts leading to more specialty outlets. However, overall
volumes and values have decreased over the years.
Besides Switzerland and the US, Belgium and UK have also been consistent export partners for Rwandan
coffee, representing about 10–15% of the value. The largest volumes going to Europe are of the semi-washed
qualities. The specialty market for Rwanda is mainly the US and Asia is growing.
Figure 8. Exported value of Rwandan coffee in 2016 to EU & EFTA
Source ITC: Trade Map
1 PEARL: Partnership to Enhance Agriculture in Rwanda through Linkages 2 SPREAD: Sustaining Partnership to enhance Rural Enterprises and Agribusiness Development 3 STABEX: Stabilisation of Exports fund
0
5000
10000
15000
20000
25000
USD
x10
00Box 1 PEARL and SPREAD
Both PEARL and the SPREAD projects were designed to develop
high-value markets with the potential to increase the incomes of
farmers and others in the coffee value chain. PEARL focused on
rapidly improving quality, processing and management
standards in Rwanda’s coffee industry. This was done by training
(young) Rwandans in cupping and quality control and supporting
farmers to improve coffee growing and processing techniques.
Most importantly, PEARL built new washing stations and formed
farmer-owned cooperatives, giving farmers more control of their
product and a further economic stake in the quality of their
coffee. The projects also introduced the Cup of Excellence in
2008. Rwanda was the first country in Africa to hold the
prestigious “Cup of Excellence”, one of the world’s top
international speciality coffee competitions.
SPREAD was a continuation of PEARL. Both projects overall were
seen as very successful and have opened up the markets to the
US specialty market.
Prepared by Page 18
Figure 9. Export destinations of Rwandan coffee in 2012–2016
Source: ITC Trade Map
1.3.1 Margins in the coffee trade
Conventional high-volume coffees are traded on the London or New York futures market, while many of the
more niche specialty coffees are traded on the spot market. Margins on conventional bulk coffees are low. For
the high grades of fully washed arabicas traded on the futures market, margins are at 2–3%, while on bulk
robustas, margins on the physical coffee have disappeared and are obtained by taking on speculative positions
on the futures market.
For the premium specialty coffees, which trade in much lower volumes and at spot prices, margins for trade
differ greatly depending on how the coffee is valued by the market. Some examples of small niche traders that
source from Rwanda indicate gross margins of 25–80%. Often though, the very small niche specialty buyers
bear higher costs, as they purchase cherries at much higher prices than the current farm gate prices and
support small CWSs and local communities in small development projects. Net margins come to 4–8%.
The more mainstream the specialty fully washed coffees become, the more pressure on the margins, and the
more buyers will start to look for ways to differentiate. The trends further discussed in the sections below will
show that the specialty market is moving towards more differentiation in order to prevent margins decreasing.
Differentiation can, for example, be done via storytelling (e.g. women-grown coffee) or through different
processing techniques. Increasing efficiency is another way to protect margins. This, however, is difficult to
achieve in countries that are generally quite low-tech such as Rwanda.
1.3.2 Supply chain costs
At the beginning of each season a fixed minimum price is set by the NAEB. On average, farmers receive 69%
of the FOB value, which is better than most smallholders in Africa obtain.
SwitzerlandSwitzerland
Switzerland SwitzerlandUSA
USA USA
Belgium
Belgium
Belgium
Singapore
Singapore
UK
UK
UK
Japan
Japan
Japan
UgandaUganda
Uganda
Uganda
Kenya
Kenya
Kenya
Kenya
KenyaTanzania
Tanzania
Tanzania
0
10,000
20,000
30,000
40,000
50,000
60,000
70,000
80,000
Exported value in2012
Exported value in2013
Exported value in2014
Exported value in2015
Exported value in2016
USD
x10
00
Prepared by Page 19
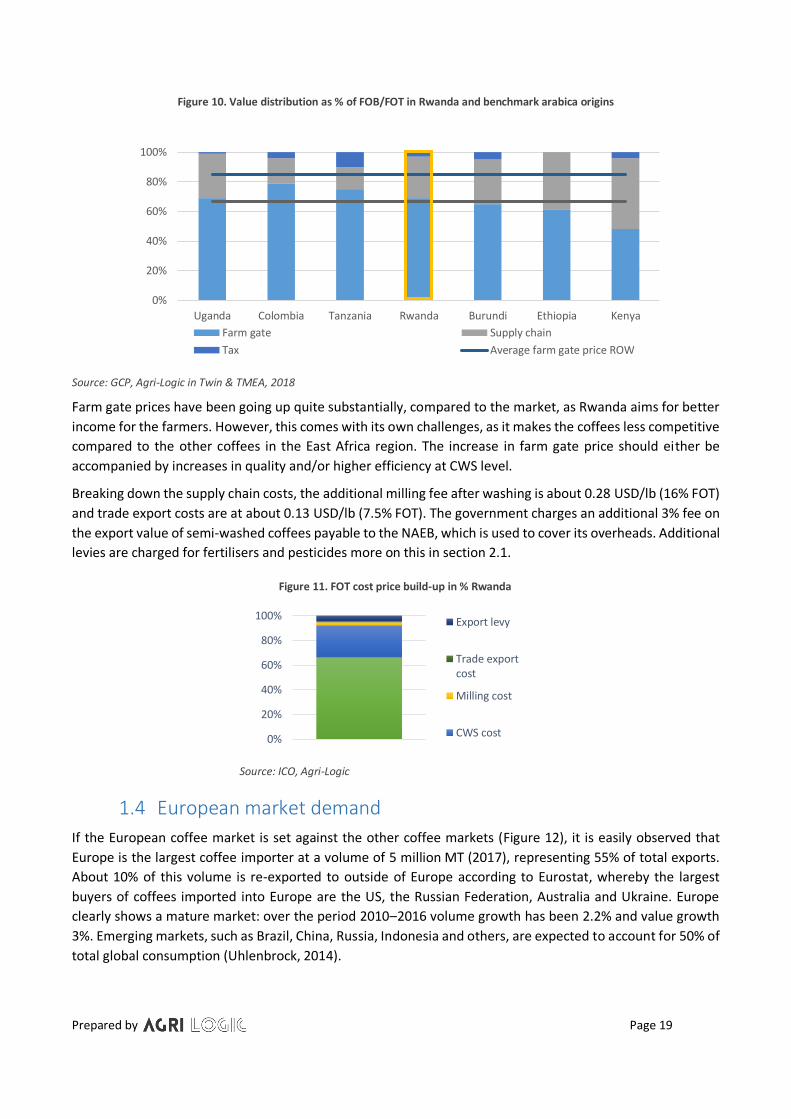
Figure 10. Value distribution as % of FOB/FOT in Rwanda and benchmark arabica origins
Source: GCP, Agri-Logic in Twin & TMEA, 2018
Farm gate prices have been going up quite substantially, compared to the market, as Rwanda aims for better
income for the farmers. However, this comes with its own challenges, as it makes the coffees less competitive
compared to the other coffees in the East Africa region. The increase in farm gate price should either be
accompanied by increases in quality and/or higher efficiency at CWS level.
Breaking down the supply chain costs, the additional milling fee after washing is about 0.28 USD/lb (16% FOT)
and trade export costs are at about 0.13 USD/lb (7.5% FOT). The government charges an additional 3% fee on
the export value of semi-washed coffees payable to the NAEB, which is used to cover its overheads. Additional
levies are charged for fertilisers and pesticides more on this in section 2.1.
Figure 11. FOT cost price build-up in % Rwanda
Source: ICO, Agri-Logic
1.4 European market demand
If the European coffee market is set against the other coffee markets (Figure 12), it is easily observed that
Europe is the largest coffee importer at a volume of 5 million MT (2017), representing 55% of total exports.
About 10% of this volume is re-exported to outside of Europe according to Eurostat, whereby the largest
buyers of coffees imported into Europe are the US, the Russian Federation, Australia and Ukraine. Europe
clearly shows a mature market: over the period 2010–2016 volume growth has been 2.2% and value growth
3%. Emerging markets, such as Brazil, China, Russia, Indonesia and others, are expected to account for 50% of
total global consumption (Uhlenbrock, 2014).
0%
20%
40%
60%
80%
100%
Uganda Colombia Tanzania Rwanda Burundi Ethiopia Kenya
Farm gate Supply chain
Tax Average farm gate price ROW
0%
20%
40%
60%
80%
100%Export levy
Trade exportcost
Milling cost
CWS cost

Prepared by Page 20
Figure 12. Value, value growth CAGR 2010–2017 and volume (bubble size)
Source: ITC Trade Map
The majority of European consumers still purchase cheaper mainstream coffee, usually in the form of standard
blends. Recent research suggests that most European consumers still cannot distinguish between low and high
quality coffees (Giacalone, et al., 2016). This indicates that there is lack of consumer awareness and education
regarding speciality coffee (CBI, 2018).
The below figures depict the value of the imports of coffee, its growth, as well as the volumes in the largest
European coffee countries. Average overall value growth per ton in Europe was 6% between 2016 and 2017
(ITC, 2017), while volumes decreased by 4%, indicating a premiumisation of the coffee. In Figure 15 this is
further detailed. Coffee value per tonne has increased in most countries over the last year. This trend is
expected to continue and is something that Rwanda could tap into.
Figure 13. Growth in value between 2016 and 2017 for the fifteen largest coffee countries in Europe
Source: ITC Trade Map, 2017
Africa
Asia & OceaniaEurope
North America
Latin America Middle East
-
1.00
2.00
3.00
4.00
5.00
6.00
7.00
8.00
0.0% 1.0% 2.0% 3.0% 4.0% 5.0% 6.0% 7.0% 8.0% 9.0% 10.0%11.0%12.0%
Val
ue
USD
/kg
% CAGR (2010–2017)
Africa Asia & Oceania Europe North America South America Middle East
- 1,000 2,000 3,000 4,000 5,000 6,000 7,000 8,000 9,000
USD
/To
nn
e
Unit value (USD/Ton) 2016 Unit value (USD/unit) 2017

Prepared by Page 21
Figure 14. Volumes imported in MT for the fifteen largest coffee countries in Europe
Source: ITC Trade Map, 2017
Figure 15. Volume and value growth CAGR 2010–2017
Source: ITC Trade Map
0
200,000
400,000
600,000
800,000
1,000,000
1,200,000
-6.0% -4.0% -2.0% 0.0% 2.0% 4.0% 6.0% 8.0% 10.0% 12.0% 14.0%
Germany
Italy
France
Belgium
Spain
Netherlands
United Kingdom
Russian Federation
Switzerland
Poland
Sweden
Finland
Austria
Portugal
Romania
Czech Republic
Norway
Denmark
Europe Aggregation
Value growth (CAGR 2010-2017) Volume growth (CAGR 2010-2017)
Prepared by Page 22
Figure 16. Appetite for coffee in Europe
Source: Euromonitor in Bloomberg Quint, 2017
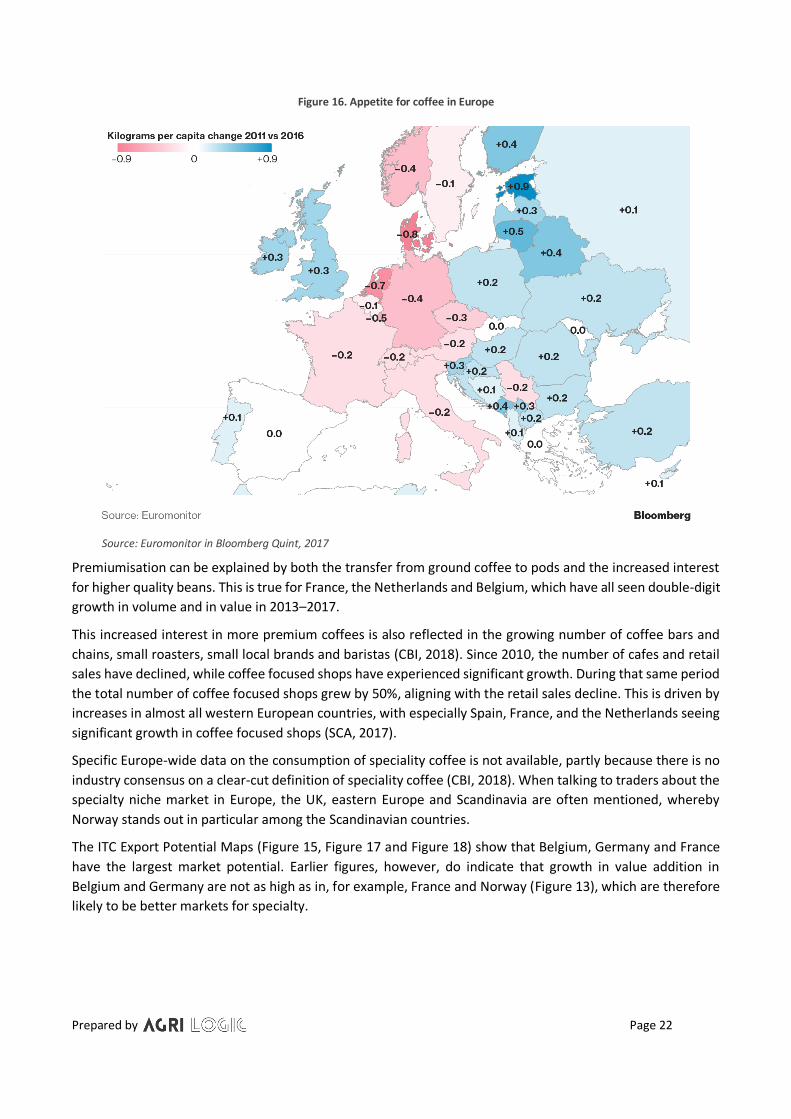
Premiumisation can be explained by both the transfer from ground coffee to pods and the increased interest
for higher quality beans. This is true for France, the Netherlands and Belgium, which have all seen double-digit
growth in volume and in value in 2013–2017.
This increased interest in more premium coffees is also reflected in the growing number of coffee bars and
chains, small roasters, small local brands and baristas (CBI, 2018). Since 2010, the number of cafes and retail
sales have declined, while coffee focused shops have experienced significant growth. During that same period
the total number of coffee focused shops grew by 50%, aligning with the retail sales decline. This is driven by
increases in almost all western European countries, with especially Spain, France, and the Netherlands seeing
significant growth in coffee focused shops (SCA, 2017).
Specific Europe-wide data on the consumption of speciality coffee is not available, partly because there is no
industry consensus on a clear-cut definition of speciality coffee (CBI, 2018). When talking to traders about the
specialty niche market in Europe, the UK, eastern Europe and Scandinavia are often mentioned, whereby
Norway stands out in particular among the Scandinavian countries.
The ITC Export Potential Maps (Figure 15, Figure 17 and Figure 18) show that Belgium, Germany and France
have the largest market potential. Earlier figures, however, do indicate that growth in value addition in
Belgium and Germany are not as high as in, for example, France and Norway (Figure 13), which are therefore
likely to be better markets for specialty.

Prepared by Page 23
Figure 17. Potential (or standard) export value based on supply, demand and market access conditions
Source: ITC Export Potential Map
Figure 18. Ease of Trade Ranking Line width shows ease of trade with the market independent of size or complementarity in trade structure
Source: ITC Export Potential Map
Certification
European consumers are increasingly concerned about the social and ecological impact of their consumption,
which is impacting the demand for certified goods (CBI, 2018). All voluntary sustainability standards have been
able to grow their volumes of certified and verified coffee at farm level worldwide, although only 20% of this
is also procured and sold as certified (Panhuysen & Pierrot, 2018). There are a few reasons for this: one is that

Prepared by Page 24
coffee yields different qualities, and only the premium qualities are sold as certified. Secondly, there is more
supply than demand of coffee. The figure below shows the production versus sales for UTZ certified coffees
from Rwanda. With regard to Fairtrade we know that for 2016, of the coffees produced Fairtrade in Rwanda,
67% was sold.
Figure 19. Production & sales of UTZ certified green coffee in Rwanda
Note that we were not able to obtain figures on the Rainforest Alliance or organic sales from Rwanda, only on production and acreage under certification Source: UTZ
Certification has become a market requirement of several buyers and retailers, especially for the medium and
large coffee companies. Drivers for the smaller coffee roasters and the speciality segment are quality,
combined with storytelling (CBI, 2018).
Generally speaking, the certification standards, such as Rainforest Alliance, UTZ and Fairtrade, have little direct
additional value for growers, when only taking the premium into account. On the other hand, it does provide
the grower with an access to another market and a higher skills set.
Organic certification is valued higher by the market than other certification, and there is a clear trend towards
more organic certified products. This is reflected by the sales statistics (Figure 20), but also has been confirmed
by the buyers. Potential constraints on the organic production side are that it is a long-term investment, it can
reduce coffee yield by up to 20% when mineral fertilisers are used, and it can deplete soils if no adequate soil
care measures are put in place. It therefore requires high investment and skill levels.
39
0
50
0
10
00
12
72
13
72
0 0 0
19
0 29
5
66
5
2 0 1 2 2 0 1 3 2 0 1 4 2 0 1 5 2 0 1 6 2 0 1 7
UTZ Production (est.) UTZ First Buyer Sales

Prepared by Page 25
Figure 20. Growth in organic food & drinks sales and farmland 2001–2016
Source: ECOVIA Intelligence 2018 in The World of Organic Agriculture – Statistics & Emerging Trends (FiBL & IFOAM, 2018)
1.4.1 Image that buyers have of Rwandan specialty coffee
We spoke to about twenty experienced European buyers, both micro-roasters and specialty green bean
traders, including those associated with large traders. All had slightly different opinions and perceptions of
Rwandan coffees. Below a summary of the points that were put forward.
Buying coffee from Rwanda was said to be very much about its origin and the story that goes with it:
relationship coffee. The coffee is produced in a country that is politically stable and easily accessible for buyers,
making it thus also easy to closely collaborate with the CWSs.
Furthermore, the wet processing infrastructure is good, allowing coffee of relatively consistent good quality
and traceability to be produced. On pricing, the coffees are still competitive, although developments in the
country have been such that prices have been increasing while quality has not necessarily increased. This
concern was mentioned by quite a few buyers.
Something else which stood out: most of the buyers mentioned that the flavour of Rwandan coffee beans is
not that unique compared to other higher qualities coming, for example, from Tanzania (Kilimanjaro), Burundi
and Ethiopia. The question put to buyers about Rwanda’s comparative and competitive advantage, in
comparison to other countries in East Africa, was one which they found difficult to answer. The Burundian
coffees, for example, score higher on flavour uniqueness, mainly due to the higher altitudes, while DRC coffees
tend to have a better character and Tanzanians offer more flexibility.
According to the buyers, Rwandan coffee as a specialty and single origin is still somewhat unknown, and
demand is low in Europe. This is also one of the reasons that it is mostly used in blends in Europe. However,
the buyers operating in the niche section of the specialty market indicated that demand is picking up, as
differentials compared to, for example, Kenyan coffees are so much more favourable, and there is of course
exceptionally good quality coffee from Rwanda.
The “potato taste defect”
The “potato taste defect”, or PTD, is considered the major constraint for buyers of Rwandan coffees. It
prevents roasters and green bean traders from buying Rwandan coffee, including specialty coffees. Coffees
from the African Great Lakes region are prone to it, but especially Rwanda and Burundi are infamous for it.
PTD makes the coffee taste and smell like raw potatoes. It only takes a single afflicted bean to spoil the brew.
Prepared by Page 26
The risk of infection, though rare, is difficult to trace and is a reason why some of the roasters are still quite
wary of purchasing Rwandan coffees. PTD is thought to be caused by specific bacteria that infect the cherry
through the holes drilled through the skin by the antestia bug (Antestiopsis), causing the raw potato taste.
Different studies including those conducted by the Rwandan Agriculture Board (RAB) show that by controlling
antestia, PTD can be reduced (Gerard & Bigirimana, 2018). There are a few ways to treat the problem which
help reduce the risk, such as pruning, removing the green beans attacked by the antestia bug, target spraying
(which can be organic), application of strict post-harvest sorting protocols and floating the coffee cherries.
This requires sensitisation and training of the farmers.
The buyers interviewed for this study do admit that the defect is much less common than it used to be and
some see the risk similar to that of corked wine, whereby the high quality of the coffees generally justify the
rare risk of the defect. On the other hand, it does still make some European buyers completely avoid Rwandan
coffees.
1.4.2 Developments in specialty coffees
Within the market for specialty coffee there are three developments that stand out: signature blends, single
origin and micro-lots (CBI, 2018).
Signature blends: These are carefully selected coffees from various origins which achieve unique taste
palettes. They cater for specific consumer tastes and communicate balance and quality. Union Roasted, for
example, have a signature espresso blend called “Revelation”, which is a blend of coffees from Guatemala,
Costa Rica, Rwanda and Sumatra (Union, 2018). According to the buyers in Europe, Rwandan coffees are
mostly used in blends, including signature blends. The market still views Rwandan coffee as exotic, and
together with the high acidity of the African coffees in general, is most likely the reason why it ends up in
blends. It is also a coffee that is quite easily replaceable by other coffees, when there are supply or quality
issues (e.g. PTD). In the US, where due to the large scale marketing efforts the coffee is much more widely
known, more single origin coffees from Rwanda can be found.
Single origin: The origins of coffee are receiving increasing attention from the industry and consumers. Single
origin is associated with high quality and uniqueness connected to a certain region or country. Rwandan single
origin is (as stated previously) still quite rare in Europe. Examples of Rwandan single origin coffees are: Rwanda
Lake Kivu, from Taylors of Harrogate; Starbucks’ Rwanda Umushanana; and Rwanda Red Bourbon from Beans
Coffee.
Micro-lots: A micro-lot refers to beans that can be traced back to their original source – be it a specific farm,
field or harvest – and tend to be the pick of a particular crop. Supply is often limited, as yields can vary from
year to year, and even the smallest of climatic variations can affect their delicate flavours. Buyers often enter
into a relationship with a grower in order to ensure that certain processes are adhered to. There has been an
increase in sales of micro-lot coffees. The Nordic Approach, a green bean importer to Norway, has quite a few
micro-lots from Rwanda, such as Gitantu Remera Lot# RW-2017-27, from crop year 2017, with a cupping score
of 86.
Besides the aforementioned differentiations, there are also ones made by traders, using names such as
“Prestige” or “Terroir”, like green bean trader Belco does. It is important to market the coffees right, so that
the buyer for whom it is intended knows what to expect and ask for.
Prepared by Page 27
1.5 Trends
1.5.1 Social
Third Wave
A well-known and often cited trend in the coffee markets is referred to as the Third Wave. The Third Wave is
characterised by an increasing coffee quality, more direct trade, a greater emphasis on sustainability (people,
planet, profit), transparency and innovative brew methods – these are all intrinsic to Third Wave coffee
(Perfect Daily Grind, 2017). Consumers can trace the heritage of their favourite coffee to the very farm from
which it was harvested. The soil, altitude and method of processing become important decision factors in
purchases. The consumers are not necessarily drinking more coffee, but are ready to pay more for a more
sustainable coffee and value the story behind it.
Part of the Third Wave is also to increase transparency of the chain. Direct trade is a term used by coffee
roasters who buy directly from the growers, cutting out the traditional middlemen. Sometimes exporters
and/or importers are still used to facilitate the process.
The relationship between the roaster and the grower generally has two goals: expanding the supply of quality
beans and improving the livelihoods of the growers and their communities. Direct trade has also encouraged
the development of micro-lots and serves as a good marketing tool. By promoting relationships with farmers
and by telling the stories of the coffees they sell, valued is added to the products. Since Rwanda is also very
accessible, there are many roasters and green bean traders that build up these direct chains. Examples include
This Side Up (TSU) and Union Roasted, but there are many others in Rwanda that are building these
relationships. Technological developments, such as blockchain, support this trend.
All “natural”
There is a trend in the food sector towards “raw” and “natural”. In coffee this translates to natural and honey
processed coffees, as well as organic. The first two are related to processing techniques, with the result often
referred to as Washed, Natural and Honey Coffee. See Annex VII for more information on the processing
techniques.
Natural processing
Rwanda has been exporting natural processed coffees in recent years. In natural or dry processing, the cherry
is sun-dried to separate seeds (“bean”) from the pulp. The processing method is very old, but was always seen
as a lesser processing method when compared to washed processes, which are thought to yield a cleaner and
more balanced profile, with fewer defects (PerfectDailyGrind, 2017). In contrast, natural processed coffee can
offer a sweet, smooth cup, with a heavy body; there is clearly an increased popularity and demand for these
kind of coffees in the market. The largest competitor in East Africa is Ethiopia, which does quite large volumes
of natural processed coffees. A problem for Rwanda is the limited amount of space available for drying, so
drying beds are a constraint.
Honey processing
Like natural processed coffees, honey processed coffees also were exported from Rwanda last season. There
are three types of honey processed coffee – White, Yellow and Red & Black – depending on the percentage of
mucilage left on the bean, which in turn depends on the amount of light and drying time the beans are exposed
to (PerfectDailyGrind, 2017). Producers of these kinds of coffees are mainly from Brazil, where it was first
pioneered, and countries such as Costa Rica and El Salvador.

Prepared by Page 28
Organic (certified)
Demand for organic has been on the rise for all types of food and beverages. Organic retail in the EU was
EUR 30.7 billion, second after the US. In the entire European market, the highest shares of organic are found
in Denmark, Luxembourg, Sweden and Austria. Switzerland, Denmark and Sweden have the highest per capita
consumption worldwide. The rise in demand for organic has also been acknowledged by the buyers (Figure
20).
Feminism
In 2017, Time magazine’s Person of the Year were the “Silent Breakers” related to the #MeToo movement.
The movement started after the sexual assault allegations against US film producer Harvey Weinstein, and has
spread globally, including to the European countries. The term “feminism” was “Word of the Year” according
to the online dictionary Merriam-Webster, as searches went up by 70%. Also in April 2017, the UK government
introduced new gender pay gap (GPG) transparency regulations, which received a lot of media attention.
For Rwanda, which actually scored fourth place in the Global Gender Gap Index of 2017, after Iceland, Norway
and Finland (World Economic Forum, 2017), opportunities related to this trend lie in promoting women-grown
coffees to the market.
1.5.2 Technological
Today, virtual reality (VR), augmented reality (AR), artificial intelligence (AI) and blockchain are redefining IT
and business, as well as society in general.
Blockchain
In the specialty coffee industry, maintaining traceability and integrity is an important part of the value of the
coffee in order for customers to make informed purchases that match their values and preferences. Therefore,
there are many initiatives that are working on creating that transparent and fair chain, whereby blockchain
seems to be the answer. Moyee Coffee, Starbucks, Progreso, Bext360, Coffeecoin, IBM, Microsoft, Infosys,
SourceMap and many more are working on tying crypto to coffee. Blockchain is particularly valuable in low-
trust environments where participants cannot trade directly or lack an intermediary. Blockchain’s core
advantages are decentralisation, cryptographic security, transparency, and immutability. It allows information
to be verified and value to be exchanged without having to rely on a third-party authority
(McKinsey&Company, 2018). The initial benefits for agriculture is especially cost reduction as it will drive
operational efficiencies. The decentralisation aspect of blockchain could potentially be in conflict with the
centralised way the coffee sector is managed in Rwanda.
Blockchain is still very much in its infancy, and with recent incidences in the crypto currency market, trust in
the system has been hurt. Small-scale pilots and experimentation with blockchain and other technological
developments, also in Rwanda, will improve the learning curve and make any larger-scale interventions at a
later stage easier.
Examples of a pilot already in place is that of Starbucks, which announced March of this year that it will pilot
“bean-to-cup” traceability with new technology (incl. blockchain) in collaboration with coffee farmers from
Costa Rica, Colombia and Rwanda. Mobile phone technology will be at its core. From their press release:
“Starbucks hopes to develop and demonstrate over the next two years how technology and innovative data
platforms can give coffee farmers even more financial independence and confidence. Conservation
International will measure the impact of traceability to understand the benefits farmers will receive from this
technology. True to their open-source philosophy, Starbucks plans to share this system and what it learns
openly.” (Starbucks, 2018)

Prepared by Page 29
Another ongoing initiative is that of Progreso. Through Beyond Coffee (BEYCO), they have been
professionalising access to markets by providing a global coffee connection platform to connect producer
organisations with buyers, facilitating trade; more on this can be found here. In addition, IOHK (builder of
Cardano blockchain) recently signed an MoU with the Ethiopian government to pilot blockchain technology in
the coffee sector. This will allow all participants in the supply chain to trace and track coffee as it makes its
way from rural farms to wholesale buyers. Bext360 has partnered with Great Lakes Coffee, a Uganda-based
coffee exporter, and Coda Coffee, a Denver-based coffee roaster, to launch a pilot programme using the
bextmachine to trace coffee from Uganda to Denver, Colorado in the US.
Big-data collection on crop and farm performance
Nano-satellites and other farm monitoring tools
Nano-satellites can provide information on crop yields and test interventions. If combined with weather, soil
and other big data, it could be used to create crop disease and weather alerts, for example, allowing crop
monitoring and forecasting, crop insurance and certification. Quite a few organisations, such as WaterWatch,
are already experimenting with this, often in collaboration with the European Space Agency (ESA). A concern
though, with nano-satellites, has been the “space-waste” created.
Farm monitoring has also become increasingly important, in order to prove impact, as certification has been
failing in that respect. Organisations like GeoTraceability, SourceMap, Farmline, SMS (ECOM), OFIS (Olam) and
Agri-Logic with its Farmer Field Book have seized this opportunity.
Mobile phone penetration
The penetration of mobile phones and internet is expected continue to increase. Subscribers numbers are
expected to rise globally from 66% in 2017 to 71% in 2022 (GSMA, 2018), and internet penetration from 43%
in 2017 to 63% in 2022. Rwanda already has 75.5% subscriber penetration in Rwanda (RURA, 2018). This comes
with many opportunities such as access to finance, farm data collection and analysis (apps). Rwanda is already
experiencing rapid growth in the use of ICT-related products, while more than 40% of the population is
currently connected to internet (RURA, 2018), creating a real opportunity.
1.5.3 Ecological
It is estimated that the areas suitable for coffee cultivation will decrease substantially by 2020 due to climate
change. Several coffee varieties are also endangered, raising concerns of roasters, importers and other
industry players. Climate change can affect the global coffee production due to prolonged droughts, rising
temperatures, biodiversity loss and heavy rains (CBI, 2018).
Therefore, the focus of the coffee sector as a whole is to make the farmers more resilient to climate change
and diversify farm risk. The Sustainable Coffee Challenge’s commitments portal confirms this, and shows that
climate, forest protection and technical assistance have surpassed certification as the main focus.
Standards that are actively working on this are Rainforest Alliance and Smithsonian Bird Friendly (the latter
provides certification for the more niche markets). For Rwanda specifically more information climate related
issues in the following chapter.
What should also be considered (which might fall more under political developments) is the strong
commitment of the EU efforts to tackle climate change, which is reflected in its trade policies. More
information on labelling is required regarding a product’s environmental footprint, action is being taken on
false “green” claims, and circular economy criteria are now being used in public procurement. This could
potentially create more barriers to imports from outside the EU. For Rwanda this means that should also move

Prepared by Page 30
in this direction with regard to their exports, as it is not only the European markets making these new
demands.
1.5.4 Economic
Economic growth
The coffee market is moving towards a larger premium and specialty segment, and will likely grow with the
European economies. According to professional services firm PwC, the economic outlook for Europe (2018–
2022) is positive, although growth is expected to slow down. In 2018 and 2019, the growth of the economies
is set to continue and remain solid, with growth of 2.3% and 2.0% respectively in both the euro area and EU
in general (ec.Europa.eu). The Netherlands, Austria and Germany are expected to outperform their EU peers.
Consumer spending is expected to grow (PwC).
Rwanda’s long-term development goals are defined in “Vision 2020”. The second Economic Development and
Poverty Reduction Strategy (EDPRS 2) aims to: raise Gross Domestic Product (GDP) per capita to USD 1000;
reduce the percentage of the population living below the poverty line to less than 30%; and reduce the
percentage of the population living in extreme poverty to less than 9% (World Bank). Rwanda is one of the
faster growing economies in Central Africa. Rwanda’s economy grew 6.1% over 2017 but is expected to grow
further in 2018 to 7.2% according to the IMF. The projected growth will be largely driven by the services sector,
with tourism and conferences being expected to act as major drivers. The government is keen on developing
value addition in the agriculture sector to maintain the sector’s contribution to sustainable economic growth
(New Times, 2018). Further developing the specialty coffee sector is part of this strategy to encourage more
sustainable economic growth.
Part of the strategy of the Rwandan government is to also promote local consumption. Bourbon Coffee and
Question Coffee, with coffee shops in Kigali, are an example of this. In addition, there are already 18 roasters
in the country, roasting coffee mainly for local consumption. Coffee is quite expensive, in comparison to
alternatives. It is not considered a staple like in Ethiopia, where more than half of the local production is
domestically consumed. Generally speaking, coffee is perceived as a luxury product, which means that coffee
consumption will depend on rising incomes. Consequently, when incomes increase, so too does the demand
for coffee.
Consolidation of the coffee market
While the destination of trade flows is becoming more diversified, the coffee industry is undergoing a process
of consolidation (ICO, 2018). After years of unrivalled market leadership, Nestlé’s global dominance of the
coffee market is being challenged by JAB Holding Co., a German investment firm owned by the Reimann
billionaire family. The Top 10 roasters have a 35% share of the coffee market (Coffee Barometer, 2018). Since
2015 there have been nine coffee deals made by JAB Holding Co. In third position after Nestlé and JAB Holding
is likely to be Lavazza. Lavazza has been buying multiple brands in the EU and North America, including
premium French coffee brand Carte Noire, making France its second largest market after Italy. Recently,
Lavazza also branched out to North America, taking a majority stake in Kicking Horse, a Canadian company
specialised in Fairtrade and organic certified coffee (Coffee Barometer, 2018).
The majority stake in Kicking Horse shows that, besides the consolidation trend, there is also a trend towards
capturing market share through portfolio premiumisation. Starbucks has retailed high-end coffees under its
Starbucks Reserve Brand since 2015. Nestlé acquired specialty coffee roaster Blue Bottle Coffee in 2017. The
trend appears similar to what has been happening in the beer industry, where Heineken and AB-InBev have
started acquiring craft breweries to protect and grow their market share.

Prepared by Page 31
In Rwanda, consolidation is also occurring, for example the acquisition of Schluter by Olam. What this trend
appears to mean for Rwanda is that in the future it will likely have to deal with larger buyers. Buyer power
would then increase and the negotiating power of the Rwandan suppliers decrease.
1.5.5 Political
Coffee is one of the world’s most traded commodities. It is an important source of foreign revenue for many
of the producing countries, and is a strong part of the culture of many of the EU countries. Therefore it has a
high profile and many activities are related to the sector, such as the Global Coffee Platform (GCP) and the
Sustainable Coffee Challenge (SCC). The SCC was set up in 2017, with actors from governments, NGOs,
industry, trade and research coming together for joint action towards making coffee sustainable. It is an
attempt to approach sustainability in a more holistic and impactful way. Rwanda and Mexico were the first
countries to join this challenge. Rwanda’s commitments include efforts to increase the production and yield
per coffee tree, improve soil fertility, strengthen farmer organisations, and improve traceability in the value
chain.
Recently, in May 2018, Arsenal signed a three-year sponsorship deal with Rwanda, as part of a broader
Rwandan strategy to double its income from tourism by 2024. Though in itself not directly related to the coffee
sector, it has created quite some political debate in countries that invest aid money in Rwanda. Among these
countries is the Netherlands, where the issue was heavily debated in politics. However, the Dutch government
did underline the importance of Rwanda marketing its tourism, and has shown support for Rwanda’s efforts
to become economically self-sufficient. There is increased support for economic development projects,
however. The political climate in Europe is such that there appears to be a clear anti-aid sentiment growing
among the population, which could affect future European development investments in Rwanda, also in the
coffee sector.
Trade
The UK will formally leave the EU in March 2019. The process towards this is bringing many uncertainties to
market. About 40% of the coffee imports to the UK are via mainland Europe, of which 64% comes from France,
Germany and Italy (OEC, 2016). What effect this will have on trade and specifically trade from Rwanda is
uncertain, as the future trade agreements are still unclear.
On macro-economic level, global trade continues to accelerate both in volumes and complexity, with the
World Trade Organization’s (WTO) most recent trade forecast revised to show improved growth in world
merchandise trade volume. At the same time the complexity of conducting global trade and complying
effectively to the growing regulatory and licensing requirements has increased, due to political unrest,
numerous trade agreement revisions and additions, rising protectionist measures, the e-commerce explosion,
and the sheer growth in types and numbers of products imported and exported around the world on a daily
basis (GlobalTrade, 2017). Europe has, however, been showing willingness to open the market, with numerous
new free trade agreements (FTA) that were enacted by the EU over the last two years.
Increased protectionism could lead to increased tariffs on roasted coffees, in order to maintain the added
value in Europe. The push from consumers towards more ethical and environmentally and/or animal friendly
traded products is also influencing politics. Stricter rules on food safety, transparency and traceability for
imported foods and beverages are likely to make it more difficult to import into the EU. This could drive a
trend towards more regional East African coffee trade, and/or towards more trade with Asia, given its fast
growing (specialty) coffee market.

Prepared by Page 32
Towards collaboration
Although the coffee sector is very fragmented, things have been changing. The larger players in the coffee
sector have been collaborating more constructively on cross-cutting issues related to the sector. Examples
include the Global Coffee Platform (GCP) and the SCC, often with support from governments, research and
NGOs. This indicates that slowly but surely a joint vision is being created by the sector stakeholders of what a
sustainable future for the sector should look like.
1.6 European requirements
In Rwanda the European requirements (i.e. food safety, labelling and packaging) for export are generally well
known to the exporters, and there does not seem to be much of a compliance constraint for the green bean
export. The cooperative CWSs generally export through MISOZI or RWASHOSCCO, which were put in place to
facilitate exports. The size of the CWSs, their access to working capital and their management capacity and
ability to market themselves seem to be much larger bottlenecks and shall be further detailed upon, in the
chapter entitled Element 2.
The export requirements that premium specialty buyers must adhere to are proving to be more of a challenge.
Many of the premium specialty coffees are traded in micro-lots, that is, lots specifically selected for uniqueness
in character and flavour, which are separated from the rest of the harvest because of their exceptional quality.
This is quality that did not exist a year prior and which will not necessarily exist the following year
(PerfectDailyGrind, 2017). So it is important that the pre-shipment samples sent to the buyers are from the
exact same lots that are being shipped. Any difference in flavour profile and cupping score and the lot is
“worthless” to the buyer. There is a high level of professionalism associated with this.
1.6.1 Tariffs
Tariffs are generally lower for raw and unprocessed products than for finished products. The EU charges a
tariff of 7.5% on roasted coffee. Below is an overview of tariffs charged on green coffee (excl. roasted and
decaffeinated) and roasted coffee (excl. decaffeinated) for a number of countries.
Table 3. Tariffs on green and roasted coffee from selected countries and regions
Country/Region* EU PRC NO AU CH RK USA
Coffee (excl. roasted and decaffeinated) 090111
0% 8% 0% 0% 0% 2% 0%
Roasted coffee (excl. decaffeinated) 090121
7.5% 15% 0% 0% CHF 63 per
100 kg brut
8% 0%
* European Union (EU), China (PRC), Norway (NO), Australia (AU), Switzerland (CH), Republic of Korea (RK) and the United States of America (USA). Source: WTO Tariff data

Prepared by Page 33
1.7 Comparative and competitive advantage
1.7.1 Rwanda’s comparative and competitive advantage
On a more macro level, it can be said that, with the exception of Burundi, the other East African countries have
a stronger competitive position than Rwanda in terms of volumes and flexibility in supply, and they do not
carry the high risk of PTD. Pricing of Rwandan coffees has been relatively competitive for the region, but with
the fixed farm gate prices going up, relative to the market, and efficiencies not improving further up the value
chain, this competitive edge is also thought to be diminishing. However, this is much more relevant for the
mainstream, more commercial specialties, where pricing is very much linked to the futures market.
So what does make Rwandan coffees interesting to buyers (as mentioned earlier) is that it is a country which
is safe and can easily be travelled to, unlike some of the other coffee countries in the region. Rwanda is well
organised, politically stable (currently not the case for Tanzania or Burundi), there is a decent infrastructure,
and the washed coffees from the CWSs are of good quality. There are also still many smallholder coffee
farmers, who are not able to obtain a living income from coffee. Improving the relationships and adding value
in this way is an important opportunity for the sector and its growers in Rwanda.
1.7.2 Scoring
To analyse Rwanda’s competitive advantage, we compared its performance in the sector and more generally
in trade against Colombia, Ethiopia, Uganda and Tanzania. The following criteria were used to score the
countries against each other (see also Annex IX).
• Macro-Economic Performance: GDP, level of foreign direct investment, unemployment and ease of
doing business
• Production Capacity: volumes produced, productivity, productive area, average farm size
• Exports: volume of arabica coffee exported, value of coffee exported, ease of trade across borders
• Certification: Rainforest Alliance, UTZ, Fairtrade and organic certification levels
• Coffee Value: farm gate prices % FOB, differential trade
• Youth & Women: labour force participation women and youth, youth unemployment, ranking women,
peace and security index
The results were as follows.
Table 4 Scoring against six indicators of Rwanda, Burundi, Kenya, Ethiopia, Tanzania, Uganda and Colombia
Weight Rwanda Burundi Kenya Ethiopia Tanzania Uganda Colombia
Macro-Economic 17% 2.87 2.33 2.82 2.95 2.78 2.46 3.52
Production 17% 1.51 1.05 1.44 2.91 1.40 2.14 5.00
Exports 17% 2.47 2.70 2.44 2.87 1.29 3.21 3.99
Certification 17% 1.72 1.75 1.55 3.28 1.53 2.00 3.26
Prices 17% 4.03 3.65 1.50 2.75 3.81 3.88 4.00 Youth & Women 17% 4.74 3.18 1.41 3.85 4.51 3.20 2.35
TOTAL Score 2.89 2.44 1.86 3.10 2.55 2.82 3.69
Colombia clearly scored highest overall. In the figure on the next page, the data from Table 4 are represented
graphically for Rwanda, Uganda, Tanzania, Ethiopia and Colombia.

Prepared by Page 34
Figure 21. Comparison between Rwanda, Uganda, Tanzania, Ethiopia and Colombia using six main criteria
1.7.3 Porter’s Five Forces applied to specialty coffee
A graphical representation of Rwanda’s competitive advantage, using Porter’s Five Forces analysis, is shown
below.
Figure 22. Porter's Five Forces applied to the coffees from Rwanda
Barriers to entry by other coffee-growing countries in the region are medium to high, as larger coffee-growing
countries, such as Uganda, traditionally a robusta growing country, are quickly catching up on their washed
arabicas, obtaining cupping scores up to specialty. For smaller countries such as Malawi, also mentioned by
one of the buyers as a potential competitor, it will be more difficult to set up a similar structure for washed
coffees.
Buyer power is relatively large. A buyer has limited switching costs, and can easily go for another Ethiopian or
lower quality Kenyan coffee as a substitute for Rwandan coffees. Only the very small niche buyers, that buy
the coffees because of the origin, and/or specific locality of trees, for example, cannot switch.
Supplier power is medium, and depends somewhat on the perspective which is taken. There are many CWSs
in Rwanda, with the majority of them capable of providing the skills and capacity required to supply the
volumes and qualities demanded by the market, especially when also taking the multinationals into account.
Threat of new entry
Buyer Power
Supplier PowerThreat of substitution
Competitive Rivalry
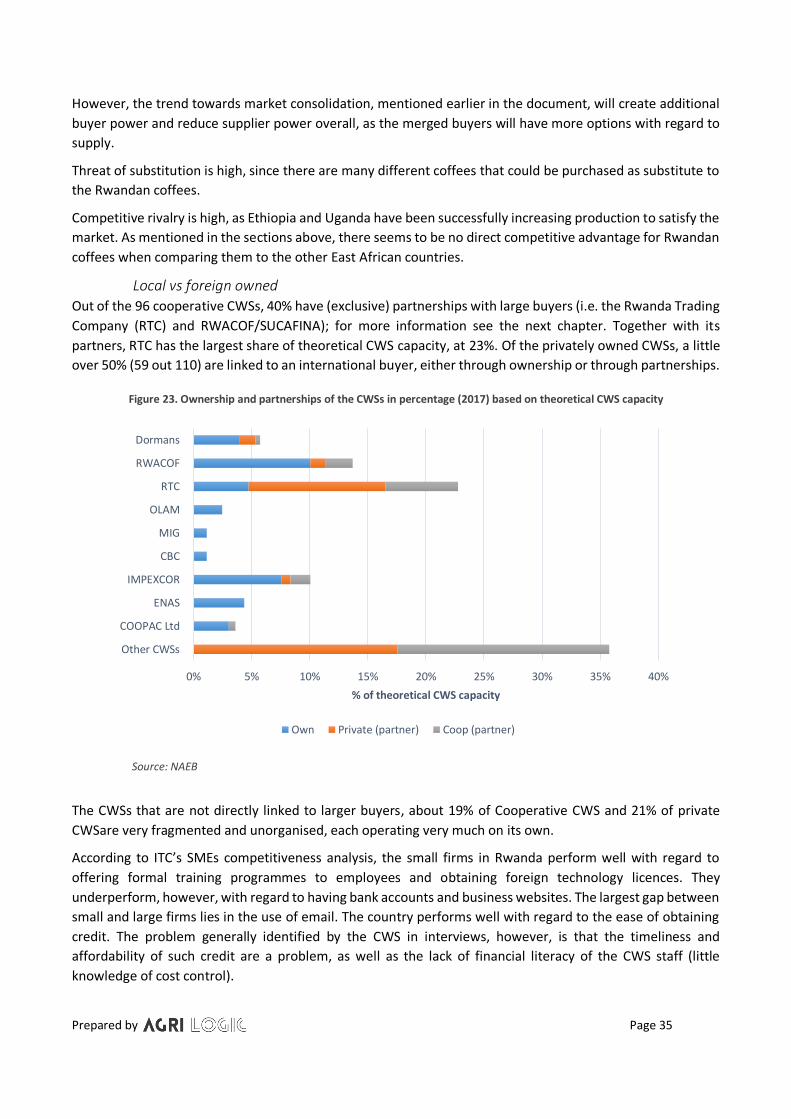
Prepared by Page 35
However, the trend towards market consolidation, mentioned earlier in the document, will create additional
buyer power and reduce supplier power overall, as the merged buyers will have more options with regard to
supply.
Threat of substitution is high, since there are many different coffees that could be purchased as substitute to
the Rwandan coffees.
Competitive rivalry is high, as Ethiopia and Uganda have been successfully increasing production to satisfy the
market. As mentioned in the sections above, there seems to be no direct competitive advantage for Rwandan
coffees when comparing them to the other East African countries.
Local vs foreign owned
Out of the 96 cooperative CWSs, 40% have (exclusive) partnerships with large buyers (i.e. the Rwanda Trading
Company (RTC) and RWACOF/SUCAFINA); for more information see the next chapter. Together with its
partners, RTC has the largest share of theoretical CWS capacity, at 23%. Of the privately owned CWSs, a little
over 50% (59 out 110) are linked to an international buyer, either through ownership or through partnerships.
Figure 23. Ownership and partnerships of the CWSs in percentage (2017) based on theoretical CWS capacity
Source: NAEB
The CWSs that are not directly linked to larger buyers, about 19% of Cooperative CWS and 21% of private
CWSare very fragmented and unorganised, each operating very much on its own.
According to ITC’s SMEs competitiveness analysis, the small firms in Rwanda perform well with regard to
offering formal training programmes to employees and obtaining foreign technology licences. They
underperform, however, with regard to having bank accounts and business websites. The largest gap between
small and large firms lies in the use of email. The country performs well with regard to the ease of obtaining
credit. The problem generally identified by the CWS in interviews, however, is that the timeliness and
affordability of such credit are a problem, as well as the lack of financial literacy of the CWS staff (little
knowledge of cost control).
0% 5% 10% 15% 20% 25% 30% 35% 40%
Other CWSs
COOPAC Ltd
ENAS
IMPEXCOR
CBC
MIG
OLAM
RTC
RWACOF
Dormans
% of theoretical CWS capacity
Own Private (partner) Coop (partner)

Prepared by Page 36
1.8 Potential for local value addition
Natural & honey processed and other processing methods
Natural and honey processed coffees seem to be a growing trend. Such processing can help create unusual
flavour profiles that add value to the coffee (Annex VII). In the previous section (1.2.2), some additional
information was provided on the status of natural and honey processed coffees in Rwanda.
For natural processed coffees, the cost of processing is lower than for fully washed, as no water is used in
making the coffee. However, prices paid for it in the market are similar to those of washed coffees. An
additional advantage is that, besides much lower operational costs, the water footprint is drastically lowered.
Disadvantages are that the period after harvest needs to be dry to allow sun drying, that it is time-consuming,
and that defects like PTD are less easy to control. The other problem with natural processed coffees is that the
market is not (yet) really able to differentiate between high-quality naturals and floaters or rejects from the
washing process, which sometimes tend to also be sold as naturals.
Innovation in processing is ongoing, in the search for better coffees and profiles. Drivers for innovation in the
coffee industry differ, but can generally be divided into these three: creating a consistently higher-quality
product, strengthening the product to prevent damage and deterioration on its way to the consumer, and
making farms more sustainable. Producers are experimenting with the absence of oxygen for fermentation
(anaerobic lactic acid process), while others are looking at catalysts to speed up fermentation. Some are also
looking closer at their environmental impact, and trying to process coffees while cutting down on the use of
water. New machinery and knowledge-sharing are also helping to create more unique cup profiles (The Perfect
Daily Grind, 2016).
Experimentation with innovation is an opportunity for Rwanda, and not just because of the increased demand
from the consumer side, translating into new flavours. Knowledge gained could also provide support in better
adapting to climate change (e.g. less water usage, quicker processes). Sharing knowledge and coordinating
these processes is thus important.
Organic certified
The growth in demand for organic coffees and its limited availability in East Africa make the coffees highly
valued. Most of the organic coffees currently come from Ethiopia. If Rwanda is able to produce a high-quality
organic coffee at market prices much more competitive than Ethiopia’s, there could potentially be a good
market. Organic certification is difficult to obtain and requires highly skilled management practices, something
that other countries might not be able to easily imitate. The constraint on Rwandan organic production is that
fertilisers and pesticides are freely distributed by government, making producing organically more of a
challenge, according to some stakeholders interviewed.
Cascara
The new buzz in the coffee sector is “cascara”, also known as coffee cherry tea. Niche coffee makers were
concerned about the environmental impact of coffee and were starting to make tea from it (The Times, 2018).
Cascara, which means “husk,” “peel” or “skin” in Spanish, refers to the dried skins of coffee cherries. These
pulped skins are collected after the seeds have been removed from the cherries. They are then dried in the
sun before they are packaged and shipped off. Coffee retailers – including Starbucks, Stumptown Coffee
Roasters and Blue Bottle – have recently started using cascara coffee husks in carbonated beverages and
coffee drinks (TheDailyMeal, 2018; Bloomberg, 2018). Thanks to their demand, the coffee husk now often
fetches a higher price than the bean itself does (Bloomberg, 2018).

Prepared by Page 37
A few observations with regards to cascara must be made. In May the UK and Germany started enforcing the
Novel Food Act of 1997, which restricted the sale of cascara in these countries. The Novel Food Act of 1997
states: “A Novel Food is defined as food that has not been consumed to a significant degree in the EU prior to
1997…”. Cascara falls under this regulation and therefore must be authorised to be able to be sold for
consumption. Companies must apply to an EU Member State, presenting scientific information and a safety
assessment that shows that the product is safe. The national authority then decides if an additional
assessment by the European Food Safety Authority is necessary. The national authority can then allow the
product if the European Commission and other EU countries do not object (PerfectDailyGrind, 2017). Changes
in Novel Food regulations are upcoming this year, which might make it easier to obtain approval, though as
for now it is considered by the EU (unlike the US) to be a product unfit for consumption.
Another observation is that the quality of cascara is very much related to both organic coffee growing and
natural coffee processing. It is related to organic coffee growing because of food safety, and to natural
processing because the skin to stays on the cherry for longer, which in turn allows the flavours to enter into
the husk. A better quality of cascara can be obtained.
There is a lot of talk about cascara, but the real demand in Europe still needs to be proven once EU restrictions
have been lifted. Like for organic, for Rwanda the constraint might lie in the current widespread use of
fertilisers and pesticides.
Innovations
Rwanda is a small country, which is well connected and has an active policy on mobile and IT technology
development. The country lends itself well to testing technological innovations and could set standards for
the future. This could (at least for the short and medium term) mean more investments and value addition in
the coffee sector.
Roasted coffee
Adding value by roasting the beans at origin is an option. Quite a good deal of small-scale roasting is already
being done, such as for the Maraba coffee and Gorilla’s Coffee produced by the Rwanda Farmers Coffee
Company (RFCC), which recently struck a deal with a US company. Direct trade and providing added value in
origin is becoming more and more of a trend. Difficulties lie in maintaining qualities during transit.
Development of local consumption
Although this would be more of a long-term effort, given that Rwanda is traditionally a tea drinking country
and coffee is relatively expensive compared to other drinks, it might be an effective channel for the more
mainstream fully washed coffees, as this is where Rwanda might have difficulty competing in the export
markets in future. Bourbon coffee and Question Coffee are good examples of how local consumption could
be promoted.
Storytelling
As already touched upon in previous sections, storytelling is an important part of marketing coffee, especially
for Rwanda. Further building on this will create value and help support the position of the Rwandan coffee
sector in the region.
1.9 Conclusion to Element 1
European demand for specialty coffee has been on the rise and is expected to continue to grow. Although
Rwandan specialty coffees are already known to European buyers, they are still seen as exotic when it comes
to specialty. The coffee is also still very much associated with the potato taste defect (PTD).

Prepared by Page 38
In the US this is a different story, due to the effectiveness of the PEARL and SPREAD projects implemented
between 2000 and 2011, which besides impressively increasing the qualities, also successfully promoted
Rwandan coffee with specialty buyers in the US. Interventions should target the promotion of Rwandan
coffees with the European buyers and roasters. An opportunity might lie in finding synergies with Rwanda’s
tourism strategy.
As to PTD: research is being conducted and there are some promising results. Continued support of this
research and its application at CWS level should further help control PTD and help improve the reputation of
Rwanda’s coffees.
According to the trade statistics, opportunities for specialty in Europe can be found particularly in the UK,
France, the Netherlands, Norway and Poland. This was backed up by the buyers, who indicated that the
Scandinavian countries as well as eastern Europe to be good growth markets for specialty. Germany shows
potential according to the ITC, although value/kg and value growth is relatively low. As a small country, volume
is less relevant for Rwanda, so most opportunities likely lie in focusing on the smaller consumer countries
exhibiting faster growth, where high-value coffees are appreciated, in order to establish market share and
brand recognition.
Taking only into account quality and volume, Rwanda has little competitive advantage compared to the other
specialty coffee producing countries in East Arica. Its competitive advantage is very much related to its
“storytelling” capacity, its pricing (for now), its CWS
infrastructure, and the ease of traveling and doing business.
The country also shows significant potential for further
improvements in cost efficiency and quality.
Porter’s Generic Strategies help in showing how Rwanda
should position itself. Being landlocked and not benefiting
from economies of scale due to its limited land size,
differentiation seems to be the best strategy. Differentiating
factors that could be interesting for Rwanda are origin
(story), further growth in organic production, micro-lots,
tech innovations, and different processing techniques such
as natural and honey. All of these differentiating factors
require increased skills from farmers and (exporting) CWS
management. This is where CBI could provide support.
Figure 244. Porter's Generic Strategies

Prepared by Page 39
Structure, Governance and Sustainability of the Value Chain
2.1 The coffee value chain
2.1.1 General overview of the coffee sector
Figure 255. Rwanda’s coffee value chain
Source: adapted from TWIN & TMEA, 2018
The Rwandan coffee value chain is depicted above. As mentioned earlier, there are two main qualities that
are recognised for export in Rwanda: fully washed and semi-washed (ordinary).
For the fully washed process, cherries harvested by farmers are carried to CWSs, within six hours of harvest,
for wet processing within their zone. The CWSs are either run by cooperatives or private-sector companies.
Quality control is done before entering the mill. This includes cupping, checks on moisture content, weight
composition ratio, the physical appearance of the bean and the presence of a fermentation odour (JICA, 2014).
The parchment which serves as raw material for semi-washed is home-processed by farmers, often from the
cherries refused by the CWS, and is done using a hand-powered pulping machine. This parchment is sold as
“Ordinary” to local middlemen and is collected by the dry mill via a vast network of middlemen, who are pre-
financed to purchase the parchment. The quality control criteria are similar, except that the parchment is not
cupped. In addition, there is no traceability on the parchment as it is collected from all over the country from
small intermediaries.
The green beans from the fully washed process are either exported or used for local roasting. All of the semi-
washed is exported. There are many different exporters, mostly working with the large international logistical
companies Bolloré or Diamond as freight forwarders. Coffee is exported via Dar es Salaam in Tanzania or
Mombasa in Kenya.
The sector faces relatively high operational costs, as a landlocked country with few own resources. Electricity
and fuel costs are relatively high compared to the region.
The National Agricultural Export Development Board (NAEB) samples all lots before they are exported and
performs an evaluation based on the official quality standards which can be found in the Annex VIII. However,
the various exporters all maintain different grading standards, as the official standards are not sufficiently
recognised by the sector (JICA, 2014).
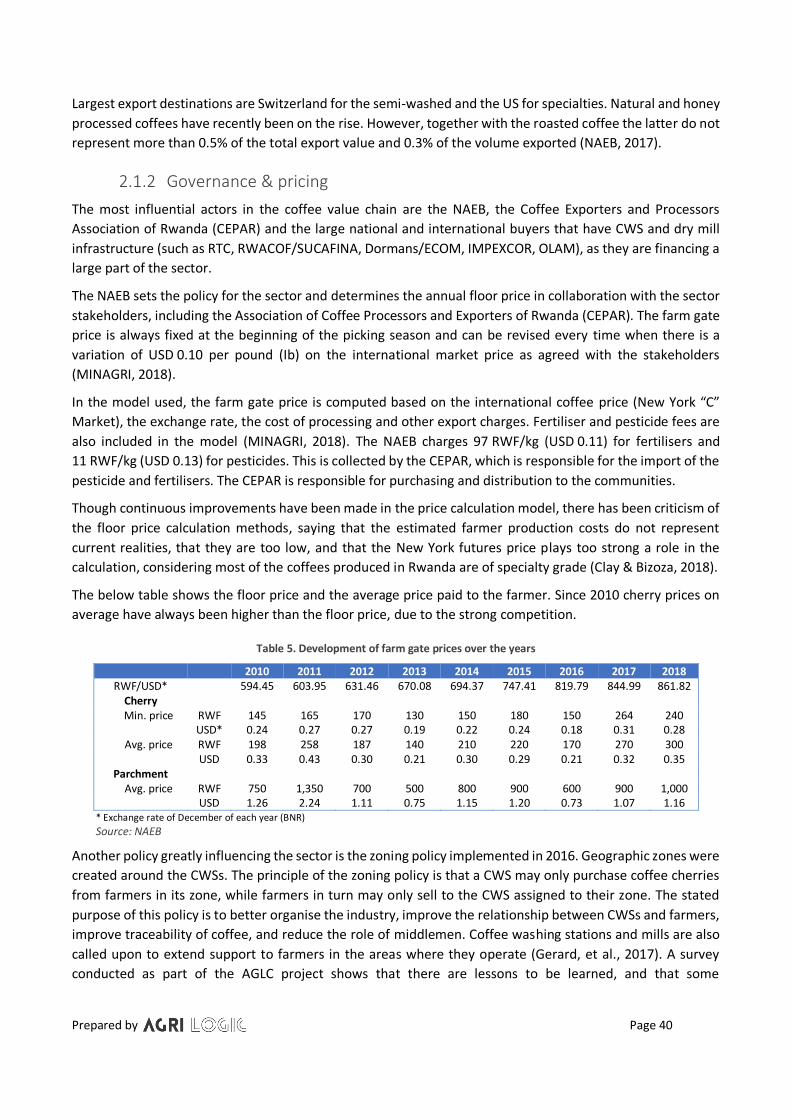
Prepared by Page 40
Largest export destinations are Switzerland for the semi-washed and the US for specialties. Natural and honey
processed coffees have recently been on the rise. However, together with the roasted coffee the latter do not
represent more than 0.5% of the total export value and 0.3% of the volume exported (NAEB, 2017).
2.1.2 Governance & pricing
The most influential actors in the coffee value chain are the NAEB, the Coffee Exporters and Processors
Association of Rwanda (CEPAR) and the large national and international buyers that have CWS and dry mill
infrastructure (such as RTC, RWACOF/SUCAFINA, Dormans/ECOM, IMPEXCOR, OLAM), as they are financing a
large part of the sector.
The NAEB sets the policy for the sector and determines the annual floor price in collaboration with the sector
stakeholders, including the Association of Coffee Processors and Exporters of Rwanda (CEPAR). The farm gate
price is always fixed at the beginning of the picking season and can be revised every time when there is a
variation of USD 0.10 per pound (Ib) on the international market price as agreed with the stakeholders
(MINAGRI, 2018).
In the model used, the farm gate price is computed based on the international coffee price (New York “C”
Market), the exchange rate, the cost of processing and other export charges. Fertiliser and pesticide fees are
also included in the model (MINAGRI, 2018). The NAEB charges 97 RWF/kg (USD 0.11) for fertilisers and
11 RWF/kg (USD 0.13) for pesticides. This is collected by the CEPAR, which is responsible for the import of the
pesticide and fertilisers. The CEPAR is responsible for purchasing and distribution to the communities.
Though continuous improvements have been made in the price calculation model, there has been criticism of
the floor price calculation methods, saying that the estimated farmer production costs do not represent
current realities, that they are too low, and that the New York futures price plays too strong a role in the
calculation, considering most of the coffees produced in Rwanda are of specialty grade (Clay & Bizoza, 2018).
The below table shows the floor price and the average price paid to the farmer. Since 2010 cherry prices on
average have always been higher than the floor price, due to the strong competition.
Table 5. Development of farm gate prices over the years
2010 2011 2012 2013 2014 2015 2016 2017 2018 RWF/USD* 594.45 603.95 631.46 670.08 694.37 747.41 819.79 844.99 861.82
Cherry Min. price RWF 145 165 170 130 150 180 150 264 240
USD* 0.24 0.27 0.27 0.19 0.22 0.24 0.18 0.31 0.28 Avg. price RWF 198 258 187 140 210 220 170 270 300
USD 0.33 0.43 0.30 0.21 0.30 0.29 0.21 0.32 0.35 Parchment
Avg. price RWF 750 1,350 700 500 800 900 600 900 1,000 USD 1.26 2.24 1.11 0.75 1.15 1.20 0.73 1.07 1.16
* Exchange rate of December of each year (BNR)
Source: NAEB
Another policy greatly influencing the sector is the zoning policy implemented in 2016. Geographic zones were
created around the CWSs. The principle of the zoning policy is that a CWS may only purchase coffee cherries
from farmers in its zone, while farmers in turn may only sell to the CWS assigned to their zone. The stated
purpose of this policy is to better organise the industry, improve the relationship between CWSs and farmers,
improve traceability of coffee, and reduce the role of middlemen. Coffee washing stations and mills are also
called upon to extend support to farmers in the areas where they operate (Gerard, et al., 2017). A survey
conducted as part of the AGLC project shows that there are lessons to be learned, and that some

Prepared by Page 41
improvements could be made. The suggestion was therefore made to regularly assess – with the stakeholders
involved – what its impact is, to prevent any unintended outcomes (Clay, et al., 2016). Lower competition
might lower the purchasing prices, which could disincentivise farmers, according to a number of stakeholders
we spoke with.
For each value chain level, the following sections will describe the most relevant actors, their roles and the
main obstacles they face, starting off with the coffee growers.
2.2 Coffee farmers
2.2.1 General overview
According to the last coffee census of 2015, there are 355,771 coffee growers in Rwanda, cultivating a total of
some 35,000 ha of coffee. Some 66,095 are members of associations or cooperatives. Cooperative members
represent over 18% of the coffee growers. The cooperative market share in coffee exports is under 10%.
Currently there are 267 coffee associations and cooperatives in the country, with an average of 247 members.
Only 80 of the 267 receive support from NGOs and/or government projects.
The low level of membership weakens farmers’ organisations and hinders coffee sector training and
monitoring initiatives, while also giving them less of a voice when policies are being developed.
As mentioned earlier, productivity is low, though comparable to the other East African coffee-growing regions.
The NAEB identifies the following five drivers for the low productivity: 1. poor soil fertility; 2. poor application
of mineral fertilisers; 3. yield loss due to pests and diseases; 4. lack of good agricultural practices (GAP); and
5. old trees (AGLC, 2017). Land fragmentation and the effects of climate change (one of the causes of pests
and diseases) can be also added to this list.
Price is also said to also be a major contributing factor to low productivity, according to the stakeholders
interviewed. The low farm gate prices (see Table 5) make coffee a less attractive option than products such as
maize, potatoes or passion fruit, for which higher prices can be obtained. The mean cost of production (excl.
transport) was 177 RWF/kg according to a recent AGLC (2016) study, indicating how low margins have been.
The same study shows that in 2015 over one third of the growers suffered a net loss.
Coffee farmers are now said to be clearing their coffee trees to plant alternative crops. Most affected by this
are the larger coffee plantation owners, with more than 1000 trees, as this group keeps a close watch on profit
margins, not investing when prices are low, and thus keeping overall productivity low (Clay & Bizoza, 2018).
Clay and Bizoza (2018) further make the point that a small productivity gain on these large plantations, to the
level of 2.17 kg/tree, would impact production by 46%. However, this group keeps a close watch on profit
margins and when prices are low they do not invest, keeping overall productivity low.
Most farmers hire labour during harvest season. Savings and advance pay from washing stations are generally
used to pay these seasonal workers (JICA, 2014). Labour is generally found to be in plentiful supply, which
keeps wages low, a social risk for the sector as there is no official minimum wage (see also section 2.7.1).
As a national strategy to further increase the value of the coffee from Rwanda, coffee farmers are strongly
encouraged to sell their cherries to CWSs for wet processing. In most cases, CWSs are located within a radius
of 3–5 km from the farmers. Either the farmers bring the cherries to the CWS or they are picked up by CWS
collectors from the designated zone. Though restricted by law, side-selling of coffee by members is still quite
common due to the differences in prices paid for the cherries by the CWS and the fact that of CWSs not always
having the funds available (on time).

Prepared by Page 42
Prices differing from the floor price (Table 5) mostly has to do with the competitiveness of the zone and to a
lesser degree with quality specifications. It is common for farmers to be paid twice. First payment occurs when
they sell the cherries, and the second payment at the end of the season, often called a “bonus” when it comes
from a cooperative or association. It is paid from the additional premiums received.
2.2.2 Challenges at producer level
Poor soil fertility and insufficient fertilisers (est. 34% coverage)
Insufficient application of appropriate fertilisers has been a major contributing factor to the stagnation of
volume growth and improvement of quality. To address the issue of poor soil fertility, the government has
installed levies on the exported coffee, from which inputs are to be purchased and distributed to cooperatives
and other private coffee washing station owners, which will in turn distributed to coffee farmers across
Rwanda, CEPAR. However, delays often occur and only an estimated 34% of the demand for inputs is covered.
In addition, because the way the distribution system works is not well understood by its beneficiaries, not all
agricultural inputs reach the farmers.
Old trees meaning low productivity
Currently one in four coffee trees are above productive age (30+ years) (NAEB, 2017). Efforts are being made
through government projects funded by IFAD to plant new trees, mainly in Eastern and Northern Province,
but replacing all non-productive trees will still require a lot of effort. Other support was previously given
through the STABEX programme of the EU. These kind of programmes require substantial financial means.
Replacing old trees represent a considerable investment by farmers, as newly planted trees will only cherry
after three years. The old trees are said to often be owned by ageing farmers, who are no longer motivated to
invest in a new coffee plantation. Unless a new generation of coffee farmers can be attracted to coffee,
through higher returns and the potential for growth, these younger farmers will continue to turn to other
more profitable crops, particularly those that receive subsidies, such as horticultural crops (vegetables & fruits)
and irrigated crops )e.g. rice and maize).
Inadequate GAP application, due to low motivation and poor or poorly coordinated extension
services
Adequate extension services at farmer level remains a challenge. Over the years, the Rwandan government
has reduced the number of staff made available for agricultural extension services. Per administrative sector,
there is only one extension agent in charge of all crops. Private CWSs and cooperatives are encouraged by the
NAEB to hire their own extension staff in their coffee zone, and to produce seedlings and distribute inputs.
Improving this situation may require a radical change, whereby government is no longer responsible for the
extension services and these are privatised. CWSs would become responsible for hiring agronomists,
producing and distributing seedlings, as well as fertiliser and fungicide distribution, all at the level of the CWS
rather than district level. This could be beneficial, as the CWSs recognise the benefits of ensuring that good
farming practices, fertilisers and fungicides are used in their area.
Low prices compared to competing crops: farmers poorly motivated to keep growing coffee
In order to motivate farmers to invest in coffee, compensation for cherry needs to be adjusted to reflect the
true cost of production and provide margins for ensuring profitability and growth. If this is not adequately
addressed, this will serve as a barrier to the sector’s sustainability.
Despite undeniable potential and many projects making efforts to support quality improvement at farm level,
the quality of cherries has not improved much. Farmers currently have little or no incentive to improve cherry

Prepared by Page 43
quality as they receive a set price for their product even if their cherries are of a superior quality to another
seller’s.
Pest and diseases
Pests and diseases may reduce Rwanda’s production by as much as 50% a year at farm level. Three pests and
diseases in particular are causing most of the damage. These are leaf rust, coffee berry disease (CBD), berry
borer and the antestia bug which causes PTD (see 1.4.1). Increased severity of leaf rust and CBD is witnessed
due mainly to climate change. Drought has a huge impact during the pre-harvest period when coffee cherries
are maturing and increases the severity of leaf rust, while a high moisture rate following heavy rains increases
CBD severity. Good agricultural practices (GAP) also influence this greatly.
Farmers apply pesticides annually, but this does have sufficient impact. Since there is a market demand trend
towards organic, chemical pesticides will no longer be acceptable to certain groups of buyers, especially in the
US and Japan. Hence, Rwandan farmers will be obliged to use more integrated pest management systems.
2.3 Primary processing
2.3.1 General overview
Since 2002, the number of CWSs in the country has grown at an incredible pace. In 2018, there were 299 CWSs
of which 276 were operational. The total theoretical processing capacity of the operational CWSs equalled
131,750 MT of cherries (or 20,000 MT of green bean) (NAEB, 2018). Nationwide the CWSs operate on average
at 60% of their capacity. It should though be noted that the theoretical installed capacity figures could be
somewhat inflated.
The Transparency.com website set up by Technoserve provides the location of 200 of these CWSs, and for a
number of these some primary information is available.
Table 6 Summary of CWSs per province in 2018
Provinces Total number of CWSs in 2017
Cherries capacity of all CWSs (incl. non-
operating CWSs) (MT)
Number of CWSs not or not yet operating in
2018
West 129 60,400 7
South 82 34,050 10
East 60 28,750 5
North & Kig. 28 14,800 1
G/TOTAL 299 138,000 23
Source: NAEB, 2018
The buying practices of the CWSs differ: farmers usually bring their cherries to a collection site on a designated
date. The CWS provides a truck for the purchase and collection of cherries. Other options are that CWS
collectors or middlemen buy the cherries from the farmers or that farmers bring cherries directly to the CWS.
All cherries delivered to the CWSs go through primary processing. Cherries of particularly high quality are
separated for processing (such as those for micro-lots or the women-grown coffees).
At the CWS the cherries are pulped, fermented and graded using flotation channels. The wet parchment is
then soaked for 24 hours, before being pre-dried, sorted and dried again. Parchment is then transported to
secondary processing facilities to process into green coffee beans. There are often too few drying tables, which
is a risk to the quality. In addition, they are often built on-site, with timber from trees that were felled nearby,
which forms an environmental risk.

Prepared by Page 44
The cherry volumes that CWSs can obtain is very much dependent on their financial means. Even though
zoning is in place, producers still go to the highest bidder, and with competition being high in most regions, it
is difficult to obtain the necessary volume to run a CWS efficiently. Strong competition leads to CWSs also
having to accept low quality, immature, damaged cherries along with the good ones, while paying a flat rate
for them. Some of the CWSs are so eager to buy the cherries that they offer prices way beyond their financial
means and go bankrupt. This has very much affected the relationships and reputation of CWSs with both the
farmers as well as national and international buyers.
A significant portion of fully washed coffee is of undistinguished quality and does not receive the higher prices
that are crucial for the long-term financial stability of CWSs. This is mainly because best practices are not
uniformly applied, not only with regard to production, but also processing and marketing. A certain
professionalism is lacking.
Many of the CWSs are off-grid: only 29% are connected to the grid, according to an evaluation report published
by TripleLine (2017), meaning no electricity, no computers and thus generally a paper based admin system.
General management skills are a major obstacle. One of them is risk management and knowledge of markets
and legal frameworks to help manage risks. Recently a Canadian company called “Happy Goat” concluded
many contracts with individual CWSs, both private ones and cooperatives, yet did not execute the contract.
This situation led to financial problems for the small exporters who were unable to repay their loans. Similar
issues occurred at a smaller scale during transactions between in-counties stakeholders.
Over the last couple of years, NGOs and International supporters, such as USAID, IFAD, Technoserve, TWIN,
SNV, Sustainable Harvest and Starbucks, have all been building the capacity of coffee processors and exporters
(especially cooperatively-owned wet mills) in financial management and the basics of international price
hedging and risks mitigation.
In terms of capacity, it is thought that at least 80% of the management staff of the smaller CWSs speaks some
level of English (or French) and that this is also true for about 10% of the labour force. Small CWSs still face a
good degree of capacity constraints and management skills are limited.
The CWSs have little knowledge of and information on the European market, mainly due to previous
experience with USAID projects, so they usually look to the US market as well as emerging markets. Due to
their remoteness and limited communication options, it is difficult for CWSs to connect with their international
buyers directly. Technological advancement is, however, expected to help improve this soon. WhatsApp has
already proved to be an effective tool in improving direct communication with buyers, allowing regular
updates.
2.3.2 Ownership
About 70% of all the CWSs in the country are privately owned. RWACOF/SUCAFINA, IMPEXCOR, RTC,
Dormans/ECOM, COOPAC, CBC and Olam, together with their CWS partners, represent about 64% of the total
available capacity (see Figure 266).
Many valuable services are provided by the large private exporter/buyer, such as financing, market access,
quality control and extension services to CWSs and producers. However, there is a lack of trust between the
partner CWS and the “Service Provider”, which is mainly related to the lack of bargaining power of the smaller
partner CWS. At the beginning of each season exclusive partnership contracts are signed between parties,
indicating expectations vis-à-vis the other in terms of services delivered, financial and otherwise. They are
renewed after each season. Market and price risks are the responsibility of the large exporter/buyer.

Prepared by Page 45
Figure 266. Share of CWSs based on theoretical capacity of the main actors (2018), including their CWS partners
Source: NAEB
2.3.3 Exporting by CWSs
For a CWS to sell green or roasted coffee on the international market, it must be licensed by the NAEB. The
fee to obtain a license is USD 100. The following documentation must also be provided (NAEB).
• Proof of registration with the Rwandan Development Board (RDB) and current business address in
Rwanda
• Business plan for the upcoming year
• Proof of previous history or capability to export a minimum of one shipping container of coffee during
the coffee season (case-based exceptions can be made for high-value coffee)
2.3.4 Challenges at CWS level
For the CWSs (cooperative or private) not directly supported their buyers, the following challenges can be
summarised.
High operating costs
Processing costs of the wet mills are relatively high compared to the region, which can be seen in the figure
below, but also in Figure 10 and Figure 11, on the value distribution.
Figure 277. Arabica export processing costs for Burundi, Ethiopia, Kenya, Rwanda, Tanzania and Uganda
Source: GCP database
Other Private, 18%
RTC, 23%
Other Coops, 18%
RWACOF, 14%
IMPEXCOR, 9%
Dormans, 6%
ENAS, 4%OLAM, 2%
CBC, 1% MIG, 1% COOPAC, 4%
-
5.00
10.00
15.00
20.00
25.00
30.00
USD
ct/l
b

Prepared by Page 46
Different reasons can be put forward for the inefficiencies at CWS processing level. First of all, being a
landlocked country means that costs are generally higher. Quality and volume of the cherries delivered is one
aspect. Strong competition for cherries (especially in poor seasons) between CWSs means that cherries are
accepted regardless of quality. In addition, the sector is relatively new and many coffee washing stations are
still learning how to operate effectively. There is also a lack of adequate business planning and management,
as well as a lack of technical knowledge, leading to high maintenance costs, and no access to markets or
financial resources.
With regard to the enabling environment, CWS operations also continue to be hampered by infrastructure
constraints. Access to water and good transportation networks are cases in point. The quality and quantity of
water used for fermenting and washing is a key determinant in the quality of the final product, as is receiving
the cherries in on time, which minimises the risks of early fermentation and thus quality loss. The
infrastructure constraints mainly are related to poor road networks in rural areas, especially in parts of the
country where escarpment defines the landscape, resulting in high transportation costs and risk of quality loss.
Access to finance
For CWSs not directly linked to the larger exporters in the country, access to finance is a major obstacle.
The fact that a number of CWSs run under capacity obviously affects their profitability. It also makes it very
difficult to make timely and sufficient repayments to the financial institutions which support them in almost
all their activities (infrastructure, cherry purchase, processing, exportation, etc.) and give them loans based on
the estimated amount of cherries that will be processed.
CWSs are seen as a high-risk operation for financing, especially the smaller ones. There are price risks,
operational risks and quality risks. Often contracts with buyers are relational contracts, so provide no
collateral. Even with the zoning, strong competition also undermines the ability to sustain a relationship
contract (Machiavello & Morjaria, 2017). Furthermore, the paper-based system and lack of financial literacy
makes the CWSs high-risk. Banks are therefore not eager to finance such CWSs, which leads to either no
financing, insufficient (incl. late) financing and very high costs of financing for the CWS. In section 2.6.4 there
is more on the financial service providers.
Digital solutions, including the use of smartphones (but also blockchain) might provide opportunities in better
registering the CWS finances. Successful examples include Technoserve, with its coffee platform for easy
accounting and financial monitoring and transparency, and the NAEB’s Internal Management System (IMS) to
report on daily production in CWSs.
Weak bargaining power and lack of collaboration and coordination
The CWSs are too small to be competitive and collaboration in one way or another is a necessity to strengthen
their position on the market and obtain the right financial, technical, management and agricultural services to
achieve their goals. Horizontal integration at both this level and at farmer level remains weak. The coffee
industry should primarily attempt to strengthen the weakest nodes to encourage the best possible functioning
of the sector as a whole.

Prepared by Page 47
2.4 Secondary processing & export
2.4.1 Overview
Dry milling is the final stage green coffee goes through before it is sold and shipped to the roaster. There are
twelve dry mills, of which four are privately owned (see the List of Exporters (2017) in Annex II). Most of the
mills are located in the vicinity of Kigali, given its strategic location. The dry mill is the final point of quality
control before submitting samples to the NAEB for quality certification for export.
There are currently 88 export companies registered, although only half are active coffee exporters. They can
be grouped into three categories based on their size (see Annex IIAnnex II).
I) >500 MT of green coffee (estimated at 85%)
II) 100–499 MT (estimated at 10%)
III) Small exporters <100 MT of green coffee per season (estimated at 5%)
In the 2016 season, eight companies were classified in the first category as big exporters and are thought to
be responsible of at least 87% of exports.
When not taking into account those CWSs owned by multinationals, there are about 200 CWSs, of which 96
are cooperatives. About half are directly linked to international exporters through financing structures. There
are about 30–35 SMEs that export themselves, depending on the year.
2.4.2 Exporter unions
Rwanda Small Holder Specialty Coffee (RWASHOSCCO) and MISOZI are exporting companies representing a
number of cooperative washing stations.
RWASHOSCCO RWASHOSCCO is composed of five cooperatives and one private CWS. It were founded in 2005 as a joint venture.
RWASHOSCCO’s board is made up of representatives from these cooperatives and it provides export support, in
terms of quality control, contract negotiation, contact with buyers and export logistics. It asks a fee of 90 RWF/kg
of the green coffee exported. Services delivered can be summed up as follows.
• Cupping
• Marketing: The company participates in overseas trade fairs, contacts coffee traders found on the
Internet and sends green coffee samples to buyers
• Export management: Export procedures, distribution arrangements, insurance arrangements, etc.
Technical guidance on cultivation used to be provided at the time they received funding support form USAID. At
that time the company has multiple agricultural experts and six selection and processing experts to provide
guidance.
Some of RWASHOSCCO’S cooperatives now receive support from TWIN and Sustainable Harvest.
MISOZI
MISOZI was set up 2007. The original idea was the start a union of cooperatives, but this was not allowed
under the Rwandan law which says that unions can only be formed by cooperatives that are based in the same
district. It therefore registered itself as a company with eight equal shareholders, CWS cooperatives. MISOZI
is trading coffee on behalf of its members, and charged mainly with marketing and logistics. The cooperatives
sell directly to international buyers, identified by MISOZI, whereby 2% of the total value of the sale goes to
MISOZI to cover its operating costs. However, it has not been smooth sailing: out of the eight cooperatives,
Prepared by Page 48
four have left, while another one joined, leaving it with five cooperatives. MISOZI could benefit from support
with regard to the services it provides to the cooperatives, especially where it comes managing a cooperative.
Members of MISOZI are currently supported by TWIN, Agriterra and Sustainable Harvest.
Both MISOZI and RWASCHOSCCO have been playing an important role as service provider in the coffee export
of coffee cooperatives. However, their expansion is very limited. The biggest companies are leading the value
chain and it is likely that they will gain more and more influence in the value chain.
Exporters that own dry mills have a clear plan for expanding their business, while also providing financial and
marketing services, and obtaining more assets at primary processing level, continuing their vertical
integration.
2.4.3 Challenges for secondary processors and exporters
High operating costs of dry mills
A review of the existing milling units in the country shows an excess capacity relative to actual coffee
production. The existing capacities distributed between the nine functioning dry millers/exporters total 45 MT
of green coffee per hour, which permits almost 52,000 tonnes per year (3 months at 16 hours/day) to be
processed. However, for 2016/17 only 20,000 MT of parchment was brought in.
Lack of transparency and traceability of dry mills
It is assumed that all necessary efforts are made to guarantee transparency and tracking, but this is not always
the case. Milling capacity is mainly concentrated in Kigali, and small CWSs do not have enough capacity to
control the whole process at the dry mill. This can lead to misunderstanding and mistrust between the CWS
and the dry mill. There is a need for capacity-building with regard to the dry mill process for CWSs, and a
regulatory framework and monitoring from the NAEB.
Access to market for exporters
Small and medium exporters find it difficult to market their coffees, indicating that prices set by the CWSs are
too high. Many also lack the experience and skills needed to successfully market the coffees globally.
2.5 Roasters
Like many producing countries, Rwanda is investing in promoting the consumption of coffee. In March 2015,
Rwanda Farmers Coffee Company (RFCC) was inaugurated, with modern coffee roasting machinery that has
the capacity to produce 3,000 kilogrammes of roasted coffee per day. The roasting plant was funded by the
Bill Clinton Foundation and set up by the NAEB. The goal is to bring additional value-added coffee products to
market – including coffee roasted for both the domestic as well as export markets.
There are 20 companies, which include processors and exporters, both private and cooperatives, which are
involved in roasting mostly for local consumption (Annex III).
A few roasters are exporting. Gorilla’s Coffee of RFCC has recently struck different deals, allowing it to export
its coffees to the US and Nigeria. In the roasting there is also a focus on women-grown coffees. RWASHOSCCO
currently sells women-grown roasted coffee, but there are also others, such as 3 African Sisters.
This analysis has not looked into the demand and further expansion of export of roasted coffees, as the focus
has mainly been on high-grade green bean exports. However current trends, under the Third Wave (also
mentioned earlier in this document) do show that there is a demand if roasting plants respect the high quality
standards of production, and coffee quality can be adequately controlled during shipment.

Prepared by Page 49
2.5.1 Challenges at roasting level
The main challenges that were identified were related to the limited experience Rwanda still has in roasting
coffee both for the domestic as well as the export market.
Access to roasting & packaging equipment/materials
In Rwanda, for example, it is difficult to find quality propane gas for the roaster, and it is expensive to procure
and ship packaging, sealers and other equipment.
Low domestic consumption & low export demand
Not having an existing coffee culture makes staffing a coffee company difficult. Exporting roasted coffee
means dealing with marketing and quality consistency constraints. Marketing research and communication
needs to be reinforced.
2.6 Enabling environment
2.6.1 Business environment
Ease of doing business
The World Bank‘s Ease of Doing Business reports are a testament to the tremendous efforts being made. In
2018, the country is ranked second in ease of doing business in Africa (after Mauritius) and ranks 41 globally,
up from 143rd out of 181 countries in 2007 (The World Bank, 2017).
ICT in agriculture
As mentioned earlier in section 1.5, Rwanda has invested significant efforts in upgrading its ICT infrastructure
over the last decade, the official projections indicating that by 2020 the internet penetration rate will have
reached almost 60% of the country’s population estimated at 12 million (RURA, 2018).
In Rwandan agriculture, ICT platforms have been used in many ways in the sector, including the following.
• As mobile market information solution which allows farmers and consumers to access market
information for agricultural products
• To publish the ICO’s daily composite price by the NAEB, which can be accessed by coffee producers
and exporters from their mobile telephones
• For Technoserve’s text message based bookkeeping system managed by coffee service providers,
which helps cooperatives to monitor and access information about their finances and stocks in real
time (Coffeetransparency.com, n.d.)
2.6.2 Government
National Agricultural Export Development Board (NAEB)
The NAEB is the key government actor involved at all levels of the coffee value chain. For any project, the
NAEB needs to consulted. The NAEB is registered under the Ministry of Agriculture and Animal Resources
(MINAGRI). The NAEB participates in the development of the policy and strategies governing the sector and
ensures the implementation of policies that affect production, processing, marketing research and training
the main actors in the sector. It is dedicated to improving the Rwanda economy through increased agricultural
exports. The NAEB supports the production of coffee in Rwanda by marketing and promoting the export of
coffee, providing technical assistance and planting materials to farmers, and participating in the development
of coffee-related policies and strategies. It is also responsible for determining the floor price (a full list of its
activities can be found on the NAEB website).
Prepared by Page 50
The new policy and strategic framework in line with the NSTP1 focus on market driven agriculture. The new
agriculture export and marketing strategy is under development. National strategies that are currently being
drafted and relevant for the sector are the following.
• Vision 2050
• National Agricultural Policy 2017–2030
• National Strategy for Transformation and Prosperity (NSTP 1) 2017–2024
• Strategic Plan for Agricultural Transformation 2018–2024
• NAEB Marketing Strategy 2018–2024
Coffee is still considered an important export commodity for Rwanda, but it should be noted that the
government focus under PSTA 4 (PSTA: Plan for the Transformation of Agriculture Rwanda) is and will continue
to be on food security and nutrition, as well as on switching to higher-value agricultural commodities, such as
horticulture, vegetable, poultry, pork and fisheries.
RAB
The Rwanda Agricultural Board (RAB) has as mission to make agriculture and livestock sector more productive.
In the coffee sector they supply improved seedlings to the NAEB, which they propagate and further distribute
to CWSs (private & coop), local coffee nurseries, and Farmers’ Organisations (cooperatives without coffee
washing stations). Any research activities would need to be conducted in collaboration with the RAB.
Others
There are other government actors (both ministries and agencies) involved in supporting the sector (Figure
298). Examples include MINAGRI, the Ministry of Agriculture and Animal Resources, which oversees the NAEB,
but the Rwanda Development Board (RDB), Rwanda Cooperative Agency (RCA) and Private Sector Federation
(PSF) are also involved in the sector.
2.6.3 Private sector organisations
Coffee Exporters and Processors Association of Rwanda (CEPAR)
CEPAR was founded in 2011 to increase productivity of the sector. One of its main responsibilities is to
purchase and ensure the timely availability of the inputs, as well as manage the local administration offices
that distribute the fertilisers. However, there are often delays. In addition, statistics have proven too unreliable
to plan for input supply since less than half of the producers are reached. Although CEPAR only has 15 private
sector members, these are the most influential ones in the sector (Annex IV).
The input suppliers used are local supplier ENAS, which recently also set up a fertiliser factory, and Yara
International, in Tanzania.
Rwandan Coffee Cooperatives Federation (RCCF)
The RCCF was set up in 2009, to represent the producers and CWS cooperatives. It is composed of 17 unions
and 89 primary cooperatives, and has 38,000 members. The RCCF provides advocacy services to the
cooperatives.
2.6.4 Trade & labour unions
Although there are trade and labour unions in Rwanda, these are not very active or visible in the sector. The
main organisation representing labourers is Centrale des Syndicats des Travailleurs au Rwanda (CESTRAR),
which includes STAVER, the union for workers in Rwanda active in agriculture, fishing, the veterinary field and
the environment.

Prepared by Page 51
2.6.5 Financial service providers & insurers
These broadly fall into the following four categories.
• Development banks (e.g. BRD, Rabobank Foundation, Oikocredit)
• Traders (e.g. RTC, RWACOF, Dormans)
• Private impact investors (e.g. Root Capital, Shared Interest, Beautiful Coffee, Fefisol, Inkunga)
• Local commercial banks (e.g. GT Bank, COGEBANK, Microfinance)
While the Rabobank foundation only supports cooperatives, others finance both cooperative and private
CWSs. In almost all cases the financing is for working capital (cherry payments). A previous focus group
discussion conducted by Agri-Logic with various CWS cooperatives in Rwanda indicated that access to working
capital generally is less of a constraint for CWSs than the timeliness of disbursement of funds and their
affordability.
Below a figure that shows how the financial service providers are distributed, based on number of
cooperatives financed. The data is not complete, but it does provide insight into the available financial sources.
Figure 288. Distribution of financial service providers, based on number of CWSs
Source: NAEB
2.6.6 Transport & logistics
Transport of cherries and parchment is organised locally with small-scale transporters. Larger washing stations
own their own lorries and collect directly from the farmer. The coffee is shipped by land in 20-foot shipping
containers to Mombasa Port in Kenya or Dar es Salaam Port in Tanzania. Transport by road from Kigali to
Mombasa Port takes seven to eight days, and four days from Kigali to Dar es Salaam. From Kigali to arrival in
Europe it takes about three weeks in total.
For export logistics, most of the exporters use international freight forwarders Bolloré or Diamond. It is
estimated that 80% of the exports go through them.
2.6.7 International organisations and projects
An overview of the projects that are currently running in coffee can be found in Annex VI. Below follows a
short description of the relevant ones.
RTC27%
Private Equity19%
Bank18%
BRD9%
Rest9%
RWACOF5%
Root Capital4%
Dormans4%
Microfinance3%
IMPEXCOR2%

Prepared by Page 52
Over the years there have been numerous large-scale projects, including three mentioned earlier: PEARL and
SPREAD (USAID projects), but now also the Feed the Future African Great Lakes Region Coffee Support
Program (AGLC). The IFAD also has a successful large-scale project, called Project for Rural Income through
Exports (PRICE), which will run until 2020.
MARKUP
MARKUP was launched in June 2018. MARKUP aims to build the competitiveness of (M)SMEs in Burundi,
Kenya, Rwanda, Tanzania and Uganda, supporting them in increasing production, taking advantage of market-
access opportunities and creating more value addition. It intends to support East African (M)SMEs specialised
in a variety of sectors: avocado, cocoa, coffee, horticulture, spices and tea. Interventions will focus on:
identifying and eliminating barriers to trade; improving competitiveness; strengthening value addition for
selected priority sectors; ensuring compliance with international regulations; providing access to trade finance
ventures; and supporting the identification of opportunities for trade and foreign direct investments. It has
been jointly designed by the European Union, the EAC Secretariat and the governments of all five African
countries. The initiative will be implemented by the International Trade Centre (ITC), Deutsche Gesellschaft
für Internationale Zusammenarbeit (GIZ), the United Nations Industrial Development Organization (UNIDO)
and other national partners. This four-year programme is funded from the Regional Indicative Programme for
EAC under the 11th European Development Fund. The MARKUP programme has a total estimated cost of
€40 million, including a €35 million contribution from the EU and indicative third-party contributions of about
€5 million, and will be implemented over a four-year period (2018–22) (ITC News, 2018). More information on
the projects can be found here.
Japan International Cooperation Agency (JICA)
In July 2017, the Japan International Cooperation Agency (JICA), signed on to a three-year project called Coffee
Upgrade and Promotion in Rwanda (CUP Rwanda) in partnership with the NAEB. It is designed to increase
Rwanda’s coffee competitiveness through the creation of well-coordinated value chains and strong monitoring
systems, and to increase the visibility of Rwandan coffee on the Japanese market.
Technoserve
Technoserve has been active in Rwanda since 2008, mostly working on the production side of the value chain.
With the IFAD/PRICE Project their activities in coffee ended this year, but new coffee projects are likely to lie
ahead.
Sustainable Harvest
According to their website, Sustainable Harvest sells specialty coffees from around the world, focusing on
creating transparent relationships that increase value throughout the supply chain, while fostering greater
sustainability. They call the approach Relationship Coffee (RCI). It is funded by Bloomberg Philanthropies. They
have set up Question Coffee, to promote local consumption of coffee, and have built different partnerships
supporting the empowerment of women in the coffee sector. They also collaborate with the Ministry of
Gender and Family Promotion (MIGEPROF) and regularly organise “Let’s Talk Coffee” networking events for
the sector. Their monitoring and evaluation (M&E) system is fully digitised and mainly registers social
improvement indicators. Their gender approach and M&E system could provide valuable input when going
forward with a project, though official approval would need to be sought from the Bloomberg Family
Foundation.
Twin
Twin is a non-profit organisation which owns a trading company. Together with Challenges Worldwide, a
Scottish organisation, they have a project supporting eight cooperatives, which started in October 2017. Their
Prepared by Page 53
other project is with Trade Mark East Africa (TMEA), supporting ten cooperatives in Rwanda and ten in
Burundi. The objectives include developing and harmonising good coffee washing practices in Rwanda and
Burundi, and providing training for technical staff to meet these practices. The aim is to so increase the amount
of quality coffee available for sale on speciality markets. Streamlining and harmonising export processes for
coffee will reduce the barriers to trade in these countries, decreasing delays and facilitating export.
Agriterra
Agriterra supports five cooperatives members of MISOZI with business management good practices. In total
they support nine coffee cooperatives in Rwanda. They actively promote youth and gender inclusivity at
cooperative level.
Others
SNV has supported 50 cooperatives and the creation of 40 new coffee cooperatives under the IFAD PRICE
project, and has been active in the sector from 2005 up to 2011. It was active in a collaboration with Palladium,
a DFID funded international NGO operating in Rwanda.
Together with the International Trade Centre (ITC) and Sucafina, Jacob Douwe Egberts (JDE) set up a new
partnership to support coffee exporters, processors and farmers in Rwanda. The collaboration has a particular
focus on women’s economic empowerment and on ensuring greater participation by women in the coffee
supply chain. JDE is currently also investigating possibilities of another project in Rwanda.
Over the last few years, South Korea has imported various quantities of coffees. KOICA, Korea’s International
Cooperation Agency, is currently discussing the possibilities of setting up a coffee project with the NAEB.
Details are not known at the time of writing.
2.6.8 Challenges summarised
Improved access to information on sector performance
Information regarding the performance of the coffee industry and information about the interventions by the
various private, NGO and public actors is gathered by the NAEB. Relevant information regarding the sector,
however, is not shared freely. During this analysis, it was noticed that each actor had their own vision of how
the sector was performing, depending on the level of access to information. Increasing transparency would
improve synergies, create a more level playing field (everyone on the same information level), as well as
supporting better decision-making by the sector actors, all the while of course respecting antitrust laws.
Focus on food crops
The PSTA 3 which is coming to an end focused on food security and the coffee sector was no longer the priority.
This is expected to continue under PSTA 4.
2.7 Sustainability of the value chain
2.7.1 Labour & employment
The coffee sector provides important rural employment opportunities during the harvesting season, when
many women and youth are employed in the sector (see also sections Youth & Gender). Asking around, there
do not seem to be many projects specifically focusing on preventing labour exploitation in the coffee sector.
Labour is by far the largest investment made by farmers, with a recent study indicating it amounts to 78.2%
of the investments (42% household labour and 36.2% hired labour) (Gerard & Bigirimana, 2018). According to
2017 (February) statistics, a little over 1.3 million Rwandans are employed in the agricultural sector. More
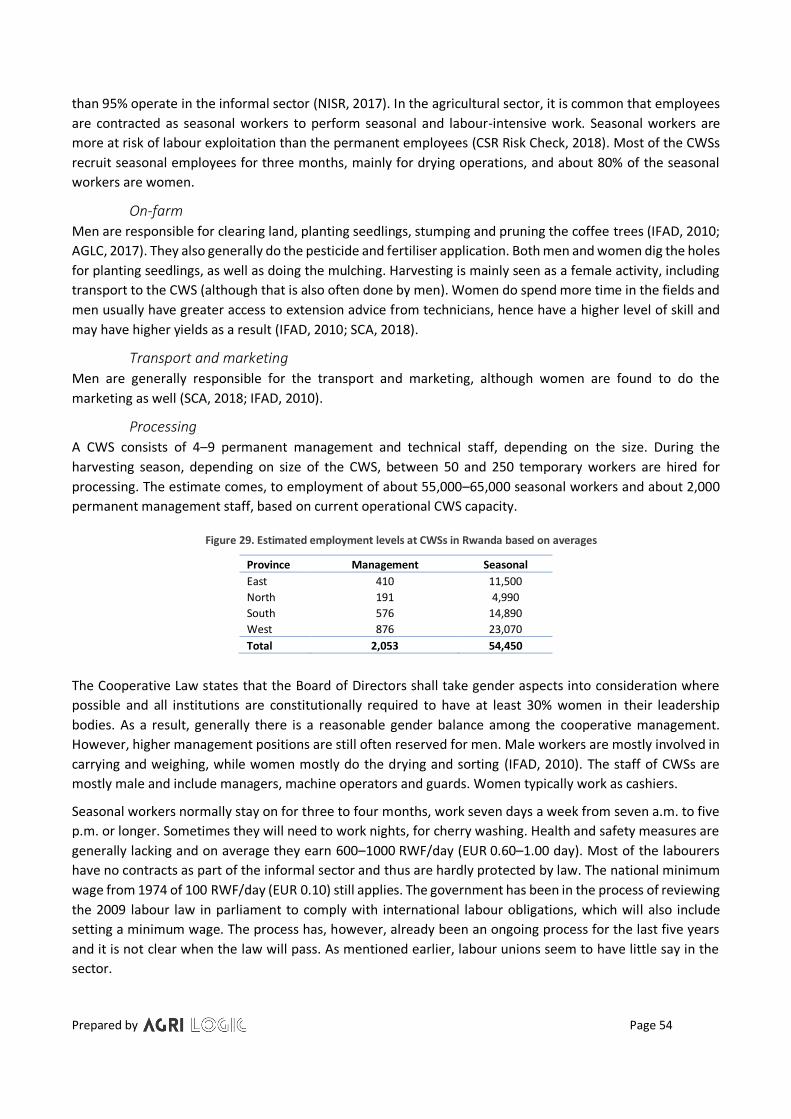
Prepared by Page 54
than 95% operate in the informal sector (NISR, 2017). In the agricultural sector, it is common that employees
are contracted as seasonal workers to perform seasonal and labour-intensive work. Seasonal workers are
more at risk of labour exploitation than the permanent employees (CSR Risk Check, 2018). Most of the CWSs
recruit seasonal employees for three months, mainly for drying operations, and about 80% of the seasonal
workers are women.
On-farm
Men are responsible for clearing land, planting seedlings, stumping and pruning the coffee trees (IFAD, 2010;
AGLC, 2017). They also generally do the pesticide and fertiliser application. Both men and women dig the holes
for planting seedlings, as well as doing the mulching. Harvesting is mainly seen as a female activity, including
transport to the CWS (although that is also often done by men). Women do spend more time in the fields and
men usually have greater access to extension advice from technicians, hence have a higher level of skill and
may have higher yields as a result (IFAD, 2010; SCA, 2018).
Transport and marketing
Men are generally responsible for the transport and marketing, although women are found to do the
marketing as well (SCA, 2018; IFAD, 2010).
Processing
A CWS consists of 4–9 permanent management and technical staff, depending on the size. During the
harvesting season, depending on size of the CWS, between 50 and 250 temporary workers are hired for
processing. The estimate comes, to employment of about 55,000–65,000 seasonal workers and about 2,000
permanent management staff, based on current operational CWS capacity.
Figure 29. Estimated employment levels at CWSs in Rwanda based on averages
Province Management Seasonal
East 410 11,500
North 191 4,990
South 576 14,890
West 876 23,070
Total 2,053 54,450
The Cooperative Law states that the Board of Directors shall take gender aspects into consideration where
possible and all institutions are constitutionally required to have at least 30% women in their leadership
bodies. As a result, generally there is a reasonable gender balance among the cooperative management.
However, higher management positions are still often reserved for men. Male workers are mostly involved in
carrying and weighing, while women mostly do the drying and sorting (IFAD, 2010). The staff of CWSs are
mostly male and include managers, machine operators and guards. Women typically work as cashiers.
Seasonal workers normally stay on for three to four months, work seven days a week from seven a.m. to five
p.m. or longer. Sometimes they will need to work nights, for cherry washing. Health and safety measures are
generally lacking and on average they earn 600–1000 RWF/day (EUR 0.60–1.00 day). Most of the labourers
have no contracts as part of the informal sector and thus are hardly protected by law. The national minimum
wage from 1974 of 100 RWF/day (EUR 0.10) still applies. The government has been in the process of reviewing
the 2009 labour law in parliament to comply with international labour obligations, which will also include
setting a minimum wage. The process has, however, already been an ongoing process for the last five years
and it is not clear when the law will pass. As mentioned earlier, labour unions seem to have little say in the
sector.

Prepared by Page 55
Health and safety hazards in coffee are related to heat exposure in drying operations, solar radiation, hearing
loss or impairment due to noisy machinery, ergonomic problems from hand tools, vibration from machinery
and tractors, and cold and humidity from outdoor exposure. Other hazards include poisoning from pesticides,
and musculoskeletal disorders from repetitive and forceful movements, and lifting and carrying heavy or
awkward loads. Coffee bean dust has been associated with occupational dust diseases and respiratory
problems.
Although all relevant ILO conventions have been ratified by Rwanda and there is a control structure in place,
the risk of labour exploitation in coffee remains high, as is also confirmed by the stakeholders in the sector.
Many sector actors feel that labour is used inefficiently. Workers are hardly skilled and often there are too
many labourers for the work at hand. Better planning and higher wages, combined with worker training, could
both improve efficiencies of the CWSs and improve the livelihoods of the labourers. On the downside it might
result in lower employment.
Child labour
Rwanda has ratified all key international conventions concerning child labour. A National Child Labour Survey
conducted by the National Institute of Statistics in Rwanda (NISR) in 2008 indicated that 11.2% of the children
(aged 5–17) are employed, and that 6.6% as work as child labourers, while 2.3% perform hazardous work. The
latter is most common among the older children aged 16–17 (LO/FTF Council , 2016). The survey (NISR, 2008)
indicated that 79.3% of child labour occurred in agriculture and that the Eastern province was the most
affected by child labour, followed by the Western Province and the Southern province.
Other data from UNESCO Institute of Statistics, collected in 2014, estimated that 5.2% of children aged 6–14
were employed (USDOL, 2016), over 151,000 individuals, some 69% of them working in agriculture.
Improvements have been made over the years. Enforcement and implementation of child labour laws and
regulations remain problematic (USDOL, 2016). Although the Ministry of Education established a policy that
provides free basic education for 12 years and aims to improve access to education by hiring new teachers
and building schools, in practice the costs of uniforms, school supplies, and unofficial school fees may preclude
some families from sending their children to school (USDOL, 2016).
There have not been any recent studies specifically on child labour in the coffee sector for Rwanda and we
have not found any project directly working on the prevention of child labour. It seems to be especially
prevalent on the tea plantations, which led to a Roundtable on the Elimination of Child Labour for sustainable
Tea Forum (REST). The majority of children affected are engaged in non-paid family work (64%). It is known
that smallholder coffee farms generally rely heavily on family labour, where child labour is most likely to occur.
Children involved in coffee production often take on a variety of tasks, including picking and sorting berries,
pruning trees, weeding, fertilising, and transporting beans and other supplies. Children are even more
vulnerable to the risks faced by adult workers in coffee production, particularly carrying heavy loads, exposure
to pesticides and dust, and injuries from sharp objects (Vérité, 2017).
The ministries responsible for enforcement of the laws against child labour are the Ministry of Public Service
and Labor (MIFOTRA), the Rwandan National Police (RNP), the National Public Prosecution Authority (NPPA)
and the Directorate General of Immigration and Emigration. Other ministries and agencies involved in
combatting child labour are the Ministry of Gender and Family Promotion (MIGEPROF) and the Ministry of
Education (MINEDUC). International agencies and NGOs involved, although none directly in coffee, are the
ILO, USDOL, WFP, UNICEF, Winrock, IMPAQ International, Save the Children, Caritas and World Vision.
Lack of a minimum wage, poor enforcement of labour laws, high migration levels from Burundi and a large
informal sector create a relatively high risk of labour exploitation and abuse in the sector.

Prepared by Page 56
2.7.2 Climate change
Climate change has impacted Rwanda and it has been confronted by floods resulting from heavy rainfall,
especially in the north-western highlands of Rwanda, and periodic droughts in the eastern and southern
regions (USAID, 2012). The variability of rainfall has a substantial impact on rain-fed agriculture, which also
includes coffee. Climate models suggest future increases of maximum and minimum temperatures, greater
annual average rainfall, and a shorter and more intense rainy season (USAID, 2012; Climate Expert, n.d.).
Coffee is highly sensitive to climate change. Models indicate that the impact of climate change will be highly
negative for arabica coffees, effectively reducing the areas suitable for production by 20–50% by 2050 (CGIAR,
2015). Impacts are highest in low latitudes and at low altitudes (Bunn, et al., 2015).
Weather index based insurance exists in Rwanda, and there have been multiple pilots, such as with
MicroEnsure and the IFC’s Global Index Insurance Facility (GIIF). Kilimo Salama is a partnership between the
Syngenta Foundation for Sustainable Agriculture, Rwandan insurer SORAS, international reinsurer Swiss Reit
and UAP Insurance Rwanda; the agriculture insurance product already launched in 2013. Crop insurance has
not yet reached a critical mass of farmers and could still be considered in its infancy stages.
In 2016 a project was set up called the Rwanda Climate Services for Agriculture. The project is a four-year
initiative (2016–2019) that seeks to transform Rwanda’s rural farming communities and national economy
through improved climate risk management. This project is supported by USAID/Rwanda and coordinated by
the CGIAR Research Program on Climate Change, Agriculture and Food Security (CCAFS) (CGIAR, 2016).
Other projects on climate change include ones initiated by Starbucks, Farmer Support Centre (FSC) in
collaboration with GIZ. The global programme Private Sector Adaptation to Climate Change (PSACC) supports
SMEs in using tools that allow them to analyse the impact that an increase in extreme weather events has on
production, sales, and on the delivery of primary products, energy and water. Parabolic drying is one of
mitigation measures introduced as a pilot at Muhondo coffee washing station. This technique allows the
number of drying days to be reduced from the usual 28 days to 8–12 days. This not only improves the coffee
washing station utilisation rate, but also improves the quality, extends the green coffee shelf life, as well as
providing a heavier body to the coffee cup profile.
In addition, Sustainable Harvest is involved in a pilot project with the Ministry of Agriculture, funded by
FONERWA, which involves the use of climate resilient seed varieties (RAB C15), the practice of inter-cropping
coffee bananas and shade trees, and training farmers in pest management and control to mitigate diseases.
2.7.3 Gender
A survey conducted by AGLC among more than a thousand households showed that 18.46% of the households
are headed by women (AGLC, 2017). The results show that these women are on average older than the men
(58 versus 49 years), are more illiterate, more likely to experience food shortages, have less land, higher costs
of production (+20%) and profit less from the coffee (−20%). Though they profit less from coffee, they have a
larger share of the income (49% versus 43% for men).
The 1999 succession law has improved the status of landownership among women in Rwanda and the mindset
has been changing due to extensive sensitisation efforts. Compared to men, women still often have
considerably less ownership and control of land, and they face significant barriers to accessing agriculture
training, improved agro-inputs and financial services. These challenges are often made even more difficult by
entrenched social norms and traditions (Technoserve, 2013), which are especially prevalent in the more rural
areas. When women in these cases do assert their rights to land, they face the traditional restrictions on

Prepared by Page 57
women’s access to dispute resolution institutions. Women who are even more vulnerable are ones in
“informal” marriages or consensual unions – including women in polygamous unions – who have virtually no
claims to the property their partners bring into the union (USAID, 2014).
As a cash crop, coffee is generally seen as a man’s crop, and income from the coffee cherry sales generally
goes directly to the man of the household, even though a large part of labour is done by women. The 2017
AGLC survey also confirmed that out of 420 households interviewed 57% of the men received the money and
about half of the time the household decides on what to do with the income from the sales.
In Rwanda, cooperatives may not be solely owned and managed by women groups, as it is an open entity
based on equity and equal participation. The cooperatives known as “women cooperatives” in the country are
cooperatives led by women, and have women chapters that supply the cherries to the CWS, which is then
processed and sold separately as “women-grown coffee”, thus adding value to the coffee. Only five to eight
cooperatives in the country are thought to be led by women. They are often supported by international
organisations. Sustainable Harvest is the most well-known organisation supporting women-grown coffees.
However, others in the sector have also started actively supporting women-grown coffees, including specialty
roasters.
Besides Sustainable Harvest (see also section 2.6.7), another organisation has been working intensively in the
coffee sector with women: the International Women’s Coffee Alliance (IWCA). IWCA was set up in 2003 by
women in Costa Rica, Nicaragua and the US. It leads women's empowerment in the international coffee
industry by supporting a global network of self-organised, self-governing organisations, called “IWCA
Chapters”. It now has chapters in 22 different countries including Rwanda (IWCA, 2018), where it was
registered as an NGO in 2013. CWSs that are supported by IWCA are Sake Coffee, SACOF Ltd and Hingakawa
Women Association.
Twin uses the GALS (Gender Action Learning System) approach in its activities, to promote gender inclusivity.
It is a community-led empowerment methodology that uses principles of inclusion to improve income, food
and nutrition security of vulnerable people in a gender-equitable way. GALS is often used complementary to
other value chain development approaches.
2.7.4 Youth
According to statistical data from the NISR (2017), a little over 1.5 million people aged 16–24 reside in the rural
areas. Average monthly cash income is RWF 16,900 for this group, with women earning 14% less than men
(NISR, 2017). About 35% is neither employed or in education. For youth, the main issue is the ability to
establish a suitable economic base to get married and start their own families. Lack of capital, primarily land,
is the main constraint they face (IFAD, 2010).
The coffee washing stations, when operational (4–5 months a year) provide considerable employment
opportunities for young men and women. According to IFAD (2010), 14% of the men aged 15–19 work as wage
labourers, as opposed to only 5% of the women in that age group. Casual labour on the large plantations and
at the coffee washing stations involves a large number of young men and women.
In line with the objectives of the EDPRS 2, MINAGRI – in close collaboration with the other relevant ministries
and organisations, such as the Ministry of Youth and ICT (MYICT), National Youth Council (NYC), Ministry of
Public Sector and Labour (MIFOTRA), Ministry of Trade and East African Community Affairs (MINEACOM),
development partners and the Private Sector Federation (PSF) – has set up the Rwanda Youth in Agribusiness
Forum (RYAF), which was launched in 2016.

Prepared by Page 58
The mission of the RYAF is to promote, inform, advocate and mobilise Rwandan youth in agribusiness,
leveraging on support and facilitation from stakeholders, resulting on a stable food market, decent jobs and
sustainable and inclusive development (RYAF, 2018). The RYAF is currently a nation-wide platform for youth
engaged in agribusiness, with elected representation in all districts and over 1,200 members throughout the
country, which are all youth engaged in agri-business. The RYAF is still a young organisation and provides an
opportunity for collaboration. Among others, they are supported by the FAO and USAID.
The labour opportunities for youth as workers are only temporary. The main constraint for youth wanting to
go into farming is access to land and capital.
AgriProFocus has regularly held different youth business events and hold finance networking days for better
access to finance. Agriterra has done similar things to promote youth involvement at its cooperatives.
Sustainable Harvest has been working on youth employment to a certain extent, by training baristas and
working on income diversification. COCAGI has worked on increasing access to land for youth by creating a
fund that allows land purchases and by providing training for young farmers.
Al though not directly related to the coffee sector, SNV has gained experience in supporting youth
employment initiatives under its Opportunities for Youth Employment (OYE) programme, funded by the
Mastercard Foundation. In the programme, SNV provided skills and capacity development (push factor), linked
youth to market opportunities for employment and enterprise development (match factor), and selected
opportunities in growth sectors that have concrete potential for employment creation (pull factor). They
worked with youth organisations, vocational training centres, local government and business associations to
identify young people who are out-of-school and unemployed, and then coordinate with training providers to
carefully screen and select disadvantaged young people to participate. The project just closed, but was
implemented in Tanzania, Rwanda and Mozambique. In Rwanda it was very much related to the Biogas sector.
2.7.5 Challenges summarised
There are opportunities to increase the sustainability of the sector. The following corporate social
responsibility (CSR) challenges were identified.
➢ Climate change threat to the coffee sector
➢ Climate change and youth employment not high priority in the coffee projects
➢ High risk of labour exploitation (working hours, low wages, health & safety) and child (family) labour
during harvesting
➢ Trade and labour unions not active in the coffee sector
➢ Women vulnerable group within coffee sector

Prepared by Page 59
Identification and Analysis of Opportunities and Obstacles
3.1 Mapping the value chain opportunities and obstacles
The below map shows the value chain obstacles and the supporters and influencers that are involved in
supporting the solutions. The relation between the different challenges can be found in Annex X.
Figure 290. Value chain map of opportunities and obstacles
3.2 Key opportunities & challenges
Given the limited area available for agricultural production and the fact it is a landlocked country, Rwanda has
difficulty competing on volume and price with the other countries in the region, so it makes sense – as was
mentioned in the conclusions of Element 1 – to focus on a differentiation strategy. Differentiation is
characterised by a deep and holistic understanding of customers, intensive brand build, jealously guarding
customers and commitment to innovation (Lafley & Martin, 2013). On a more strategic level, this is what
interventions in the coffee sector should ultimately aim towards to achieve differentiation.
Rwanda has a very favourable geographic profile and climatic conditions for producing high-quality arabica,
and the potential to achieve high returns from its participation in the global coffee market. It has developed
sufficient processing capacity by now to be able to further improve on its specialty qualities. In order to keep
Rwandan coffees on a competitive level, the following opportunities and challenges have been identified for
the sector.
3.2.1 Market demand
There is an increased demand for premium specialty coffees. Rwanda has already started to tap into this by
exporting small quantities of natural and honey processed coffees, and organic and roasted ones. In relation
Prepared by Page 60
to trends such as the Third Wave and upcoming feminism, Rwanda is also well placed: the coffee quality is
high, the supply chain is relatively transparent, the country is stable, it was ranked 4th on the Global Gender
Gap Index (2017) and it is already exporting women-grown coffees.
However, Rwanda is still seen as an exotic coffee supplier by European buyers, with a high risk of potato taste
defect. Opportunities in improving market demand lie in promoting Rwanda’s strengths in the European
market, and further adding value by improving existing qualities and introducing new qualities. This should be
combined with introducing technological innovations for further transparency and better storytelling
purposes.
3.2.2 Managing and improving coffee quality
As stated earlier, Rwanda produces relatively high-quality coffees; however, they do not differ sufficiently
from the other higher qualities that are offered in the region. Currently, coffee prices in Rwanda are rising and
quality improvements stagnating. To be able to sell Rwanda’s coffee at a higher premium, the efficiencies as
well as the quality needs to improve from farm level up. The following opportunities and related challenges
have been identified with regard to quality.
Quality management at farm level
As can be seen from Figure 29 (and as also identified in section 2.2.2), farmers face major challenges leading
to overall lack of motivation to grow coffee as a cash crop. The intervention approach on this level will need
to be a combination of managing technical productivity issues and price incentives. By focusing on quality and
rewarding quality, production levels are likely to go up as more value is added, and therefore there is more
incentive for producers to invest in their plantations.
As also mentioned in section 2.6.7, there are already quite a few actors working at this level, so collaboration
and coordination are a necessity, to maximise impact and prevent duplication.
Technical skills related to primary and secondary processing
The coffee washing infrastructure available is generally of high quality and provides potential for increasing
qualities from the CWSs. Challenges at CWS level are mostly related to lack of knowledge regarding quality
management, machine maintenance and infrastructural issues, such as a lack of drying tables and poor roads.
Good processing practices are needed to increase quality (and efficiencies), such as better cherry selection,
water usage, and proper drying and sorting prior to the milling. To make the needed improvements, the labour
used needs to become more skilled and have a better understanding of how processing influences quality.
Both the labour and the management would need to be trained in quality management, machine maintenance
and operations and new processing techniques, such as “natural” and “honey” that are currently trending.
Creating physical coffee cupping facilities, where qualities can be tested, would be an activity in support of
this.
3.2.3 Professionalisation of primary and secondary processing operations
Lack of business skills leads to high operating costs, limited access to finance, high risk of bankruptcy, a weak
negotiating position, and possible trust issues with buyers and farmers. To professionalise and increase
efficiencies, it is therefore necessary to improve both financial as well as marketing skills. This applies to both
the smaller processors and exporters, as well as the smaller private and cooperative CWSs.
Prepared by Page 61
Financial management skills
The main attention point with regard to financial management skills is financial literacy. This includes cost
control, and the capacity to develop bankable business plans and provide collateral. It also allows for the
financial transparency needed to solidify business relations.
The second financial skills gap is related to price risk management. Knowledge of markets and legal
frameworks is also required to help manage risks. The “Happy Goat” issue has clearly put forward this need
(section 2.3.1).
Marketing
To be able to market Rwanda as a unique and distinctive coffee, a deep understanding of the customers, a
strong brand and activities that promote customers loyalty are required.
Rwanda has developed a national coffee brand: Second Sunrise. However, as also concluded from Element 1,
the coffees need to be further differentiated as well, to improve marketing and promotion opportunities.
Stakeholders we spoke to indicated that the technical skills related to marketing and pricing are important,
but that there is also a great challenge when it comes soft skills. This relates to building business relationships,
and includes improving on communication styles and means.
Sector collaboration between sector SMEs
There is a lack of overall coordination, collaboration and sharing of information between the smaller CWSs.
They are very fragmented and need to strengthen their negotiation position in the market, allowing them to
also benefit from scale efficiencies. Improved collaboration would benefit skills development for the smaller
SMEs, both for learning as well as for joint marketing, if their business is too small to reach out to the
demanding export markets.
A market approach build on differentiation also means innovation. Therefore there is a need for the CWSs and
processors to be kept up to date on the latest innovations in coffee, so that they can be among the first to
experiment. Since Rwanda is small and relatively well connected, it is ideally positioned for this, although
collaboration would be needed in order to provide necessary volumes.
Transparency and traceability of dry mill operations
For CWSs, the losses occurring during the milling process are considerable when they do not own the mill.
Milling capacity is mainly concentrated in Kigali, and small CWSs neither control the process nor have sufficient
negotiation power to do so. Training CWSs on better understanding the milling process itself and improving
on increasing transparency at mill level (e.g. with improved ICT infrastructure) could support the CWSs in
better managing this process and reducing their milling losses.
3.2.4 Enabling environment
Conducive enabling environment
Rwanda has made impressive strides in improving the business environment and regulatory framework over
the last decade, including aggressive reforms that have impacted almost all aspects of its economic life. This
is also true for coffee. It brings opportunities, and makes the country easily accessible and welcoming to
foreigners on the lookout for coffee imports from Rwanda.
The government is well structured, capable and willing to provide support in further developing the sector.
Mobile and internet penetration is high in the country, and there are many new ICT developments, improving
access to information to actors in the value chain at a fast pace.
Prepared by Page 62
Opportunities lie in innovations and experimentation in the sector itself, involving production, processing,
M&E and marketing levels.
Possibility of synergies & partnerships
Many activities are ongoing, and currently a strategy is being drafted by various ministries, including those for
the coffee sector. This is therefore the best time to look for synergies between the coffee, tea and tourism
industries, for joint promotion.
Different international (regional) programmes are being initiated, which also include the coffee sector. One of
them is the new regional project MARKUP; for further information see also 2.6.7. Coordination is needed in
order to make interventions efficient and impactful.
3.2.5 CSR
The main corporate social responsibility (CSR) challenges identified were the threat of climate change and the
high risk of labour exploitation (working hours, low wages, health & safety) and child (family) labour during
harvesting. In section 2.7 more detail is provided on the risks and stakeholders involved. Gender and youth
employment are cross cutting issues and best practices from, for example, Sustainable Harvest and Twin could
be used.
Solutions with regard to labour issues should be sought in training labourers and CWSs on labour rights, as
well as increasing the skill level of labourers in coffee washing so that they become more valuable to the coffee
washing stations and higher wages could be asked. Rainforest Alliance/UTZ or Fairtrade certification for CWSs
provides support in preventing labour exploitation, as the standards apply strict criteria.
With regard to adapting to climate change, solutions should be sought in a combination of training both the
farmers and CWSs, combined with the introduction of new technologies (e.g. drying systems, weather apps)
and more resilient varieties.

Prepared by Page 63
Possible Interventions and Support Activities in the Value Chain
Element 4 of this value chain analysis comprises identifying interventions and support actions needed to seize
the key opportunities and tackle the key obstacles identified in Element 3, which are combined under the
following five headings:
1. Market demand
2. Managing and improving quality
3. Professionalisation of the sector
4. Enabling environment
5. CSR (section 4.1.2)
4.1.1 Interventions and support actions
The key actors mentioned in the below table are indicative and are based on those which have either already
shown their willingness to participate in a potential new project, or who were mentioned as key supporters
or influencers during our discussions with the sector.
VALUE CHAIN
CHALLENGES INTERVENTIONS KEY ACTORS OUTCOMES
1. Market demand 1.1 Promotion in Europe a) Promote Rwanda’s coffees in the European market (e.g. UK, France, Netherlands, Norway, Poland and others) by informing and introducing buyers to the Rwandan coffees
NAEB, CEPAR, Exporters with support of CBI
Increase demand in the EU market
1.2. Branding Standardisation and categorisation of product standards for branding and marketing purposes
NAEB, CEPAR, RCCF, RDB, RSB, CWS/Exporters, supported by CBI
Improved brand recognition for the Rwandan specialty coffees
2. Managing and improving quality
2.1. Quality performance management at farm level a) GAP training at farmer level
c) Quality control and management
d) Farm performance monitoring
NAEB, RYAF, Sustainable Harvest, Technoserve, Twin, Agriterra, Starbucks
Improved quality and volume of specialty grades >85
2.2. Value addition a) Train in e.g. natural and honey processing, coffee roasting, blockchain, storytelling; women-grown coffees, etc.
b) Support in obtaining certification: organic + RA/UTZ or Fairtrade
NAEB, CBI, European specialty green coffee buyers and micro-roasters, Technoserve, Twin, Sustainable Harvest, Starbucks, Progreso, other more experienced CWSs, etc.
Improved access to market
2.3. Technical skills development Training on coffee quality and coffee quality management (e.g. handling micro-lots, selection and sorting, water usage)
RYAF; Agriterra, Technoserve, Twin, Sustainable Harvest etc. local NGOs, private BSOs
Improved skills level for better management and sustainable business
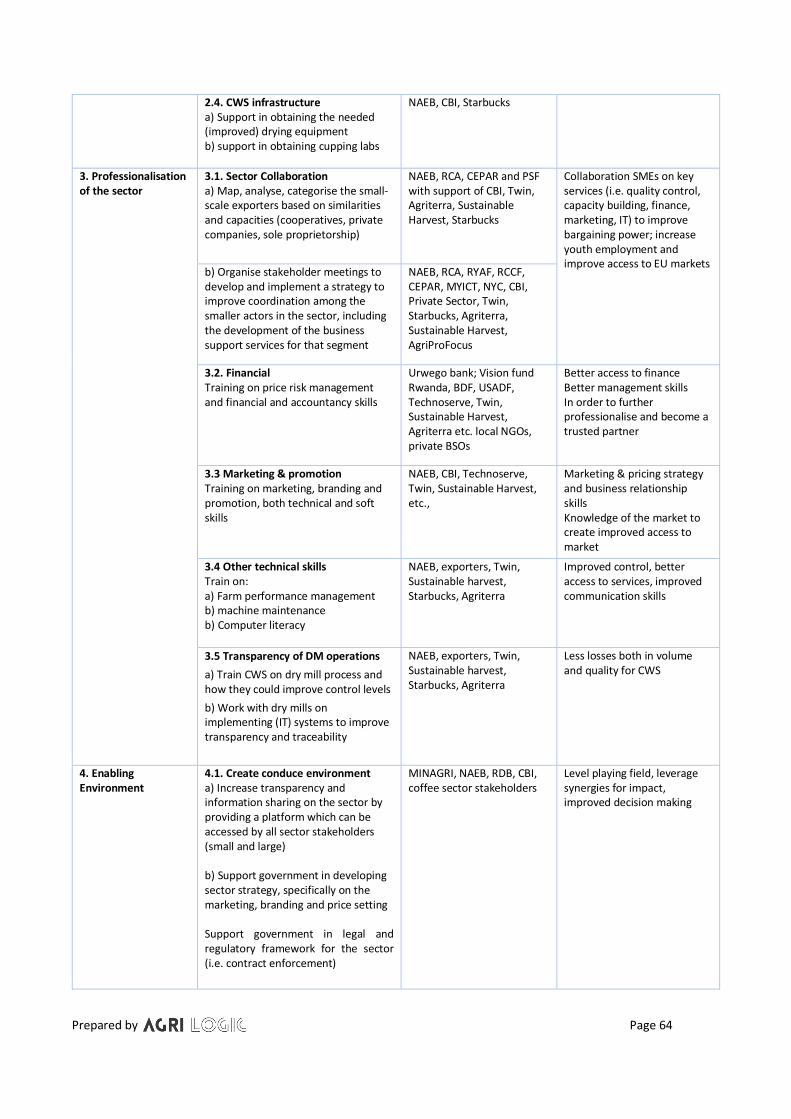
Prepared by Page 64
2.4. CWS infrastructure a) Support in obtaining the needed (improved) drying equipment b) support in obtaining cupping labs
NAEB, CBI, Starbucks
3. Professionalisation of the sector
3.1. Sector Collaboration a) Map, analyse, categorise the small-scale exporters based on similarities and capacities (cooperatives, private companies, sole proprietorship)
NAEB, RCA, CEPAR and PSF with support of CBI, Twin, Agriterra, Sustainable Harvest, Starbucks
Collaboration SMEs on key services (i.e. quality control, capacity building, finance, marketing, IT) to improve bargaining power; increase youth employment and improve access to EU markets
b) Organise stakeholder meetings to develop and implement a strategy to improve coordination among the smaller actors in the sector, including the development of the business support services for that segment
NAEB, RCA, RYAF, RCCF, CEPAR, MYICT, NYC, CBI, Private Sector, Twin, Starbucks, Agriterra, Sustainable Harvest, AgriProFocus
3.2. Financial Training on price risk management and financial and accountancy skills
Urwego bank; Vision fund Rwanda, BDF, USADF, Technoserve, Twin, Sustainable Harvest, Agriterra etc. local NGOs, private BSOs
Better access to finance Better management skills In order to further professionalise and become a trusted partner
3.3 Marketing & promotion Training on marketing, branding and promotion, both technical and soft skills
NAEB, CBI, Technoserve, Twin, Sustainable Harvest, etc.,
Marketing & pricing strategy and business relationship skills Knowledge of the market to create improved access to market
3.4 Other technical skills Train on: a) Farm performance management b) machine maintenance b) Computer literacy
NAEB, exporters, Twin, Sustainable harvest, Starbucks, Agriterra
Improved control, better access to services, improved communication skills
3.5 Transparency of DM operations
a) Train CWS on dry mill process and how they could improve control levels
b) Work with dry mills on implementing (IT) systems to improve transparency and traceability
NAEB, exporters, Twin, Sustainable harvest, Starbucks, Agriterra
Less losses both in volume and quality for CWS
4. Enabling Environment
4.1. Create conduce environment a) Increase transparency and information sharing on the sector by providing a platform which can be accessed by all sector stakeholders (small and large) b) Support government in developing sector strategy, specifically on the marketing, branding and price setting Support government in legal and regulatory framework for the sector (i.e. contract enforcement)
MINAGRI, NAEB, RDB, CBI, coffee sector stakeholders
Level playing field, leverage synergies for impact, improved decision making
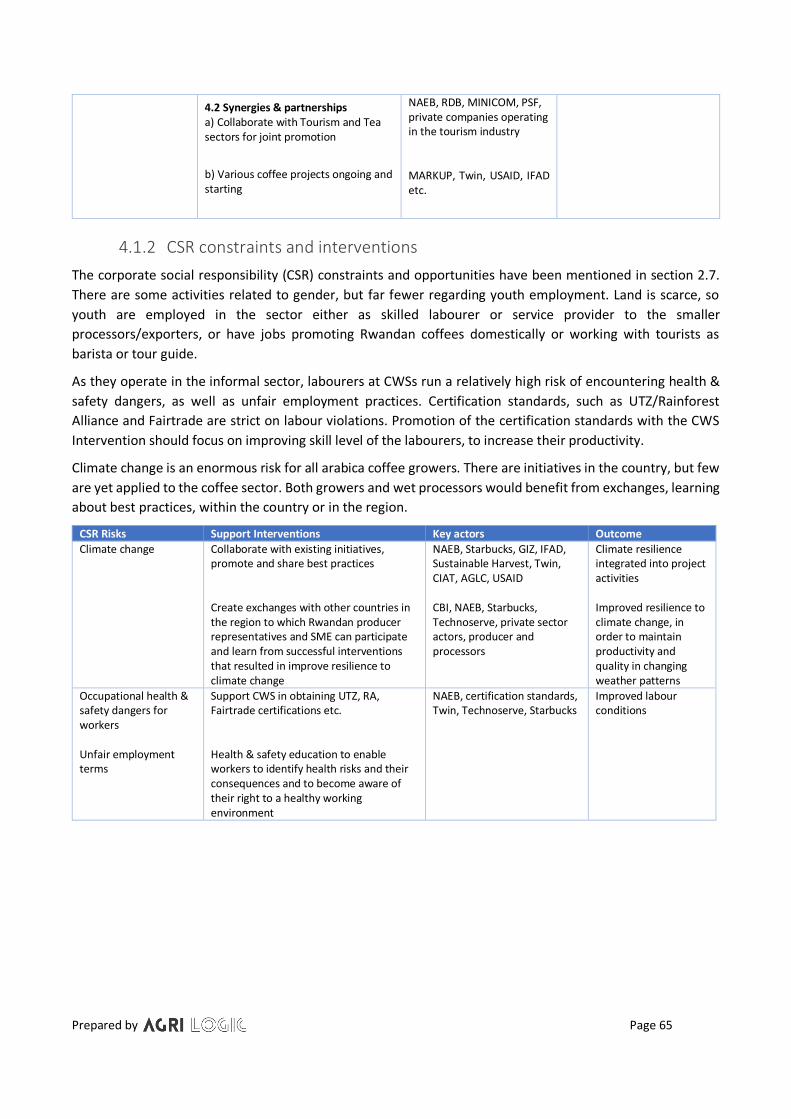
Prepared by Page 65
4.2 Synergies & partnerships a) Collaborate with Tourism and Tea sectors for joint promotion
b) Various coffee projects ongoing and starting
NAEB, RDB, MINICOM, PSF, private companies operating in the tourism industry MARKUP, Twin, USAID, IFAD etc.
4.1.2 CSR constraints and interventions
The corporate social responsibility (CSR) constraints and opportunities have been mentioned in section 2.7.
There are some activities related to gender, but far fewer regarding youth employment. Land is scarce, so
youth are employed in the sector either as skilled labourer or service provider to the smaller
processors/exporters, or have jobs promoting Rwandan coffees domestically or working with tourists as
barista or tour guide.
As they operate in the informal sector, labourers at CWSs run a relatively high risk of encountering health &
safety dangers, as well as unfair employment practices. Certification standards, such as UTZ/Rainforest
Alliance and Fairtrade are strict on labour violations. Promotion of the certification standards with the CWS
Intervention should focus on improving skill level of the labourers, to increase their productivity.
Climate change is an enormous risk for all arabica coffee growers. There are initiatives in the country, but few
are yet applied to the coffee sector. Both growers and wet processors would benefit from exchanges, learning
about best practices, within the country or in the region.
CSR Risks Support Interventions Key actors Outcome
Climate change Collaborate with existing initiatives, promote and share best practices Create exchanges with other countries in the region to which Rwandan producer representatives and SME can participate and learn from successful interventions that resulted in improve resilience to climate change
NAEB, Starbucks, GIZ, IFAD, Sustainable Harvest, Twin, CIAT, AGLC, USAID CBI, NAEB, Starbucks, Technoserve, private sector actors, producer and processors
Climate resilience integrated into project activities Improved resilience to climate change, in order to maintain productivity and quality in changing weather patterns
Occupational health & safety dangers for workers Unfair employment terms
Support CWS in obtaining UTZ, RA, Fairtrade certifications etc. Health & safety education to enable workers to identify health risks and their consequences and to become aware of their right to a healthy working environment
NAEB, certification standards, Twin, Technoserve, Starbucks
Improved labour conditions

Prepared by Page 66
CSR Opportunities Interventions Key actors Outcome
Youth employment Where there is a demand for employment, support interventions that create youth employment, such as: business support activities for CWSs and/or exporters; extension services; skilled labour at CWSs; activities related to the promotion of domestic coffee consumption and/or in tourism, etc.
NAEB, RDB, MYICT, NYC, RYAF, (I)NGOs, SMEs, CBI could promote the use of youth in interventions described in 4.1.1
Increased youth employment
Gender inclusion All activities include best practices from current projects that apply a gender inclusive approaches Support of women-grown coffee initiatives
MIGEPROF, Sustainable Harvest, Twin, Technoserve, CWS/Exporters. CBI could support the CWSs and exporters in developing and marketing women-grown coffees
Women benefit equally from the programme
4.1.3 Risk assessment
Rwanda is a country that has received quite a lot of aid in the past few decades, which includes the coffee
sector. There are many actors and many projects, and for a large part the political environment determines
how the value chain is and will be faring. Therefore it is important that the design of a project has the full
support of government from the start, or else the risk of failing is high.
MARKUP is a large project, currently putting out its tenders; it is important to be kept well informed on
activities and the actors involved, as there is likely to be overlap, therefore synergies should be sought.
The US is a well-known market to the Rwandans and the coffees are also much appreciated by the consumers
there. Asia and Oceania are becoming fast growing markets for coffee, given their increasing numbers of
consumers, and there are already quite a few actors from these regions promoting these markets. It is unlikely
that efforts put into the specialty coffee sector will only benefit one market, which in the case of CBI is the EU.
Risk Impact Likelihood Mitigation
Interventions will benefit other markets than the EU and will not reach CBI’s target of growth in export to Europe
L H Involve specialty buyers from Europe at an early stage in the design and support of the project
No synergies between MARKUP and other coffee projects H M
Assign one person who is regularly in contact with the main coffee projects in the country and align on activities
Resistance to team up in the sector/share information/collaborate H M
Involve the NAEB from the start, as well as the other sector platforms such as CEPAR and RCCF
Resistance to change by sector actors H M
Involve the NAEB from the start, as well as the other sector platforms such as CEPAR and RCCF
Political instability
H L
Plan activities after parliamentary elections in 2018 and end programme before presidential election in 2025
Reputation risk due to labour exploitation at CWSs and child labour risk at farm level
H M/H
Involve relevant stakeholders in providing education on labour rights and health & safety, certify the SMEs involved in the programme. Use platforms for awareness raising
Prepared by Page 67
Conclusions Europe is the largest coffee market, accounting for more than 50% of global consumption. Although
traditionally Rwanda has sold most of its specialty coffees to the US market, there is a clear trend observable
in Europe towards coffee market premiumisation. Although demand is rising, Rwandan specialty coffees is still
seen as an exotic coffee, and also as a “risky” coffee because of the potato taste defect (PTD), which is still
very much associated with it.
Though most buyers are of the opinion that the qualities of the coffees produced in Rwanda are high, the
unique flavour is something the European roasters and green been traders found difficult to agree upon. There
is strong competition from other producing countries in the region, which have higher volumes (more
flexibility) and are said to offer more unique flavour profiles and/or character. However, Rwanda does have a
few other advantages it can compete on: the coffee pricing is still attractive, though going up; it has good
processing infrastructure; it produces a relatively consistent high quality, with a large potential to further
improve; it provides easy access to buyers; and there is a story to tell.
There is ample opportunity to grow market demand for Rwandan coffees, if quality continues to improve,
product differentiation is promoted and PTD is further controlled.
On the production side, there is an asymmetry to be observed between the fragmented small CWSs and the
other concentrated processors and exporters. Rwanda’s coffee industry is dominated by a few medium to
large processors and exporters. This significantly impacts the competitive position of the smaller processors.
Their bargaining power has gone down, compared to that of the buyers, while the rivalry among the existing
competitors has increased. The smaller processors and exporters are truly struggling in this environment,
making them vulnerable to default and bankruptcy.
To support these smaller processors and exporters in accessing the specialty market in Europe, where the
value for these coffees lies, it will be necessary to work on professionalising this segment and helping to
strengthen their position in the local market. This also means continuing to address the shortcomings in the
value chain, such as low skill levels, high processing costs, scarcity and inconsistent quality of raw material,
and poor access to finance. The main intervention strategies should focus on supporting better coordination
of the smaller processors and exporters and support them in increasing qualities and efficiencies, as well as
working on improving their management and technical skills, which includes marketing and promotion and
developing the soft skills to help build long-term relationships, an important attribute of the specialty sector.
Prepared by Page 68
References
AGLC, 2017. Guiding Question: How Might We Explore Improvements to Input Delivery? Innovation Lab for
Food Security Policy / African Great Lakes Region Coffee Support Program (AGLC) / Policy Advocacy
Roundtable on Farmer Investments in Coffee June, Volume Backgounder 4.
AGLC, 2017. Pricing Coffee Cherry to Incentivize Farmers and Improve Quality. Feed the Future Innovation
Lab for Food Security Policy Research Brief 43. East Lansing: Michigan State University. [Online]
Available at: http://foodsecuritypolicy.msu.edu/uploads/resources/Policy_Brief_43.pdf
[Accessed June 2018].
AGLC, 2017. Topic: Challenges and Opportunities for Women in the Rwandan Coffee Sector. Feed the Future
Africa Great Lakes Region Coffee Support Program (AGLC) Policy Roundtable. Michigan State
University. [Online]
Available at:
http://foodsecuritypolicy.msu.edu/uploads/resources/RW_Gender_RW_July_2017_Puebla_for-
Print.pdf
[Accessed June 2018].
Amazon, n.d. aylors of Harrogate Rwanda Lake Kivu Coffee Beans 1 kg. [Online]
Available at: https://www.amazon.co.uk/Taylors-Harrogate-Rwanda-Coffee-Beans/dp/B00QQB85Y0
APA News, 2018. Rwanda Internet Penetration Hits 47.8 Percent. [Online]
Available at: http://apanews.net/index.php/en/news/rwandas-internet-penetration-hits-478-percent
[Accessed July 2018].
Bloomberg Quint, 2017. Latte Lovers From Moscow to Prague Driving Coffee-Chain Boom. [Online]
Available at: https://www.bloombergquint.com/markets/2017/12/13/latte-fans-from-moscow-to-
prague-help-drive-coffee-chain-boom
[Accessed July 2018].
Bloomberg, 2018. Coffee Waste Is Now Fetching a 480% Premium Over Coffee Itself. [Online]
Available at: https://www.bloomberg.com/news/articles/2018-05-22/coffee-waste-is-now-fetching-a-
480-premium-over-coffee-itself
[Accessed June 2018].
Bunn, C., Läderlach, P., Rivera, O. O. & Kirschke, D., 2015. A Bitter Cup: Climate Change Profile of Global
Production of Arabica and Robusta Coffee. Climatic Change, 129(DOI 10.1007/s10584-014-1306-x), pp.
89-101.
CBI, 2018. What is the Demand for Coffee in Europe? [Online]
Available at: https://www.cbi.eu/market-information/coffee/trade-statistics/
[Accessed June 2018].
CBI, 2018. Which Trends Offer Opportunities on the European Coffee Market? [Online]
Available at: https://www.cbi.eu/market-information/coffee/trends/
CGIAR, 2015. Climate Change Impacts on African Crop Production. Working Paper No. 19. [Online]
Available at: https://ccafs.cgiar.org/blog/crops-under-changing-climate-what-are-impacts-
africa#.WuBhzpco_b0
[Accessed June 2018].

Prepared by Page 69
CGIAR, 2016. Building Climate Services Capacity in Rwanda. [Online]
Available at: https://ccafs.cgiar.org/building-climate-services-capacity-rwanda#.WzzzAdIzaUk
[Accessed June 2018].
Clay, D. et al., 2016. Determinants of Farmer Investment in Coffee Production:Finding a Path to Sustainable
Growth in Rwanda's Coffee Sector. Research Paper 32. East Lansing: Michigan State University.
[Online]
Available at: http://foodsecuritypolicy.msu.edu/uploads/resources/FSP_Research_Paper_32.pdf
[Accessed June 2018].
Clay, D. C. & Bizoza, A., 2018. The Challenge to Sustainable Growth in Rwanda’s Coffee Sector. Feed the
Future Innovation Lab for Food Security Policy Research Paper 100. East Lansing: Michigan State
University.. [Online]
Available at: http://foodsecuritypolicy.msu.edu/uploads/resources/FSP_Research_Paper_100.pdf
[Accessed June 2018].
Climate Expert, n.d. Climate Risk Management & Business Opportunities – Agro Processing of Tea and Coffee
in Rwanda – Why Adaptation to Climate Change Matters for Businesses! Implemented by GiZ in
cooperation with Adelphi. [Online]
Available at: https://www.climate-
expert.org/fileadmin/user_upload/Infosheet_Climate_Expert_Rwanda_Agro_EN.pdf
Coffee Barometer, 2018. hivos.org. [Online]
Available at: https://hivos.org/sites/default/files/coffee_barometer_2018.pdf
[Accessed June 2018].
Coffeetransparency.com, n.d. Technoserve – Coffee Transparency. [Online]
Available at: http://www.coffeetransparency.com/c/rw/
CSR Risk Check, 2018. Rwanda Coffee and Coffee Subsitutes, s.l.: MVONederland & Ministry of Foreign
Affairs.
FiBL & IFOAM, 2018. The World of Organic Agriculture – Statistics & Emerging Trends. [Online]
Available at: https://shop.fibl.org/CHen/mwdownloads/download/link/id/1093/?ref=1
[Accessed June 2018].
GCP, 2016. African Coffee Investment Agenda – Rwanda. [Online]
Available at: http://www.globalcoffeeplatform.org/assets/files/Documents/African-Coffee-
Investment-Agendas/African-Coffee-Investment-Agendas_Rwanda_Full_Report.pdf
Gerard, A. & Bigirimana, J., 2018. Mitigating Antestia Bug Damage and the Potato Taste Defect in Rwandan
Coffee. Feed the Future Innovation Lab for Food Security Policy Research Brief 63. East Lansing:
Michigan State University. [Online]
Available at: http://foodsecuritypolicy.msu.edu/uploads/resources/Policy_Brief_63.pdf
[Accessed June 2018].
Gerard, A., Clay, D. C. & Claudia Lopez, M., 2017. Stakeholder Perceptions on Geographic Zoning in Rwanda’s
Coffee Sector Feed the Future Innovation Lab for Food Security Policy Research Brief 42. East Lansing:
Michigan State University. [Online]
Available at: http://foodsecuritypolicy.msu.edu/uploads/resources/Policy_Brief_42.pdf
[Accessed June 2018].

Prepared by Page 70
Giacalone, D., Reinhold Fosgaard, T., Steen, I. & Münchow, M., 2016. “Quality Does Not Sell Itself”:
Divergence Between “Objective” Product Quality and Preference for Coffee in Naïve Consumers. British
Food Journal, Vol. 118 Issue: 10, pp.2462-2474, Emerald Group Publishing Limited 2016. [Online]
Available at: https://www.emeraldinsight.com/doi/abs/10.1108/BFJ-03-2016-0127
GKI, 2014. On the Path to Eliminating Coffee Potato Taste Defect. [Online]
Available at: http://globalknowledgeinitiative.org/2014/12/21/on-the-path-to-eliminating-coffee-
potato-taste-defect/
[Accessed June 2018].
GlobalTrade, 2017. Six Global Supply Chain Trends to Watch in 2018. [Online]
Available at: http://www.globaltrademag.com/global-trade-daily/commentary/six-global-supply-
chain-trends-watch-2018
[Accessed June 2018].
GoR, 2017 draft. National Strategy for Transformation and Prosperity (NSTP 1), s.l.: s.n.
GSMA, 2018. The Mobile Economy. [Online]
Available at: https://www.gsma.com/mobileeconomy/
[Accessed June 2018].
Hakorimana, F. & Akcaoz, H., 2017. The Climate Change and Rwandan Coffee Sector. Turkish Journal of
Agriculture – Food Science and Technology, 5(10), pp. 1206-2015.
ICO, 2017. Historical Data on the Global Coffee Trade. [Online]
Available at: http://www.ico.org/new_historical.asp
ICO, 2018. Development of Coffee Trade Flows. [Online]
Available at: http://www.ico.org/documents/cy2017-18/icc-121-4e-trade-flows.pdf
[Accessed June 2018].
ICO, 2018. World Coffee Consumption. [Online]
Available at: http://www.ico.org/prices/new-consumption-table.pdf
[Accessed June 2018].
IFAD, 2010. Gender and Study Report: Youth in the Tea and Coffee Value Chains – Smallholder Cash and
Export Crops Development (PDCRE). [Online]
Available at: https://www.ifad.org/documents/10180/518776af-1649-4613-bdee-7702d53c97e5
[Accessed June 2018].
ITC News, 2018. MARKUP Initiative to Boost Market Access to Europe for East African SMEs. [Online]
Available at: http://www.intracen.org/news/MARKUP-initiative-to-boost-market-access-to-Europe-
for-East-African-SMEs/
[Accessed June 2018].
ITC, 2011. The Coffee Exporter’s Guide – Third Edition. [Online]
Available at: http://www.intracen.org/The-Coffee-Exporters-Guide---Third-Edition/
ITC, 2017. ITC’s SheTrades Initiative Launched in Rwanda. [Online]
Available at: http://www.intracen.org/news/ITCs-SheTrades-initiative-launched-in-Rwanda/
[Accessed July 2018].

Prepared by Page 71
ITC, 2017. Trade Map. [Online]
Available at: www.trademap.org
IWCA, 2018. International Women's Coffee Alliance. [Online]
Available at: https://www.womenincoffee.org/what-we-do/
JICA, 2014. Data Collection Survey on Coffee Growing and Marketing in the Republic of Rwanda. Japan
International Cooperation Agency (JICA) Africa Department. [Online]
Available at: http://open_jicareport.jica.go.jp/pdf/1000016725.pdf
[Accessed June 2018].
Lafley, A. & Martin, R. L., 2013. Playing to Win: How Strategy Really Works. 1st editition ed. s.l.:Harvard
Business Review Press.
LMCP, 2015. Unlikely Heroes Fighting the Potato Defect. [Online]
Available at: http://www.longmilescoffeeproject.com/heroes-fighting-potato-defect/
[Accessed June 2018].
LO/FTF Council , 2016. Labour Market Profile Danish Trade Council. [Online]
Available at:
http://www.ulandssekretariatet.dk/sites/default/files/uploads/public/PDF/LMP/lmp_rwanda_2016_fi
nal.pdf
[Accessed June 2018].
Macchiavello, R. & Morjaria, A., 2015. Coffee Washing Stations Rwanda. [Online]
Available at: https://www.theigc.org/wp-content/uploads/2015/02/Macciavello-and-Morjaria-2015-
Project-Memo.pdf
[Accessed June 2018].
Machiavello, R. & Morjaria, A., 2017. Competition and Relational Contracts: Evidence from Rwanda's Coffee
Mills. [Online]
Available at: https://cepr.org/sites/default/files/Morjaria,%20Ameet.pdf
McKinsey&Company, 2018. Blockchain Beyond the Hype: What Is the Strategic Business Value? [Online]
Available at: https://www.mckinsey.com/business-functions/digital-mckinsey/our-insights/blockchain-
beyond-the-hype-what-is-the-strategic-business-value
[Accessed June 2018].
MINAGRI, 2016-2020. National ICT Strategy for Rwanda Agriculture (2016–2020). [Online]
Available at:
http://www.minagri.gov.rw/fileadmin/user_upload/documents/policies_and_strategy/ICT4RAg_STRA
TEGIC_PLAN_2016-2020_final__final__3_.pdf
[Accessed June 2018].
MINAGRI, 2017. PSTA 4 – Strategic Plan for Agricultural Transformation 2018–24, s.l.: Ministry of Agriculture
and Animal Resources Rwanda.
MINAGRI, 2018. Rwandan Farmers Cheerful as Coffee Prices Increase. [Online]
Available at:
http://www.minagri.gov.rw/index.php?id=469&tx_ttnews%5Btt_news%5D=1486&cHash=a499b61a4
3283799c9ef0a5dd9f54c6e

Prepared by Page 72
NAEB, 2012. Annual Report 2011–2012. [Online]
Available at: http://www.naeb.gov.rw/fileadmin/Reports-Annual/ANNUAL_REPORT_2011-2012.pdf
NAEB, 2013. Annual Report 2012–2013. [Online]
Available at: http://www.naeb.gov.rw/fileadmin/Reports-Annual/ANNUAL_REPORT_2012-2013.pdf
NAEB, 2014. Annual Report 2013–2014. [Online]
Available at: http://www.naeb.gov.rw/fileadmin/Reports-Annual/ANNUAL_REPORT_2013-2014.pdf
NAEB, 2015. Annual Report 2014–2015. [Online]
Available at: http://www.naeb.gov.rw/index.php?id=171
NAEB, 2016. Annual Report 2015–2016. [Online]
Available at: http://www.naeb.gov.rw/fileadmin/Reports-Annual/ANNUAL_REPORT_2015-2016..pdf
NAEB, 2017. Annual Report 2016–2017. [Online]
Available at: http://www.naeb.gov.rw/fileadmin/Reports-Annual/ANNUAL_REPORT_2016-2017.pdf
NAEB, 2017. NAEB Medium Term Strategic Plan 2018–2024, s.l.: NAEB.
NISR, 2017. Labour Force Survey. [Online]
Available at: http://www.statistics.gov.rw/datasource/labour-force-survey-2017
[Accessed June 2018].
OEC, 2016. Rwanda. [Online]
Available at: https://atlas.media.mit.edu/en/profile/country/rwa/
[Accessed June 2018].
OEC, 2016. Where Does the United Kingdom Import Coffee From? (2016). [Online]
Available at: https://atlas.media.mit.edu/en/visualize/tree_map/hs92/import/gbr/show/0901/2016/
[Accessed June 2018].
Oxfam Novib, 2014. Gender Action Learning System, Practical Guide for Transforming Unequal Power
Relations in Value Chains. [Online]
Available at:
https://www.oxfamnovib.nl/Redactie/Downloads/English/publications/150115_Practical%20guide%2
0GALS%20summary%20Phase%201-2%20lr.pdf
[Accessed July 2018].
Panhuysen, S. & Pierrot, J., 2018. Coffee Barometer 2018. [Online]
Available at: https://hivos.org/sites/default/files/coffee_barometer_2018.pdf
[Accessed June 2018].
Perfect Daily Grind, 2017. What Is “Third Wave Coffee” & How Is It Different to Specialty? [Online]
Available at: https://www.perfectdailygrind.com/2017/04/third-wave-coffee-different-specialty/
[Accessed June 2018].
PerfectDailyGrind, 2017. Is Cascara ACTUALLY Banned? Mixed Messages in the EU. [Online]
Available at: https://www.perfectdailygrind.com/2017/03/cascara-banned-mixed-messages-eu/
[Accessed June 2018].
PerfectDailyGrind, 2017. Micro Lot vs Macro Lot: What’s the Difference? [Online]
Available at: https://www.perfectdailygrind.com/2017/12/micro-lot-vs-macro-lot-whats-difference/
[Accessed June 2018].

Prepared by Page 73
PerfectDailyGrind, 2017. Should Natural Coffees Be Judged Differently? [Online]
Available at: https://www.perfectdailygrind.com/2017/02/natural-coffees-judged-differently/
[Accessed June 2018].
PerfectDailyGrind, 2017. Yellow, Red, & Black Honey Processed Coffees: What’s the Difference? [Online]
Available at: https://www.perfectdailygrind.com/2017/02/yellow-red-black-honey-processed-coffees-
whats-difference/
[Accessed June 2018].
Royal, 2018. Potato Taste Defect: What Roasters Need to Know. [Online]
Available at: https://royalcoffee.com/potato-taste-defect-what-roasters-need-to-know/
[Accessed June 2018].
RURA, 2018. Annual Report 2016-2017, s.l.: Rwanda Utilities Regulatory Authority.
RYAF, 2018. About Ryaf. [Online]
Available at: www.ryaf.rw
[Accessed June 2018].
SCA, 2014. Risk, Responsibility, and Potatoes? A Rwandan Coffee Story. [Online]
Available at: http://www.scanews.coffee/2014/07/07/risk-responsibility-and-potatoes-a-rwandan-
coffee-story/
[Accessed June 2018].
SCA, 2017. SCA News. [Online]
Available at: http://www.scanews.coffee/2017/11/28/2017-western-european-coffee-market-size-
report/
[Accessed June 2018].
SCA, 2018. An SCA White Paper: Gender Equality and Coffee: Minimizing the Gender Gap in Agriculture.
[Online]
Available at: https://www.scaa.org/PDF/scaa-white-paper-gender-equality.pdf
[Accessed June 2018].
SCC, 2018. The Sustainable Coffee Challenge. [Online]
Available at: https://www.sustaincoffee.org/commitments/
[Accessed June 2018].
Simsch, S., 2014. Seattle Coffee Works Blog What on Earth Is Honey Process? [Online]
Available at: http://blog.seattlecoffeeworks.com/roastery/earth-honey-process/
[Accessed June 2018].
Starbucks, 2018. Starbucks to Pilot "Bean to Cup" Traceability with New Technology. [Online]
Available at: https://news.starbucks.com/news/starbucks-to-pilot-bean-to-cup-traceability
[Accessed June 2018].
Technoserve, 2013. The Coffee Initiative 2008-2011: Lessons Learned. [Online]
Available at: http://www.technoserve.org/files/downloads/coffee-initiative-lessons-learned.pdf
[Accessed June 2018].
The Perfect Daily Grind, 2016. Washed, Natural, Honey: Coffee Processing 101. [Online]
Available at: https://www.perfectdailygrind.com/2016/07/washed-natural-honey-coffee-processing-
Prepared by Page 74
101/
[Accessed July 2018].
The Times, 2018. Waste from Coffee Plants Is New Gold Blend Amid Bean Price Crash. [Online]
Available at: https://www.thetimes.co.uk/article/waste-from-coffee-plants-is-new-gold-blend-amid-
bean-price-crash-dt9cwntpm
[Accessed June 2018].
TheDailyMeal, 2018. Starbucks To Roll Out 2 New Cold Foam Tea Lemonades. [Online]
Available at: https://www.thedailymeal.com/drink/starbucks-cold-foam-lemonade/062118
[Accessed June 2018].
TripleLine, 2017. Evaluation of the TechnoServe East Africa Coffee Initiative. [Online]
Available at: http://www.technoserve.org/files/downloads/triple-line-evaluation-of-the-coffee-
initiative.pdf
[Accessed July 2018].
Twin & TMEA, 2018. Coffee Export Capabilities. [Online]
Available at: http://www.twin.org.uk/assets/TWIN-TMEA-Export-Capability-Study-narrative-report-
final.pdf
Uhlenbrock, S., 2014. F.O. Licht Commodity Analysts – World Supply and Demand Outlook – ICO Coffee
Seminar. [Online]
Available at: http://www.ico.org/documents/cy2013-
14/presentations/seminar%20march%202014%20presentations/seminar-march2014-stefan-
uhlenbrock-e.pdf
[Accessed June 2018].
Union, 2018. Blends. [Online]
Available at: https://www.unionroasted.com/coffees/blends.html
USAID, 2012. Climate Change Adaptation in RWANDA. [Online]
Available at:
https://www.climatelinks.org/sites/default/files/asset/document/rwanda_adaptation_fact_sheet_jan
2012.pdf
[Accessed June 2018].
USAID, 2014. The Gendered Nature of Land and Property Rights in Post-Reform Rwanda. [Online]
Available at: https://www.land-links.org/wp-
content/uploads/2016/09/USAID_Land_Tenure_Rwanda_LAND_Report_Gendered_Nature_Land_Righ
ts.pdf
[Accessed June 2018].
USAID, n.d. Climatelinks: Rwanda. [Online]
Available at: https://www.climatelinks.org/countries/rwanda
[Accessed June 2018].
USDOL, 2016. Findings on the Worst Forms of Child Labor. [Online]
Available at: http://www.refworld.org/pdfid/5448a85f0.pdf
[Accessed June 2018].
Prepared by Page 75
Vérité, 2017. Summary of Key Trafficking in Persons Issues in Coffee Production. [Online]
Available at: https://www.verite.org/africa/explore-by-commodity/coffee/
[Accessed June 2018].
Weissman, M., 2017. Is Direct Trade Fair? [Online]
Available at: https://sprudge.com/is-direct-trade-fair-110410.html
[Accessed June 2018].
World Economic Forum, 2017. Global Gender Gap Report, Insight Report. [Online]
Available at: http://www3.weforum.org/docs/WEF_GGGR_2017.pdf
[Accessed July 2018].
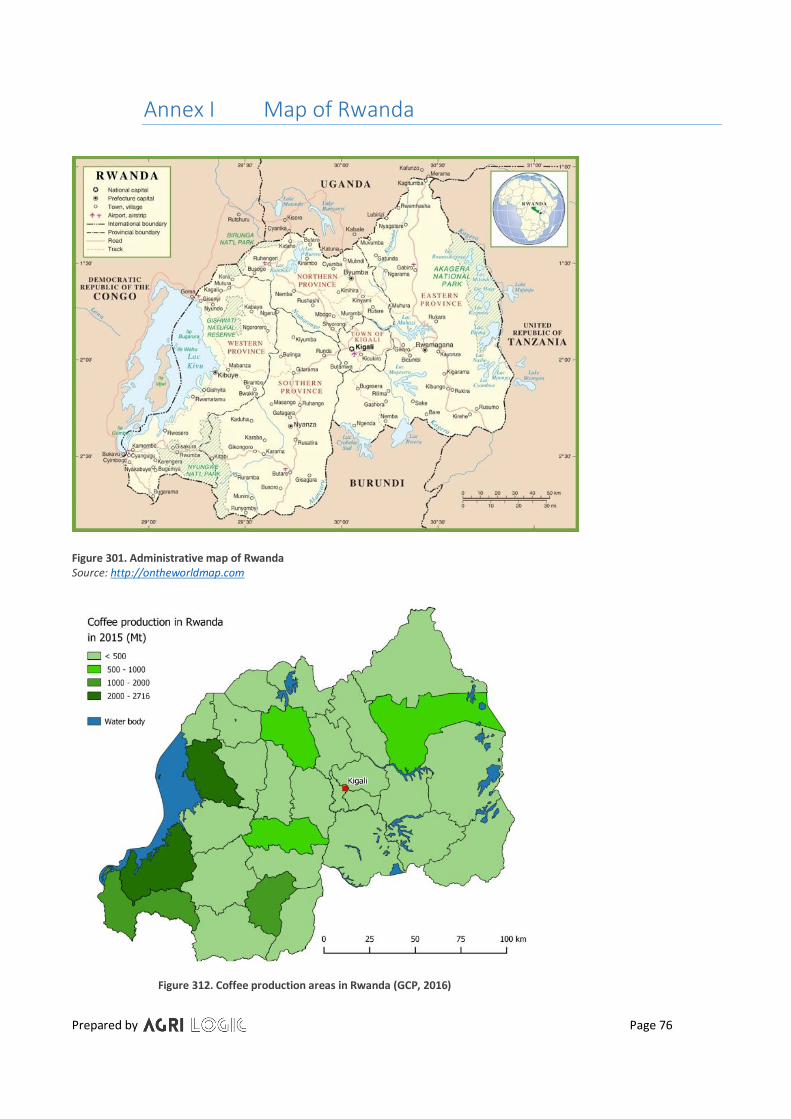
Prepared by Page 76
Annex I Map of Rwanda
Figure 301. Administrative map of Rwanda Source: http://ontheworldmap.com
Figure 312. Coffee production areas in Rwanda (GCP, 2016)

Prepared by Page 77
Annex II List of Exporters (2017)
No REGISTERED EXPORTER Coop/Private
Size* CWS DM Export to** Observations Exported in 2017
1 1000 Hills Products Rwanda Ltd.
✓
2 AMAYAGA HIGHLANDS COFFEE LTD P
3 ARABICA COFFEE COOPERATIVE P Republic of Korea
4 BIG COFFEE LTD P III Gabon, Uganda
✓
5 BOURBON COFFEE P II Switzerland
✓
6 BOND COFFEE EXPORTERS P III
✓
7 BUJYUJYU COFFEE P III ✓
✓
8 CAFÉ DE GISAGARA LTD P Republic of Korea NGO from Korea Project
9 COCAMU P
COCAMU is a farmer-owned coffee cooperative operating a CWS since 2007
10 Coffee & Tea Africa (COFTERICA) LTD P II Republic of Korea, DRC
✓
11 COFFEE BUSINESS CENTER LTD (CBC) P I ✓ ✓ Belgium, Australia, Switzerland, USA Rwandan. Main importer for Sustainable Harvest ✓
12 Coopérative pour La promotion des Activités Café (COOPAC)
P I ✓ ✓ USA, Switzerland, Italy Rwandan. Partners: USAID and ACDI VOCA ✓
13 CYAHINDA COFFEE P III ✓ Japan
✓
14 DALLAS Investments Ltd P III ✓ South Africa
✓
15 DORMANS P I ✓ ✓ Singapore, UK
✓
16 EASY WAY LTD P USA, Singapore
17 Ets NKUBILI Alfred & SONS (ENAS CAFFEX)
P I ✓ ✓ Switzerland, Singapore Rwandan. Also does soil analysis and soil fertilisers and dairy & beef farming. Works with Dutch organisation SoilCares
✓
18 FARMER TO CUSTOMER P Germany
19 GIC CO. LTD P Uganda
✓
20 GOMA DUTY FREE LTD P III USA International ✓
21 Greater International Grain (G.I.G) CO. LTD
P Republic of Korea
22 GREEN LAND COFFEE CO. LTD P III Uganda
✓
23 Green Mountain Coffee P III ✓ Uganda Rwandan ✓
24 HIDDEN WEALTH Ltd P Finland, Switzerland
25 HIROES COFFEE LTD P

Prepared by Page 78
26 IMPEXCOR P I ✓ ? Switzerland, Australia Supported by Oikocredit loan of USD 1,000,000 ✓
27 INGOBOKA Cooperative LTD P
28 John's Coffee company Ltd. P
29 JURU Coffee P II ✓ Japan
✓
30 K.A.M.G Ltd P Republic of Korea, DRC
✓
31 KANANI SUPPLY Co. Ltd P
32 KARENGERA COFFEE P
33 Kigasali General Supply Ltd. P
34 KISCO SUPPLIER P
35 LAND OF 1,000 HILLS COFFEE P III ✓ US US ✓
36 LETSEQUOIA COFFEE P III Switzerland, Republic of Korea
✓
37 LIFE MATE COFFEE P
38 MAHEMBE Coffee P III ✓ Switzerland
✓
39 MIBILIZI COFFEE & FOOD STUFS (MICOF LTD)
P II ✓ ✓ Switzerland, Republic of Korea
✓
40 MISOZI COFFEE - ABAKUNDAKAWA - COOCAMU - KOPAKAKI - KOPAKAMA - TWONGEREKAWA
C
II III II II III
✓ ✓ ✓ ✓ ✓
✓
Switzerland Rwandan Coop Export Union (5 coops). Created with IFAD support.
✓
45 Mountain Coffee Ltd. P III ✓ UK
✓
46 Mubuga Coffee Ltd. P III ✓
✓
47 MUHONDO COFFEE COMPANY LTD P III ✓ Switzerland
✓
48 Muraho Trading Co. Ltd P USA, UK, Australia
49 NEZA Trading Co P III ✓
✓
50 NORTH HILLS COMPANY (NHC) LTD P Switzerland
51 NOVA COFFEE P
✓
52 OIT RWANDA LTD P
53 OLAM Rwanda P I ✓ ✓
✓
54 R&B Import Export Trading P
✓
55 REGIONAL COFFEE Co LTD P Australia, Canada, Germany, Finland, USA, Denmark
✓
56 RUSIZI Specialty coffee LTD P Switzerland
57 RWAMATAMU COFFEE LTD P III ✓
✓
58 Rwanda Coffee Exporters & Processors (RWACOF)
P I ✓ ✓ Switzerland, Sweden, USA, Russia Subsidiary SUCAFINA (CH) ✓
59 Rwanda Coffee Farmers Company (RFCC)
P II UK, USA, Italy
✓

Prepared by Page 79
60 RWANDA MOUNTAIN COFFEE P III ✓ Belgium
✓
61 Rwanda Professional Dealer Ltd. P
✓
62 Rwanda Small Holder Specialty Coffee (RWASHOSCCO)
Switzerland, Norway, UK Rwandan Coop Export Union (6 coops). Partnered with US African Development Foundation.
✓
- BUF P II ✓ - COCAGI C II ✓ - COCAHU C III ✓ - GENERALITIES Ltd C III ✓ - GISUMS C III ✓ - KOAKAKA C II ✓ - MUSASA C II ✓ - NYAMPINGA C III ✓ - SHOLI C III ✓ - SIMBI C III ✓ - TWONGERUMUSARURO C III ✓
73 RWANDA TRADING COMPANY (RTC) P I ✓ ✓ Switzerland, Netherlands, Germany, Norway
US based HQ, sister company to FALCON Coffee UK ✓
74 SAASA Coffee (SACOF) P
Rwandan
75 SAKE Farm LTD P
76 SCENSION COFFEE Ltd P
77 SHINING COFFEE P China
78 SIMBA SUPERMARKET LTD P
79 SIMBI Coffee Investment Ltd. P
80 Société Commerce Représentation Café (SOCOR CAFÉ)
P
Rwandan
81 Société de Production et d'Exportation de Café (SOPECAF)
P
82 Sustainable Harvest P
US Headquarters
83 Tropic Coffee Company P
✓
84 UNGUKA MUHINZI LTD P Switzerland
✓
85 VOLCANO COFFEES LTD P Uganda
86 WEST HILLS COFFEE P Sweden, Slovakia, USA
87 YAHINDA Coffee Ltd P
88 ZEBRA COFFEE LTD. P Swaziland
Number of exporters 2017
57
* Own estimate **Based on data from the Rwanda Development Board RDB

Prepared by Page 80
Annex III List of Roasters No Company Name Brand Name
1 BOURBON Coffee Ltd Bourbon Coffee
2 Café Connexion Ltd Café Connexion
3 CAFERWA Ltd Tora Coffee
4 COOPAC & SACOF Ltd Kivu Burbon Coffee
5 Easy Way Ltd Rugali Coffee
6 ENAS Ltd Migongo Coffee
7 GANOLA Coffee RAFI Coffee
8 Huye Mountain Coffee Ltd Huye Mountain Coffee
9 Kigasali General Supplier Izimano Coffee
10 LETSEQUOIA Ltd L Coffee
11 LIFEMATE Ltd Aromec
12 Micro Roasters Hotels and Coffee Shops
13 North Hills Ltd Everfresh Coffee
14 RFCC Ltd Gorilla's Coffee
15 Rwashoscco Ltd Maraba
16 SAKE farm Ltd Sake Coffee
17 Socor Café Ltd Kinunu Coffee
18 Sustainable Harvest Question Coffee
19 West Hills Coffee Ltd West Hills Coffee
20 3 African Sisters Coffee 3 African Sisters Coffee
Registered roasters in Rwanda
Source: NAEB, interview Agri-Logic
Annex IV Members of CEPAR
01. Coffee Business Centre Ltd (CBC) 09. RWACOF Exports
02. Dormans 10. Rwanda Farmers Coffee Company (RFCC)
03. ENAS 11. Rwanda Trading Company
04. GOMA DUTY FREE Ltd 12. RWASCHOSCCO
05. IMPEXCOR 13. Sake farm Ltd.
06. MIBIRIZI Coffee & Foodstuffs (MICOF Ltd) 14. TEUSCHER INVESTMENT
07. Muhando Coffee 15. UNGUKA MUHINZI Ltd
08. Nyakizu Mountain Coffee
Source: CEPAR 2018
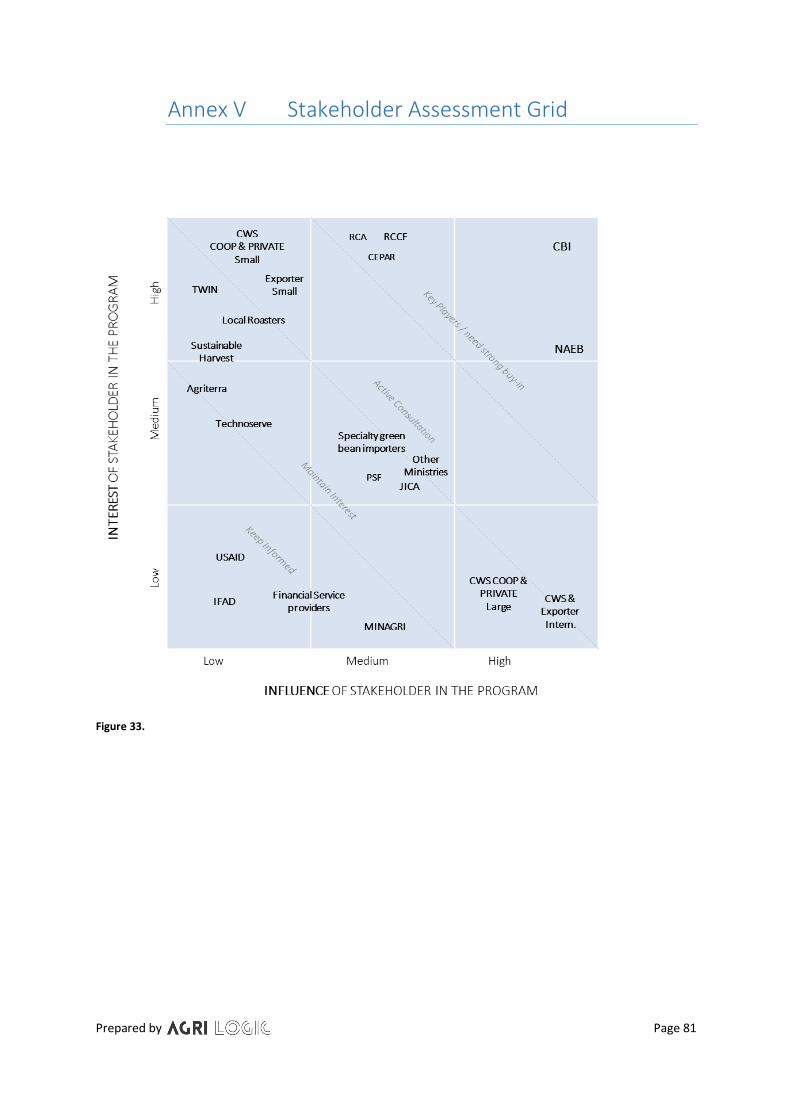
Prepared by Page 81
Annex V Stakeholder Assessment Grid
Figure 33.

Prepared by Page 82
Annex VI List of Coffee Projects
Fa
rm
CW
S
Gen
der
Yo
uth
Fin
ance
Inn
ova
tio
n
/ R
&D
Clim
ate
Mar
kets
Po
licy
Starbucks X X X X X X
Twin X X X X X
Sustainable Harvest 69 cooperatives (29 have a CWS)
X X X X X X X
PRICE / IFAD USD 57 m 2014-2018
X X X X X X X
CUP Rwanda / JICA 2017–2020
X X X X
MARKUP USD 35 m + USD 5 m 2018–2022
X X X X
AGLC X X X
Agriterra (6 coffee coops)
X X X X X
Details on some of the above mentioned projects:
Objective (topics/keywords) Donor Partners & Implementing Agencies
Countries
PRICE – Project for Rural Income through Exports
Raise smallholder farmers’ income. To achieve this, the project’s development objective is to promote sustainable increased returns to farmers from key export-driven agricultural value chains through increased volumes and quality of production, improved marketing, and access to finance and effective farmer organisations. Export commodities targeted: coffee, tea, silk, horticulture.
IFAD NAEB RW
CUP Rwanda – Coffee Upgrade & Promotion in Rwanda
Enhance competitiveness in the market by strengthening the Rwanda coffee value chain
JICA NAEB (Implementing Agent) ; CABI-Africa (Executing Agent)
RW

Prepared by Page 83
MARKUP – Market Access Upgrade Programme
MARKUP aims to build the competitiveness of (M)SMEs across the region, and support them in increasing production, taking advantage of market access opportunities and creating more value addition. It sets out to support East African (M)SMEs specialised in a variety of sectors, including avocado, cocoa, coffee, horticulture, spices and tea. Interventions will focus on the identification and elimination of barriers to trade; improving competitiveness; strengthening of value addition for selected priority sectors; ensuring compliance with international regulations; providing access to trade finance ventures; and supporting the identification of opportunities for trade and foreign direct investments.
EU ITC and GiZ (partnerships with multinationals) supervised by EAC secretariat
RW, TZ, UG, BU, KE

Prepared by Page 84
Annex VII Washed, Natural and Honey Coffee
There are generally three processing techniques that can be identified in coffee (Simsch, 2014):
1. Natural Process or “Dried in the Fruit” process – no layers are removed.
2. Honey Process – skin and pulp are removed, but some or all of the mucilage (Honey) remains.
3. Washed Process – skin, pulp, and mucilage are removed using water and fermentation. Also called
“Fully Washed”. This is the conventional form of arabica coffee processing used in most parts of
the world. It is possible to skip the fermentation step by using a high-tech pressure washing
machine to remove the skin, pulp and some or all of the mucilage. This process is called “Pulped
Natural”.
Figure 34. Anatomy of a coffee cherry and the different processing techniques according to water usage (Simsch, 2014)
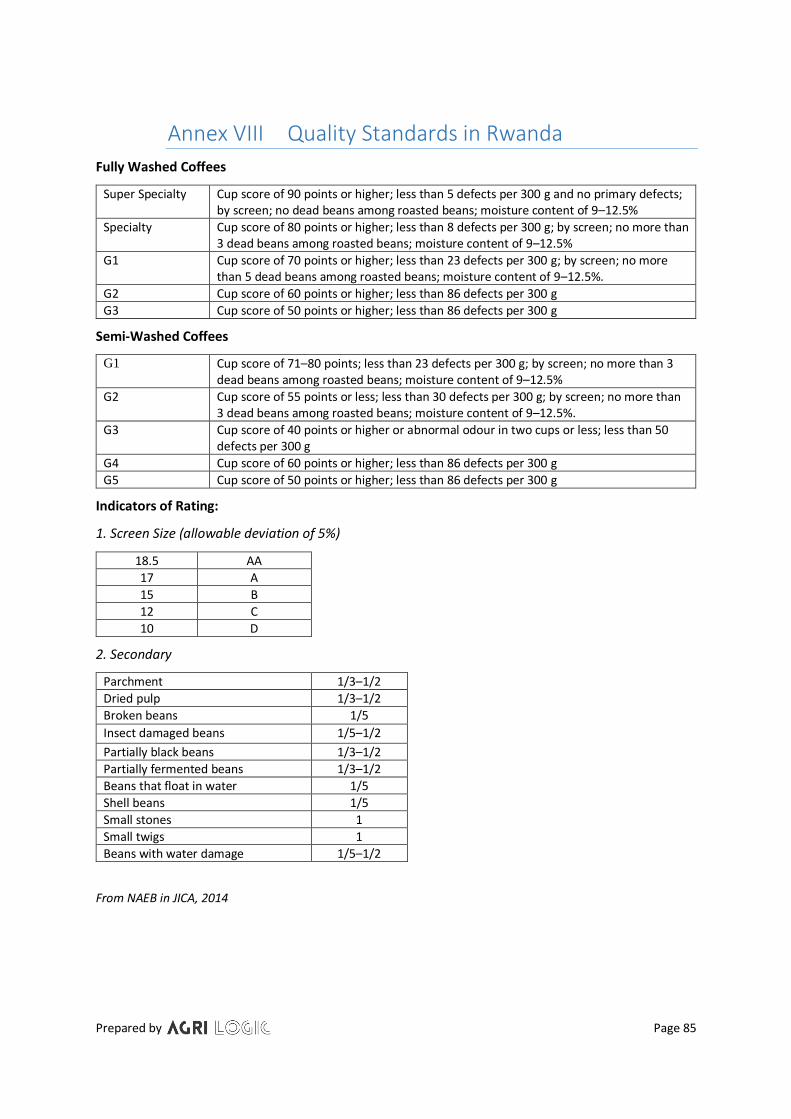
Prepared by Page 85
Annex VIII Quality Standards in Rwanda
Fully Washed Coffees
Super Specialty Cup score of 90 points or higher; less than 5 defects per 300 g and no primary defects; by screen; no dead beans among roasted beans; moisture content of 9–12.5%
Specialty Cup score of 80 points or higher; less than 8 defects per 300 g; by screen; no more than 3 dead beans among roasted beans; moisture content of 9–12.5%
G1 Cup score of 70 points or higher; less than 23 defects per 300 g; by screen; no more than 5 dead beans among roasted beans; moisture content of 9–12.5%.
G2 Cup score of 60 points or higher; less than 86 defects per 300 g
G3 Cup score of 50 points or higher; less than 86 defects per 300 g
Semi-Washed Coffees
G1 Cup score of 71–80 points; less than 23 defects per 300 g; by screen; no more than 3 dead beans among roasted beans; moisture content of 9–12.5%
G2 Cup score of 55 points or less; less than 30 defects per 300 g; by screen; no more than 3 dead beans among roasted beans; moisture content of 9–12.5%.
G3 Cup score of 40 points or higher or abnormal odour in two cups or less; less than 50 defects per 300 g
G4 Cup score of 60 points or higher; less than 86 defects per 300 g
G5 Cup score of 50 points or higher; less than 86 defects per 300 g
Indicators of Rating:
1. Screen Size (allowable deviation of 5%)
18.5 AA
17 A
15 B
12 C
10 D
2. Secondary
Parchment 1/3–1/2
Dried pulp 1/3–1/2
Broken beans 1/5
Insect damaged beans 1/5–1/2
Partially black beans 1/3–1/2
Partially fermented beans 1/3–1/2
Beans that float in water 1/5
Shell beans 1/5
Small stones 1
Small twigs 1
Beans with water damage 1/5–1/2
From NAEB in JICA, 2014

Prepared by Page 86
Annex IX Competitive & Comparative Advantage Scoring
Macro Economic Rwanda Burundi Kenya Ethiopia Tanzania Uganda Colombia
FDI US$ million (2016) 254 0 393 3,989 1,365 523 13,849
FDI Rank 3% 17% 1 1 1 2 1 1 5
Agricultural GDP Billion US$ (2016) 3 1 25 27 15 6 20
Agricultural GDP Rank 3% 17% 1 1 5 5 3 2 4
Agricultural GDP Growth in % (2016) 0 0 0 0 0 0 0
GDP Growth Rank 3% 17% 4 5 4 5 4 3 1
GDP per capita (PPP) US$ (2017 est) 2,100 800 3,500 2,100 3,300 2,400 14,500
GDP per capita Rank 3% 17% 1 1 2 1 2 1 5
Unemployment Rate 3 2 11 5 3 2 9
Unemployment Rate Rank 3% 17% 5 5 1 3 5 5 2
Ease of doing business 41 164 80 161 137 122 59
Ease of doing business Rank 3% 17% 5 1 4 1 2 2 4
Production
Arabica coffee volumes (2017) 16,200 15,000 47,400 459,000 36,000 57,280 840,000
Arabica volumes Rank 4% 25% 1.0 1.0 1.2 3.2 1.1 1.2 5.0
Production Kg/Ha (2015) 0.547 0.235 0.417 0.501 0.260 0.702 0.843
Production Rank 4% 25% 3.1 1.0 2.2 2.8 1.2 4.1 5.0
Total Coffee Acreage Ha (2015) 32,000 70,000 113,500 804,000 215,000 312,000 997,500
Total production area Rank 4% 25% 1.0 1.2 1.3 4.2 1.8 2.2 5.0
Average farm size 0.1 0.1 0.1 0.7 0.7 0.2 4.5
Average farm size Rank 4% 25% 1.0 1.0 1.1 1.5 1.6 1.1 5.0
Exports
Coffee Exports (2016) 15,756 13,811 43,623 179,098 42,535 215,736 762,983
Coffee Export Rank 7% 40% 1.0 1.0 1.2 1.9 1.2 2.1 5.0
% of export value (vegetable products) 32% 65% 9% 42% 13% 47% 45%
Export Value Rank 3% 20% 2.7 5.0 1.0 3.4 1.3 3.7 3.6
Time to Export - Border Compliance (hrs) 93 59 21 51 96 64 112
Time to Export Border Compliance Rank 2% 10% 1.8 3.3 5.0 3.7 1.7 3.1 1.0
Time to Export - Document Compliance (hrs) 42 120 19 76 96 51 60
Time to Export - Document Compliance Rank 2% 10% 4.1 1.0 5.0 2.7 2.0 3.7 3.4
Cost to export - Border Compliance (US$) 183.0 136.0 143.0 172.0 1,160 209.0 545.0
Cost to export - Border Compliance (US$) 2% 10% 4.8 5.0 5.0 4.9 1.0 4.7 3.4
Cost to export - Document Compliance (US$) 110.0 150.0 191.0 175.0 275.0 102.0 90.0
Cost to export - Border Compliance (US$) 2% 10% 4.6 3.7 2.8 3.2 1.0 4.7 5.0
Certification
Certified RA (ha) 2015 Rwanda - Coffee 3,406 46 14,449 43,691 19,208 14,082 39,438
Certified RA (ha) 2015 - Rank 4% 25% 1.3 1.0 2.3 5.0 2.8 2.3 4.6
Certified UTZ as % of export 9% 17% 11% 9% 8% 8% 13%
Certified UTZ Ranking 1% 8% 1.3 5.0 2.1 1.4 1.1 1.0 3.3
Sold as UTZ - 2017 (%) 48% 61% 24% 17% 21% 26% 34%
Sold as UTZ Rank 1% 8% 3.8 5.0 1.6 1.0 1.3 1.8 2.5
Premiums UTZ (2017) 2.4 6.8 3.0 2.4 4.1 6.0
Premium UTZ Rank 1% 8% 1.0 - 5.0 1.6 1.0 2.5 4.3
Organic Coffee (ha) 203 - 1,262 161,113 - 65,570 10,495
Organic Rank 4% 25% 1.0 - 1.0 5.0 - 2.6 1.3
Fairtrade # Cooperatives (2017) 15 1 18 6 7 10 108
Fairtrade # Cooperatives Rank 4% 25% 1.5 1.0 1.6 1.2 1.2 1.3 5.0
Prices
Farmgate Price as % of FOB 69% 65% 48% 61% 75% 69% 79%
Farmgate Price as % of FOB Rank 13% 75% 3.7 3.2 1.0 2.7 4.5 3.7 5.0
Differentials (6.00) (6.00) 4.08 4.08 10.00 (3.00) 14.00
Differential Rank 4% 25% 5.0 5.0 3.0 3.0 1.8 4.4 1.0
Youth and Women
Labor force participation women (2017) 88 81 63 80 81 68 64
Labor force participation women Rank 4% 25% 5.0 4.0 1.0 3.7 3.9 1.8 1.1
Labor force participation youth (2017) 76 53 34 75 72 53 54
Labor force participation youth Rank 4% 25% 5.0 2.8 1.0 4.9 4.7 2.8 2.9
Youth unemployment rate (%) 3.3 3 22.1 7.6 5.4 4 19.5
Youth unemployment Rank (%) 4% 25% 4.9 5.0 1.0 4.0 4.5 4.8 1.5
Ranking Women, Peace and Security Index 94 122 107 106 85 100 96
Women, Peace and Security Ranking 4% 25% 4.0 1.0 2.6 2.7 5.0 3.4 3.8
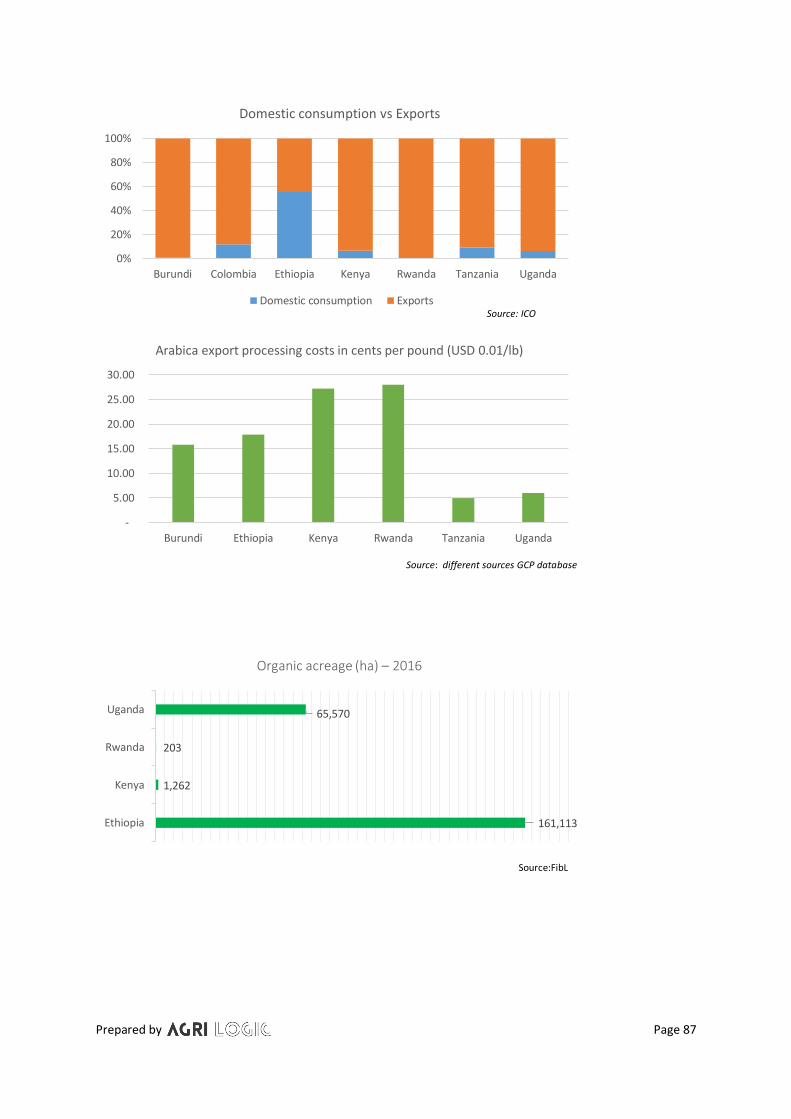
Prepared by Page 87
0%
20%
40%
60%
80%
100%
Burundi Colombia Ethiopia Kenya Rwanda Tanzania Uganda
Domestic consumption vs Exports
Domestic consumption ExportsSource: ICO
-
5.00
10.00
15.00
20.00
25.00
30.00
Burundi Ethiopia Kenya Rwanda Tanzania Uganda
Arabica export processing costs in cents per pound (USD 0.01/lb)
161,113
1,262
203
65,570
Ethiopia
Kenya
Rwanda
Uganda
Organic acreage (ha) – 2016
Source: different sources GCP database
Source:FibL
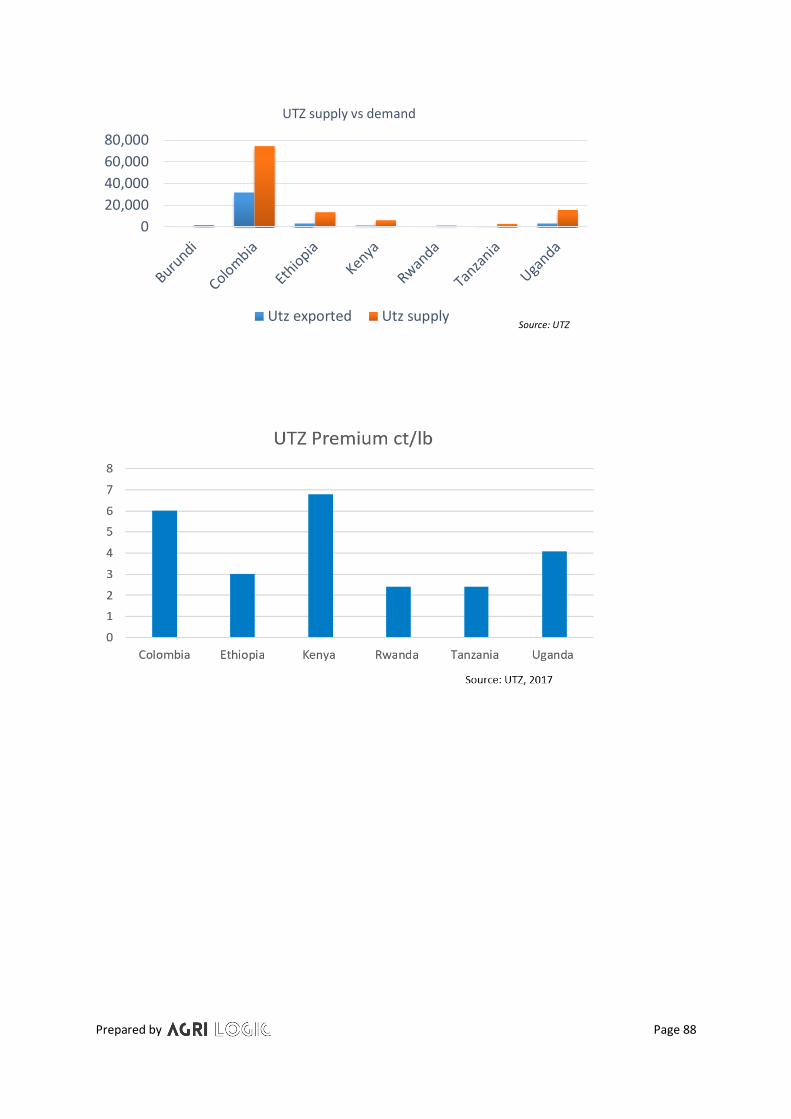
Prepared by Page 88
0
20,000
40,000
60,000
80,000
UTZ supply vs demand
Utz exported Utz supplySource: UTZ
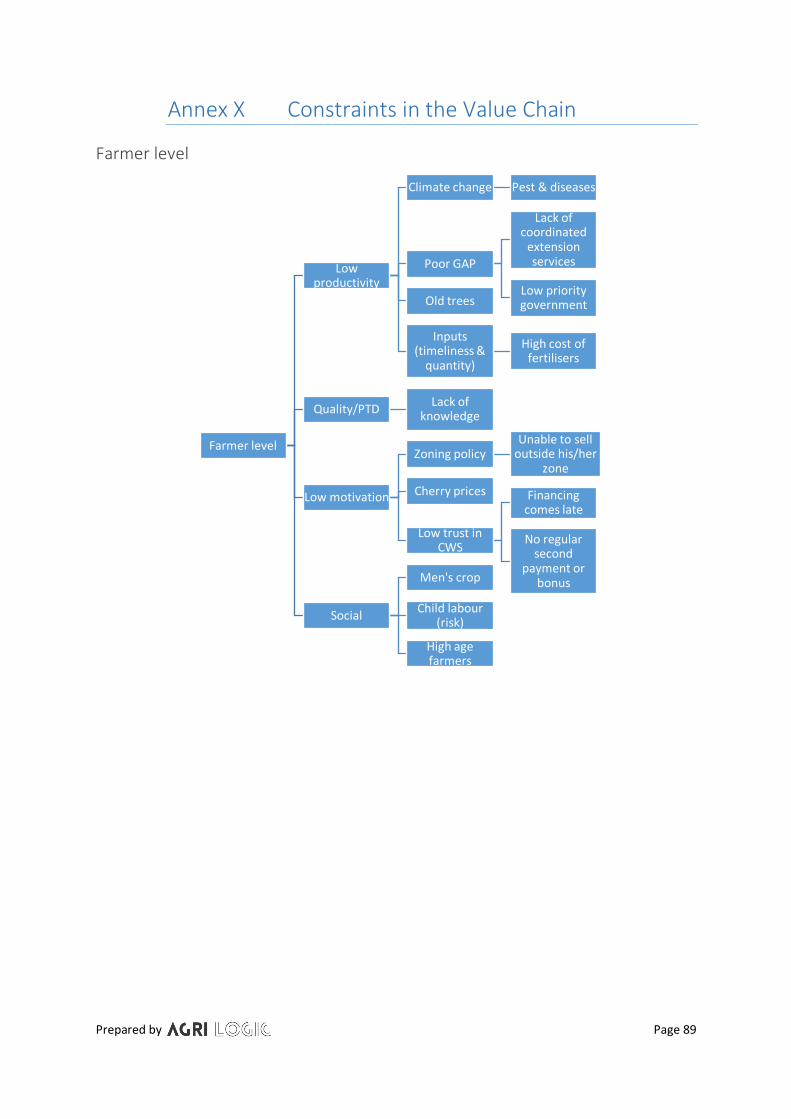
Prepared by Page 89
Annex X Constraints in the Value Chain
Farmer level
Farmer level
Low productivity
Climate change Pest & diseases
Poor GAP
Lack of coordinated
extension services
Low priority governmentOld trees
Inputs (timeliness &
quantity)
High cost of fertilisers
Quality/PTDLack of
knowledge
Low motivation
Zoning policyUnable to sell
outside his/her zone
Cherry prices
Low trust in CWS
Financing comes late
No regular second
payment or bonus
Social
Men's crop
Child labour (risk)
High age farmers
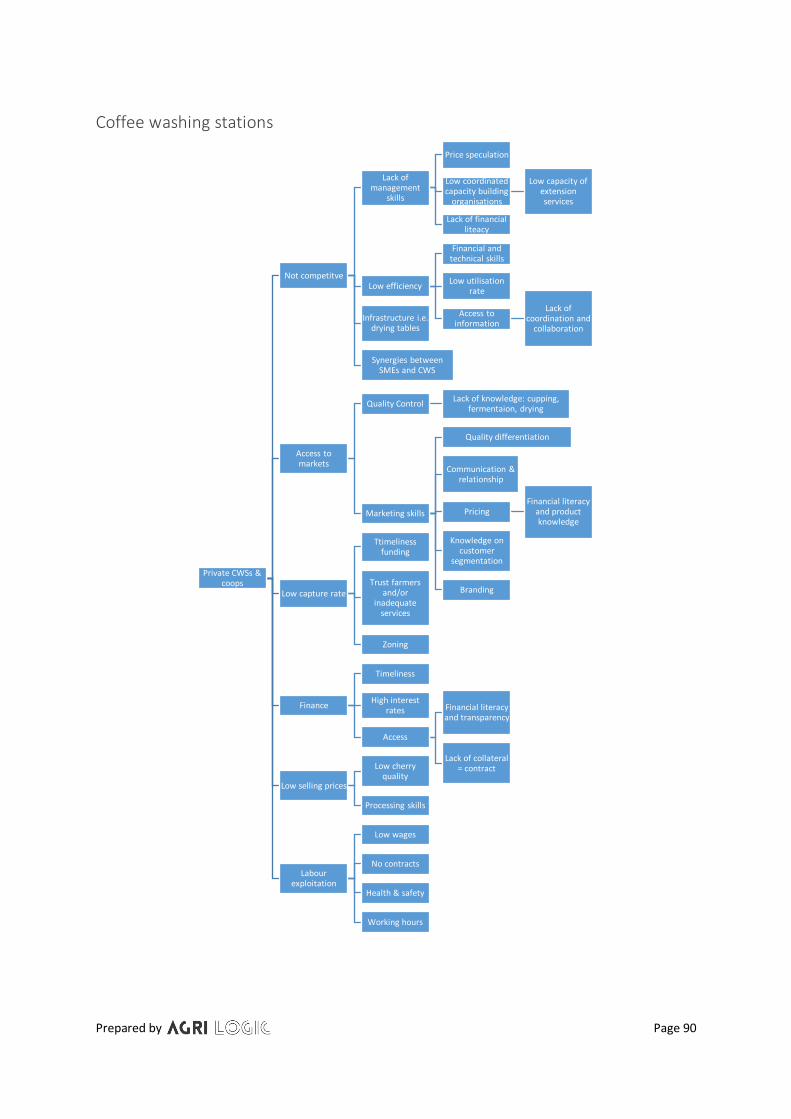
Prepared by Page 90
Coffee washing stations
Private CWSs & coops
Not competitve
Lack of management
skills
Price speculation
Low coordinated capacity building
organisations
Low capacity of extension services
Lack of financial liteacy
Low efficiency
Financial and technical skills
Low utilisation rate
Access to information
Lack of coordination and
collaborationInfrastructure i.e.
drying tables
Synergies between SMEs and CWS
Access to markets
Quality ControlLack of knowledge: cupping,
fermentaion, drying
Marketing skills
Quality differentiation
Communication & relationship
PricingFinancial literacy
and product knowledge
Knowledge on customer
segmentation
BrandingLow capture rate
Ttimeliness funding
Trust farmers and/or
inadequate services
Zoning
Finance
Timeliness
High interest rates
Access
Financial literacy and transparency
Lack of collateral = contract
Low selling prices
Low cherry quality
Processing skills
Labour exploitation
Low wages
No contracts
Health & safety
Working hours

Prepared by Page 91
Secondary processing marketing & enabling environment
Secondary processing and/or export
Management capacity
Access to market Lack of coordination
and collaboration
Quality of parchment
Underperformance of CWS
Semi-washed not controlled
EU market
Reputation and/or PTD
Consumer knowledge of Rwandan coffee
Enabling environment
Lack of information sharing
Focus on food crops
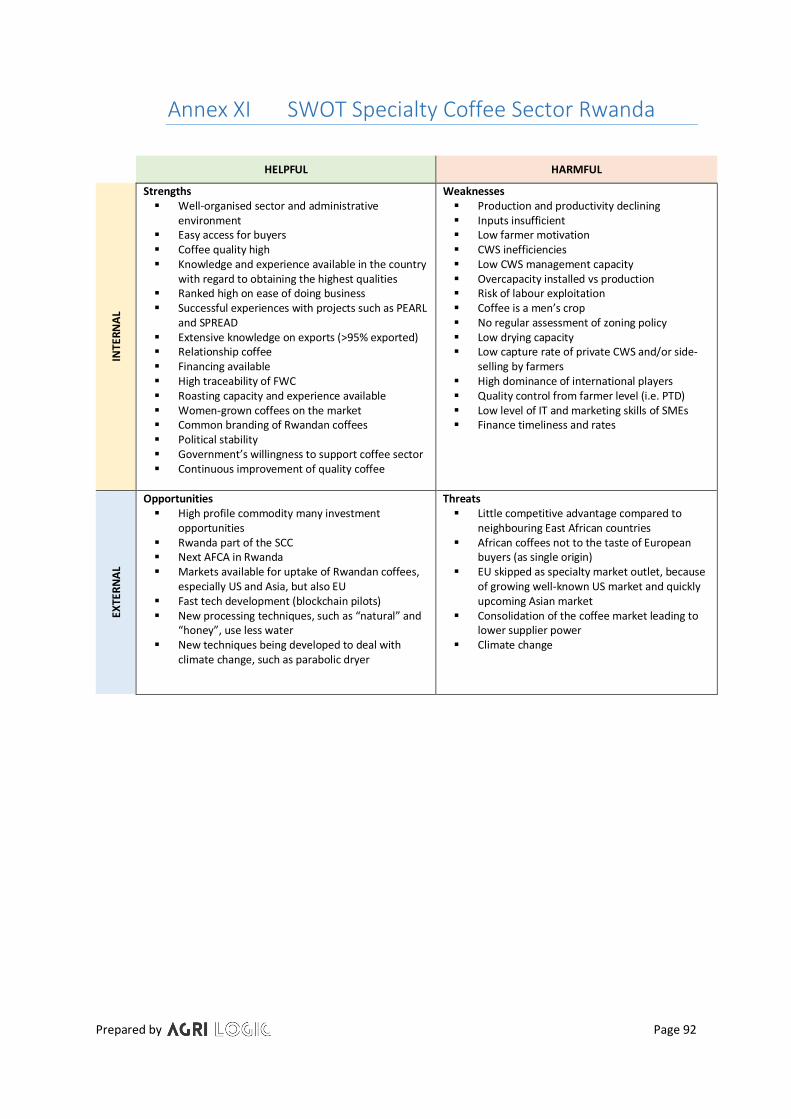
Prepared by Page 92
Annex XI SWOT Specialty Coffee Sector Rwanda
HELPFUL HARMFUL
INTE
RN
AL
Strengths ▪ Well-organised sector and administrative
environment ▪ Easy access for buyers ▪ Coffee quality high ▪ Knowledge and experience available in the country
with regard to obtaining the highest qualities ▪ Ranked high on ease of doing business ▪ Successful experiences with projects such as PEARL
and SPREAD ▪ Extensive knowledge on exports (>95% exported) ▪ Relationship coffee ▪ Financing available ▪ High traceability of FWC ▪ Roasting capacity and experience available ▪ Women-grown coffees on the market ▪ Common branding of Rwandan coffees ▪ Political stability ▪ Government’s willingness to support coffee sector ▪ Continuous improvement of quality coffee
Weaknesses ▪ Production and productivity declining ▪ Inputs insufficient ▪ Low farmer motivation ▪ CWS inefficiencies ▪ Low CWS management capacity ▪ Overcapacity installed vs production ▪ Risk of labour exploitation ▪ Coffee is a men’s crop ▪ No regular assessment of zoning policy ▪ Low drying capacity ▪ Low capture rate of private CWS and/or side-
selling by farmers ▪ High dominance of international players ▪ Quality control from farmer level (i.e. PTD) ▪ Low level of IT and marketing skills of SMEs ▪ Finance timeliness and rates
EXTE
RN
AL
Opportunities ▪ High profile commodity many investment
opportunities ▪ Rwanda part of the SCC ▪ Next AFCA in Rwanda ▪ Markets available for uptake of Rwandan coffees,
especially US and Asia, but also EU ▪ Fast tech development (blockchain pilots) ▪ New processing techniques, such as “natural” and
“honey”, use less water ▪ New techniques being developed to deal with
climate change, such as parabolic dryer
Threats ▪ Little competitive advantage compared to
neighbouring East African countries ▪ African coffees not to the taste of European
buyers (as single origin) ▪ EU skipped as specialty market outlet, because
of growing well-known US market and quickly upcoming Asian market
▪ Consolidation of the coffee market leading to lower supplier power
▪ Climate change

Prepared by Page 93
Annex XII Value Chain Baseline Measurement Stakeholder Indicator Value (2018)
With SMEs
Number of SMEs operating in this sector
Farm level: none Primary processors: 200 excl. those owned by multinationals of which 96 are cooperatives Export: about 33 of the above also export
Number of SMEs with international business contacts (EU/EFTA and non-EU/EFTA)
101 CWSs have international business contacts, of which 13 SMEs fall under MISOZI and RWASHOSCCO
Number of exporting SMEs in this specific value chain
There are 88 exporters, of which about half export and 8 are considered large. There are about 40–50 SME exporters operational
With business support organisations and sector associations
Number of business support organisations and sector associations active in this value chain
INGOs (6): Sustainable Harvest; Twin; Technoserve; Agriterra; SNV; AgriProFocus Sector organisations (2): CEPAR and RCCF Financial service providers (30–35) Many local NGOs >20
Type of export-enabling services provided by business support organisations and sector associations
NGOs: Certification, GAP, market access, marketing & branding, financial management, youth and gender inclusion, quality (cupping), climate resilience Others: Financial services, input provision, price setting, advocacy, marketing
Level of cooperation between the private sector, government, NGOs and knowledge institutions
Different sector meetings organised by the NAEB, CEPAR and Sustainable Harvest. Less regular are those of AGLC and AgriProfocus, which organises non-sector related events. The broader sector generally does not meet up
With local government
Production figures of main products in this value chain (esp. those products that CBI would want to focus on) incl. product pricing
The total coffee production for Rwanda ranges between 15,000 MT and 22,000 MT. Farm gate pricing is set by government. Export market prices should be in the range of 4–7 USD/kg for specialty.
Direct export to the EU/EFTA in volumes and EUR, incl. growth in %
The NAEB estimates that 75% exported as specialty, which equals about USD 22.5 m. Target is to increase volume of specialty coffee with cupping score 85 and above.
Main export destinations UK, France, Netherlands, Norway and Poland etc.
Level of foreign investments TBD with the NAEB for the sector N/A
In this value chain Main bottlenecks in this value chain for exporting SMEs
High competitive environment; management and technical skills to efficiently run operations and; receive adequate and timely access to finance
Main certification standards in this value chain in this country
UTZ/RA and Fairtrade, 4C, CAFÉ practices, organic is on the rise