Valuation Slides Week1 1 - Intro and FFCF Previtero
45
Valuation MBA FIN 286 Alessandro Previtero Slide Pack Week 1 Part 1 Company Valuation – Introduction and FFCF
-
Upload
stefanie-wang -
Category
Documents
-
view
230 -
download
0
Transcript of Valuation Slides Week1 1 - Intro and FFCF Previtero

7/24/2019 Valuation Slides Week1 1 - Intro and FFCF Previtero
http://slidepdf.com/reader/full/valuation-slides-week1-1-intro-and-ffcf-previtero 1/45
Valuation
MBA FIN 286
Alessandro Previtero
Slide Pack Week 1 Part 1
Company Valuation – Introduction and
FFCF

7/24/2019 Valuation Slides Week1 1 - Intro and FFCF Previtero
http://slidepdf.com/reader/full/valuation-slides-week1-1-intro-and-ffcf-previtero 2/45
Logistics
I. My CV/Research
II. Syllabus:
a) Office Hours
- Thu 2:30-4:30pm CBA 6.228
b) TA Review Sessions :
- TBD
c) Textbook
d) Assignments/Cases
e) Grading
f)
Classroom Policies
g) Discussion Board
h)
News of the day
III. Slides
IV.
Make-up class this FRIDAY same time same room.
!"#$"%#& ( )
7/24/2019 Valuation Slides Week1 1 - Intro and FFCF Previtero
http://slidepdf.com/reader/full/valuation-slides-week1-1-intro-and-ffcf-previtero 3/45
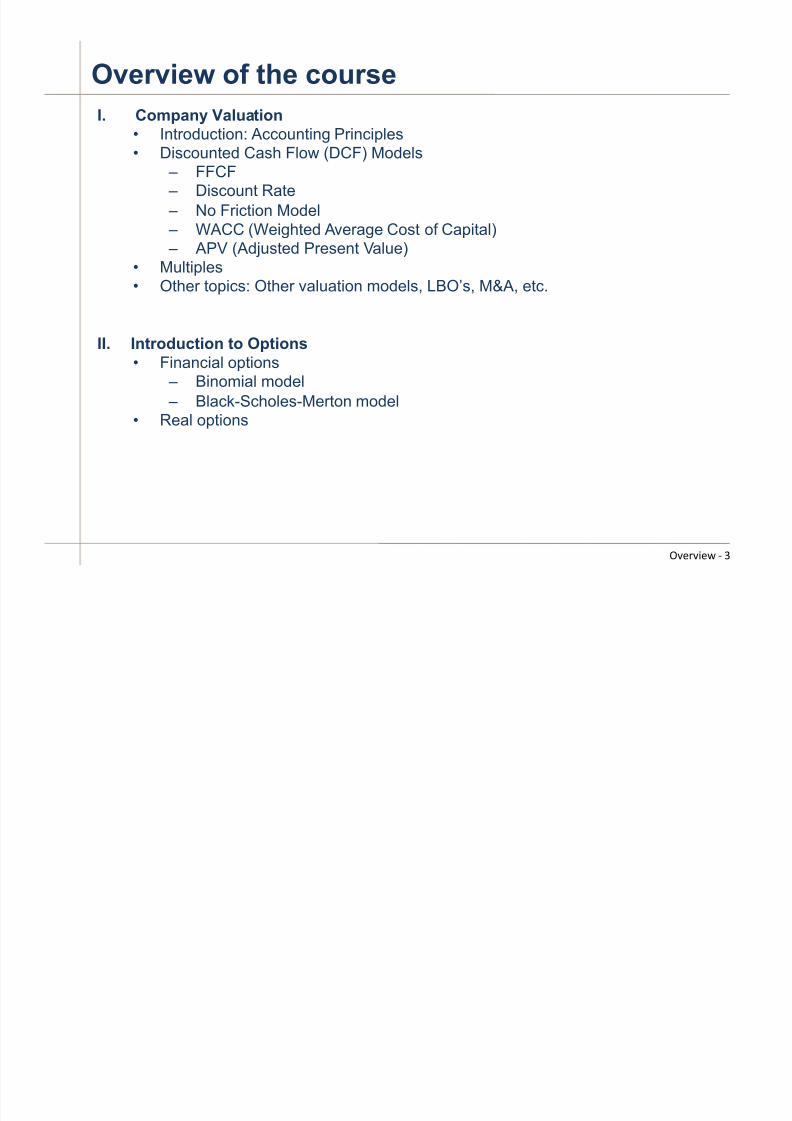
Overview of the course
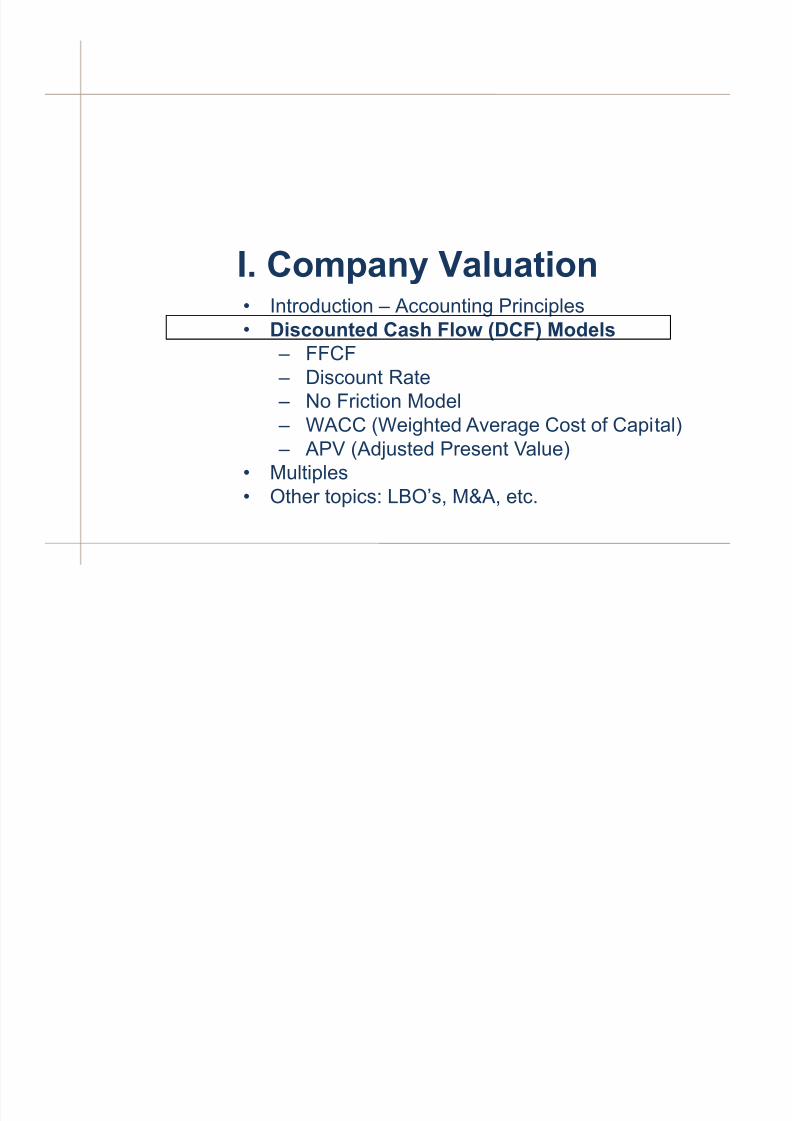
I. Company Valuation
•
Introduction: Accounting Principles• Discounted Cash Flow (DCF) Models – FFCF –
Discount Rate
–
No Friction Model – WACC (Weighted Average Cost of Capital) – APV (Adjusted Present Value)
• Multiples•
Other topics: Other valuation models, LBO’s, M&A, etc.
II.
Introduction to Options
• Financial options – Binomial model
– Black-Scholes-Merton model
•
Real options
!"#$"%#& ( *
7/24/2019 Valuation Slides Week1 1 - Intro and FFCF Previtero
http://slidepdf.com/reader/full/valuation-slides-week1-1-intro-and-ffcf-previtero 4/45
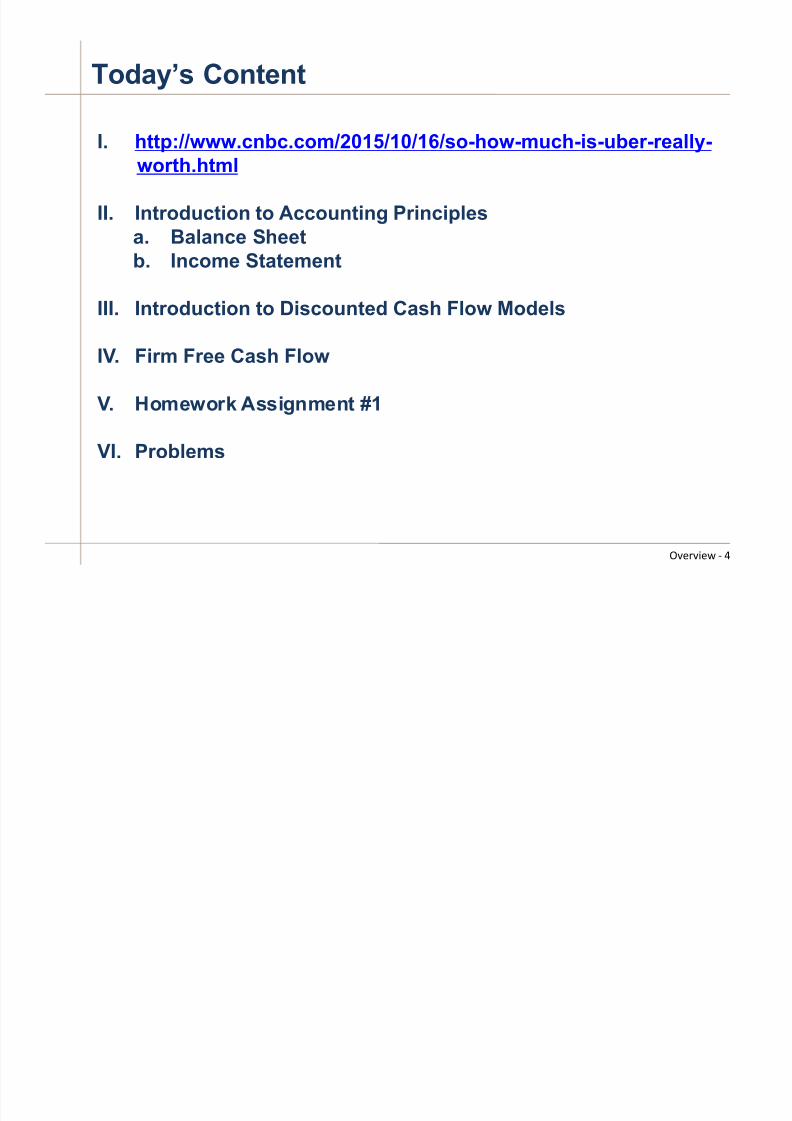
Today’s Content
I.
http://www.cnbc.com/2015/10/16/so-how-much-is-uber-really-worth.html
II.
Introduction to Accounting Principles
a. Balance Sheet
b. Income Statement
III. Introduction to Discounted Cash Flow Models
IV.
Firm Free Cash Flow
V. Homework Assignment #1
VI. Problems
!"#$"%#& ( +
7/24/2019 Valuation Slides Week1 1 - Intro and FFCF Previtero
http://slidepdf.com/reader/full/valuation-slides-week1-1-intro-and-ffcf-previtero 5/45
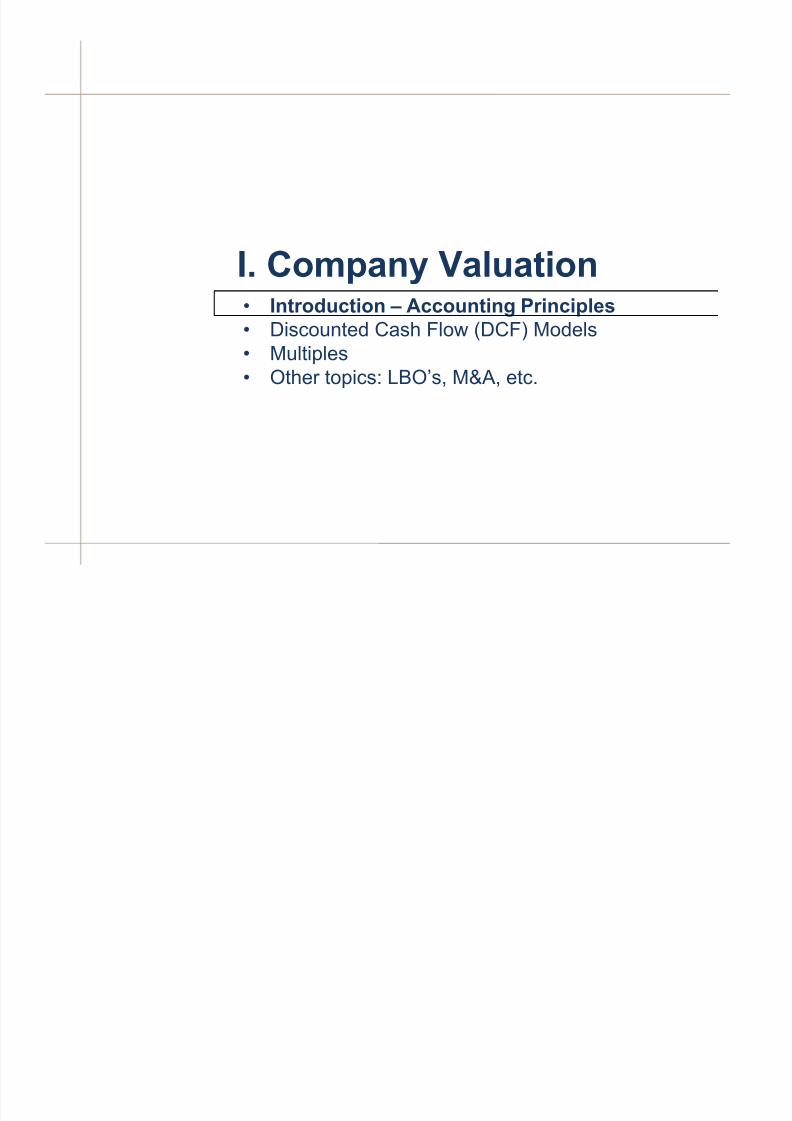
• Introduction – Accounting Principles
•
Discounted Cash Flow (DCF) Models• Multiples• Other topics: LBO’s, M&A, etc.
I. Company Valuation
7/24/2019 Valuation Slides Week1 1 - Intro and FFCF Previtero
http://slidepdf.com/reader/full/valuation-slides-week1-1-intro-and-ffcf-previtero 6/45
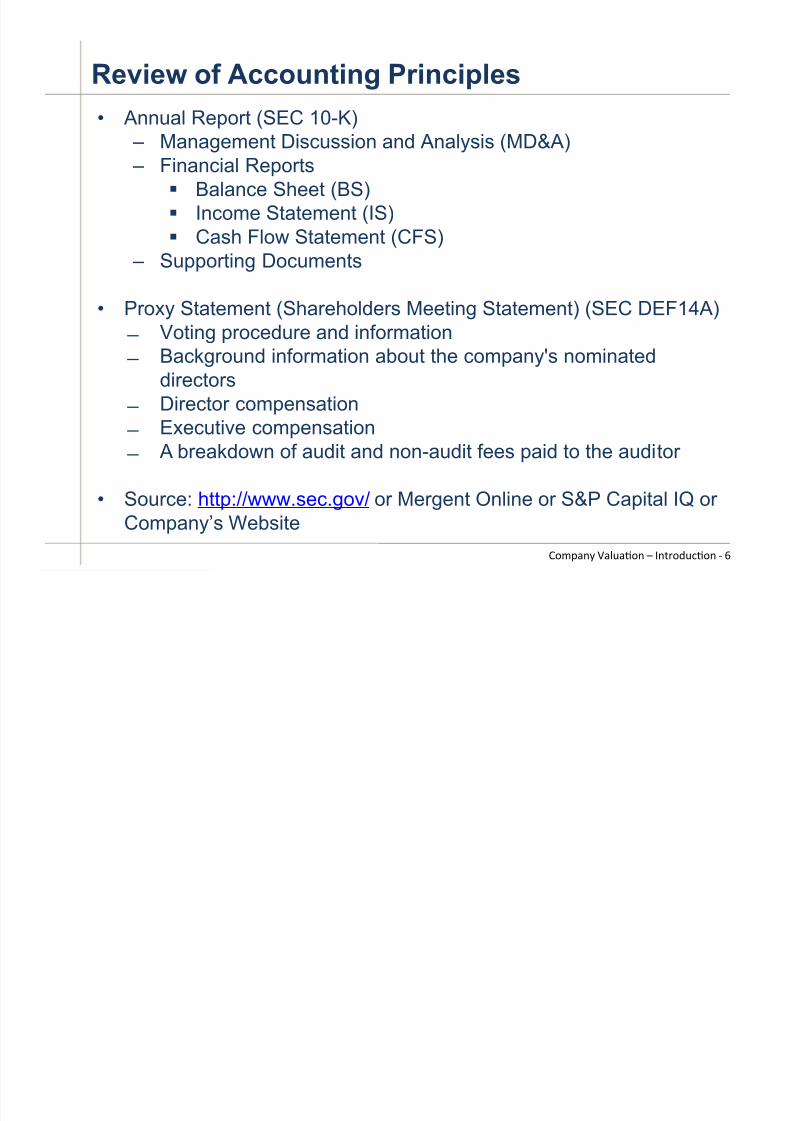
Review of Accounting Principles
• Annual Report (SEC 10-K)
!
Management Discussion and Analysis (MD&A) ! Financial Reports
! Balance Sheet (BS)!
Income Statement (IS)! Cash Flow Statement (CFS)
! Supporting Documents
• Proxy Statement (Shareholders Meeting Statement) (SEC DEF14A) " Voting procedure and information " Background information about the company's nominated
directors " Director compensation " Executive compensation " A breakdown of audit and non-audit fees paid to the auditor
•
Source: http://www.sec.gov/ or Mergent Online or S&P Capital IQ orCompany’s Website
,-./012 304506-1 7 819$-:5;6-1 ( <
7/24/2019 Valuation Slides Week1 1 - Intro and FFCF Previtero
http://slidepdf.com/reader/full/valuation-slides-week1-1-intro-and-ffcf-previtero 7/45
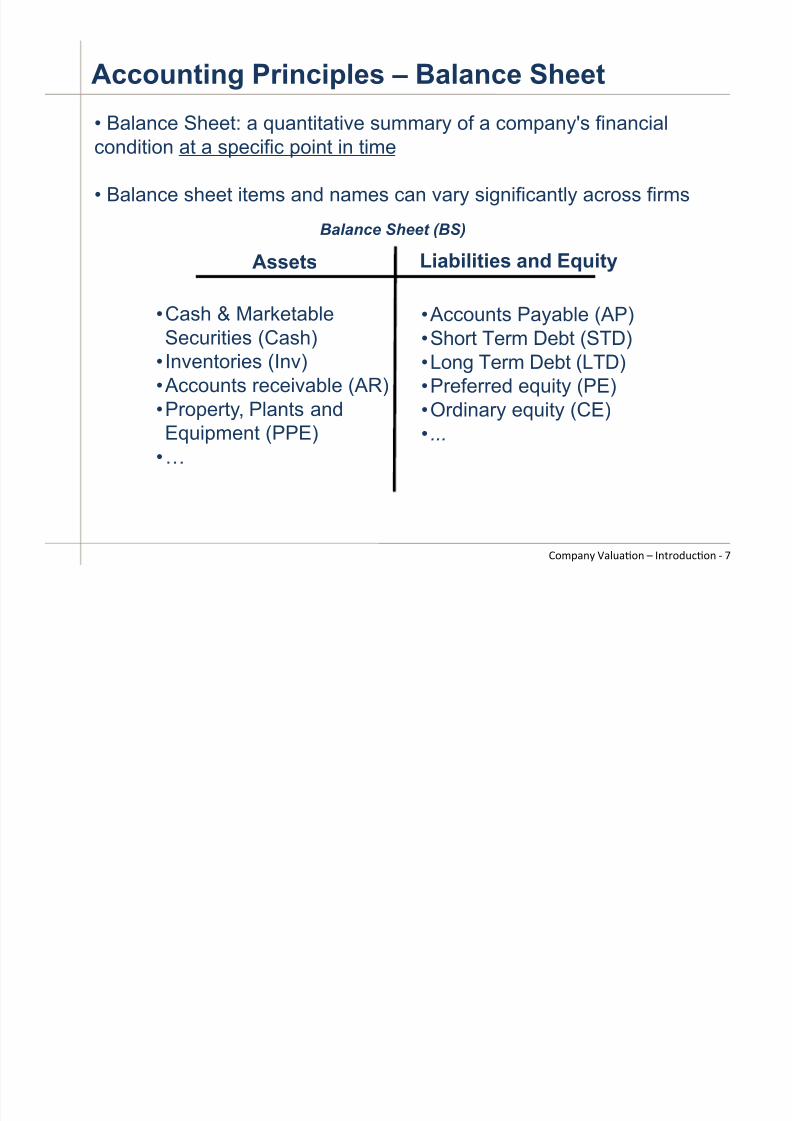
Accounting Principles – Balance Sheet
Assets Liabilities and Equity
• Cash & MarketableSecurities (Cash)
• Inventories (Inv)• Accounts receivable (AR)
•
Property, Plants andEquipment (PPE)• #
• Accounts Payable (AP)• Short Term Debt (STD)• Long Term Debt (LTD)• Preferred equity (PE)
•
Ordinary equity (CE)• ...
Balance Sheet (BS)
• Balance Sheet: a quantitative summary of a company's financialcondition at a specific point in time
• Balance sheet items and names can vary significantly across firms
,-./012 304506-1 7 819$-:5;6-1 ( =
7/24/2019 Valuation Slides Week1 1 - Intro and FFCF Previtero
http://slidepdf.com/reader/full/valuation-slides-week1-1-intro-and-ffcf-previtero 8/45
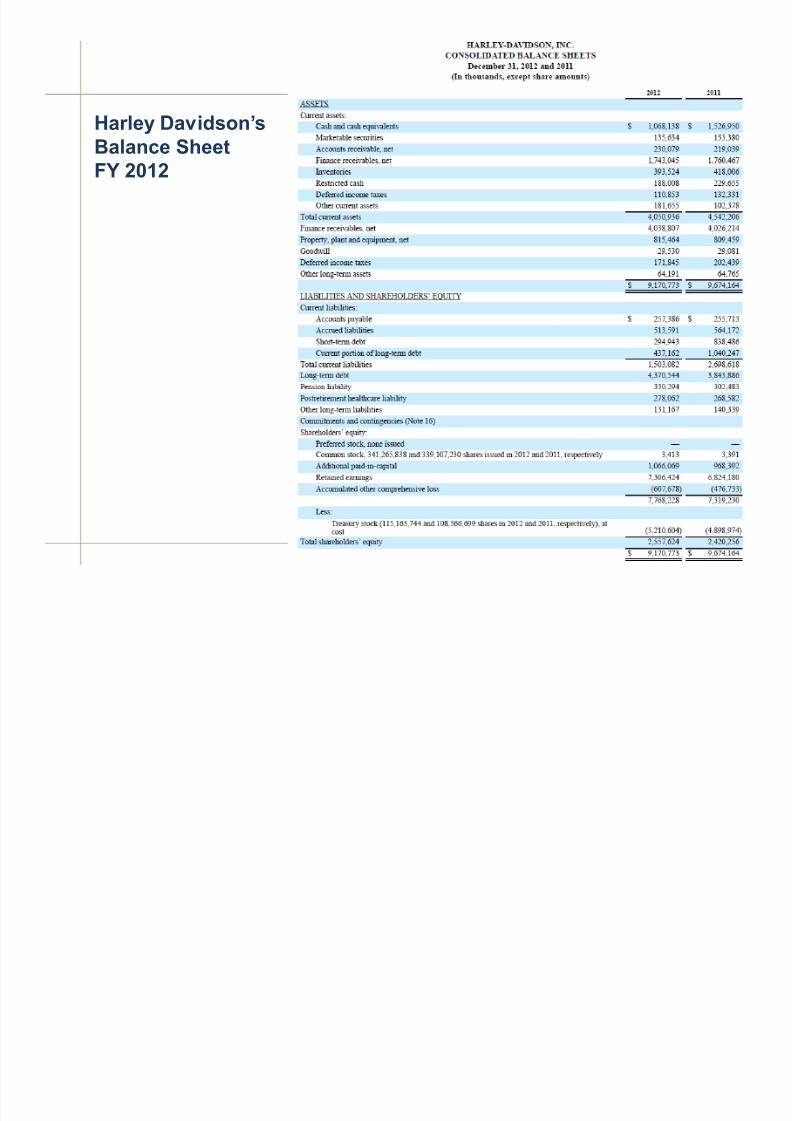
Harley Davidson’s
Balance Sheet
FY 2012
,-./012 304506-1 7 819$-:5;6-1 ( >
7/24/2019 Valuation Slides Week1 1 - Intro and FFCF Previtero
http://slidepdf.com/reader/full/valuation-slides-week1-1-intro-and-ffcf-previtero 9/45
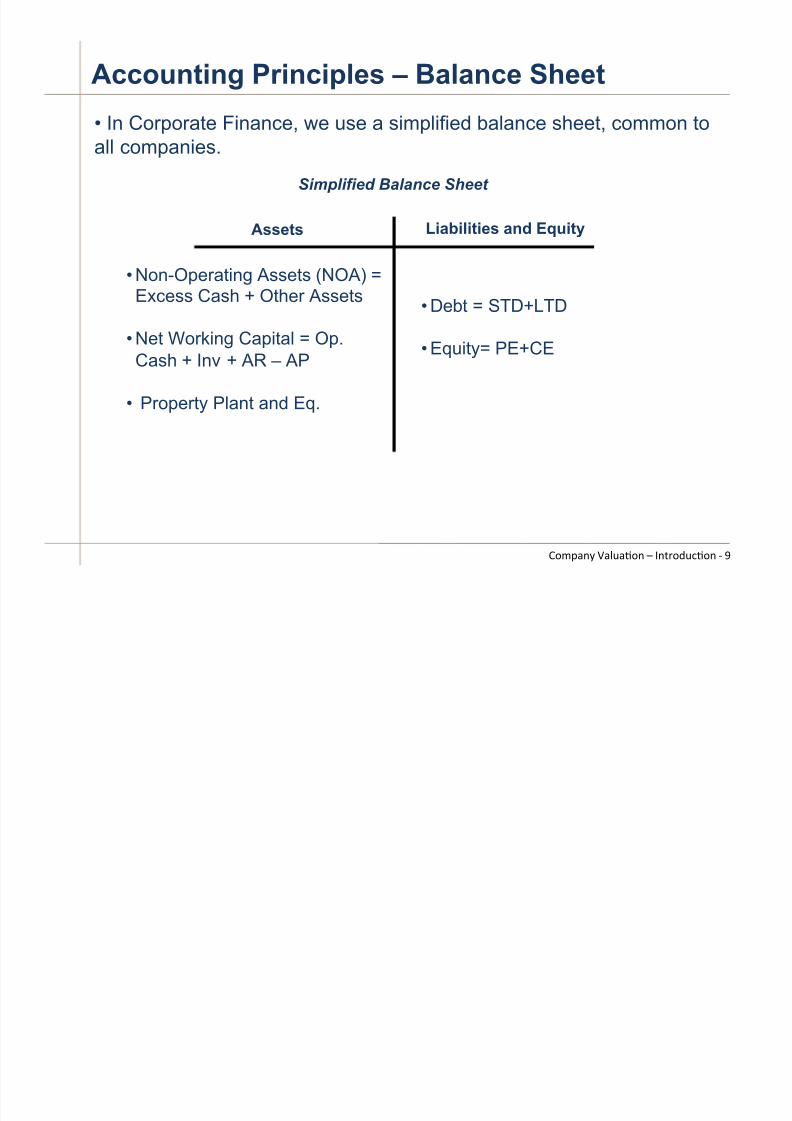
Accounting Principles – Balance Sheet
Assets Liabilities and Equity
•
Non-Operating Assets (NOA) =Excess Cash + Other Assets
•
Net Working Capital = Op.Cash + Inv + AR – AP
• Property Plant and Eq.
• Debt = STD+LTD
•
Equity= PE+CE
Simplified Balance Sheet
,-./012 304506-1 7 819$-:5;6-1 ( ?
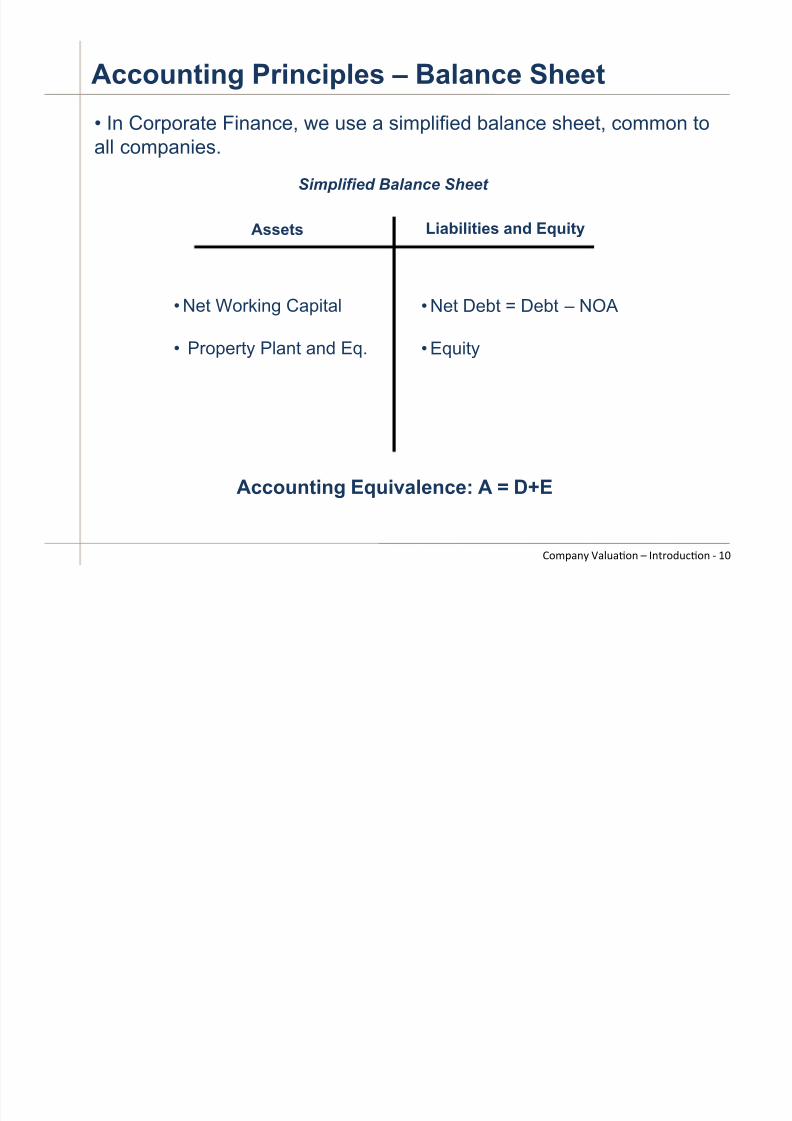
• In Corporate Finance, we use a simplified balance sheet, common to
all companies.
7/24/2019 Valuation Slides Week1 1 - Intro and FFCF Previtero
http://slidepdf.com/reader/full/valuation-slides-week1-1-intro-and-ffcf-previtero 10/45
Accounting Principles – Balance Sheet
Assets Liabilities and Equity
• Net Working Capital
•
Property Plant and Eq.
• Net Debt = Debt – NOA
•
Equity
Simplified Balance Sheet
,-./012 304506-1 7 819$-:5;6-1 ( @A
• In Corporate Finance, we use a simplified balance sheet, common to
all companies.
Accounting Equivalence: A = D+E
7/24/2019 Valuation Slides Week1 1 - Intro and FFCF Previtero
http://slidepdf.com/reader/full/valuation-slides-week1-1-intro-and-ffcf-previtero 11/45
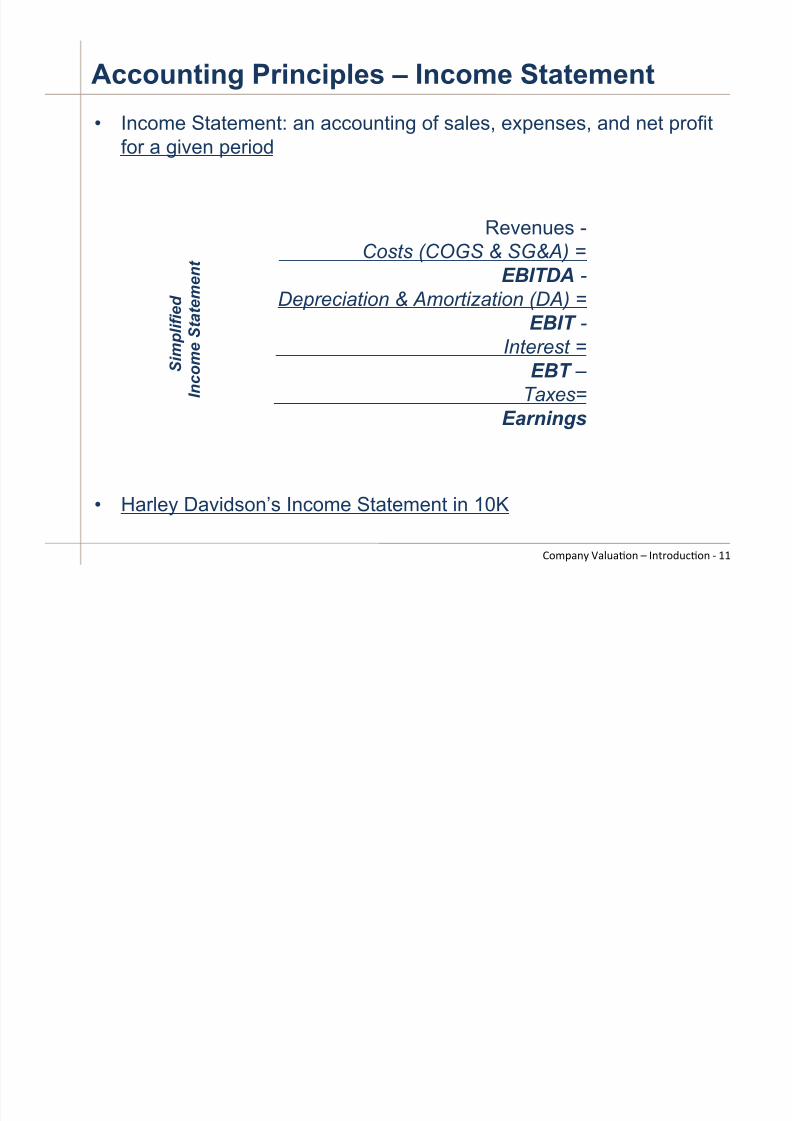
Accounting Principles – Income Statement
Revenues -Costs (COGS & SG&A) =
EBITDA -Depreciation & Amortization (DA) =
EBIT -
Interest =
EBT –
Taxes=
Earnings
S i m p l i f i e d
I n c o m e S t a t e m e n t
,-./012 304506-1 7 819$-:5;6-1 ( @@
• Income Statement: an accounting of sales, expenses, and net profit
for a given period
• Harley Davidson’s Income Statement in 10K
7/24/2019 Valuation Slides Week1 1 - Intro and FFCF Previtero
http://slidepdf.com/reader/full/valuation-slides-week1-1-intro-and-ffcf-previtero 12/45
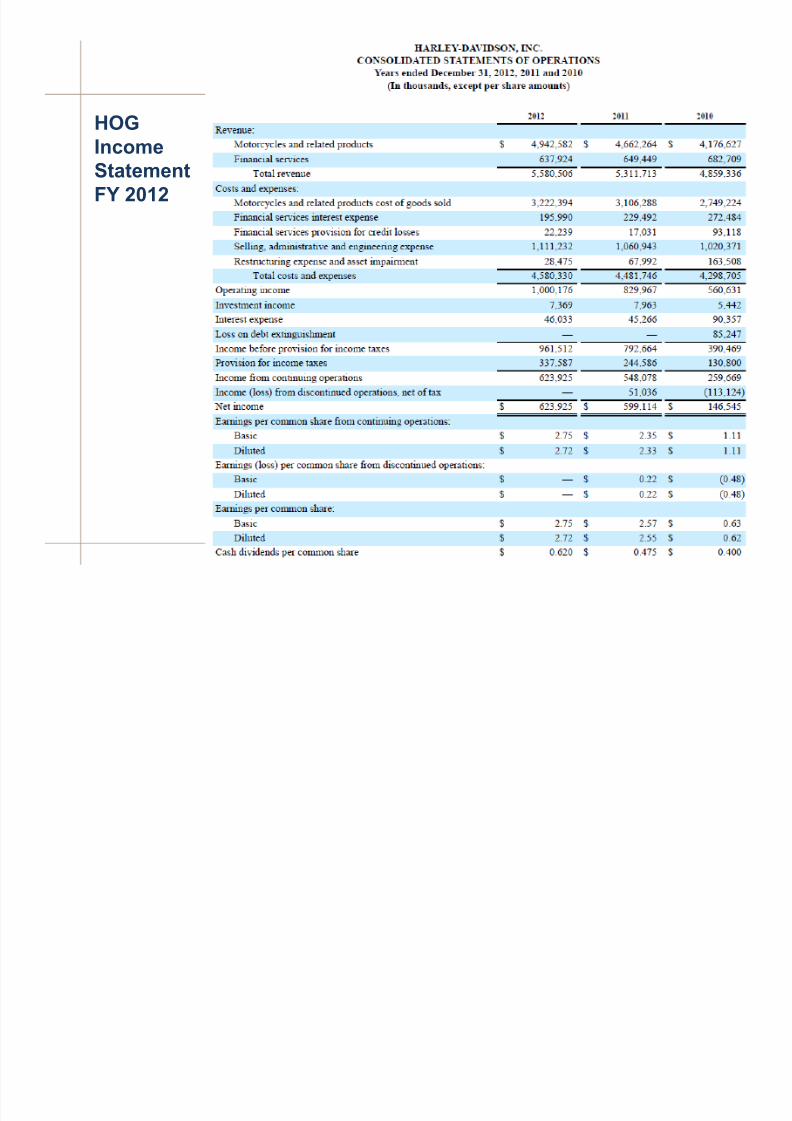
,-./012 304506-1 7 819$-:5;6-1 ( @)
HOG
Income
Statement
FY 2012
7/24/2019 Valuation Slides Week1 1 - Intro and FFCF Previtero
http://slidepdf.com/reader/full/valuation-slides-week1-1-intro-and-ffcf-previtero 13/45
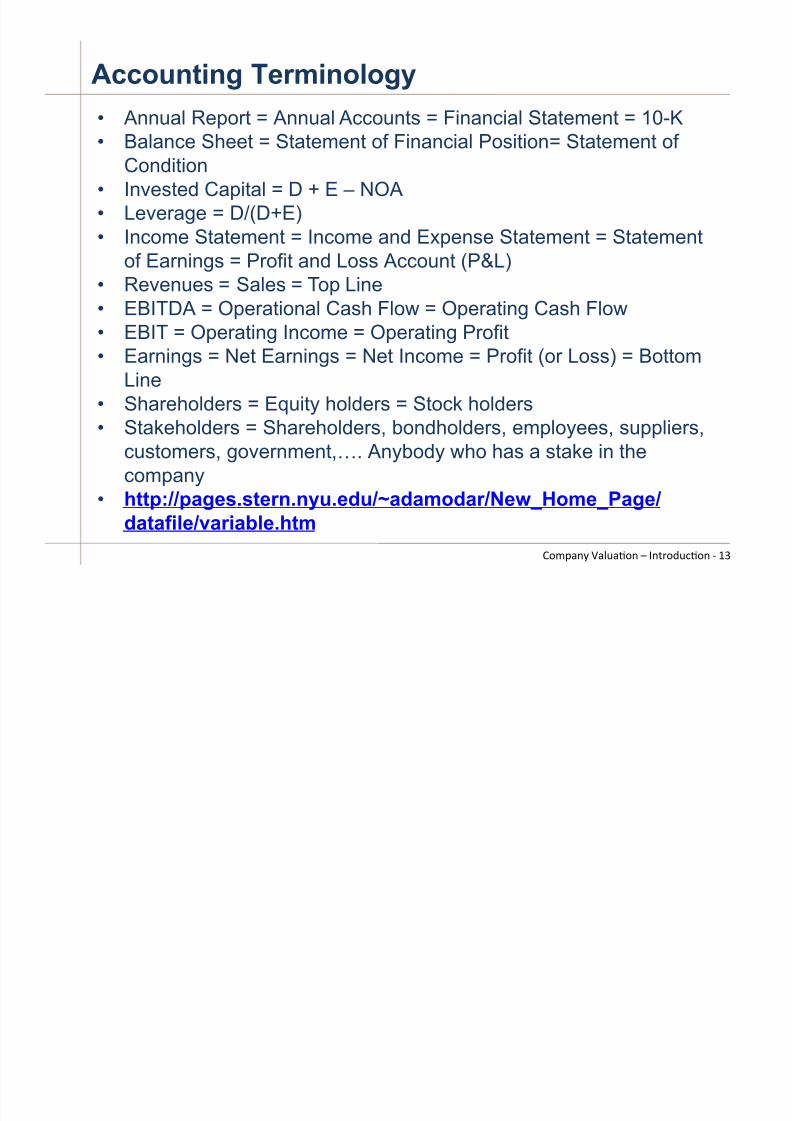
Accounting Terminology
• Annual Report = Annual Accounts = Financial Statement = 10-K
•
Balance Sheet = Statement of Financial Position= Statement ofCondition
• Invested Capital = D + E – NOA•
Leverage = D/(D+E)• Income Statement = Income and Expense Statement = Statement
of Earnings = Profit and Loss Account (P&L)
•
Revenues = Sales = Top Line• EBITDA = Operational Cash Flow = Operating Cash Flow• EBIT = Operating Income = Operating Profit•
Earnings = Net Earnings = Net Income = Profit (or Loss) = BottomLine
• Shareholders = Equity holders = Stock holders•
Stakeholders = Shareholders, bondholders, employees, suppliers,customers, government,#. Anybody who has a stake in thecompany
•
http://pages.stern.nyu.edu/~adamodar/New_Home_Page/
datafile/variable.htm
,-./012 304506-1 7 819$-:5;6-1 ( @*
7/24/2019 Valuation Slides Week1 1 - Intro and FFCF Previtero
http://slidepdf.com/reader/full/valuation-slides-week1-1-intro-and-ffcf-previtero 14/45
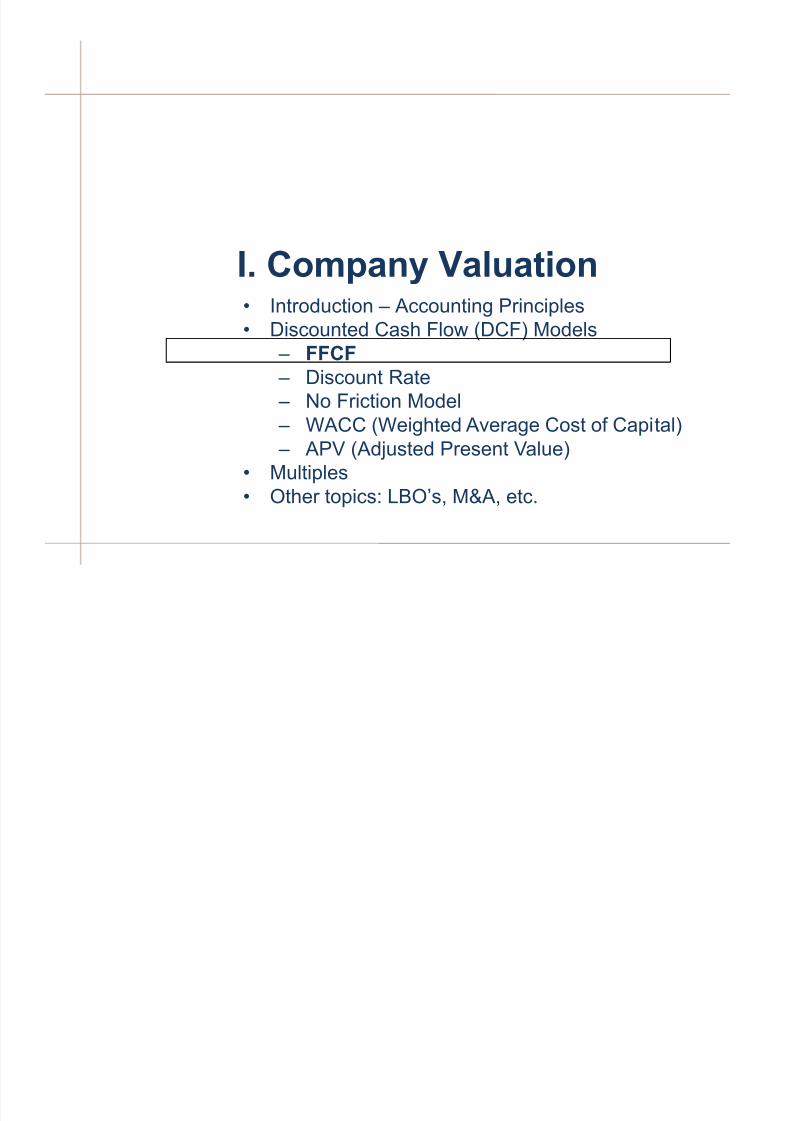
• Introduction – Accounting Principles•
Discounted Cash Flow (DCF) Models
– FFCF – Discount Rate –
No Friction Model –
WACC (Weighted Average Cost of Capital) – APV (Adjusted Present Value)
•
Multiples• Other topics: LBO’s, M&A, etc.
I. Company Valuation
7/24/2019 Valuation Slides Week1 1 - Intro and FFCF Previtero
http://slidepdf.com/reader/full/valuation-slides-week1-1-intro-and-ffcf-previtero 15/45
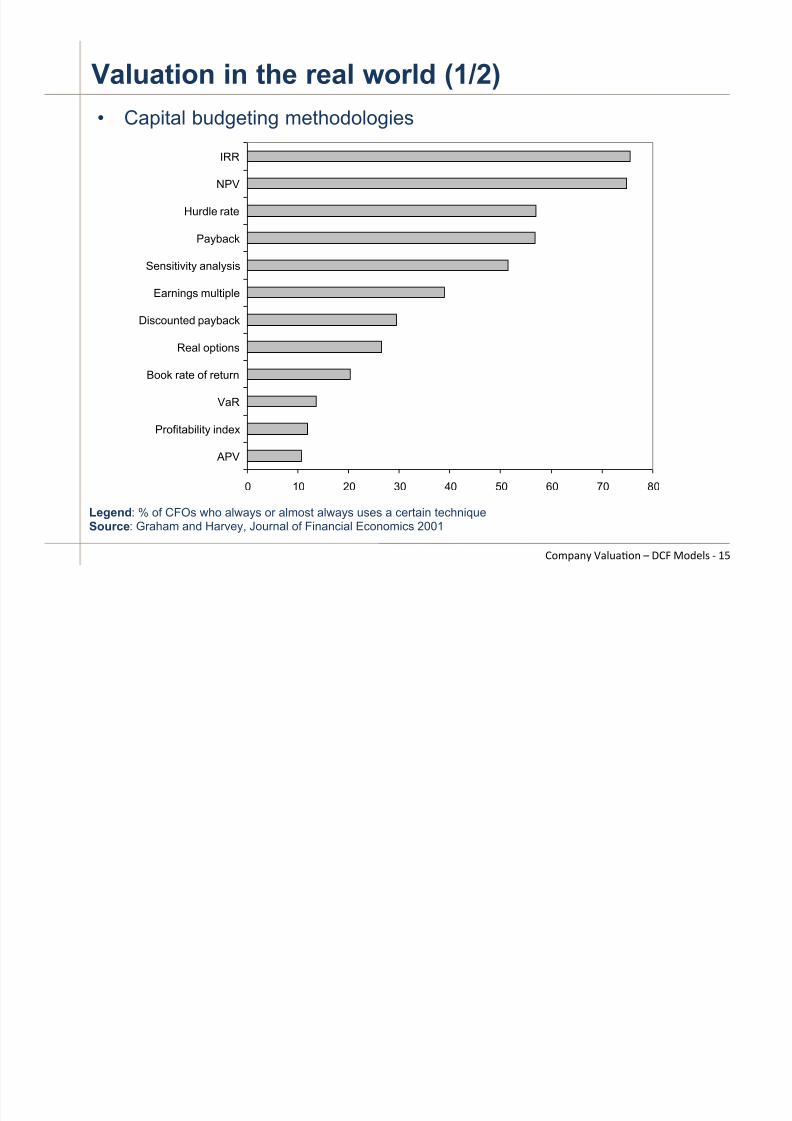
Valuation in the real world (1/2)
Legend: % of CFOs who always or almost always uses a certain techniqueSource: Graham and Harvey, Journal of Financial Economics 2001
0 10 20 30 40 50 60 70 80
APV
Profitability index
VaR
Book rate of return
Real options
Discounted payback
Earnings multiple
Sensitivity analysis
Payback
Hurdle rate
NPV
IRR
• Capital budgeting methodologies
,-./012 304506-1 7 B,C D-:#4E ( @F
7/24/2019 Valuation Slides Week1 1 - Intro and FFCF Previtero
http://slidepdf.com/reader/full/valuation-slides-week1-1-intro-and-ffcf-previtero 16/45
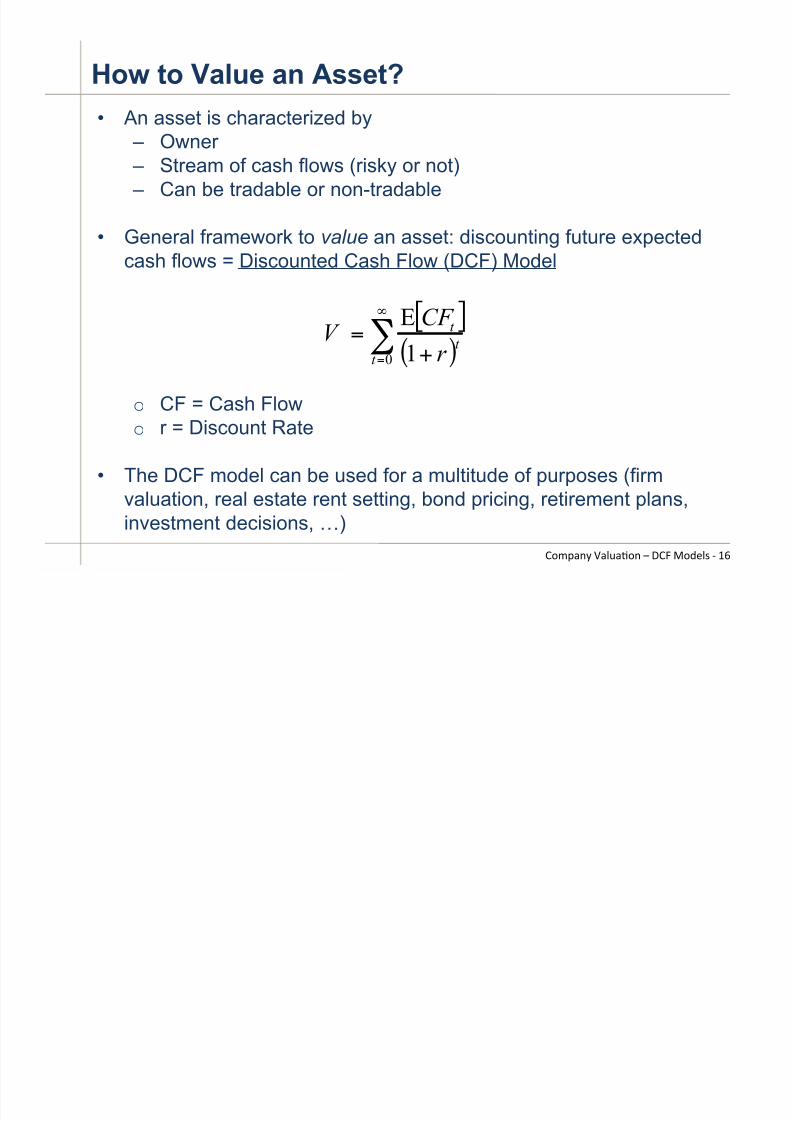
How to Value an Asset?
• An asset is characterized by
–
Owner – Stream of cash flows (risky or not) – Can be tradable or non-tradable
• General framework to value an asset: discounting future expectedcash flows = Discounted Cash Flow (DCF) Model
o CF = Cash Flowo
r = Discount Rate
• The DCF model can be used for a multitude of purposes (firmvaluation, real estate rent setting, bond pricing, retirement plans,investment decisions, #)
[ ]( )!
"
= +
=
0 1
E
t
t
t
r
CF V
,-./012 304506-1 7 B,C D-:#4E ( @<
7/24/2019 Valuation Slides Week1 1 - Intro and FFCF Previtero
http://slidepdf.com/reader/full/valuation-slides-week1-1-intro-and-ffcf-previtero 17/45
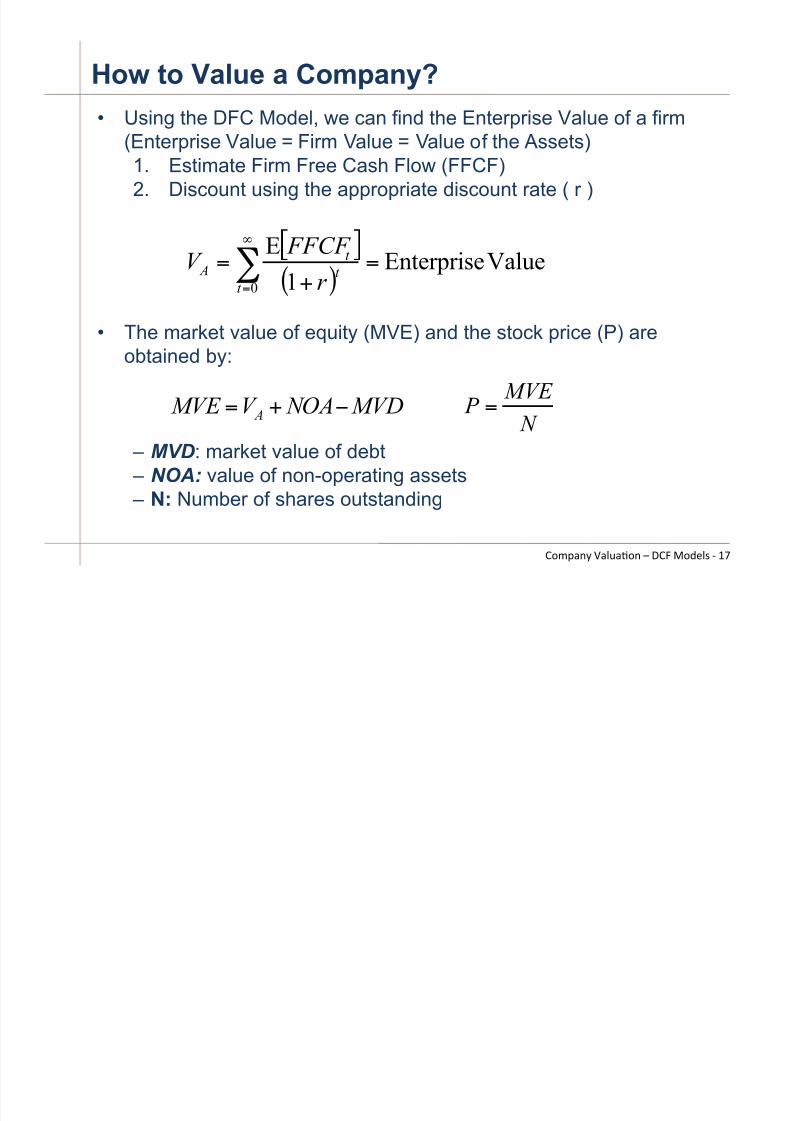
How to Value a Company?
• Using the DFC Model, we can find the Enterprise Value of a firm
(Enterprise Value = Firm Value = Value of the Assets)1. Estimate Firm Free Cash Flow (FFCF)2. Discount using the appropriate discount rate ( r )
• The market value of equity (MVE) and the stock price (P) areobtained by:
– MVD: market value of debt – NOA: value of non-operating assets –
N: Number of shares outstanding
[ ]
( )ValueEnterprise
1
E
0
=
+
=
!
"
=t
t
t
A
r
FFCF V
,-./012 304506-1 7 B,C D-:#4E ( @=
MVD NOAV MVE A
!+=
N
MVE P =
7/24/2019 Valuation Slides Week1 1 - Intro and FFCF Previtero
http://slidepdf.com/reader/full/valuation-slides-week1-1-intro-and-ffcf-previtero 18/45
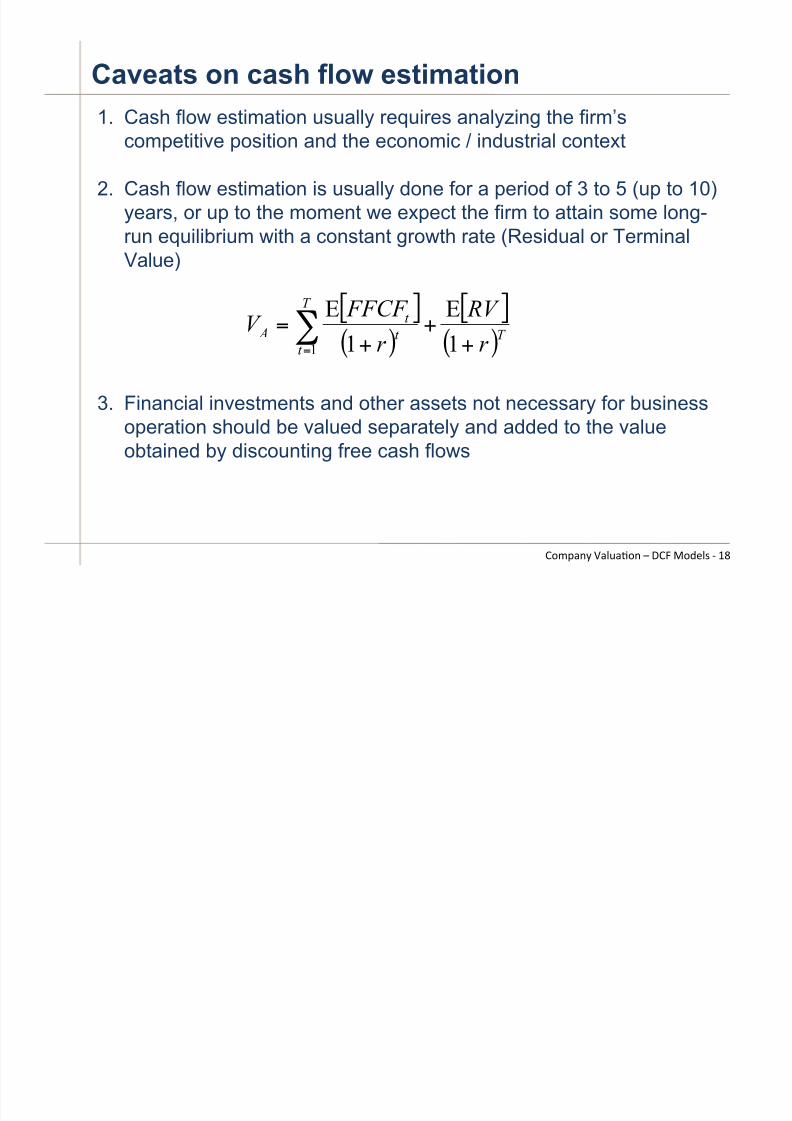
1. Cash flow estimation usually requires analyzing the firm’s
competitive position and the economic / industrial context
2. Cash flow estimation is usually done for a period of 3 to 5 (up to 10)years, or up to the moment we expect the firm to attain some long-run equilibrium with a constant growth rate (Residual or TerminalValue)
3. Financial investments and other assets not necessary for businessoperation should be valued separately and added to the valueobtained by discounting free cash flows
Caveats on cash flow estimation
,-./012 304506-1 7 B,C D-:#4E ( @>
[ ]( )
[ ]( )T
T
t
t
t
A
r
RV
r
FFCF V
+
+
+
=!= 1
E
1
E
1
7/24/2019 Valuation Slides Week1 1 - Intro and FFCF Previtero
http://slidepdf.com/reader/full/valuation-slides-week1-1-intro-and-ffcf-previtero 19/45
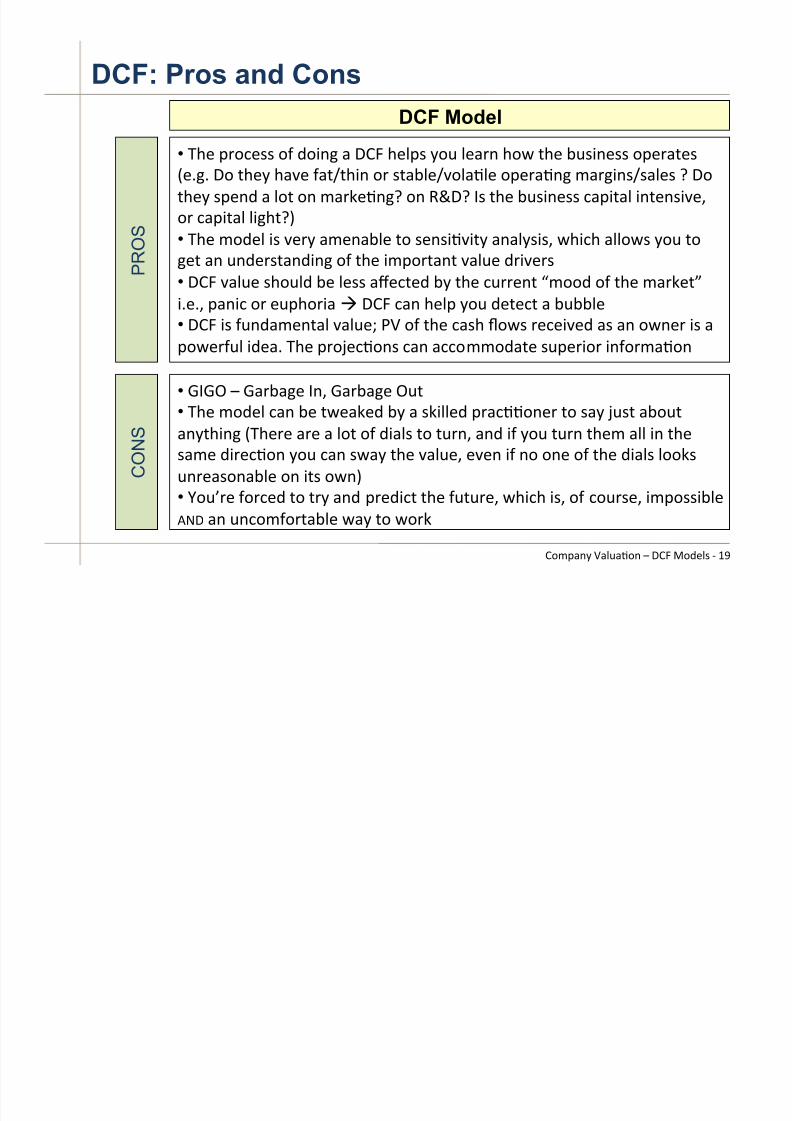
DCF: Pros and Cons
• GH# /$-;#EE -I :-%1J 0 B,C H#4/E 2-5 4#0$1 H-& 9H# K5E%1#EE -/#$09#E
L#MJM B- 9H#2 H0"# I09N9H%1 -$ E90K4#N"-4064# -/#$061J .0$J%1ENE04#E O B-
9H#2 E/#1: 0 4-9 -1 .0$P#61JO -1 QRBO 8E 9H# K5E%1#EE ;0/%904 %19#1E%"#S
-$ ;0/%904 4%JH9OT
• GH# .-:#4 %E "#$2 0.#10K4# 9- E#1E%6"%92 01042E%ES &H%;H 044-&E 2-5 9-
J#9 01 51:#$E901:%1J -I 9H# %./-$9019 "045# :$%"#$E
•
B,C "045# EH-54: K# 4#EE 0U#;9#: K2 9H# ;5$$#19 V.--: -I 9H# .0$P#9W%M#MS /01%; -$ #5/H-$%0" B,C ;01 H#4/ 2-5 :#9#;9 0 K5KK4#
• B,C %E I51:0.#1904 "045#X Y3 -I 9H# ;0EH Z-&E $#;#%"#: 0E 01 -&1#$ %E 0
/-&#$I54 %:#0M GH# /$-[#;6-1E ;01 0;;-..-:09# E5/#$%-$ %1I-$.06-1
DCF Model
•
\8\! 7 \0$K0J# 81S \0$K0J# !59
•
GH# .-:#4 ;01 K# 9�P#: K2 0 EP%44#: /$0;66-1#$ 9- E02 [5E9 0K-590129H%1J LGH#$# 0$# 0 4-9 -I :%04E 9- 95$1S 01: %I 2-5 95$1 9H#. 044 %1 9H#
E0.# :%$#;6-1 2-5 ;01 E&02 9H# "045#S #"#1 %I 1- -1# -I 9H# :%04E 4--PE
51$#0E-10K4# -1 %9E -&1T
• ]-5^$# I-$;#: 9- 9$2 01: /$#:%;9 9H# I595$#S &H%;H %ES -I ;-5$E#S %./-EE%K4#
_`B 01 51;-.I-$90K4# &02 9- &-$P
P R O S
C O N S
,-./012 304506-1 7 B,C D-:#4E ( @?
7/24/2019 Valuation Slides Week1 1 - Intro and FFCF Previtero
http://slidepdf.com/reader/full/valuation-slides-week1-1-intro-and-ffcf-previtero 20/45
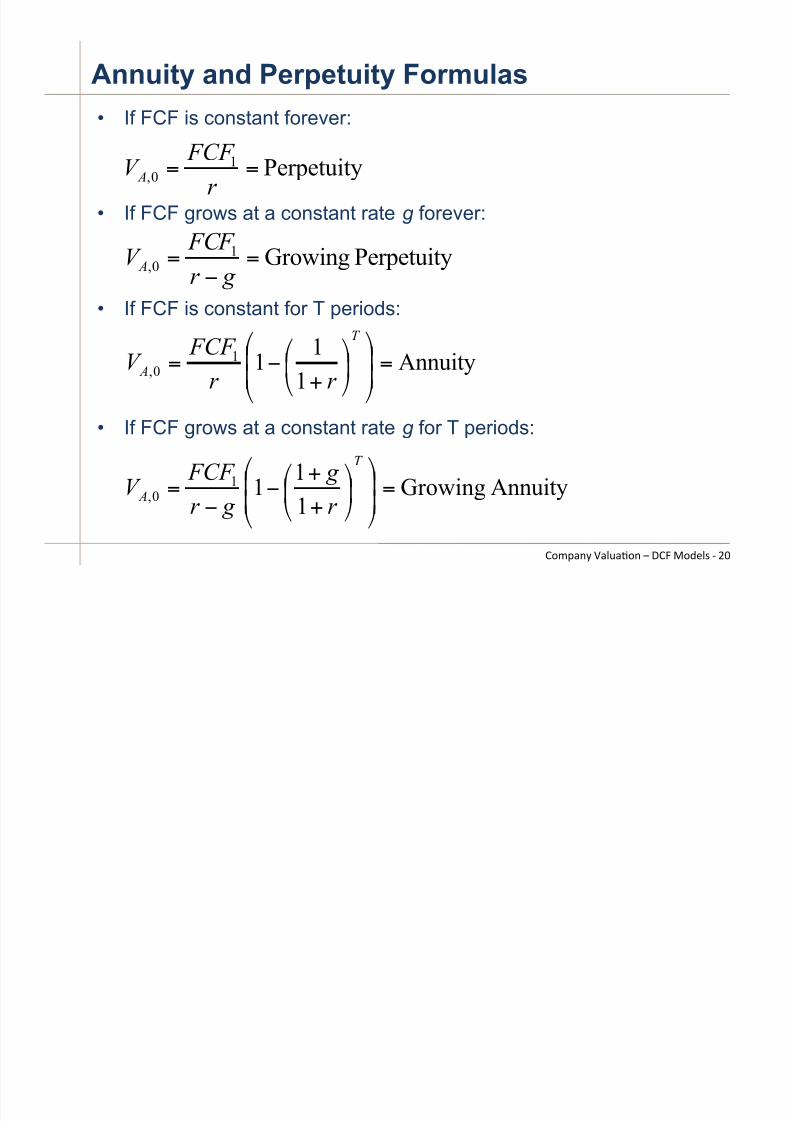
Annuity and Perpetuity Formulas
• If FCF is constant forever:
•
If FCF grows at a constant rate g forever:
• If FCF is constant for T periods:
•
If FCF grows at a constant rate g for T periods:
Perpetuity10, ==
r
FCF V A
,-./012 304506-1 7 B,C D-:#4E ( )A
PerpetuityGrowing10, =
!
=
g r
FCF V A
Annuity1
111
0, =!!
"
#
$$
%
&!"
#$%
&
+
'=
T
A
r r
FCF V
AnnuityGrowing1
111
0, =!!
"
#
$$
%
&!"
#$%
&
+
+
''
=
T
Ar
g
g r
FCF V
7/24/2019 Valuation Slides Week1 1 - Intro and FFCF Previtero
http://slidepdf.com/reader/full/valuation-slides-week1-1-intro-and-ffcf-previtero 21/45
• Introduction – Accounting Principles•
Discounted Cash Flow (DCF) Models – FFCF
– Discount Rate –
No Friction Model
–
WACC (Weighted Average Cost of Capital) – APV (Adjusted Present Value)
•
Multiples• Other topics: LBO’s, M&A, etc.
I. Company Valuation
7/24/2019 Valuation Slides Week1 1 - Intro and FFCF Previtero
http://slidepdf.com/reader/full/valuation-slides-week1-1-intro-and-ffcf-previtero 22/45
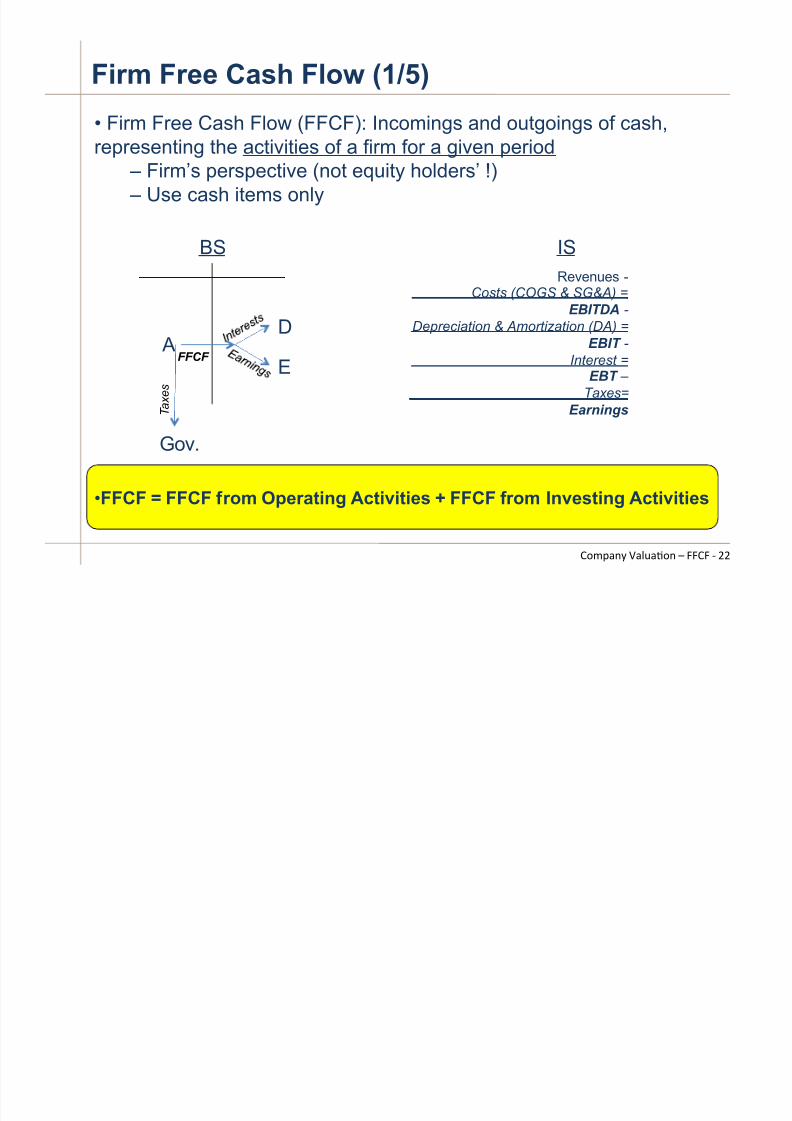
Firm Free Cash Flow (1/5)
,-./012 304506-1 7 CC,C ( ))
• Firm Free Cash Flow (FFCF): Incomings and outgoings of cash,
representing the activities of a firm for a given period ! Firm’s perspective (not equity holders’ !) ! Use cash items only
• FFCF = FFCF from Operating Activities + FFCF from Investing Activities
D
E
Revenues -Costs (COGS & SG&A) =
EBITDA -
Depreciation & Amortization (DA) =
EBIT -
Interest =EBT –
Taxes=
Earnings
BS IS
T a x e s
Gov.
A FFCF
7/24/2019 Valuation Slides Week1 1 - Intro and FFCF Previtero
http://slidepdf.com/reader/full/valuation-slides-week1-1-intro-and-ffcf-previtero 23/45
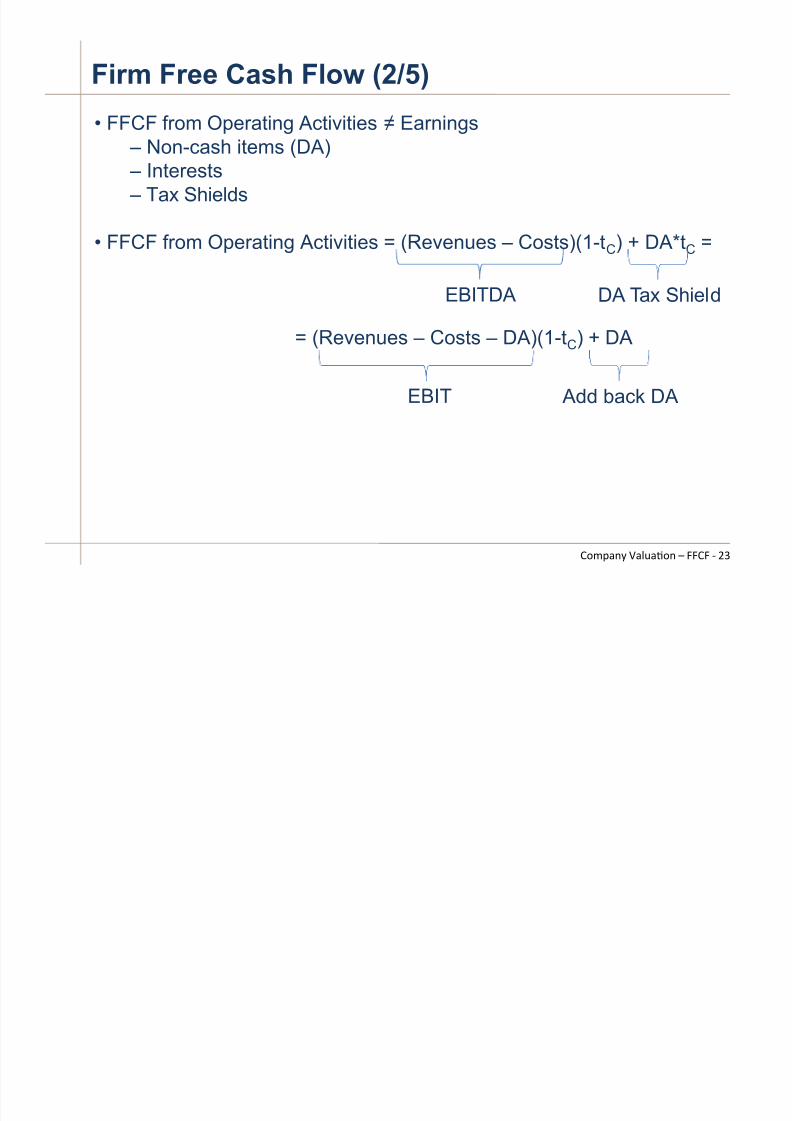
Firm Free Cash Flow (2/5)
• FFCF from Operating Activities $ Earnings
!
Non-cash items (DA) ! Interests ! Tax Shields
• FFCF from Operating Activities = (Revenues – Costs)(1-tC) + DA*tC =
= (Revenues – Costs – DA)(1-tC) + DA
EBITDA DA Tax Shield
EBIT Add back DA
,-./012 304506-1 7 CC,C ( )*
7/24/2019 Valuation Slides Week1 1 - Intro and FFCF Previtero
http://slidepdf.com/reader/full/valuation-slides-week1-1-intro-and-ffcf-previtero 24/45
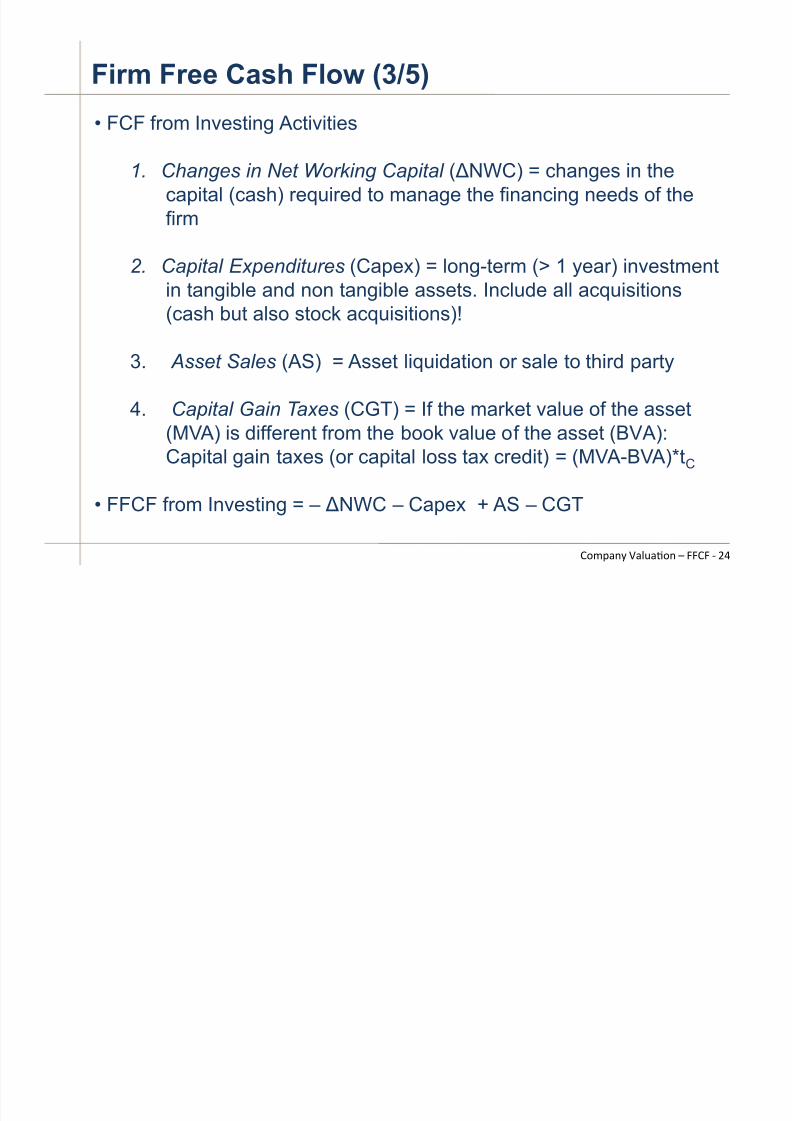
Firm Free Cash Flow (3/5)
• FCF from Investing Activities
1. Changes in Net Working Capital ( %NWC) = changes in thecapital (cash) required to manage the financing needs of thefirm
2. Capital Expenditures (Capex) = long-term (> 1 year) investmentin tangible and non tangible assets. Include all acquisitions(cash but also stock acquisitions)!
3. Asset Sales (AS) = Asset liquidation or sale to third party
4.
Capital Gain Taxes (CGT) = If the market value of the asset(MVA) is different from the book value of the asset (BVA):Capital gain taxes (or capital loss tax credit) = (MVA-BVA)*tC
• FFCF from Investing = – %NWC – Capex + AS – CGT
,-./012 304506-1 7 CC,C ( )+
7/24/2019 Valuation Slides Week1 1 - Intro and FFCF Previtero
http://slidepdf.com/reader/full/valuation-slides-week1-1-intro-and-ffcf-previtero 25/45
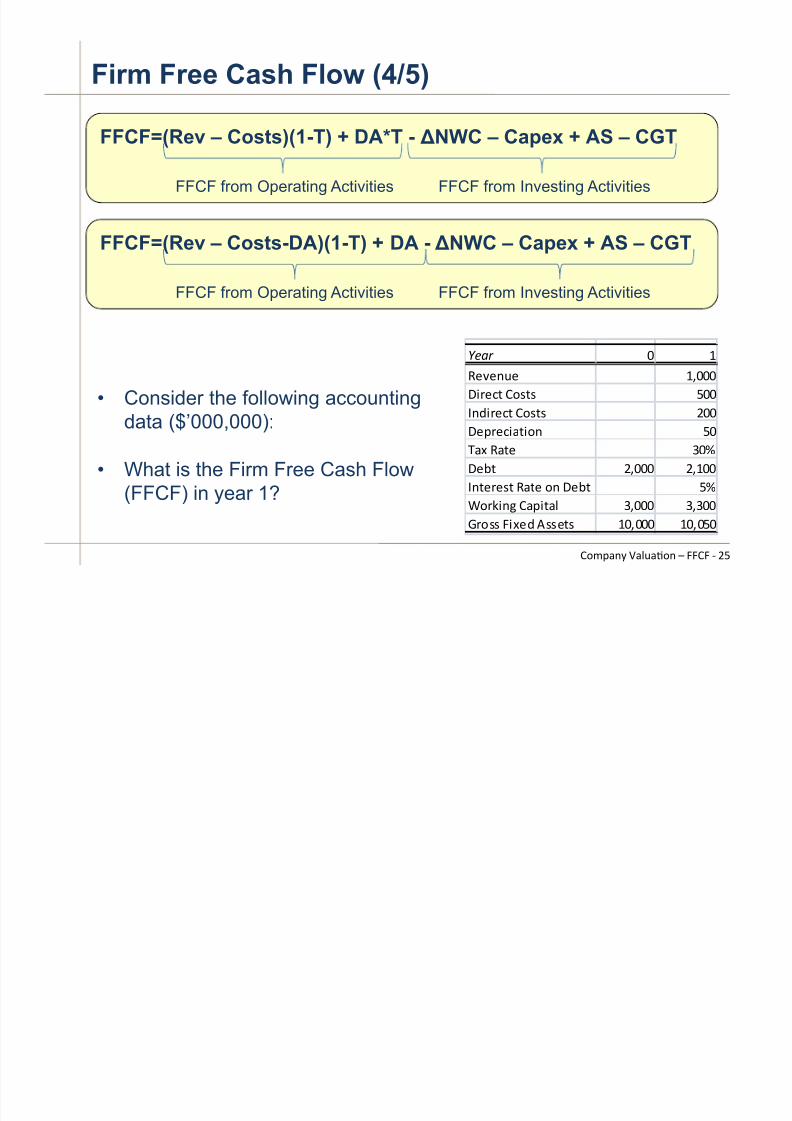
Firm Free Cash Flow (4/5)
• Consider the following accounting
data ($’000,000):
• What is the Firm Free Cash Flow(FFCF) in year 1?
!"#$ ! "
#$%$&'$ "(!!!
)*+$,- /01-1 2!!
3&4*+$,- /01-1 5!!)$6+$,*7-*0& 2!
879 #7-$ :!;
)$<- 5(!!! 5("!!
3&-$+$1- #7-$ 0& )$<- 2;
=0+>*&? /76*-7@ :(!!! :(:!!
A+011 B*9$4 C11$-1 "!(!!! "!(!2!
FFCF=(Rev – Costs)(1-T) + DA*T - !NWC – Capex + AS – CGT
FFCF from Operating Activities FFCF from Investing Activities
FFCF=(Rev – Costs-DA)(1-T) + DA - !NWC – Capex + AS – CGT
FFCF from Operating Activities FFCF from Investing Activities
,-./012 304506-1 7 CC,C ( )F
7/24/2019 Valuation Slides Week1 1 - Intro and FFCF Previtero
http://slidepdf.com/reader/full/valuation-slides-week1-1-intro-and-ffcf-previtero 26/45
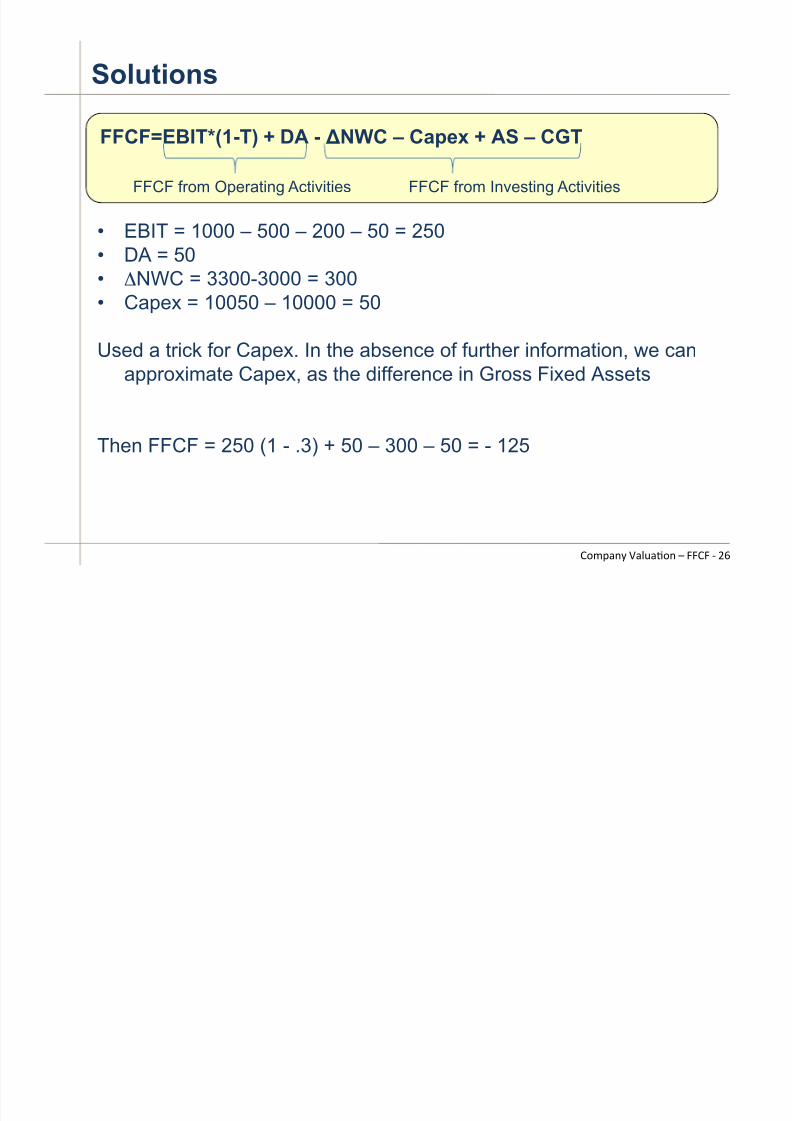
Solutions
• EBIT = 1000 – 500 – 200 – 50 = 250• DA = 50
•
!NWC = 3300-3000 = 300• Capex = 10050 – 10000 = 50
Used a trick for Capex. In the absence of further information, we canapproximate Capex, as the difference in Gross Fixed Assets
Then FFCF = 250 (1 - .3) + 50 – 300 – 50 = - 125
FFCF=EBIT*(1-T) + DA - !NWC – Capex + AS – CGT
FFCF from Operating Activities FFCF from Investing Activities
,-./012 304506-1 7 CC,C ( )<
7/24/2019 Valuation Slides Week1 1 - Intro and FFCF Previtero
http://slidepdf.com/reader/full/valuation-slides-week1-1-intro-and-ffcf-previtero 27/45
What is the FFCF of HOG in FY2015
,-./012 304506-1 7 CC,C ( )=
7/24/2019 Valuation Slides Week1 1 - Intro and FFCF Previtero
http://slidepdf.com/reader/full/valuation-slides-week1-1-intro-and-ffcf-previtero 28/45
How do you forecast FFCF?
• When a firm earns above their risk-adjusted rates ofreturn, it creates value.
•
The most important step in understanding how acompany creates value is to analyze its businessenvironment
1. Analysis of macro-economic conditions
2.
Analysis of industry dynamics
3. Analysis of intra-industry firm’s competitive
advantage4. Analysis of firm’s historical performance
,-./012 304506-1 7 CC,C ( )>
7/24/2019 Valuation Slides Week1 1 - Intro and FFCF Previtero
http://slidepdf.com/reader/full/valuation-slides-week1-1-intro-and-ffcf-previtero 29/45
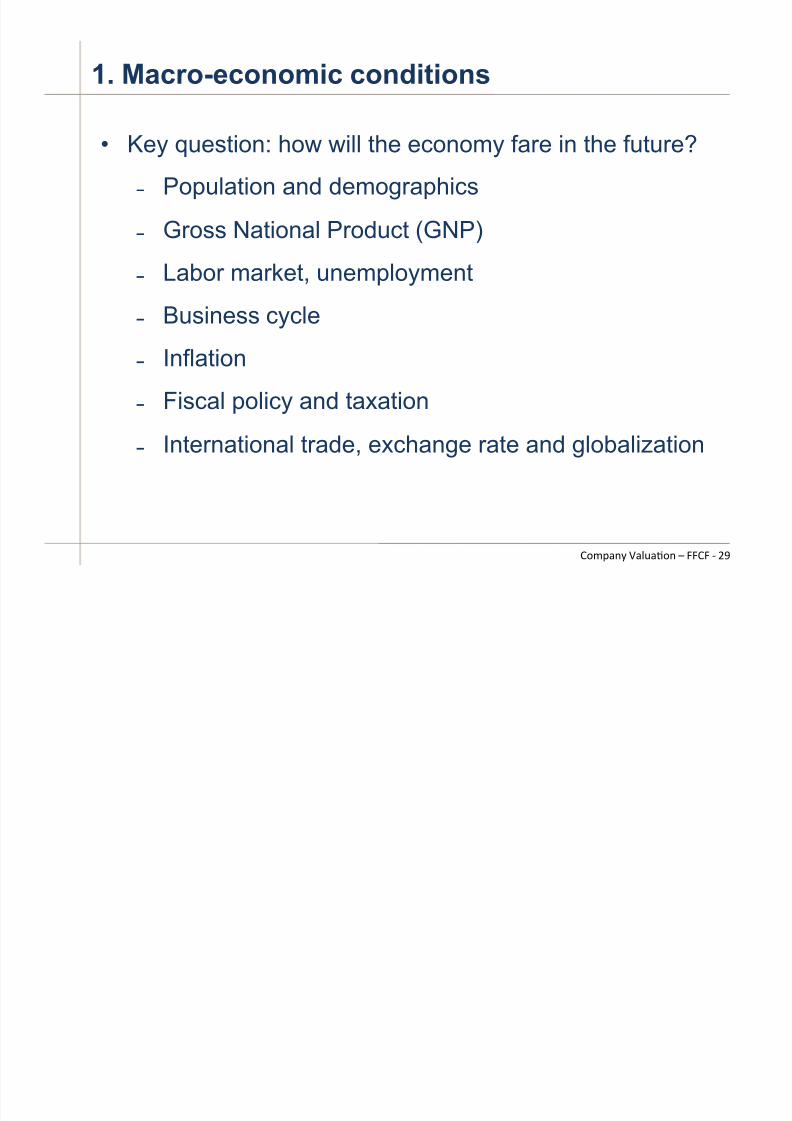
1. Macro-economic conditions
•
Key question: how will the economy fare in the future?
& Population and demographics
& Gross National Product (GNP)
&
Labor market, unemployment& Business cycle
& Inflation
& Fiscal policy and taxation
& International trade, exchange rate and globalization
,-./012 304506-1 7 CC,C ( )?

7/24/2019 Valuation Slides Week1 1 - Intro and FFCF Previtero
http://slidepdf.com/reader/full/valuation-slides-week1-1-intro-and-ffcf-previtero 30/45
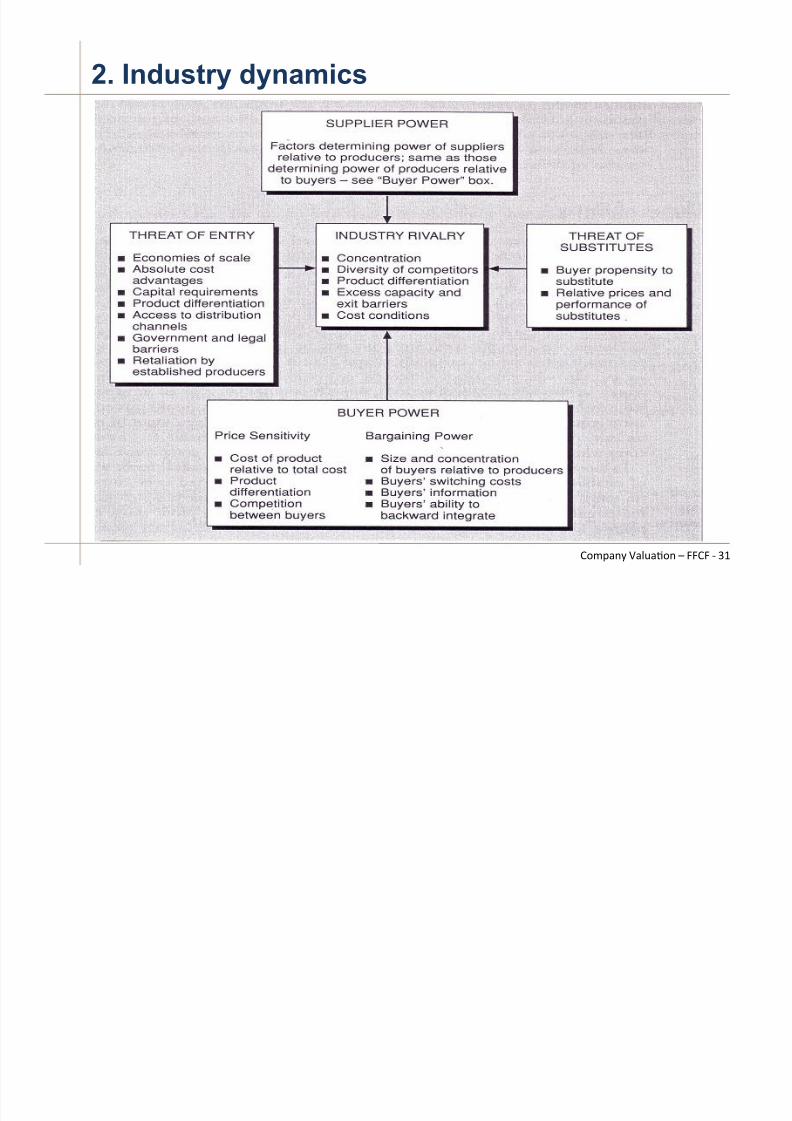
2. Industry dynamics
•
Key question: What are main trends and characteristicsof the industry the firm is in?
• Industry analysis using Porter’s Five Forces
' Intensity of the rivalry among industry competitors
' Threat of new entrants into the industry
' Threat of substitution (substitute for the industry’sproducts and services
' Bargaining power of the buyers of the industry’sproduct
' Bargaining power of the suppliers of inputs for theindustry
,-./012 304506-1 7 CC,C ( *A
7/24/2019 Valuation Slides Week1 1 - Intro and FFCF Previtero
http://slidepdf.com/reader/full/valuation-slides-week1-1-intro-and-ffcf-previtero 31/45
2. Industry dynamics
,-./012 304506-1 7 CC,C ( *@
7/24/2019 Valuation Slides Week1 1 - Intro and FFCF Previtero
http://slidepdf.com/reader/full/valuation-slides-week1-1-intro-and-ffcf-previtero 32/45
3. Intra-industry competitive advantage
•
Key question: Does the firm have a competitiveadvantage compared to its competitors? If yes, whichtype?
' Product differentiation (superior quality, variety,
delivery or service, image, brand, R&D) ' Cost leadership (economies of scale/scope,
efficiencies in production or distribution, simplerdesigns, better technology, lower input costs, bettercost controls)
• Examples of competitive advantage: Product pricereductions (e.g., Walmart), Product innovations (e.g.,
Apple), Product delivery innovations (e.g., Amazon),Lower production costs (e.g., outsourcing)
,-./012 304506-1 7 CC,C ( *)
7/24/2019 Valuation Slides Week1 1 - Intro and FFCF Previtero
http://slidepdf.com/reader/full/valuation-slides-week1-1-intro-and-ffcf-previtero 33/45
3. Intra-industry competitive advantage
•
Is the competitive advantage sustainable? Why? Forhow long?
• What prevents other firms from copying the firm andeliminating the competitive advantage? What’s the
barrier? What are the unique competencies that the firmpossesses?
• How isolate the rents are from customers and suppliers?
• The economic environment changes quickly over time.
In a financial forecasts, these changes have to beconsidered and modeled accordingly.
,-./012 304506-1 7 CC,C ( **
7/24/2019 Valuation Slides Week1 1 - Intro and FFCF Previtero
http://slidepdf.com/reader/full/valuation-slides-week1-1-intro-and-ffcf-previtero 34/45
4. Firm’s historical performance
•
Financial ratios are useful when analyzing a firm’shistorical performance and forecasting financialstatements:
' Hard to find out what is a good or a bad level
' Ratios vary over time and across industries.Comparing ratios with competitors and comparablecompanies is crucial.
' Different ratios are used in different industries.
' Ratios are used in bank covenants (working capital,leverage, direct dividend constraints,#)
' Ratios are used in some compensation contracts toincentivize managers to perform
,-./012 304506-1 7 CC,C ( *+
7/24/2019 Valuation Slides Week1 1 - Intro and FFCF Previtero
http://slidepdf.com/reader/full/valuation-slides-week1-1-intro-and-ffcf-previtero 35/45
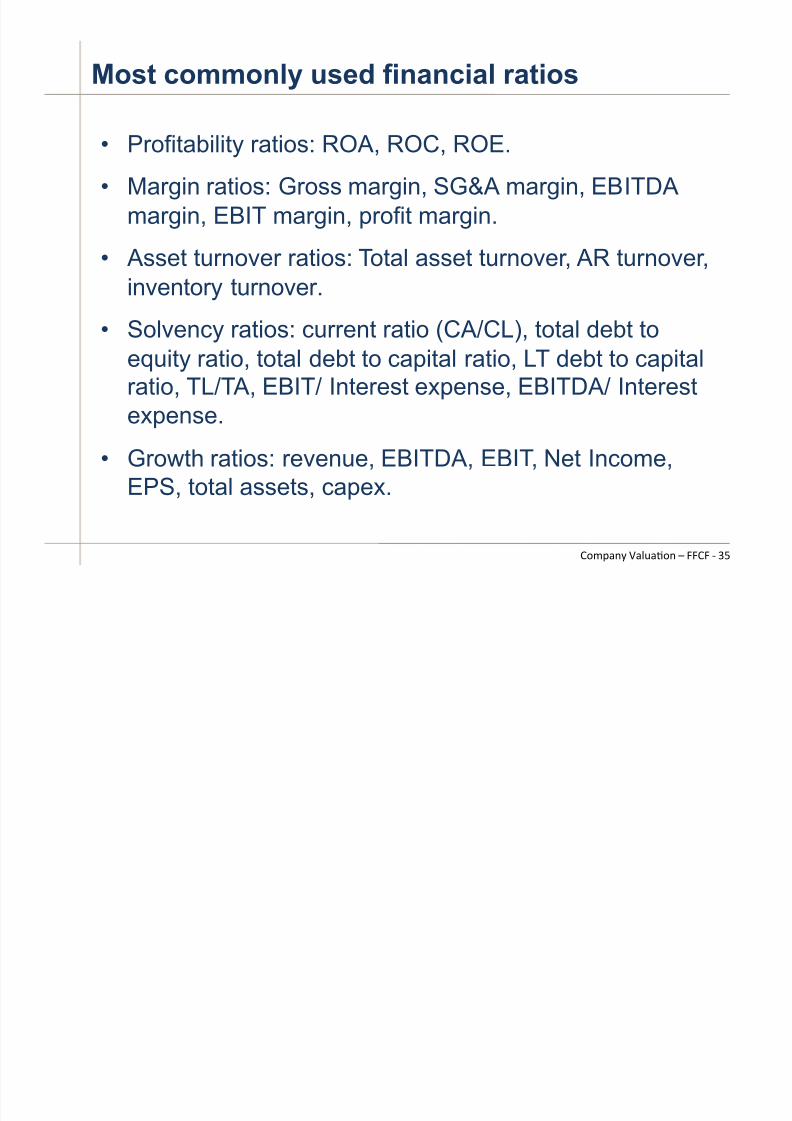
Most commonly used financial ratios
•
Profitability ratios: ROA, ROC, ROE.
• Margin ratios: Gross margin, SG&A margin, EBITDAmargin, EBIT margin, profit margin.
• Asset turnover ratios: Total asset turnover, AR turnover,
inventory turnover.
• Solvency ratios: current ratio (CA/CL), total debt toequity ratio, total debt to capital ratio, LT debt to capitalratio, TL/TA, EBIT/ Interest expense, EBITDA/ Interest
expense.• Growth ratios: revenue, EBITDA, EBIT, Net Income,
EPS, total assets, capex.
,-./012 304506-1 7 CC,C ( *F
7/24/2019 Valuation Slides Week1 1 - Intro and FFCF Previtero
http://slidepdf.com/reader/full/valuation-slides-week1-1-intro-and-ffcf-previtero 36/45
Financial ratios for HOG
,-./012 304506-1 7 CC,C ( *<
Harley-Davidson Inc (NYS: HOG): Ratios
Date 12/31/2001 12/31/2002 12/31/2003 12/31/2004 12/31/2005 12/31/2006 12/31/2007 12/31/2008 12/31/2009 12/31/2010 12/31/2011 12/31/2012 12/31/2013 3/31/2014 6/30/2014 9/30/2014Profitability Q1 Q2 Q3Return on Assets % 14.0% 15.0% 15.5% 16.2% 18.3% 18.9% 16.5% 7.9% -0.6% 1.6% 6.2% 6.8% 7.8% 10.9% 14.1% 6.0%Return on Capital % 18.6% 19.4% 19.3% 19.7% 22.4% 23.4% 20.9% 10.3% -0.7% 1.8% 7.4% 8.1% 8.9% 12.9% 16.2% 6.9%Return on Equity % 24.9% 26.0% 25.7% 27.6% 31 .1% 37.8% 39.3% 29.3% -2.6% 6.6% 24.8% 24.4% 24.4% 33.7% 42.1% 18.3%
Margin Analysis
Gross Margin % 42.9% 42.0% 43.9% 45.6% 45.6% 46.0% 44.7% 42.8% 44.5% 50.1% 46.7% 46.9% 46.9% 47.2% 51.4% 59.4%SG&A Margin % 16.3% 14.8% 13.9% 13.6% 13.4% 13.5% 14.6% 16.5% 20.5% 21.3% 19.9% 19.9% 19.1% 16.0% 14.3% 21.5%EBITDA Margin % 23.9% 25.0% 28.1% 30.3% 30.4% 30.6% 28.1% 23.6% 15.3% 23.3% 25.1% 26.1% 26.9% 30.0% 36.3% 36.3%EBIT Margin %
19.6% 20.9% 24.1% 26.3% 26.8% 27.1% 24.8% 19.5% 10.1% 15.8% 20.1% 21.5% 22.4% 26.1% 29.5% 20.4%Net Income Margin % 12.3% 13.5% 15.5% 16.7% 16 .9% 16.8% 15.1% 10.4% -1.2% 3.1% 11.3% 11.2% 12.4% 15.4% 17.7% 11.5%
Asset Turnover
Total Asset Turnover 114% 112% 100% 97% 108% 112% 109% 76% 52% 51% 55% 61% 63% 71% 79% 52% Accounts Receivable Turnover 28 38 41 41 44 41 32 19 16 16 21 21 20 19 25 16Inventory Turnover 19 19 22 22 24 20 16 14 13 13 11 13 12 14 20 10
Short Term Liquidity
Current Ratio 2.3 2.1 2.9 2.8 3.6 2.2 1.8 2.1 1.9 2.0 1.7 2.7 1.6 1.5 1.8 1.6Total Debt/Equity 34.0% 34.2% 33.6% 40.3% 39.1% 61.8% 88.4% 185.0% 270.7% 260.7% 236.4% 199.5% 174.8% 161.2% 159.2% 165.8%Total Debt/Capital 25.4% 25.5% 25.2% 28.7% 28.1% 38.2% 46.9% 64.9% 73.0% 72.3% 70.3% 66.6% 63.6% 61.7% 61.4% 62.4%LT Debt/Capital 16.1% 12.7% 17.0% 17.7% 23.3% 19.5% 21.9% 36.1% 52.7% 56.8% 47.2% 57.1% 41.3% 39.6% 43.5% 40.9%Total Liabilities/Total Assets 43.7% 42.2% 39.9% 41.3% 41.3% 50.2% 58.0% 73.0% 77.0% 76.6% 75.0% 72.1% 68.0% 67.5% 66.6% 67.2%EBIT / Interest Exp. 28.3 59.5 67.1 61.7 42.2 28.2 18.8 8.5 1.6 2.1 3.9 5.0 6.3 10.6 14.3 6.6EBITDA / Interest Exp. 34.5 71.1 78.3 71.1 47.8 31.8 21.3 10.3 2.4 3.1 4.9 6.0 7.5 12.2 17.7 11.8
Growth Over Prior Year
Total Revenue 21.6% 13.0% 8.5% 6.5% 8.6% -1.3% -2.3% -23.4% - 2.6% 11.6% 6.0% 6.4% 19.6% 39.5% -14.0%EBITDA 26.5% 28.2% 17.1% 7.0% 9.7% -8.7% -18.7% -48.2% 52.7% 19.9% 9.3% 8.7% 30.8% 83.2% 19.2%EBIT 29.0% 31.4% 18.5% 8.7% 10.5% -9.2% -23.7% -58.5% 55.7% 41.7% 12.8% 10.1% 36.3% 78.2% -19.8%Net Income 32.5% 31.1% 16.9% 7.8% 8.7% -10.5% -33.5% -108.9% -365.9% 308.8% 4.1% 17.6% 44.9% 93.0% -18.2%Diluted EPS before Extra 32.6% 31.6% 19.8% 15.8% 15.4% -3.1% -31.9% -108.8% -364.5% 317.7% 6.2% 21.4% 44.9% 94.1% -16.9%Total Assets 23.8% 27.5% 11.4% -4.2% 5.3% 2.2% 38.4% 16.9% 3.0% 2.6% -5.2% 2.6% 3.5% 7.1% 6.6%Capital Expenditures 11.5% -29.8% -6.0% -7.1% 1 0.7% 10.3% -4.1% -49.7% 4 6.3% 10.6% 0.0% 10.2 % -50.3% 43.1% 131.0%
7/24/2019 Valuation Slides Week1 1 - Intro and FFCF Previtero
http://slidepdf.com/reader/full/valuation-slides-week1-1-intro-and-ffcf-previtero 37/45
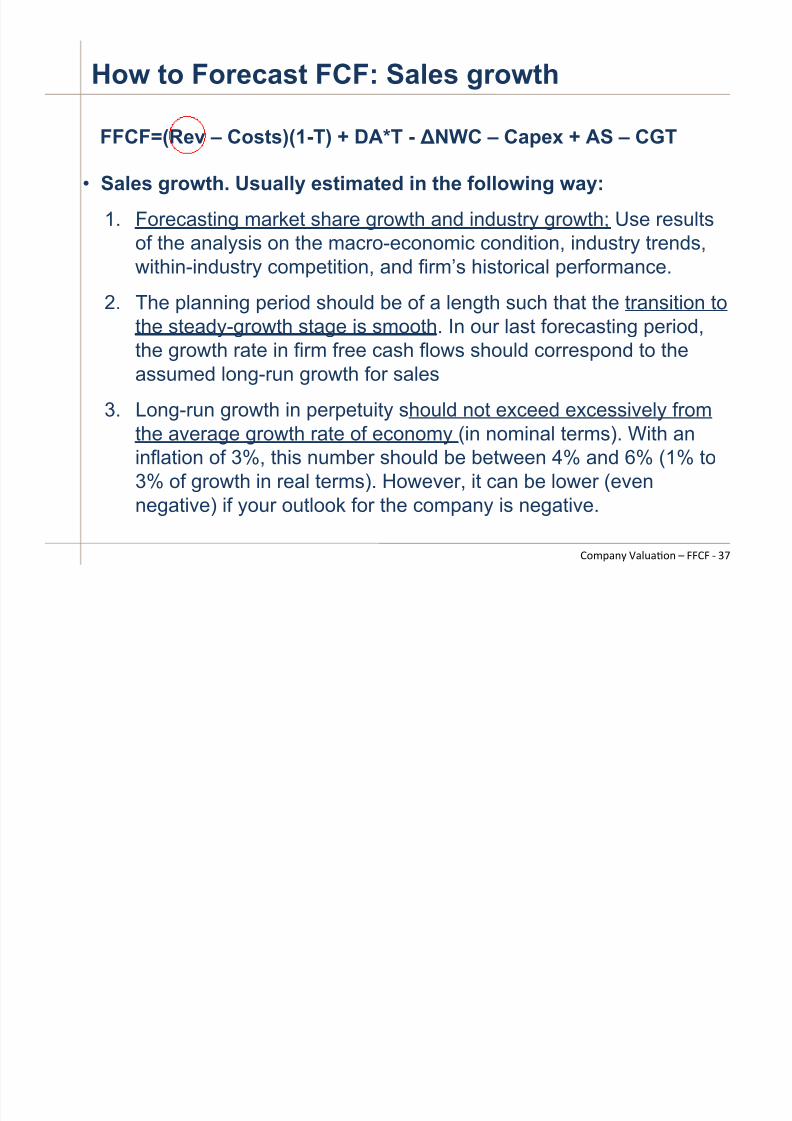
How to Forecast FCF: Sales growth
• Sales growth. Usually estimated in the following way:
1. Forecasting market share growth and industry growth; Use resultsof the analysis on the macro-economic condition, industry trends,within-industry competition, and firm’s historical performance.
2. The planning period should be of a length such that the transition tothe steady-growth stage is smooth. In our last forecasting period,the growth rate in firm free cash flows should correspond to theassumed long-run growth for sales
3.
Long-run growth in perpetuity should not exceed excessively fromthe average growth rate of economy (in nominal terms). With aninflation of 3%, this number should be between 4% and 6% (1% to3% of growth in real terms). However, it can be lower (evennegative) if your outlook for the company is negative.
FFCF=(Rev – Costs)(1-T) + DA*T -!
NWC – Capex + AS – CGT
,-./012 304506-1 7 CC,C ( *=
7/24/2019 Valuation Slides Week1 1 - Intro and FFCF Previtero
http://slidepdf.com/reader/full/valuation-slides-week1-1-intro-and-ffcf-previtero 38/45
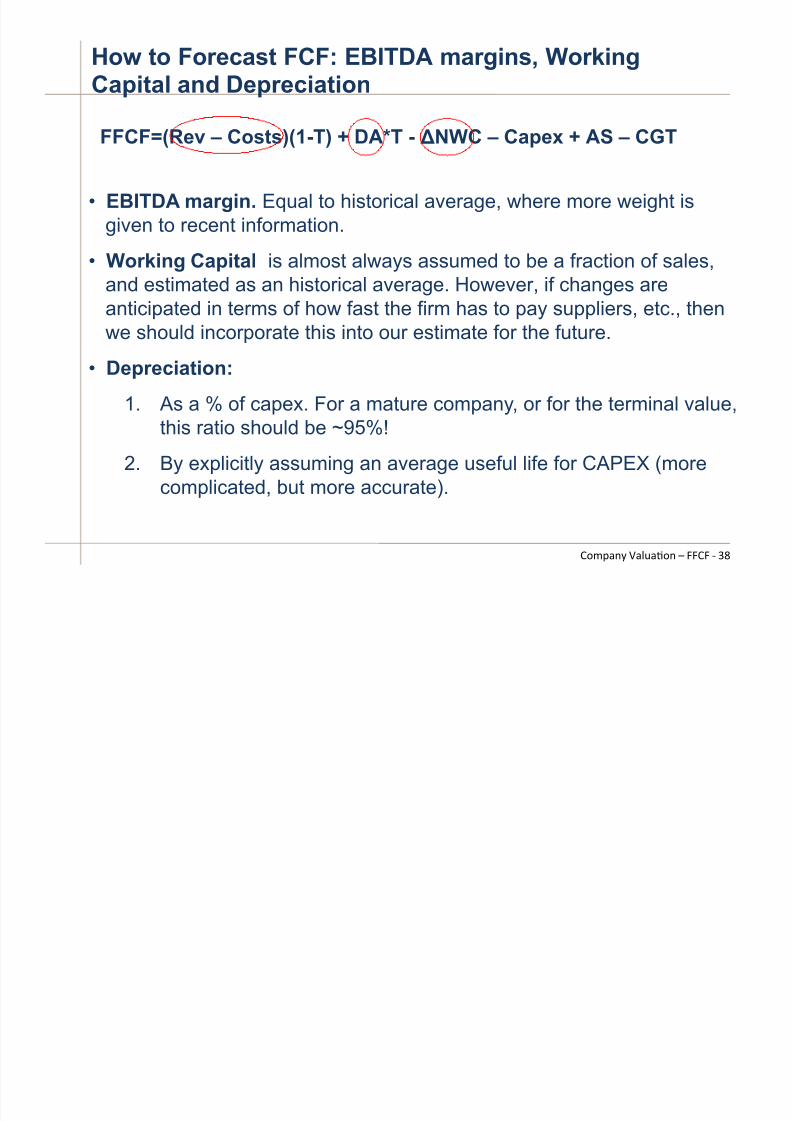
How to Forecast FCF: EBITDA margins, WorkingCapital and Depreciation
• EBITDA margin. Equal to historical average, where more weight isgiven to recent information.
• Working Capital is almost always assumed to be a fraction of sales,
and estimated as an historical average. However, if changes areanticipated in terms of how fast the firm has to pay suppliers, etc., thenwe should incorporate this into our estimate for the future.
• Depreciation:
1. As a % of capex. For a mature company, or for the terminal value,
this ratio should be ~95%!
2.
By explicitly assuming an average useful life for CAPEX (morecomplicated, but more accurate).
FFCF=(Rev – Costs)(1-T) + DA*T -!
NWC – Capex + AS – CGT
,-./012 304506-1 7 CC,C ( *>
7/24/2019 Valuation Slides Week1 1 - Intro and FFCF Previtero
http://slidepdf.com/reader/full/valuation-slides-week1-1-intro-and-ffcf-previtero 39/45
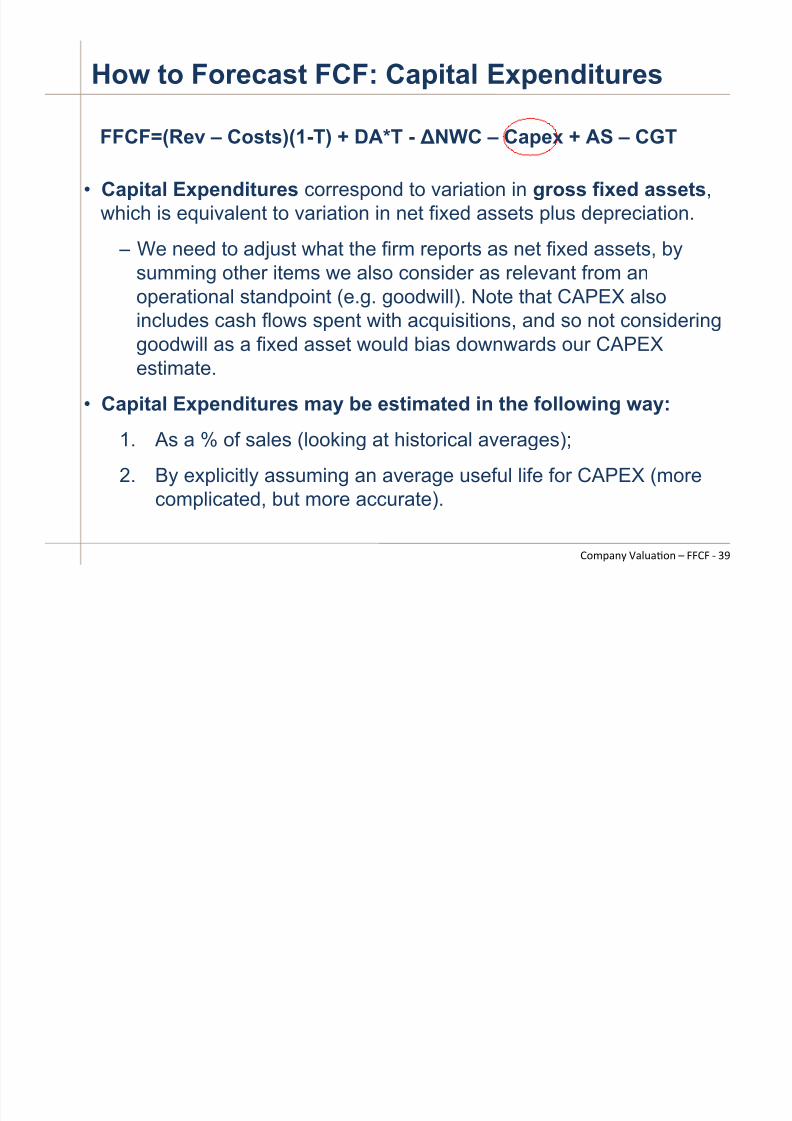
How to Forecast FCF: Capital Expenditures
• Capital Expenditures correspond to variation in gross fixed assets,which is equivalent to variation in net fixed assets plus depreciation.
–
We need to adjust what the firm reports as net fixed assets, by
summing other items we also consider as relevant from anoperational standpoint (e.g. goodwill). Note that CAPEX alsoincludes cash flows spent with acquisitions, and so not consideringgoodwill as a fixed asset would bias downwards our CAPEXestimate.
• Capital Expenditures may be estimated in the following way:
1. As a % of sales (looking at historical averages);
2. By explicitly assuming an average useful life for CAPEX (morecomplicated, but more accurate).
FFCF=(Rev – Costs)(1-T) + DA*T -!
NWC – Capex + AS – CGT
,-./012 304506-1 7 CC,C ( *?
7/24/2019 Valuation Slides Week1 1 - Intro and FFCF Previtero
http://slidepdf.com/reader/full/valuation-slides-week1-1-intro-and-ffcf-previtero 40/45
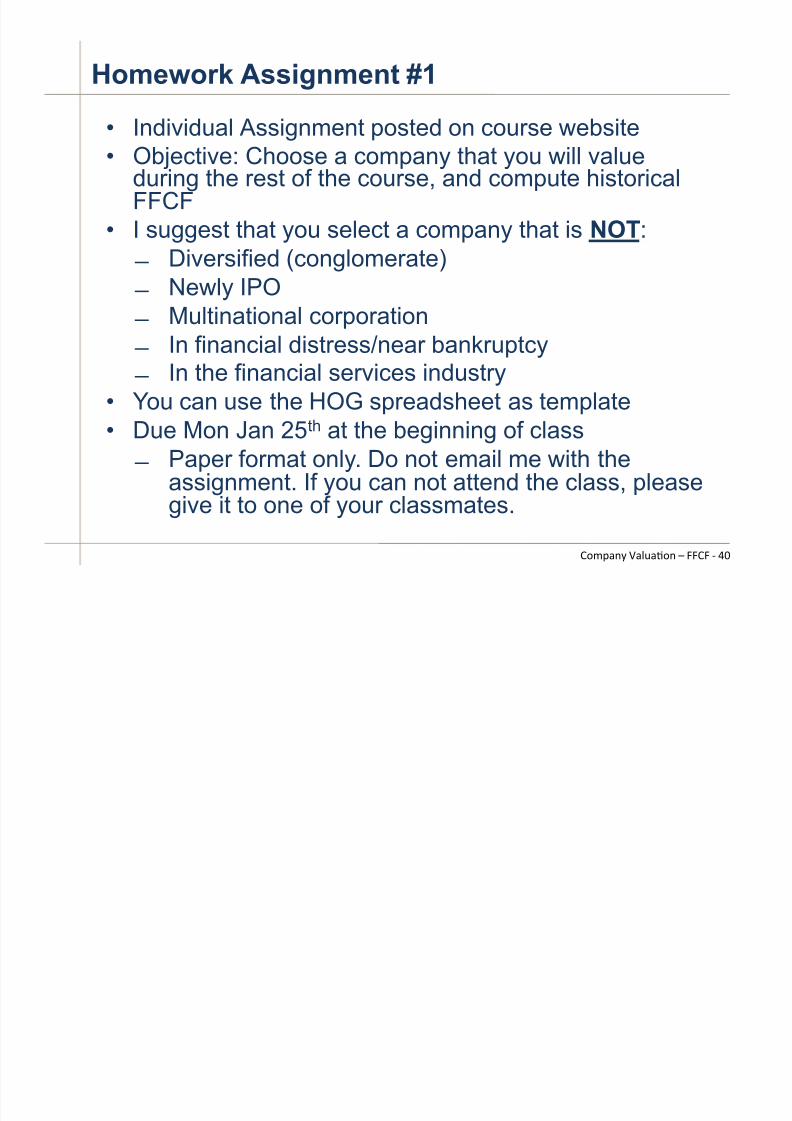
Homework Assignment #1
• Individual Assignment posted on course website•
Objective: Choose a company that you will valueduring the rest of the course, and compute historicalFFCF
• I suggest that you select a company that is NOT: " Diversified (conglomerate)
" Newly IPO " Multinational corporation " In financial distress/near bankruptcy " In the financial services industry
• You can use the HOG spreadsheet as template
•
Due Mon Jan 25th at the beginning of class " Paper format only. Do not email me with the
assignment. If you can not attend the class, pleasegive it to one of your classmates.
,-./012 304506-1 7 CC,C ( +A

7/24/2019 Valuation Slides Week1 1 - Intro and FFCF Previtero
http://slidepdf.com/reader/full/valuation-slides-week1-1-intro-and-ffcf-previtero 41/45
Reminder:
,-./012 304506-1 7 CC,C ( +@
•
Fill up the classroom policy survey by tomorrow(Thursday) at 5pm
• Make-up class this Friday same room same time.
7/24/2019 Valuation Slides Week1 1 - Intro and FFCF Previtero
http://slidepdf.com/reader/full/valuation-slides-week1-1-intro-and-ffcf-previtero 42/45
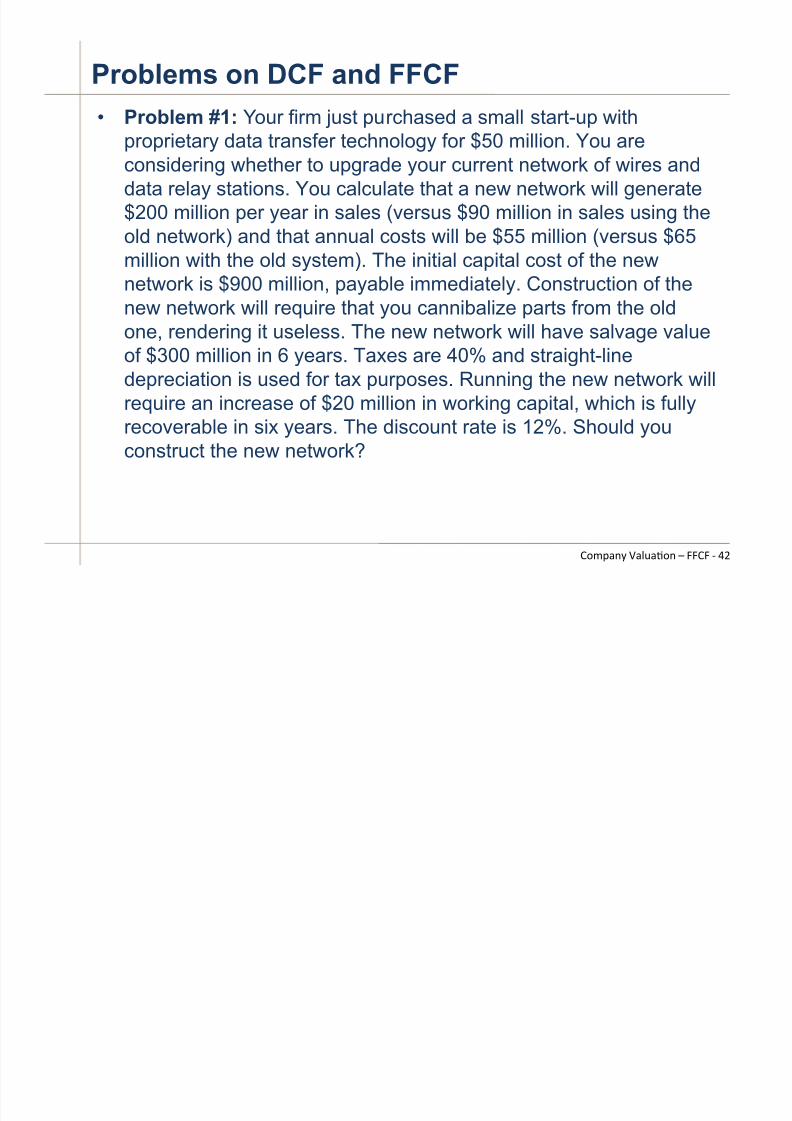
• Problem #1: Your firm just purchased a small start-up with
proprietary data transfer technology for $50 million. You areconsidering whether to upgrade your current network of wires anddata relay stations. You calculate that a new network will generate$200 million per year in sales (versus $90 million in sales using theold network) and that annual costs will be $55 million (versus $65million with the old system). The initial capital cost of the new
network is $900 million, payable immediately. Construction of thenew network will require that you cannibalize parts from the oldone, rendering it useless. The new network will have salvage valueof $300 million in 6 years. Taxes are 40% and straight-linedepreciation is used for tax purposes. Running the new network willrequire an increase of $20 million in working capital, which is fully
recoverable in six years. The discount rate is 12%. Should youconstruct the new network?
Problems on DCF and FFCF
,-./012 304506-1 7 CC,C ( +)
7/24/2019 Valuation Slides Week1 1 - Intro and FFCF Previtero
http://slidepdf.com/reader/full/valuation-slides-week1-1-intro-and-ffcf-previtero 43/45
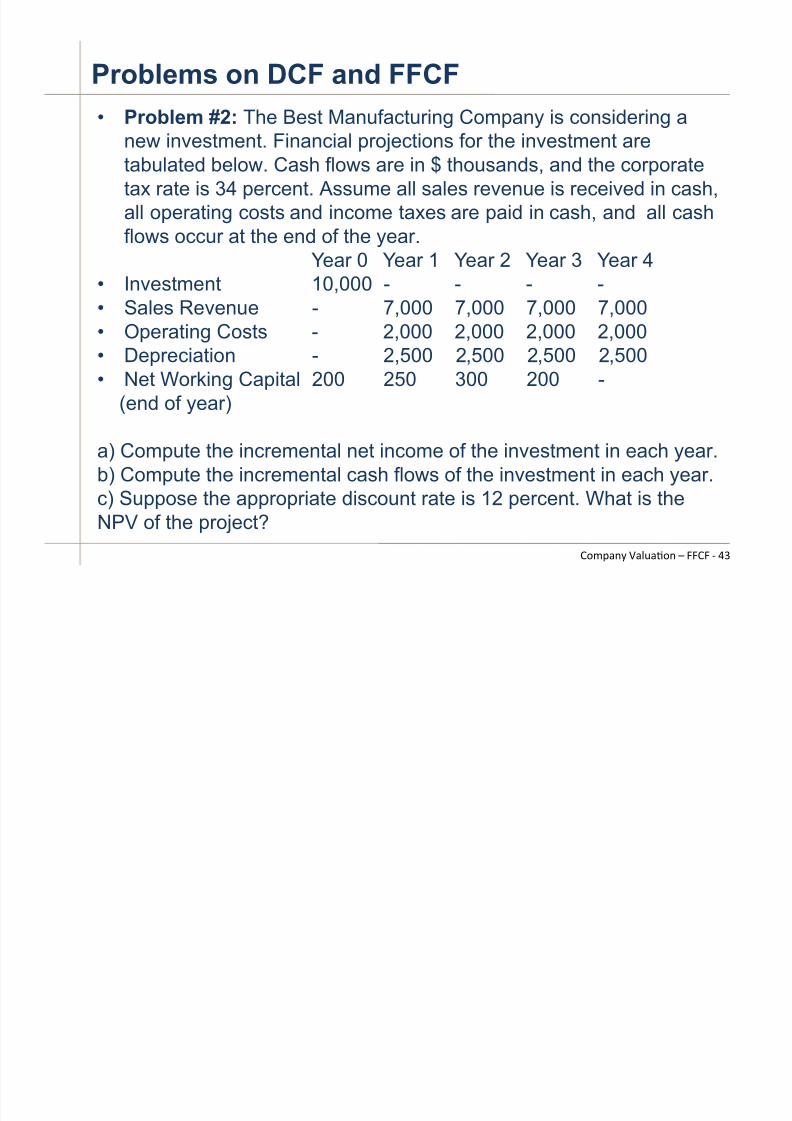
• Problem #2: The Best Manufacturing Company is considering a
new investment. Financial projections for the investment aretabulated below. Cash flows are in $ thousands, and the corporatetax rate is 34 percent. Assume all sales revenue is received in cash,all operating costs and income taxes are paid in cash, and all cashflows occur at the end of the year.
Year 0 Year 1 Year 2 Year 3 Year 4
•
Investment 10,000 - - - -• Sales Revenue - 7,000 7,000 7,000 7,000• Operating Costs - 2,000 2,000 2,000 2,000• Depreciation - 2,500 2,500 2,500 2,500• Net Working Capital 200 250 300 200 -
(end of year)
a) Compute the incremental net income of the investment in each year.b) Compute the incremental cash flows of the investment in each year.c) Suppose the appropriate discount rate is 12 percent. What is theNPV of the project?
Problems on DCF and FFCF
,-./012 304506-1 7 CC,C ( +*
7/24/2019 Valuation Slides Week1 1 - Intro and FFCF Previtero
http://slidepdf.com/reader/full/valuation-slides-week1-1-intro-and-ffcf-previtero 44/45
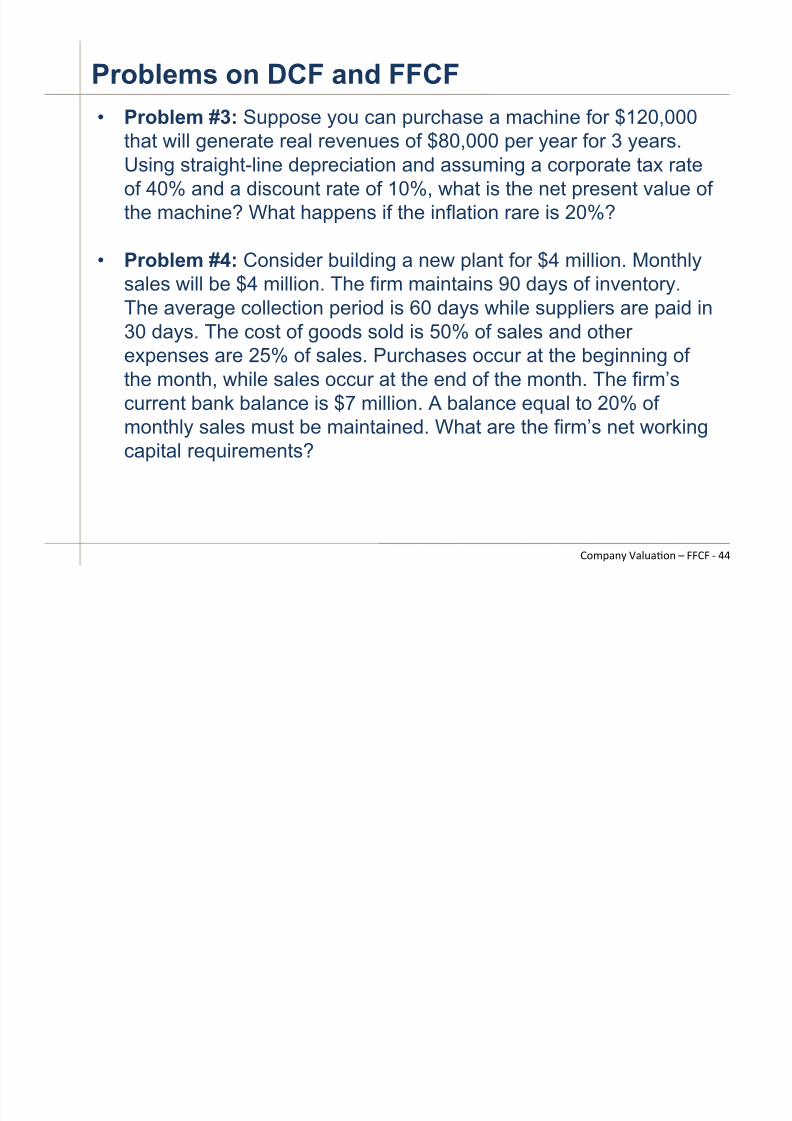
• Problem #3: Suppose you can purchase a machine for $120,000
that will generate real revenues of $80,000 per year for 3 years.Using straight-line depreciation and assuming a corporate tax rateof 40% and a discount rate of 10%, what is the net present value ofthe machine? What happens if the inflation rare is 20%?
• Problem #4: Consider building a new plant for $4 million. Monthly
sales will be $4 million. The firm maintains 90 days of inventory.The average collection period is 60 days while suppliers are paid in30 days. The cost of goods sold is 50% of sales and otherexpenses are 25% of sales. Purchases occur at the beginning ofthe month, while sales occur at the end of the month. The firm’scurrent bank balance is $7 million. A balance equal to 20% of
monthly sales must be maintained. What are the firm’s net workingcapital requirements?
Problems on DCF and FFCF
,-./012 304506-1 7 CC,C ( ++
7/24/2019 Valuation Slides Week1 1 - Intro and FFCF Previtero
http://slidepdf.com/reader/full/valuation-slides-week1-1-intro-and-ffcf-previtero 45/45
Problems on Annuity and Perpetuity
,-./012 304506-1 7 B,C D-:#4E ( +F
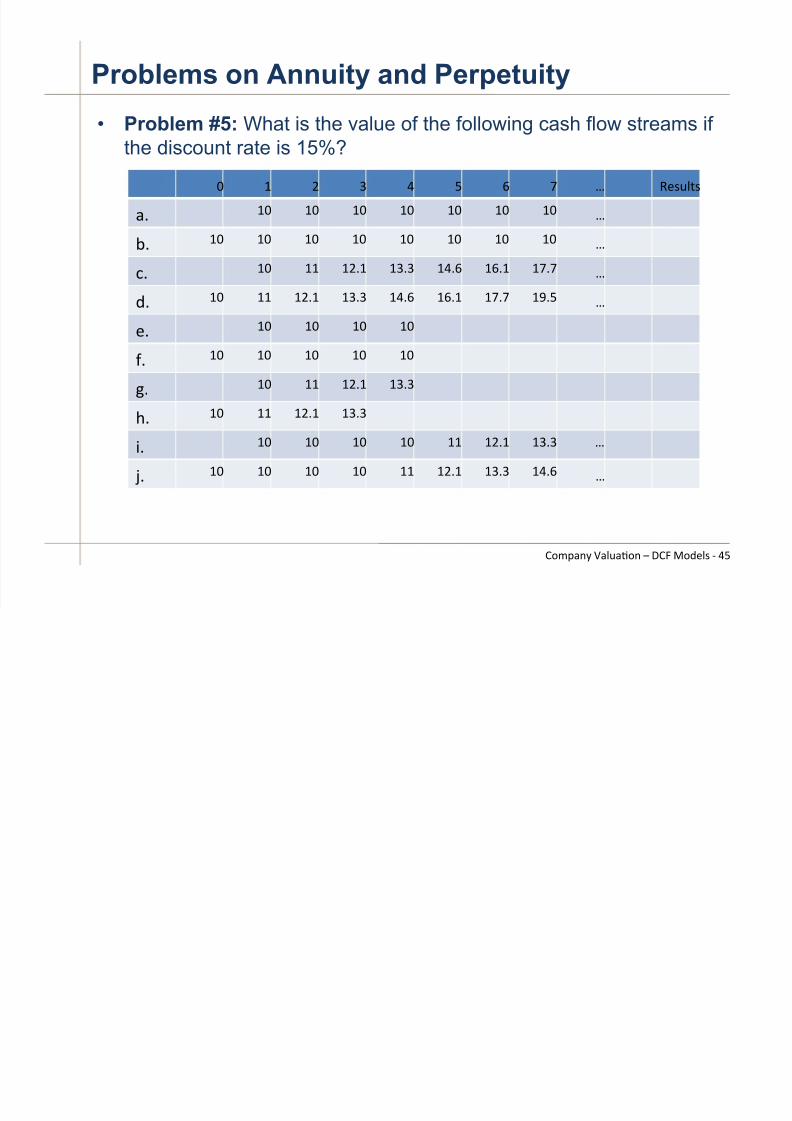
• Problem #5: What is the value of the following cash flow streams if
the discount rate is 15%?
A @ ) * + F < = a Q#E549E
0M @A @A @A @A @A @A @A a
KM @A @A @A @A @A @A @A @A a
;M @A @@ @)M@ @*M* @+M< @<M@ @=M= a
:M @A @@ @)M@ @*M* @+M< @<M@ @=M= @?MF a
#M @A @A @A @A
IM @A @A @A @A @A
JM @A @@ @)M@ @*M*
HM@A @@ @)M@ @*M*
%M @A @A @A @A @@ @)M@ @*M* a
[M @A @A @A @A @@ @)M@ @*M* @+M< a