Valuation of Urban Environmental Amenities in … · a planned city of a developing country like...
14
© 2013. Pradeep Chaudhry, M.P. Sharma, G. Singh & Arun Bansal. This is a research/review paper, distributed under the terms of the Creative Commons Attribution-Noncommercial 3.0 Unported License http://creativecommons.org/licenses/by-nc/3.0/), permitting all non commercial use, distribution, and reproduction in any medium, provided the original work is properly cited. Global Journal of Science Frontier Research Environment & Earth Science Volume 13 Issue 2 Version 1.0 Year 2013 Type : Double Blind Peer Reviewed International Research Journal Publisher: Global Journals Inc. (USA) Online ISSN: 2249-4626 & Print ISSN: 0975-5896 Valuation of Urban Environmental Amenities in Developing Countries: A Case Study from Chandigarh, India By Pradeep Chaudhry, M.P. Sharma, G. Singh & Arun Bansal Indian Institute of Technology Roorkee, India Abstract - Studies related to the valuation of urban environmental amenities like water bodies, green spaces and clean air are very scarce in developing countries. The present study is a first of its kind in India where Hedonic Pricing Method (HPM) has been used to study the impact of key environmental attributes like proximity of an urban lake having good water quality, parks/gardens, clean air and traffic noise attenuation on the market rates of residential plots in a planned city. Two functional hedonic pricing models, double log with weighted least square and ordinary least square, were constructed. Both the models offered comparable and reliable results. Proximity to Sukhna lake of Chandigah city and Leisure valley chain of green spaces raised housing prices by about 10 % and 2 % respectively. Air quality showed significant improvement near green spaces. The study demonstrates that there is significant scope of enhancing government controlled collector rate of urban residential property in areas near to Sukhna lake. The revenue so realized could be ploughed back in conservation efforts of the lake and expanding the green spaces in the city. Keywords : hedonic price method, urban lake, green spaces, urban forests, environmental amenities, residential property valuation. GJSFR-H Classification : FOR Code: 300801 ValuationofUrbanEnvironmentalAmenitiesinDevelopingCountriesACaseStudyfromChandigarh,India Strictly as per the compliance and regulations of :
Transcript of Valuation of Urban Environmental Amenities in … · a planned city of a developing country like...

© 2013. Pradeep Chaudhry, M.P. Sharma, G. Singh & Arun Bansal. This is a research/review paper, distributed under the terms of the Creative Commons Attribution-Noncommercial 3.0 Unported License http://creativecommons.org/licenses/by-nc/3.0/), permitting all non commercial use, distribution, and reproduction in any medium, provided the original work is properly cited.
Global Journal of Science Frontier Research Environment & Earth ScienceVolume 13 Issue 2 Version 1.0 Year 2013 Type : Double Blind Peer Reviewed International Research Journal Publisher: Global Journals Inc. (USA) Online ISSN: 2249-4626 & Print ISSN: 0975-5896
Valuation of Urban Environmental Amenities in Developing Countries: A Case Study from Chandigarh, India
By Pradeep Chaudhry, M.P. Sharma, G. Singh & Arun Bansal Indian Institute of Technology Roorkee, India
Abstract - Studies related to the valuation of urban environmental amenities like water bodies, green spaces and clean air are very scarce in developing countries. The present study is a first of its kind in India where Hedonic Pricing Method (HPM) has been used to study the impact of key environmental attributes like proximity of an urban lake having good water quality, parks/gardens, clean air and traffic noise attenuation on the market rates of residential plots in a planned city. Two functional hedonic pricing models, double log with weighted least square and ordinary least square, were constructed. Both the models offered comparable and reliable results. Proximity to Sukhna lake of Chandigah city and Leisure valley chain of green spaces raised housing prices by about 10 % and 2 % respectively. Air quality showed significant improvement near green spaces. The study demonstrates that there is significant scope of enhancing government controlled collector rate of urban residential property in areas near to Sukhna lake. The revenue so realized could be ploughed back in conservation efforts of the lake and expanding the green spaces in the city.
Keywords : hedonic price method, urban lake, green spaces, urban forests, environmental amenities, residential property valuation.
GJSFR-H Classification : FOR Code: 300801
Valuation of Urban Environmental Amenities in Developing CountriesA Case Study from Chandigarh, India
Strictly as per the compliance and regulations of :

Valuation of Urban Environmental Amenities in Developing Countries: A Case Study from
Chandigarh, India Pradeep Chaudhry α, M.P. Sharma σ, G. Singh ρ & Arun Bansal Ѡ
Abstract - Studies related to the valuation of urban environmental amenities like water bodies, green spaces and clean air are very scarce in developing countries. The present study is a first of its kind in India where Hedonic Pricing Method (HPM) has been used to study the impact of key environmental attributes like proximity of an urban lake having good water quality, parks/gardens, clean air and traffic noise attenuation on the market rates of residential plots in a planned city. Two functional hedonic pricing models, double log with weighted least square and ordinary least square, were constructed. Both the models offered comparable and reliable results. Proximity to Sukhna lake of Chandigah city and Leisure valley chain of green spaces raised housing prices by about 10 % and 2 % respectively. Air quality showed significant improvement near green spaces. The study demonstrates that there is significant scope of enhancing government controlled collector rate of urban residential property in areas near to Sukhna lake. The revenue so realized could be ploughed back in conservation efforts of the lake and expanding the green spaces in the city. Values accorded to urban environmental amenities in the study can justify the public spending and seek more funding for the betterment of urban water bodies and green spaces in developing countries. Keywords : hedonic price method, urban lake, green spaces, urban forests, environmental amenities, residential property valuation.
I. Introduction
orld is rapidly urbanizing and it is expected that half of the population of Asia will live in urban areas by 2020, while Africa is likely to reach 50
% urbanization rate in 2035. Population growth is largely becoming an urban phenomenon in the developing world (Satterthwaite, 2007; U.N, 2012). India is not lagging behind on urbanization front. About 25.72 % of country’s population lived in cities and towns in 1991 which increased to 27.86 % during 2001 and 31.16 % in 2011(Bhagat, 2011).Urban environmental amenities like green spaces, urban forests, lakes, wetlands and rivers are under severe stress as the people move towards cities for better employment opportunities and schooling of their children. All these activities cause increased urban sprawl leading to more noise, water and air
pollution. New and planned cities in India like Chandigarh and Gandhinagar have special provision for creation of urban parks/gardens and water bodies in their respective master plans but this is not the case with majority of
other cities. With the advent of education and environmental awareness, demand for urban nature and environmental resources is growing gradually in developing countries (Jim and Chen, 2006; Kong et al.,
2007; Jim and Chen, 2007).
Urban parks/gardens, wetlands, rivers and good environments provide intangible benefits that contribute to the quality of urban life (Bouland and Hunhammar, 1999; Shafer et al.,
2000; Chiesura, 2004). Environmental economists have devised various methods to quantify values of such non-market or intangible benefits of urban tress and water bodies to the society (Adamowicz et al.,
1994; Wilson and Stephan, 1999; Price, 2000; Woodward and Wui, 2001; Boyer and Polasky, 2004; Bin, 2006; Qiu et al.,
2006 and Tapsuwan et al.,
2009). Methods like Contingent Valuation Method (CVM), Travel Cost Method (TCM) and Hedonic Pricing Method (HPM) have been more popular, used and improved in recent decades. CVM falls under direct methods or ‘stated preference methods’ category whereas TCM and HPM fall under indirect methods or ‘revealed preference methods’ category. In CVM, a hypothetical market is created before a respondent who tells about his/her willingness to pay for a particular amount of non market commodity e.g. for a given quality of water in a river or lake, air quality or urban greenery at a particular location. However, as the responses do not involve actual market purchases, the responses of the respondents are based on hypothetical rather than actual behavior (Tyrvainen and Vaananen, 1998). Moreover CVM should be used very carefully with respondents in developing countries (Chaudhry et al.,
2007) because the chances of getting reliable results with CVM are low in developing countries and indirect methods like TCM and HPM are likely to yield more reliable results (Chaudhry and Tewari, 2006). In TCM, the people or tourists must reach a recreation site or resource from different distances after spending travel and time expenses, otherwise, this method does not work well (More et al.,
1988).
Indirect methods like TCM and HPM make use of substitute markets to find
W
1
Globa
lJo
urna
lof
Scienc
eFr
ontie
rResea
rch
V
olum
eXIII
Issue
e
rsion
IV
IIYea
r
()
H 2 01 3
© 2013 Global Journals Inc. (US)
Authors : Alternate Hydro Energy Centre, Indian Institute of Technology Roorkee, Roorkee-247667, India. E-mail : [email protected] ρ: Arid Forest Research Institute, Jodhpur-342005, India.Author Ѡ : Department of Environment, Chandigarh-160019, India.
α σ

affect house prices (Choumert and Salanie, 2008). HPM has been used extensively in USA and European countries
to value urban greenery, water bodies and combination of these items (Mahan et al.,
2000; Loomis and Feldman, 2003; Garrod and Willis, 1992; Tyrvainen and Miettinen, 2000; Luttik, 2000, Tajima, 2003 and Morancho, 2003). Among developing countries, researchers in China have achieved a commendable progress in valuation of urban environmental attributes e.g. Jim and Chen (2006), Kong et al.,
(2007), Jim and Chen (2009), Jiao and Liu (2010). However, India is lagging behind on this front as evident from only two studies which were conducted in Mumbai and Bhopal cities, regarding the valuation of urban environmental attributes (Gupta and Mythili, 2010; Verma and Negandhi, 2011).
The main objective of the present communication is to assess the environmental factors which make a location attractive to live in, particularly, in a planned city of a developing country like India and to assist urban land use planning with emphasis on urban nature conservation like green spaces and water bodies. Another objective is to find out the possibility of revenue generation for the conservation of Chandigah city’s environmental attributes using Hedonic Pricing method.
II.
Theoritical Background of HPM
The hedonic theory was first introduced by Rosen (1974), summarized by Freeman (1979, 1985) and later by Palmquist (1991). Hedonic Price Method/Model (HPM) is based on the hypothesis that goods are actually aggregations of characteristics features and that the demand for goods relates to these characteristics features. For example, price
of a house/flat in a locality depends on market components e.g. size of plot, number of rooms, number of balconies, number of bathrooms etc and non market components like air quality, nearness to water bodies, parks/gardens, exposure to traffic noise etc.
Hedonic price models have been developed to quantify the contributions of the market and non market components of a particular good to its market price through statistical analysis. People often pay more for a charming view if two houses are identical except for the views and the extra payment can be estimated as the value of the aesthetic and recreational service. In practice, many attributes jointly contribute to the selling price of a house. Statistical techniques have been developed to separate parts of transaction prices due to each contributory attribute (Jim and Chen, 2006).
In general, the purchase price of heterogeneous housing goods could be expressed by a hedonic pricing method which embraces a bundle of housing charac-teristics:
P = f (X1, X2, --------, Xn, Z)
(1)
where P is the market price of house and X1, X2,-------Xn
are the
structural and locational characteristics the house embodies and Z is the environmental variable without a market price (the hedonic variable). The partial derivatives of the price with respect to the constituent variables provide information on the marginal willingness to pay for an additional unit of each characteristic (Palmquist, 1991; Garrod and Willis, 2000; Sheppard, 1999 and Malpezzi, 2003). As a result, the implicit price of individual characteristics could be deduced (Jim and Chen, 2006). HPM is based on assumptions that the observed prices reflect equilibrium conditions in the market. Secondly, the model assumes that both the buyers and sellers of properties have perfect information about the market and non market components of the good (Sarker and McKenney, 1992). HPM is based on actual transaction behaviors in the market and is considered to be the most convincing approach to quantify amenity value (Hoevenagel, 1994; Ready et al, 1997; Hidano, 2000; Tajima, 2003 and Jim and Chen, 2006).
The HPM typically makes use of multiple regression analysis to relate housing price details with diverse characteristics of different properties and to find out the different contributions. Enough guidance is not available in economic theory about the choice of functional form which connects housing price with multiple attributes including structural, locational and environmental attributes (Rosen, 1974; Freeman, 1979; Halvorsen and Pollakowski, 1979). Therefore, it is better to try several functional forms like linear, semi-logarithmic, double logarithmic and Box-Cox while using multiple regression technique (Cassel and Mendelsohn, 1985). Each functional form has its own merits and demerits e.g. Box-Cox transformation could provide better results in terms
of better fit of data than other transformations, but requires complicated transforma-tion processes which could result into random errors (Davidson and MacKinnon, 1993; Jim and Chen, 2006). Three functional forms i.e. linear, semi logarithmic and double logarithmic have been tried for the analysis and results obtained from best form in terms of R2
and least standard error estimate are presented in the paper.
III.
About Chandigarh City
Chandigarh, the City Beautiful, is India’s first planned city constructed after 1947 when country got independence. A number of famous town planners remain associated with concept and planning of the city
2
Yea
r
2013
© 2013 Global Journals Inc. (US)
Globa
lJo
urna
lof
Scienc
eFr
ontie
rResea
rch
V
olum
eXIII
Issue
e
rsion
IV
II
()
H
features can also be one of the variables. The purpose is to take into consideration a bundle of factors that
out individual preferences (Garrod and Willis, 2000). The HPM links property values and the presence of features like lakes/wetlands/streams/green spaces with variables such as distance, view or access. Quality of these
Valuation of Urban Environmental Amenities in Developing Countries: A Case Study from Chandigarh, India

picturesque Shivalik mountain ranges, the city is an epitome of tradition blended with modernity. In the city’s master plan, trees and plants are as much a part of the construction plans as the buildings and the roads. The geographical area of the city is 114 km2, supporting a
population of more than one million as per latest census of India in 2011. The basic unit of urban planning is the ‘sector’ and the entire city has been designed with an ordered framework of ‘sector’ that looks like a chess board (Figure 1). The dimensions of most of the sectors are 120m x 80m except the sectors located just near the Sukhn lake. The Sukhna lake is an artificial lake constructed in 1958 with a water spread area of about 2.50 km2. This lake is one of the important tourist spots of the city with ‘good’ water quality according to National Sanitation Foundation Water Quality Index (NSFWQI) criteria (Chaudhry et al.,
2013
(A and B)).
Figure 1 :
Chandigarh city map showing sectors, green spaces and Sukhna lake
Chandigarh is a fully grown city of modern architectural splendor and nestles in a picturesque setting in the foothills of the Shivalik mountains. The city has attracted people from nearby states of Punjab, Haryana and Himachal Pradesh over the years due to its
educational, environmental and career oriented facilities. Le Corbusier designed the city for a population of 0.5 million but now the population has gone over 1 million as shown in Figure 2.
Figure 2
: Population of Chandigarh city between 1961 to 2011
Chandigarh has the largest numbers of vehicles per capita in India. The data provided by the Registering and Licensing Authority, Chandigarh administration, indicates that the number of vehicles per household is two (D.O.E, 2008). Increasing numbers of petrol and
diesel vehicles in the city are causing significant decrease in ambient air quality. The number of vehicles in Chandigarh has risen from 5, 73,035 in 2004 to 8, 29,145 in 2011 i.e. an increase by over 40 % in a span of seven years (Figure 3).
0
200000
400000
600000
800000
1000000
1200000
1961 1971 1981 1991 2001 2011
Popu
latio
n
3
Globa
lJo
urna
lof
Scienc
eFr
ontie
rResea
rch
V
olum
eXIII
Issue
e
rsion
IV
IIYea
r
()
H 2 01 3
© 2013 Global Journals Inc. (US)
construction of the city began in 1952 and Dr. Rajendra Prasad, the first President of India, inaugurated the city on October 7, 1953. Located at the foothills of the
e.g. Albert Mayer and Matthew Nowicki from America, Le Corbusier from France and English nationals E. Maxwell Fry, Jane and Pierre Jeanneret. Le Corbusier played major role till the city came to life. The
Valuation of Urban Environmental Amenities in Developing Countries: A Case Study from Chandigarh, India

Figure 3 : Rise in number of vehicles in Chandigarh city
IV.
Materials and Methods
Based on a sample size of 176 numbers of urban residential
plots located in different sectors of
Chandigarh city, details regarding prevailing rate (Rs/sq yard)*, overall price (Rs) and plot size (yard) were collected from residents and property dealers of the city. Numbers of residential plots between 4 to 5 were covered in different (40) sectors of the city for collecting above details. Sectors like 1, 6, 12, 14, 17 and 25 were not considered as no private residential plots are located except mostly the governmental, educational and commercial properties (Figure 1). Sectors adjoining Mohali city of Punjab were also not covered as the multi-storied flats are mostly located here whereas maximum of city’s geographical area is devoid of private multi-storied flat culture. Further the city areas around Manimajra, Halomajra, Ram darbar, airport and railway station vicinity were also not considered for primary data collection as no systematic residential sectors are formed in these areas. In addition to above details regarding residential plots, primary survey was conducted in different sectors of the city among residents to find out status of air quality, drinking water quality and its availability round the year, exposure to traffic noise, quality of sector parks/gardens and general garbage removal around living areas of the residents. Secondary
data about air quality and noise pollution in
residential areas of different sectors was also collected from Chandigarh Pollution Control Committee (CPCC), Department of Environment, Chandigarh administration. Deputy Commissioner, Chandigarh office was approached for finding out ‘collector rate’ applicable to sale and purchase of residential property in the city. Collector rate comes into picture when a particular property is sold or purchased and property registration is required to be done at rates equal
or higher than the
applicable collector rate. Property registration ensures a kind of revenue for the local administration.
*The residential plot rates are expressed in Rupee per sq yard in the region in and around the Chandigarh city.
One sq yard=0.8361 sq metre or one sq metre=1.196 sq yard.
V.
Results and Discussion
The city area from sector 2 to 47 was divided into four (4) zones from ‘zone 1’ to ‘zone 4’ based on existing market rate of plots found during the survey. The survey was conducted during the period Oct 2012 to Dec 2012. It is observed that zone 1 near Sukhna Lake has the highest average plot rate of Rs 1,76,000 per sq yard, followed by Rs 1, 52,000 for zone 2, Rs 1,33,000 for zone 3 and Rs 1,12,000 for zone 4 (Figure 4).
Figure 4
:
Division of Chandigarh city area in to four zones
Sample number of plots considered in different zones, maximum, minimum and mean size of plots, maximum, minimum and mean rate of plots in a particular zone and mean distance from Sukhna Lake are given in Table 1, where it is observed that mean rate of residential plots decreases as the distance from Sukhna lake increases.
4
Yea
r
2013
© 2013 Global Journals Inc. (US)
Globa
lJo
urna
lof
Scienc
eFr
ontie
rResea
rch
V
olum
eXIII
Issue
e
rsion
IV
II
()
HValuation of Urban Environmental Amenities in Developing Countries: A Case Study from Chandigarh,
India

Table 1 : Details about number of plots, sizes, rates and distance from lake
Details Zone 1 Zone 2 Zone 3 Zone 4 No of residential plots considered 40 32 68 36 Mean size (sq yard) 1590 575 315 200 Max size (sq yard) 4000 2000 1000 500 Min size (sq yard) 250 200 125 100 Mean rate (Rs /sq yard) 1,76,000 1,52,000 1,33,000 1,12,000 Mean plot price (Rs million) 280.00 87.40 41.80 22.40 Mean distance from lake (m) 1300 2560 4437 6090
ANOVA has been used to compare the means
of three or more than three unrelated groups, using F statistics was applied. Variables considered were rate, price, size and distance of residential plots from the Sukhna lake. Higher value of F statistics implied that samples were drawn from populations with different
The definitions of the dependent variable
(RATE) and 8 explanatory variables included in this
study are presented in Table 2. One variable i.e. size of residential plot (PLOTSIZE) is related to the structural characteristics and the rest are environmental variables. Last five variables are dichotomic in nature that takes the value of 1 or 0 i.e. 1 for good air and water quality and 0 for bad quality. Similarly 1 is adopted for low traffic noise and 0 for higher noise disturbance. Variables other than PLOTSIZE can also be called hedonic variables as their inclusion in the price equation allows us to assess the influence of environmental attributes on housing market value.
Table 2 : Variables related to plots and their environs
Variable name Definition Unit
RATE Market rate of residential plots in different sectors Rs per sq yard PLOTSIZE Size of residential plots Sq yard
DISTLAKE Distance of plot from Sukhna Lake m
DISTLVALLEY Distance of plot from Leisure valley chain of parks/gardens m
AIRQUALITY Quality of air in the vicinity of plot 0,1
NOISE Exposure to traffic noise 0,1
GARBAGE Garbage removal facility from house & in the vicinity of plot 0,1
WATERQUALITY Quality and availability of drinking water during the year 0,1
QUALITYSECPARKS Quality of sector parks in comparison to Leisure valley 0,1
Leisure valley chain of parks and gardens consists of number of linear parks and theme gardens developed along eight km stretch of a seasonal rivulet running across the city (Figure 1). Various parks and gardens developed along this rivulet include Rajendra Park (16,19,400 m2), Bougainvillea Garden (80,970 m2), Leisure Valley Garden and Fitness Trail (3,80,566 m2), Zakir Rose Garden (21,450 m2), Shanti Kunj (72,875 m2), Bamboo Valley Garden (1,11,336 m2), Bulbous Garden (28,340 m2), Hibiscus Garden (16,194 m2), Fragrance Garden (40,486 m2) and Dahlia Garden (18,318 m2). These parks/gardens are in addition to numerous small and big sector parks and green belts in the city. Due to the strategic location and importance of the Leisure valley chain of parks/gardens, the distance of residential plots from Leisure valley chain of parks/gardens (DISTLVALLEY) has been taken as one of the hedonic or environmental variables in the present study.
Various hedonic pricing studies involving influence of environmental amenities with either water bodies or green spaces or both as main ingredient on housing prices in developed (Luttik, 2000; Mahan et al., 2000; Paterson and Boyle, 2002; Price, 2003; Tajima, 2003; Morancho, 2003; Tapsuwan et al., 2009) and developing countries (mainly China e.g. Jim and Chen, 2006; Kong et al., 2007; Jim and Chen, 2007) have been conducted with ‘price’ or ‘rate’ of residential flats as dependent variable. Present study is the first of its kind where ‘rate’ of ‘residential plots’ has been taken as dependent variable. Further, locational variables like nearness to schools, workplace and market have not been considered in the study. This is mainly due to two reasons. One, the city area is not very large (114 km2) and secondly, the public transport system in the form of government owned local buses is good. The ‘Transport Performance Index’ of Chandigarh city is highest among
5
Globa
lJo
urna
lof
Scienc
eFr
ontie
rResea
rch
V
olum
eXIII
Issue
e
rsion
IV
IIYea
r
()
H 2 01 3
© 2013 Global Journals Inc. (US)
mean values. The respective values of F statistics(p <0.01) indicated that the division of the geographical area of the city under consideration (i.e. Sector 2 to 47) into four zones (zone 1 to 4) based on the above variables is statistically correct.
Valuation of Urban Environmental Amenities in Developing Countries: A Case Study from Chandigarh, India

major cities of India (Figure 5; Department of Environment, 2008). Moreover, Chandigarh has also the
highest density of private vehicles (two and four wheeled) in India (Department of Environment, 2008).
Figure 5 : Transportation Performance indices of different cities of India
Table 3 gives the estimation of double log model using weighted least square (WLS) method. Statistical Package for Social Sciences (SPSS 16.0 for Windows) was used for regression analysis. Variable ‘zone’ was used as the source variable for the weight in above software. In double log form, natural log is applied on both sides of the equation (except on dichotomic variables) describing relationship between price or rate of housing to various variables. The set of explanatory variables was found to account for more than two third of the rate variance (Adj R2 = 0.678) and the F ratio test indicated that model fits properly. The results indicate that all independent variables are significant except exposure to traffic noise and garbage removal variables. A close look at the Student’s t-statistics reveals that distance from the lake was most significant variable affecting the rates of residential plots. Rates of plots decrease @ 10.5 % per zone as the distance from lake increases. This trend is also evident from Table 1. If the rates of plots are analyzed with the linear distance from Sukhna lake, it is found that the rates decrease @ 1600/- per sq yard for every 100 m distance upto 3000 m and @ 800/- per sq yard for every 100 m from 3000 to 6000 m (Figure 6). The steeper slope of curve upto 3000 m and relatively gentle slope after 3000 m indicates a clear positive effect of lake proximity on residential property.
Table 3 : Multiple regression analysis results using WLS method (double log form)
Independent variable
Coefficient t-ratio p-value
In PLOTSIZE -0.024 -1.90 0.05
In DISTLAKE -0.105 -5.54 0.00
In DISTLVALLEY -0.019 -2.36 0.01
AIRQUALITY 0.031 3.72 0.00
NOISE 0.00 0.00 0.99
GARBAGE 0.00 -0.05 0.95WATERQUALITY 0.048 5.10 0.00
QUALITYSECPARKS 0.068 4.05 0.00
CONSTANT 12.64 51.92 0.00
Adj R2 =0.678, F=46.98 (p<0.00), Log-likelihood function value=160.982, n=176
Source variable for weighting=Zone, Dependent variable=In RATE
However, the rates of plots decrease at lesser rate of 1.9 % per zone as distance from Leisure valley chain of parks/gardens increases. This means that the effect of lake proximity is more influential on property prices than the green belt. Similarly, the rates of plots decrease @ 2.4 % as plot size increases (Table 3). This is a general feature in Indian property market in majority of cities where smaller size residential plots fetch higher selling rate. If the rate of plots is analyzed with linear distance from Leisure valley, it is observed that rates decrease @ 800/- per sq yard for every 100 m distance (Figure 9). Among other environmental variables, drinking water quality, its availability round the year and air quality are affecting the rates of property as the zones nearer to lake have the advantages of having better quality of air and drinking water availability. Quality of sector parks was also as an important variable (t-statistics=4.05), indicating comparatively better quality of sector parks in areas near to the lake and poorer quality in southern sectors of the city which are away from the lake.
6
Yea
r
2013
© 2013 Global Journals Inc. (US)
Globa
lJo
urna
lof
Scienc
eFr
ontie
rResea
rch
V
olum
eXIII
Issue
e
rsion
IV
II
()
HValuation of Urban Environmental Amenities in Developing Countries: A Case Study from Chandigarh,
India
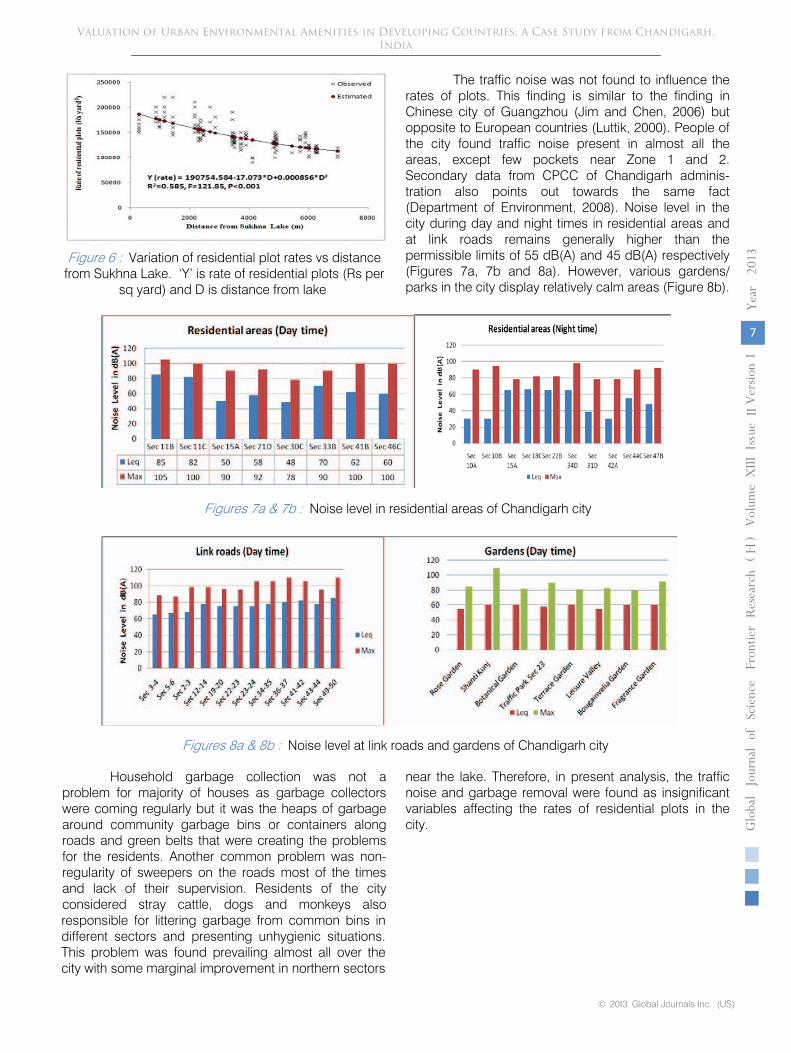
Figure 6 : Variation of residential plot rates vs distance
from Sukhna Lake. ‘Y’ is rate of residential plots (Rs per sq yard) and D is distance from lake
The traffic noise was not found to influence the rates of plots. This finding is similar to the finding in Chinese city of Guangzhou (Jim and Chen, 2006) but opposite to European countries (Luttik, 2000). People of the city found traffic noise present in almost all the areas, except few pockets near Zone 1 and 2. Secondary data from CPCC of Chandigarh adminis-tration also points out towards the same fact (Department of Environment, 2008). Noise level in the city during day and night times in residential areas and at link roads remains generally higher than the permissible limits of 55 dB(A) and 45 dB(A) respectively (Figures 7a, 7b and 8a). However, various gardens/ parks in the city display relatively calm areas (Figure 8b).
Household garbage collection was not a problem for majority of houses as garbage collectors were coming regularly but it was the heaps of garbage around community garbage bins or containers along roads and green belts that were creating the problems for the residents. Another common problem was non-
regularity of sweepers on the roads most of the times and lack of their supervision. Residents of the city considered stray cattle, dogs and monkeys also responsible for littering garbage from common bins in different sectors and presenting unhygienic situations. This problem was found prevailing almost all over the city with some marginal improvement in northern sectors
near the lake. Therefore, in present analysis, the traffic noise and garbage removal were found as insignificant variables affecting the rates of residential plots in the city.
7
Globa
lJo
urna
lof
Scienc
eFr
ontie
rResea
rch
V
olum
eXIII
Issue
e
rsion
IV
IIYea
r
()
H 2 01 3
© 2013 Global Journals Inc. (US)
Figures 7a & 7b : Noise level in residential areas of Chandigarh city
Figures 8a & 8b : Noise level at link roads and gardens of Chandigarh city
Valuation of Urban Environmental Amenities in Developing Countries: A Case Study from Chandigarh, India

Figure 9 : Variation of residential plot rates vs distance from Leisure Valley. ‘Y’ is rate of residential plots (Rs per sq
yard) and D is distance from Leisure valley
Almost similar results were found when multiple regression analysis was conducted using ordinary least square (OLS) method with double log functional form (adj R2
= 0.69, F = 50 (p<0.00)). Distance from lake
was again found most significant variable (t-statistics = 5.55). Exposure to traffic noise and garbage removal were again found insignificant variables (Table 4).
Table 4 : Multiple regression analysis results using OLS method (double log form)
Independent variable Coefficient
t-ratio
p-value
In PLOTSIZE -0.033 -2.67 0.00
In DISTLAKE -0.101 -5.55 0.00
In DISTLVALLEY -0.022 -2.64 0.00
AIRQUALITY 0.032 3.59 0.00
NOISE 0.00 -0.048 0.96
GARBAGE 0.00 0.127 0.89
WATERQUALITY 0.051 5.31 0.00
QUALITYSECPARKS 0.074 4.193 0.00
CONSTANT 12.66 54.31 0.00
Adj R2 =0.69, F=50.00 (p<0.00), Dependent variable=In RATE, n=176
Ambient air quality of Chandigarh city is under pressure since last three decades due to increase in vehicle population. Respirable Suspended Particulate Matter (RSPM) in the city is crossing its permissible
limits in all the residential areas where monitoring is done by CPCC. However, the SO2
and NOX
levels are
within permissible limits (Figures 10, 11, 12).
8
Yea
r
2013
© 2013 Global Journals Inc. (US)
Globa
lJo
urna
lof
Scienc
eFr
ontie
rResea
rch
V
olum
eXIII
Issue
e
rsion
IV
II
()
H
Figure 10 : RSPM, Sulphur Dioxide and Nitrogen Oxide concentrations in zone 1
Valuation of Urban Environmental Amenities in Developing Countries: A Case Study from Chandigarh, India

Figure 11 :
RSPM, Sulphur
Dioxide and Nitrogen Oxide concentrations in zone 2
Figure 12 :
RSPM, Sulphur Dioxide and Nitrogen Oxide concentrations in zone 4
a)
Urban greenery and its environmental effects
As per the two analysis by WLS and OLS method, air quality is found as good in areas nearer to lake and Leisure valley i.e. zones 1 and 2. Air pollution monitoring stations at Punjab Engineering College (PEC) University of Technology, Sector 12 (zone 1) and Central Plaza, Sector 17 (zone 2) of Chandigarh city recorded comparatively lesser average annual RSPM concentration in comparison to those recorded at Institute of Microbial Technology (IMTECH), Sector 39 (zone 4) as evident from Figures 10, 11 and 12. Probable explanations for this are not difficult to find. First, the density of human population n, vehicles and number of plots are less in this region (due to comparatively bigger size plots in comparison to zone 3 and 4). Secondly, more road side greenery, tree avenues, boulevards and parks/gardens in the form of Leisure Garden chain are available in zone 1 and 2 like Rajendra Park, Bougainvillea Garden, Fitness Trail, Zakir Rose Garden and Shanti Kunj (Figure 1). Quality of sector parks was also found comparatively well in zone 1 and 2 (Table 3 and 4). In fact, Chandigarh city is among top India’s cities having forest and tree cover of more than 35 % of its area and per capita green space availability around 55 m2
(Chaudhry and Tewari, 2011; Chaudhry et
al.,
2011). Maximum of this forest and tree cover is concentrated around zone 1 and 2 (Figure 1).
The enhancement of urban vegetation is one of the ways, which has the potential to mitigate the adverse effects of urbanization, mainly air pollution, in a
sustainable manner. Nowadays there is an increased societal demand for more green areas in and around cities (Ridder et al.,
2004). Many studies conducted in developed and developing countries support this view. According to a research conducted in Santiago city of Chile which is facing worst urban air pollution in Latin
9
Globa
lJo
urna
lof
Scienc
eFr
ontie
rResea
rch
V
olum
eXIII
Issue
e
rsion
IV
IIYea
r
()
H 2 01 3
© 2013 Global Journals Inc. (US)
America, managing municipal urban forests (comprising trees, shrubs, and grass) to remove suspended particulate matter (PM10) was a cost effective policy for abating PM10 based on criteria set by the World bank (Escobedo et al., 2008). In a study conducted in USA, it was found that atmospheric pollution worth more than 7,00,000 metric tons per year was removed in 55 cities of the country by the urban vegetation (Nowak et al., 2006). Urban forests of Guangzhou city of China, covering an area of 7360 ha, removed 312 metric tons of atmospheric pollution annually, out of which PM10
accounted for 234 metric tons (Jim and Chen, 2008). Similarly, urban greenery of Beijing, China with 4.5 million human population, was responsible for removal of 1261 metric tons of environmental pollution every year, out of which 776 metric tons were particulate matter (Yang et al., 2005).
Two way ANOVA was performed with ‘rates’ of plots as dependent variable and ‘distance from Leisure valley chain of parks/gardens’ and ‘distance from lake’ as fixed factors. For distance from Sukhna lake, the following groupings were adopted i.e. 0 to 1500 m, 1501 to 3000 m, 3001 to 4500 m, 4501 to 6000 m and > 6000 m. For distance from Leisure valley chain of
Valuation of Urban Environmental Amenities in Developing Countries: A Case Study from Chandigarh, India

parks/gardens following groupings were made i.e. 0 to 200 m, 201 to 600 m, 601 to 1500 m, 1501 to 2000 m and >2000 m. Duncan multiple range test (DMRT) was used to find effect of ‘zone’ and ‘distance from L.valley’ on Air quality. It is found that about 77 % of residents up to 1500 m from L.valley were satisfied with air quality, whereas < 53 % residents were satisfied with air quality at far away places i.e. >1500 m distance from L.valley. Duncan multiple range test (DMRT) was also employed to find the effect of ‘zone’ and ‘distance from lake’ on air quality. It was found that > 73 % of residents were satisfied from air quality upto a distance of 3000 m from lake and less than 54 % were satisfied as distance from lake increased more than 3000 m. When ‘quality of sector parks’ was selected as dependent variable, it was noticed
that nearly cent percent residents are satisfied with quality of sector parks upto 1500 m from the lake and up to two thirds were satisfied upto 3000 m from the lake. Less than one third of residents were satisfied with quality of sector parks after 3000 m distance from lake. Above analysis shows that ‘zone 1’ and ‘zone 2’, which enjoy nearness to S. lake and Leisure Valley, constitute the best region of the Chandigarh city as far as the air quality and urban greenery are concerned (Figure 4). The Sukhna lake has an attractive dam promenade with lot of trees, shrubs, herbs and lawns over it. A road nearby allows walking by visitors and sightseeing of the lake with tropical deciduous forests in the background, adding to recreational and aesthetic value of the spot. Therefore, it is not surprising for the zones 1 and 2 of the city to have highest residential property value. Such green spaces provide recreational and leisure opportunities to the residents and tourists (Tzoulas and James, 2010). They serve as an
important place for the people to meet and have social get-togethers (Seeland et al.,
2009).
b)
Scope of revenue generation
Current government approved collector rate for all the urban residential areas in the Chandigarh is uniform @ Rs 54,912/-
per sq yard
(Chandigarh Administration, 2012). This rate is very less in comparison to prevailing residential property market rates in zone 1 to 4 (Table 1). Ideally, the collector rate should be very near to prevailing market rate of the property. The huge gap not only leads to the loss of government revenue in the form of stamp duty and registration charges applicable for selling/purchase of such property, it also encourages circulation of black money in the economy as investment in real estate is one of the most favorable options for the persons/firms having black money. Use of unaccounted money in property market in India has become a major problem (Nayar, 1996; Kumar, 1999; Bhigania, 2012). Hence, there is an immediate need to enhance the present collector rate for urban residential property in the city from Rs 54, 912/-
per sq yard to at least Rs 1,50,000/-
for zones 1 and 2 and to Rs 1,00,000/-
for zones 3 and 4. This means an increase of about 173 % for zone 1 and 2 and about 82 % for zone 3 and 4. The Chandigarh administration can take a clue from Government of National Capital Territory (NCT) of Delhi where the property prices for category A (posh areas like Defence colony, Greater Kailash, Gulmohar Park, Golf links, Green Park etc) were increased by 200 % and
for category B (areas like Kalkaji, Andrew ganj, Munirka vihar etc) by 50 % in December 2012 (Delhi Administration, 2012). A comparison regarding percent increment in such rates in two cities shows that Delhi Government has been following more pragmatic
and practical approach in property matters than Chandigarh administration (Table 5).
Table 5 :
Comparison of percent increase in urban property rates in Chandigarh and Delhi
City
Remarks
Year 2010
Year 2011
Year 2012
% Increase
Chandigarh
Uniform rates all over the
city
Rs 39,936 per sq yard
Rs 49,920 per sq yard
25
Rs 54,912 per sq yard
10
Category A
Rs 86,000 per sq m
Rs 2,15, 000 per sq m
150
Rs 6,45,000 per sq m
200
10
Yea
r
2013
© 2013 Global Journals Inc. (US)
Globa
lJo
urna
lof
Scienc
eFr
ontie
rResea
rch
V
olum
eXIII
Issue
e
rsion
IV
II
()
H
DelhiCategory B Rs 68,200 per
sq mRs 1,36,400 per
sq m100 Rs 2,04,000
per sq m50
Extra revenue generated, thereby, can be utilized for creating better parks/gardens in sectors devoid of greenery, maintaining the existing parks/gardens and the lake. This will help in curbing increased air and noise pollution, as it has been proved not only in developed countries but also in a densrly populated city of Dhaka, Bangladesh, a developing country where the
research concluded that urban vegetation was very effective in controlling air and noise pollution (Islamal., 2012).
Local city municipalities in developing countries often fell short of budget for urban nature conservation related works. In developing countries, research studies related to valuation of urban environmental amenities
et
% Increase
Valuation of Urban Environmental Amenities in Developing Countries: A Case Study from Chandigarh, India

are scanty (Jim and Chen, 2006). Present study is a small step in this direction and provides significant information about people’s attitude and behavior towards such amenities in a developing country like India. More and more such studies should be conducted in different cities of the country, wherever possible, to provide scientific justification and platform for generating revenues for creating and maintaining the urban nature components like lakes, wetlands, parks and gardens.
VI.
Conclusions
Very few studies are available involving valuation of urban environmental amenities in develop-ping countries including India. These environ-mental amenities include water bodies, clean air and urban forests. Quantification and valuation of environ-mental, social and economic values of these attributes has remained a difficult task. This study is an effort to extract and value the environmental externalities embodied in housing market of Chandigarh city. Municipalities in developing countries always struggle in financing urban nature conservation projects. Attempts were made in this study to establish that the local municipalities and city administration can generate sufficient revenue to further consolidate urban nature elements and provide better quality of urban life and recreational /leisure opportunities to the citizens. This study can also serve as a model for future city planning in the country as the city planners, architects and policy makers can consider the information about the utility of water bodies and urban green spaces in urban land use planning. It is expected that the results of the present study will boost future research about the valuation of the urban environmental amenities in Indian cities.
VII.
Acknowledgement
One of the authors (PC) would like to express gratitude to National River Conservation Directorate (NRCD), Ministry of Environment and Forests, Govern-ment of India, New Delhi for sponsoring him to pursue two years M. Tech. programme (2011-13) in ‘Environ-mental Management of Rivers and Lakes’ being offered by Alternate Hydro Energy Centre, Indian Institute of Technology, Roorkee, India. The authors also express sincere thanks to the officials of different departments of Chandigarh administration and people of the city for providing facts, figures and various valuable data about the environmental attributes for this study.
References Références Referencias
1.
Adamowicz.
W, Louviere.
J and Williams.
M (1994): Combining revealed and stated preferences methods for valuing environmental amenities. Journal of Environmental Economics and Manage-ment.
26: 271-292.
2.
Bhagat. R.B (2011): Emerging Patterns of Urbanization in India. Economic & Political Weekly. 66(34): 10-12.
3.
Bhigania.
R.K.M (2012): Black money and its imply-cation. Indian Streams Research Journal. 2(4): 1-4
4.
Bin.
O (2005): A semiparametric hedonic model for valuing wetlands. Applied Economics Letters.
12
(10): 597-601.
5.
Bolund.
P and Hunhammar. S (1999): Ecosystem services in urban areas. Ecological Economics. 29: 293-301.
6.
Boyer.
T and Polasky.
S (2004): Valuing urban wetlands: A review of non-market valuation studies. Wetlands. 24(4): 744-755.
7.
Cassel.
E and Mendelsohn. R (1985): The choice of functional forms for hedonic price equations: comment. Journal of Urban Economics. 18: 135-142.
8.
Chandigarh administration, C.A (2012): Information provided under Right to Information to the leading author by Deputy Commissioner, Chandigarh office vide no DC/DRA/2012/551 dated 5/11/12.
9.
Chaudhry.
P and Tewari.
V.P (2006): A comparison between TCM and CVM in assessing the recrea-tional use value of urban forestry. International Forestry Review. 8(4): 439-448.
10.
Chaudhry.
P, Singh.
B and Tewari.
V.P (2007): Non market economic valuation in developing countries: Role
of participant observation method in CVM
11
Globa
lJo
urna
lof
Scienc
eFr
ontie
rResea
rch
V
olum
eXIII
Issue
e
rsion
IV
IIYea
r
()
H 2 01 3
© 2013 Global Journals Inc. (US)
11. Chaudhry. P and Tewari. V.P (2011): Urban forestry in India: Development and research scenario. Interdisciplinary Environmental Review. 12 (1):80-93.
12. Chaudhry. P, Bagra. K and Singh. B (2011): Urban greenery status of some Indian cities: A short communication. International journal of Environm-ental Science and Development. 2(2):98-101.
13. Chaudhry. P, Sharma. M.P, Bhargava. R, Kumar. S and Dadwal. P.J.S (2013 A): Water quality assessment of Sukhna Lake of Chandigarh city of India. Journal of Water, Energy and Environment
14. Chaudhry. P, Bhargava. R, Sharma. M.P and Tewari.V.P (2013 B): Conserving urban lakes for tourism and recreation in developing countries: A case from Chandigarh, India. International Journal of Leisure
15. Chiesurs. A (2004): The role of urban parks for the sustainable city. Landscape and Urban Planning. 68: 129-138.
16. Choumert. J and Salanie. J (2008): Provision of urban green spaces: Some insights from econo-mics. Landscape Research. 33(3): 331-345.
analysis. Journal of Forest Economics. 13(4): 259-275.
(Hydro Nepal) Issue no 12, January 2013: 26-33.
and Tourism Marketing 3(3): 267-281.
Valuation of Urban Environmental Amenities in Developing Countries: A Case Study from Chandigarh, India

17.
Davidson.
R and MacKinnon.
J.G (1993): Estimation and Inference in Econometrics. Oxford University Press, Mew York, 874 p.
18.
Delhi administration (2012): Revision of property rates vide government notification number F.1 (152) Regn. Br./Div.Com/HQ/2011/780 dated 04/12/12 by Govt of NCT of Delhi, Revenue Department, Delhi
19.
Department of Environment (2008): State of Environment, Chandigarh-2008. A publication by ENVIS Centre in collaboration with Department of Environment, Chandigarh administration.
20.
Escobedo.
F.J, Wagner.
J.E, Nowak.
D.J, Maza.
C.L.De la, Rodriguez.
M and Crane.
D.E (2008): Analyzing the cost effectiveness of Santiago, Chile’s policy of using urban forests to improve air quality. Journal of Environmental Management. 86:148-157.
21.
Freeman, III.A.M (1979): Hedonic prices, property values and measuring environmental benefits: a survey of the issues. Scandinavian Journal of Economy, Vol 81, pp.154-173.
22.
Freeman, III.A.M (1985): Methods for assessing the benefits of environmental programmes. In: A.V.
Kneese and J.L Sweeney (Eds.). Handbook of Natural resource and energy economics, Vol 1.
Elsevier, Oxford, pp. 223-269.
23.
Garrod.
G and Willis.
K.G (1992): Valuing goods characteristics: an application of the hedonic price method to environmental attributes. Journal of Environmental Management.34: 59-76.
24.
Garrod.
G and Willis.
K.G (2000): Economic Valuation of the Environment: Methods and Case Studies, Cheltenham, Edward Elgar, 400 pp.
25.
Gupta. V and Mythili. G (2010): Valuation of urban environmental amenities: A case study. International Journal of Ecological Economics and Statistics. 19: 20-32.
26.
Halvorsen. R and Pollakowski. H (1979): Choice of functional form for hedonic price equations. Journal of Urban Economics. 10: 37-49.
27.
Hidano.
N (2002): The economic valuation of the environment and public policy: A hedonic approach. Edward Elgar, Cheltenham, UK, 167 pp.
28.
Hoevenagel.
R (1994): A comparison of economic valuation methods. In: Pethig, R. (Ed), Valuing the Environment: Methodological and Measurement issues. Kluwer Academic, Amsterdam, pp. 251-272.
29.
Islam. M.N, Rahman.
K.S, Bahar. M.M, Habab.
M.A, Ando.
K and Hatturi.
N (2012): Pollution attenuation by roadside greenbelts in and around urban areas. Urban Forestry & Urban Greening. 11: 460-464.
30.
Jim.
C.Y and Chen.
W.Y (2006): Impacts of urban environmental elements on residential housing prices in Guangzhou (China). Landscape and Urban Planning.
78: 422-434.
31.
Jim.
C.Y and Chen.
W.Y (2007): Consumption preferences and environmental externalities: A
hedonic analysis of the housing market in Guan-gzhou. Geoforum. 38: 414-431.
32.
Jim.
C.Y and and Chen.
W.Y (2008): Assessing the ecosystem service of air pollutant removal by urban trees in Guangzhou. Journal of Environmental Management. 88: 665-676.
33.
Jim.
C.Y and Chen W.Y (2009): Value of scenic views: Hedonic assessment of private housing in Hong Kong. Landscape and Urban Planning. 91: 226-234.
34.
Kong.
F, Yin.
H and Nakagoshi.
N (2007): Using GIS and landscape metrics in the hedonic price modeling of the amenity value of urban green space: A case study in Jinan city, China.
Landscape and Urban Planning.79: 240-252.
35.
Kumar.
A (1999): The Black Money: Missing
Dimension of Macropolicy making in India. Economic and Political Weekly. 34(12): 681-694.
36.
Loomis.
J and Feldmen.
M (2003): Estimating the benefits of maintaining adequate lake levels to home owners using the hedonic property method. Water Resources Research. 39(9): 21-26.
37.
Luttik.
J (2000): The value of trees, water and open space as reflected by house prices in Netherlands. Landscape and Urban Planning. 48: 161-167.
38.
Mahan.
B.L, Polasky.
S and Adams.
R.M (2000): Valuing urban wetlands: A property price approach. Land Economics. 76(1): 100-113.
39.
Malpezzi.
S (2003): Hedonic pricing models: a selective and applied review. In: O’Sullivan, T, and Gibb, K (Eds), Housing Economics and Public Policy. Blackwell, Oxford, UK, pp. 67-89.
40.
Morancho.
A.B (2003): A hedonic valuation of urban green areas. Landscape and Urban Planning. 66: 35-41.
12
Yea
r
2013
© 2013 Global Journals Inc. (US)
Globa
lJo
urna
lof
Scienc
eFr
ontie
rResea
rch
V
olum
eXIII
Issue
e
rsion
IV
II
()
H
41. More. T.A, Stevens. T and Allen. P.G (1988): Valuation of urban parks. Landscape and Urban Planning. 15: 139-152.
42. Nayar. S (1996): The Indian Real Estate Market: A comprehensive analysis for the foreign investors. M.Arch dissertation submitted to Massachusetts Institute of Technology, USA.
43. Nowak. D.J, Crane. D.E and Stevens. J.C (2006): Air pollution removal by urban trees and shrubs in the United States. Urban Forestry & Urban Greening. 4: 115-123.
44. Palmquist. R (1991): Hedonic methods. In: J.Braden and C. Kolstad (eds). Measuring the demand for environmental quality. Elsevier, North Holland, pp. 77-120.
45. Paterson. R.W and Boyle. K.J (2002): Out of sight, out of mind? Using GIS to incorporate visibility in hedonic property value models. Land Economics. 78(3): 417-425.
46. Price. C (2000): Valuation of unpriced products: contingent valuation, cost-benefit analysis and
Valuation of Urban Environmental Amenities in Developing Countries: A Case Study from Chandigarh, India

47.
Price.
C (2003): Quantifying the aesthetic benefits of urban forestry. Urban Forestry & Urban Greening.
1: 123-133.
48.
Qiu.
Z.Y, Prato.
T and Boehm.
G (2006): Economic valuation of riparian buffer and open space in a suburban watershed. Journal of American Water Resources Association. 12: 1583-1596.
49.
Ready.
R.C, Berger.
M.A and Blomquist, G.C (1997): Measuring amenity benefits from farmland: Hedonic pricing vs. contingent valuation. Growth and Change. Vol 28, pp 438-458.
50.
Ridder.
De.K, Adamec.
V, Banuelus.
A, Bruse.
M, Burger.
M, Damsgaard. O, Dufek.
J, Hirsch.
J, Lefebu.
F, Perez-Lacorzana.
J.M, Thierry.
A and Weber.
C (2004): An integrated methodology to assess the benefits of urban green space. Science of the Total Environment. 334-335: 489-497.
51.
Rosen. S.M (1974): Hedonic prices and implicit prices: production differentiation in pure compe-
52.
Sarker.
R and McKenney, D (1992): Measuring unpriced values: An economic perspective and annotated bibliography for Ontario. Information report O-X-422. A collaborative project between the Ontario Ministry of natural resources and Forestry Canada, Ontario region
53.
Satterthwaite.
D (2007): The transition to a predominantly urban world and its underpinnings. Human Settlements Discussion Paper Series. International Institute for Environment and Develo-pment, London.
54.
Seeland.
K, Dubendurfer.
S and Hansmann.
R (2009): Making friends in Zurich’s urban forests and parks: The role of public green space for social inclusion of youths from different cultures. Forest Policy and Economics. 11(1): 10-17.
55.
Shafer.
C.S, Lee.
B.K and Turner.
S (2000): A tale of three greenway trails: user perceptions related to quality of life. Landscape and Urban Planning. 49: 163-178.
56.
Sheppard.
S (1999): Hedonic analysis of housing markets. In: Cheshire, P., Mills, E.S (Eds), Hand-book of Regional and Urban Economics, Vol 3: Applied Urban Economics. Elsevier, Amester-dam, pp. 1595-1635.
57.
Tajima.
K (2003): New estimates of the demand for urban green space: implications for valuing the environmental benefits of Boston’s big dig project. Journal of Urban Affairs. 25: 641-655.
58.
Tapsuwan.
S, Ingram.
G, Burton.
M and Brennan.
D (2009): Capitalized amenity value of urban wetlands: a hedonic property price approach to urban wetlands in Perth, Western Australia.
Australian Journal of Agricultural and Resource Economics. 53: 527-545.
59.
Tyrvainen.
L and Vaananen. H (1998): The economic value of urban forest amenities: an application of the contingent valuation method. Landscape and Urban Planning. 43: 105-118.
60.
Tyrvainen.
L and Miettinen. A (2000): Property prices and urban forest amenities. Journal of Environmental Economics and Management. 39: 205-223.
61.
Tzoulas.
K and James.
P (2010): People’s use of, and concerns about, green space networks: A case study of Birchwood, Warrington New Town, UK. Urban Forestry & Urban Greening. 9(2): 121-128.
62.
United Nations (2012): World Urbanization Prospects-The 2011 revision. Department of Economic and Social Affairs. U.N, New York.
63.
Verma.
M and Negandhi.
D (2011): Valuing ecosystem services of wetlands-a tool for effective policy formulation and poverty alleviation. Hydrolo-gical Sciences Journal. 56(8): 1622-1639.
64.
Wilson.
M.A and Stephen.
R.C (1999): Economic valuation of freshwater ecosystem services in the U.S: 1971-1997. Ecological Applications. 9:772-783.
65.
Woodward.
R.T and Wui.
Y.S (2001): The economic value of wetland services: a meta-analysis. Ecological Economics. 37(2): 257-270.
66.
Yang. J, Mc
Bride.
J, Zhou.
J and Sun.
Z (2005): The urban forest in Beijing and its role in air pollution reduction. Urban Forestry & Urban Greening. 4: 115-123.
13
Globa
lJo
urna
lof
Scienc
eFr
ontie
rResea
rch
V
olum
eXIII
Issue
e
rsion
IV
IIYea
r
()
H 2 01 3
© 2013 Global Journals Inc. (US)
participatory democracy. Land Use Policy. 17: 187-196.
tition. Journal of Political Economy. Vol 82, pp. 34-55.
Valuation of Urban Environmental Amenities in Developing Countries: A Case Study from Chandigarh, India