Valuation for Natural Capital and Ecosystem Accounting ... · within the Knowledge Innovation...
57
Valuation for Natural Capital and Ecosystem Accounting Synthesis Paper
Transcript of Valuation for Natural Capital and Ecosystem Accounting ... · within the Knowledge Innovation...

Valuation for Natural
Capital and
Ecosystem Accounting
Synthesis Paper

Page 1 of 57
Valuation for Natural Capital and Ecosystem Accounting: Synthesis Paper Prepared for:
The European Commission as part of a contract on the provision of technical support for the
development of Natural Capital Accounting (Contract 07.0202/2017/767463/SERJENV.D.2), led by
UNEP-WCMC in collaboration with IEEP and UEA CSERGE. This report was prepared University of East Anglia, Centre for Social and Economic Research on the Global Environment (CSERGE) Published September 2017 Copyright European Union 2018. All rights reserved. Certain parts are licensed under conditions to the EU Citation
Badura T., Ferrini S., Agarwala M. and Turner K. (2017) Valuation for Natural Capital and Ecosystem
Accounting. Synthesis report for the European Commission. Centre for Social and Economic Research
on the Global Environment, University of East Anglia. Norwich 2017. Disclaimer: The information and views ser out in this report are those of the authors and do not necessarily reflect the official opinion of the Commission. The Commision does not guarantee the accurancy of the data included in this study. Neither the Commission not any person actting on the Commission’s behalf may be held responsible for the use which may be made of the information
contained therein.
The Centre for Social and Economic Research on the Global Environment (CSERGE), University of East Anglia (UK), is internationally renowned for working at the forefront of interdisciplinary research, on a range of environmental issues. CSERGE research covers a huge array of topics such as sustainable development, the relationship between humans and the environment, natural resource valuation and management, economic instruments, land use, water, energy, wetlands and coastal zone management, climate change,
ecosystem services and natural resource accounting.
Page 2 of 57
Table of Contents
0 INTRODUCTION 3
1 SUMMARY 4
2 BACKGROUND – NATIONAL AND WEALTH ACCOUNTING 11
2.1 Three approaches to natural capital accounting: 16
3 VALUATION IN/FOR NATURAL CAPITAL AND ECOSYSTEM ACCOUNTING
19
3.1 Exchange and welfare value concepts 21
3.1.1 Simulated exchange values 23
3.2 Valuing flows – ecosystem services 24
3.2.1 Valuing pollination 35
3.2.2 Valuing recreation services 39
3.3 Stock valuation – monetary asset accounts 42
4 KEY MESSAGES 45
5 BIBLIOGRAPHY 47
6 ANNEX 51

Page 3 of 57
0 Introduction
This report aims to fulfil two objectives identified with the clients (i.e. KIP INCA
partners and JRC in particular). These were to provide overviews1: 1) of the main issues
surrounding valuation methodologies in the context of ecosystem and natural capital
accounting; and 2) of the possible approaches for valuing crop pollination and recreation
within the Knowledge Innovation Project for an Integrated system for Natural Capital and
ecosystem services Accounting (KIP INCA). This report might be further expanded in the
future to provide an extended discussion of the valuation methodologies in context of the
KIP INCA future plans. The report provides a background for Technical Support actions in
Q3 and Q4 2017, aiming to support the valuation work being undertaken at the Joint
Research Centre.
Following an extended summary, this report starts with a brief background on national
and wealth accounting and sets out three possible generic approaches for future progress. It
also indicates how natural capital accounting can contribute to wider strategy and policy
analysis. It then discusses more specific issues related to valuation concepts such as exchange
and welfare values and their uses and limitations which are closely related to the
overarching purpose of the KIP INCA and its planned use of the derived information.
Further, this report discusses the valuation approaches for flows of ecosystem services as
well as how it might be possible to value assets (stocks) as part of the KIP INCA.
Complementary work has been undertaken for JRC covering specific ecosystem flows
valuation in more detail (Fact sheets feedback). This material is provided in the Annex.
We would like to keep this report as a living document that would be updated over the
duration of this project. This would allow for further reflection on both empirical results and
data availability, resulting from Technical support Action, and the incorporation of
comments and feedback from KIP INCA partners.
1 Please note that this report builds on an assumption of relative familiarity with the recent material and guidance documents
related to Natural Capital accounting. Namely, it is assumed that the reader is familiar with SEEA CF 2012, SEEA EEA 2012,
SEEA EEA Draft Technical recommendation (2017). Please refer to these documents for further background and information
related to the recent discussions on environmental and economic accounting as well as ecosystem accounting practices.

Page 4 of 57
1 Summary
National income accounting is a method of collecting, organising and reporting
desirable information on economic activity which can assist in the measurement of trends
and decision making. It does not fully measure human welfare/wellbeing, nor does it include
a comprehensive assessment of the impacts on the environment linked to the economic
activity. National accounts are human constructs, deliberately and strategically designed and
have always included a degree of pragmatism in their evolution. So what is included or
excluded from the national accounts is a matter of choice (Coyle 2014). The inclusion of
natural capital into this accounting context is, we would argue, also a choice and one in
which a degree of pragmatism is required.
A significant problem associated with the inclusion of natural capital and ecosystem
services into the national accounts is that market prices and so-called exchange values are
often missing. This has led to efforts to ‘impute’ values (proxy exchange values) which have
to be indirectly measured or estimated. Production function data if available are especially
useful in this context. There also needs to be a recognition that the prevailing institutional
governance arrangements (e.g. property rights regimes, existing laws and regulations,
cultural norms etc.) will condition the ‘imputed values’ that may be observed and calculated.
We also note the criticisms from some conservationists that assigning monetary values to
nature will end up in the complete ‘commodification’ of the environment. While such an
outcome would risk overemphasising the substitution possibilities between natural capital
and other forms of capital, as well as excluding the intrinsic value nature might possess, this
outcome is not inevitable. A pluralistic approach to valuing nature has much to recommend
it. With this line of reasoning it is possible to discern a number of value dimensions: the
value elicitation process, and the source of the value information i.e. individual community
societal/cultural group; the value motivation i.e. self-regarding or other-regarding; the
overall institutional context; and the value scale i.e. to society or to the individual. What is
required is a pragmatic view of environmental valuation which accepts that not all aspects of
nature can be meaningfully captured in money terms, but much can be treated in this way
and this could bolster conservation (Turner 2016). We outline in a succeeding section how
natural capital accounting incorporating monetary values can contribute to economic
development plans and strategies at the national and regional level, as well as down at the
project/programme level. This pragmatic approach is mirrored in the history of national
accounting in debates over whether parts of the informal economy can be estimated in value
terms and included in the accounts. It is also the case that a significant amount of
Government spending does not directly reflect exchange values, although some is based on
costs of production.

Page 5 of 57
As yet, natural capital lacks a widely agreed definition and a number of different
possible approaches could claim to provide (with varying degrees of complexity, uncertainty
and practicality) natural capital accounting processes. Most prominently these include:
Provide a limited extension to the measurement of economic activity via the main
national income/capital accounts, or within the framework of the UN System of
National Accounts (SNA)
Compile physical accounts (based on, for example, land use and habitat units2) as
satellite accounts, which highlight the contribution of the environment to the
economy and society
Compile physical and monetary natural capital satellite accounts, which are
compatible with but separate from national income/capital accounts
Fully integrate natural capital and ecosystem services accounts into national
accounts
Compile comprehensive social welfare wealth accounts (with economic welfare
values linked to wellbeing) in line with sustainable development principles (weak or
strong)
Compile corporate natural capital accounts (identifying firms’ dependencies and
impacts on natural capital in value terms).
Because each of these approaches have different objectives and answer somewhat different
questions, they require different data and, importantly, different values and valuation
methods. For simplicity, in the report we distinguish three broad approaches to natural
capital accounting each with the following objective:
1) Development of extended SNA type accounts to include more environmental
impacts, but which still follow SNA conventions and restrictions on how economic
activity is measured (APPROACH ONE). This approach would hence be strictly
based on exchange value concept.
2) Development of a separate set of (physical/monetary) Satellite natural capital
accounts that can provide complementary information to SNA type accounts. They
would serve to highlight the different contributions of the environment to the macro
economy and hence allow for a degree of flexibility and fit-for-purpose design
(APPROACH TWO). This approach could use different value concepts including
exchange and economic welfare values.
3) Development of comprehensive social welfare Wealth accounts, these are data
intensive and require a full range of shadow values for monetary valuation purposes
in order to capture wellbeing (APPROACH THREE).
2 In the SEEA context the relevant spatial statistical units are Basic statistical units (BSUs), Ecosystem Assets (EA)
and Ecosystem Accounting Area (EEA). See SEEA EEA 2017 for further details.

Page 6 of 57
The choice made between these different approaches will determine the form and
extent of any new accounting system and appropriate economic valuation methods. But the
approaches are not mutually exclusive. For example, information could be transferred from
the second to the first or to the third as knowledge improves and/or changes in accounting
practices are agreed. Similarly, information from accounts based on one approach could be
used to complement accounts based on another approach for specific policy requirements.
The first of these approaches (APPROACH ONE) it has been argued, limits the type of
values that can be utilised to incorporate environmental impacts into a monetary account.
From this viewpoint only exchange values can be used, although some analysts have made
the case for a wider inclusion of externality effects (Vincent 2015).Taking the example of a
positive externality where an ecosystem provides a service that is an input used by a firm to
increase production, the input value could be interpreted as an implicit exchange value. The
input value would be measured in terms of the value of the additional output produced by
the firm, and Vincent (2015) has argued that this is the maximum amount a producer would
be willing to pay for the ecosystem service if a market actually existed. If this approach is to
be generalised a number of practical measurement problems would need to be overcome.
The second approach (APPROACH TWO) aims to bring together a separate set of satellite
(physical/monetary) accounts covering ecosystem services assets (stock) and services (flows).
The objective is to ‘mirror’ changes in economic activity (expressed in the SNA type
accounts) with a set of ‘environmental’ accounts which quantify and value the consequences
of economic activity as it impinges on the environment and society through various drivers
and pressures. An agreed baseline position and timeline is required, but a wider range of
plural values can be utilised e.g. exchange and economic welfare values plus others.
The third approach (APPROACH THREE) attempts to provide a comprehensive social
welfare based wealth account in monetary terms (economic welfare values). These accounts
would aim to reflect the fullest possible quantification of capital assets and economic and
social wellbeing impacts (including for example health and education) in order to achieve
sustainable development.
The three approaches to natural capital accounting can play a diverse number of roles in the
policy process. At a strategic level (e.g. promotion of the Circular Economy strategy),
quantifying the natural capital asset base and the benefits it provides to the economy and
society represents an important component of a national or regional economic development
strategy. Such an approach would seek to increase resource use efficiency, increase resource
supply security and promote eco-innovation, thereby raising the overall productivity of the
economy. A monitoring system for natural capital can identify gaps in knowledge and lead
to a risk register (Mace et al 2015) together with information on ‘critical natural capital’
limits. Prior identification of the pressures, drivers and threats/opportunities to natural

Page 7 of 57
capital can facilitate the move to sustainable development paths. It may also be possible to
investigate societal inequalities by augmenting income data (Gini coefficient) with natural
capital provision and access data. At the enabling/implementation level natural capital
accounting can help in the assessment of the effectiveness of prevailing policy instruments
and the practicability of policy objectives, or future policy options. The same accounting
information can also play a role in individual project/programme assessment (see for
example the Balance Sheet approach (UK NEA Follow On 2014; Turner 2016).
The natural capital accounting system generally conceptualises the ecosystem as the
asset (stock), rather than the constituent parts. The assets are described in terms of a
particular land cover class or ecosystem type and in terms of their extent and condition. Hein
et al (2016) provide additional concept ideas relating to ecosystem assets, they argue that
capacity, capability to supply services and the potential supply of services are necessary
measures for accounting. These notions are closely related to sustainability and critical
natural capital limits and thresholds thinking. The distinction between intermediate services
and final ecosystem service flows used by beneficiaries, also needs to be borne in mind
(Boyd and Banzhaf 2007; Fisher et al 2009). Physical accounts classify and record the extent,
condition of and annual service flow from ecosystem assets. Monetary accounts put
monetary values (point estimates) on final ecosystem services on an annual basis, or on the
capacity to produce future flows of final services. There is a further choice to be made on
monetary values: welfare and/or exchange values. The former reflect the willingness to pay
for goods and services, regardless of whether they are exchanged for cash, or how much cash
they would be exchanged for if they were exchanged. The latter are the value at which flows
and stocks are in fact, or could be, exchanged for cash. Market prices are the reference for
valuation in most official guidance (e.g. OECD 2009). The guidance continues to cover
contexts in which no market price is available and recommends that if costs are also not
available, then stocks and flows may be valued, as a last resort, at the discounted present
value of expected returns. We take a closer look at valuation methods for ecosystem services
in a later section, along with some pragmatic guiding principles.
But other problems and choices also loom large in this accounting context. It is
important to clearly distinguish between stock and flow concepts. The SEEA EEA3 defines
the ecosystem stock account in terms of the extent or volume of the asset and its condition or
quality, at the start and end of a year. The services account shows flows over a given period
of time, but with the complication that some cross-cutting service accounts will be necessary
3 SEEA EEA refers to the report published by United Nations, European Commission, Food and Agricultural Organization of
the United Nations, Organisation for Economic Co-operation and Development, The World Bank (2014b) System of
Environmental-Economic Accounting 2012 – Experimental Ecosystem Accounting. United Nations, New York

Page 8 of 57
in cases where some services are provided by a number of habitats. A particularly difficult
challenge is posed when there is uncertainty over the sustainability of a given stock under
use pressure or environmental change. The use of point estimates for ecosystem services
values when non-marginal stock changes occur and thresholds are crossed is problematic.
The development of ‘red flag’ (e.g. UK NEAFO 2014) warning measures in the physical
accounts needs urgent attention given the uncertainties over threshold effects. If a strong
sustainability position is accepted then restoration costs may play a role in any satellite
account.
Stock (asset) sustainability and lifetime questions are important and add a further level
of complication to the accounting task. Hein et al (2016) have put a new emphasis on
ecosystem capacity and capacity accounts. The capacity relates to the sustainable rate of
usage of a ‘bundle’ of ecosystem services and represents an important link to long term
viability of an asset. This link is not reflected in the currently proposed approach to asset
valuation relying on a net present value basis for an expected flow of ecosystem services. In a
satellite account, UK ONS (2017) has suggested a proxy approach in which a minimum
restoration/ replacement cost would be charged and summed over the asset lifetime
(undiscounted). The acceptance of a strong sustainability worldview (with its constant
capital rule) is critical to this sort of proxy method and does not fit easily into SNA practice.
There is some debate over whether restoration costs are or are not equivalent to asset
depreciation in national accounts. On an annual basis, the latter represents the cost of
replacing the asset in its depreciated state, but the sum over all annual depreciation charges
is equivalent to the cost of replacing the asset in its non-depreciated state.
The use of replacement cost values will also be conditioned by the institutional /policy
context. Taking water purification as an example, this is strictly an intermediate ecosystem
service which yields the final service, clean water which has an economic benefit value to
consumers. However, if a formal water quality standards regime is in place then a value
comparison between a wetland providing a natural purification service and a water
treatment facility is a valid procedure. The costs of the two alternatives could be compared in
order to derive a cost effective solution.
Asset lifetime considerations bring in the question of an appropriate discount rate.
Most environmental economists agree that for environmental long lived assets a discount
rate based on market rates is not appropriate. Markets are essentially driven by short term
considerations. So for ecosystem assets a capacity and accounting lifetime of 100years seems
reasonable, together with a declining discount rate such as that adopted in the UK, based on
the Ramsey formula (e.g. ONS 2017).
The distinction between stock and flow has also been recently highlighted in work in
the USA (Fenichel and Abbott 2014, Fenichel et al., 2016). This line of argument seeks to keep

Page 9 of 57
natural capital separate from ecosystem services by linking natural capital more formally to
national capital accounts, with ecosystem services classified as part of the national income
account. A complication with this stream of research is the necessity to accommodate the
“scarcity effect” of natural capital depletion and the effect on market prices. This problem
seems to have been overcome in some empirical cases on groundwater and fisheries
compiled by these analysts (see sections in the main report).
The environmental economics literature now contains a range of tried and tested
valuation methods and techniques for market and non-market goods and services which can
in principle be used to value ecosystem services flows. For accounting purposes a clear,
explicit and consistent application of valuation methods is important. For example, ONS
(2017) have suggested a number of principles as guidance in the valuation process which we
have reinterpreted as follows:
Use of a particular technique should be clearly explained and related to the
underlying biophysical assessment process
Valuation methods should be transparent, intuitive and replicable
Where possible calculated values should be compartmentalised into their ‘price’ and
‘quantity’ components
‘Benefits transfer’ potential for using available estimates should be explored with
caution.
Four broad categories of valuation methods are potentially available:
Market-based methods (using market price values)
Revealed preference methods (related to the behaviour of individuals and the
expenditure they incur)
Cost-based methods
Stated preference methods (related to the answers provided by individuals when
responding to survey questions about their willingness to pay for something).
A fuller discussion of these methods is provided in a later section of this report.
The diverse range of methods for valuing flows of ecosystem services (e.g. Freeman et
al 2013) that are available to some extent reflect the prevailing set of different policy
objectives and contexts. An important first step in the process of developing natural capital
accounts is to get clarity and agreement on the broad approaches to accounting and the
related policy objectives. For example, while more effort might be put into developing a full
set of SNA-compatible natural capital accounts, specific satellite ecosystem service accounts
might also be constructed to provide complementary information (e.g. pollination accounts).
The ultimate objective of development of natural capital accounts is facilitation of
better-informed decision making. The debate surrounding the use of valuation methods for

Page 10 of 57
the natural accounts is far from settled. Since both the potential use and possible
methodologies are not yet fully clarified, we would argue that an open approach in the
context of KIP INCA might be taken to valuation methodologies. Nevertheless, this
pragmatism should involve a clear identification of and clear specification of the agreed
goals for the use of accounts. The work within the KIP INCA context allows grounds for
testing some of the approaches as well as comparing results under different approaches. This
is an opportunity that should be fully, but carefully, exploited.

Page 11 of 57
2 Background – national and wealth accounting
Current macroeconomic decision making is largely guided by the information derived
from the System of National Accounts (SNA; EC et. al. 2009) and its flagship policy indicator,
the Gross Domestic Product (GDP). Despite its frequent and (unfortunately) common public
interpretation as a welfare index, GDP does not provide a comprehensive picture of welfare
changes (Dasgupta 2009). It is clearly a fundamental component of overall wellbeing and is
a necessary but not sufficient measure of welfare. GDP is a gross flow measure, building on
SNA’s objective to “compile measures of economic activity in accordance with strict
accounting conventions based on economic principles” (EC et. al. 2009, para 1.1). It accounts
for flows of economic activities for a specified accounting period, however it omits some
non-market goods and services. This has consequences for environmental protection policy.
Rather than GDP, a stock of wealth indicator is required to measure intertemporal
sustainable growth and development progress.
Recent decades have seen an increased realisation of the need to better understand and
manage the relationship between human society and the environment. Decreases in
environmental quality have led to calls for improvement in our measurement systems for
sustainable development. A spectrum of approaches can be envisaged for this task. On one
end of this spectrum are different variants of a limited extension of national accounting that
incorporate environmental and ecosystem assets into its measurement system4. The
environmental and ecosystem accounts could also be constructed as satellite accounts that
are not integrated within the SNA system. These could be biophysical only, or also
encompass monetary accounts. A future and ambitious goal might be to fully integrate
ecosystem services into SNA system. At the other end of the spectrum of approaches to
natural capital accounting is wealth accounting. On a conceptual basis, some of these
approaches differ in the focus of their measurement systems and hence their ultimate
usability potential for policy making. While national accounting is focused on the flows of
economic activity over an accounting period (usually a year), wealth accounting focuses on
the changes in the (as far as possible) comprehensive set of stocks of capital assets
underpinning economic growth. In other words, national income accounting focuses
predominantly on the (changes in) flow of economic activities, wealth accounting aims to
measure (changes in) stocks of assets that condition the flows. These different approaches
offer useful insights for policy making and present different, and to certain extent
4 Note that, due to focus of this report on the accounting for environmental and ecosystem goods and services, we omit in the
following discussion the social dimension of sustainable development. Nonetheless a substantial progress has been made in
understanding and data collection on indicators related to social capital.

Page 12 of 57
complementary, alternatives and context for assessment of economic growth and
development. We feel that it is important to keep in mind the different possibilities for the
KIP INCA.
As it is predominantly focused on market activity5, SNA is missing important
information that is relevant for the assessment of growth in its broadest sense. Indeed,
important omissions of SNA’s measurements have been discussed since its inception in the
1950’s. Some contributions to economic activity are not reflected in the national accounts. In
particular, as a systematic measurement tool of economic activity, that aims to measure
output in terms of goods and services exchanged in markets, national accounting omits
economically, socially and environmentally important non-market goods and services. From
an economic point of view, for example, the SNA disregards unpaid work that takes place at
home which might significantly skew the view of economic production and economic
growth (see e.g. Landefeld and McCulla 2000). Similarly, a number of ecosystem related
goods and services (e.g. soil formation, fish nursery grounds) that support economic activity
are invisible in the SNA in the sense that they are implicit, but not explicit in their
contribution to production (e.g. food production, fisheries). Other ecosystem related goods
and services are omitted from the SNA in different ways. Their role in supporting human
wellbeing is not explicitly recognized and while some can be included in the prices of other
goods and services (e.g. amenity value of landscapes increasing property prices or increased
tourism revenue in the area), in some cases their value is ignored altogether (e.g. the value
ascribed to an existence of endangered species or the carbon sequestration and storage value
of some vegetation covers). An underestimation of the role of the environment in economic
and other human activity contributes to inefficient management and potential environmental
degradation.
Recent efforts, especially the System of Environmental-Economic Accounting, Central
Framework and Experimental Ecosystem Accounting (SEEA CF6 and SEEA EEA) aim to
extend and integrate the national accounts for environmental and ecosystem assets.
Ecosystems are viewed as assets that contribute to SNA-measured economic activity, but
also as assets that generate economic and human activity outside of SNA’s current
measurement system. This extension might effectively allow a) understanding how much
economic activities are dependent and/or impact on environmental and ecosystems assets
and b) extending the measurement of national accounts to some ecosystem services that
5 We acknowledge that SNA includes the public services provides by Government (such as schooling, hospitals, defence and so
on). It breaks these down into collective and individual public goods. But valuation is on the basis of the cost of providing those
services. 6 SEEA CF refers to the report published by United Nations, European Commission, Food and Agricultural Organization of the
United Nations, International Monetary Fund, Organisation for Economic Co-operation and Development, The World Bank
(2014a) System of Environmental-Economic Accounting 2012 – Central Framework. United Nations, New York

Page 13 of 57
contribute to human wellbeing that were previously fully or partially missing in national
accounting (e.g. air and water purification provided by various vegetation types).
SNA and SEEA measure flows and stocks related to economic and human activity by
collecting, organising and reporting associated information. The SEEA’s major addition to
SNA is the collection of physical data related to environment and ecosystems and the
organisation of it in a coherent manner following SNA conventions. Employing the exchange
value concept it aims to monitor the value of flows over the accounting year and change in
the value of assets. It relies on the market prices of goods and services exchanged in the
markets; or the ‘assumed’ transaction prices for goods and service that have no market.
The extension of SNA to ecosystem related goods and services represents a welcome
start in broadening our measurement of “what matters” for sustainable development
decision making. The systematisation of physical data on ecosystem assets is likely to
support numerous possible analyses and evidence gathering beyond national accounting. In
particular, it might support further development of and facilitate the broader use of wealth
accounting.
Wealth accounting aims to address the limited scope of national accounts and GDP by
focusing on the changes in capital stocks that are reflecting the changes in overall wealth.
SNA does not allow a charge for depreciation of natural assets to be included in income and
production accounts. GDP was always meant to be used strictly as a measure of economic
production (e.g. UNU-IHDP and UNEP 2012).The inability of main indicator commonly
used to guide policy - GDP - to measure natural capital depreciation is seen by some as its
major shortcoming (e.g. Dasgupta 2009). A policy of maximising the rate of economic growth
may result in a decrease in overall wealth or human wellbeing. SNA accounts for the
depreciation of reproducible capital7, however it does not account for the depreciation of
natural or human capital. As such SNA is not fully suited to assess changes in the overall
wealth of countries, or to signal possible suboptimal development trajectories.
Wealth accounting aims to augment the current target indicator for economic policy,
GDP, by a measure of wealth that can evaluate the changes in capital assets that all add
together to build a country’s wealth. From this perspective, an economy’s wealth is
composed of reproducible capital (infrastructure, buildings and machines), natural capital
(renewable and non-renewable natural resources) and human capital (education and
health)8. The economic indicators should reflect a measure of this wealth that accounts for
the depreciations of all capital assets. In contrast to national accounting, wealth accounting
7 We acknowledge that the reliability of reproducible capital depreciation in SNA can be questioned.
8 Note that wealth accounting might tend to stress intangible wealth such as social and institutional capital, technology, etc.

Page 14 of 57
estimates the shadow prices of capital assets – which in this context translate as the
contribution of a marginal unit of the asset to human wellbeing (see section below for further
discussion on welfare or shadow prices).
Two main initiatives represent the current approaches to wealth accounting: the
comprehensive wealth approach of the World Bank9 (World Bank 2006, 2011) and The
Inclusive Wealth Report10 (UNU-IHDP and UNEP 2012). These two approaches provide
initial insights into the extended use of wealth accounting which can encompass the
construction of natural capital accounts.
Needless to say national and welfare accounting aim to provide measurement
approaches guided by different objectives (see also box below). While the former is focused
on measuring flows (economic activities), the latter aims to measure stock (wealth).
Measuring wealth is more difficult, but of significant importance and interest to decision
making - after all it is the stock of natural capital that underpins the flows of benefits from it.
SEEA EEA can be seen as a significant step from the SNA system towards comprehensive
wealth accounting. The latter, however, remains a complex and ambitious long term goal.
The Inclusive Wealth Index (IWI) for example requires a large amount of shadow price data
and in principle should include health and education among other things. Due to
computational difficulties health was not included in the index, despite its obvious
importance in wellbeing UNU-IHDEP-UNEP (2014). For a critique of the IWI and
suggestions for substitute information (e.g. sustainability limits linked to critical natural
capital assessments) see Roman and Thiry (2016).
9 In its approach, the World Bank accounts for exhaustible resources, renewable resources and agricultural land. The wealth
measure also includes intangible capital (raw labour, human capital, social capital and the quality of institutions). 10 This approach accounted for reproducible capital, human capital, knowledge, natural capital, population, institutions and
time.
Page 15 of 57
Box 1: Weak vs. strong sustainability
Related to the debate on which measurement system should underpin public decision
making is the long standing debate between supporters of weak and strong sustainability.
Assuming sustainability (i.e. non declining overall stock of different forms of capital), the
critical issue that the opponents in this debate is the degree to which natural capital is
substitutable for other forms of capital. The proponents of strong sustainability see some
components of natural capital (‘critical natural capital’) as non- substitutable and as such it
should be conserved and protected so that its overall stock is not decreasing over time.
Weak sustainability accepts depletion of natural capital, as far as this decrease is offset by
innovation and technical progress which increases efficiency of usage and/or the role of
other forms of capital. This paradigm is historically more broadly reflected in our society –
e.g. in land use change, such as transforming stocks of forests to agricultural production or
through use of fossil fuels to produce man made capital.
The two standpoints could be seen at the opposite sides of a spectrum of political and
philosophical positions stakeholders might take to the management of the environment.
What each person, company, country or organisation adopts as her/his/its worldview, is
likely to define the choice of measurement system to account for sustainable growth.
Further the positions held from this spectrum might be different for different aspects of
natural capital. For example, for some aspects of natural capital society/individuals can
hold a strong sustainability perspective (e.g. species and ecosystem protection under the
Habitat and Birds directive), but weak sustainability perspective for other aspects of
natural capital (e.g. converting some components of natural capital to infrastructure allows
increase in social capital in terms of mobility and economic growth). Indeed, it seems
important to consider carefully which components of natural capital society deem to be
substitutable and which not.
The standpoint on the weak vs strong sustainability would be reflected in the measurement
system one adopts. From the three approaches specified in section 2.1, Approach 3 (Wealth
Accounting) can, if feasible, provide a measurement framework that would allow
measurement of progress in strong sustainability terms. Approach 1 and 2 can provide
measurement frameworks for weak sustainability position, although Approach 2
information could also be used to impose ‘critical natural capital’ conservation rules and
regulations in line with strong sustainability.
Page 16 of 57
2.1 Three approaches to natural capital accounting:
The approaches to natural capital accounting described above could be seen on a
spectrum with on one side represented by strictly SNA-compatible accounting and on the
other side wealth accounting. An approach that uses satellite accounts is positioned between
the two.
We take a pragmatic approach towards testing of natural capital accounting and we
specify three broad approaches that can be adopted in its development. We believe that such
a perspective allows flexibility for countries to develop and test accounts, depending on their
individual pressing policy needs. Our perspective does not aim to underplay the importance
of economic theory underpinning natural capital accounting – we would argue that
theoretical basis of accounts should be developed in parallel to actual testing of the accounts
and requires joint effort between economists, natural scientists and statisticians.
The three approaches can be characterised as follows:
1) APPROACH ONE (SNA Accounting):
The objective under this approach is to develop extended SNA type accounts to
include more environmental impacts, but which still follow SNA conventions and
restrictions on how economic activity is measured. This approach would hence be
strictly based on exchange value concept (see section 3.1 below) and would only
consider the components of the natural capital for which exchange values, or
imputed exchange values, can be estimated. In this approach the current SNA
conventions and measurement principles together with data availability dictate
which components of natural capital that can be included in national accounting.
2) APPROACH TWO (Satellite accounts):
The objective under this approach is to develop a separate set of (physical/monetary)
Satellite natural capital accounts that can provide complementary information to
SNA type accounts. These satellite accounts would serve to highlight the different
contributions of the environment to the macro economy and hence allow for a degree
of flexibility and fit-for-purpose design. This approach could use different value
concepts including exchange and welfare values depending on the planned use of the
accounts and data availability. While some of the constructed accounts under this
approach can be directly compatible with SNA accounts (hence in exchange value),
other can be compatible indirectly (e.g. through matching spatial statistical
units/areas).
3) APPROACH THREE (Wealth Accounting):
The objective under this approach is to develop comprehensive social welfare Wealth
accounts, such as the IWI. The Wealth accounts are data intensive and require a full
range of shadow values for monetary valuation purposes. This approach would use,

Page 17 of 57
when possible, shadow prices and otherwise exchange and welfare values when
appropriate. From a strong sustainability policy point of view this is the most
desirable type of account but in practice it is proving difficult to meaningfully reflect
a comprehensive range of external costs and benefits with links to wellbeing.
The activities surrounding SEEA EEA and SEEA CF indicate that the future goal is an
integrated account (Approach one) - i.e. fully compatible SNA type accounts with an
extended production boundary.11 Other initiatives related to wealth accounting would be
further enabled by Approach two.
The three approaches are not mutually exclusive and it is foreseeable that efforts
within each approach could support each other. For example, the development of SEEA EEA
and SEEA CF might be useful for all three approaches. We would argue that each approach
has its advantages and disadvantages. Approach one would be compatible with a
historically used and significantly developed and tested accounting systems and practices.
At the same time this approach risks ignoring components of natural capital for which
exchange values cannot be derived; and/or might disregard some dimensions of natural
capital values that might be important (e.g. non-use values, broader welfare values of
ecosystems). Approach two’s main advantage is its flexibility and fit-for-purpose orientation
that allows use of different data and, in particular, range of existing valuation studies for
deriving monetary values for natural capital accounts. Its disadvantage is that as the set of
accounts becomes more comprehensive it becomes more difficult to derive indexes of
change, or to rank order indicators. The third approach is in principle the most suitable
measurement system for an assessment of the development process – in social, economic and
environmental terms. However it is also the most difficult approach in terms of meaningful
data/information – it requires difficult estimations of shadow prices and as comprehensive a
data set as possible on all three dimensions of progress.
A particularly divisive issue across the three approaches is the use of non-market
valuation. Vincent (2015) has made the case for incorporating non-market valuation directly
into the main national accounts. He uses environmental externality and public goods
concepts to argue that there is a transaction (in money terms) between economic agents
involved in the activities generating external effects. Therefore there is a basis for arguing for
the incorporation of non-market values into national accounts. It seems to us that in practice
this line of reasoning is similar to the use of production function data to generate values; and
11 Note that SEEA EEA (2017) explicitly recognise (see 2.10) that it might be possible or desirable to construct
accounts that, for example, adopt different valuation concepts to suit particular policy needs – in line with what
we describe as approach two.

Page 18 of 57
satellite accounts, it could be argued, allow more flexibility and range of coverage in terms of
environmental impacts and values.
We believe that thinking about the development of natural capital accounting in terms
of what the final objectives of the accounts will be might be helpful in facilitating more
experimentation and allow progress in natural capital accounting. Keeping the three
approaches listed in this section in mind, the next sections will discuss the valuation
methodologies and issues relevant to the KIP INCA.

Page 19 of 57
3 Valuation in/for Natural capital and Ecosystem
Accounting
Building on the discussion above, it is important to note that accounting relies on two
key concepts of stocks and flows, where stocks are measured at a specific point of time and
flows are measured over selected time period. Following the SEEA EEA conceptual
framework (see Figure below) the concept of stock translates to spatially delineated
ecosystem assets that produce flows of ecosystem services. Ecosystem accounting aims to
measure both flows of ecosystem services over an accounting period (usually an accounting
year) as well as to monitor changes in stocks of ecosystem assets.
Figure 1 General Ecosystem Accounting framework [Source: SEEA EEA]
Ecosystem services contribute to two types of benefits. Many ecosystem services are
already present in national accounts (e.g. crops, timber, some aspects of tourism/recreation)
and these are in SEEA EEA terms called SNA benefits. The inclusion of ecosystem services
contributing to the production of SNA benefits leads to increases in intermediate
consumption, but does not have any effect on the overall level of income/GDP. Ecosystem
services contribution to production of benefits that are not accounted for in SNA - Non-SNA
benefits – lead to an expansion in the measures of output and hence changes
(increases/decreases) in GDP.
The SEEA EEA envisions the following five ecosystem accounts:
Ecosystem extent account – physical terms

Page 20 of 57
Ecosystem condition account – physical terms
Ecosystem services supply and use account – physical terms
Ecosystem services supply and use account – monetary terms
Ecosystem monetary asset account – monetary terms
The five accounts could be considered as satellite accounts of the SNA, however they
do not depend on the SNA accounts for their compilation (SEEA EEA 2017). Recent
discussion have also raised a possibility to compile ecosystem capacity accounts (Hein et al.
2016, SEE EEA 2017).
Assuming available biophysical data from physical accounts, valuation techniques can
be employed to provide monetary ecosystem service accounts and monetary ecosystem asset
accounts. The valuation step is essential if an integration with the SNA is required.
However, the valuation of nature-related goods and services is one of the most contested
topics and is conditioned by the adoption of different weak or strong sustainability
worldviews (see Box above). The debate exposes profound differences and as such is far
from settled, including the choice of adequate valuation concept and methods (e.g. SEEA
EEA, Obst et al. 2015, SEEA EEA 201712). See the discussion of the appropriate valuation
concepts further below.
Single ecosystem service flows from ecosystem assets are valued using the most
appropriate techniques in light of available data. Note here that it is crucial to identify the
benefits/beneficiaries, since without the demand there are no benefits and hence no
ecosystem services. As such, actual service usages need to be identified to value the flows of
services over the accounting period. This also holds true for expected future use of
ecosystem services to estimate asset values where identification of patterns of use is of
crucial importance.
The identification of the actual use of services might differ across service types. For
example, most provisioning services’ usage will be reflected in increased extraction or output
quantities (e.g. food produced, timber harvested). In contrast, the usage (and value) of many
regulating and cultural services generally increase with the number of people in the relevant
area (e.g. flood protection, air and water purification or recreation).
The asset valuation in SEEA is expressed through the Net Present Value of Expected
Ecosystem Service flows from an ecosystem asset, assuming current consumption patterns.
However other theoretically possible approaches for asset valuation have also recently
12 SEEA EEA 2017 refers to the draft consultation report “SEEA Experimental Ecosystem Accounting: Technical
Recommendations” released on 6th March 2017 and developed by UNEP / UNSD / CBD project on Advancing Natural Capital
Accounting funded by NORAD.

Page 21 of 57
materialised (see later section). At this current stage, the focus of the KIP INCA is on
ecosystem service (flow) valuation.
3.1 Exchange and welfare value concepts
One of the contested topics in the context of valuation methods for natural capital
accounting has been the adequacy and relevance of the exchange value and welfare value
concepts. It has been argued that for SEEA EEA the chosen value concept can only be
exchange value, in order to allow integration of the values of stocks and flows related to the
man-made capital with the values of natural capital (e.g. SEEA, Obst et al 2015).
National accountants focus on exchange values or as Obst et al (2015) put it “the value
at which goods, services and assets are exchanged regardless of the prevailing market
conditions”. In the case of ecosystem services, for which markets often don’t exist, exchange
values essentially represent an assumed transaction between an ecosystem asset and
economic units, or “the monetary value of the ecosystems to economic production and
consumption” (SSE EEA 2017 6.59). In the figure below, the exchange value concept is
represented by producer surplus (area B) and cost of production (area C). This is equal to P*
times Q*, market price of a good/service and its consumed quantity. Using the exchange
value concept is convenient for national accounting as it allows consistent recording of
(assumed) transactions in national accounting, since the values for supply and use are the
same. At the same time, for most of the marketed goods the data is readily available. For
ecosystem services, most of which are not traded in the market, these values need to be
imputed (however, note that value imputation is already used for health, education or
intermediate financial services in the SNA).
In contrast, the welfare value concept and welfare analysis is related to the changes in
consumer surplus (area A), relative either to market or shadow price. The consumer surplus
area represents the difference between consumers’ full willingness to pay and the price they
actually pay which is typically smaller. For many policy analyses and decisions, it is the
welfare value concept that is of relevance. The welfare value concept underpins EU Cost
Benefit analyses guidelines (e.g. Sartori et al. 2014) and the majority of the studies analysing
the values of ecosystem services are based on the shadow or welfare value concept.

Page 22 of 57
Figure 2: Supply and Demand for ecosystem related goods and services
We argue that some degree of pragmatism is reasonable when choices are made on
valuation methods and estimates. It is our opinion that while the exchange value concept is
relevant for national accounting purposes, it should not be the only consideration for the EU
natural capital accounts. The choice of valuation approach and methods is dictated by the
aim of natural capital assessment (see SEEA EEA 2017). So if the sole purpose of constructing
natural capital accounts in the EU is to integrate the ecosystem values with SNA, it might be
necessary to only use the exchange value concept (e.g. Obst et al. 2015). But other accounting
practice options might be considered, especially if the ‘new’ accounts are satellites to the
main national accounts and the primary aim is to highlight the contribution of the
environment (ecosystems) to economic progress. Similarly, some accounts might serve a
specific policy goal and hence need a broader concept of value (e.g. assessment of the
contribution of national parks to societal welfare).
As a practical example UK ONS (2017) suggests that in situations where the exchange
values cannot be imputed it might be feasible to use welfare values, assumed as exchange
values (i.e. retaining use and supply values). This would provide an overestimation of the
exchange value and would need to be clearly noted in the accounts construction. Further, in
cases where the difference between the two value concepts might be significant, it could be
useful to attempt to report both value types, however how this could practically be achieved
would need to be clarified (ibid). We would argue that rather than assuming welfare values
as exchange values it would be perhaps more useful and transparent to produce satellite
accounts which, by definition, can be more flexible in terms of what values can be
incorporated. The goal of the satellite accounts would in this context be to emphasise the
contribution of environmental assets and services to economic development/progress, as
well as to give some signals on sustainability.

Page 23 of 57
The information organised and collected in the physical and monetary accounts could
also be used for purposes other than national accounting, such as policy evaluation,
management decisions or advocacy purposes. For example, Costs Benefit Analyses that
underpin a number of key EU policies and programmes (e.g. investment projects within
cohesion policy 2014-2020) use welfare value for assessments. Further, it might be of interest
to policy makers to develop wealth accounting in order to assess its progress in
sustainability. In this case, exchange values are augmented by shadow prices of natural
capital assets13.
What distinguishes actual exchange value is that it does not assume any institutional
arrangement by accepting the institutional arrangement in which the transaction took place.
As Atkinson and Obst (2016) note this is not a neutral position, since accounting does not
make any judgement about what the institutional arrangement should be. As such, using
both exchange and welfare values in satellite accounts derived under different institutional
arrangement can help to measure progress towards (desired) policy targets.
Ecosystem services are in many cases associated with non-use values. People may
value the continued existence of species and ecosystems for themselves, for others or for
future generations (i.e. existence, altruistic and bequest values, respectively). This component
of value might in some cases be significant. It is not yet clear how to capture non-use value
within an accounting system, as these values are generally captured through methods based
on the welfare value concept and stated preference valuation methods reliant on surveys14.
Given that the current stage in the EU natural capital accounting process is
experimental, we believe different approaches are still open for debate and should be
explored in a pragmatic process. However, it is also expected that the policy utility focused
work stream in this project (prepared by IEEP) is likely to shed more light on the policy
demands for the KIP INCA outputs which might help to select appropriate value concepts
and valuation methods.
3.1.1 Simulated exchange values
An emerging method of simulated exchange values potentially provides an
opportunity for using stated preference methods to derive exchange values. Caparrós et al
(2003) proposed the method and Caparrós et al (2015) further describe this method and
13 In a perfect competitive market, we acknowledge that exchange and shadow value for accounting purposes will be the same
as the marginal value that will be P*. However, we argue that markets or quasi-markets for ESs are far from “perfect”. 14 More fundamentally, the issue about the incorporation non-use values might be about the physical accounting units to use for
multiplying the potential estimated price.

Page 24 of 57
apply it to free access recreation services in Spain. The method estimates demand for a
service, using non-market valuation methods, and models the whole market - the demand
against the supply of a service under different market structures. In their application,
Caparrós et al (2015) derive the demand function from a stated preference survey and for the
supply curve of the service they survey public servants for an understanding of the cost
associated with the provision of free access recreation. The exchange value/price can then be
found at the intersection between the demand and supply curves.
A lack of research is available related to this approach to make it truly operational.
Further work is required to explore to what extend the method provides an option to use
existing evidence from stated preference literature to derive values compatible with the
exchange value concept and national accounts. Further, it is important to consider the efforts
related to understanding the supply of the services as well as the assumptions used in
implementing this method (e.g. assumptions related to the shape of the demand function).
From our view, as of yet, this approach either requires a number of bold assumptions or very
detailed dataset and/or effort in survey on the demand and supply for the service.
3.2 Valuing flows – ecosystem services
Valuing flows in the context of extending or/and integrating natural capital into SNA,
implies valuing final ecosystem services. While the biophysical definition of ESs often refers
to provision, regulating, cultural (e.g. CICES15) and supporting (MA 2005) services this
classification needs to be further adapted for economic assessment (e.g. Fisher and Turner
2008). There are flows of ecosystem service between ecosystem assets (i.e. intermediate or
supporting ecosystem services), but for the construction of monetary ecosystem services
accounts, only final ecosystem services should be accounted for and valued, otherwise
double counting might occur (Fisher et al. 2009).
Nevertheless, recent discussions have highlighted the need to account for the
intermediate ecosystem services (functions) in order to understand interdependencies
between ecosystem assets and to answer particular policy questions (e.g. SEEA EEA 2017
1.71, 1.72; 5.40 - 5.43). Indeed valuing intermediate ecosystem services can provide valuable
information for cost effectiveness and other management decisions (e.g. restoration of
ecosystems, conservation interventions etc.), but it is essential that the intermediate and final
services are clearly distinguished. Only final ecosystem services can be the focus of the
ecosystem use and supply accounts in the SNA/SEEA EEA or double counting can occur.
15 The Common International Classification of Ecosystem Services (CICES) – see https://cices.eu/

Page 25 of 57
Satellite accounts can be used to highlight the contribution of intermediate ecosystem
services that are valuable for the functioning of natural capital which produces the final
ecosystem services outcomes which are already accounted for in the SNA (e.g. pollination
for agricultural production). There may also be cost-effectiveness decision making contexts
in which it is valid to compare an ecosystem service alternative with a man-made capital
facility i.e. comparing natural wetland water purification with the construction of a treatment
plant, given an institutional context in which water quality legal standards are in force.
At the EU level, valuing chosen ecosystem services will depend on the data available
and the goal of the particular account(s). As discussed above, different valuation concepts
might be relevant in light of the goal the account should serve.
The valuation methods that can be used in the context of SEEA EEA (i.e. based on
exchange value concept) are classified in:
Market-based or cost-based methods
Unit resource rent
Production function, cost function and profit function methods
Replacement cost
Damage costs or defensive expenditure
Averting behaviour
Payment for Ecosystem Services (PES) schemes
Revealed Preference methods
Hedonic pricing
Marginal values from travel cost demand functions (simulated exchange)
Whether the intention of accounting is to complement/extent SNA with satellite
information, or to move to wealth accounting other valuation methods can be considered,
such as:
Stated Preference methods
Contingent Valuation
Choice experiment
Extensive literature is available on the theory and application of methods in context of
valuing preferences for ecosystem related goods and services and we recommend these for

Page 26 of 57
further detail16. In the following sub section we will focus on the specifics of valuation
methods for natural capital accounting.
Many of the methods listed above require extensive data and statistical expertise (e.g.
hedonic pricing), existing markets (e.g. PES); or detailed biophysical/scientific understanding
(e.g. Production function) to make the method practically applicable. Use of existing
valuation results, particularly for the KIP INCA project, might be needed.
In the case of market-based price values, usage should be conditioned by the
prevailing institutional arrangements (e.g. degree of competition in the market), and should
not include non-ecosystem inputs (reproducible man-made capital).
Resource rent approaches (which is estimated as the difference between the benefit
price and the unit costs of labour, produced assets and intermediate inputs) are most suited
to so-called provisioning ecosystem services but again much depends on the prevailing
market structures (e.g. subsidies might obscure the “true” exchange value). Another
potential approach would be to try to discern a production function and the contribution to
it made by an ecosystem service (typically provisioning and some regulating services).
Physical science and data gaps, and the existence of non-market values can complicate any
production function estimation. Given a pragmatic strategy, a possible alternative proxy
approach could be replacement costs or damage costs methods. The complications with this
proxy approach include the correct identification of the beneficiaries, and their actual
incurred costs. In other cases, avertive behaviour purchasing (or defensive costs) may
provide useful value estimates.
Hedonic pricing methods (which generally look at the variation in housing prices to
assess the value of local environmental attributes) are linked to market-based transactions
but require large data sets with spatial variation. Further it is sometimes difficult to
disentangle the ‘bundle’ of ecosystem services that may be represented by for example
residential property prices.
Travel cost methods (which use travel expenditures to a site/good, in terms of financial
and time costs, to assess good/site’s value) have been greatly refined over the years due to
the increased use and capability of Geographical Information Systems (GIS). However the
values they yield include welfare value (time) and other components which are already
included in national accounts. An alternative proxy approach could be to rely instead on raw
16 See e.g. Badura et al (2016) (available for download) for a short overview, Bateman et al (2011) for theory and
policy context for ecosystem service assessments and Freeman et al (2014) for a thorough theoretical and practical
discussion of valuation methods.

Page 27 of 57
travel cost (mean or median) data from surveys perhaps differentiated by day trip and
longer stay visits. In cases where there is an entry price to the facility/area this is a
willingness to pay measure. In satellite accounts travel cost measures could provide useful
supplementary information highlighting the contribution of the ecosystem service
(recreation) to among other things human wellbeing.
Stated preference methods (contingent valuation or choice experiments) based on
participant surveys (where individuals provide answers about choices related to
environmental change or their willingness to pay for any such changes), are the best option
for non-use values related to feasible transactions. However, care needs to be taken since
these methods are often based on the welfare value concept, although they can be designed
to capture only market based values. They may also have a role to play as a cross checking
device.
Recent discussions and literature (Freeman et al 2013, SEEA EEA 2017, Atkinson and
Obst 2016) have highlighted the possible usefulness of looking at the economic channels
through which ecosystem services affect human wellbeing. This categorisation recognises
three broad ecosystem service types:
ES#1, intermediate services which input in the production system along with
other producing factors
ES#2, final/intermediate ecosystem services which provide benefits to
households as complementary (or substitute) of marketed goods and services
ES#3, final ecosystem services which directly contribute to household
wellbeing.
This distinction can be useful for classifying methods for ecosystem service valuation
in a manner that is relevant to national accounting thinking, due to its explicit consideration
of users of the services. .Building on the discussion in section 2 of the report, we indicate the
links between service users and the three broad approaches to natural capital accounting:
1) Approach 1: development of SNA compatible natural capital accounts that will fully
follow SNA conventions and restrictions on what the accounts measure and how.
2) Approach 2: development of Satellite natural capital accounts that can provide
complementary information to SNA accounts and hence allow certain flexibility and
fit-for-purpose design, including use of different value concepts.
3) Approach 3: development of comprehensive Wealth accounts. Requiring an
extensive range of shadow pricing and wellbeing information.
Under Approach 1: ES1 services such as waste disposal and water quality, have values
that are implicitly encompassed within economic production and as such are already
included in SNA accounts. But valuation via exchange prices and production functions

Page 28 of 57
could add to information on the service’s contribution to final services. ES2 benefits fall into
two sub categories, in the first households purchase a good which has an ecosystem service
level condition associated with it e.g. local air quality or amenity. This group is already
included in SNA accounts via for example the property market. The second sub category
households choose a level of ecosystem service through their purchase of a complementary
market good, for e.g. recreation valued by travel costs and these will add to conventional
GDP. Finally ES3 services, non-use services, are excluded from SNA accounts because
exchange values are not available, only stated preference methods can be used in this
context.
Under Approach 2: all three ES1, ES2 and ES3 services could be quantified and valued
directly, or their supply contribution to final services assessed. Under Approach 3: some
variant of an inclusive wealth index would seek to encompass all the service categories and
other wellbeing components such as health and education.
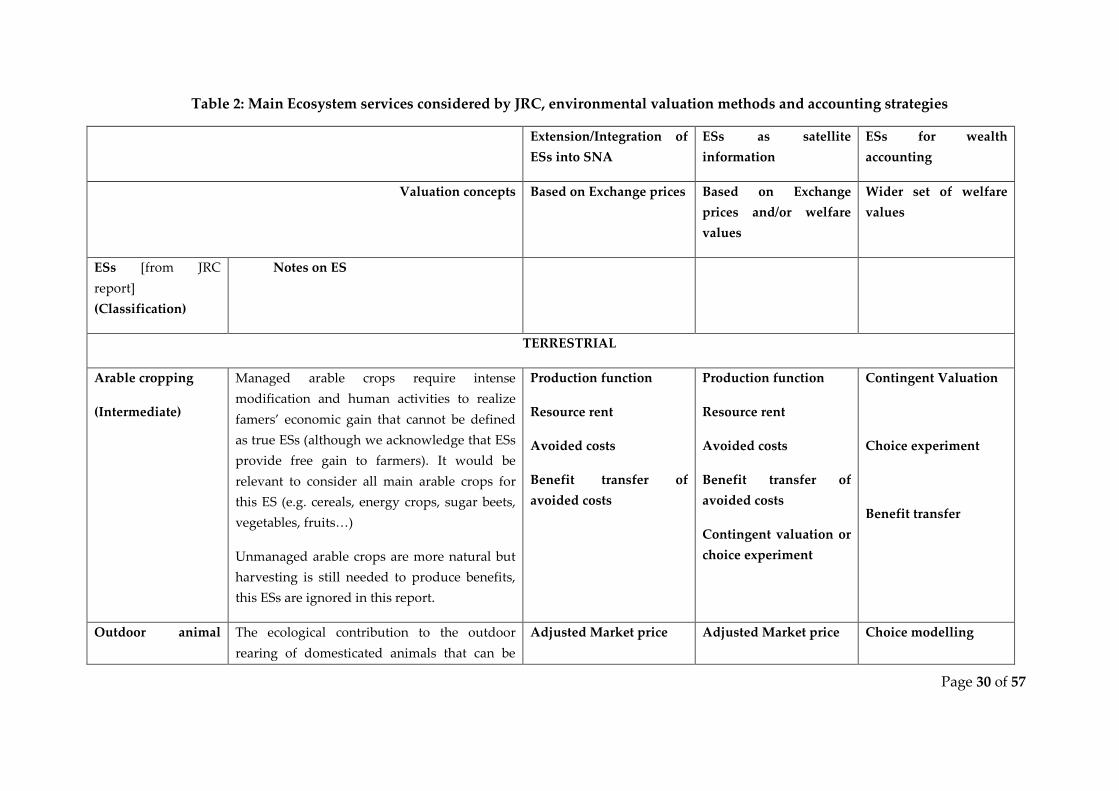
Table 1 provides different perspectives on the methods that can be used for natural
capital accounting in light of the three strategic (1, 2 and 3) approaches to natural capital
accounting. It provides examples of methods that can be potentially used for valuing
individual ecosystem service flows within the context of KIP INCA. Please note that further
detail on this is to be explored in light of testing of the approaches over the course of KIP
INCA actions, and that the entries in the table are subject to further assessment. Table 2
provides examples of valuation methods that can be used to assess ESs considered by JRC.

Table 1: Valuation methods for different ESs accounting strategies
Category Explanation
from economic
perspective
Examples of
ecosystem
services
Link to national
accounting perspective
Valuation
methods for
integration
SNA
Valuation methods
for supplementation
of SNA with satellite
accounts
Valuation methods
for wealth accounting
ES#1 ESs as input to
economic
production
Nutrient cycling,
water regulation,
water
purification, crop
pollination
Value of ecosystem
service is implicit in the
value of economic
production as
measured in standard
national accounts (e.g.
in conventional GDP).
Market/cost-based
methods (e.g.
production function,
avoided costs)
No extra methods
required
ES#2 ESs as joint
inputs to final
consumption
Amenity value,
purified air,
recreational
activities, flood
protection
Some values of
ecosystem service are
already reflected in
household
consumption as
measured in standard
national accounts (e.g.
in conventional GDP)
others provided
extended benefits (non-
SNA benefits).
Market/cost-
based methods
(e.g. production
function)
Revealed Preference
methods or
market/cost-based
methods (e.g. hedonic
pricing in property
markets, travel cost,
damage costs)
Stated Preference
methods such as
contingent valuation,
(discrete) choice
experiment
ES#3 ESs as direct
input to
households
wellbeing
Carbon storage Value of ecosystem
service is not associated
with any purchase of a
market good
Simulated
Exchange
values
Simulated Exchange
values or stated
preference methods
Stated Preference
methods such as
contingent valuation,
(discrete) choice
experiment [Source: Adapted from Freeman et al. 2013 and Atkinson Obsts 2016]
Page 30 of 57
Table 2: Main Ecosystem services considered by JRC, environmental valuation methods and accounting strategies
Extension/Integration of
ESs into SNA
ESs as satellite
information
ESs for wealth
accounting
Valuation concepts Based on Exchange prices Based on Exchange
prices and/or welfare
values
Wider set of welfare
values
ESs [from JRC
report]
(Classification)
Notes on ES
TERRESTRIAL
Arable cropping
(Intermediate)
Managed arable crops require intense
modification and human activities to realize
famers’ economic gain that cannot be defined
as true ESs (although we acknowledge that ESs
provide free gain to farmers). It would be
relevant to consider all main arable crops for
this ES (e.g. cereals, energy crops, sugar beets,
vegetables, fruits…)
Unmanaged arable crops are more natural but
harvesting is still needed to produce benefits,
this ESs are ignored in this report.
Production function
Resource rent
Avoided costs
Benefit transfer of
avoided costs
Production function
Resource rent
Avoided costs
Benefit transfer of
avoided costs
Contingent valuation or
choice experiment
Contingent Valuation
Choice experiment
Benefit transfer
Outdoor animal The ecological contribution to the outdoor
rearing of domesticated animals that can be
Adjusted Market price Adjusted Market price Choice modelling

Page 31 of 57
husbandry
(Intermediate)
used for the production of food. The outdoor
rearing of animal provides higher organoleptic
properties of food and better quality of life to
animals.
Replacement costs
Resource rent
Replacement costs
Resource rent
Contingent valuation or
choice experiment
Benefit transfer
Timber
(Final)
The ecological contribution to the growth of
tree for timber production.
Adjusted Market price
Resource rent
Crop pollination
(Intermediate)
Movement of floral gametes for reproduction
of plants thanks to wild bees and pollinators.
Production function
Replacement costs
Adjusted Market price
Production function
Replacement costs
Adjusted Market price
Contingent valuation or
choice experiment
Contingent valuation
Choice experiment
Benefit transfer
Erosion control
(Final)
Retention of soil within an ecosystem Avoided costs
Replacement costs
Benefit transfer of
avoided costs
Avoided costs
Replacement costs
Contingent valuation or
choice experiment
Hedonic price
Contingent valuation
Choice experiment
Benefit transfer
Outdoor recreation
(Final)
The natural amenities which provide recreation
opportunities for human beings.
Resource rent
Production function
Resource rent
Production function
Contingent valuation or
Contingent valuation
Choice experiment

Page 32 of 57
choice experiment
Travel cost or hedonic
price
Travel cost
Benefit transfer
MARINE
Marine fish
(Final)
Wild fish species that can be harvested and
used as food. Harvesting is still needed to
produce benefits out of this ESs.
Adjusted Market price
Residual Resource rent
Adjusted Market price
Residual Resource rent
Contingent valuation or
Choice experiment
Travel cost
Benefit transfer
Choice modelling
Contingent valuation
Travel cost
Benefit transfer
FRESHWATER
Water purification
(Intermediate/Final)
Removal or breakdown of excess nutrients of
compounds in water
Replacement costs
Resource rent
Payment for ecosystem
services
Contingent valuation
Choice modelling
Fiscal instruments
Payment for ecosystem
services
Benefit transfer
Contingent valuation
Choice experiment
Benefit transfer

Page 33 of 57
Water provisioning
(Intermediate)
The provision of water flow for human uses
can produce several benefits (e.g. bottle water)
Adjusted Market price
Resource rent
Payment for ecosystem
services
Replacement cost
Adjusted Market price
Resource rent
Payment for ecosystem
services
Replacement cost
Contingent valuation or
choice experiment
Contingent valuation
Choice experiment
Benefit transfer
Flood control
(Intermediate)
The natural control of water flow in rainy
season.
Adjusted Market price
Avoided cost
Adjusted Market price
Avoided cost
Contingent valuation or
choice experiment
Hedonic price
Contingent valuation
Choice Experiment
Benefit transfer
OTHERS
Air purification
(Intermediate)
Removal or breakdown of excess nutrients of
compounds in the air
Avoided health cost
Replacement cost
Avoided health cost
Replacement cost
Contingent valuation or
choice experiment
Hedonic price
Contingent valuation
Choice Experiment
Benefit transfer
Global climate
regulation
Maintenance of stable and sustainable air
gases combination
Adjusted Market price Adjusted Market price Contingent valuation

Page 34 of 57
(Final) Replacement cost
Payment for ecosystem
services
Replacement cost
Payment for ecosystem
services
Fiscal instruments
Contingent valuation or
choice experiment
Choice experiment
Benefit transfer

3.2.1 Valuing pollination17
Crop pollination is an intermediate ecosystem service and hence should not be
confused with final service supply. Importantly, crop pollination is already included in the
income estimates provided by the SNA through the value of crops traded in the markets
(ES#1). The contribution of ecosystem assets to this production should be assessed through
final ecosystem service Cultivated Crops, following the hierarchical structure provided in
the Common International Classification of Ecosystem Services (CICES) - Nutrition, Biomass,
and Cultivated Crops. Crop pollination is an intermediate ecosystem service that acts as an
input to production of crops. As such a crop pollination account will not impact GDP, but
could be constructed in order to better understand the contribution of pollination to crop
production that is already accounted in the SNA (and GDP). Note that pollination in general
terms also contributes to other benefits, such as ornamental flowers, or wildflowers and wild
foods. In this context pollination might impact on people’s cultural enjoyment of the
landscape and hence methods ES#2 and perhaps ES#3 might be more appropriate.
Consideration might be given to value pollination in this broader context, depending on the
final objective of the pollination accounts.
As raised previously, the purpose (i.e. which accounting approach) of the valuation
exercise needs to be identified in order to select the theoretically and practically most
appropriate valuation method. It is assumed that the interest in developing the crop
pollination accounts is essentially in raising the importance of pollination for crop
production and therefore of particular components of ecosystems for management or
advocacy purposes. However, note that if the goal is advocacy for e.g. protected areas, field
margins or other conservation interventions related to pollination, it is likely that the welfare
value concept might be of more relevance. Such focus might be more closely aligned with
project evaluation using CBA instead of accounting.
NOTE: Clear understanding of the objectives for valuing crop pollination are essential
for selection of valuation method.
Recent years have seen an increased interest in understanding pollination services
(IPBES 2016) and valuing pollination services (e.g. Hanley et al. 2015, Breeze et al. 2016). The
empirical evidence of the value of pollination services is still scarce, heterogeneous and
varies geographically and only partially inform management and policy (Breeze et al. 2016).
Most of the literature focuses on the contribution of pollinators to agricultural production.
A number of approaches can be distinguished for valuing pollination services.
Dependency ratios and yield analyses aim to calculate the portion of the production that can
17 This report forms a basis of Technical Support Action to Joint Research Centre’s efforts to value crop pollination
and recreation services.

Page 36 of 57
be attributed to pollination either based on the literature review and expert consultations
(e.g. Klein et al. 2007) or from direct field experiments (e.g. Garratt et al. 2014, Klatt et al.
2014). These methods often omit other factors that influence crop productions, such
fertilisers and other production inputs, that might lead to overestimation of the benefits.
More complex production function approaches have been proposed (e.g. Hanley et al. 2015).
These aim to estimate a function that reflects the various inputs to crop production where
pollination represent one such input, effect of which can be isolated and hence valued. This
method requires detailed understanding of the crop production process and high quality
data. Further, some studies use cost of replacement to value pollination services with
technology (e.g. Allsopp et al. 2008) or using the rental costs for managed honeybee
pollination (e.g. Rucker et al. 2012). The approach based on costs of replacement of
ecosystem services has been criticised in the literature as these costs might in some cases
bear little resemblance to the value of actual benefit and should be used with caution (e.g.
Barbier 2007, Melathopoulos et al. 2015). All the above techniques often simplify the impact
of pollination loss on welfare, as they disregard effects of prices and crop markets – they do
not capture the impact of pollinators on producer and consumer surplus. Some recent
studies attempted to do so (e.g. Gallai et al. 2009, Bauer and Wing 2016). Each of the
approaches to value pollination services have their strengths and weaknesses (see Table 3
below), however it is mostly data availability that dictates which methods can be used in a
given context.
Notwithstanding the purpose for the construction of crop pollination accounts, the
following data is anticipated for the construction of monetary crop pollination service
accounts, as a minimum requirement:
Location of agricultural lands that is in proximity to land covers that provide
pollination services, with detailed data on the cultivated crops in the areas
concerned, yields of these crops and the prices paid for these crops (from SNA)
An understanding of the composition and abundance of the pollinators in each
areas/locations/habitats adjacent to crop fields, as well as pollination interaction
relationship of each species with each crop, including species visitation ranges.
Other data might be relevant for accounting purposes, in particular the
replacement costs in terms of both manual pollination expenses or costs of
using managed pollinators. Similarly, it might be useful to have data that allow
an understanding of the various factors that influence crop production that
would allow to isolate the contribution of pollination from other factors
influencing crop production.

Table 3: Methods for valuing pollination services (adapted from Breeze et al 2016)
Category Method Explanation Strengths Weaknesses NCA Approach REF
Market
based
methods
Dependency ratios
Portion of the total market price of
crops times the dependency ratio (how
much production would be lost if there
would be no pollination)
Captures benefits across different
crops;
Applicable at all scales;
Minimal data requirements
Estimates only producer benefits;
might generalise across crops;
Does not account of of other inputs to
crop production;
Assumes pollination services at
maximum levels
1 & 2 Klein et al.
(2007)
Yield analysis Field studies that allow analysis of crop
production of pollinated versus non-
pollinated patches of land
Directly measures benefits of
pollination;
Captures specific variations across
crops;
Can capture marginal benefits
Only for local scales;
Require extensive planning and
resources;
Does not account for other inputs to
crop production;
Estimates only producer benefits
1 & 2
Ricketts et
al. (2004)
Garratt,
M.P. et al.
(2014)
Klatt et al
(2014)
Production function
Estimates a mathematical relationship
between the different inputs to crop
production. This allows separating the
role of any input in particular, such as
pollination.
Can be used for accounting;
Captures the benefits of
pollination relative to other
inputs;
Can be used for other locations;
Can accurately assess the value of
pollination services
Requires detailed data and biophysical
understanding;
Can be complex to estimate and
require sufficient datapoints
Estimates only producer benefits
1 & 2
N/A
discussed
in Hanley
et al (2015)
Replacement
costs
Managed
pollination
Using information on costs of managed
pollination to assess the value of wild
pollination. Replacement costs used in
national accounts;
Apply at all scales
Not linked to crop prices;
Replacements may not be effective;
Assumes producer's willingness and
ability to pay for replacement;
Not necessary linked to benefits from
pollination;
Linked to labour and input prices;
Not reflecting price changes and
impacts
1 & 2
Rucker et
al. (2012)
Technological
pollination
Using information on costs of
technological pollination (e.g. manual
or machine) to assess the value of wild
pollination.
Allsopp et
al
Stated
preferences
Contingent
valuation Surveys where individuals provide
answers about choices related to
environmental change or their
willingness to pay for any such
changes.
Can be used to value non-use
values;
Could be used to value any
hypothetical situations;
Not linked to market prices;
Estimates welfare values;
Resource intensive (time, expertise,
costs);
Require high quality sample of
respondents;
Complex to analyse;
2 & 3
Breeze et al.
(2015)
Narjes and
Lippert
(2016) Choice modelling
Modelling Partial equilibrium
models
models the impact of the welfare value
of changes to market(s) due to
Can assess both consumer and
producer surplus;
Extremely complex and resource
intensive (knowledge, resources); 1, 2 & 3
Gallai et al
(2009)

Page 38 of 57
General
equilibrium models
pollination service change Captures effects within and across
markets;
Can be applied at different scales
Requires detailed biophysical
understanding;
Assumes that pollination services are
at current levels
Bauer and
Wing (2016)

3.2.2 Valuing recreation services18
Tourism is a fundamental component of European countries economies and since 2000
EU has launched different initiatives to monitor tourism activities. Satellite accounts have
been set up by EU and individual countries to monitor tourism impact on the economy.
Despite this early interest in tourism activities the scientific community have only recently
started acknowledging the contribution of natural capital to tourism activities.
Given different land use types and ecosystem services, human beings can benefit from
multiple recreational opportunities. Normally, to benefit from these ESs households need to
acquire complementary market goods and services (ES#2). These can be represented by
recreational equipment, entrance fees and travel expenses. Natural tourism can be classified
either as SNA benefits (represented by already accounted for expenses), or as non-SNA
benefits including all intangible benefits provided to human beings.
Freeman et al (2013) suggest using nature-based expenditures (e.g. membership of
conservation organizations, magazines, etc.) to assign exchange prices consistent with SNA.
Although, this approach sounds attractive these expenses might not represent the most
appropriate valuation approach and are open to challenge. Remme et al. (2015) attempt an
estimate of recreational SNA benefits for Limburg province. They collected local area data
covering total revenues, labour costs, accommodation and catering sectors costs,
differentiating North, Centre and South of the province. Subsequently using a resource rent
approach the average tourist expenditures for the three zones was spatially distributed to
nature-based recreation areas. Remme et al’s approach is a data intense exercise and the final
output is satellite information on nature-based tourism.
An alternative approach to account for nature-based tourism is the travel cost method
which is based on the financial expenses generated by recreational activities (Atkinson and
Obst 2016). This method mainly captures fuel costs associated with visiting recreational sites
and it has been widely tested and developed in environmental economics. While the method
can potentially capture exchange and welfare values attention is needed in reporting the
appropriate accounting measure. When the aim is to integrate data into SNA accounts, only
exchange values are relevant, and all financial expenses generate by recreational sites travel
(equipment, fuel costs, etc.) are already accounted for in the SNA and the final effect on GDP
will be null. By contrast, if satellite information or wealth accounting are the objective of
valuation, either exchange or welfare values can be considered. In particular, welfare values
18 This report forms a basis of Technical Support Action to Joint Research Centre’s efforts to value crop pollination
and recreation services.

Page 40 of 57
can capture the value of time and wider welfare benefits generated by the natural
environment.
For accounting purposes the following data is anticipated as crucial:
Location of different land use types which can provide recreational
opportunities as open green spaces, forest, water course etc.
An understanding of the composition of recreational sites as a bundle of
different ESs with a broad categorization in high, medium and low provisional
sites.
Other data on population density, distance to recreational sites and socio-
economics characteristics of the population to be used to derive a trip
generation function which will signal the economic attraction of the area.

Table 4: Methods for valuing recreation services
Category Method Explanation Strengths Weaknesses NCA
Approach REF
Market
based
methods
Unit
Resource
Rent
Is estimated as the difference between the
benefit price (e.g. total tourist revenues
for the area) and the unit costs of labour,
produced assets and intermediate inputs
that allow recreation benefit to occur.
It is compatible with the
SEEA/SNA approach;
Relatively well established
approach
Influenced by the property rights
and market structures;
In some cases (esp. open access
cases) might lead to negative
residual rents;
1 & 2
Remme
et al
2015
Revealed
preferences
Hedonic
pricing
Measures the implicit price of an
ecosystem service related good as
revealed in the observed price of an
associated, market priced good. Common
application is estimation of
environmental quality (e.g. access to local
recreation opportunities) from property
market prices.
Compatible with the SEEA/SNA
approach;
Theoretically sounds method,
accepted by economists;
Already used in SNA for pricing
of computers.
Requires extensive resources in
terms of expertise/knowledge,
analysis, data and time; requires
large data sets;
It might be difficult to dissentangle
recreation opportunities from other
environmental goods and services;
Might depend on availability of
subsitutes and/or complements;
Is specific to the property market
analysed.
1 & 2 Day et al
2007
Travel cost
method
Through analysis of travel expenses in
terms of actual travel costs, time costs and
admittance fees it is possible to assess the
implicit price of access to the recreation
site and incur the value of recreational
benefits.
Relatively frequently applied
and accepted method;
Could provide exchange values
(if the cost of time is not taken
into account) and welfare values
(if it is);
Complex to determine the actual
contribution of an ecosystem to the
total willingness to pay;
Method is varied in the literature
with different techniques and
assumptions;
It is difficult to account for different
habitats and types of sites;
1, 2 & 3
Whiteley
et al
(2016)
Stated
preferences
Contingent
valuation Surveys where individuals provide
answers about choices related to
environmental change or their
willingness to pay for any such changes.
Can be used to value non-use
values;
Could be used to value any
hypothetical situations and
attributes of such change;
Estimates welfare values;
Resource intensive (time, expertise,
costs);
Require high quality sample of
respondents;
Complex to analyse;
2 & 3
Choice
experiments

3.3 Stock valuation – monetary asset accounts
Following SNA’s approach for situations where there are no markets for assets that
could be used for estimating their values, the SEEA uses an Net Present Value approach for
estimating ecosystem asset values (e.g. SEEA EEA 2017, 6.8.). Two valuation steps result
from this premise for the construction of monetary ecosystem asset accounts. First,
individual ecosystem services from an individual ecosystem asset are assessed and valued
based on principles outlined above in terms of their use and supply. Second, the expected
future income flow of a basket of ecosystem services from an ecosystem asset is discounted
to the present. This calculation aims to capture the stock of ecosystem assets at a point in
time – given seasonal variation for some ecosystem assets this would be done for average
ecosystem condition over a year, for other at a specific time of a year.
The NPV asset valuation method assumes detailed knowledge and/or bold
assumptions. The NPV is likely to depend on the condition of the ecosystem and its natural
regeneration, however it is calculated on the basis of current patterns of use (Hein et al 2016).
Further NPV calculations require an understanding of the likely pattern of supply of the
ecosystem assets and interactions between individual services. Key decisions need to be
taken regarding the use of discount rates and assumed asset life. Most environmental
economists agree that for environmental long lived assets a discount rate based on market
rates is not appropriate. Markets are essentially driven by short term considerations. So for
ecosystem assets a capacity and accounting lifetime of 100years seems reasonable, together
with a declining discount rate such as that adopted in the UK, based on the Ramsey formula
(e.g. ONS 2017). A particular challenge is forecasting expected ecosystem service flows,
especially in case of unsustainable use of ecosystem asset.
Further complication arises from using the values of ecosystem services derived for at a
point in time for extended periods. The valuation of ESs implicitly assume that ESs values
reflect
current magnitude of ES flows,
currently available substitutes,
current institutions (e.g. property rights regimes, access restrictions, etc.)
current technology (whale oil not so valuable in a world with electric lights, copper is
less valuable now that we have fibre optic cable, etc.)
current individual preferences (views on littering, killing whales, etc. change over
time)
However, all these factors are unlikely to stay constant over prolonged periods of time,
as assumed in the NPV asset valuation. Indeed, this assumption is implicit in many NPV
calculations for other purposes, such as CBA, however need to be acknowledged.

Page 43 of 57
Recent discussions (in particular Hein et al 2016 and SEEA EEA 2017) have highlighted
the importance of concepts such as capacity, capability and potential supply19 for
understanding (and accounting for) ecosystems as assets. Capacity might provide another
important way to provide monetary assessment of ecosystem assets, however this will likely
differ from the NPV approach and might present complementary information that improves
the understanding of ecosystems as assets. The natural capital unlike man-made capital can
regenerate itself and this growth capacity could be integrated in the economic assessment
exercises providing more reliable values, especially when the impact of “scarcity effect” on
resource price can be accounted for as in Fenichel and Abbott (2014). Ignoring this feature of
natural assets and focusing all the attention on annual flows can produce inconsistency in
natural capital accounting. However this ambitious target broadly discussed in Hein et al
(2016) suggests a stronger need to integrate biophysical and economic analysis.
Fenichel and Abbott (2014) and Fenichel et al (2016) have recently proposed a
framework for estimating prices of natural capital assets. The approach builds directly on
capital theory and sets out an asset pricing function that accounts for biophysical and
economic feedbacks and institutional setting of specific natural capital stock to estimate its
price (see an example and Box below for further details). These feedbacks reflect an
observation (similarly to Hein et al. 2016) that while valuing ecosystem service flows is an
important component of ecosystem asset valuation, it is not the only determinant of the asset
value. Ecosystem service flows need to be combined with biophysical, social and economic
data to derive long run value of natural capital assets that also reflect their sustainability.
This is in contrast to the NPV approach used in SEEA EEA that values ecosystem assets in
view of current use patterns, disregarding sustainability of this use. The Fenichel et al (2016)
approach, while requiring availability of detailed data, represents a promising theory-driven
avenue for estimating the price of natural capital assets that could be particularly useful to
wealth accounting, and the monitoring of stock sustainability.
19 “Capacity relates to sustainable use levels of multiple ecosystem services, capability involves prioritising the
use of one ecosystem service over a basket of services, and potential supply considers the ability of ecosystems to
generate services regardless of demand for these services.” Hein et al. (2016)

Page 44 of 57
Fenichel et al (2016) demonstrate their approach by valuing groundwater in Kansas
High Plains Aquifer over the years 1996-2005. They calculate a significant decrease (of
approx. $110 million per year in 2005 US dollars) in the value of the Aquifer over the ten year
period – an amount that is equal in size to Kansas 2005 budget surplus (approx. $110 million
per year in 2005 US dollars). This application shows that valuing natural capital assets in this
way might help understanding the relative scale of natural capital depletion. Pricing natural
capital assets in the way presented in this study is useful - the price indicates scarcity and
hence the sustainability of asset use. The application also highlights the joint effect of
technology and institutional arrangements on natural capital prices. Their price functions
reflect the impact of the subsidised technology that, while increasing effectivity of water
usage, led to an absolute increase in water withdrawal.
Box 2: Stock valuation approach in Fenichel et al. (2016) PNAS
The study present a framework for pricing natural capital assets, as summarised in the figure
below. The framework recognises that the policy and institutional context and state of natural
capital stocks influences human (consumption and/or investment) behaviour that, in turn, has an
impact on the flows of (ecosystem) services, as well as on the stock of (ecosystem) assets. Theses
conditioned behaviour rules are termed economic program and represent actual conditions rather
than assumed conditions in a theoretical markets.
Further the framework allows calculating unit costs of capital (Grey box). This is calculated as a
ratio of changes in flows of services together with estimated capital gains, over discount rate
adjusted by the changes in stock of capital. Using the unit price of capital can be then used for
wealth accounting purposes.

Page 45 of 57
4 Key messages
Natural capital accounting is the subject on ongoing debate with a range of candidate
accounting frameworks on offer. A degree of pragmatism seems a reasonable
strategy given the controversy.
It is important to clearly differentiate between the accounting approaches on offer
and highlight their primary policy objective(s), nevertheless they will also form a
complementary set of components in an overall sustainability knowledge base.
For simplicity, three approaches have been categorised to represent the spectrum of
natural capital accounting frameworks:
o Limited extension of national accounts more or less linked to the SNA to
measure economic activity (Approach 1);
o Compilation of satellite accounts (physical and monetary) to provide fuller
information on the environmental impacts of economic activity (Approach 2);
o Compilation of comprehensive welfare accounts to address strong
sustainability issues (Approach 3).
The generic approach adopted will to a certain extent condition the range of
appropriate value concepts and valuation methods and techniques.
For SNA related accounts, exchange values for final ecosystem services will be the
dominant concept.
For satellite accounts more flexibility can be appropriate, highlighting the role of
intermediate ecosystem services assessment, and more value concepts and methods,
depending on the specific purpose of the account(s).
A clearer distinction needs to be observed between natural capital asset valuation
(stocks) and ecosystem services valuation (flows). This clearer distinction would
particularly help in the assessment of the sustainability of the natural capital use.
Recent work on capital asset valuation (stock pricing) merits further attention.
Possible ways forward:
o Approach 1 – future progress could focus on extending the data base for
ecosystem services production function relationships. It may also be possible
to discern similar supply relationships and quasi exchange values through the
use of economic externality theory. The recent efforts to calculate natural
capital stock prices and then to monitor price changes over time, also holds
some promise, although the number of contexts in which the approach is
tractable may be limited.
o Approach 2 – our suggestion would be to keep it as a distinct set of satellite
accounts without the push for integration; so it is most flexible and fit-for-
policy-purpose; including resource supply security risk analysis and

Page 46 of 57
threshold effects warning. The set of accounts could then provide a mirror
environmental reflection over a given period of time of changes in GDP.
o Approach 3 – Wealth accounting is essentially the only approach to monitor
strong sustainability progress on an individualistic and monetised basis.
Given the formidable shadow pricing requirements across a wide range of
wellbeing components, critics have suggested alternatives based on
biophysical and socio-economic analysis for sustainability standards and
gaps. Others recommend cost-based environmental sustainability analysis.
These suggestions could form part of the set of data under Approach 2.
Good quality data lie at the heart of any approach to natural capital accounting and
will define it usefulness.
o In some cases existing data need to be made more freely available, in others
new data could be collected through existing national and European
initiatives, or new data focused efforts.
Experimentation should be encouraged with different approach and methods.
o Comparison of the different approaches to natural capital accounting on a
number case studies would be helpful.
o Similarly valuation assessments employing welfare and exchange values in
the same case studies would be useful.
o Ideally, case studies based on large ecosystems (e.g. The Alps, Białowieża
Forest, etc.) in several countries could serve this purpose; starting with
high profile/importance ecosystems and/or linked to pressing policy
problems.

Page 47 of 57
5 Bibliography
Allsopp, M. H., de Lange, W. J., Veldtman, R., Görgens, A., & Willems, T. (2008). Valuing Insect
Pollination Services with Cost of Replacement. PLoS ONE, 3(9), e3128.
http://doi.org/10.1371/journal.pone.0003128
Atkinson G. and C. Obst (2016) Transaction prices for ecosystem accounting. Draft prepared as
part of the work program of the World Bank WAVES project. December, 2016.
Badura T., Bateman I.J., Agarwala M., Binner A. (2016) Valuing preferences for ecosystem related
goods and services, in: Roy Haines-Young, Marion Potschin, Robert Fish and Kerry Turner
ed(s) Handbook on Ecosystem Services, Earthscan from Routledge. Available for download
here.
Barbier, E. B. (2007). Valuing ecosystem services as productive inputs. In Economic Policy (Vol. 22,
pp. 177–229).
Bateman, I.J., Mace, G.M., Fezzi, C., Atkinson, G., Turner, K. (2011a) ‘Economic Analysis for
Ecosystem Service Assessments’, Environmental and Resource Economics, 48(2), 177–218.
Bauer, D. M., & Sue Wing, I. (2016). The macroeconomic cost of catastrophic pollinator declines.
Ecological Economics, 126, 1–13. http://doi.org/10.1016/j.ecolecon.2016.01.011
Boyd, J., & Banzhaf, S. (2007) What are ecosystem services? The need for standardized
environmental accounting units. Ecological Economics, 63(2), 616–626.
http://doi.org/10.1016/j.ecolecon.2007.01.002
Breeze, T. D., Bailey, A. P., Potts, S. G., & Balcombe, K. G. (2015). A stated preference valuation of
the non-market benefits of pollination services in the UK. Ecological Economics, 111, 76–85.
http://doi.org/10.1016/j.ecolecon.2014.12.022
Breeze, T. D., Gallai, N., Garibaldi, L. A., & Li, X. S. (2016). Economic Measures of Pollination
Services: Shortcomings and Future Directions. Trends in Ecology & Evolution, 31(12), 927–939.
http://doi.org/10.1016/j.tree.2016.09.002
Caparrós A., Campos P., Montero G., (2003) An Operative Framework for Total Hicksian Income
Measurement: Application to a Multiple Use Forest. Environmental and Resources
Economics 26, 173–198.
Caparrós, A., Oviedo, J.L., Ovando, P., Álvarez, A. and Campos, C. (2015) “Simulated Exchange
Values and Ecosystem Accounting”, Institute for Public Goods and Policies (IPP), Consejo
Superior de Investigaciones Científicas (CSIC), Madrid.
Coyle, D. (2014) GDP : A Brief but Affectionate History. Priceton University Press.
Dasgupta, P. (2009) The welfare economic theory of green national accounts. Environmental and
Resource Economics, 42(1), 3–38. http://doi.org/10.1007/s10640-008-9223-y
Day, B., Bateman, I.J. and Lake, I. (2007) ‘Beyond implicit prices: recovering theoretically
consistent and transferable values for noise avoidance from a hedonic property price
model’, Environmental and Resource Economics, 37(1): 211-232.

Page 48 of 57
European Commission, International Monetary Fund, Organisation for Economic Co-operation
and Development, United Nations, World Bank (2009) System of National Accounts 2008.
United Nations, New York
Fenichel, E. P., & Abbott, J. K. (2014) Natural Capital: From Metaphor to Measurement. Journal of
the Association of Environmental and Resource Economists, 1(1/2), 1–27.
http://doi.org/10.1086/676034
Fenichel, E. P., Abbott, J. K., Bayham, J., Boone, W., Haacker, E. M. K., & Pfeiffer, L. (2016)
Measuring the value of groundwater and other forms of natural capital. Proceedings of the
National Academy of Sciences of the United States of America, 113(9), 2382–7.
http://doi.org/10.1073/pnas.1513779113
Fisher, B., & Turner, R. K. (2008) Ecosystem services: classification for valuation. Biological
Conservation, 1(2007), 8–10. Retrieved from
http://www.sciencedirect.com/science/article/pii/S0006320708000761
Fisher, B., Turner, R. K., & Morling, P. (2009) Defining and classifying ecosystem services for
decision making. Ecological Economics, 68(3), 643–653.
http://doi.org/10.1016/j.ecolecon.2008.09.014
Freeman III, M. A., Herriges, J. A., & Kling, C. L. (2014) The Measurement of Environmental and
Resource Values: Theory and Methods. RFF Press; 3 edition (June 5, 2014).
Gallai, N., Salles, J.-M., Settele, J., & Vaissière, B. E. (2009). Economic valuation of the vulnerability
of world agriculture confronted with pollinator decline. Ecological Economics, 68(3), 810–821.
http://doi.org/10.1016/j.ecolecon.2008.06.014
Garratt, M. P. D., Breeze, T. D., Jenner, N., Polce, C., Biesmeijer, J. C., & Potts, S. G. (2014).
Avoiding a bad apple: Insect pollination enhances fruit quality and economic value.
Agriculture, Ecosystems & Environment, 184, 34–40. http://doi.org/10.1016/j.agee.2013.10.032
Hanley, N., Breeze, T. D., Ellis, C., & Goulson, D. (2015). Measuring the economic value of
pollination services: Principles, evidence and knowledge gaps. Ecosystem Services, 14, 124–
132. http://doi.org/10.1016/j.ecoser.2014.09.013
Hein, L., Bagstad, K., Edens, B., Obst, C., de Jong, R., & Lesschen, J. P. (2016) Defining Ecosystem
Assets for Natural Capital Accounting. PLOS ONE, 11(11), e0164460.
http://doi.org/10.1371/journal.pone.0164460
IPBES (2016). The assessment report of the Intergovernmental Science-Policy Platform on
Biodiversity and Ecosystem Services on pollinators, pollination and food production. S.G.
Potts, V. L. Imperatriz-Fonseca, and H. T. Ngo, (eds). Secretariat of the Intergovernmental
Science-Policy Platform on Biodiversity and Ecosystem Services, Bonn, Germany. 552 pages.
Klatt, B. K., Holzschuh, A., Westphal, C., Clough, Y., Smit, I., Pawelzik, E., & Tscharntke, T.
(2014). Bee pollination improves crop quality, shelf life and commercial value. Proceedings.
Biological Sciences, 281(1775), 20132440. http://doi.org/10.1098/rspb.2013.2440
Klein, A.-M., Vaissière, B. E., Cane, J. H., Steffan-Dewenter, I., Cunningham, S. A., Kremen, C., &
Tscharntke, T. (2007). Importance of pollinators in changing landscapes for world crops.
Proceedings of the Royal Society of London B: Biological Sciences, 274(1608). Retrieved from
http://rspb.royalsocietypublishing.org/content/274/1608/303

Page 49 of 57
Landefeld, J. S., & McCulla, S. H. (2000) Accounting For Nonmarket Household Production
Within A National Accounts Framework. Review of Income and Wealth, 46(3), 289–307.
http://doi.org/10.1111/j.1475-4991.2000.tb00844.x
Melathopoulos, A. P., Cutler, G. C., & Tyedmers, P. (2015). Where is the value in valuing
pollination ecosystem services to agriculture? Ecological Economics, 109, 59–70.
http://doi.org/10.1016/j.ecolecon.2014.11.007
Millennium Ecosystem Assessment. (2005) Ecosystems and Human Well-Being: Synthesis. Island
Press, Washington, DC.
Obst, C., Hein, L., & Edens, B. (2015) National Accounting and the Valuation of Ecosystem Assets
and Their Services. Environmental and Resource Economics. http://doi.org/10.1007/s10640-
015-9921-1
ONS. (2017) Principles of Natural Capital Accounting.
Ricketts, T. H., Daily, G. C., Ehrlich, P. R., & Michener, C. D. (2004). Economic value of tropical
forest to coffee production. Proceedings of the National Academy of Sciences of the United States of
America, 101(34), 12579–82. http://doi.org/10.1073/pnas.0405147101
Roman P and Thiry G (2016) The inclusive wealth index. A critical approach, Ecological
Economics, 126:185-192
Rucker, R. R., Thurman, W. N., & Burgett, M. (2012). Honey Bee Pollination Markets and the
Internalization of Reciprocal Benefits. American Journal of Agricultural Economics, 94(4), 956–
977. http://doi.org/10.1093/ajae/aas031
Sartori Catalano, G., Genco, M., Pancotti, C., Sirtori, E., Vignetti, S., & Del Bo C., (2014) Guide to
Cost-Benefit Analysis of Investment Projects. Economic appraisal tool for Cohesion Policy
2014-2020”. European Commission, Directorate-General for Regional and Urban policy
REGIO DG 02 – Communication
Turner R.K. (2016) Economics and ecosystem services: a positive contribution to environmental
management. In Potschin et al (2016) Eds. Routledge Handbook of Ecosystem Services.
Routledge, London
Turner R.K. (2016) The Balance Sheet approach. In Potschin et al (2016) Eds Routledge Handbook
of Ecosystem Services, Routledge, London.
UK National Ecosystem Assessment (2014) The UK National Ecosystem Assessment: Follow-on.
UNEP-WCMC, LWEC, UK.
United Nations, European Commission, Food and Agricultural Organization of the United
Nations, International Monetary Fund, Organisation for Economic Co-operation and
Development, The World Bank (2014a) System of Environmental-Economic Accounting 2012
– Central Framework. United Nations, New York
United Nations, European Commission, Food and Agricultural Organization of the United
Nations, Organisation for Economic Co-operation and Development, The World Bank
(2014b) System of Environmental-Economic Accounting 2012 – Experimental Ecosystem
Accounting. United Nations, New York
UNU-IHDP and UNEP (2014) Inclusive Wealth Report 2014. Measuring progress toward
sustainability. Cambridge: Cambridge University Press.

Page 50 of 57
Vincent J. R. (2015) valuing Environmental Services in the SNA. Report prepared for the Policy
and Technical Experts Committee (PTEC) of the World Bank’s Wealth Accounting and
Valuation of Ecosystem Services (WAVES) programme.
Whiteley G., Shabb K., Korkeala O., Mccullough A., Smithers R. (2016) Reviewing cultural
services valuation methodology for inclusion in aggregate UK natural capital estimates.
Report for Office National Statistics. Ricardo Energy & Environment.
World Bank (2006) ‘Where is the Wealth of Nations?’ Washington, DC: World Bank
World Bank (2011) ‘The Changing Wealth of Nations’, Washington, DC: World Bank

Page 51 of 57
6 Annex
FULL TABLE of VALUATION METHODS FOR ESs as PROVIDED TO JRC
JRC-ESs
(classification) Notes ES References for valuation
approaches based on exchange prices
Terrestrial
Arable cropping
(Intermediate)
Managed arable crops
require intense
modification and human
activities to realize
famers’ economic gain
that cannot be defined as
true ESs (we
acknowledge that ESs
provide free (input
factor) gain to farmers).
It sis essential that main
arable crops will be
consider for this ES (e.g.
cereals, energy crops,
sugar beets, vegetables,
fruits…)
Unmanaged arable crops
are more natural but
harvesting is still needed
to produce benefits, this
ESs are ignored in this
report.
Fezzi, C, & Bateman, I. J. (2011). Structural
agricultural land use modeling for spatial
agro-15 environmental policy analysis.
American Journal of Agricultural Economics, 93,
1168-1188
UK-NEA (2011), UK-NEAFO (2014).
These works employed a spatially explicit
production function approach (consists of
tracing, through chains of causality, the
impact of changes in final crops production
due to the services of agricultural land)
which disentangles the effects of
agricultural land for crops profits.
Remme et al (2015). Monetary accounting
of ecosystem services: A test case for
Limburg province, the Netherlands.
Ecological Economics 112 (2015) 116–128.
This work values with resource rent the
arable crops. From the total revenue of the
crops intermediate labour and fixed costs
are deducted to derive ESs price.
Sandhu et al 2013. Experimental
Assessment of Ecosystem Services in
Agriculture. In Ecosystem Services in
Agricultural and Urban Landscapes. Wiley and
Sons. This paper suggests combining field
experiment and avoided costs approach to
assess arable crops ESs. Two case studies
(Denmark-Porter 2009 and New Zealand-

Page 52 of 57
Sandhu 2008 and 2010) present the key
components of methods but ESs estimates
do not disentangle for individual farmland
ESs.
FAO 2015, Natural Capital Impacts in
Agriculture. Supporting better business
decision making. This report applies
benefit transfer of avoided costs
estimates to assess the benefits of
sustainable farming practices. Individual
valuation of arable cropping is not available.
Nahuelhuel et al 2007. Valuing Ecosystem
Services Of Chilean Temperate Rainforests.
Environment, Development and Sustainability
(2007) 9:481–499. The authors apply the
Replacement costs to assess the natural
soil fertility produced by tree assessing the
market costs of fertilizer able to produce an
equivalent soil production.
Outdoor animal
husbandry
(Intermediate)
The ecological
contribution to the
husbandry systems (free-
range, organic or outdoor
reared) of domesticated
animals that can be used
for the production of
food. The outdoor
rearing of animal
provides higher
organoleptic properties
of food and better quality
of life to animals.
Stevenson (2011). REVIEWING THE
COSTS: The economics of moving to higher welfare
farming. Compassion farming. the production
costs of indoor and outdoor rearing are
compared for different European case
studies.
Timber
(Final)
The ecological
contribution to the
growth of tree for timber
production.
Nahuelhuel et al 2007. Valuing Ecosystem
Services of Chilean Temperate Rainforests.
Environment, Development and Sustainability
(2007) 9:481–499 suggest Adjusted Market
price (average exchange rate for standing
timber for different uses) for valuing timber
production.
UK ONS (2017) “Principles of Natural Capital

Page 53 of 57
Accounting” The stumpages price is
considered as good value of the unit
resource rent.
Crop pollination
(Intermediate)
Movement of floral
gametes for reproduction
of plants thanks to wild
bees and pollinators.
Winfree, et al. 2011. Valuing pollination
services to agriculture. Ecological Economics,
71: 80–88 suggest using replacement
costs.
Ricketts and Lonsdorf (2013) Landscape
effects on crop pollination services: Are
there general patterns? Ecol. Lett. 11, 499–
515 and Jonsson et al. (2014) Ecological
production functions for biological control
services in agricultural landscapes; Methods
in Ecology and Evolution 5, 243-252. Both
authors suggest production function
approaches.
Garrad et al 2014. Avoiding a bad apple:
Insect pollination enhances fruit quality and
economic value Agriculture, Ecosystems and
Environment 184 (2014) 34–40 report an
example of Adjusted Market price to
assess pollinator services.
Erosion control
(Final)
Retention of soil within
an ecosystem
Yoshida (2014). The economic value of
ecosystem services from agricultural and
rural landscapes in Japan. In Ninan, “valuing
ecosystem services”. The author reports details
of replacement costs sustained to protect
land from soil erosion.
Telles et al (2013) Valuation and assessment
of soil erosion costs. Sci. Agric. v.70, n.3,
p.209-216. Suggests a set of methods to
assess soil erosion such as production
function, replacement costs and avoided
costs.
Barry et al (2011) Valuing Avoided Soil
Erosion by Considering Private and Public
Net Benefits, Presented Tahuna Conference
Centre – Nelson, New Zealand. August 25-26,
2011 focus on private and public avoided

Page 54 of 57
costs by soil erosion.
Outdoor recreation
(Final)
The natural amenities
which provide recreation
opportunities for human
beings.
Remme et al (2015). Monetary accounting
of ecosystem services: A test case for
Limburg province, the Netherlands.
Ecological Economics 112 (2015) 116–128.
This work values with resource rent the
values of nature-based tourism. From the
total revenue of the tourism in different
area of the province intermediate labour
and fixed costs are deducted to derive ESs
price.
Nahuelhuel et al 2007. Valuing Ecosystem
Services Of Chilean Temperate Rainforests.
Environment, Development and Sustainability
(2007) 9:481–499 suggest the travel cost
method to assess the value of Chilean
natural forests which include waterfalls,
scenery, wildlife etc.
Marine
Marine fish
(Final)
Wild fish species that can
be harvested and used as
food. Harvesting is still
needed to produce
benefits out of this ESs.
Anna (2017). Indonesian shrimp resource
accounting for sustainable stock
Management, Biodiversitas 18 (1): 248-256.
The author applies resource rent to assess
the monetary value of fish stock.
Similarly, Obst, 2010. Issue #12: Valuation
of Assets: A case study on the valuation of
fish stocks, Prepared for the London Group of
Experts on Environmental Accounting proposes
and describes in details how to apply
resource rent for fish stock assessment.
Freshwater
Water purification
(Final/Intermediate)
Removal or breakdown
of excess nutrients of
compounds in water
Mueller et al. 2016. Evaluating services and
damage costs of degradation of a major lake
ecosystem, Ecosystem Services 22: 370–380.
Authors describe how avoided costs
methodology can be employed to assess

Page 55 of 57
lake water purification.
Goldman-Benner et al. (2012). Water funds
and payments for ecosystem services:
practice learns from theory and theory can
learn from practice Fauna & Flora
International, Oryx, 46(1), 55–63. The authors
review the PES for different water services.
Water provisioning
(Intermediate)
The provision of water
flow for human uses can
produce several benefits
(e.g. bottle water)
Kumar 2005, Market for Ecosystem
Services, International Institute for Sustainable
Development (IISD). In this work a revision
of payment for ecosystem services and
fiscal instruments (subsides or marketable
permits) used for valuing water
provisioning services across the globe.
Remme et al (2015). Monetary accounting
of ecosystem services: A test case for
Limburg province, the Netherlands.
Ecological Economics 112 (2015) 116–128.
This work values with replacement cost
the groundwater provision. The least-cost
substitute that can reasonably be expected
to replace groundwater is surface water and
the difference average production costs is
used as ES value.
Flood control
(Intermediate)
The natural control of
water flow in rainy
season.
Ricardo Energy & Environment (2016)
Valuing flood-regulation services for
inclusion in the UK ecosystem accounts.
The study employs replacement costs to
assess the natural flood retention.
Brookhuis &. Hein (2016) The value of the
flood control service of tropical forests: A
case study for Trinidad. Forest Policy and
Economics 62:118–124. The avoided costs
approached is described in this article.
Others
Air purification
(Intermediate)
Removal or breakdown
of excess nutrients of
compounds in the air
Remme et al (2015). Monetary accounting
of ecosystem services: A test case for
Limburg province, the Netherlands.

Page 56 of 57
Ecological Economics 112 (2015) 116–128.
This work values with avoided health cost
the air regulation service.
Baro et al. 2014. Contributing of Ecosystem
Services to Air quality and Climate change
mitigation policies: the case of urban forests
in Barcelona, Spain. AMBIO 2014, 43: 466-
479. A benefit transfer approach is applied
to value air purification services.
Yoshida (2014) The economic value of
ecosystem services from agricultural and
rural landscapes in Japan. In Ninan, “valuing
ecosystem services”. The author suggests
replacement costs to assess natural air
purification services.
Global climate
regulation
(Final)
Maintenance of stable
and sustainable air gases
combination
Yoshida (2014) The economic value of
ecosystem services from agricultural and
rural landscapes in Japan. In Ninan, “valuing
ecosystem services”. The author suggests
replacement costs to assess natural
climate mitigation strategies.
Li et al. 2014 Prioritizing protection
measures through ecosystem services
valuation for the Napahai Wetland, Shangri-
La County, Yunnan Province, China.
International Journal of Sustainable Development
& World Ecology 22:2, 142-150. The authors
suggest adjusted market price and
replacement costs to value climate
regulating services.