VALUATION & ADVISORY SERVICES Brake & Throttle… 2 Feb... · 2013-03-29 · CMBS Market:...
32
K.C. Conway, MAI, CRE Exec. Managing Dir. R.E. Analytics Colliers International [email protected] Brake & Throttle… Where is the Friction/Resistance & Where is the Acceleration? ICSC West FL Idea Exchange – Feb 17, 2012 VALUAT ION & ADVISORY SERVICES
-
Upload
trinhkhuong -
Category
Documents
-
view
213 -
download
0
Transcript of VALUATION & ADVISORY SERVICES Brake & Throttle… 2 Feb... · 2013-03-29 · CMBS Market:...
K.C. Conway, MAI, CRE
Exec. Managing Dir. R.E. Analytics
Colliers International
Brake & Throttle…
Where is the Friction/Resistance
&
Where is the Acceleration?
ICSC West FL Idea Exchange – Feb 17, 2012
VALUATION & ADVISORY SERVICES

Disclaimer: Upfront and Not in fine print…
The ICSC make no representations or warranties about the accuracy or
suitability of any information in this presentation. The ICSC does not
guarantee, warrant, or endorse the advice or services of Colliers
International Valuation and Advisory Services (CIVAS). This
presentation consists of materials prepared exclusively by K.C. Conway,
MAI, CRE, and is provided during this 2012 Idea Exchange conference
solely for informational purposes of attendees and members of the
ICSC. This presentation is not intended to constitute legal,
investment or financial advice or the rendering of legal, consulting, or
other professional services of any kind.
2
3
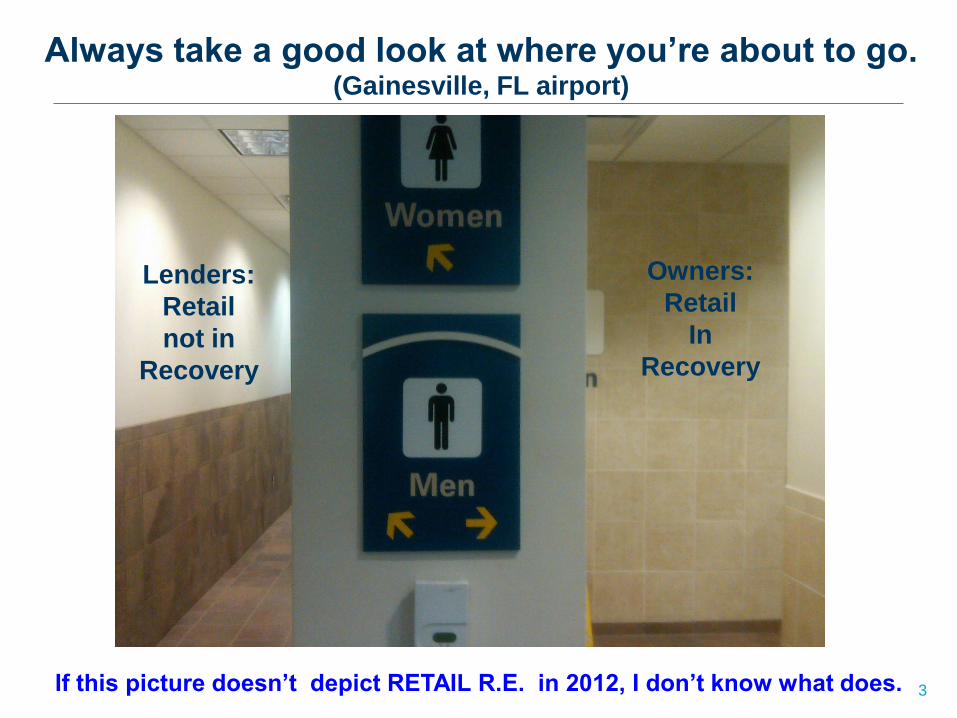
Always take a good look at where you’re about to go. (Gainesville, FL airport)
If this picture doesn’t depict RETAIL R.E. in 2012, I don’t know what does.
Lenders:
Retail
not in
Recovery
Owners:
Retail
In
Recovery
4
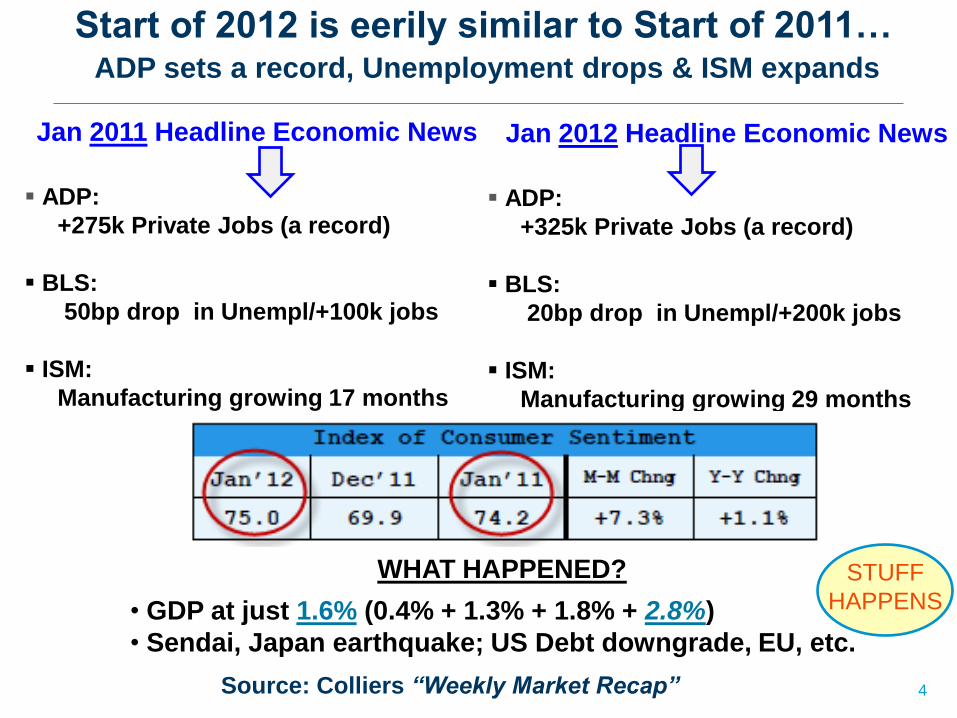
Start of 2012 is eerily similar to Start of 2011… ADP sets a record, Unemployment drops & ISM expands
Source: Colliers “Weekly Market Recap”
Jan 2011 Headline Economic News Jan 2012 Headline Economic News
ADP:
+275k Private Jobs (a record)
BLS:
50bp drop in Unempl/+100k jobs
ISM:
Manufacturing growing 17 months
ADP:
+325k Private Jobs (a record)
BLS:
20bp drop in Unempl/+200k jobs
ISM:
Manufacturing growing 29 months
WHAT HAPPENED?
• GDP at just 1.6% (0.4% + 1.3% + 1.8% + 2.8%)
• Sendai, Japan earthquake; US Debt downgrade, EU, etc.
STUFF
HAPPENS
5
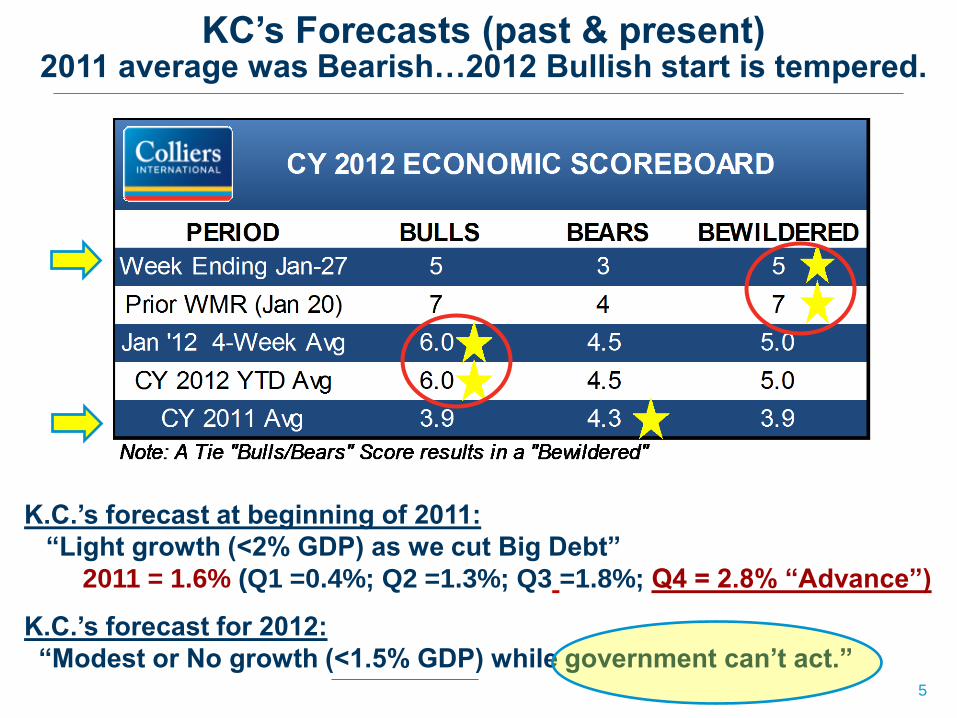
KC’s Forecasts (past & present) 2011 average was Bearish…2012 Bullish start is tempered.
K.C.’s forecast at beginning of 2011:
“Light growth (<2% GDP) as we cut Big Debt”
2011 = 1.6% (Q1 =0.4%; Q2 =1.3%; Q3 =1.8%; Q4 = 2.8% “Advance”)
K.C.’s forecast for 2012:
“Modest or No growth (<1.5% GDP) while government can’t act.”

6
Government that Can’t Act… …is no longer an option, and it’s toxic to CRE…
“Control your
generosity
when dealin’ with
a chronic borrower”
…The antidote to Dodd-Frank…
A Cowboy’s Guide to Life By: Texas Bix Bender
7
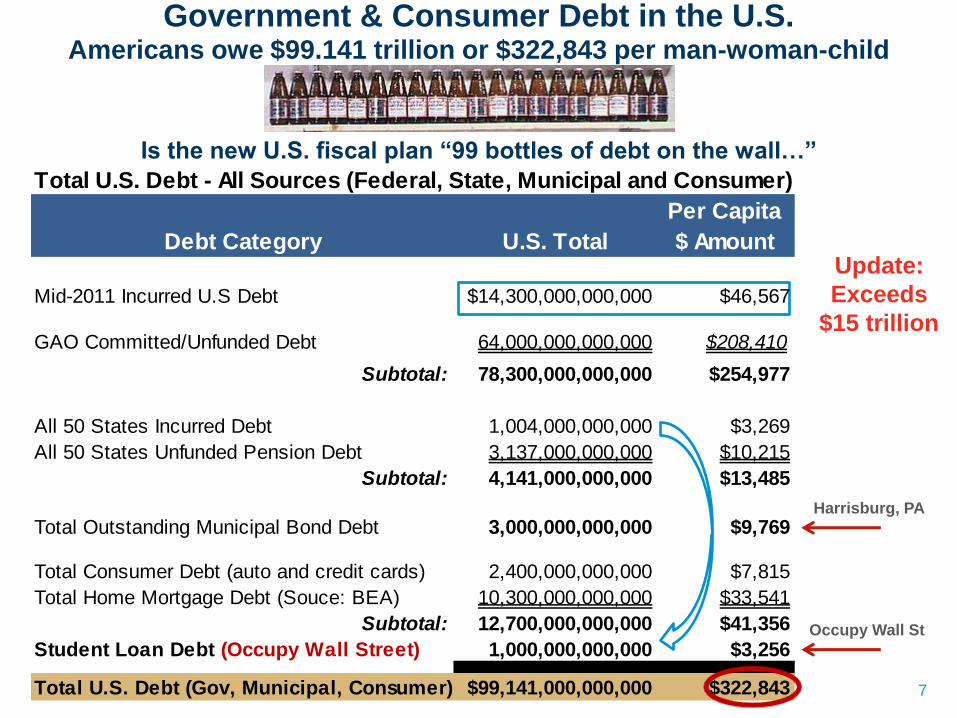
Government & Consumer Debt in the U.S. Americans owe $99.141 trillion or $322,843 per man-woman-child
Is the new U.S. fiscal plan “99 bottles of debt on the wall…”
Total U.S. Debt - All Sources (Federal, State, Municipal and Consumer)
Debt Category U.S. Total
Per Capita
$ Amount
Mid-2011 Incurred U.S Debt $14,300,000,000,000 $46,567
GAO Committed/Unfunded Debt 64,000,000,000,000 $208,410
Subtotal: 78,300,000,000,000 $254,977
All 50 States Incurred Debt 1,004,000,000,000 $3,269
All 50 States Unfunded Pension Debt 3,137,000,000,000 $10,215
Subtotal: 4,141,000,000,000 $13,485
Total Outstanding Municipal Bond Debt 3,000,000,000,000 $9,769
Total Consumer Debt (auto and credit cards) 2,400,000,000,000 $7,815
Total Home Mortgage Debt (Souce: BEA) 10,300,000,000,000 $33,541
Subtotal: 12,700,000,000,000 $41,356
Student Loan Debt (Occupy Wall Street) 1,000,000,000,000 $3,256
Total U.S. Debt (Gov, Municipal, Consumer) $99,141,000,000,000 $322,843
Harrisburg, PA
Occupy Wall St
Update:
Exceeds
$15 trillion
8
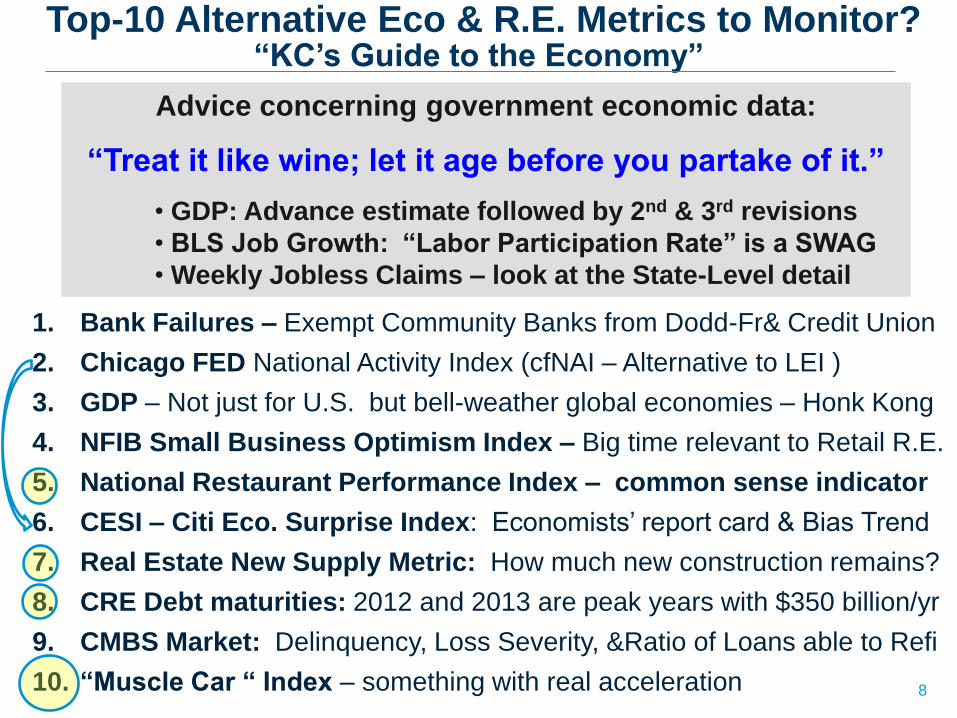
Top-10 Alternative Eco & R.E. Metrics to Monitor? “KC’s Guide to the Economy”
1. Bank Failures – Exempt Community Banks from Dodd-Fr& Credit Union
2. Chicago FED National Activity Index (cfNAI – Alternative to LEI )
3. GDP – Not just for U.S. but bell-weather global economies – Honk Kong
4. NFIB Small Business Optimism Index – Big time relevant to Retail R.E.
5. National Restaurant Performance Index – common sense indicator
6. CESI – Citi Eco. Surprise Index: Economists’ report card & Bias Trend
7. Real Estate New Supply Metric: How much new construction remains?
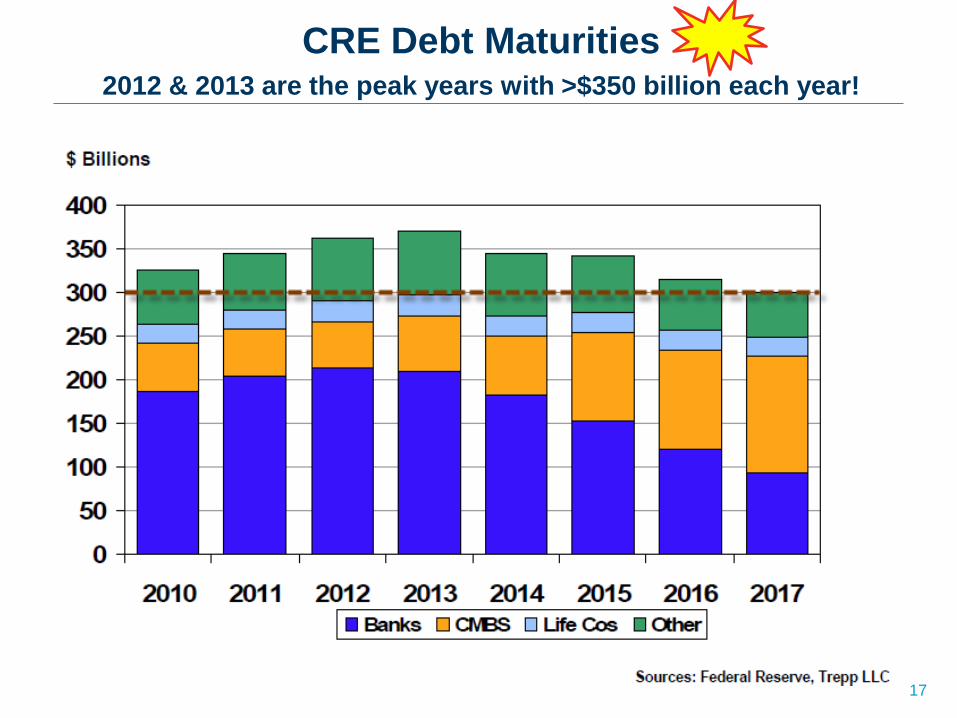
8. CRE Debt maturities: 2012 and 2013 are peak years with $350 billion/yr
9. CMBS Market: Delinquency, Loss Severity, &Ratio of Loans able to Refi
10. “Muscle Car “ Index – something with real acceleration
Advice concerning government economic data:
“Treat it like wine; let it age before you partake of it.”
• GDP: Advance estimate followed by 2nd & 3rd revisions
• BLS Job Growth: “Labor Participation Rate” is a SWAG
• Weekly Jobless Claims – look at the State-Level detail

9
Bank Failures What should we have learned?
First: “Good judgment comes from
experience, and …
a lot of that comes from bad judgment”
CRE over-leverage lesson
Second: “Never try to run a bluff when your
pockets are empty.”
Under Capitalized Lesson

10
Bank Failures – Are we done? Historical Perspective
CY 2011’ 92 compare well to 2009 & 2012, but…
Source: FDIC
But…Bank Failures in Jan 2012 equal those in Jan 2011 (7)
* 2012: Who is #1 in Bank Failures? Phew – not GA.
* 380 banks haven’t repaid TARP & Treasury hired a collection agency
11
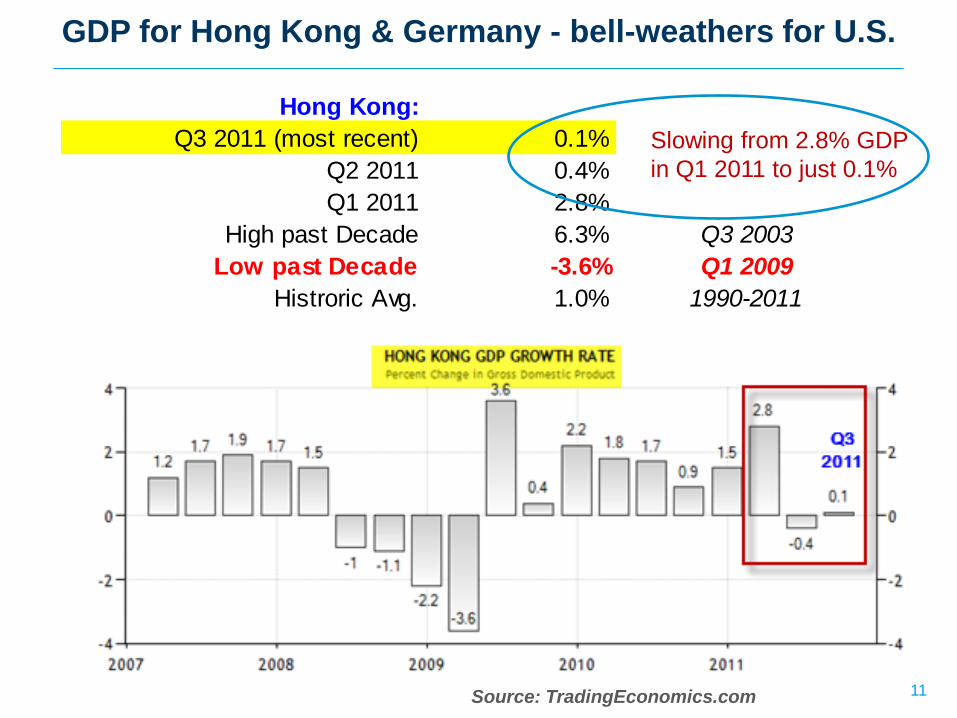
GDP for Hong Kong & Germany - bell-weathers for U.S.
Hong Kong:
Q3 2011 (most recent) 0.1%
Q2 2011 0.4%
Q1 2011 2.8%
High past Decade 6.3% Q3 2003
Low past Decade -3.6% Q1 2009
Histroric Avg. 1.0% 1990-2011
Slowing from 2.8% GDP
in Q1 2011 to just 0.1%
Source: TradingEconomics.com

12
National Restaurant Performance Index A good macro indicator for retail, hospitality and restaurant R.E.
National Restaurant Performance Index:
Next Release Jan 27 2012
Current Release 100.6 Nov-11
Prior Period 100.0 Oct-11
Sep-11 100.1 Sep-11
Aug-11 99.4 Aug-11
Trend: Volatile Aug was 13-mo low
Sept was >100 (1st in 3 mos)
Key Note: A reading >100 indicates growth
Back in
“growth”
territory!
Bullish for
Retail R.E.
13
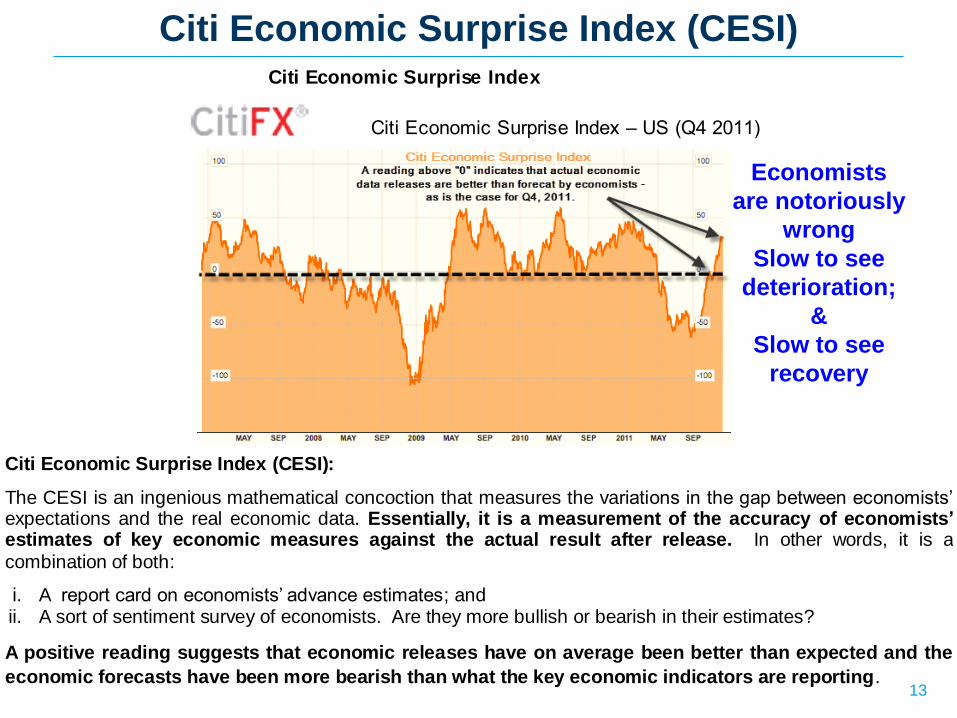
Citi Economic Surprise Index (CESI)
Citi Economic Surprise Index
Citi Economic Surprise Index – US (Q4 2011)
Citi Economic Surprise Index (CESI):
The CESI is an ingenious mathematical concoction that measures the variations in the gap between economists’ expectations and the real economic data. Essentially, it is a measurement of the accuracy of economists’ estimates of key economic measures against the actual result after release. In other words, it is a
combination of both:
i. A report card on economists’ advance estimates; and ii. A sort of sentiment survey of economists. Are they more bullish or bearish in their estimates?
A positive reading suggests that economic releases have on average been better than expected and the
economic forecasts have been more bearish than what the key economic indicators are reporting.
Economists
are notoriously
wrong
Slow to see
deterioration;
&
Slow to see
recovery

14
CRE Supply Metric “If you’re riding ahead of the
herd,
take a look back every now and then
to make sure it’s still there.”
By: Texas Bix Bender: A Cowboy’s Guide to Life.
15
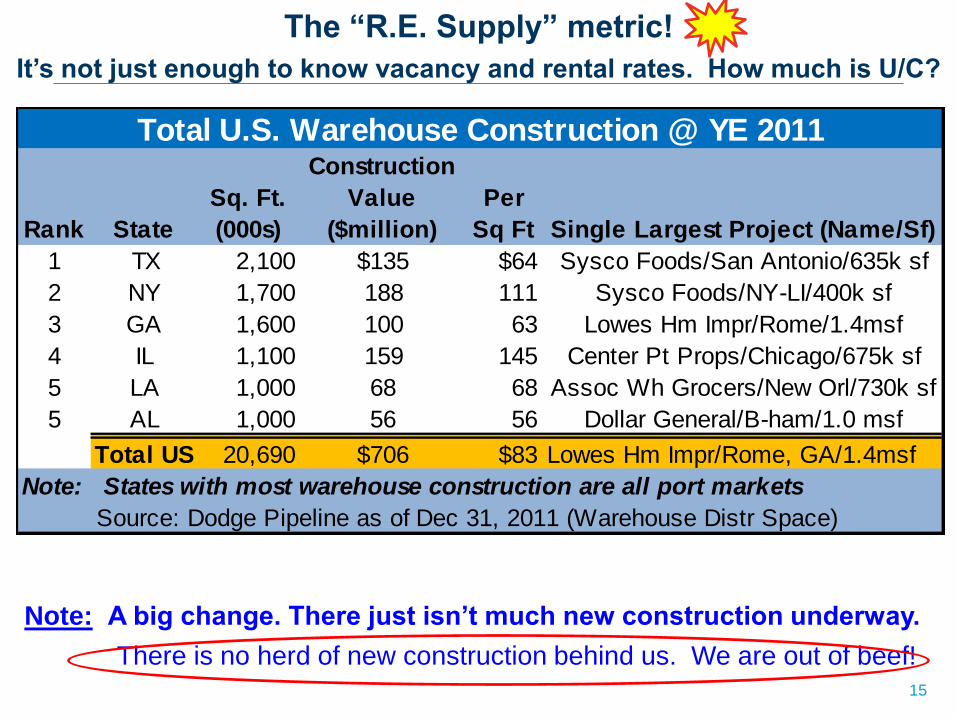
The “R.E. Supply” metric!
It’s not just enough to know vacancy and rental rates. How much is U/C?
Total U.S. Warehouse Construction @ YE 2011
Rank State
Sq. Ft.
(000s)
Construction
Value
($million)
Per
Sq Ft Single Largest Project (Name/Sf)
1 TX 2,100 $135 $64 Sysco Foods/San Antonio/635k sf
2 NY 1,700 188 111 Sysco Foods/NY-LI/400k sf
3 GA 1,600 100 63 Lowes Hm Impr/Rome/1.4msf
4 IL 1,100 159 145 Center Pt Props/Chicago/675k sf
5 LA 1,000 68 68 Assoc Wh Grocers/New Orl/730k sf
5 AL 1,000 56 56 Dollar General/B-ham/1.0 msf
Total US 20,690 $706 $83 Lowes Hm Impr/Rome, GA/1.4msf
Note: States with most warehouse construction are all port markets
Source: Dodge Pipeline as of Dec 31, 2011 (Warehouse Distr Space)
Note: A big change. There just isn’t much new construction underway.
There is no herd of new construction behind us. We are out of beef!

16
CRE Debt Maturities
“You can just about always
stand more than you think you can.”
or
So you thought you could…
17
CRE Debt Maturities 2012 & 2013 are the peak years with >$350 billion each year!
18
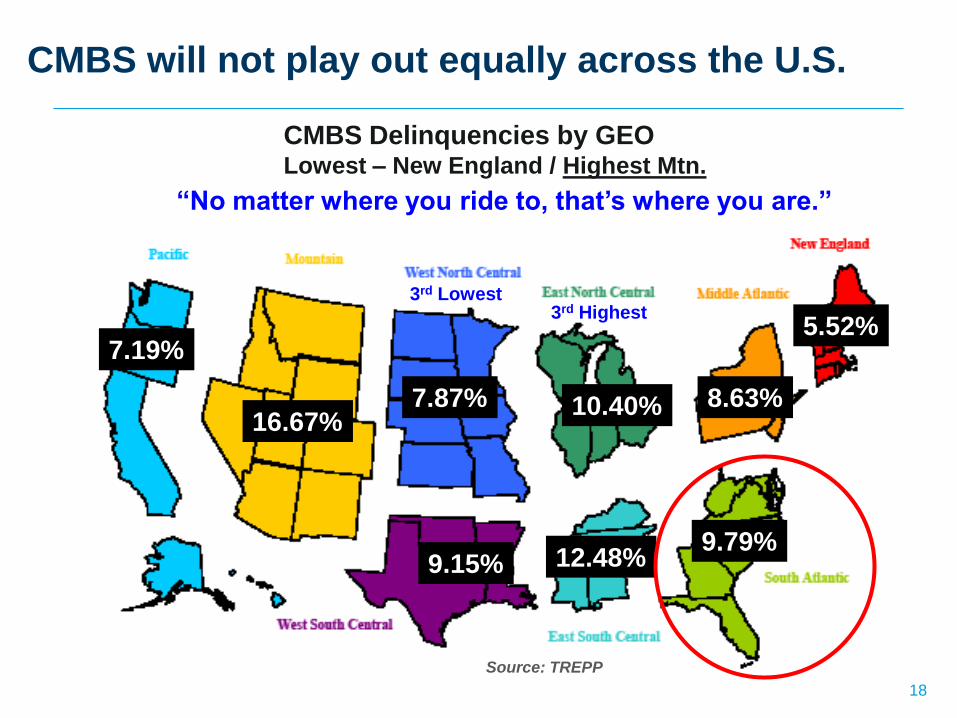
CMBS will not play out equally across the U.S.
CMBS Delinquencies by GEO Lowest – New England / Highest Mtn.
10.40%
12.48%
8.63% 16.67%
5.52%
7.87%
7.19%
9.15% 9.79%
3rd Lowest
Source: TREPP
3rd Highest
“No matter where you ride to, that’s where you are.”
19
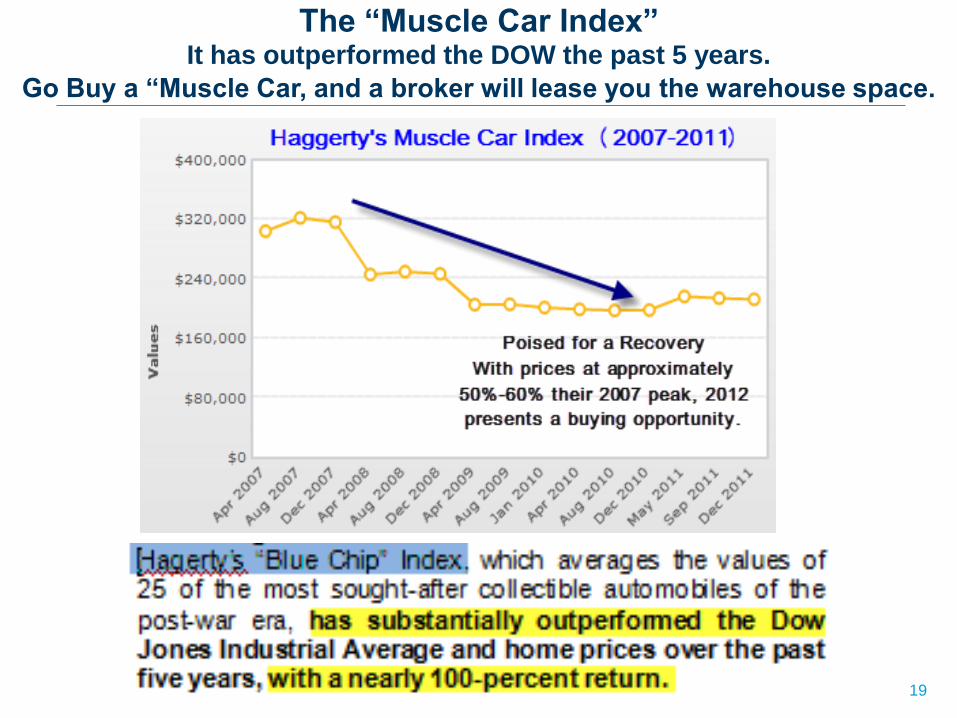
The “Muscle Car Index” It has outperformed the DOW the past 5 years.
Go Buy a “Muscle Car, and a broker will lease you the warehouse space.
20
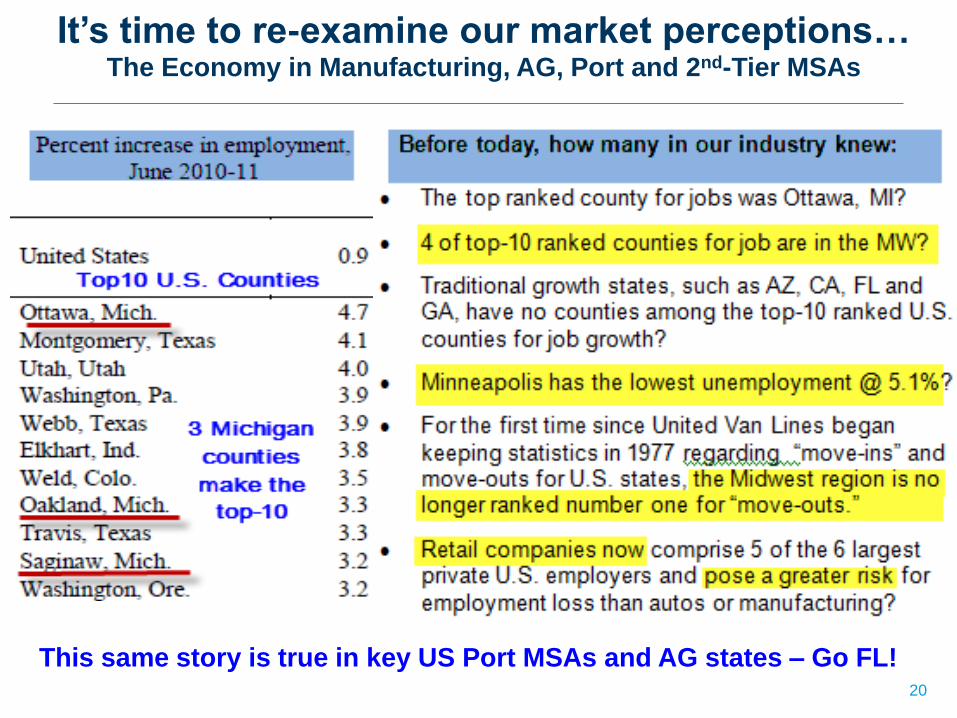
It’s time to re-examine our market perceptions… The Economy in Manufacturing, AG, Port and 2nd-Tier MSAs
This same story is true in key US Port MSAs and AG states – Go FL!

21
NC becoming a key Energy state

22
r
U.S. Port Markets A “Bullish” story not understood… Where FL is strong! Where FL can remake its image - #1 in Trade Vs Retirees

23
r
FL has more
Ports than
any other
state ; and
3 of top 15
are in Florida

24
Real Estate Compass settings for 2012 2012 is the year for Warehouse…not so much for Retail
North: Warehouse
Smooth Sailing
East: US & EU Debt
Danger Zone
Banks?
South: Retail & Housing
Let’s just have a drink – a
long road to recovery and
very BIFURCATED
West: Office & Multifamily
Measured re-balancing of
supply & demand…
Market-by-Market analysis

25
Warehouse CRE Why “Smooth Sailing” for 2012?
Absence of New Construction
Less Distressed than other CRE property types
US Trade to Emerging Markets
Port Readiness : Post-Panamax containerships
Absence of Cap Rate
Compression
26
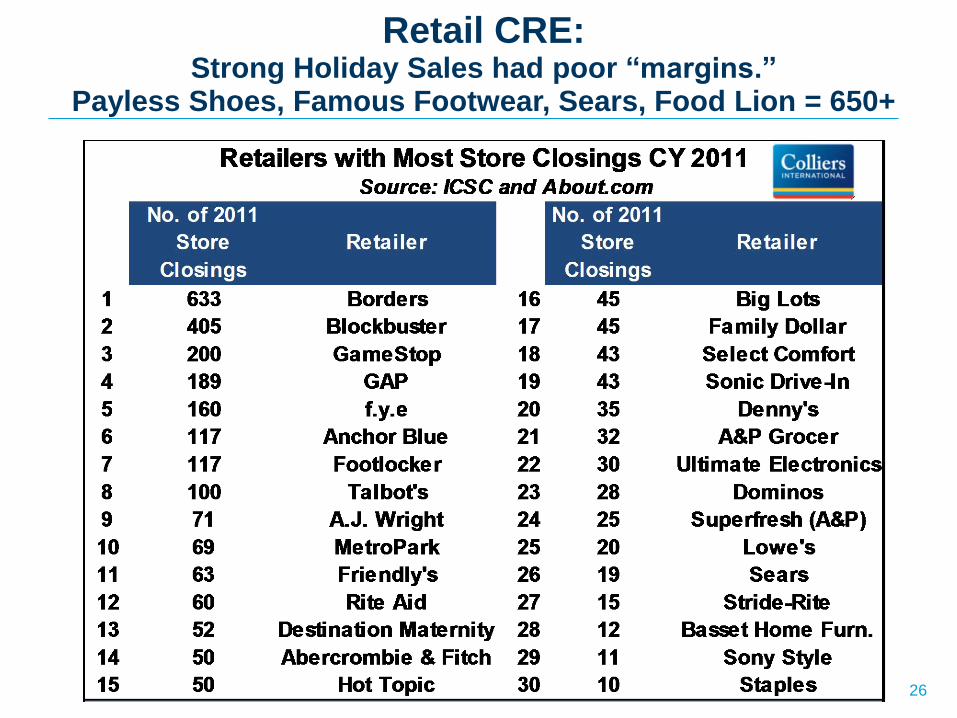
Retail CRE: Strong Holiday Sales had poor “margins.”
Payless Shoes, Famous Footwear, Sears, Food Lion = 650+

27
Believe it or not, there is a lot of retail expansion underway! Note the growth in Auto Parts & Food…not so much in apparel & electronic

28
What does the future of urban/infill retail look like? (Services vs Goods: It could be colorful - Ladies with Pink Hair Eating out)
E-tailing will result in more vacant retail space being utilized for SERVICES
Hair Salon, Pet Grooming, Karate & Gymnastics schools, live theatre, medical, etc.
Bachelorette
party in
downtown
Charleston
29
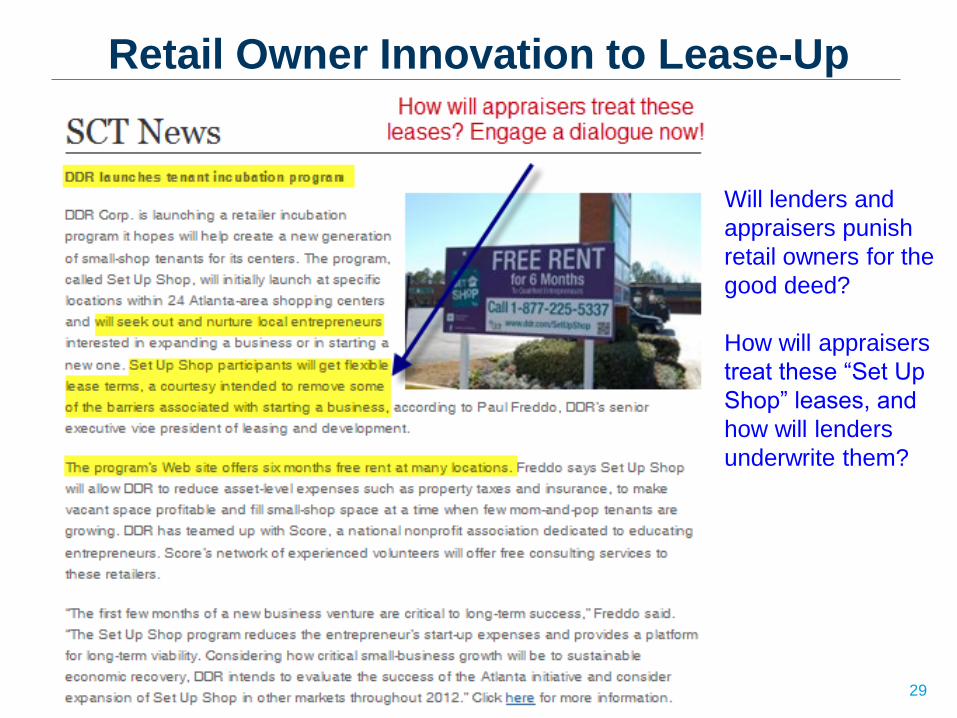
Retail Owner Innovation to Lease-Up
Will lenders and
appraisers punish
retail owners for the
good deed?
How will appraisers
treat these “Set Up
Shop” leases, and
how will lenders
underwrite them?

30
“Faulty Appraisals” Getting Value right in Retail R.E. is paramount to recovery!
31
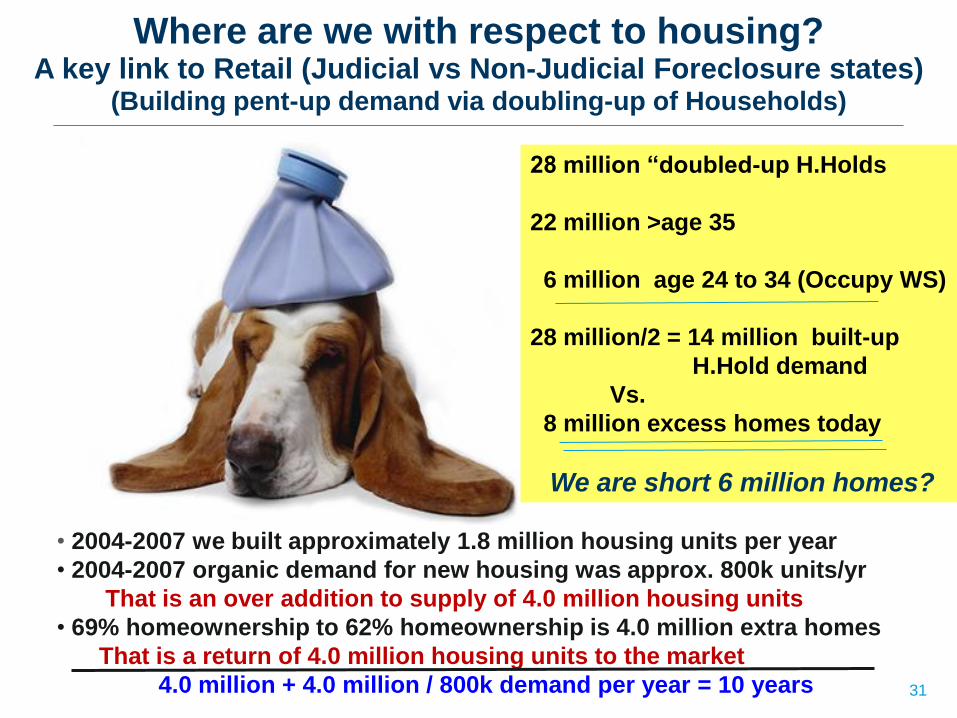
Where are we with respect to housing? A key link to Retail (Judicial vs Non-Judicial Foreclosure states)
(Building pent-up demand via doubling-up of Households)
• 2004-2007 we built approximately 1.8 million housing units per year
• 2004-2007 organic demand for new housing was approx. 800k units/yr
That is an over addition to supply of 4.0 million housing units
• 69% homeownership to 62% homeownership is 4.0 million extra homes
That is a return of 4.0 million housing units to the market
4.0 million + 4.0 million / 800k demand per year = 10 years
28 million “doubled-up H.Holds
22 million >age 35
6 million age 24 to 34 (Occupy WS)
28 million/2 = 14 million built-up
H.Hold demand
Vs.
8 million excess homes today
We are short 6 million homes?

Thank You K.C. Conway, MAI, CRE
Exec. Managing Director, R.E. Analytics
Colliers International
“Un-Dam” it
Capital “Un-Dam” it
Regulation Section 165: Dodd-Frank
“Un-Dam” it
Unemployment
What is the Solution?