Valuation - NYUadamodar/pdfiles/cf2E/val.pdfAswath Damodaran 4 Equity Valuation n The value of...
102
Aswath Damodaran 1 Valuation Aswath Damodaran
Transcript of Valuation - NYUadamodar/pdfiles/cf2E/val.pdfAswath Damodaran 4 Equity Valuation n The value of...

Aswath Damodaran 1
Valuation
Aswath Damodaran
Aswath Damodaran 2
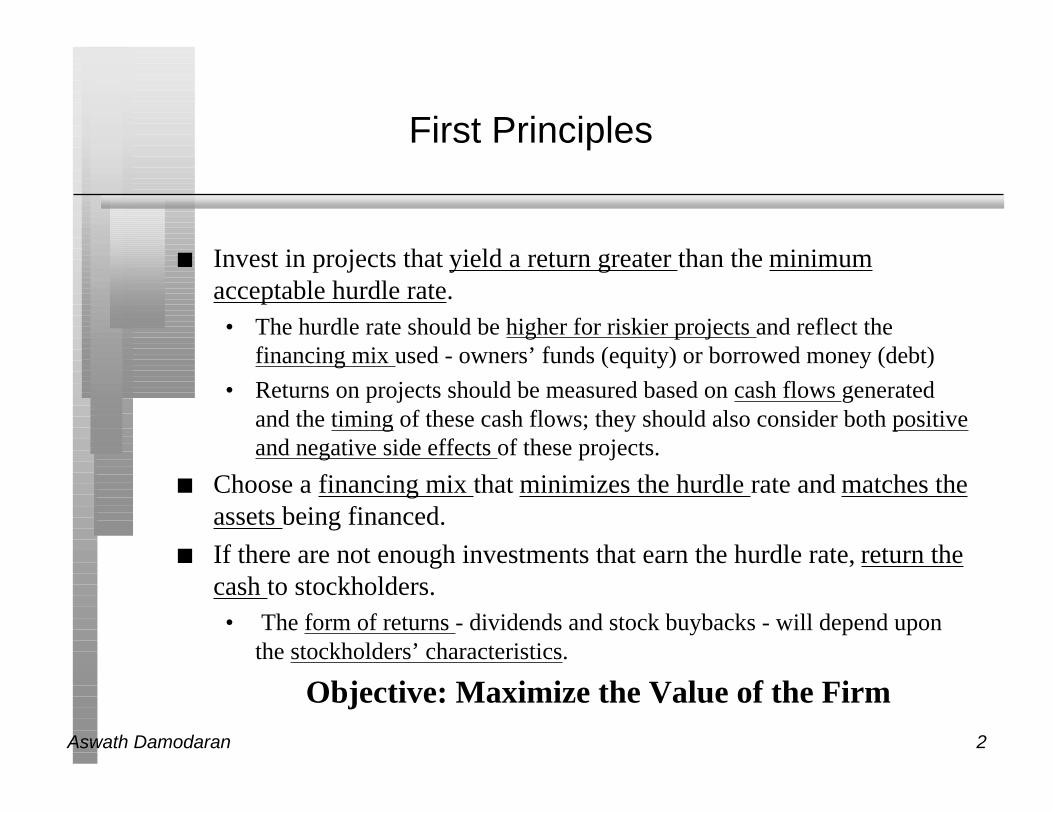
First Principles
n Invest in projects that yield a return greater than the minimumacceptable hurdle rate.• The hurdle rate should be higher for riskier projects and reflect the
financing mix used - owners’ funds (equity) or borrowed money (debt)
• Returns on projects should be measured based on cash flows generatedand the timing of these cash flows; they should also consider both positiveand negative side effects of these projects.
n Choose a financing mix that minimizes the hurdle rate and matches theassets being financed.
n If there are not enough investments that earn the hurdle rate, return thecash to stockholders.• The form of returns - dividends and stock buybacks - will depend upon
the stockholders’ characteristics.
Objective: Maximize the Value of the Firm

Aswath Damodaran 3
Discounted Cashflow Valuation: Basis forApproach
• where,
• n = Life of the asset
• CFt = Cashflow in period t
• r = Discount rate reflecting the riskiness of the estimated cashflows
Value = CFt
(1+ r)tt =1
t = n∑

Aswath Damodaran 4
Equity Valuation
n The value of equity is obtained by discounting expected cashflows toequity, i.e., the residual cashflows after meeting all expenses, taxobligations and interest and principal payments, at the cost of equity,i.e., the rate of return required by equity investors in the firm.
where,
CF to Equityt = Expected Cashflow to Equity in period t
ke = Cost of Equity
n The dividend discount model is a specialized case of equity valuation,and the value of a stock is the present value of expected futuredividends.
Value of Equity = CF to Equityt
(1+ ke )tt=1
t=n
∑

Aswath Damodaran 5
Firm Valuation
n The value of the firm is obtained by discounting expected cashflows tothe firm, i.e., the residual cashflows after meeting all operatingexpenses and taxes, but prior to debt payments, at the weightedaverage cost of capital, which is the cost of the different componentsof financing used by the firm, weighted by their market valueproportions.
where,
CF to Firmt = Expected Cashflow to Firm in period t
WACC = Weighted Average Cost of Capital
Value of Firm = CF to Firmt
(1+ WACC)tt=1
t=n
∑

Aswath Damodaran 6
Generic DCF Valuation Model
Cash flowsFirm: Pre-debt cash flowEquity: After debt cash flows
Expected GrowthFirm: Growth in Operating EarningsEquity: Growth in Net Income/EPS
CF1 CF2 CF3 CF4 CF5
Forever
Firm is in stable growth:Grows at constant rateforever
Terminal Value
CFn.........
Discount RateFirm:Cost of Capital
Equity: Cost of Equity
ValueFirm: Value of Firm
Equity: Value of Equity
DISCOUNTED CASHFLOW VALUATION
Length of Period of High Growth
Aswath Damodaran 7
Estimating Inputs:I. Discount Rates
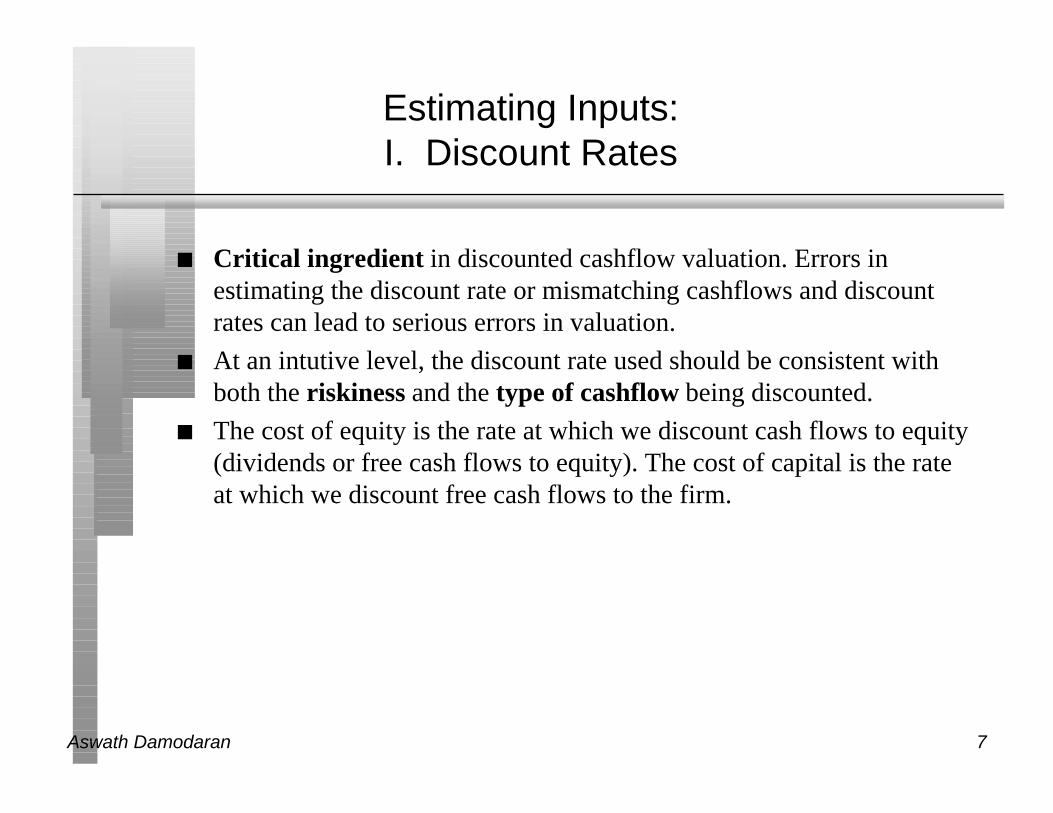
n Critical ingredient in discounted cashflow valuation. Errors inestimating the discount rate or mismatching cashflows and discountrates can lead to serious errors in valuation.
n At an intutive level, the discount rate used should be consistent withboth the riskiness and the type of cashflow being discounted.
n The cost of equity is the rate at which we discount cash flows to equity(dividends or free cash flows to equity). The cost of capital is the rateat which we discount free cash flows to the firm.

Aswath Damodaran 8
The Cost of Equity: A Recap
Cost of Equity = Riskfree Rate + Beta * (Risk Premium)
Has to be in the samecurrency as cash flows, and defined in same terms(real or nominal) as thecash flows
Preferably, a bottom-up beta,based upon other firms in thebusiness, and firm’s own financialleverage
Historical Premium1. Mature Equity Market Premium:Average premium earned bystocks over T.Bonds in U.S.2. Country risk premium =Country Default Spread* ( σEquity/σCountry bond)
Implied PremiumBased on how equitymarket is priced todayand a simple valuationmodel
or

Aswath Damodaran 9
Estimating the Cost of Capital
Cost of Capital = Cost of Equity (Equity/(Debt + Equity)) + Cost of Borrowing (1-t) (Debt/(Debt + Equity))
Cost of borrowing should be based upon(1) synthetic or actual bond rating(2) default spreadCost of Borrowing = Riskfree rate + Default spread
Marginal tax rate, reflectingtax benefits of debt
Weights should be market value weightsCost of equitybased upon bottom-upbeta

Aswath Damodaran 10
Costs of Equity, Debt and Capital
Boeing The Home Depot InfoSoft
Beta (Bottom-up) 1.01 0.87 1.49
Cost of Equity 10.58% 9.78% 13.19%
Equity/(Debt + Equity) 79.91% 95.45% 93.38%
Rating AA A+ A
After-tax Cost of Debt 3.58% 3.77% 3.48%
Debt/(Debt + Equity) 20.09% 4.55% 6.62%
Cost of Capital 9.17% 9.51% 12.55%

Aswath Damodaran 11
II. Estimating Cash Flows
Cash Flows
To Equity To Firm
The Strict ViewDividends +Stock Buybacks
The Broader ViewNet Income- Net Cap Ex (1-Debt Ratio)- Chg WC (1 - Debt Ratio)= Free Cashflow to Equity
EBIT (1-t)- ( Cap Ex - Depreciation)- Change in Working Capital= Free Cashflow to Firm

Aswath Damodaran 12
Estimating Operating Income
• The first adjustment is for financing expenses that accountants treat asoperating expenses. The most significant example is operating leases.
• The second adjustment is the treatment of some capital expenditures asoperating expenses. Here, the most dramatic example is the treatmentof research and development expenses.
• The third adjustment is to correct for the incidence of one-time orirregular income and expenses. Any expense (or income) that is truly aone-time expense (or income) should be removed from the operatingincome and should not be used in forecasting future operating income.

Aswath Damodaran 13
Operating Income Estimates
Boeing Home InfoSoft
Depot
Operating Income $1,720 $2,661 $2,000
+ Special and One-time Charges $0 $0 $0
+ Research and Development Expenses $1,895 $0 $4,000
- Amortization of Research Asset $1,382 $0 $2,367
+ Imputed Interest Expense on Operating Leases $ 31 $ 154 $ -
= Adjusted Operating Income $2,264 $2,815 $3,633

Aswath Damodaran 14
Estimating a Tax Rate
n The choice is between the effective and the marginal tax rate. In doingprojections, it is far safer to use the marginal tax rate since theeffective tax rate is really a reflection of the difference between theaccounting and the tax books.
n By using the marginal tax rate, we tend to understate the after-taxoperating income in the earlier years, but the after-tax tax operatingincome is more accurate in later years
n If you choose to use the effective tax rate, adjust the tax rate towardsthe marginal tax rate over time.

Aswath Damodaran 15
Tax Rate Estimates
Boeing Home Depot InfoSoft
Taxable Income 1397 2654 1685
Taxes 277 1040 707.7
Effective Tax Rate 19.83% 39.19% 42.00%
Average Effective Tax Rate:94-98 20.44% 38.78% 42%
Marginal tax rate 35% 35% 42%
We will use the 35% tax rate to value Boeing and the Home Depot and42% for InfoSoft.

Aswath Damodaran 16
Estimating Capital Expenditures
n Research and development expenses, once they have been re-categorized as capital expenses. The adjusted cap ex will beAdjusted Net Capital Expenditures = Net Capital Expenditures + Current
year’s R&D expenses - Amortization of Research Asset
n Acquisitions of other firms, since these are like capital expenditures.The adjusted cap ex will beAdjusted Net Cap Ex = Net Capital Expenditures + Acquisitions of other
firms - Amortization of such acquisitions
Two caveats:
1. Most firms do not do acquisitions every year. Hence, a normalizedmeasure of acquisitions (looking at an average over time) should be used
2. The best place to find acquisitions is in the statement of cash flows,usually categorized under other investment activities

Aswath Damodaran 17
Net Capital Expenditures: 1998
Boeing The Home Depot InfoSoft
Capital Expenditures $1,584 $2,059 $2,000
R&D $1,895 $0 $4,000
Depreciation $1,517 $373 $1,000
Amortization of R&D $1,382 $0 $2,367
Net Cap Ex w/o R&D $67 $1,686 $1,000
Net Cap Ex with R&D $580 $1,686 $2,633

Aswath Damodaran 18
Estimating Net Working Capital Needs
n In accounting terms, the working capital is the difference betweencurrent assets (inventory, cash and accounts receivable) and currentliabilities (accounts payables, short term debt and debt due within thenext year)
n A cleaner definition of working capital from a cash flow perspective isthe difference between non-cash current assets (inventory and accountsreceivable) and non-debt current liabilities (accounts payable)
n Any investment in this measure of working capital ties up cash.Therefore, any increases (decreases) in working capital will reduce(increase) cash flows in that period.
n When forecasting future growth, it is important to forecast the effectsof such growth on working capital needs, and building these effectsinto the cash flows.

Aswath Damodaran 19
Net Working Capital Estimates
Boeing The Home Depot InfoSoft
Revenues: 1998 $56,154 30219 20000
Non-cash WC: 1998 $1,360 2028 2000
∆ Working capital $667 $190 $500
Non-cash WC as % of Revenues 2.42% 6.71% 10.00%
Average from 1994-1998 4.12% 7.08% NA
Industry Average 18.95% 12.30% 18.00%

Aswath Damodaran 20
6 Application Test: Estimating your firm’sFCFF
n Estimate the FCFF for your firm in its most recent financial year:
In general, If using statement of cash flows
EBIT (1-t) EBIT (1-t)
+ Depreciation + Depreciation
- Capital Expenditures + Capital Expenditures
- Change in Non-cash WC + Change in Non-cash WC
= FCFF = FCFF
Estimate the dollar reinvestment at your firm:
Reinvestment = EBIT (1-t) - FCFF

Aswath Damodaran 21
Choosing a Cash Flow to Discount
n When you cannot estimate the free cash fllows to equity or the firm,the only cash flow that you can discount is dividends. For financialservice firms, it is difficult to estimate free cash flows. For DeutscheBank, we will be discounting dividends.
n If a firm’s debt ratio is not expected to change over time, the free cashflows to equity can be discounted to yield the value of equity. ForAracruz, we will discount free cash flows to equity.
n If a firm’s debt ratio might change over time, free cash flows to equitybecome cumbersome to estimate. Here, we would discount free cashflows to the firm. For Disney, we will discount the free cash flow tothe firm.

Aswath Damodaran 22
III. Expected Growth
Expected Growth
Net Income Operating Income
Retention Ratio=1 - Dividends/Net Income
Return on EquityNet Income/Book Value of Equity
X
Reinvestment Rate = (Net Cap Ex + Chg in WC/EBIT(1-t)
Return on Capital =EBIT(1-t)/Book Value of Capital
X

Aswath Damodaran 23
Expected Growth in EPS
gEPS = Retained Earningst-1/ NIt-1 * ROE= Retention Ratio * ROE= b * ROE
• Proposition 1: The expected growth rate in earnings for a companycannot exceed its return on equity in the long term.

Aswath Damodaran 24
Expected Growth in EBIT And Fundamentals
n Reinvestment Rate and Return on Capital
gEBIT = (Net Capital Expenditures + Change in WC)/EBIT(1-t) * ROC= Reinvestment Rate * ROC
n Proposition 2: No firm can expect its operating income to grow overtime without reinvesting some of the operating income in net capitalexpenditures and/or working capital.
n Proposition 3: The net capital expenditure needs of a firm, for a givengrowth rate, should be inversely proportional to the quality of itsinvestments.

Aswath Damodaran 25
Estimating Reinvestment Rate
Boeing The Home Depot InfoSoft
Net Cap Ex $ 580 $ 1,686 $ 2,633
Change in Non-Cash WC $ 667 $ 190 $ 500
Total Reinvestment $ 1,247 $ 1,876 $ 3,133
EBIT (1-t) $ 1,651 $ 1,830 $ 2,793
Reinvestment Rate 75.52% 102.53% 112.17%
Average : 1994-98 65.98% 131.85% NA
Industry Average 55.48% 88.62% 73.12%

Aswath Damodaran 26
Estimating Return on Capital
Boeing The Home Depot InfoSoft
Adjusted EBIT (1-t) $ 1,651 $ 1,830 $ 2,793
Adjusted BV of capital $ 28,957 $ 11,173 $ 11800
ROC 5.70% 16.38% 23.67%
Average ROC: 1994-1998 6.59% 15.12% NA
Industry average ROC 15.07% 14.10% 17.20%

Aswath Damodaran 27
Expected Growth Estimates
Boeing The Home Depot InfoSoft
Return on Capital 6.59% 16.38% 23.67%
Reinvestment Rate 65.98% 88.62% 112.17%
Expected Growth Rate 4.35% 14.51% 26.55%
Boeing: Used average return on capital and reinvestment rate over last 5years
The Home Depot: Used current return on capital and Industry averagereinvestment rate
InfoSoft: Used current return on capital and reinvestment rate

Aswath Damodaran 28
6 Application Test: Estimating ExpectedGrowth
n Estimate the following:• The reinvestment rate for your firm
• The after-tax return on capital
• The expected growth in operating income, based upon these inputs

Aswath Damodaran 29
IV. Getting Closure in Valuation
n A publicly traded firm potentially has an infinite life. The value istherefore the present value of cash flows forever.
n Since we cannot estimate cash flows forever, we estimate cash flowsfor a “growth period” and then estimate a terminal value, to capture thevalue at the end of the period:
Value = CF
t
(1+r)tt = 1
t = ∞∑
Value = CFt
(1 + r)t+
Terminal Value
(1 + r)N
t = 1
t = N∑

Aswath Damodaran 30
Stable Growth and Terminal Value
n When a firm’s cash flows grow at a “constant” rate forever, the presentvalue of those cash flows can be written as:Value = Expected Cash Flow Next Period / (r - g)
where,
r = Discount rate (Cost of Equity or Cost of Capital)
g = Expected growth rate
n This “constant” growth rate is called a stable growth rate and cannotbe higher than the growth rate of the economy in which the firmoperates.
n While companies can maintain high growth rates for extended periods,they will all approach “stable growth” at some point in time.
n When they do approach stable growth, the valuation formula abovecan be used to estimate the “terminal value” of all cash flows beyond.

Aswath Damodaran 31
Growth Patterns
n A key assumption in all discounted cash flow models is the period ofhigh growth, and the pattern of growth during that period. In general,we can make one of three assumptions:• there is no high growth, in which case the firm is already in stable growth
• there will be high growth for a period, at the end of which the growth ratewill drop to the stable growth rate (2-stage)
• there will be high growth for a period, at the end of which the growth ratewill decline gradually to a stable growth rate(3-stage)

Aswath Damodaran 32
Determinants of Length of High Growth Period
n Size of the firm• Success usually makes a firm larger. As firms become larger, it becomes
much more difficult for them to maintain high growth rates
n Current growth rate• While past growth is not always a reliable indicator of future growth,
there is a correlation between current growth and future growth. Thus, afirm growing at 30% currently probably has higher growth and a longerexpected growth period than one growing 10% a year now.
n Barriers to entry and differential advantages• Ultimately, high growth comes from high project returns, which, in turn,
comes from barriers to entry and differential advantages.
• The question of how long growth will last and how high it will be cantherefore be framed as a question about what the barriers to entry are, howlong they will stay up and how strong they will remain.

Aswath Damodaran 33
Analyzing the Growth Period
Boeing The Home Depot InfoSoft
Firm Size/Market Size Firm has the dominant market
share of a slow-growing market
Firm has dominant market share
of domestic market, but is
entering new businesses and new
markets (overseas)
Firm is a small firm in a market
that is experiencing significant
growth.
Current Excess Returns Firm is earning less than its cost
of capital, and has done so for
last 5 years
Firm is earning substantially
more than its cost of capital.
Firm is earning significant
excess returns.
Competitive Advantages Huge capital requirements and
technological barriers to new
entrants. Management record
over the last few years has been
poor.
Significant economies of scale
are used to establish cost
advantages over rivals. Has a
management team that is focused
on growth and efficiency.
Has both a good product and
good software engineers.
Competitive advantage is likely
to be limited, since employees
can be hired away, and
competitors are extremely
aggressive.
Length of High Growth
period
10 years, entirely because of
competitive advantages and
barriers to entry.
10 years; it will be difficult for
competitors to overcome the
economies of scale.
5 years. In spite of the firm’s
small size, the competitive nature
of this market and the lack of
barriers to competition make us
conservative on our estimate.

Aswath Damodaran 34
Firm Characteristics as Growth Changes
Variable High Growth Firms tend to Stable Growth Firms tend to
Risk be above-average risk be average risk
Dividend Payout pay little or no dividends pay high dividends
Net Cap Ex have high net cap ex have low net cap ex
Return on Capital earn high ROC (excess return) earn ROC closer to WACC
Leverage have little or no debt higher leverage

Aswath Damodaran 35
Estimating Stable Growth Inputs
n Start with the fundamentals:• Profitability measures such as return on equity and capital, in stable
growth, can be estimated by looking at– industry averages for these measure, in which case we assume that this firm in
stable growth will look like the average firm in the industry
– cost of equity and capital, in which case we assume that the firm will stopearning excess returns on its projects as a result of competition.
• Leverage is a tougher call. While industry averages can be used here aswell, it depends upon how entrenched current management is and whetherthey are stubborn about their policy on leverage (If they are, use currentleverage; if they are not; use industry averages)
n Use the relationship between growth and fundamentals to estimatepayout and net capital expenditures.

Aswath Damodaran 36
Estimating Stable Period Cost of Capital
High Growth Stable Growth High Growth Stable Growth High Growth Stable GrowthBeta 1.014 1 0.869 0.869 1.489 1.2Cost of Equity 10.58% 10.50% 9.78% 9.78% 13.19% 11.60%After-tax Cost of Debt 3.58% 3.58% 3.77% 3.58% 3.48% 3.48%Debt Ratio 20.09% 30.00% 4.55% 30.00% 6.62% 6.62%Cost of Capital 9.17% 8.42% 9.51% 7.92% 12.55% 11.06%
Boeing The Home Depot InfoSoft

Aswath Damodaran 37
Estimating Stable Period Net Cap Ex
gEBIT = (Net Capital Expenditures + Change in WC)/EBIT(1-t) * ROC= Reinvestment Rate * ROC
n Moving terms around,
Reinvestment Rate = gEBIT / Return on Capital
n For instance, assume that Boeing in stable growth will• grow 5% and that
• its return on capital in stable growth will be 8.42% (its cost of capital).
Reinvestment Rate for Boeing in Stable Growth = 5/8.42 = 59.36%
n In other words,• the net capital expenditures and working capital investment each year
during the stable growth period will be 59.36% of after-tax operatingincome.

Aswath Damodaran 38
Stable Period Return on Capital andReinvestment Rates
High Growth Stable Growth High Growth Stable Growth High Growth Stable GrowthReturn on Capital 6.59% 8.42% 16.38% 14.10% 23.67% 17.20%Reinvestment Rate 65.98% 59.35% 88.62% 35.46% 112.17% 29.07%Expected Growth Rate 4.35% 5.00% 14.51% 5.00% 26.55% 5.00%
Boeing The Home Depot InfoSoft

Aswath Damodaran 39
Dealing with Cash and Marketable Securities
n The simplest and most direct way of dealing with cash and marketablesecurities is to keep it out of the valuation - the cash flows should bebefore interest income from cash and securities, and the discount rateshould not be contaminated by the inclusion of cash. (Use betas of theoperating assets alone to estimate the cost of equity).
n Once the firm has been valued, add back the value of cash andmarketable securities.• If you have a particularly incompetent management, with a history of
overpaying on acquisitions, markets may discount the value of this cash.

Aswath Damodaran 40
Cash and Marketable Securities: Estimates
Boeing The Home Depot InfoSoft
Cash $2,183 $62 $100
Marketable Securities $279 $0 $400
Non-Operating Assets $0 $0 $0
Excess of Pension Assets $1,861 $0 $0
Cash and Non-Operating Assets $4,323 $62 $500
Boeing has an overfunded pension plan. We considered only 50% of theoverfunding, since the firm will have to pay a tax of 50% if it decidesto withdraw the funds.

Aswath Damodaran 41
The Value of Cash
n Implicitly, we are assuming here that the market will value cash atface value. Assume now that you are buying a firm whose only asset ismarketable securities worth $ 100 million. Can you ever consider ascenario where you would not be willing to pay $ 100 million for thisfirm?
o Yes
o No
n What is or are the scenario(s)?

Aswath Damodaran 42
Dealing with Holdings in Other firms
n Holdings in other firms can be categorized into• Minority passive holdings, in which case only the dividend from the
holdings is shown in the balance sheet
• Minority active holdings, in which case the share of equity income isshown in the income statements
• Majority active holdings, in which case the financial statements areconsolidated.

Aswath Damodaran 43
How to value holdings in other firms
Fin Statement Valuing What to do…
Not consolidated Equity Value equity in subsidiary and takeshare of holding.
Not consolidated Firm Value subsidiary as a firm and addportion of firm value. Add portion ofdebt in subsidiary to the debt in estimating equity value.
Consolidated Firm Strip operating income of subsidiaryand value subsidiary separately. Addportion of this value to value of parent firm.

Aswath Damodaran 44
How some deal with subsidiaries...
n When financial statements are consolidated, some analysts value thefirm with the consolidated operating income and then subtract minorityinterests from the firm value to arrive at the value of the equity in thefirm. What is wrong with this approach?

Aswath Damodaran 45
Equity Value and Per Share Value: A Test
n Assume that you have done an equity valuation of Microsoft. The totalvalue for equity is estimated to be $ 400 billion and there are 5 billionshares outstanding. What is the value per share?

Aswath Damodaran 46
An added fact
n In 1999, Microsoft had 500 million options outstanding, granted toemployees over time. These options had an average exercise price of $20 (the current stock price is $ 80). Estimate the value per share.

Aswath Damodaran 47
Equity Value and Per Share Value
n The conventional way of getting from equity value to per share valueis to divide the equity value by the number of shares outstanding. Thisapproach assumes, however, that common stock is the only equityclaim on the firm.
n In many firms, there are other equity claims as well including:• warrants, that are publicly traded
• management and employee options, that have been granted, but do nottrade
• conversion options in convertible bonds
• contingent value rights, that are also publicly traded.
n The value of these non-stock equity claims has to be subtracted fromthe value of equity before dividing by the number of sharesoutstanding.

Aswath Damodaran 48
Warrants
n A warrant is a security issued by a company that provides the holderwith the right to buy a share of stock in the company at a fixed priceduring the life of the warrant.
n A warrant is therefore a long term call option on the equity of the firmand can be valued using option pricing models.
n Warrants and other equity options issued by the firm are claims on theequity of the firm and have to be treated as equity, which has relevancefor:• estimating debt and equity for the leverage calculation
• estimating per share value from total equity value

Aswath Damodaran 49
Convertible Bonds
n A convertible bond is a bond that can be converted into a pre-determined number of shares, at the option of the bond holder.
n While it generally does not pay to convert at the time of the bondissue, conversion becomes a more attractive option as stock pricesincrease.
n A convertible bond can be considered to be made up of two securities -a straight bond and a conversion option.
n Firms generally add conversions options to bonds to lower the interestrate paid on the bonds.

Aswath Damodaran 50
Factors in Using Option Pricing Models toValue Convertibles and Warrants
n Option pricing models can be used to value the conversion option withthree caveats –• conversion options are long term, making the assumptions about constant
variance and constant dividend yields much shakier,
• conversion options result in stock dilution, and
• conversion options are often exercised before expiration, making itdangerous to use European option pricing models.
n These problems can be partially alleviated by using a binomial optionpricing model, allowing for shifts in variance and early exercise, andfactoring in the dilution effect

Aswath Damodaran 51
Options Outstanding: Boeing
Exercise Price Number(in ‘000s)
Life Black-ScholesValue/option
Total Value (in‘000s)
$ 16.35 4315 4.5 $ 17.71 $ 76,418.65
$ 23.32 8480 5 $ 14.23 $ 120,670.40
$ 38.44 1779 7.1 $ 10.75 $ 19,124.25
$ 41.25 4598 7.4 $ 10.34 $ 47,543.32
$ 53.37 9481 8.7 $ 9.12 $ 86,466.72
Total Value of Options Outstanding at Boeing = $ 350,223.34

Aswath Damodaran 52
Options Outstanding: The Home Depot
n Average Exercise Price of Options Outstanding = $20.17
n Stock Price at time of analysis= $ 37.00
n Average Maturity of Options Outstanding = 7.6 years
n Number of Options Outstanding = 47.728 million
n Standard Deviation of The Home Depot stock = 30%
n Value of Options Outstanding = $2,021 million

Aswath Damodaran 53
Steps in Getting to Value Per Share
n Step 1: Value the firm, using discounted cash flow or other valuationmodels.
n Step 2:Subtract out the value of the outstanding debt to arrive at thevalue of equity. Alternatively, skip step 1 and estimate the of equitydirectly.
n Step 3:Subtract out the market value (or estimated market value) ofother equity claims:• Value of Warrants = Market Price per Warrant * Number of Warrants :
Alternatively estimate the value using OPM
• Value of Conversion Option = Market Value of Convertible Bonds -Value of Straight Debt Portion of Convertible Bonds
n Step 4:Divide the remaining value of equity by the number of sharesoutstanding to get value per share.

Aswath Damodaran 54
Boeing: Valuation - Summary of Inputs
High Growth Phase Stable Growth Phase
Length 10 years Forever after year 10
Growth Inputs- Reinvestment Rate- Return on Capital- Expected Growth rate
65.98%6.59%%4.35%
59.36%8.42%5.00%
Cost of Capital Inputs- Beta- Cost of Debt- Debt Ratio- Cost of Capital
1.015.50%19.92%9.17%
1.005.50%30.00%8.42%
General Information- Tax Rate 35% 35%

Aswath Damodaran 55
Current Cashflow to FirmEBIT(1-t) : 1,651- Nt CpX 568- Chg WC 667= FCFF 417Reinvestment Rate = 74.77%
Expected Growth in EBIT (1-t).6598* .0659 = .04354.35%
Stable Growthg = 5%; Beta = 1.00; D/(D+E) = 30%;ROC=8.42%Reinvestment Rate=59.36%
Terminal Value 10= 1078/(.0842-.05) = 31,496
Cost of Equity10.58%
Cost of Debt(5%+ 0.50%)(1-.35)= 3.58%
WeightsE = 80.08% D = 19.92%
Discount at Cost of Capital (WACC) = 10.58% (0.80) + 3.58% (0.20) = 9.17%
Firm Value: 17,500+ Cash: 4,323- Debt: 8,194=Equity 13,630-Options 350Value/Share $13.14
Riskfree Rate:Government Bond Rate = 5%
+Beta 1.01 X
Risk Premium5.5%
Unlevered Beta for Sectors: 0.88
Firm’s D/ERatio: 25.14%
Historical US Premium5.5%
Country RiskPremium0%
Boeing: A ValuationReinvestment Rate65.98%
Return on Capital6.59%
EBIT(1-t)- ReinvFCFF
$1,723 $1,798 $1,876 $1,958 $2,043 $2,132 $2,225 $2,321 $2,422 $2,528 $2,654 $1,137 $1,186 $1,238 $1,292 $1,348 $1,407 $1,468 $1,532 $1,598 $1,668 $1,576 $586 $612 $638 $666 $695 $725 $757 $790 $824 $860 $1,078
Terminal year

Aswath Damodaran 56
The Home Depot: Valuation Inputs
High Growth Phase Stable Growth Phase
Length 10 years Forever after year 10
Growth Inputs- Reinvestment Rate- Return on Capital- Expected Growth rate
88.62%16.37%14.51%
35.46%14.10%5.00%
Cost of Capital Inputs- Beta- Cost of Debt- Debt Ratio- Cost of Capital
0.875.80%4.55%9.52%
0.875.50%30.00%7.92%
General Information- Tax Rate 35% 35%

Aswath Damodaran 57
Current Cashflow to FirmEBIT(1-t) : 1,829- Nt CpX 1,799- Chg WC 190= FCFF <160>Reinvestment Rate =108.75%
Expected Growth in EBIT (1-t).8862*.1637= .145114.51%
Stable Growthg = 5%; Beta = 0.87; D/(D+E) = 30%;ROC=14.1%Reinvestment Rate=35.46%
Terminal Value 10= 4806/(.0792-.05) = 164,486
Cost of Equity9.79%
Cost of Debt(5%+ 0.80%)(1-.35)= 3.77%
WeightsE = 95.55% D = 4.45%
Discount at Cost of Capital (WACC) = 9.79% (0.9555) + 3.77% (0.0445) = 9.52%
Firm Value: 68,949+ Cash: 62- Debt: 4,081=Equity 64,930-Options 2,021Value/Share $42.55
Riskfree Rate:Government Bond Rate = 5%
+Beta 0.87 X
Risk Premium5.5%
Unlevered Beta for Sectors: 0.86
Firm’s D/ERatio: 4.76%
Historical US Premium5.5%
Country RiskPremium0%
The Home Depot: A ValuationReinvestment Rate88.62%
Return on Capital16.37%
EBIT(1-t)- ReinvFCFF
20951857 238
23992126 273
27472434 313
31462788 358
36023192 410
41253655 469
47234186 538
54094793 616
61945489 705
70926285 807

Aswath Damodaran 58
InfoSoft: Valuation Estimates
High Growth Phase Stable Growth Phase
Length 5 years Forever after year 5
Growth Inputs- Reinvestment Rate- Return on Capital- Expected Growth rate
112.17%23.67%26.55%
29.07%17.2%5.00%
Cost of Capital Inputs- Beta- Cost of Debt- Debt Ratio- Cost of Capital
1.496.00%6.62%12.54%
1.206.00%6.62%11.05%
General Information- Tax Rate 42% 42%

Aswath Damodaran 59
Current Cashflow to FirmEBIT(1-t) : 2,793- Nt CpX 2,633- Chg WC 500= FCFF <340>Reinvestment Rate = 112.17%
Expected Growth in EBIT (1-t)1.1217*.2367 = .265526.55%
Stable Growthg = 5%; Beta = 1.20; D/(D+E) = 6.62%;ROC=17.2%Reinvestment Rate=29.07%
Terminal Value 10= 6753/(.1106-.05) = 111,384
Cost of Equity13.20%
Cost of Debt(5%+ 1.00%)(1-.42)= 3.36%
WeightsE = 93.38% D = 6.62%
Discount at Cost of Capital (WACC) = 13.2% (0.9338) + 3.36% (0.0662) = 12.55%
Firm Value: 59,218+ Cash: 500- Debt: 4,583=Equity 55,135
Riskfree Rate:Government Bond Rate = 5%
+Beta 1.49 X
Risk Premium5.5%
Unlevered Beta for Sectors: 1.43
Firm’s D/ERatio: 7.09%
Historical US Premium5.5%
Country RiskPremium0%
InfoSoft: A ValuationReinvestment Rate112.17%
Return on Capital23.67%
EBIT(1-t)- ReinvFCFF
35353965 -430
44745029 -545
56616350 -689
71657937 -872
906710071 -1104
952027736753

Aswath Damodaran 60
Relative Valuation
n In relative valuation, the value of an asset is derived from the pricingof 'comparable' assets, standardized using a common variable such asearnings, cashflows, book value or revenues. Examples include --• Price/Earnings (P/E) ratios
– and variants (EBIT multiples, EBITDA multiples, Cash Flow multiples)
• Price/Book (P/BV) ratios– and variants (Tobin's Q)
• Price/Sales ratios
Aswath Damodaran 61
Equity Multiples: Determinants
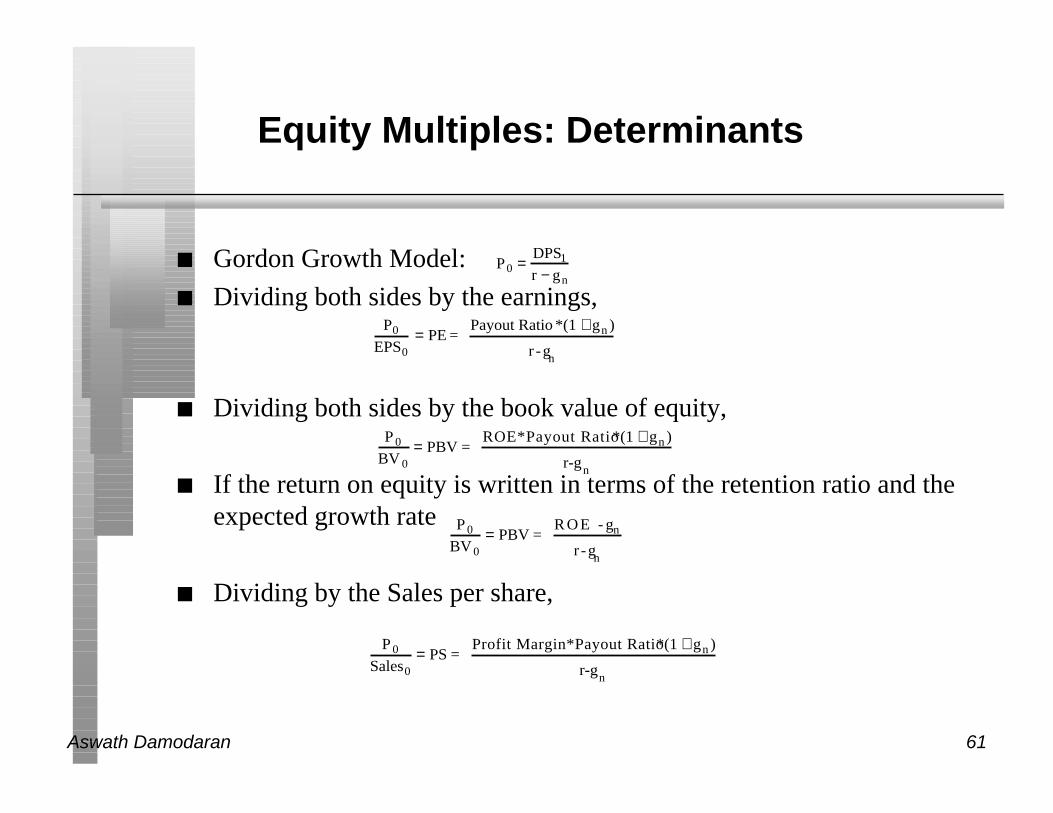
n Gordon Growth Model:
n Dividing both sides by the earnings,
n Dividing both sides by the book value of equity,
n If the return on equity is written in terms of the retention ratio and theexpected growth rate
n Dividing by the Sales per share,
P0 =DPS1
r − gn
P0
EPS0= PE =
Payout Ratio *(1 + gn )
r -gn
P 0
BV0= PBV =
R O E - gn
r -gn
P 0
BV 0= PBV =
ROE*Payout Ratio*(1 + gn )
r-gn
P 0
Sales0= PS =
Profit Margin*Payout Ratio*(1 + gn )
r-gn

Aswath Damodaran 62
Firm Value Multiples
n The value of a firm in stable growth can be written as:
Value of Firm =
n Dividing both sides by the expected free cash flow to the firm yieldsthe Value/FCFF multiple for a stable growth firm:
n The value/EBITDA multiple, for instance, can be written as follows:

Aswath Damodaran 63
Determinants of Multiples
Multiple Determining Variables
Price/Earnings Ratio Growth, Payout, Risk
Price/Book Value Ratio Growth, Payout, Risk, ROE
Price/Sales Ratio Growth, Payout, Risk, Net Margin
Value/EBITDA Growth, Net Capital Expenditure needs, Leverage, Risk
Value/Sales Growth, Net Capital Expenditure needs, Leverage, Risk, Operating Margin
Value/Book Capital Growth, Leverage, Risk and ROC
Companion variable is in italics.

Aswath Damodaran 64
Using Multiples based upon Comparables
n Simple Averages: The average multiple of comparable firms is used tovalue any firm. This works only if the firm is similar to the averagefirm in the sector.
n Adjusted Averages: Here, the average multiple is adjusted using onevariable. For instance, the PE ratio may be divided by growth to arriveat a PEG ratio.
n Regression Estimates: Here, the multiple is regressed against one ormore variables, and the regression is used to estimate the value anyfirm.

Aswath Damodaran 65
PE Ratios and Growth Rates: Software FirmsCompany Name PE Expected Growth PEG
Spanlink Communications 51.00 50% 1.02
Expert Software 11.18 15% 0.75
Applied Microsystems 10.74 20% 0.54
Tripos 9.73 25% 0.39
MathSoft 14.14 30% 0.47
Comshare 6.06 10% 0.61
Eagle Point Software 46.57 5% 9.31
TSR 12.56 20% 0.63
Computer Outsourcing Services 16.04 40% 0.40
Data Research Associates 12.14 15% 0.81
Mecon 46.55 30% 1.55
Forsoft 16.86 25% 0.67
HIE 39.53 38% 1.04
CFI ProServices 13.54 22% 0.62
Adept Technology 23.96 19% 1.26
TechForce 23.15 15% 1.54
InVision Technologies 9.83 23% 0.43
American Software A 8.33 30% 0.28
Viasoft 9.05 17% 0.53
Micrografx 122.17 35% 3.49
Orcad 18.14 16% 1.13
MySoftware 153.00 30% 5.10
Integrated Measurement Systems 15.71 11% 1.43
Jetform 10.87 20% 0.54
Aladdin Knowledge Systems 9.53 18% 0.53
Average 28.41 23% 1.40

Aswath Damodaran 66
Valuing InfoSoft
n Using Simple AverageValue of Equity
= InfoSoft Net Earnings in 1998* Average PE ratio for sector
= $977,300 * 28.41 = $27.765 million
n Using Average Adjusted for Growth• PEG Ratio = 1.40
• Expected Growth Rate for InfoSoft= 27.03%
• Value of Equity = $977,300 million * 1.40 * 27.03 = $ 37.056 million

Aswath Damodaran 67
Boeing: Price to Book Ratios forAerospace/Defense Firms
Company PBV ROE Standarad Deviation in Stock Prices
AAR Corp. 1.83 11.85% 61.19%
Orbital Sci Corp 2.32 3.28% 32.46%
CAE Inc. 3.66 25.41% 36.63%
Alliant Techsystems 3.93 25.57% 26.07%
Precision Castparts 1.77 14.46% 47.02%
Howmet Intl 6.00 27.10% 27.62%
Cordant Techn. 3.33 13.95% 27.15%
Litton Inds. 2.49 15.38% 35.62%
Sundstrand Corp. 7.17 33.03% 18.15%
Northrop Grumman 1.59 11.02% 37.59%
Raytheon Co. 'A' 0.65 10.51% 36.12%
Gen'l Dynamics 4.22 16.40% 19.48%
Bombardier Inc. 'B' 4.46 16.23% 22.16%
Lockheed Martin 2.83 19.29% 39.07%
Boeing 3.50 9.09% 34.32%
Average 3.32 16.84% 33.38%

Aswath Damodaran 68
PBV Regression
n Regressing price to book ratios against returns on equity and risk(standard deviation), we get
PBV = 3.54 + 12.69 ROE –6.97 Standard Deviation R2 = 76.15%
(2.97) (3.35) (2.41)
n Using this regression, we get a predicted price to book value ratio forBoeing, based upon its return on equity of 9.09% and a standarddeviation of 34.32%:
Predicted PBVBoeing = 3.54 + 12.69 (.0909) –6.97 (.3432) = 2.27
n Boeing, which is trading at 3.50 times book value, looks over valued.

Aswath Damodaran 69
Is Boeing fairly valued?
n Based upon the PBV ratio, is Boeing under, over or correctly valued?
o Under Valued
o Over Valued
o Correctly Valued
n Will this valuation give you a higher or lower valuation than thediscounted cashflow valuation?
o Higher
o Lower

Aswath Damodaran 70
Relative Valuation Assumptions
n Assume that you are reading an equity research report where a buyrecommendation for a company is being based upon the fact that its PEratio is lower than the average for the industry. Implicitly, what is theunderlying assumption or assumptions being made by this analyst?
o The sector itself is, on average, fairly priced
o The earnings of the firms in the group are being measured consistently
o The firms in the group are all of equivalent risk
o The firms in the group are all at the same stage in the growth cycle
o The firms in the group are of equivalent risk and have similar cashflow patterns
o All of the above

Aswath Damodaran 71
Value Enhancement: Back to Basics
Aswath Damodaran
http://www.stern.nyu.edu/~adamodar

Aswath Damodaran 72
Price Enhancement versus ValueEnhancement

Aswath Damodaran 73
The Paths to Value Creation
n Using the DCF framework, there are four basic ways in which thevalue of a firm can be enhanced:• The cash flows from existing assets to the firm can be increased, by either
– increasing after-tax earnings from assets in place or
– reducing reinvestment needs (net capital expenditures or working capital)
• The expected growth rate in these cash flows can be increased by either– Increasing the rate of reinvestment in the firm
– Improving the return on capital on those reinvestments
• The length of the high growth period can be extended to allow for moreyears of high growth.
• The cost of capital can be reduced by– Reducing the operating risk in investments/assets
– Changing the financial mix
– Changing the financing composition

Aswath Damodaran 74
A Basic Proposition
n For an action to affect the value of the firm, it has to• Affect current cash flows (or)
• Affect future growth (or)
• Affect the length of the high growth period (or)
• Affect the discount rate (cost of capital)
n Proposition 1: Actions that do not affect current cash flows, futuregrowth, the length of the high growth period or the discount ratecannot affect value.

Aswath Damodaran 75
Value-Neutral Actions
n Stock splits and stock dividends change the number of units of equityin a firm, but cannot affect firm value since they do not affect cashflows, growth or risk.
n Accounting decisions that affect reported earnings but not cash flowsshould have no effect on value.• Changing inventory valuation methods from FIFO to LIFO or vice versa
in financial reports but not for tax purposes
• Changing the depreciation method used in financial reports (but not thetax books) from accelerated to straight line depreciation
• Major non-cash restructuring charges that reduce reported earnings but arenot tax deductible
• Using pooling instead of purchase in acquisitions cannot change the valueof a target firm.
n Decisions that create new securities on the existing assets of the firm(without altering the financial mix) such as tracking stock cannotcreate value, though they might affect perceptions and hence the price.

Aswath Damodaran 76
Value Creation 1: Increase Cash Flows fromAssets in Place
n The assets in place for a firm reflect investments that have been madehistorically by the firm. To the extent that these investments werepoorly made and/or poorly managed, it is possible that value can beincreased by increasing the after-tax cash flows generated by theseassets.
n The cash flows discounted in valuation are after taxes andreinvestment needs have been met:EBIT ( 1-t)- (Capital Expenditures - Depreciation)- Change in Non-cash Working Capital= Free Cash Flow to Firm
n Proposition 2: A firm that can increase its current cash flows, withoutsignificantly impacting future growth or risk, will increase its value.

Aswath Damodaran 77
Ways of Increasing Cash Flows from Assets inPlace
Revenues
* Operating Margin
= EBIT
- Tax Rate * EBIT
= EBIT (1-t)
+ Depreciation- Capital Expenditures- Chg in Working Capital= FCFF
Divest assets thathave negative EBIT
More efficient operations and cost cuttting: Higher Margins
Reduce tax rate- moving income to lower tax locales- transfer pricing- risk management
Live off past over- investment
Better inventory management and tighter credit policies

Aswath Damodaran 78
Operating Margin and Value Per Share: Boeing
Figure 25.2: Boeing: Operating Margin Effect on Value
$0.00
$20.00
$40.00
$60.00
$80.00
$100.00
$120.00
$140.00
3% 5% 7% 9% 11% 13% 15%
After-tax Operating Margin
Val
ue/S
hare

Aswath Damodaran 79
Tax Rate and Value: InfoSoft
Figure 25.3: Tax Rate and InfoSoft Value
$52,000
$53,000
$54,000
$55,000
$56,000
$57,000
$58,000
$59,000
$60,000
0% 10% 20% 30% 40% 50%

Aswath Damodaran 80
Working Capital and Value: The Home Depot
Figure 25.5: The Home Depot: Working Capital and Value/Share
$0.00
$5.00
$10.00
$15.00
$20.00
$25.00
$30.00
$35.00
$40.00
$45.00
$50.00
0% 5% 10% 15% 20%
Non-Cash Working Capital as % of Revenues
Val
ue/S
hare

Aswath Damodaran 81
Value Creation 2: Increase Expected Growth
n Keeping all else constant, increasing the expected growth in earningswill increase the value of a firm.
n The expected growth in earnings of any firm is a function of twovariables:• The amount that the firm reinvests in assets and projects
• The quality of these investments

Aswath Damodaran 82
Value Enhancement through Growth
Reinvestment Rate
* Return on Capital
= Expected Growth Rate
Reinvest more inprojects
Do acquisitions
Increase operatingmargins
Increase capital turnover ratio

Aswath Damodaran 83
Reviewing the Valuation Inputs
Boeing The Home Depot InfoSoft
Cost of Capital 9.17% 9.51% 12.55%
Return on Capital 6.59% 16.38% 23.67%
Reinvestment Rate 65.98% 88.62% 112.17%
Expected Growth Rate 5.72% 14.51% 27.03%
Value Per Share $13.14 $42.55 $55.15

Aswath Damodaran 84
Changing the Reinvestment Rate
Figure 25.6: Effect of Changes in the Reinvestment Rate on the Value of Equity
-30.00%
-20.00%
-10.00%
0.00%
10.00%
20.00%
30.00%
-20% -10% 10% 20%
Change in Reinvestment Rate
Cha
nge
in V
alue
of
Equ
ity
Boeing The Home Depot InfoSoft

Aswath Damodaran 85
Reinvestment Rate and Value
n Increasing the reinvestment rate increases value per share at The HomeDepot and InfoSoft, but reduces it at Boeing. Why?

Aswath Damodaran 86
Value Creation 3: Increase Length of HighGrowth Period
n Every firm, at some point in the future, will become a stable growthfirm, growing at a rate equal to or less than the economy in which itoperates.
n The high growth period refers to the period over which a firm is ableto sustain a growth rate greater than this “stable” growth rate.
n If a firm is able to increase the length of its high growth period, otherthings remaining equal, it will increase value.
n The length of the high growth period is a direct function of thecompetitive advantages that a firm brings into the process. Creatingnew competitive advantage or augmenting existing ones can createvalue.

Aswath Damodaran 87
3.1: The Brand Name Advantage
n Some firms are able to sustain above-normal returns and growthbecause they have well-recognized brand names that allow them tocharge higher prices than their competitors and/or sell more than theircompetitors.
n Firms that are able to improve their brand name value over time canincrease both their growth rate and the period over which they canexpect to grow at rates above the stable growth rate, thus increasingvalue.

Aswath Damodaran 88
Illustration: Valuing a brand name: Coca Cola
Coca Cola Generic Cola Company
AT Operating Margin 18.56% 7.50%Sales/BV of Capital 1.67 1.67
ROC 31.02% 12.53%
Reinvestment Rate 65.00% (19.35%) 65.00% (47.90%)
Expected Growth 20.16% 8.15%
Length 10 years 10 yea
Cost of Equity 12.33% 12.33%
E/(D+E) 97.65% 97.65%
AT Cost of Debt 4.16% 4.16%
D/(D+E) 2.35% 2.35%
Cost of Capital 12.13% 12.13%
Value $115 $13

Aswath Damodaran 89
3.2: Patents and Legal Protection
n The most complete protection that a firm can have from competitivepressure is to own a patent, copyright or some other kind of legalprotection allowing it to be the sole producer for an extended period.
n Note that patents only provide partial protection, since they cannotprotect a firm against a competitive product that meets the same needbut is not covered by the patent protection.
n Licenses and government-sanctioned monopolies also provideprotection against competition. They may, however, come withrestrictions on excess returns; utilities in the United States, forinstance, are monopolies but are regulated when it comes to priceincreases and returns.

Aswath Damodaran 90
3.3: Switching Costs
n Another potential barrier to entry is the cost associated with switchingfrom one firm’s products to another.
n The greater the switching costs, the more difficult it is for competitorsto come in and compete away excess returns.
n Firms that devise ways to increase the cost of switching from theirproducts to competitors’ products, while reducing the costs ofswitching from competitor products to their own will be able toincrease their expected length of growth.

Aswath Damodaran 91
3.4: Cost Advantages
n There are a number of ways in which firms can establish a costadvantage over their competitors, and use this cost advantage as abarrier to entry:• In businesses, where scale can be used to reduce costs, economies of scale
can give bigger firms advantages over smaller firms
• Owning or having exclusive rights to a distribution system can providefirms with a cost advantage over its competitors.
• Owning or having the rights to extract a natural resource which is inrestricted supply (The undeveloped reserves of an oil or mining company,for instance)
n These cost advantages will show up in valuation in one of two ways:• The firm may charge the same price as its competitors, but have a much
higher operating margin.
• The firm may charge lower prices than its competitors and have a muchhigher capital turnover ratio.

Aswath Damodaran 92
Growth Period and Value: InfoSoft
Figure 25.7: Value of InfoSoft and Expected Growth Period
0
20
40
60
80
100
120
1 2 3 4 5 6 7 8 9 10

Aswath Damodaran 93
Gauging Barriers to Entry
n Which of the following barriers to entry are most likely to work for thefirm that you are analyzing?
p Brand Name
p Patents and Legal Protection
p Switching Costs
p Cost Advantages

Aswath Damodaran 94
Value Creation 4: Reduce Cost of Capital
n The cost of capital for a firm can be written as:
Cost of Capital = ke (E/(D+E)) + kd (D/(D+E))
Where,
ke = Cost of Equity for the firm
kd = Borrowing rate (1 - tax rate)
n The cost of equity reflects the rate of return that equity investors in thefirm would demand to compensate for risk, while the borrowing ratereflects the current long-term rate at which the firm can borrow, givencurrent interest rates and its own default risk.
n The cash flows generated over time are discounted back to the presentat the cost of capital. Holding the cash flows constant, reducing thecost of capital will increase the value of the firm.

Aswath Damodaran 95
Reducing Cost of Capital
Cost of Equity (E/(D+E) + Pre-tax Cost of Debt (D./(D+E)) = Cost of Capital
Change financing mix
Make product or service less discretionary to customers
Reduce operating leverage
Match debt to assets, reducing default risk
Changing product characteristics
More effective advertising
Outsourcing Flexible wage contracts &cost structure
Swaps Derivatives Hybrids

Aswath Damodaran 96
Actual versus Optimal Debt Ratios
Current Optimal
Debt RatioCost of Capital Debt Ratio Cost of Capital
Boeing 20.09% 9.17% 30% 9.16%
The Home Depot 4.55% 9.51% 20% 9.23%
InfoSoft 6.55% 12.55% 20% 12.28%

Aswath Damodaran 97
Changing Financing Type
n The fundamental principle in designing the financing of a firm is toensure that the cash flows on the debt should match as closely aspossible the cash flows on the asset.
n By matching cash flows on debt to cash flows on the asset, a firmreduces its risk of default and increases its capacity to carry debt,which, in turn, reduces its cost of capital, and increases value.
n Firms which mismatch cash flows on debt and cash flows on assets byusing• Short term debt to finance long term assets
• Dollar debt to finance non-dollar assets
• Floating rate debt to finance assets whose cash flows are negatively or notaffected by inflation
will end up with higher default risk, higher costs of capital and lower firmvalue.

Aswath Damodaran 98
The Value Enhancement ChainGimme’ Odds on. Could work if..
Assets in Place 1. Divest assets/projects withDivestiture Value >
Continuing Value2. Terminate projects with
Liquidation Value >Continuing Value
3. Eliminate operating
expenses that generate nocurrent revenues and nogrowth.
1. Reduce net working capitalrequirements, by reducing
inventory and accountsreceivable, or by increasingaccounts payable.
2. Reduce capital maintenanceexpenditures on assets in
place.
1. Change pricing strategy tomaximize the product of
profit margins and turnoverratio.
Expected Growth Eliminate new capital
expenditures that are expected
to earn less than the cost ofcapital
Increase reinvestment rate or
marginal return on capital or
both in firm’s existingbusinesses.
Increase reinvestment rate or
marginal return on capital or
both in new businesses.
Length of High Growth Period If any of the firm’s products orservices can be patented and
protected, do so
Use economies of scale or costadvantages to create higher
return on capital.
1. Build up brand name2. Increase the cost of
switching from product andreduce cost of switching toit.
Cost of Financing 1. Use swaps and derivativesto match debt more closely
to firm’s assets2. Recapitalize to move the
firm towards its optimaldebt ratio.
1. Change financing type anduse innovative securities to
reflect the types of assetsbeing financed
2. Use the optimal financingmix to finance new
investments.3. Make cost structure more
flexible to reduce operatingleverage.
Reduce the operating risk of thefirm, by making products less
discretionary to customers.

Aswath Damodaran 99
Current Cashflow to FirmEBIT(1-t) : 2,123- Nt CpX 1,039- Chg WC 667= FCFF 417Reinvestment Rate = 80.38%
Expected Growth in EBIT (1-t).6598*.125 = .088.25%
Stable Growthg = 5%; Beta = 1.00; D/(D+E) = 30%;ROC=12.5%Reinvestment Rate=40%
Terminal Value 10= 2,298(.0842-.05) = 67,148
Cost of Equity13.85%
Cost of Debt(5%+ 0.50%)(1-.35)= 3.58%
WeightsE = 80.08% D = 19.92%
Discount at Cost of Capital (WACC) = 10.56% (0.80) + 3.58% (0.20) = 9.16%
Firm Value: 33,254+ Cash: 4,323- Debt: 8,194=Equity 40,776-Options 350Value/Share $28.73
Riskfree Rate:Government Bond Rate = 5%
+Beta 1.01 X
Risk Premium5.5%
Unlevered Beta for Sectors: 0.88
Firm’s D/ERatio: 25.14%
Historical US Premium5.5%
Country RiskPremium0%
Boeing: A Restructured ValuationReinvestment Rate65.98%
Return on Capital12.50%
EBIT(1-t)- ReinvFCFF
17881179608
19351277658
20951382713
22671496 771
24541619 835
26571753 904
28761898 978
311320541059
337022231146
364824071241
383015322298

Aswath Damodaran 100
Current Cashflow to FirmEBIT(1-t) : 1,841- Nt CpX 1,813- Chg WC 190= FCFF <161>Reinvestment Rate =108.76%
Expected Growth in EBIT (1-t)1.0876*.1677= .182418.24%
Stable Growthg = 5%; Beta = 0.87; D/(D+E) = 30%;ROC=14.1%Reinvestment Rate=35.46%
Terminal Value 10= 6666/(.0792-.05) = 228,146
Cost of Equity10.39%
Cost of Debt(5%+ 2.00%)(1-.35)= 4.55%
WeightsE = 80% D = 20%
Discount at Cost of Capital (WACC) = 10.39% (0.80) + 4.55% (0.20) = 9.23%
Firm Value: 89,850+ Cash: 62- Debt: 3,885=Equity 86,027-Options 2,021Value/Share $56.81
Riskfree Rate:Government Bond Rate = 5%
+Beta 0.98 X
Risk Premium5.5%
Unlevered Beta for Sectors: 0.86
Firm’s D/ERatio: 25%
Historical US Premium5.5%
Country RiskPremium0%
The Home Depot: A Restructured ValuationReinvestment Rate108.76%
Return on Capital16.77%
EBIT(1-t)- ReinvFCFF
21772513 -336
25742972 -397
30443514 -470
35994155 -556
42564913 -657
50325809 -777
59506869 -919
70368122-1086
83209604-1284
983711356 -1519

Aswath Damodaran 101
Current Cashflow to FirmEBIT(1-t) : 2,793- Nt CpX 2,633- Chg WC 500= FCFF <340>Reinvestment Rate = 112.17%
Expected Growth in EBIT (1-t)1.1217*.2367= .265526.55%
Stable Growthg = 5%; Beta = 1.20; D/(D+E) =20%;ROC=17.2%Reinvestment Rate=29.07%
Terminal Value 10= 21918/(.1035-.05) = 409453
Cost of Equity14.02%
Cost of Debt(5%+ 4.00%)(1-.42)= 5.37%
WeightsE = 80% D = 20%
Discount at Cost of Capital (WACC) = 14.02% (0.80) + 5.37% (0.20) = 12.29%
Firm Value: 121522+ Cash: 500- Debt: 4,583=Equity 117439
Riskfree Rate:Government Bond Rate = 5%
+Beta 1.64 X
Risk Premium5.5%
Unlevered Beta for Sectors: 1.43
Firm’s D/ERatio: 7.09%
Historical US Premium5.5%
Country RiskPremium0%
InfoSoft: A Restructured ValuationReinvestment Rate112.17%
Return on Capital23.67%
EBIT(1-t)- ReinvFCFF
35353965 -430
44745018 -544
56616350 -689
71658047 -872
906710170 -1103
1147412871-1397
1452116288-1767
1837620613-2237
2325526086-2831
2942933011-3582

Aswath Damodaran 102
First Principles
n Invest in projects that yield a return greater than the minimumacceptable hurdle rate.• The hurdle rate should be higher for riskier projects and reflect the
financing mix used - owners’ funds (equity) or borrowed money (debt)
• Returns on projects should be measured based on cash flows generatedand the timing of these cash flows; they should also consider both positiveand negative side effects of these projects.
n Choose a financing mix that minimizes the hurdle rate and matches theassets being financed.
n If there are not enough investments that earn the hurdle rate, return thecash to stockholders.• The form of returns - dividends and stock buybacks - will depend upon
the stockholders’ characteristics.
Objective: Maximize the Value of the Firm