Valorization of lignin as an active material for ...
110
https://lib.uliege.be https://matheo.uliege.be Valorization of lignin as an active material for electrochemical energy storage Auteur : Natalis, Vincent Promoteur(s) : Richel, Aurore; Vertruyen, Benedicte Faculté : Faculté des Sciences Diplôme : Master en sciences chimiques, à finalité approfondie Année académique : 2017-2018 URI/URL : http://hdl.handle.net/2268.2/8506 Avertissement à l'attention des usagers : Tous les documents placés en accès ouvert sur le site le site MatheO sont protégés par le droit d'auteur. Conformément aux principes énoncés par la "Budapest Open Access Initiative"(BOAI, 2002), l'utilisateur du site peut lire, télécharger, copier, transmettre, imprimer, chercher ou faire un lien vers le texte intégral de ces documents, les disséquer pour les indexer, s'en servir de données pour un logiciel, ou s'en servir à toute autre fin légale (ou prévue par la réglementation relative au droit d'auteur). Toute utilisation du document à des fins commerciales est strictement interdite. Par ailleurs, l'utilisateur s'engage à respecter les droits moraux de l'auteur, principalement le droit à l'intégrité de l'oeuvre et le droit de paternité et ce dans toute utilisation que l'utilisateur entreprend. Ainsi, à titre d'exemple, lorsqu'il reproduira un document par extrait ou dans son intégralité, l'utilisateur citera de manière complète les sources telles que mentionnées ci-dessus. Toute utilisation non explicitement autorisée ci-avant (telle que par exemple, la modification du document ou son résumé) nécessite l'autorisation préalable et expresse des auteurs ou de leurs ayants droit.
Transcript of Valorization of lignin as an active material for ...

https://lib.uliege.be https://matheo.uliege.be
Valorization of lignin as an active material for electrochemical energy storage
Auteur : Natalis, Vincent
Promoteur(s) : Richel, Aurore; Vertruyen, Benedicte
Faculté : Faculté des Sciences
Diplôme : Master en sciences chimiques, à finalité approfondie
Année académique : 2017-2018
URI/URL : http://hdl.handle.net/2268.2/8506
Avertissement à l'attention des usagers :
Tous les documents placés en accès ouvert sur le site le site MatheO sont protégés par le droit d'auteur. Conformément
aux principes énoncés par la "Budapest Open Access Initiative"(BOAI, 2002), l'utilisateur du site peut lire, télécharger,
copier, transmettre, imprimer, chercher ou faire un lien vers le texte intégral de ces documents, les disséquer pour les
indexer, s'en servir de données pour un logiciel, ou s'en servir à toute autre fin légale (ou prévue par la réglementation
relative au droit d'auteur). Toute utilisation du document à des fins commerciales est strictement interdite.
Par ailleurs, l'utilisateur s'engage à respecter les droits moraux de l'auteur, principalement le droit à l'intégrité de l'oeuvre
et le droit de paternité et ce dans toute utilisation que l'utilisateur entreprend. Ainsi, à titre d'exemple, lorsqu'il reproduira
un document par extrait ou dans son intégralité, l'utilisateur citera de manière complète les sources telles que
mentionnées ci-dessus. Toute utilisation non explicitement autorisée ci-avant (telle que par exemple, la modification du
document ou son résumé) nécessite l'autorisation préalable et expresse des auteurs ou de leurs ayants droit.
1
FACULTE DES SCIENCES Département de Chimie Biomasse et Technologies Vertes (GABTx-Uliège) – Pr. Richel GreenMat (ULiège) – Pr. Vertruyen
Valorization of lignin as an active material for electrochemical energy storage
Année académique 2017-2018 Dissertation présentée par Vincent Natalis en vue de l’obtention du diplôme de Master en Sciences Chimiques

2
Acknowledgments
First and foremost, I would like to warmly thank my two promoters, Ms. Richel and
Vertuyen, who provided a helpful guidance throughout the whole master thesis. Their work
was essential, precise, concise and kind, and their help available at all times. Thank you !
A big thanks goes to the team of the laboratory of Biomass and Green Technologies, with
whom I spent these 5 months: Alex, Isabelle (for her kind remarks!), Sophie, Maroua,
Quentin, Christel, Romolo and Lionel.
An immense thank you to the big heads that helped me think and overthink, write and rewrite
every little piece of data: Thibaut & Thibaut, Lauris, and, of course, the future Pope of Lignin,
whose time I stole way too much - Thomas !
A huge thanks to Thibaut L., Mathilde and Antoine for their help in laboratory experiments.
A special thanks to Elias for the nice pictures he helped me with.
A double thanks to Caroline and Anthony, who helped me for all Greenmat-related
experiments.
I also thank the people who helped me proof-read this piece: Johana, Françoise, Louis the
nightly owl, my parents and André. This work is also theirs.

3
Abstract
Lignin is one of the three major architectural biopolymers of lignocellulosic biomass, and the
largest available feedstock of natural aromatic polymer on Earth. Its valorization in second-
generation biorefineries remains a challenge. Among possible uses, lignin can be carbonized
to create porous carbons, which are useful as supercapacitors, a kind of capacitor that also
displays battery-like properties. Recent studies show lignin could also be exploited as a bio-
sourced, redox-active material in batteries thanks to its numerous quinone-like moieties. Still,
we lack fundamental pieces of knowledge about lignin, such as the impact of pretreatment
type on lignin structure, molecular weight fractionation, organic solvent solubility or
electrochemical properties. Moreover, to the best of our knowledge, no research has been
conducted on the use of soda-extracted lignin in batteries.
In this master thesis, illustrated in fig. 1, we fractionated soda-extracted lignin samples from
three sources (softwood, hardwood, herbaceous), characterized them by Fourier transform
infrared (FTIR) spectroscopy, high pressure size exclusion chromatography (HPSEC), nuclear
Figure 1 Visual scheme of the whole master thesis. Brown dots: Lignin molecules. Source
for symbols: [72]–[74]

4
magnetic resonance (NMR) and scanning electron microscopy (SEM). We linked their
characteristics to their electrochemical capacity performances, measured by cyclic
voltammetry (CV). Our results showed that organic solvent fractionation and pH-driven
fractionation created a range of molecular weight-separated fractions of smaller
polydispersity. All fractions had unique relative abundances of oxygenated functionalities.
Soda-extracted lignin exhibited a ~16 mAh/g capacity. This showed that soda-extracted
samples are as capacitive as Kraft-extracted samples reported in literature. Furthermore, our
softwood samples displayed capacities 4 and 8 times higher than herbaceous and hardwood
lignins, respectively.
La lignine est un des trois principaux biopolymères structurants de la biomasse
lignocellulosique. C’est le plus grand réservoir naturel de polymères aromatiques sur Terre.
Dans les bioraffineries de seconde génération, sa valorisation reste un challenge. Une des
applications de la lignine est sa carbonisation en noir de carbone poreux, utilisé comme
supercondasteur, un type de condensateur qui présente aussi des propriétés de batterie. Des
études récentes montrent que la lignine pourrait aussi être utilisée comme matériau
oxydoréducteur dans les batteries, du fait de sa haute teneur en fonctions quinone. Pourtant,
nous manquons toujours de données fondamentales sur la lignine, comme, notamment,
l’impact du type de prétraitement sur sa structure, son fractionnement par masse molaire, sa
solubilité dans les solvants organiques et ses propriétés électrochimiques. De plus, d’après
nos recherches bibliographiques, il n’existe aucune étude sur l’utilisation de la lignine
extraite à la soude dans des batteries.
Dans ce mémoire, illustré en fig. 1, nous avons fractionné des échantillons de lignine
provenant de trois sources (résineux, feuillu, herbacée) selon leur masse molaire, les avons
caractérisés par FTIR, HP-SEC, RMN et SEM, puis avons mis en lien ces caractéristiques
avec leurs performances électrochimiques, mesurées par CV. Nos résultats montrent que le
fractionnement par solvant organique et le fractionnement par pH ont créé une série de
fractions de faible polydispersisté, séparées selon leur masse molaire. Toutes les fractions
avaient des abondances relatives uniques de fonctionnalités oxygénées. La lignine extraite à
la soude avait une capacitance de 16 mAh/g, ce qui met en évidence le fait que les
échantillons extraits à la soude sont aussi capacitifs que les lignines issues du procédé Kraft
décrites dans la littérature. De plus, nos échantillons de résineux avaient des capacitances 4
et 8 fois plus élevées que, respectivement, ceux d’herbacée et de feuillu.

5
Table of Contents
ACKNOWLEDGMENTS ....................................................................................................... 2
ABSTRACT .............................................................................................................................. 3
1. INTRODUCTION .............................................................................................................. 13
2. STATE OF THE ART ....................................................................................................... 14
2.1. WHAT IS LIGNIN? .............................................................................................................. 14
2.1.1. LIGNIN IS PRODUCED IN PAPER MILLS AND BIOREFINERIES .............................................. 17
2.1.2. LIGNIN CAN BE VALORIZED IN BOTH LOW VALUE AND HIGH VALUE APPLICATIONS ......... 22
2.1.3. LIGNIN CAN BE FRACTIONATED ACCORDING TO MOLECULAR WEIGHT OR SURFACE
MOIETIES ................................................................................................................................... 25
2.2. ELECTROCHEMICAL STORAGE : CAPACITORS AND BIOMOLECULES ............................... 26
2.3. LIGNIN IN ENERGY STORAGE ............................................................................................ 29
2.3.1. CARBONIZATION OF BIOMASS CREATES CAPACITIVE POROUS CARBONS .......................... 29
2.3.2. NON-CARBONIZED LIGNIN IS USED SYNERGISTICALLY WITH POROUS CARBON TO CREATE
SUPERCAPACITORS .................................................................................................................... 39
2.4. STATE OF THE ART: A SUMMARY ...................................................................................... 43
3. OBJECTIVES ..................................................................................................................... 44
4. MATERIALS AND METHODS ....................................................................................... 45
5. RESULTS AND DISCUSSION ......................................................................................... 50
5.1. EXTRACTION AND PURIFICATION ..................................................................................... 50
5.1.1. EXTRACTION YIELDS ARE LOWER THAN EXPECTED .......................................................... 50
5.1.2. THE KLASON METHOD SHOWS THE DIALYZED LIGNINS ARE >97% PURE ......................... 50
.................................................................................................................................................. 51
5.2. FRACTIONS PROPORTIONS ARE INDICATORS OF FUNCTIONALITY CONTENT ................ 52

6
5.2.1. PH FRACTIONS PROPORTIONS INDICATE PROPORTIONS OF CARBOXYLIC ACIDS AND
PHENOLS IN THE FRACTIONS ...................................................................................................... 52
5.2.2 ORGANIC SOLVENT FRACTIONS PROPORTIONS WERE DIFFICULT TO ANALYZE BECAUSE OF
COMPLEX LIGNIN SOLUBILITY .................................................................................................... 54
5.3 HANSEN SOLUBILITY PARAMETERS MAKE SENSE OUT OF ORGANIC SOLVENT SOLUBILITY
.................................................................................................................................................. 56
5.4 FTIR ANALYSIS POINTS OUT GENERAL FUNCTIONALITY CONTENT TRENDS ................... 59
5.4.1. ORGANIC SOLVENT FRACTIONATION ............................................................................... 59
5.4.1.2 ACETONE/WATER MIXTURES FRACTIONATION ............................................................... 64
5.4.1.3. PH FRACTIONATION ...................................................................................................... 66
5.4.1.4. SONICATION AND BALL-MILLING .................................................................................. 67
5.5. HPSEC ANALYSIS SHOWS MOLECULAR WEIGHT FRACTIONATIONS DID WORK ............. 68
5.6. NMR ANALYSIS REPORTS CHANGES IN OXYGEN-BEARING MOIETIES CONTENTS .......... 75
5.7. SEM SHOWS DIVERSE STRUCTURES IN LIGNIN FRACTIONS AND INHOMOGENEITY IN
ELECTRODE FILM ..................................................................................................................... 78
5.7.1. LIGNIN FRACTIONS SHOW DIVERSE MICROSTRUCTURES ................................................... 78
5.7.2. LIGNIN FILMS ARE MADE OF LIGNIN PARTICLES EMBEDDED IN CARBON MATRIX ............. 80
.................................................................................................................................................. 81
5.8. CYCLIC VOLTAMMETRY INDICATES DPL IS MUCH MORE CAPACITIVE THAN HL AND BL
.................................................................................................................................................. 82
5.9. SUMMARIZED OVERVIEW: NMR, HPSEC AND FTIR AGREE ON MOLECULAR WEIGHT
DETERMINATION ...................................................................................................................... 85
6. CONCLUSION AND PERSPECTIVES .......................................................................... 88
7. BIBLIOGRAPHY .............................................................................................................. 91
8. APPENDIXES .................................................................................................................... 99
APPENDIX I : KLASON CALCULATIONS ................................................................................... 99
APPENDIX II : FTIR DATA ..................................................................................................... 100
APPENDIX III : HANSEN PARAMETERS .............................................................................. 106
APPENDIX IV : HPSEC POLYSTYRENE CALIBRATION CURVE ............................................. 109

7
Table of figures
Figure 1 Visual scheme of the whole master thesis. Brown dots: Lignin molecules. Source for
symbols: [72]–[74] 3
Figure 2 Schematic representation of a molecule of lignin. The figure highlights the diverse
number of linkages and the reticulation of the biopolymer [75] 13
Figure 3 The 3D structure of lignocellulosic biomass [4] 14
Figure 5 The reversible electrochemical reaction between hydroxyquinone (on the left) and
quinone (on the right) [9]. 16
Figure 4 The three monomeric alcohols that polymerize into lignin. From left to right: p-
hydroxyphenyl (abbreviated H) , coniferyl G and synapil S. Molecules drawn with
ChemDoodle ©. 16
Figure 6 Overview of all available biorefinery pretreatments to separate lignin,
hemicelluloses and cellulose. SPORL: Sulfite Pretreatment to Overcome Recalcitrance of
Lignocellulose [18]. 19
Figure 7 Schematic representation of possible valorizations for lignin, arranged by volume
and value. Framed in black, an application that will be further explained in section 2.3 [31]. 22
Figure 8 Schematic representation of the possible ways to valorize lignin. In black, we
circled the application we are aiming at: the valorization of lignin as a biopolymer [31]. 23
Figure 9 Ragone plot, displaying the specific power as a function of specific energy. Gasoline
combustion engine (CE) and H2 combustion engine (CE) should be considered apart, because
they consume fuel and do not store it [39]. 26
Figure 10 Array of biomolecules that are being investigated for their electrochemical storage
potential. A and b: quinones. C: pteridines [2]. 27
Figure 11 Adapted from table 1 in Tang et al, 2017 [2]. C: specific capacitance density, I:
current density. KOH: activator. Sources for pictures: [76]–[84]. 30
Figure 12 Comparison between non-activated carbon materials and activated carbon
materials. Starch was used as cellulosic material, jute and rice husk as lignocellulosic
materials [45]. 31
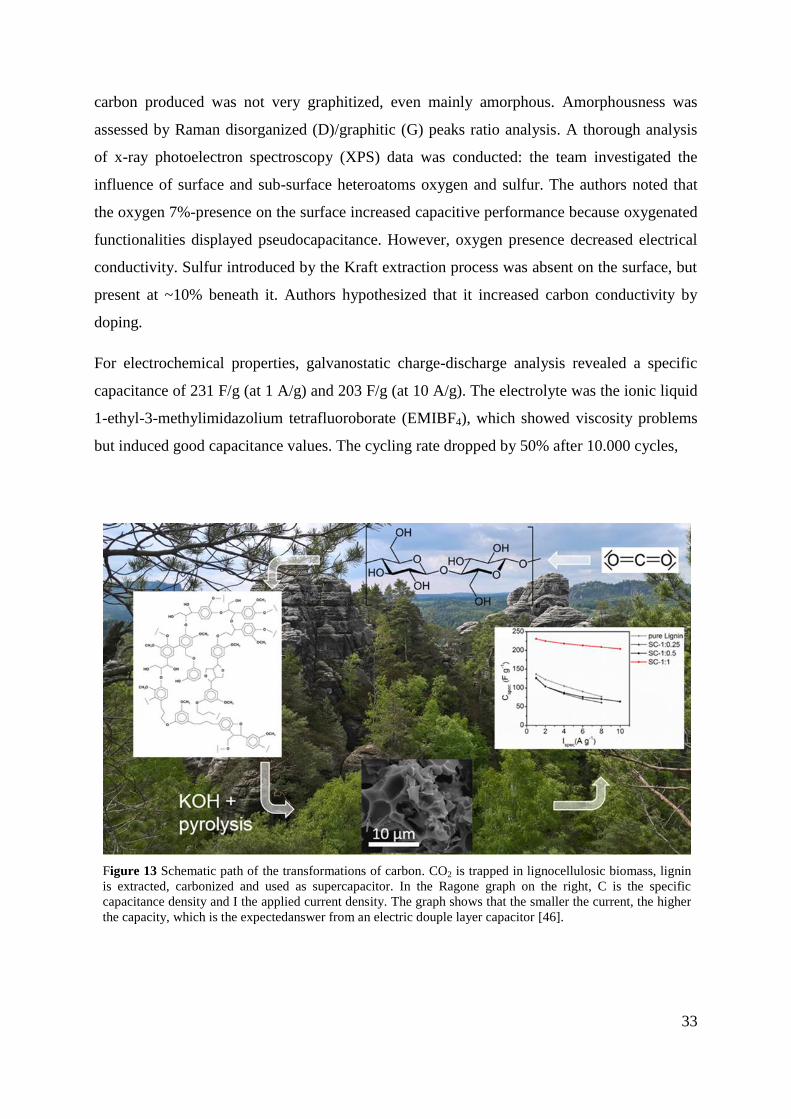
Figure 13 Schematic path of the transformations of carbon. CO2 is trapped in lignocellulosic
biomass, lignin is extracted, carbonized and used as supercapacitor. In the Ragone graph on
the right, C is the specific capacitance density and I the applied current density. The graph

8
shows that the smaller the current, the higher the capacity, which is the expectedanswer from
an electric douple layer capacitor [46]. 33
Figure 14 Schematic synthesis of carbonized lignin sheets. Lignin is dispersed in an alkaline
solution, frozen with liquid nitrogen, freeze dried and carbonized [44] 34
Figure 15 Schematic synthesis of the carbonized lignin-embedded rGO sheets [8]. 35
Figure 16 Schematic synthesis of hierarchical porous carbon. The two "red arrow" steps take
place at the same time: KOH is mixed with lignin during hydrothermal carbonization [41] 36
Figure 17 Schematic synthesis of F-127 templated porous activated carbon [51] 37
Figure 18 Schematic synthesis of electrospun carbonized lignin fibers, as well as cell
assembly for electrochemical tests. AL: alkaline-extracted lignin. ACF: activated carbon fiber
[49] 37
Figure 19 CV curve of the lignin-porous carbon mixture. Non-faradaic capacitive
contribution comes from the porous carbon. Faradaic, pseudocapacitive contribution comes
from lignin [9]. 39
Figure 20 Faradaic and non-faradaic contributions from different lignin:carbon ratios. The
best results appeared at 15:75:10 lignin:carbon:binder ratio [9]. 39
Figure 21 Visual representation of the expected microstructure of lignin, glyoxal and carbon.
The difference between (a) and (b) is the order of mixing of the three reagents [11]. 40
Figure 22 (a) Picture of a Venus flytrap [55] (b) SEM picture of a closed graphene cage .
Lignin is supposed to be engulfed in the graphene pore. The legend on the picture says 50 µm
[55]. 41
Figure 23 Schematic representation of a tannin molecule [12] 42
Figure 24 Schematic representation of a lignin fragment. The three monolignols that
constitute the polymer are highlighted [85] 43
Figure 25 Visual representation of Klason method results. A: acid soluble. AI: acid insoluble.
51
Figure 26 Schematic representation of the pH fractionation methods, as well as fraction
proportions results. The % figures are mass percentages of the lignin introduced at the
beginning of the fractionation. 52
Figure 27 Schematic representation of the organic solvent fractionation, as well as the
fraction proportions for each type of lignin. 55
9
Figure 28 Schematic representation of the acetone/water fractionation, as well as the fraction
proportions for each type of lignin. S: solid. L: liquid. Dashed box: filtration. The % figures
are mass percentages of the lignin introduced at the beginning of the fractionation. 55
Figure 30 2D slice of the Hansen space. X-axis: dispersive interactions. Y-axis: hydrogen
bonds. 57
Figure 29 2D slice of the Hansen space. X-axis: dispersive interactions. Y-axis: dipolar
interactions. 57
Figure 31 Comparative spectrum of DPL (in grey), F1 (in red) and F1C (in blue) 60
Figure 32 Comparative spectrum of the five soluble organic solvent fractions of DPL: F1 in
red, F2 in pink, F3 in blue, F4 in green and INS in black. 61
Figure 33 Zoom on zone « c » of figure 32. Comparative spectrum of the five soluble organic
solvent fractions of DPL: F1 in red, F2 in pink, F3 in blue, F4 in green and INS in black. 62
Figure 34 Zoom on zone « b » of figure 32. Comparative spectrum of the five soluble organic
solvent fractions of DPL: F1 in red, F2 in pink, F3 in blue, F4 in green and INS in black. The
arrow highlights the reduction of the 1700 cm-1
band. 62
Figure 35 Comparative spectrum of the three acetone/water fractions of DPL: SA1 in red,
SA2 in black and SA3 in blue. 64
Figure 36 Comparative spectrum of the three acetone/water fractions of BL: SA1 in red, SA2
in black and SA3 in blue. 65
Figure 37 Comparative spectrum of the three pH fractions of HL: SH1 in red, SH2 in grey
and SH3 in blue. 66
Figure 38 Comparative chromatogram of DPL fraction F1 to INS. X-axis: retention time, in
10² min. Y-axis: UV absorbance at 269 nm, arbitrary units. 69
Figure 39 Reaction between a lignin hydroxyl and TMDP to generate a phosphityl moiety.
The phosphorus atom linked to the hydroxyl hydrogen displays a different chemical shift
depending on the type of hydroxyl it reacted with [76]. 75
Figure 40 31
P NMR spectrum of HL. Each peak is assigned to a type of hydroxyl. X-axis:
chemical shift, in ppm. Y-axis: relative intensity, arbitrary units. 76
Figure 41 SEM pictures of HL-SH1. The picture on the right is a 10-fold zoom of the red
rectangle in the left picture. 79
Figure 42 SEM pictures of DPL-F3. The picture on the right is a 10-fold zoom of the red
rectangle in the left picture. 79

10
Figure 43 SEM pictures of HL-SH3. The picture on the right is a 10-fold zoom of the red
rectangle in the left picture. 79
Figure 44 SEM picture of lignin-carbon films. On the left, HL film. On the right, DPL film.
White dots are lignin aggregates. The black matrix is the carbon. 81
Figure 45 SEM picture of a particule of lignin (light grey) of DPL film sitting on top of
carbon beads (dark grey). 81
Figure 46 carbon-covered lignin particles from Chalewaert-umpon’s article [ref 1]. Please
note the difference with fig. 46, which is at the same scale . Scale: the white tick is 2 µm [9].
81
Figure 47 Schematic view of lignin-carbon mixing with glyoxal binder [ref 2]. (a) lignin is
mixed with glyoxal then with carbon (b) lignin is mixed with carbon then glyoxal.. 81
Figure 48 Cyclic voltametry curves for different lignin-carbon films at 5 mV/s in H2SO4 1N.
The reference electrode is a calomel electrode. Legend: DPL (red), HL (pink), BL (brown),
DPL-S45 (green) and DPL-INS (grey). X-axis is the working potential E against the standard
calomel electrode (in V). Y-axis is the measured current (in mA). 83
Figure 49 Comparative spectrum of BL, zoom on the 1800-900 cm-1
region. F1 in red, F2 in
pink, F3 in blue, F4 in green and INS in black. 102
Figure 50 Comparative spectrum of BL, zoom on the 3600-2700 cm-1
region. F1 in red, F2 in
pink, F3 in blue, F4 in green and INS in black. 102
Figure 51 Comparative spectrum of BL-BM 36h (black) and BL-BM-108 (red) 103
Figure 52 Comparative spectrum of the acetone/water fractions of HL: SA1 (red), SA2
(black) and SA3 (blue) 103
Figure 53 Comparative spectrum of HL, zoom on the 3600-2700 cm-1
region. F1 in red, F2 in
pink, F3 in blue, F4 in green and INS in black. 104
Figure 54 Comparative spectrum of BL, zoom on the 1800-900 cm-1
region. F1 in red, F2 in
pink, F3 in blue, F4 in green and INS in black. 104
Figure 55 Comparative spectrum of HL-BM 36 (red), HL-BM72 (black) and BL-BM108
(blue) 105
Figure 56 Comparative spectrum of HL (black) and HL-S45 (red) 105
Figure 57 2D slice of Hansen space. All dots represent one solvent that was used in this
master thesis. On the right, in blue, lignin. 108
Figure 58 2D slice of Hansen space. All dots represent one solvent that was used in this
master thesis. On the right, in blue, lignin. 108
11
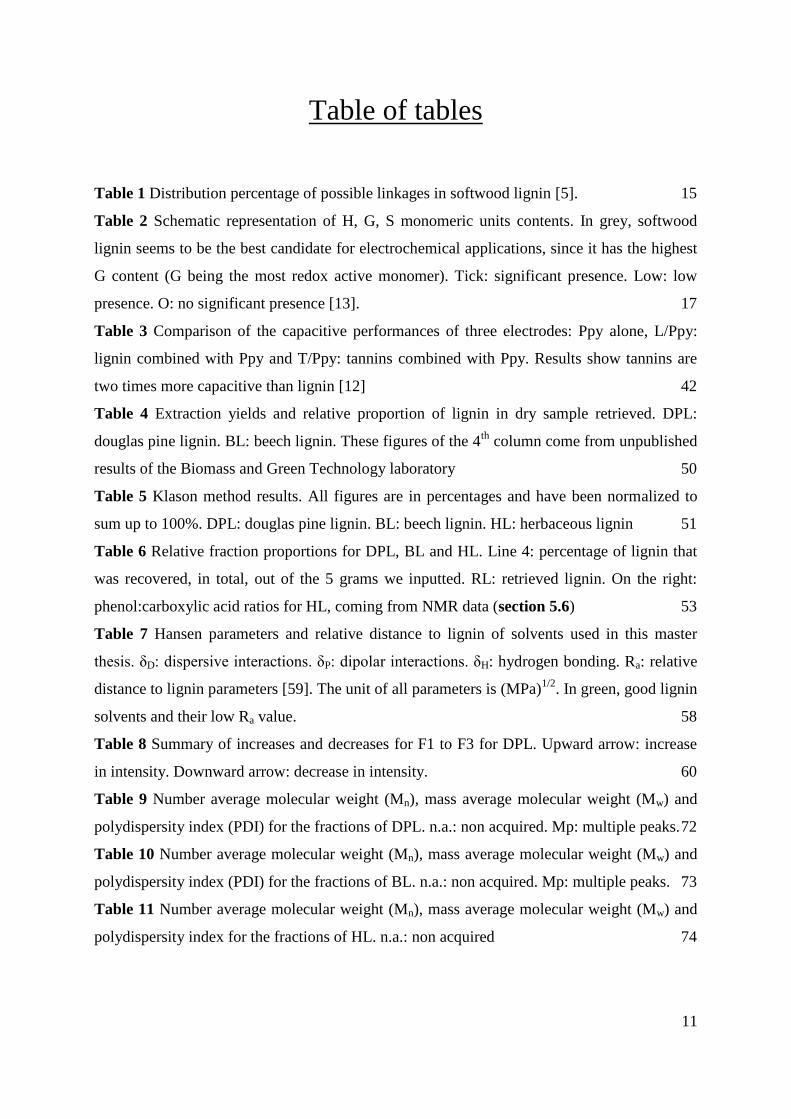
Table of tables
Table 1 Distribution percentage of possible linkages in softwood lignin [5]. 15
Table 2 Schematic representation of H, G, S monomeric units contents. In grey, softwood
lignin seems to be the best candidate for electrochemical applications, since it has the highest
G content (G being the most redox active monomer). Tick: significant presence. Low: low
presence. O: no significant presence [13]. 17
Table 3 Comparison of the capacitive performances of three electrodes: Ppy alone, L/Ppy:
lignin combined with Ppy and T/Ppy: tannins combined with Ppy. Results show tannins are
two times more capacitive than lignin [12] 42
Table 4 Extraction yields and relative proportion of lignin in dry sample retrieved. DPL:
douglas pine lignin. BL: beech lignin. These figures of the 4th
column come from unpublished
results of the Biomass and Green Technology laboratory 50
Table 5 Klason method results. All figures are in percentages and have been normalized to
sum up to 100%. DPL: douglas pine lignin. BL: beech lignin. HL: herbaceous lignin 51
Table 6 Relative fraction proportions for DPL, BL and HL. Line 4: percentage of lignin that
was recovered, in total, out of the 5 grams we inputted. RL: retrieved lignin. On the right:
phenol:carboxylic acid ratios for HL, coming from NMR data (section 5.6) 53
Table 7 Hansen parameters and relative distance to lignin of solvents used in this master
thesis. δD: dispersive interactions. δP: dipolar interactions. δH: hydrogen bonding. Ra: relative
distance to lignin parameters [59]. The unit of all parameters is (MPa)1/2
. In green, good lignin
solvents and their low Ra value. 58
Table 8 Summary of increases and decreases for F1 to F3 for DPL. Upward arrow: increase
in intensity. Downward arrow: decrease in intensity. 60
Table 9 Number average molecular weight (Mn), mass average molecular weight (Mw) and
polydispersity index (PDI) for the fractions of DPL. n.a.: non acquired. Mp: multiple peaks. 72
Table 10 Number average molecular weight (Mn), mass average molecular weight (Mw) and
polydispersity index (PDI) for the fractions of BL. n.a.: non acquired. Mp: multiple peaks. 73
Table 11 Number average molecular weight (Mn), mass average molecular weight (Mw) and
polydispersity index for the fractions of HL. n.a.: non acquired 74

12
Table 12 Relative proportions of aliphatic alcohol, H, G and S phenol, and carboxylic acid
hydroxyls. The arrows show opposite increases between aliphatic and carboxylic hydroxyls.
77
Table 13 CV specific capacity results for different lignins and lignin fractions. The third
column is the substraction of the value of the second column by the carbon blank capacitive
value (4.1 mAh/g). DPL displays a close value to our reference value [9]. 84
Table 14 Summarized overview of all characterization results concerning DPL, DPL-F1,
DPL-F3 and DPL-F4, in order to highlight crosschecks and converging trends. In the framed
boxes, “OH” means “aliphatic OH”. 86
Table 15 Summarized overview of all characterization results concerning HL, HL-SH1, HL-
SH2 and HL-SH3, in order to highlight crosschecks and converging trends. In the framed
boxes, “OH” means “aliphatic OH”. 87
Table 16 List of highlights of this master thesis, ordered by topic. 88
Table 17 List of minor hurdles met during this master thesis. On the right, the perspectives of
improvement of these problems. 89
Table 18 Ashes (inorganic salts) calculation for Douglas Pine lignin, given as an exemple.
The ashes are weighted by difference after carbonization of acid insoluble lignin. 99
Table 18bis Acid soluble lignin determination of Douglas Pine lignin by UV absorption at
280 nm. 99
Table 19 FTIR assignation table, drawn and summarized from literature. Region 1270-810
cm-1
. Black: at least two sources. Grey: one source. Sources: [3], [32], [61]–[63] 100
Table 20 FTIR assignation table, drawn and summarized from literature. Region 3460-1325
cm-1
. Black: at least two sources. Grey: one source. Sources: [3], [32], [61]–[63] 101
Table 21 Table of Hansen parameters for common solvents and polymers. The Ra was
computed from the Hansen parameters of lignin. In green, solvents with Ra < 11,5 [60] 106
Table 22 Polystyrene retention times and mass average molecular weights. The relationship
between log (Mw) and tr is linear and can be used to transform one into the other 109

13
1. Introduction
Electrochemical storage demand is rapidly growing, encouraged, among many applications,
by the recent development of electric cars, portable electronic devices and housing solar
panels. This growth seems incompatible with the growing desire for a more sustainable,
environment-friendly society [1]. This society paradigm advocates, for example, for the
reduction of pollution associated with the mining of precious metals. One of these metals is
lithium, which is used in lithium-ion batteries, the most common type of electronic devices
batteries [2]. Sustainable electrical energy storage is thus a highly desirable issue. Could
biobased molecules efficiently store large amounts of electrical energy?
Lignin (fig. 2) is the second most abundant natural biopolymer on Earth, and the most
abundant aromatic polymer. Its production is plentiful and undervalued, since it is mostly
burnt in the paper production process [3]. The complex structure and the production of lignin
are explored in section 2.1. In section 2.2, we describe two important points of battery
development: the combination of battery and capacitors in hybrid materials, called
supercapacitors, and the use of biomolecules in the fabrication of aforesaid supercapacitors. In
section 2.3, we unfold the fact that (a) lignin is already used to manufacture porous carbon, a
type of supercapacitor and that (b) the quinone-like moieties of pristine lignin are redox-active
and can reversibly store electrons, making it a suitable candidate for electrochemical storage.
Figure 2 Schematic representation of a molecule of lignin. The figure highlights the diverse number of
linkages and the reticulation of the biopolymer [75].

14
2. State of the art
2.1. What is lignin?
All terrestrial vascular plants, except algae and mosses, contain lignin. This kind of biomass is
called lignocellulosic biomass. It is composed of three architectural biopolymers: cellulose,
hemicellulose and lignin. Fig. 3 depicts the spatial arrangement of the three polymers in the
secondary wall of cell plants [4].
Cellulose is the major polymeric component of all plants. Its presence ranges from woody
plants, with 45% of cellulose in mass, to cotton, which contains up to 95% of cellulose in
mass. The polymer is made of D-glucose units linked by β-1,4 bonds. Its structure is generally
crystalline because of the many intra- and interfibrillar hydrogen bonds (though some
amorphous cellulosic fibers can be encountered). This causes cellulose to be almost
completely insoluble in organic solvents. The degree of polymerization of cellulose can
greatly vary, ranging from a dozen of units to several thousands.
Figure 3 The 3D structure of lignocellulosic biomass [4].

15
Hemicellulose is a heteropolymer. The main monomeric unit is glucose, but other monomers
include xylose, mannose, galactose, rhamnose and arabinose. They are linked by β-1,4 bonds.
The complexity of monomeric units and structural linkages requires many enzymes and/or
many selective chemical reagents to fully degrade the molecule [5].
Lignin is a crosslinked heteropolymer. It is composed of phenylpropane units linked by ether
bonds. These bonds are, for the most, β-aryl ether (β-O-4) bonds, but several other are
possible (tab. 1). Lignin has a different structure in herbaceous plants, in hardwood and in
softwood. There are three monomeric units that radically polymerize into lignin: p-
hydroxyphenyl alcohol (also called “H” unit), guaicyl alcohol (G) and syringyl alcohol (S)
(fig. 4). They bind together in multiple ways and produce complex bonds. These first
paragraphs are translated and adapted from one of our previous works [6].
Table 1 Distribution percentage of possible linkages in softwood lignin [5].

16
The three biopolymers are embedded to together toform a tight matrix. Lignin acts as glue
between cellulose-hemicellulose fibrils (fig. 3) and represents 15 to 40% of total plant mass.
The role of lignin is to make the structure water-insoluble and mechanically resistant. Its
complex structure also acts as a natural barrier against biological and chemical attacks. Lignin
is not a well-defined molecule; it is a broad label used to describe a structurally variable
polymer. Each extracted lignin differs in relative H:G:S ratio (tab. 2), in structure, in bonding
patterns (tab. 1), in remaining inorganic salts content… Moreover, on the cellular level,
environmental and developmental factors induce different structure production between
different parts of a plant [7]. Lignin production in plants can vary in quantity up to a few
percent between years, depending on seasonal conditions. This variability makes it difficult
for industries to rely on lignin for high-value applications: the production is too variable [8],
though some solutions can be found (see section 2.3).
However, extractions processes such as highly acidic or alkaline pretreatments (see section
2.1.2.2) can make up for this disparity. Or, as we will see in section 2.3, some chemical
transformations can turn lignin into a more valuable product and hence get rid of its inherent
structural discrepancy. The electrochemically active moieties of lignin are its hydroquinone-
like functions [9], [10].As can be seen in fig. 4, an end-chain quinone can reversibly accept
two electrons, turning itself into a hydroxyquinone and vice versa, which is the reason why
lignin can be used as a charge storage molecule. The H monomer (fig. 5) only has one
phenolic hydroxyl on its aromatic ring, thus it cannot undergo the redox reaction.
Figure 5 The three monomeric alcohols that
polymerize into lignin. From left to right: p-
hydroxyphenyl (abbreviated H) , coniferyl G and
synapil S. Molecules drawn with ChemDoodle ©.
Figure 4 The reversible electrochemical reaction
between hydroxyquinone (on the left) and quinone (on
the right) [9].

17
Table 2 Schematic representation of H, G, S monomeric units contents. In grey, softwood
lignin seems to be the best candidate for electrochemical applications, since it has the highest
G content (G being the most redox active monomer). Tick: significant presence. Low: low
presence. O: no significant presence [13].
Conversely, the redox reaction can be achieved in G and S monomers, which bear 1 and 2
methoxy moieties on their aromatic ring, respectively. In lignin cyclic voltammetry
measurements, the S group has a potential of 0.35V and the G group has a potential of 0.55V
[9] and thus electrochemical properties depend on G and S quantities of the extracted lignin.
In reference papers [9], [11], [12], the 0.55V guaiacyl group contribution to charge storage is
higher than the S one, and thus, one can hypothesize that the higher the G relative proportion,
the better. According to H:G:S quantifications (tab. 2) [13], softwood provides the highest G
content and consequently, one could can legitimately assume softwoods should exhibit the
highest charge storage performance.
2.1.1. Lignin is produced in paper mills and biorefineries
Around the world, every year, carbon gets trapped in biomass and the quantity of biomass
increases. Estimations of the natural worldwide production of lignin in biomass range from
0.5 to 3.6 BT (billion tons) annually. Projections show the US could reach 1.2 BT of
commercial biomass production by 2060, and that the European Union could produce up
commercial biomass to 300 MT by 2030 [14].
Lignin valorization is impacted by lignin production. The main source of lignin in the world is
the paper industry, which separates cellulose and lignin, then uses cellulose to craft paper.
Softwood Hardwood Herbaceous
H Low O ✓
S O ✓ ✓
G ✓ ✓ ✓

18
Lignin is undesirable because it is responsible for the yellowing of paper [15]. The lignin is
often burnt on site to produce heat and to retrieve the chemicals used to separate the
biopolymers (NaOH, sulfites, etc.). Lignin can also come out of biorefineries, which are
aimed at valorizing agricultural and forest waste (chopped wood, leftover crops, …) by
producing chemicals out of the left-alone lignocellulosic biomass of these two industries [16].
2.1.1.1. The paper industry produces 50 MT/y of underutilized lignin via two main processes
The industries that use the greatest amounts of wood every year are the wood industry and the
paper industry. The latter is the only one which tries to separate the three components of
wood. The paper industries produce 50 million tons of lignin every year, less than 2% of
which are commercialized – the other 98% are burnt on-site or pressed into pellets designed to
be burnt [17], [18]. Among the four main lignin extraction processes, 1100 kT of commercial
lignin are produced each year. The 2 most common extraction processes are the Kraft and the
Sulfite processes [16].
The Sulfite process produces 1000 kT of lignin every year. In the sulfite process, cellulose
and lignin are separated by sulfite (SO32-
) or bisulfite (HSO3-) anions, which depolymerize
lignin ether bonds. The resulting lignosulfonates are very different from native lignin: they
contain a lot of sulfonate functionalities, which make them highly soluble in water.
Carbohydrates (i.e. cellulose and hemicelluloses) are not totally removed, which means
lignosulfonates need further purification before being put to use [19]. The Kraft process
produces 87 kT of lignin every year. The lignocellulosic biomass is heated to temperatures
above 150°C together with Na2S and NaOH, producing in situ hydrogenosulfide anions (HS-),
which depolymerize lignin by breaking its ether bonds. The resulting lignin is recovered in an
aqueous solution called black liquor. The so-called “Kraft lignin” is soluble in alkaline media,
contains considerable quantities of sulfur-bearing moieties and has a smaller molar mass [18],
[19]. The two next processes, in terms of lignin production quantities, are the alkaline (5-10
kT per year) and the organosolv (3 kT per year) [18]. They are described in the following
section.
19
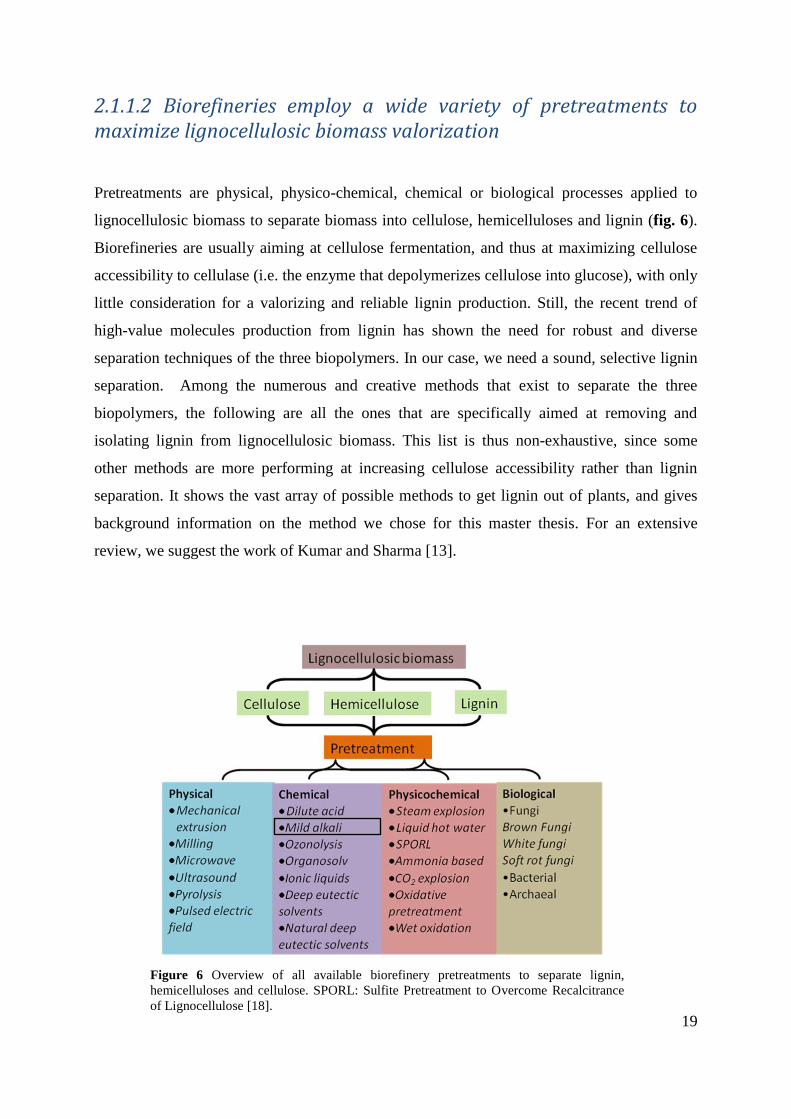
2.1.1.2 Biorefineries employ a wide variety of pretreatments to maximize lignocellulosic biomass valorization
Pretreatments are physical, physico-chemical, chemical or biological processes applied to
lignocellulosic biomass to separate biomass into cellulose, hemicelluloses and lignin (fig. 6).
Biorefineries are usually aiming at cellulose fermentation, and thus at maximizing cellulose
accessibility to cellulase (i.e. the enzyme that depolymerizes cellulose into glucose), with only
little consideration for a valorizing and reliable lignin production. Still, the recent trend of
high-value molecules production from lignin has shown the need for robust and diverse
separation techniques of the three biopolymers. In our case, we need a sound, selective lignin
separation. Among the numerous and creative methods that exist to separate the three
biopolymers, the following are all the ones that are specifically aimed at removing and
isolating lignin from lignocellulosic biomass. This list is thus non-exhaustive, since some
other methods are more performing at increasing cellulose accessibility rather than lignin
separation. It shows the vast array of possible methods to get lignin out of plants, and gives
background information on the method we chose for this master thesis. For an extensive
review, we suggest the work of Kumar and Sharma [13].
Figure 6 Overview of all available biorefinery pretreatments to separate lignin,
hemicelluloses and cellulose. SPORL: Sulfite Pretreatment to Overcome Recalcitrance
of Lignocellulose [18].

20
Oxidation
Wet oxidation
Wet oxidation consists in bringing together lignocellulosic biomass, water and oxygen in a
pressured (>120 psi) vessel, and heating the mixture at >120°C. A liquid and a solid fraction
are retrieved: the liquid fraction contains lignin and broken down hemicelluloses, while the
solid fraction contains a higher percentage of cellulose [20]. This process can be improved by
alkaline or acid treatment[21].
H2O2
H2O2 is commonly used in association with an alkaline reagent, to oxidize the three polymers.
Lignin is the most reactive of the three; it is thus selectively affected and can dissolve up to
50%. Conditions and costs are comparable to other methods [22].
Ozonolysis
Ozone induces degradation of lignin in mild conditions, and has a specific affinity for
aromatic rings. It depolymerizes lignin by breaking aromatic rings into carboxylic acids. The
structure of lignin is hugely altered. However, ozone is an expensive molecule, both
energetically and financially, and its use remains marginal [23].
Acidic pretreatment
Application of strong or dilute acids (H2SO4, HCl, HNO3, H3PO4) induces lignin degradation
and solubilization, as well as hemicellulose partial or total destruction. Temperatures up to
100-200 °C can be used. Long and precise optimizations often have to be sought [24].
Organosolv
In general, an organosolv pretreatment involves a mixture of water, organic solvent and
mineral acid – typically H2SO4. A variety of organosolv processes exist: water/ethanol,
water/formic acid, water/methanol/NaOH, water/acetic acid, water/butanol, water/acetone, to
name but a few. Organosolv processes generate very pure lignin, with less than 1% in weight
of carbohydrates. It is gaining increasing attention in the biorefinery field of research. As
alcohols, organic acids and ketones can be derived from biomass, the solvent need of the
refinery could be met by its own production, forming a more environmentally responsible
closed loop [25].

21
Ammoniac recycle percolation (ARP)
In this process, lignocellulosic biomass is subjected to aqueous ammonia (10-15%) at
temperatures between 150 and 170°C. Ammonia breaks down carbohydrates-lignin bonds and
intramolecular lignin bond. Lignin is thus in the liquid phase, which contains the ammoniac.
The liquid phase is then evaporated to be recycled. Lignin is isolated by washing. It is
partially depolymerized [26].
Room temperature ionic liquids and deep eutectic solvents
Ionic liquids are a relatively new class of solvents, made out of cations and anions only
(typically imidazolium salts), with low melting points and low vapor pressure. Some authors
report quasi-total dissolution of lignocellulosic biomass in ionic liquids, allowing a selective
precipitation of lignin and hemicelluloses with the right anti-solvent. High-purity high-
molecular weight lignins are obtained: no co-precipitated inorganic salts, no sulfur in the
lignin, and no acids or bases are needed to carry out the process. Still, ionic liquids are
expensive and need very precise optimization parameters, which are sometimes difficult to
replicate from literature [18].
Alkaline
There are three commonly used alkaline reagents to carry out this pretreatment: dilute NaOH
(most common, most efficient), KOH and Ca(OH)2 (less efficient but cheaper). They
depolymerize hemicelluloses and lignin and increase cellulose accessibility. The method is
simple and can be used at temperatures between 100°C and 200°C. Some lignin ether and
ester bonds are cleaved and lignin is solubilized in the process. It is then recovered by
acidification of the liquid phase [24], [27], [28]. This implies that the produced lignin is
sulfur-free since no sulfur is used, compared to Kraft lignin or lignosulfonates, which do
contain sulfur. Still, the alkaline-treated lignin needs further purification of the inorganic salts
introduced by neutralization of the base by the acid.
We chose this pretreatment for this master thesis for the simplicity of the reaction, the
availability of the alkaline-resistant reactor in the laboratory, low cost of the reagents and the
possibility of getting “pure” lignin (sulfur-free and salt-free after purification).

22
2.1.2. Lignin can be valorized in both low value and high value
applications
Lignin is, as for now, mainly used as a fuel in the paper industry and in biorefineries. It is a
low-grade fuel (21.13 MJ/kg) compared to gasoline (47.3 MJ/kg) or ethanol (29.7 MJ/kg)
because of its high oxygen content and over functionalization [29][30]. It has the upside of
being produced in the process and thus of being available on site. However, projections show
that the development of biorefineries that process agricultural and forestry wastes will
generate 60% more lignin than needed for energy production. Moreover, lignin has numerous
higher value applications (fig. 7). A non-exhaustive list is proposed herein.
Figure 7 Schematic representation of possible valorizations for lignin, arranged by volume and
value. Framed in black, an application that will be further explained in section 2.3 [31].

23
Materials - Lignosulfonates, i.e., lignin produced by the sulfite process (see section 2.1.2.2) are
already used in cement production as dispersant. The modified cement requires less
water in the mixture and displays improved mechanical properties [31].
- Carbon fibers are usually produced by the transformation of polyacrylonitrile (PAN);
recent studies show that 45 to 60% of steel car structure could be replaced by carbon
fiber. PAN is too expensive to be the precursor to carbon fibers. Lignin could replace
PAN as precursor. Carbonization of lignin has exhibited significant improvements in
recent years, and lignin could thus be a suitable precursor candidate for automotive
structural carbon fibers [32].
Chemistry: polymer, agriculture, fine chemicals - Lignosulfonates are used as dispersants in foams, elastomers and resins [19].
- Lignosulfonates are promising non-toxic slow-release fertilizers. Lignin acts as a
matrix that slowly opens up to release N- and P-doped chemicals [16].
- The Borregaard biorefinery, in Norway, produces vanillin (4-hydroxy-3-
méthoxybenzaldehyde) from lignin (fig. 8, 4th
colum). Vanillin is the most used
flavoring agent worldwide [20].
Figure 8 Schematic representation of the possible ways to valorize lignin. In black, we
circled the application we are aiming at: the valorization of lignin as a biopolymer [31].

24
- Lignin can be used in polyurethane blends as co-monomer thanks to its numerous
hydroxyl functions [18].
- Parkhust and coworkers demonstrated in 1982 that lignin could be hydrocracked into
pure phenol (20%) and benzene (14%). Lignin being nowadays worth 110$/T and
phenol worth ~1000$/T [33], this low yield could soon become attractive, considering
that aromatics coming from petrol are decreasing [16]. Aromatic aldehydes such as
syringaldehyde can also be produced in the process [21].
- Benzene-Toluene-Xylenes (BTX) can be obtained from lignin, but the process is far
from efficient. Catalysis and purification are still challenging [19].
Energy storage This is the subject of this master thesis. Lignin can be valorized either by carbonization to
produce porous carbon (fig. 8), or by mixing non-carbonized lignin with said porous carbon.
See section 2.3. for the development on this subject.
The valorization of lignin has gained renewed interest over the last decade because of three
factors.
(a) Genetic bioengineering: researchers were able to manufacture mutants with less
recalcitrant lignin, hence easier to extract at lower costs and higher purity [19].
(b) Advances in analytical/computational chemistry : new techniques include advances in
time of flight – second ion mass spectrometry (TOF-SIMS), atomic force microscopy
(AFM), function-detecting antibodies, high performance liquid chromatography (HPLC)
and anti-stokes Raman scattering (ARS) [34].
(c) Optimization of pretreatment methods [18].

25
2.1.3. Lignin can be fractionated according to molecular weight or
surface moieties
Lignin is usually fractionated for two reasons: (a) to diminish the polydispersity of the
polymer and (b) to retrieve fractions with different physico-chemical properties. Some
fragments may be fitter for certain applications than other, due to aggregation or surface
phenomena. Three methods are commonly used.
Ultrafiltration A continuous flow of solubilized lignin in alkaline water passes onto a cylindrical membrane
with a specific cut-off. This membrane discriminates particles according to their
hydrodynamic volume; the small particles, low molecular weight lignin and inorganic salts go
through the membrane, while the remaining high molecular weight lignin stays in a self-
looped tube to re-enter the membrane compartment to be filtered again. Different cut-offs can
be used to isolate different molecular weights. Care should be taken for the absolute
molecular weight of the separated lignin: ultrafiltration is based on hydrodynamic volume,
and biases can be induced by the aggregation of lignin in different solvent conditions [35].
See section 5.5 for details.
pH fractionation Different lignins precipitate at different pH. By adjusting pH at different values, one can
retrieve distinct fractions. The method is simple, straightforward, and only requires water and
acid; but it does not guarantee molecular weight separation, since many factors (charge,
hydrophilic/hydrophobic moieties, oxygen content, sulfur content for lignosulfonates/Kraft
lignin) can be accounted for differentiated precipitation [36].
Solvent fractionation Organic solvents can be used to separate lignin according to its solubility in these solvents.
Fractionation can be conducted either in parallel or sequentially. In the first case, a number of
samples of pristine lignin are dissolved in the corresponding number of solvents, and each
sample gets separated in two fractions, soluble and insoluble. In the second case, one given
sample is mixed in solvent A. The insoluble part is filtered off, and then mixed in a solvent B,
and so on. Multiple narrower molecular weight, functionally-enriched fractions are thus
retrieved from one sample [37], [38].
26
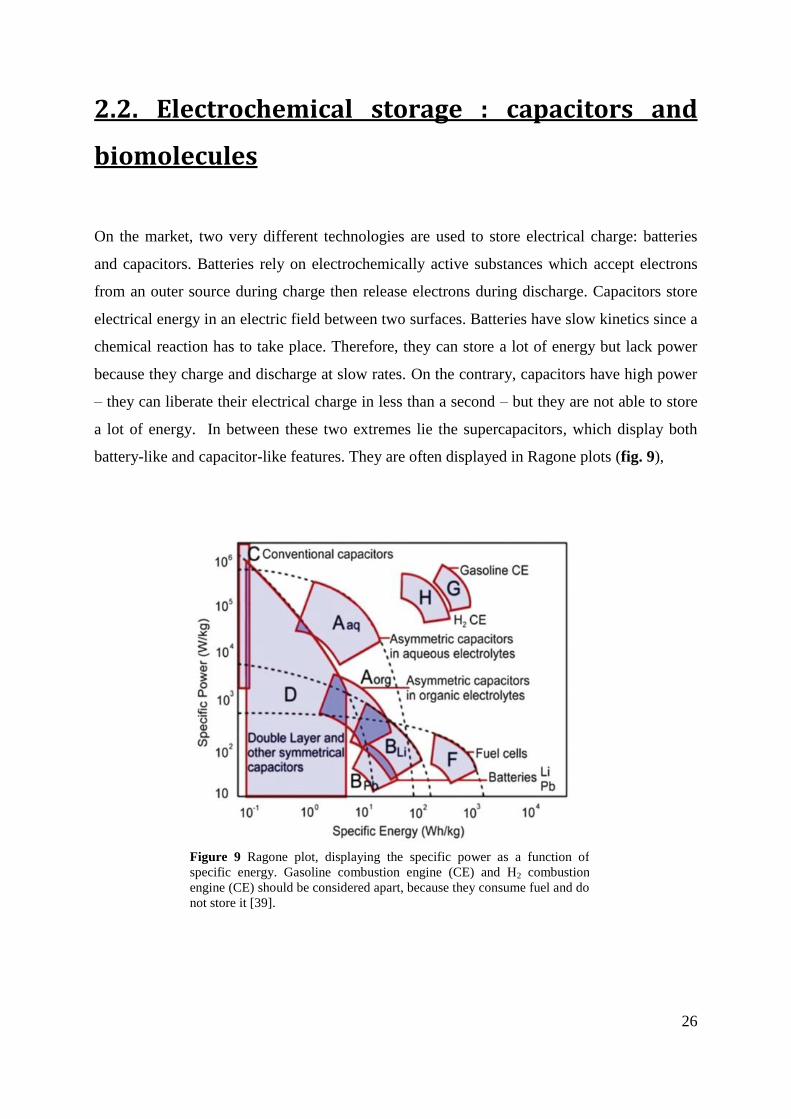
2.2. Electrochemical storage : capacitors and
biomolecules
On the market, two very different technologies are used to store electrical charge: batteries
and capacitors. Batteries rely on electrochemically active substances which accept electrons
from an outer source during charge then release electrons during discharge. Capacitors store
electrical energy in an electric field between two surfaces. Batteries have slow kinetics since a
chemical reaction has to take place. Therefore, they can store a lot of energy but lack power
because they charge and discharge at slow rates. On the contrary, capacitors have high power
– they can liberate their electrical charge in less than a second – but they are not able to store
a lot of energy. In between these two extremes lie the supercapacitors, which display both
battery-like and capacitor-like features. They are often displayed in Ragone plots (fig. 9),
Figure 9 Ragone plot, displaying the specific power as a function of
specific energy. Gasoline combustion engine (CE) and H2 combustion
engine (CE) should be considered apart, because they consume fuel and do
not store it [39].
27
which show specific power against specific energy. They are two types of supercapacitors:
electric double-layer capacitors (EDLC) and electrochemical supercapacitors (ESC). EDLCs
consist of high-surface carbon, which can store charge in the electrical double layer induced
by the electric field created when a voltage potential is applied. ESCs rely on electroactive
molecules linked to an electrode, which can undergo redox reactions at this electrolyte-
electrode interface – this phenomenon is called pseudocapacitance [39].
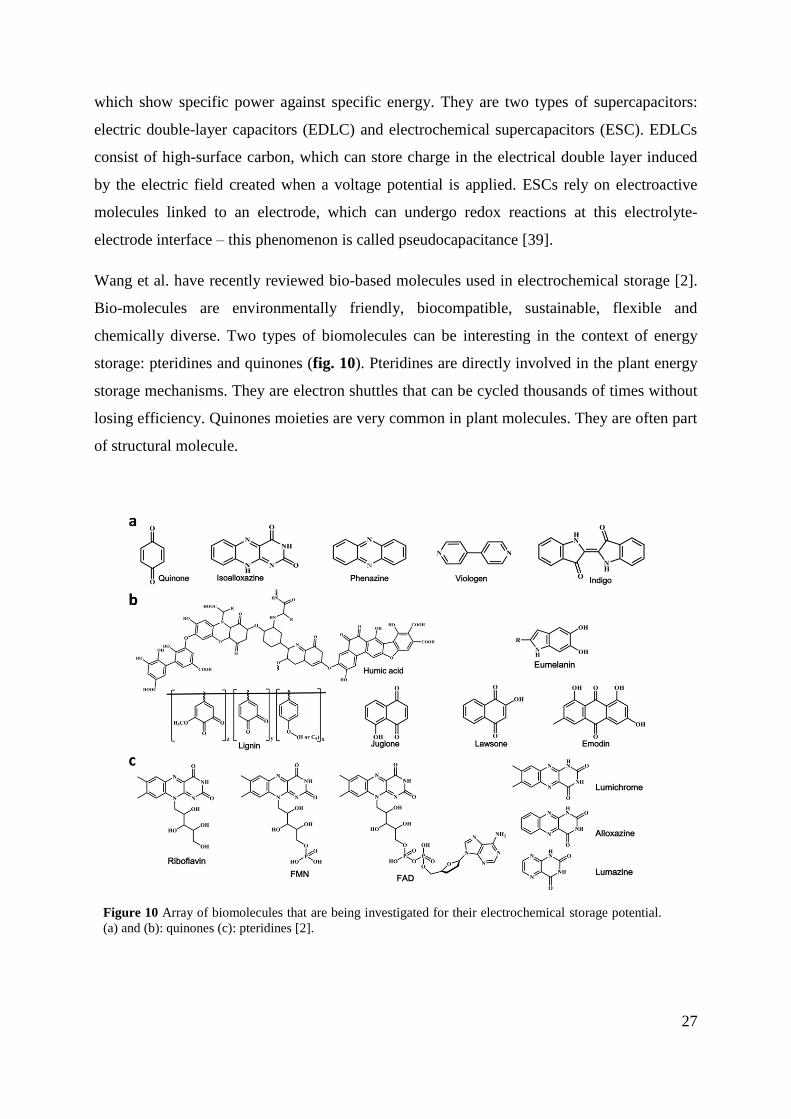
Wang et al. have recently reviewed bio-based molecules used in electrochemical storage [2].
Bio-molecules are environmentally friendly, biocompatible, sustainable, flexible and
chemically diverse. Two types of biomolecules can be interesting in the context of energy
storage: pteridines and quinones (fig. 10). Pteridines are directly involved in the plant energy
storage mechanisms. They are electron shuttles that can be cycled thousands of times without
losing efficiency. Quinones moieties are very common in plant molecules. They are often part
of structural molecule.
Figure 10 Array of biomolecules that are being investigated for their electrochemical storage potential.
(a) and (b): quinones (c): pteridines [2].

28
- Pteridines: many biomolecules possess a pteridine-like moiety (fig. 10). The
isoalloxazine part of pteridine is redox-active. Riboflavin, flavin mononucleotide
(FMN) and flavin adenine nucleotide (FAD) have already been tested in redox flow
batteries, i.e., batteries with liquid reservoirs as active materials, connected to a central
reservoir separated in two by a semi-permeable membrane. As such, flavins exhibit a
specific capacity of [100-200] mAh/g. Park et al. [40] also tailored the flavins to be
more effective by removing inactive parts of the molecule to keep the isoalloxazine
cores. Lumichrome, alloxazine and lumazine were synthesized by this method. They
all reached >200 mAh/g specific capacity values. A major advantage of flavins is their
versatility: addition of a lateral group can change the solubility, and solubility is a
crucial parameter in redox flow batteries.
- Quinones: Many biomolecules have a quinone-like moiety (fig. 10). Quinone is
redox-active and can be reversibly transformed into hydroxyquinone (fig. 5) [11].
Lignin possesses quinone motifs and has been investigated. Other molecules have also
been investigated too, like tannins. Tannins contain 5000 times more phenol per gram
than lignin because of their smaller, more condensed structure. Combined with a
conductive polymer like polypyrrole (Ppy), tannins can reach 370 F/g for 1 A/g
current and 195 F/g for 25 A/g current – these values, compared to lignin, are
outstanding [10]. However, their smaller structure means that tannins do not have a
satisfactory cycling stability: they slowly dissolve in the electrolyte. To make more
stable electrodes, microchannels that are naturally present in carbonized wood can be
used as good biosourced templates [12]. A tannin/pyrrole mixture was successfully
polymerized in situ, i.e., inside the microchannels of the carbonized wood. The
polymerization appeared to be very homogeneous judging from electronic microscopy
results. Carbonized wood also served as a good natural current collector.
According to Guo and coworkers [10], other good candidates include: melanin, which
assembles into nanoparticles; juglone and lawsone, mixed with Ppy for conductivity; and
humic acids, which displays poor cycling rate but good storage results.

29
2.3. Lignin in energy storage
The first part of this section is a review of the use of lignin in porous carbons supercapacitors;
the emphasis on method development, capacitive performance, cyclability and originality of
the synthesis method. Then, section 2.3.2 reviews four articles that are the basis for this
master thesis: the use of pristine lignin mixed with porous carbon. Porous carbon acts as an
electrical double layer capacitor, and lignin acts as a battery-type storage, making the final
material a supercapacitor [39], that is, an electrode with both capacitive/non-faradaic
contributions from porous carbon, and battery/faradaic contributions from pristine lignin.
2.3.1. Carbonization of biomass creates capacitive porous carbons
In order to get rid of fossil fuels, we need to replace many materials by bio-sourced materials
and technologies by sustainable technologies; supercapacitors (see section 2.2) could
advantageously use porous carbons to accommodate this transition. Porous carbon is a broad
term that can describe rather different materials. In general, porous carbons are pure carbon
powders, often containing graphitic sheets, with a high surface area (> 500 m²/g) due to their
intrinsic porosity. These carbons can be synthesized from biomass by carbonization under
inert atmosphere followed by activation, usually with KOH [41]. It should be noted that these
two steps often take place at the same time as the precursor can be mixed with KOH before
carbonization. Furthermore, biomass-based porous carbons are precursor-sustainable, widely
tunable, cheap and easy to make. The capacitive property of porous carbons relies on
electrical double layer capacitance: quick charge, quick discharge, but little stored energy. In
general, the higher the surface area, the larger the specific capacitance [42]–[44]. Activation is
the key to have good electrochemical performance: tests without activation show non-
activated porous carbons are way less capacitive than their activated counterparts [45].
Although this review focuses on alkaline activators, there are many activator agents, among
which KOH, NaOH, H3PO4 and ZnCl2 [46]. Often, carbonization and activation take place at
the same time, because the activating agent is also the reactant used to extract lignin from its
lignocellulosic matrix [47].

30
2.3.1.1. Carbonization of lignocellulosic biomass creates capacitive porous carbons
Biomass precursors have recently been reviewed by Tang et al. [2]. Cellulose carbonizes as
well as hemicelluloses and lignin, producing partially graphitic porous carbon. Many
precursors have been tested, among which orange peels, coconut shells, pomelo and litchi
peels, rice husk, soy beans, bamboo and human hair (fig. 11). Ojha and coworkers [45]
compared KOH-activated and non-activated precursors in terms of electrode performances.
The precursors were starch (glucosidic polymer), and two lignocellulosic candidates: jute, a
herbaceous plant, and rice husk, the hard shell or rice grains. Activation was supposed to
create pores, oxygenated surface functionalities and random defects which would increase
conductivity. It was confirmed that the activation of jute and rice husk produced amorphous
multilayer carbon sheets, with few surface functionalities (fig. 12).
Cyclic voltammetry measurements showed much higher specific capacitance for activated
materials than for non-activated ones, thus showing that activation creates materials with
Figure 11 Adapted from table 1 in Tang et al, 2017 [2]. C: specific capacitance density, I:
current density. KOH: activator. Sources for pictures: [76]–[84].

31
higher specific surfaces. This higher charge was also caused by a higher number of surface
functionalities. Activated carbon from jute had the highest specific capacitance: 476 F/g (at
0.2 A/g) and 200 F/g (at 10 A/g), which was hypothesized to be caused by the higher lignin
content of the precursor (%lignin in dry jute: 26%; dry rice husk: 16%). The electrolyte was
aqueous H2SO4, 0.5M. The authors compared the results for jute and rice husk to those of
starch, which did not contain lignin. They concluded that starch produced activated carbon
with low conductivity compared to the two others, and that “synergistic effect of lignin and
cellulose in the biomass is the key factor for high specific capacitance”.
We just explained two examples of lignocellulosic biomass carbonization. Now, let us focus
on the carbonization of lignin on its own, separated from cellulose and hemicellulose. Since
lignin already contains aromatics, research teams expected it to create more capacitive
graphitic porous carbon. The next section is a short review of important articles.
.
Figure 12 Comparison between non-activated carbon materials and activated
carbon materials. Starch was used as cellulosic material, jute and rice husk as
lignocellulosic materials [45].

32
2.3.1.2. Carbonization of pristine lignin creates capacitive porous carbons
In addition to exhibiting good electrochemical performances, electrodes obtained by lignin
carbonization have another major advantage. As mentioned in section 2.1., natural lignin
production is highly variable – in structure, relative H:G:S contents, and purity – and this
carbonization smoothens this lignin disparity, making lignin use more robust, reliable, and
less industrially risky. However, as lignin is carbonized above 700°C, experiments are often
conducted between 700°C and 2400°C. This requires large amounts of energy [37].
Carbonized lignin has remarkable capacitive properties
Hu and coworkers [48] synthesized carbon nanoplates by simultaneous carbonization and
alkaline (NaOH or KOH) activation of alkaline-extracted lignin. The simplicity of the method
lies in the same reactant (NaOH or KOH) being used for extraction and porous carbon
activation. NaOH vs. KOH activation efficiency was studied. The synthesized carbons were
described as graphite-like circular nanoplates, 10-25 nm in diameter, separated by amorphous
carbon clusters. Brunaueur-Emmet-Teller (BET), SEM and transmission electron microscopy
(TEM) analysis allowed to conclude that the micro- and mesostructures were slit-like, and
that the aggregated nanoplates resembled graphene structure with its typical π-π stacking.
Raman spectrometry showed that increases in temperature and in impregnation time led to a
broadening of micropores into mesopores, beneficial for high surface area. On the contrary,
increase of base concentration boosted the carving of mesopores into micropores. For the
electrochemical properties, NaOH-activated carbons performed better than KOH-activated
carbons : 248 F/g (at 20 mV/s) for NaOH and 149 F/g (at 20 mV/s) for KOH, as well as 95%
and 92% resilience, respectively, after 5000 cycles. The electrolyte was not mentioned.
Klose and coworkers [46] synthesized porous activated carbon in a two-step process (fig. 13).
First, Kraft lignin was carbonized with KOH as activating agent, then it was washed to
remove any side-products. As for structure, the team noticed that (a) the pore volume
increased with KOH concentration, which was demonstrated by BET data and that (b) the
33
carbon produced was not very graphitized, even mainly amorphous. Amorphousness was
assessed by Raman disorganized (D)/graphitic (G) peaks ratio analysis. A thorough analysis
of x-ray photoelectron spectroscopy (XPS) data was conducted: the team investigated the
influence of surface and sub-surface heteroatoms oxygen and sulfur. The authors noted that
the oxygen 7%-presence on the surface increased capacitive performance because oxygenated
functionalities displayed pseudocapacitance. However, oxygen presence decreased electrical
conductivity. Sulfur introduced by the Kraft extraction process was absent on the surface, but
present at ~10% beneath it. Authors hypothesized that it increased carbon conductivity by
doping.
For electrochemical properties, galvanostatic charge-discharge analysis revealed a specific
capacitance of 231 F/g (at 1 A/g) and 203 F/g (at 10 A/g). The electrolyte was the ionic liquid
1-ethyl-3-methylimidazolium tetrafluoroborate (EMIBF4), which showed viscosity problems
but induced good capacitance values. The cycling rate dropped by 50% after 10.000 cycles,
Figure 13 Schematic path of the transformations of carbon. CO2 is trapped in lignocellulosic biomass, lignin
is extracted, carbonized and used as supercapacitor. In the Ragone graph on the right, C is the specific
capacitance density and I the applied current density. The graph shows that the smaller the current, the higher
the capacity, which is the expectedanswer from an electric douple layer capacitor [46].

34
which was supposedly caused by either the decomposition of the ionic liquid electrolyte at a
too high voltage window (3V) or because of the partial degradation of oxygen-bearing surface
functionalities. Ionic liquids thus seem promising but in need of optimization for cycling
stability. It should be noted that, in addition to voltage degradation, oxygen-bearing and
sulfur-bearing surface functionalities have been shown to catalyze electrolyte degradation
[46].
Liu and coworkers [8] synthesized carbon nanosheets by ice templating softwood alkali
lignin. An aqueous suspension of lignin was immersed in liquid nitrogen, creating lignin
sheets, which were then carbonized at 900°C for 6h (fig. 14). The authors wanted to
determine the influence of precursor lignin concentration on the reaction. It was observed that
the lower the lignin concentration in the suspension, the better the electrochemical properties.
When the concentration diminished, the produced carbon was more graphitized; and when
concentration increased, the size of the carbon nanosheets increased but the specific area
decreased. These carbonized nanosheets were partially graphitized. Higher lignin suspension
concentration also increased oxygen presence on the surface, enhancing pseudocapacitance.
The authors insisted on the absence of activating agent for the synthesis: with no byproduct,
the method possesses reduced environmental impact. The only reactant was lignin itself. They
hypothesized that the <2 nm micropores were caused by the escape of CO2 and H2O gases
during carbonization, and that these spontaneously created gases could suffice to create small
micropores and advantageously replace KOH activation.
Figure 14 Schematic synthesis of carbonized lignin sheets. Lignin is dispersed in an alkaline solution,
frozen with liquid nitrogen, freeze dried and carbonized [44]

35
The electrochemical performances were 281 F/g (at 0.5 A/g) and 103 F/g (at 20 A/g). Stability
reached 91% resilience after 5.000 cycles. The electrolyte was aqueous H2SO4, 1M.
Tran and coworkers [44] synthesized a porous activated carbon (fig. 15) by mixing graphene
oxide (GO) and organosolv hardwood lignin in a suspension. Then, they simultaneously
reduced the GO and carbonized/activated lignin into porous carbon. The idea was to use
lignin as a spacer between reduced GO (rGO) sheets, which, because of their graphene
structure, had a tendency to stack up with π-π bonding. This π-π bonding taking place
between rGO and lignin matrix also ensured good stability and suppressed the need for a
carbon-lignin bindern but was too strong and needed to be decreased. To do so, the authors
tested proportions of 0 to 85% of lignin in their suspension, and found out that specific
surface increased from 19 m² to 1280 m² in specific surface area. The flexibility of the casted
films was intermediate between brittle lignin and flexible graphene. Optimization showed that
the 85:15 lignin:GO ratio is best, creating a wide carbon matrix with dispersed, loosely
stacked graphene sheets. In accordance with literary hypotheses, increased KOH
concentration caused more etching of the porous electrode, creating more and more slit pores
(~1 nm). The electrochemical performances displayed were 200 F/g (at 20 mV/s) and 160 F/g
(at 1 V/s). The electrolyte was aqueous H2SO4 1M.
Figure 15 Schematic synthesis of the carbonized lignin-embedded rGO sheets [8].

36
Guo and coworkers [41] used lignin coming from enzymatic hydrolysis to create hierarchical
3D porous carbon without template. Template casting is the standard way of producing
hierarchical porous carbon. Their new method consisted of a hydrothermal carbonization
followed by high-temperature KOH activation (fig. 16). Their work showed that increasing
KOH concentration increased surface area, but decreased yield, since more carbon had been
etched off by the activating KOH. The electrode was tested in two electrolytes: KOH 6M, and
an ionic liquid, 1-ethyl-3-methylimidazolium bis(trifluoromethylsulfonyl)imide (EMIMTFSI).
They reached a good specific capacitance, even at high currents: 420 F/g (at 0.1 A/g) and 284
F/g (at 100 A/g) in KOH; 218 F/g (at 1 A/g) and 159 F/g (at 50 A/g) in the ionic liquid. After
5000 cycles, the electrode showed 99% capability retention in KOH and 90% retention in the
ionic liquid. Impedance measurements showed that the ionic liquid was more resistive (4.2
ohms vs. 1.39 ohms in the KOH system), thus causing a decrease in the overall specific
capacitance. The researchers also hypothesized that pore size was a major factor for ionic
liquid use, as the solvent ions could hinder one another in nanopores. Guo also furthered the
point of Hu about pore size: the specific capacitance is directly impacted by the ratio size of
pores/size of the electrolyte.
Figure 16 Schematic synthesis of hierarchical porous carbon. The two "red arrow" steps take place at the
same time: KOH is mixed with lignin during hydrothermal carbonization [41]

37
Two research teams synthesized activated carbon fibers by electrospinning alkaline solutions
of lignin (fig. 17), producing highly packed mats of carbon nanofibers with high specific area
(>500 m²/g). Electrochemical performance were 64 F/g at 0.5 A/g, 90% retention after 6000
cycles [49] and 196 F/g at 0.5 A/g, 95% retention after 5000 cycles [50] in 6M NaOH
electrolyte [49], [50].
Using poly(ethylene oxide) (PEO)/poly(propylene oxide) PPO copolymers and triblock
polymer surfactant F127 as templates, the authors synthesized a mesoporous activated carbon
from pre-cross-linked lignin with KOH, at 1000°C (fig. 18). Results showed 97 F/g results at
0.1 A/g [51].
Chen et al. [52] implemented the same method as Dipendu et al. [51] with a twist: the addition
of nickel oxide particles. NiO was another candidate to electrode manufacturing. The low
conductivity, poor stability, but excellent specific capacitance of NiO was complementary to
the characteristics of carbon: high conductivity, good stability, but mediocre specific
capacitance compared to transition metals. The resulting material was a mix of hierarchical
porous carbon and NiO nanoparticles, with good performance: 880 F/g at 1 A/g, with 93.7%
capability retention after 1000 cycles.
Figure 17
Figure 17 Schematic synthesis of F-127 templated
porous activated carbon [51].
Figure 18 Schematic synthesis of electrospun
carbonized lignin fibers, as well as cell assembly
for electrochemical tests. AL: alkaline-extracted
lignin. ACF: activated carbon fiber [49].

38
Carbonized lignin is a good battery electrode
Lithium-ion batteries electrodes are usually made out of graphite. During charge, lithium ions
migrate toward the graphitic anode, and insert themselves in between the graphene layers of
graphite [39]. At charge, the ions migrate back to the other electrode.
Tenhaeff and coworkers [53] proposed to use the porous activated carbon created from lignin
carbonization to build an anode for lithium-ion batteries, taking advantage of the capacitive
properties and graphitic structure of lignin-derived porous carbon. Lignin was extracted via
Alcell pretreatment (organosolv treatment, see section 2.1.1.2.), melted into fibers and
carbonized at >1000°C. The resulting nano-crystalline fiber network was tested in a cell
against a lithium counter electrode in a conventional lithium ion battery electrolyte, 1.2 M
LiPF6 in ethylene carbonate/dimethyl carbonate. The Coulombic efficiency measured were
over 99.9% and comparable to conventional lithium-ion battery performances [39].
Other types of batteries could be enhanced by lignin use. Zhang et al. [17] used the same
carbonization-activation reaction than others in section 2.3.1.2., but with lithium-selenium
battery. The hydrothermal pretreatement with alkaline activation remains, but selenium is
added in the process to be encapsulated in the porous carbon. It is mentioned that both Li-S
and Li-Se batteries could benefit from the hierarchical porous carbon structure to avoid the
loss by solubilization of polyselenide and polysulfide which are a major hurdle to battery
optimization. No clear value for an optimized battery or proto-battery was reported.

39
2.3.2. Non-carbonized lignin is used synergistically with porous
carbon to create supercapacitors
Carbonizing lignin at >900°C to produce carbonaceous materials is a process that requires
massive amounts of energy and yields are often very low (<10%) [48]. This low yield is
caused by the creation of pores driven by alkaline etching and thus removal of material from a
“block” of lignin [55]. Using pristine lignin instead of carbonized lignin as one of the main
ingredient of the electric charges storage system would therefore be a very attractive
alternative. This approach has been pioneered by Chalewaert-umpon and coworkers in two
recent publications [9], [11]: they used pristine lignin as redox-active molecule, instead of
transforming it into porous carbon.
In the first work [9], Kraft lignin was blended with activated carbon and polyvinylidene
fluoride (PVDF) as binder, in order to combine electrical double layer capacitance (non-
faradaic capacitance) from the activated carbon, and pseudocapacitance (faradaic capacitance)
from the lignin molecules (fig. 19). The two effects supposedly combined to increase the total
specific capacity. The activated carbon was also used to counteract the isolating nature of
lignin, which would have hampered its performance as electrode. By simple mixing of the
two powders, the authors reached a reasonable 80 mAh/g with a non-optimized system. They
Figure 19 CV curve of the lignin-porous carbon
mixture. Non-faradaic capacitive contribution comes
from the porous carbon. Faradaic, pseudocapacitive
contribution comes from lignin [9].
Figure 20 Faradaic and non-faradaic contributions
from different lignin:carbon ratios. The best results
appeared at 15:75:10 lignin:carbon:binder ratio
[9].

40
also noticed that (a) the specific capacity increased with acidic electrolyte (HClO4)
concentration, which was expected from a proton-dependent reaction (see section 2.1) and
that (b) the best most performing electrode had a ratio of 15:75:10 lignin:carbon:binder, both
in faradaic and non-faradaic capacity (fig. 20). This indicated that complex interactions
between lignin and the porous carbon were in place. These interactions depended on
insulation, electrolyte penetration and lignin-carbon microstructure. Stability was estimated at
100% after 100 cycles by galvanostatic charge/discharge. Impedance measurements
confirmed the major role of lignin microstructure, because it impacted drastically the
electrode performance. Lignin and porous carbon being both bio-sourced, this study opened
the path toward a totally bio-sourced battery.
The second article from Chaleawlert-umpon and coworkers [11] built on the results of the
first article: the main change was the use of glyoxal instead of PVDF as binder. Glyoxal is
bio-sourced and biodegradable, while PVDF is not. In addition, glyoxal is known to cross-link
different strands of lignin, which could increase the electrode stability. The authors
investigated the best order to mix the three constituents of the electrode, as well as the
temperature treatment for the electrode fabrication. They found out that glyoxal ought to be
added after the mixing of carbon and lignin, because cross-linking before the mixing
produced small particles of aggregated lignin that were too insulating (fig. 21). On the
contrary, when cross-linked after mixing, lignin was dispersed across the entire carbon
surface, increasing electrochemical properties, i.e. conductivity and capacity. Yet, they did
Figure 21 Visual representation of the expected microstructure of lignin, glyoxal and carbon. The difference
between (a) and (b) is the order of mixing of the three reagents [11].

41
not reach higher specific capacity than in the first article (80 mAh/g). The temperature
treatment investigation showed that cross-linking was maximum at 80°C, but that 60°C was
preferable because at 80°C, phenolic –OH would tended to react together and polymerize,
which is undesired since they are the redox-active moieties of the molecule.
Geng and coworkers [55] approached electrode improvement with an original solution:
biomimetic mimicry of a Venus flytrap, the carnivorous plant seen in fig 22A. The problems
that this study tried to tackle were that (a) lignin is an insulator, thus a poor current collector
and that (b) lignosulfonates, the sulfonated version of lignin, quickly dissolve when immerged
in an aqueous solution. The proposed solution was to create a 2D graphene plane, to add
lignosulfonate onto it, then by reduction, close the plane on itself like a flytrap, so that lignin
would still be accessible to the electrolyte but unable to escape the graphene cage (fig. 22B).
The aromatics of lignin were expected to guarantee that it would be solidly π-π linked to the
graphene. SEM pictures (fig. 22B) showed promising results and cyclic voltammetry showed
reasonable specific capacitance values: 226 F/g (at 0.8 A/g) and 166 F/g (at 2 A/g). The
cycling stability, which was the expected main improvement, was 88% after 15.000 cycles.
The authors also studied the importance of electrode mass loading. At higher loadings, the
thickness of the lignin film increased, and as lignin is insulating, it just decreased the
accessibility of the lignin connected to graphene beneath it and decreased the overall specific
capacitance.
Figure 21 ¨
A B
Figure 22 (a) Picture of a Venus flytrap [55] (b) SEM picture of a closed graphene cage . Lignin is
supposed to be engulfed in the graphene pore. The legend on the picture says 50 µm [55].
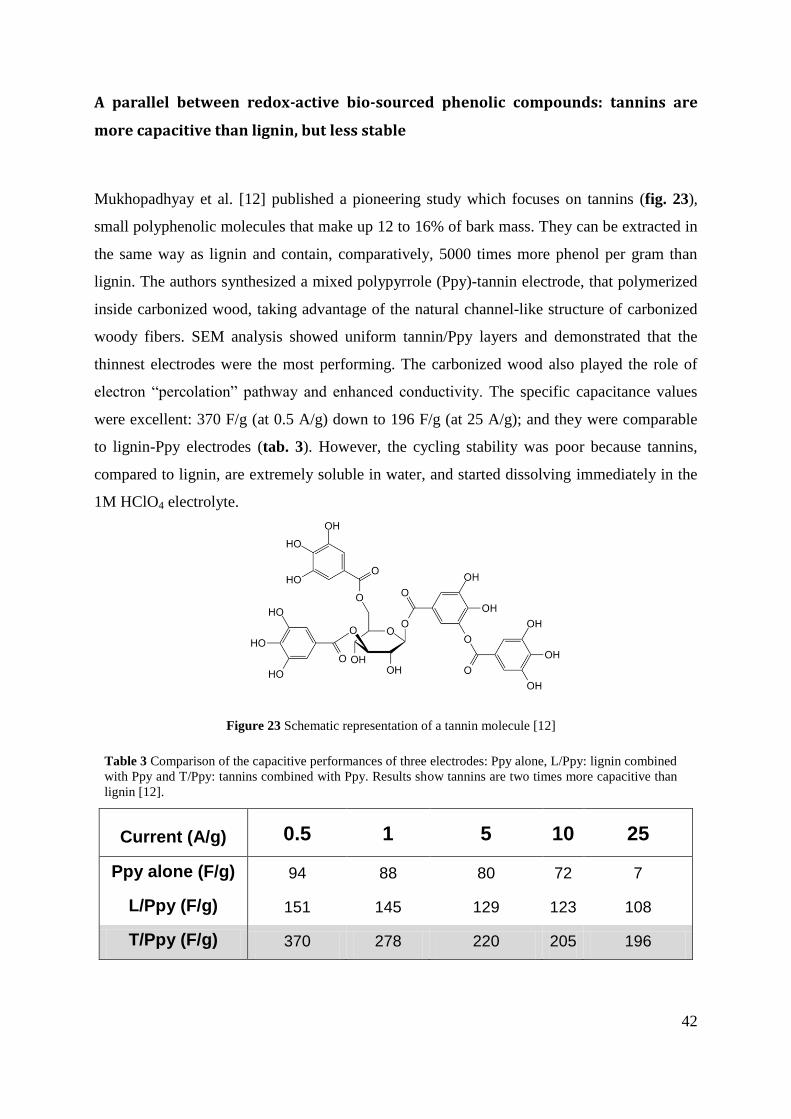
42
A parallel between redox-active bio-sourced phenolic compounds: tannins are
more capacitive than lignin, but less stable
Mukhopadhyay et al. [12] published a pioneering study which focuses on tannins (fig. 23),
small polyphenolic molecules that make up 12 to 16% of bark mass. They can be extracted in
the same way as lignin and contain, comparatively, 5000 times more phenol per gram than
lignin. The authors synthesized a mixed polypyrrole (Ppy)-tannin electrode, that polymerized
inside carbonized wood, taking advantage of the natural channel-like structure of carbonized
woody fibers. SEM analysis showed uniform tannin/Ppy layers and demonstrated that the
thinnest electrodes were the most performing. The carbonized wood also played the role of
electron “percolation” pathway and enhanced conductivity. The specific capacitance values
were excellent: 370 F/g (at 0.5 A/g) down to 196 F/g (at 25 A/g); and they were comparable
to lignin-Ppy electrodes (tab. 3). However, the cycling stability was poor because tannins,
compared to lignin, are extremely soluble in water, and started dissolving immediately in the
1M HClO4 electrolyte.
Current (A/g) 0.5 1 5 10 25
Ppy alone (F/g) 94 88 80 72 7
L/Ppy (F/g) 151 145 129 123 108
T/Ppy (F/g) 370 278 220 205 196
Figure 23 Schematic representation of a tannin molecule [12]
Table 3 Comparison of the capacitive performances of three electrodes: Ppy alone, L/Ppy: lignin combined
with Ppy and T/Ppy: tannins combined with Ppy. Results show tannins are two times more capacitive than
lignin [12].

43
2.4. State of the art: a summary
Section 2.1 explained what lignin was: a natural reticulate heteropolymer made from 3
phenylpropane alcohols, labeled G, H and S (fig. 24). Lignin could be extracted by a number
of chemical treatments. Among them, we chose the alkaline pretreatment for this master
thesis. Lignin is already valorized in the polymer and material industries, and, more recently,
was used in electrochemical storage. Lignin is very polydisperse and needs to be fractionated
for some applications. Methods like ultrafiltration, organic solvents fractionation and pH
fractionation can achieve that. In section 2.2, we explained what a supercapacitor was and
how biomolecules were used in batteries and capacitors.
In section 2.3, we explained that lignin was a redox-active molecule that had already shown to
be an interesting active material for batteries when associated with other polymers or when
transformed into porous carbons. Lignin to porous carbon conversion included diverse
processes such as alkaline-activated hydrothermal carbonization, polymer templating and
electrospinning. Lastly, recent studies reported the use of lignin in association with porous
carbon, to add a pseudocapacitive property to the specific capacitance of porous carbon
In summary, lignin can be used as a precursor to electrode material (porous carbon) and as a
battery redox-active molecule thanks to its unique aromatic reticulate structure. As for now,
lignin is mainly valorized in low-value applications, but these electrochemical properties pave
the way towards the valorization of lignin in complex systems such as supercapacitors. What
hinders its advances in technical applications is a lack of fundamental knowledge about the
structure of lignin, its properties and its possible transformations.
Figure 24 Schematic representation of a lignin fragment. The three monolignols that constitute the
polymer are highlighted [85].

44
3. Objectives
The two articles of Chalewaert-umpon and coworkers [9], [11] open a new research field in
the chemistry of lignin: the use of lignin as redox-active molecule to increase the faradaic
storage of supercapacitors. Their pioneering works establish a proof-of-concept, as well as
some first benchmarks such as optimal temperature and ideal mixing order of the reactants
[11]. Still, the literature lacks fundamental knowledge about multiple facets of lignin, such as
the links between structure and electrochemical properties, or the links between solubility,
molecular weight and functionality content. This lack hinders the rationalization of
experimental results and consequently, the advances needed to improve those results. The
objective of this work is to build up on Chalewaert-umpon’s results, with a specific focus on
the influence of molecular weight and chemical moieties of lignin on its electrochemical
performances. We also wanted to observe if the alkaline pretreatment would cause different
electrochemical performance than Chalewaert-umpon’s Kraft sulfur-containing lignin.
To investigate the influence of molecular weight and chemical moieties on these
performances, we chose to fractionate lignin. Three methods were chosen: pH fractionation,
acetone/water mixtures and successive organic solvent dissolutions. The obtained fractions
were characterized by HPSEC, FTIR, NMR, SEM, Klason method for lignin impurities
dosage and electrochemically tested by CV.
By corollary, other major fields of research for lignin were addressed and furthered, such as
(a) the solubility of lignin in organic solvents, and in different pH conditions, (b) the search
for a suitable molecular weight analysis for lignin and (c) the difficulty of lignin chemical
moieties characterization due to its intrinsic heterogeneity.
45
4. Materials and methods
Materials
Three different lignins were analyzed in this master thesis: Douglas pine (DPL), Beech (BL)
and Herbaceous (HL). Douglas pine (Pseudotsuga menziesii L.) chips were obtained from a
milled sample harvested in Gembloux Agro Bio Tech’s campus. Chips were between 1 and 5
cm in length and 1-5 mm wide. Beech (Fagus Salvatica L.) chips were obtained from trees cut
on January 31, 2016, located in the most southern part of Belgium and ball milled to 4-mm
wide particles. ProtobindTM
P1000 lignin was a commercial mixed wheat straw/Sarkanda
grass soda lignin bought from Green Value S.A.
All chemicals were obtained from either Sigma-Aldrich or VWR and used as received.
Lignin Extraction
Lignin was extracted from either Douglas Pine (samples labeled D1 or D2) or Beech (labeled
H1). The dry milled pieces of wood were introduced in a 5050 Parr reactor, along with NaOH
3% (w:v), with a ratio 1:10 sample:solvent (w:v). The mixture was heated at 160°C for 30
minutes. Solid residue and black liquor were separated by centrifugation (10.000 RPM, 7
minutes). The lignin was precipitated out the black liquor by bringing the pH to 2 using
concentrated H2SO4. The lignin was separated from the solution by centrifugation (10,000
RPM, JA-10, 7 minutes).
Dialysis
The black, gooey solid was then transferred to dialysis tubes (cut-off 1 kDa), then immersed
in demineralized water. The dialysis was monitored by conduction measurement. Water was
replaced by fresh demineralized water as soon as conductivity exceeded 200 µS/cm. Dialysis
lasted between 3 and 5 days, depending on salt content and tube length. Dialysis was stopped
when conductivity was under 10 µS/cm for at least 3 hours straight. The samples were then
frozen and lyophilized.

46
Ball-milling
A total of 5 g of lignin were added in a ceramic-coated titanium vessel, together with 2 drops
of ethanol. It was ball-milled 3 times 36h, for a total of 108h per sample. After 36h and 72h, 1
gram of lignin was removed and stocked for further analysis.
Polymeric Sonication
Lignin was mixed with solvent (aqueous NaOH 5% (w:v)) with a 1:10 ratio (w:v and
submitted to a 12-mm wide sonication probe at 35% amplitude for 45 minutes. The slurry
mixture was precipitated at pH = 2 using concentrated H2SO4, and centrifuged at 1100 g for 7
minutes, followed by washing to remove Na2SO4 salts.
HPSEC
HPSEC solvent was prepared by mixing 6.9 g of NaH2PO4 with 3.2 g of NaOH in 1 liter of
deionized water. pH was then brought to 12 with dropwise addition of NaOH 6M. The
solution was filtered on a porosity 3 filtering crucible with a porosity of 100-140 µm and
sonicated for 15 minutes to degas. The standards were sodium polystyrenesulfonate beads of
1000, 4000, 16000, 32000 Da. The column was a TSK Gel G3000 PWXL eluted at 0.9
mL/min in a Waters 2695 equipment. A total of 9 mg of lignin in 3 mL of solvent were
magnetically stirred for at least 48 hours, then filtrated on 0.45 µm nylon syringe filters. The
elution flow was 0.9 mL/minute.
HPLC-SEC solvent was 0.5% (w:v) LiBr in N,N-dimethylformamide (DMF). LiCl had a
disaggregating role. Polystyrene standards were made by dissolving 15 mg of polystyrene
beads in the eluent. Standards included 1kDa, 2kDa, 3 kDa, 10 kDa, 20 kDa and 30 kDa . The
column was a Styragel HR3 THF placed on a Agilent Technologies 1200 series. In this case,
9 mg of acetylated lignin (see “Lignin acetylation”) or pristine lignin in 3 mL of solvent were
magnetically stirred for at least 2 hours, and then filtrated on 0.45 µm nylon syringe filters.
The elution flow was 0.4 mL/minute.

47
Fractionation
Lignin was either submitted to fractionation by pH, fractionation by acetone/water mixtures or
fractionation by organic solvents. Fractionation by pH [36] was performed by dissolving 5g
of lignin in 200 mL of NaOH 5% (w (g): v (mL)) and magnetically stirring for 1 hour. pH was
then brought to 8 by slow and careful adding of concentrated H2SO4 and NaOH 6M when the
value of pH = 8 was exceeded. The precipitate was separated from the solution by
centrifugation (7 minutes, 1100 g), then washed with 50°C acidified water (deionized water
acidified to pH=2 by concentrated H2SO4) to remove inorganic salts. The solid was then
frozen and lyophilized. The same protocol was applied at pH=5 and pH=2. Fractionation by
acetone/water mixtures [38] was done as follows: 5g of lignin were magnetically stirred in
100 mL of a mixture 60:40 acetone:water (v:v) for at least two hours. The mixture was
filtered on ceramic porosity 2 filters and washed two times with the solvent. The filtrate was
rotary evaporated and freeze dried. The solid residue was submitted to the same protocol but
with a 30:70 acetone:water (v:v) mixture. Fractionation by organic solvents [37] was
performed as follows: 5g of lignin were dissolved in 100 mL of an organic solvent and
magnetically stirred for at least two hours. The mixture was filtered on ceramic porosity 2
filters. The solid residue was washed two times with 15 mL of the organic solvent, and then
was used with another organic solvent. The filtrate was rotary evaporated, the solid residue
washed off with 10-20 mL of deionized water and freeze dried. The organic solvent sequence
was: ethyl acetate, methyl ethyl ketone, methanol, acetone and dioxane:water 95:5 (v:v) .
Lignin Acetylation [56]
To 1 g of lignin mixed in 23 mL of acetic anhydrous, we carefully added 2.3 mL of acetyl
bromide. The mixture was magnetically mixed for 24 hours. Then, 30 mL of ethanol were
added to quench the reaction and the solvent removed by rotary evaporation. Next, 30 mL of
ethanol were twice added and evaporated, to remove the solvent entirely. The solid residue
was either kept as such or submitted to purification. For purification, 10 mL of CHCl3 were
added to 0.5 g of acetylated lignin. Once the lignin was dissolved, the solution was washed
twice with 20 mL of deionized water and the organic phase was dried with Na2SO4. The dried
CHCl3 solution was added dropwise to 150 mL of dry diethyl ether. Gelatinous drops of
lignin started to precipitate. After at least 12 hours, the diethyl ether was rotary evaporated
and the remaining solid was weighted.

48
Klason determination of sugars
A sample of 100 mg lignin was mixed with 3 mL of 72% H2SO4 agitated with a vortex for 30
seconds and placed in a 30°C bath for 60 minutes. 84 mL of water were added to drop the
acid concentration to 4%. The mixture was then heated for one hour at 121 °C in an
autoclave, then let to cool down and filtered. The filtrate contained acid-soluble lignin and
carbohydrates, while the solid contained inorganics salts and acid-insoluble lignin. To dose
acid-insoluble lignin and inorganics, the solid residue was put in a dry, weighted crucible
and dried at 105°C for at least 4 hours. The sample was then weighted, put in an oven at
550°C for 4 hours, let to cool in a desiccant and weighted again. The difference between non-
carbonized and carbonized samples gave insoluble lignin content, and the remaining solid
inorganics content. Acid-soluble lignin was dosed by UV spectrometry. 3 mL of filtrate were
diluted until absorbance at 205 nm was between 0.2 and 0.7. Each sample was analyzed twice.
To quantify carbohydrates, 20 mL of the filtrate were slowly neutralized with CaCO3 to pH
= 5-6. Slowness was required to avoid foam formation. The sample was thoroughly mixed
and let to settle. The pH of the filtrate was about 7. The sample was centrifuged at 10.000
RPM for 7 minutes and the supernatant was isolated.
Fourier Transform Infrared (FTIR)
The dry sample of lignin was placed on the FTIR crystal. High quality spectra could only be
obtained when deposit quantities were >200 mg. The machine was flushed with nitrogen gas
and background compensated. Resolution was 4 cm-1
. Spectrum manipulations included
baseline correction and normalization, as well as hand peak picking. The spectrometer was a
Brücker Vertex 70.
31P NMR dosage of hydroxyls
The reactive mixture was prepared as such: 12,8 µL of 30°C pre-heated cyclohexanol, 1 mL
of DMF, 1.2 mL of deuteriated chloroform, 1 mL of pyridine (dried by addition of 10g of
NaOH beforehand) and 11.5 mg of chromium acetylacetonate were mixed in a 4 mL-vial.
Lignin was dried overnight in a 40°C oven. We mixed 20 mg of dried lignin with 500 µL of
reaction mixture and 100 µL of phosphitylatingte agent 2-chloro-4,4,5,5-tetramethyl-1,3,2-

49
dioxaphospholane (TMDP). The mixture was agitated and vortexed at room temperature, and
centrifuged if a solid residue could still be seen. Up to 1600 scans were taken to generate one
spectrum.
Electrode films fabrication
Lignin films were prepared by mixing lignin, activated carbon (80 m²/g) and polyvinylidene
fluoride (PVDF) in weight ratio 15:85:10. The powder was suspended in N-methyl-2-
pyrrolidone (NMP), which was added drop wise to obtain viscous slurry. The mixture was
spread with a 120 µm casting knife on either pure copper foil or fluorine doped tin oxide
(FTO) glass and dried at 100°C under vacuum for one night. A 1cm by 1cm square was then
cut off and tested as such in cyclic voltammetry.
SEM
SEM was performed on both lignin-carbon films and on pristine lignin powders. The film
sample or powder sample was first sprayed with gold to make it conductive. This was done in
60 seconds at 30 mV on a Bal-Tec device. The electronic microscope was a ESEM Philips
XL-30 FEG. The secondary electrons detector was used. The electrical tension was 15 kV.
CV
Cyclic voltammetry was performed in a three-electrode cell in H2SO4 with a standard calomel
electrode for reference. The potential was swept from -0.2 to 0.8 V at 5 mV/s. The reported
spectra were the third iteration of the experience, to ensure the system was stabilized.
Schiff test
A sample of lignin (10 mg) was dissolved in 2 mL of methanol. The, 0.5 mL of Schiff’s
reagent was added. The test was considered positive if any red-pink coloration appeared up
until two minutes. Otherwise, the test was considered negative.
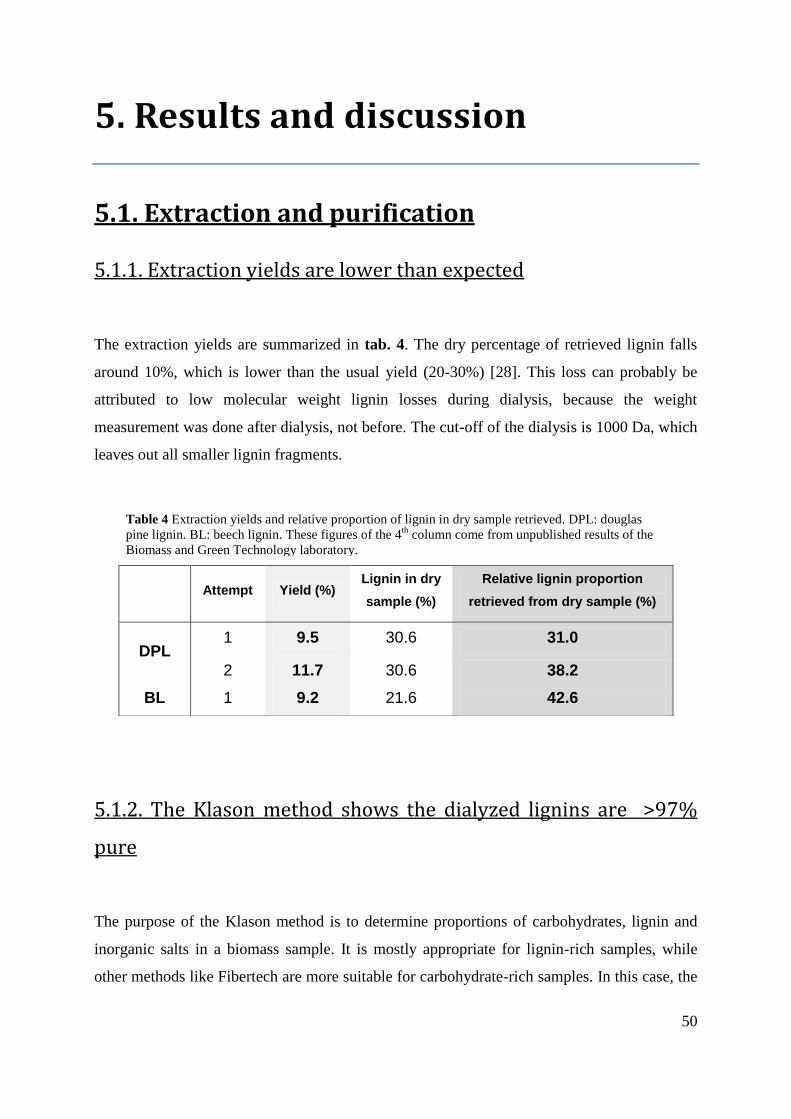
50
5. Results and discussion
5.1. Extraction and purification
5.1.1. Extraction yields are lower than expected
The extraction yields are summarized in tab. 4. The dry percentage of retrieved lignin falls
around 10%, which is lower than the usual yield (20-30%) [28]. This loss can probably be
attributed to low molecular weight lignin losses during dialysis, because the weight
measurement was done after dialysis, not before. The cut-off of the dialysis is 1000 Da, which
leaves out all smaller lignin fragments.
5.1.2. The Klason method shows the dialyzed lignins are >97%
pure
The purpose of the Klason method is to determine proportions of carbohydrates, lignin and
inorganic salts in a biomass sample. It is mostly appropriate for lignin-rich samples, while
other methods like Fibertech are more suitable for carbohydrate-rich samples. In this case, the
Attempt Yield (%) Lignin in dry
sample (%)
Relative lignin proportion
retrieved from dry sample (%)
DPL 1 9.5 30.6 31.0
2 11.7 30.6 38.2
BL 1 9.2 21.6 42.6
Table 4 Extraction yields and relative proportion of lignin in dry sample retrieved. DPL: douglas
pine lignin. BL: beech lignin. These figures of the 4th
column come from unpublished results of the
Biomass and Green Technology laboratory.

51
Table 5 Klason method results. All figures are in percentages and have been normalized to sum up to 100%.
DPL: douglas pine lignin. BL: beech lignin. HL: herbaceous lignin
Inorganics
Carbohydrates
AS lignin
AI lignin
Klason method will indicate whether the lignin samples are pure or not, and if dialysis yielded
sufficiently pure lignin. Inorganic salts contamination could greatly influence the
electrochemical tests results because (a) many inorganic salts are redox-active and (b) the
ionic content of the lignin could dissolve in the electrolyte, and influence the ion mobility in
the test cell. The detailed methods for calculating these results on the basis of GC-MS
(carbohydrates), acid soluble lignin (UV) and inorganic salts (carbonization), as well as error
calculation, can be found in Appendix I. The lignin samples used in the following analysis
are thus >97% pure (tab. 5, fig. 25). The dialysis method seems to be efficient, though very
time consuming.
Carbohydrates Inorganic
salts
Total
impurities
Acid soluble
lignin
Acid
insoluble
lignin
Total
lignin
DPL 0.77 1.92 2.62 15.5 81.81 97.38
BL 0.82 2.05 2.87 12.8 84.56 97.63
HL 0.71 2.03 2.74 16.5 80.76 97.26
Figure 25 Visual representation of Klason method results. A:
acid soluble. AI: acid insoluble.

52
5.2. Fractions proportions are indicators of
functionality content
A schematic view of the three fractionations, as well as the labeling of the different fractions
is displayed in fig. 26, fig. 27 and fig. 28. To help with fraction identification and labeling, a
non-attached supplementary “Table of abbreviations” sheet has been included in this master
thesis.
5.2.1. pH fractions proportions indicate proportions of carboxylic
acids and phenols in the fractions
A sample of 5 g of lignin was dissolved in water, alkalized to pH = 12 by concentrated NaOH.
The pH was then brought to pH = 8, pH = 5 then pH = 2 with concentrated H2SO4. See fig. 26
for a visual representation.
Figure 26 Schematic representation of the pH fractionation methods, as well as fraction
proportions results. The % figures are mass percentages of the lignin introduced at the beginning
of the fractionation.

53
Table 6 Relative fraction proportions for DPL, BL and HL. Line 4: percentage of lignin that was recovered,
in total, out of the 5 grams we inputted. RL: retrieved lignin. On the right: phenol:carboxylic acid ratios for
HL, coming from NMR data (section 5.6)
DPL did not precipitate until pH = 2. BL precipitated out of the solution at pH = 8 and pH =
2, but not at pH = 5. HL mostly precipitated at pH = 8 and pH = 5, and not much at pH = 2.
We rationalized these very different behaviors by evaluating
the quantities of acido-basic active moieties in lignin. The two main functionalities that were
affected by pH were carboxylic acids (pKa = 4-5 [57]) and phenols (pKa = 9-10 [57])1. At pH
= 12, we assumed all these functionalities were deprotonated, hence negatively charged and
soluble in water. The addition of H+
brought the pH to 8, protonating and neutralizing phenol
functions, leading to a decrease in solubility. Similarly, when the pH was brought to 2, the
carboxylic acids were protonated and neutralized, causing a decrease in solubility. We
inferred that DPL contained large amounts of carboxylic acids, which kept the molecule
soluble up at pH = 8 and 5 because the pH was still above their pKa (4-5). At pH =2, they
were neutralized and the lignin precipitated. These carboxylic acids were numerous enough to
keep the lignin soluble until pH = 2. On the contrary, HL mostly precipitated at pH = 8 and 5,
and not at pH = 2. We concluded that HL contained comparatively larger amounts of phenols,
and fewer carboxylic acids. This hypothesis was corroborated by NMR data. Looking at SA1,
SA2 and SA3, we calculated that the ratio of phenolic alcoholic hydroxyls to acid carboxylic
hydroxyls were respectively 6:1, 2.3:1 and 1.8:1 (tab. 6). This means that SH3 contained
proportionally a lot more carboxylic acids than SH1, which confirmed our hypothesis.
1 Aliphatic alcohols were not taken into account since their pKa was higher than 12 (pKa = 16-17 [57])
DPL (%) BL (%) HL (%)
HL P:CA
SH1 0.4 56.7 70.6
6:1
SH2 0.3 1.5 23.9 2,3:1
SH3 99.3 41.8 5.5 1,8:1

54
The interpretation of BL results was more complicated, since half of the sample precipitated
at pH = 8 and half at pH = 2, and almost no precipitate at pH = 5. A possible explanation
could be that HL possessed two distinct sets of lignins, one set containing many phenols, the
other containing many carboxylic acids. This hypothesis could be confirmed by 31
P NMR,
which doses each type of hydroxyl function (aliphatic or aromatic alcohol, acid), by
measuring the quantities of each type of hydroxyl in fractions SH1 and SH3, data which were
unfortunately not acquired.
5.2.2 Organic solvent fractions proportions were difficult to
analyze because of complex lignin solubility
The second type of fractionation was organic solvent fractionation. A sample of lignin was
dissolved in ethyl acetate. The solid residue and the ethyl acetate were separated by filtration
and the ethyl acetate evaporated to recover the first lignin fraction, F1 (see fig. 27 for a visual
representation). The solid residue was dissolved in the second solvent, methyl ethyl ketone
(MEK), and so forth in methanol, acetone, and dioxane:water (95:5), creating fractions F2,
F3, F3bis, F4 and INS, the insoluble fraction. F3bis was the acetone-soluble lignin, which
was, in mass, insignificant compared to the other fractions. The analysis of this fraction would
have been too costly in pristine lignin: a few grams of pristine lignin would have been
necessary to isolate a few milligrams of F3bis. F3bis was thus discarded in the
characterizations and the following analyses of this master thesis. The proportions of each
fraction are displayed in fig. 27. The third type of fractionation was acetone/water
fractionation. The process was the same as organic solvent fractionation, only the solvents
were acetone/water mixtures. The first was acetone:water 60:40 and the second acetone:water
30:70, creating three fractions: SA1, SA2 and SA3, the latter being the insoluble fraction. The
proportions of each fraction are displayed in the visual scheme fig. 28. Unlike pH
fractionation, organic solvent and acetone/water fractionations could not be explained with
simple acido-basic considerations: the solubility of lignin in organic solvents can only be
assessed by evaluating the non-covalent interactions it can form with the solvent molecules.
These interactions are summed up in a theory that describes the solubility of polymers in
organic solvents: Hansen solubility parameters theory. This theory will be used throughout
this master thesis to infer structural pieces of information from solubility observations.

55
Figure 27 Schematic representation of the organic solvent fractionation, as well as the fraction proportions for each type of lignin. S: solid. L: liquid. Dashed box: filtration. The % figures are mass percentages of the lignin introduced at the beginning of the fractionation.
Figure 28 Schematic representation of the acetone/water fractionation, as well as the fraction proportions for each type of lignin. S: solid. L:
liquid. Dashed box: filtration. The % figures are mass percentages of the lignin introduced at the beginning of the fractionation.

56
5.3 Hansen solubility parameters make sense out
of organic solvent solubility
This theory was developed by Hansen and coworkers [56] to ameliorate the Hildebrand theory
of solubility [58], [59].The Hildebrand theory assigned a solubility parameter δ to every
polymer and acomparing it with the δ of solvents. The theory states that the solubility of a
polymer increases in solvents with similar δ. The Hildebrand theory only applied to strictly
non-polar solvents. Hansen extended the theory by adding a parameter that would take into
account polar interactions.
In Hansen solubility theory, each solvent and each polymer has three parameters: δD, δP and
δH, that respectively symbolize dispersive interactions, dipole-dipole interactions and
hydrogen bonding. Their unit is (MPa)1/2
. They are linked to the global parameter δ in one
equation:
Hansen parameters can be represented in the Hansen space, in which each axis is a parameter.
The aim of the Hansen parameters is to allow comparison of multiple solvents or multiples
polymers at once. The pieces of information that can be inferred from Hansen space are
schemed in fig. 29 and 30. Let us take methanol as an example (orange dot in fig. 29 and 30).
If a lignin fraction is soluble in this solvent, it means that its Hansen parameters are spatially
closer to the ones of the solvent. In the case of methanol, it clearly appears that the soluble
lignin fraction must display lower dipole-dipole interactions, higher hydrogen bonding and
lower dispersive interactions than pristine lignin. The Hansen spaces containing all solvents
that have been used for analysis can be found in Appendix III [60]. The Hansen solubility
parameters of mixtures are calculated by weighted average of the parameters of the pure
solvents.

57
Thus, the Hansen parameters of solvents can give us a general idea of what kind of
functionalities they dissolve better, and in general, which solvents are adequate or not for
different types of lignin. In tab. 7, we can see why DMSO and DMF are very good solvents
for lignin: their distance to lignin is the smallest of all solvents.
Figure 30 2D slice of the Hansen space. X-axis: dispersive interactions. Y-
axis: dipolar interactions.
Figure 29 2D slice of the Hansen space. X-axis: dispersive interactions.
Y-axis: hydrogen bonds.
δD
δD
δH
δD [(MPa)1/2]
δP [(MPa)1/2]
δH [(MPa)1/2]
δP [(MPa)1/2]

58
The value that indicates the closeness of two molecules is Ra, which is calculated as such:
Ra² = 4(δD1-δD2)² + (δP1-δP2)² + (δH1-δH2)²
δD1 being δD for molecule 1, δD2 for molecule 2, and so forth. A list of Ra has been computed
into tab. 7.
Hansen solubility parameters even allow solubility prediction. From a selection of organic
solvents, the computations of their Ra to lignin are easily calculable if the parameters of the
polymer are known. In the case of lignin, other good solvents should include: benzyl alcohol,
m-cresol, dipropylene glycol and tetrahydrofurfuryl alcohol (green in Appendix III).
Table 7 Hansen parameters and relative distance to lignin of solvents used in this master thesis.
δD: dispersive interactions. δP: dipolar interactions. δH: hydrogen bonding. Ra: relative distance
to lignin parameters [59]. The unit of all parameters is (MPa)1/2
. In green, good lignin solvents
and their low Ra value.
δH

59
5.4 FTIR analysis points out general functionality
content trends
5.4.1. Organic solvent fractionation
5.4.1.1. Successive fractionations
A band assignation chart was drawn from literature [3], [32], [61]–[63] and can be found in
appendix II.
Spectra were recorded in between successive dissolutions, in order to compare soluble lignin
to insoluble lignin at each step of the fractionation. In the following discussion, the soluble
fraction of lignin in solvent 1 is called F1, and the solid residue is called F1C (for
complementary); F2 and F2C for solvent 2, and so on.
DPL-F1 and BL-F1 showed similar band reductions and increases (fig. 31). DPL-F1C and
BL-F1C did too. In F1, the 1030 cm-1
, and the 3300 cm-1
bands decreased; the 1115, 1200,
1500, 1850 and 2950 cm-1
bands increased. Complementarily, F1C showed an increase of the
3300 cm-1
band, and a decrease for the 1115, 1215, 2850 and 2950 cm-1
bands. Since the
1000-1100 cm-1
region was attributed to C-O stretching vibrations (ether, alcohol, carbonyl)
and the 3300 cm-1
broad peak to O-H stretching, we hypothesized that ethyl acetate could less
solubilize those kinds of oxygen-bearing functions. The intensity changes in the following
complementary spectra (F2/F2C, F3/F3C) are summarized in tab. 8, and confirm this first
hypothesis: low polarity, non-oxygenated parts of lignin seemed to have dissolved in ethyl
acetate, while two characteristic bands of higher polarity ether and alcohol diminished. BL
displays the same kind of behavior.

60
Table 8 Summary of increases and decreases for F1 to F3 for DPL. Upward arrow: increase in intensity.
Downward arrow: decrease in intensity.
Figure 31 Comparative spectrum of DPL (in grey), F1 (in red) and F1C (in blue).

61
5.4.1.2. Total comparative spectra
The total comparative infrared analysis of the five fractions of DPL allowed us to highlight
three experimental observations: (a) the increased 3200 cm-1 band, (b) the progressive
diminution of the 1700 cm-1
band and (c) the pattern differences between the fractions in the
1000-1300 region cm-1
(those three points are illustrated in fig. 32, fig. 33, fig. 34).
(a) The INS fraction had a more intense 3200 cm-1
band than the four other fractions. This
band was assigned to hydroxyl vibrations. The larger intensity of the alcohol band was
exclusive to DPL. Comparative spectra of BL and HL (Appendix II) did not show this larger
intensity. We inferred from this data that the organic solvents we used could not significantly
dissolve hydroxyl-rich fractions.
(b) The relative intensity of the 1700 cm-1
band decreased with successive dissolutions. In
other words, relative intensity went as such: F1 > F2 > F3=F4 > INS. We assigned the band to
Figure 32 Comparative spectrum of the five soluble organic solvent fractions of DPL: F1 in red,
F2 in pink, F3 in blue, F4 in green and INS in black.

62
Figure 33 Zoom on zone « c » of figure 32. Comparative spectrum of the five soluble organic solvent fractions
of DPL: F1 in red, F2 in pink, F3 in blue, F4 in green and INS in black.
Figure 34 Zoom on zone « b » of figure 32. Comparative spectrum of the five soluble organic
solvent fractions of DPL: F1 in red, F2 in pink, F3 in blue, F4 in green and INS in black. The arrow
highlights the reduction of the 1700 cm-1
band.
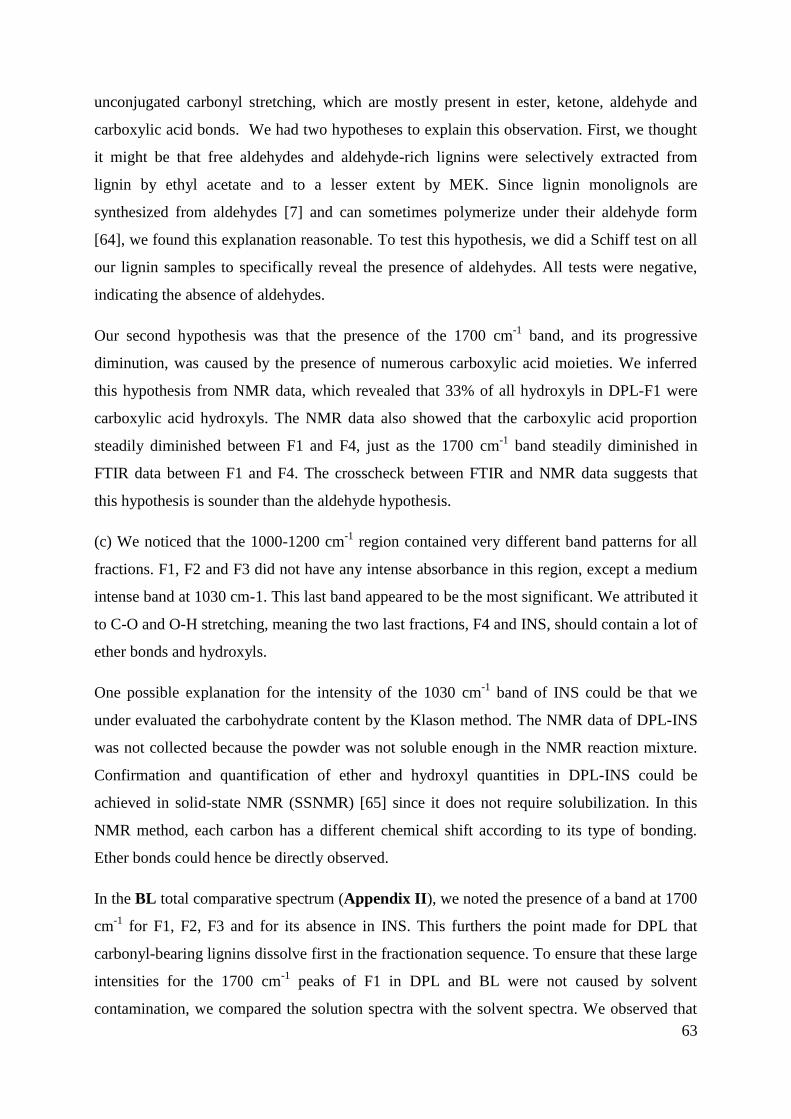
63
unconjugated carbonyl stretching, which are mostly present in ester, ketone, aldehyde and
carboxylic acid bonds. We had two hypotheses to explain this observation. First, we thought
it might be that free aldehydes and aldehyde-rich lignins were selectively extracted from
lignin by ethyl acetate and to a lesser extent by MEK. Since lignin monolignols are
synthesized from aldehydes [7] and can sometimes polymerize under their aldehyde form
[64], we found this explanation reasonable. To test this hypothesis, we did a Schiff test on all
our lignin samples to specifically reveal the presence of aldehydes. All tests were negative,
indicating the absence of aldehydes.
Our second hypothesis was that the presence of the 1700 cm-1
band, and its progressive
diminution, was caused by the presence of numerous carboxylic acid moieties. We inferred
this hypothesis from NMR data, which revealed that 33% of all hydroxyls in DPL-F1 were
carboxylic acid hydroxyls. The NMR data also showed that the carboxylic acid proportion
steadily diminished between F1 and F4, just as the 1700 cm-1
band steadily diminished in
FTIR data between F1 and F4. The crosscheck between FTIR and NMR data suggests that
this hypothesis is sounder than the aldehyde hypothesis.
(c) We noticed that the 1000-1200 cm-1
region contained very different band patterns for all
fractions. F1, F2 and F3 did not have any intense absorbance in this region, except a medium
intense band at 1030 cm-1. This last band appeared to be the most significant. We attributed it
to C-O and O-H stretching, meaning the two last fractions, F4 and INS, should contain a lot of
ether bonds and hydroxyls.
One possible explanation for the intensity of the 1030 cm-1
band of INS could be that we
under evaluated the carbohydrate content by the Klason method. The NMR data of DPL-INS
was not collected because the powder was not soluble enough in the NMR reaction mixture.
Confirmation and quantification of ether and hydroxyl quantities in DPL-INS could be
achieved in solid-state NMR (SSNMR) [65] since it does not require solubilization. In this
NMR method, each carbon has a different chemical shift according to its type of bonding.
Ether bonds could hence be directly observed.
In the BL total comparative spectrum (Appendix II), we noted the presence of a band at 1700
cm-1
for F1, F2, F3 and for its absence in INS. This furthers the point made for DPL that
carbonyl-bearing lignins dissolve first in the fractionation sequence. To ensure that these large
intensities for the 1700 cm-1
peaks of F1 in DPL and BL were not caused by solvent
contamination, we compared the solution spectra with the solvent spectra. We observed that

64
ethyl acetate and MEK displayed a carbonyl peak at higher wave numbers, around 1750 cm-1
,
suggesting our samples were not contaminated since their carbonyl band was displayed at
1700 cm-1
. The HL total comparative spectrum (Appendix II) had some similar features to
BL and DPL: 1700 cm-1
band larger intensity for the first fractions, 1030 cm-1
band larger
intensity for the last fractions.
5.4.1.2 Acetone/water mixtures fractionation
We noticed a feature on the comparative spectrum of the three fractions of DPL (fig. 35)
which seemed to display an opposite trend to organic solvent fractionation. In SA1, the 1030
cm-1
band had increased intensity, while SA2 and SA3 had bands increase in the 1200-1500
cm-1
zone, as well as the 1700 cm-1
. BL showed another kind of intensity proportions for
these two regions: SA1 had a more intense 1030 cm-1
band, SA2 a more intense 1200-1500
cm-1
region, and SA3 seemed to have the same intensity for the two (fig. 36). Using our
Figure 35 Comparative spectrum of the three acetone/water fractions of DPL: SA1 in
red, SA2 in black and SA3 in blue.

65
predefined assignations, we inferred that for DPL, SA1 contained larger amounts of
ether/alcohol functions, while SA2 and SA3 contained more alkane/aromatics functions. For
BL, the same observations were made, but we could also infer that SA3 contained
intermediate proportions of ether/alcohol to alkane/aromatics between SA1 and SA2 because
of the relative intermediate intensities of the bands. Compared with BL and DPL, HL
acetone/water fractionation did not seem to work at all (Appendix II). There were no
significant intensity increases or decreases. This non-discrimination was supported by fraction
proportions: ~10% of HL dissolved in the first solvent, and ~10% in the second; 80%
remained non dissolved. In terms of Hansen parameters, this probably meant that HL had
more dispersive interactions, as, for example, if it was enriched in aromatics compared to
oxygen-containing moieties. This crosschecked the NMR data that showed that 60% of HL
detected hydroxyls were phenolic, versus 40% for DPL and 35% for HL.
Figure 36 Comparative spectrum of the three acetone/water fractions of BL: SA1 in red,
SA2 in black and SA3 in blue.

66
5.4.1.3. pH fractionation
HL total comparative spectrum displayed three distinct features (fig. 37). First, SH1 showed
an increased 3300 cm-1
hydroxyl band. Secondly, SH1, SH2 and SH3 showed a medium
intense, a weak, and no band at 1700 cm-1
(assigned to carbonyls), respectively. Thirdly, the
aromatic peaks between 1200 and 1500 cm-1
were very similar in intensity.
Assuming the third observation is correct, and that the aromatic content of the three fractions
is the same, then we can conclude that the carboxylic acid content (proportional to the C=O
1700 cm-1
band intensity) decreased from SH3 to SH1; and that SH1 contained the majority of
phenol-rich lignins. This hypothesis seemed correct because it was supported both by pKa
considerations and by NMR data. The fraction that precipitated at pH = 8 (SH1) were the ones
Figure 37 Comparative spectrum of the three pH fractions of HL: SH1 in red, SH2 in grey
and SH3 in blue.

67
containing more phenols with a higher pKa, while the ones that precipitated at pH = 2 (SH3)
were the ones containing more carboxylic acids which have a lower pKa. Moreover, in NMR,
the phosphitylation of hydroxyl functionalities showed that COOH content increased from
SH1 to SH3, corroborating this hypothesis.
As for the two other types of lignin, BL displayed exactly the same kind of behavior (not
shown). DPL proportions of SH1 and SH2 (<1%) did not allow us to carry out FTIR
measurements on them.
5.4.1.4. Sonication and ball-milling
Comparison of sonicated and non sonicated samples did not indicate any significant changes
in the three samples (Appendix II), which could mean that the sonication did not work. If it
did work, we can affirm that it did not affect the functionalities of lignin. Since the
polymerization of lignin demanded the condensation of a phenol moiety with an aromatic part
or an alkene part of another lignin molecule, and that phenols do not have any specific IR
band, polymerization could not be accurately assessed by FTIR. As for ball-milling, the
samples did not show any significant changes (Appendix II), whatever the ball-milling times.
These negative results support the hypothesis that sonication and ball-milling do not affect the
functionality content of the samples.

68
5.5. HPSEC analysis shows molecular weight
fractionations did work
The HP-SEC technique is often used to characterize the molecular weight of polymers. It
relies on a simple concept: the hydrodynamic volume, i.e. the average volume that the
polymer takes up in a given solvent, is proportional to the molecular weight of the polymer.
Therefore, when passed onto a size-excluding resin, large molecules are eluted first, and small
molecules last.
This technique has two major hurdles: (a) it is not appropriate for lignin absolute molecular
weight determination and (b) it is dependent on lignin solubility.
(a) There are no available and reliable lignin standards to calibrate the elution time-molecular
weight relationship. Thus, we had to choose a similar standardized polymer. The polymer
that had the most alike structure was polystyrene, because of its benzene rings. However,
polystyrene is a linear, non-reticulated, carbonated homopolymer whereas lignin is an
oxygen-bearing cross-linked heteropolymer: they are not comparable. The obtained results
are thus expressed in polystyrene-equivalent; they are appropriate to compare the
molecular weights of two samples of lignin, not to assess their absolute molecular weight.
(b) Alkaline-extracted lignin is a mixture of structurally different phenylpropane
heteropolymers. Its solubility is thus unusual, some fractions being more soluble than
others in some solvents. HPSEC only analyses soluble fractions. Therefore, if a lignin
fraction is insoluble in the HPSEC solvent, it will not be observed; this is often the case
for high molecular weight fractions. Therefore, we had to bear in mind that any insoluble
fraction would not be observed by this technique.
Researchers often acetylate lignin in order to enhance solubility in HPLC solvents (DMF,
THF or dimethylacetamide, DMAc) [66]. Since acetylation is a time-costly operation and that
our samples seemed to solubilize well in DMF, we checked whether acetylation was
necessary or not by comparing HPSEC-DMF spectra of DPL and acetylated DPL, as well as
BL and acetylated BL. The spectra showed no differences in retention time. Thus, we
analyzed all samples without acetylation.
69
Firs, we observed that in all tested samples, the measured polystyrene-equivalent molecular
weights were higher in DMF than in water. Two reasons might explain this. First, DMF is a
way better solvent than water for lignin. It allows lignin to be stable while spread out. The
Hansen theory Ra of DMF is one of the smallest of organic solvents towards lignin. Secondly,
in DMF, we added 0,5% (m:v) of LiCl. We could not add it in water, because it formed the
corrosive salt LiOH that would have attacked the HPSEC column. LiCl was added to cancel
the intra- and inter-molecular weak bonds such as hydrogen bonds or π-π stacking. This might
be one of the factors that caused the larger values of Mn and Mw of lignin in DMF: the chains
were much more spread out. Tables 9, 10 and 11 (pp. 72-74) summarize all results.
For DPL (tab. 9, fig. 38) and BL (tab. 10), the solvent fractionation revealed a steady
increase in molecular weight going from F1 to INS. The same experimental observations were
noted for HL and BL, both in DMF and in alkaline water (tab. 10, tab. 11). The only odd
results were DPL-INS in alkaline water and HL-INS in DMF: they did not follow the general
trend and displayed lower polystyrene-equivalent molecular weights.
F1
F2 F3
F4
INS
Figure 38 Comparative chromatogram of DPL fraction F1 to INS. X-axis: retention time, in
10² min. Y-axis: UV absorbance at 269 nm, arbitrary units.

70
The general trend could be explained by the simple fact that low molecular weight lignins are
intrisically more soluble: their hydrodynamic volume is smaller, hence, their surface to bulk
ratio is higher and they solubilize first, whatever the solvent. Given the Hansen solubility
parameters of all our solvents, following no particular order, functionality-driven
solubilization did not seem to be the prime factor. The oddity of the INS fraction could not be
explained. It illustrated nicely the inherent problem cited in at the beginning of this section:
HPSEC is not appropriate to analyze reticulate polymers, because their hydrodynamic volume
varies greatly between solvents. The only pieces of information we can infer from this data is
that the highest hydrodynamic volume of all DPL fractions is INS in DMF and F4 in water.
Similarly, the highest hydrodynamic volume of all HL fractions in DMF is F4 and INS in
water.
For acetone/water mixtures fractionation, we observed the same trend as for organic
solvent fractionation (tab. 9, 10, 11): increase of Mn and Mw from DPL-SA1 to SA3, with a
steady PDI. Lower molecular weight fractions hence dissolve first. Unlike organic solvent
fractionation, we can here use the Hansen solubility parameters because they follow a clear
trend: the two acetone/water solvents a have equivalent dispersive parameter values, and
acetone:water 3:7 displays greater hydrogen bonding and dipole-dipole interactions
parameters than acetone:water 6:4. Therefore, the acetone:water 3:7-soluble lignins must
contain more hydrogen-bonding and polar functionalities, such as hydroxyls, acids, esters and
ketones. This hypothesis is corroborated by FTIR data: comparative spectra of DPL and HL
(fig. 31 and Appendix II) show higher C-O/aromatics and O-H/aromatics ratios for SA1 than
for SA3 and SA3. For pH fractionation, we saw that Mn and Mw decreased with the decrease
of pH. PDIs were comprised between 1.5 and 2.5, thus a little bit higher than in organic
solvent fractionations.
We observed the same kind of low molecular weight solubility: the smaller molecules were
more soluble, thus precipitated last (at the most acidic pH). This result seemed to show that
molecular weight and functionality content were uncorrelated when it came to solubility.
Fraction proportions, FTIR and NMR data showed that SH1, SH2 and SH3 for the three
lignin samples contained significant amounts of hydroxyls and carboxylic acids. Those
amounts determined when each type of fraction would precipitate (before pH =8, at pH = 5 or
at pH = 2). Here, HPSEC results did not seem to be influenced by these functionalities: larger
molecules, less soluble, precipitated first, independently from their acid/hydroxyls contents.

71
Sonication of an alkaline solution of lignin was tested because it allegedly repolymerized
lignin. The cavitation induced by the sonic probe should have released enough energy in the
solution to generate radicals, which would induce polymerization in lignin [67]. The results
for BL and DPL, both in DMF and water, showed an increase of Mn and Mw of approximately
20-30%. This result seems to show that repolymerization is possible and that the method
works. A technique that could corroborate this result is HSQC 13
C-1H 2D-NMR: each carbon
has a different signal according to its type of bonding [65]. Comparison of HSQC peaks from
non- sonicated and sonicated samples could indicate if the number of linkages has increased,
confirming repolymerization.
We tried ball-milling the lignin samples to determine if physical grinding could depolymerize
lignin. No significant molecular weight changes were observed. 158h-ball-milled DPL lignin
sample showed higher molecular weight, not lower. 36h-, 72h-, and 108h-ball-milled samples
of HL and BL displayed diminished molecular weights (20-30% reduction) in DMF but no
changes after 36h of ball-milling. In water, for BL, there was no change at all. We did not
investigate the oddity of the DPL sample, because it seemed to have been contaminated with
an unknown substance in FTIR. These results could be explained by grain thickness. Ball-
milling might not have caused depolymerization, but rather a shrinking in lignin grain sizes,
causing the lignin to be more impregnated with solvent, thus more unfolded in solution. Since
the HPSEC method measures hydrodynamic volume, and not absolute molecular weight, this
could be a reasonable explanation. Confirmation or invalidation could arise from molecular
weight measurement techniques that do allow an estimation of the absolute Mn, such as
viscosimetry [68], osmotic pressure measurement or light scattering [69].
Our polystyrene calibration curve can be found in Appendix III.

72
Mn Mw PDI
DMF H2O DMF H2O DMF H2O
DPL 30000 3300 74000 5100 2.44 1.53
DPL-F1 13000 2100 22000 3000 1.70 1.41
DPL-F2 25000 2600 34000 3500 1.4 1.37
DPL-F3 39000 4200 54000 6000 1.4 1.43
DPL-F4 54000 5400 78000 850 1.46 1.57
DPL-INS 76000 9900 127000 22000 1.67 2.19
DPL-SA1 21000 Mp 33000 Mp 1.57 Mp
DPL-SA2 30000 3500 50000 5400 1.64 1.54
DPL-SA3 38000 3800 58000 6200 1.54 1.63
DPL-SH1 60000 n.a. 130000 n.a. 2.19 n.a.
DPL-SH2 36000 n.a. 88000 n.a. 2.43 n.a.
DPL-SH3 44000 n.a. 68000 n.a. 1.56 n.a.
DPL-S45 38000 3702 104000 5700 2.75 1.53
DPL-BM156 58000 n.a. 103000 n.a. 1.77 n.a.
DPL-ACET 25000 n.a. 47000 n.a. 1.87 n.a.
Table 9 Number average molecular weight (Mn), mass average molecular weight (Mw) and polydispersity index (PDI)
for the fractions of DPL. n.a.: non acquired. Mp: multiple peaks.

73
Mn Mw PDI
DMF H2O DMF H2O DMF H2O
BL 29000 3000 54000 4500 1.85 1.57
BL-F1 11000 n.a. 16000 n.a. 1.45 n.a.
BL-F2 21000 2000 30000 3200 1.42 1.56
BL-F3 33000 3000 45000 4500 1.38 1.49
BL-F4 53000 5000 74000 7900 1.41 1.53
BL-INS 74000 Mp 114000 Mp 1.55 Mp
BL-SA1 21000
15000
n.a. 68000
29000
n.a. 3.23
1.89
n.a.
BL-SA2 65000 n.a. 145000 n.a. 2.25 n.a.
BL-SA3 21000 n.a. 3500 n.a. 1.7 n.a.
BL-SH1 41000 n.a. 75000 n.a. 1.85 n.a.
BL-SH2 31000 n.a. 55000 n.a. 1.77 n.a.
BL-SH3 16000 n.a. 35000 n.a. 2.25 n.a.
BL-S45 36000 n.a. 62000 n.a. 1.74 n.a.
BL-BM36 20000 n.a. 35000 n.a. 1.75 n.a.
BL-BM72 23000 n.a. 45000 n.a. 1.97 n.a.
BL-BM108 21000 n.a. 35000 n.a. 1.69 n.a.
BL-ACET 31000 n.a. 51000 n.a. 1.63 n.a.
Table 10 Number average molecular weight (Mn), mass average molecular weight (Mw) and polydispersity index
(PDI) for the fractions of BL. n.a.: non acquired. Mp: multiple peaks.

74
Mn Mw PDI
DMF H2O DMF H2O DMF H2O
HL 29000 2900 49000 5000 1.69 1.72
HL-F1 n.a. 1900 n.a. 3300 n.a. 1.7
HL-F2 n.a. 2400 n.a. 3400 n.a. 1.41
HL-F3 31000 3600 45000 5000 1.46 1.39
HL-F4 54000 5800 78000 9100 1.44 1.57
HL-INS 18000 7900 28000 14600 1.59 1.85
HL-SA1 n.a.
HL-SA2 n.a.
HL-SA3 n.a.
HL-SH1 21000 3500 32000 5600 1.51 1.6
HL-SH2 13000 3200 17000 4600 1.30 1.43
HL-SH3 7500 2500 14000 3300 1.84 1.31
HL-S45 n.a.
HL-BM36 17000 3000 32000 4700 1.92 1.57
HL-BM72 16000 3000 28000 4700 1.78 1.57
HL-BM108 16000 3000 28000 4700 1.81 1.57
HL-ACET n.a.
Table 11 Number average molecular weight (Mn), mass average molecular weight (Mw) and polydispersity index
for the fractions of HL. n.a.: non acquired

75
5.6. NMR analysis reports changes in oxygen-
bearing moieties contents
The selective reaction between lignin hydroxyls and 2-chloro-4,4,5,5-tetramethyl-1,3,2-
dioxaphospholane (TMDP) in CDCl3/pyridine creates phosphite moieties. In these, the
phosphorus atom has a different chemical shift depending on the kind of alcohol it reacted
with: guaiacyl G, p-hydroxyphenyl H, syringyl S, aliphatic or carboxylic acid. The integration
of the peaks (fig. 39), compared to an internal standard (cyclohexanol), gives us the relative
proportions of each type of hydroxyl.
We emphasize the fact that the relative proportions of aliphatic, aromatic and carboxylic acid
hydroxyls are biased, because the only detectable aromatic hydroxyls are the ones that have
not polymerized, thus, the end-chain aromatic hydroxyls. Hence, the ratio aliphatic:acid is
correct, but the aromatic units content is greatly underestimated. The “aromatic hydroxyls”
described here should be understood as “end-chain aromatic hydroxyls”. Still, the ratio G:H:S
is correct, because it compares aromatic hydroxyls to other aromatic hydroxyls. Fig. 40 shows
the peak assignments.
Figure 39 Reaction between a lignin hydroxyl and TMDP to generate a phosphityl moiety.
The phosphorus atom linked to the hydroxyl hydrogen displays a different chemical shift
depending on the type of hydroxyl it reacted with [76].

76
For DPL, as expected, we observed a major peak for G unit, and a minor peak for the H unit.
The integration revealed a G:H 7:3 ratio. As for the aliphatic:aromatic:carboylic acid ratio, we
found a 4:4:2 ratio (see tab. 12 for percentages). During organic solvent fractionation, the
relative quantity of aliphatic alcohol increased from 19% to 50% of the total, while the
relative carboxylic acid hydroxyl quantity decreased from 33% to 10%. These changes could
not be explained rationally by Hansen parameters: the chosen solvents did not display any
logical sequence in any of the three Hansen spatial dimensions. They were chosen empirically
to fractionate lignin according to molecular weight. Still, we inferred from the increase in
aliphatic alcohol that the molecular weight increased, confirming HPSEC data. The aliphatic
alcohols were mostly present in β-O-4 linkages. The relative proportion of aliphatic alcohol
thus indicated that there were more bonds in DPL-F4 than in DPL-F1.
For BL, we could not measure SA1 because it was too insoluble in the reaction mixture. We
witnessed that BL had a higher relative aliphatic hydroxyl content than DPL and HL, and
lower carboxylic acid content. We hypothesized that aliphatic hydroxyls indicated a higher
number of linkages, but that would not crosscheck with HPSEC data, which showed that the
three types of lignin had roughly the same size. BL-SA1 data is needed for any further
analysis. For HL, we saw that the relative abundances of aliphatic hydroxyls decreased
between SH1 and SH3, whereas the carboxylic acid relative abundance increased. As we
already crosschecked in the FTIR section, fractionation yields, FTIR and NMR data agree on
Aliphatic
H unit G unit
S unit Carboxylic
acid
Cyclohexanol
Figure 40 31P NMR spectrum of HL. Each peak is assigned to a type of hydroxyl. X-axis: chemical shift, in
ppm. Y-axis: relative intensity, arbitrary units.

77
the functionality content of the SH1-SH2-SH3 fractions. SH1 was rich in hydroxyls and poor
in acids, and SH3 was rich in acids, and poor in hydroxyls.
Since we had solubility problems for at least 20% of our samples, and that some did not
dissolve at all, like BL-SA1, we tried a different method. The reaction mixture to analyze the
lignin samples contains CDCl3, pyridine and DMF in equivolume proportions. Pyridine is
needed for the phosphitylation to occur. CDCl3 provides the deuterated signal for the NMR
machine to lock and shim (i.e. “calibrate”) the magnets. DMF is added to help solubilize
lignin. Since CDCl3 is a poor lignin solvent (Hansen Ra = 17,7) and DMF a good lignin
solvent (Hansen Ra = 10,2), we tried replacing CDCl3 with deuterated DMF. The resulting
spectra displayed peaks that had a higher S/N ratio, and were better resolved. A mixture of
d7-DMF and pyridine thus seemed to be a better solvent for lignin analysis, and could be an
alternative for low solubility samples. The disadvantage is that DMF-d7 (41$/g) [70] is way
more expensive than CDCl3 (<1$/g) [71].
Table 12 Relative proportions of aliphatic alcohol, H, G and S phenol, and carboxylic acid hydroxyls. The
arrows show opposite increases between aliphatic and carboxylic hydroxyls.
78
5.7. SEM shows diverse structures in lignin
fractions and inhomogeneity in electrode film
5.7.1. Lignin fractions show diverse microstructures
The microstructures of pristine lignin fractions were investigated by SEM. The aim was to
collect pieces of information about the impact of the fractionation technique on the
aggregation and structure of lignin particles.
First, we observed different microstructures between three organic solvent fractions of DPL.
F4 and F2 (not shown) displayed aggregates with sizes ranging from 1 to 100 µm, with no
preference for a certain size, while F3 showed smaller, 2-4 µm needle-shaped particles at the
surface of the aggregates (fig. 42). F3 was the fraction soluble in methanol, and IR results
showed that this fraction was enriched in aromatic units, and depleted in C-O bonds. This
disparity might have caused the formation of needle-like structures. This last result could
display enhanced electrochemical performances: other authors [49] showed the interest of
fiber-like porous carbons to increase surface area, with success.
Second, sonication seemed to produce 10-100 µm agglomerates of 1-10 µm sheet-like
particles. These sheet-like particles were also witnessed in HL pH-fractionated samples (fig.
43). It could mean that the acidic precipitation of lignin tends to produce sheet-like
microstructures, which can be altered when the lignin was dissolved in organic solvents. A
systematic SEM analysis of all the samples could confirm or invalidate this hypothesis.
Third, it appeared that, for HL, the SH3 fraction (fig. 43) was more porous than the SH1
fraction (fig. 41), which could result in higher electrochemical performances: carbon beads
could be more inserted into the lignin particles, allowing better conductivity and increased
pseudo-capacity.

79
Figure 41 SEM pictures of HL-SH1. The picture on the right is a 10-fold zoom of the red rectangle in the left
picture.
Figure 42 SEM pictures of DPL-F3. The picture on the right is a 10-fold zoom of the red rectangle in the left
picture.
Figure 43 SEM pictures of HL-SH3. The picture on the right is a 10-fold zoom of the red rectangle in the left
picture.
80
5.7.2. Lignin films are made of lignin particles embedded in carbon
matrix
SEM pictures of lignin-carbon films were taken. Films (15% lignin, 75% carbon, 10% PVDF)
were made from DPL, BL and HL, as well as repolymerized DPL, labelled DPL-S45, in order
to witness the microstructure and compare any structural differences between the four
samples. We observed lignin particles dispersed into a carbon matrix (fig. 44). The particles
were either sitting on top of the matrix (fig. 45) or partially embedded in it. Lignin particle
sizes ranged from 1 to 100 µm, without any preference for a certain size. We did not see any
significant differences between the microstructures of DPL, BL, HL and DPL-S45.The lignin-
carbon films that were described by Chalewaert-umpon and coworkers [9], [11] suggested
that mixing the two powders with a binder (PVDF or glyoxal) in NMP would lead to the
deposition of a thin film of lignin into the pores of activated carbon. The authors discussed the
order in which the three reactants (lignin, carbon, binder) ought to be mixed (fig. 47) and
concluded that the binder should be added after the mixing of lignin and carbon.
We did not observe the same kind of microstructure than Chalewaert-umpon’s (fig 46) [9];
that is, <0,5 µm particles of lignin covered with a thin layer of carbon. Instead, we saw >5 µm
particles of lignin, covered with beads of activated carbon or embedded in the carbon matrix.
The major difference between their results and ours can probably be explained by the carbon
used: we used carbon black with a surface area of 80 m²/g, while Chalewaert-umpon used
>1500 m² carbons (that is, smaller carbon beads), allowing the covering of lignin particle with
very thin carbon.
Other research teams [10], [17], [41], [46], [48] pointed out that the carbon microstructure,
pore size and electrode thickness played a major role, and that the bigger the surface area, the
better. Increasing surface area should thus be a priority for future works. When seeing the
picture of our four samples, it appeared that no lignin had a tendency to form a film, or to
preferentially form smaller particles, which would augment the surface area exposed to the
electrolyte during electrochemical experiments. Therefore, as all tested samples exhibited the
same kind of microstructure, we could assume that their electrochemical performances
measured in cyclic voltammetry were not influenced by the microstructure, and that any
performance difference could not be attributed to it.

81
Figure 44 SEM picture of lignin-carbon films. On the left, HL film. On the right, DPL film. White dots
are lignin aggregates. The black matrix is the carbon.
Figure 47 Schematic view of lignin-carbon mixing with glyoxal binder [ref 2]. (a) lignin is
mixed with glyoxal then with carbon (b) lignin is mixed with carbon then glyoxal..
Figure 46 SEM picture of a particule of
lignin (light grey) of DPL film sitting on top
of carbon beads (dark grey).
Figure 45 carbon-covered lignin particles
from Chalewaert-umpon’s article [ref 1].
Please note the difference with fig. 46,
which is at the same scale . Scale: the white
tick is 2 µm [9].
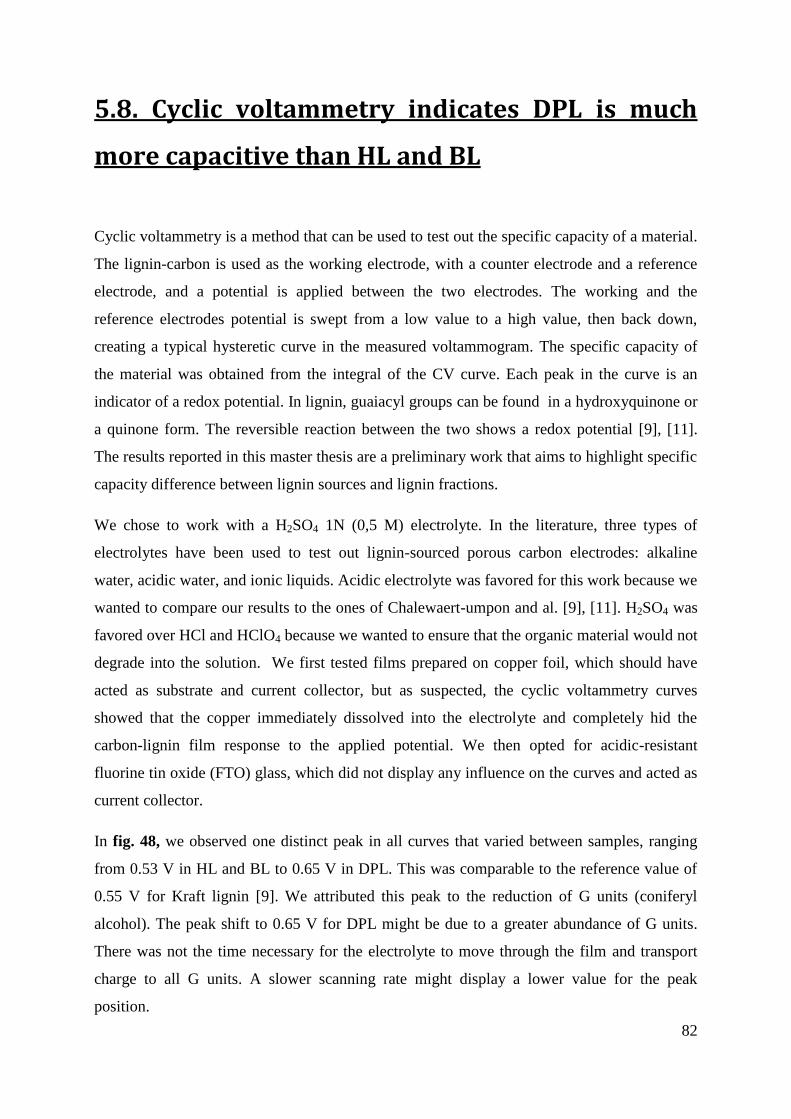
82
5.8. Cyclic voltammetry indicates DPL is much
more capacitive than HL and BL
Cyclic voltammetry is a method that can be used to test out the specific capacity of a material.
The lignin-carbon is used as the working electrode, with a counter electrode and a reference
electrode, and a potential is applied between the two electrodes. The working and the
reference electrodes potential is swept from a low value to a high value, then back down,
creating a typical hysteretic curve in the measured voltammogram. The specific capacity of
the material was obtained from the integral of the CV curve. Each peak in the curve is an
indicator of a redox potential. In lignin, guaiacyl groups can be found in a hydroxyquinone or
a quinone form. The reversible reaction between the two shows a redox potential [9], [11].
The results reported in this master thesis are a preliminary work that aims to highlight specific
capacity difference between lignin sources and lignin fractions.
We chose to work with a H2SO4 1N (0,5 M) electrolyte. In the literature, three types of
electrolytes have been used to test out lignin-sourced porous carbon electrodes: alkaline
water, acidic water, and ionic liquids. Acidic electrolyte was favored for this work because we
wanted to compare our results to the ones of Chalewaert-umpon and al. [9], [11]. H2SO4 was
favored over HCl and HClO4 because we wanted to ensure that the organic material would not
degrade into the solution. We first tested films prepared on copper foil, which should have
acted as substrate and current collector, but as suspected, the cyclic voltammetry curves
showed that the copper immediately dissolved into the electrolyte and completely hid the
carbon-lignin film response to the applied potential. We then opted for acidic-resistant
fluorine tin oxide (FTO) glass, which did not display any influence on the curves and acted as
current collector.
In fig. 48, we observed one distinct peak in all curves that varied between samples, ranging
from 0.53 V in HL and BL to 0.65 V in DPL. This was comparable to the reference value of
0.55 V for Kraft lignin [9]. We attributed this peak to the reduction of G units (coniferyl
alcohol). The peak shift to 0.65 V for DPL might be due to a greater abundance of G units.
There was not the time necessary for the electrolyte to move through the film and transport
charge to all G units. A slower scanning rate might display a lower value for the peak
position.
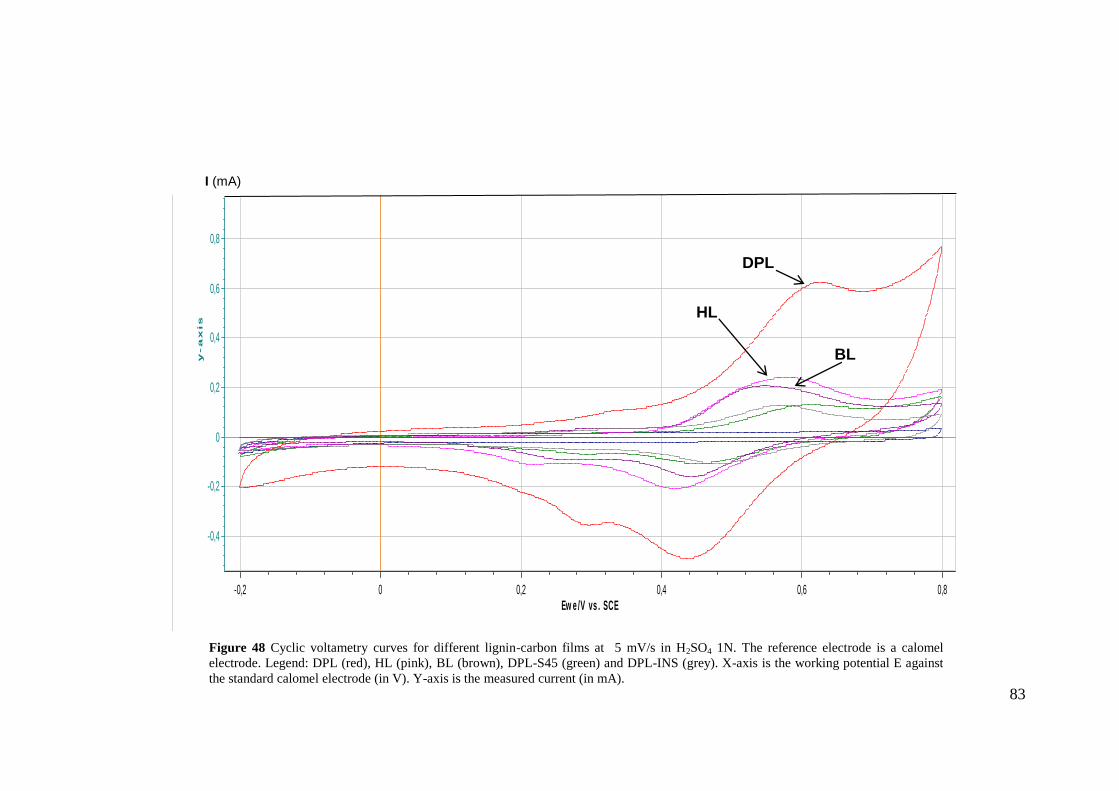
83
Ew e /V vs . SCE
0,80,60,40,20-0,2
y-a
xis
1,2
1
0,8
0,6
0,4
0,2
0
-0,2
-0,4
<I> vs. Ewe
NBC-002_H2SO4-1N_5mVs-1.mpr, cycle 3 D1_H2SO4-1N_5mVs-1.mpr, cycle 3 D45_H2SO4-1N_5mVs-1.mpr, cycle 3 M1_H2SO4-1N_5mVs-1.mpr, cycle 3 P1_H2SO4-1N_5mVs-1.mpr, cycle 3
INS-bis_H2SO4-1N_5mVs-1.mpr, cycle 3 FTO-blank_H2SO4-1N_5mVs-1.mpr, cycle 3 #
Figure 48 Cyclic voltametry curves for different lignin-carbon films at 5 mV/s in H2SO4 1N. The reference electrode is a calomel
electrode. Legend: DPL (red), HL (pink), BL (brown), DPL-S45 (green) and DPL-INS (grey). X-axis is the working potential E against
the standard calomel electrode (in V). Y-axis is the measured current (in mA).
DPL
HL
BL
I (mA)

84
Table 13 CV specific capacity results for different lignins and lignin fractions. The third column is the
substraction of the value of the second column by the carbon blank capacitive value (4.1 mAh/g). DPL displays a
close value to our reference value [9].
The intensity of the current detected for pristine DPL seemed much larger than the ones of all
the other samples. We thought this increased electron storage capacity was caused by the
natural abundance of quinone-like G units in DPL, whereas HL and BL contained
proportionally less G units, hence the lower specific capacity. The calculated specific
capacities were calculated and displayed in table 13. From these preliminary results (no
repetitions), we saw that DPL was 3 times more capacitive than HL and 8 times more
capacitive than BL. We also noticed that DPL-S45 and DPL-INS had negative contributions
to the overall specific capacity, i.e. their presence worsened the specific capacity of pristine
porous carbon. We hypothesized that their contribution was sufficiently small that film
inhomogeneity or statistical fluctuations made it look like they had a negative contribution;
repetition of the experiments should allow one to confirm or invalidate this hypothesis. The
pseudocapacitive contribution of our lignin in specific capacity measurements is almost
identical (~16 mAh/g) to the results of Chalewaert-umpon [9]. The higher value of 80 mAh/g
reported by the research team was caused by higher capacity carbon, not by lignin enhanced
pseudocapacity. The pioneering work of Chalewaert-umpon is thus partly confirmed. Also,
they used softwood Kraft lignin, and we found identical results for softwood soda lignin,
pointing towards the fact that the lignin type (softwood, hardwood, herbaceous) is a major
factor, much more than the pretreatment method.
Total capacity
(mAh/g) Lignin pseudocapacitive
contribution (mAh/g)
Reference Value for
lignin pseudocapacitive contribution (mAh/g) [9]
DPL 20.3 16.1
16.6
BL 5.6 1.5
HL 7.7 3.6
Carbon blank
4.1 /
FTO blank 0.004 /

85
5.9. Summarized overview: NMR, HPSEC and
FTIR agree on molecular weight determination
In tab 14 and tab. 15, we summarize our observations for the characterization of some chosen
fractions of DPL and HL, to witness any pattern, complementarity or disagreements between
techniques.
We observe that HPSEC-DMF and HPSEC-H2O agree: increase of Mw from F1 to INS for
DPL, decrease from SH1 to SH3 for HL. In almost all HPSEC results, though the absolute
value was different, the relative molecular weight increases and decreases were the same in
the two solvents. The fractionation methods we used in this master thesis were taken from
literature for their ability to discriminate molecular weight [38]. That objective seems
achieved for the three methods, though the mechanism that underlies the fractionation remains
unclear. The simplest explanation is simple volume to surface ratio: the small molecules
dissolved first, whatever the solvent, then the medium ones, then the large ones. However,
this hypothesis seems at best incomplete when we look at FTIR and NMR data. FTIR and
NMR data agreed on the aliphatic OH:COOH (aOH:COOH) relative proportions, showing an
interesting crosscheck between the two techniques. When compared with the molecular
weight, we observe that the aOH:COOH ratio and molecular weight appear to be correlated:
the higher the molecular weight, the higher the aOH:COOH ratio. As already mentioned in
section 5.5, we can hypothesize that aliphatic OH are mostly present in β-O-4 linkages and
COOH in end-chain units. Then the data makes sense: high molecular weight lignins have a
high ratio of linkages to end-chains, thus a high aOH:COOH ratio, and low molecular weight
lignins display the opposite. In summary, it looks as if HPSEC, NMR and FTIR data point to
the same piece of information: the molecular weight. HPSEC, via hydrodynamic volume and
NMR/FTIR, by the ratio aOH:COOH which is directly linked to molecular weight. Therefore,
the three analytical techniques support and crosscheck each other.
Finally, SEM pictures show that the molecular weight and the functionality content influenced
the microstructure, in pore size and in morphology: some samples displayed micrometric
sheets, others needles, and some, particles. It does not look like there are any links between
molecular weight, oxygenated moieties, and apparent microstructure.

86
Table 14 Summarized overview of all characterization results concerning DPL, DPL-F1, DPL-F3 and DPL-F4, in order to highlight crosschecks
and converging trends. In the framed boxes, “OH” means “aliphatic OH”.
DPL-F1 DPL-F2 DPL-F3 DPL-F4 DPL-INS DPL
FP 21% 26.2% 29.3% 8.7% 14.8% -
FTIR
Major bands
O-H
C=O
Aromatics
C-O
NMR -
Aromatics
70% G
30% H
HPSEC
74000 g/mol
5100 g/mol
Higher PDI in
DMF (2.45) than
water (1.53)
SEM - 10-100 µm sheets 10-100 µm sheets
2 µm « needles »
1-10 µm sheets
aggregated in 10-
30 µm particles
- -
Rich in COOH Poor in OH
Rich in OH Poor in COOH
C=O band decreases C-O and O-H band increase
Rich in COOH Poor in OH
Rich in OH Poor in COOH
22000 g/mol 127000 g/mol
PDI constant at ~1.5
3000 g/mol
8500 g/mol

87
Table 15 Summarized overview of all characterization results concerning HL, HL-SH1, HL-SH2 and HL-SH3, in order to highlight crosschecks
and converging trends. In the framed boxes, “OH” means “aliphatic OH”.

88
Table 16 List of highlights of this master thesis, ordered by topic.
6. Conclusion and perspectives
The characterization techniques used in this master thesis were fraction proportions, Klason
dosage of carbohydrates, FTIR, HPSEC, NMR, and SEM. Fraction proportions showed
equivalent repartition of lignin for most of organic fractions, and drastic differences in pH
fractions. These differences were used to infer carboxylic acid and phenol relative contents.
Klason lignin and carbohydrate dosage showed the lignin samples purity was >97%. It
assured that inorganic salt content would not interfere with electrochemical measurements.
FTIR spectroscopy indicated general moieties content trends, such as C=O increase/O-H
decrease between F1 and INS of DPL, or the aromatics and C-O content of some fractions.
HPSEC was performed in DMF and in water, and the molecular weights trends almost always
agreed in both solvents. Mn and Mw increased between F1 and INS and between SA1 and SA3
for all three lignins. Mn and Mw decreased between SH1 and SH3 for all three lignins (tab.
16). NMR showed expected H:G:S ratios. It also exhibited the evolutions in aliphatic
OH:COOH ratios, that were correlated with molecular weight, as explained in the
summarized section 5.9. SEM pictures showed different microstructures, but without
suggesting a link between microstructure and molecular weight or functionality content.
Topic Highlights
Fractionation method Organic solvents fractionate lignin from smallest to largest
pH fractionates lignin from largest to smallest
Characterization NMR and FTIR, through aliphatic OH:COOH ratio, agree with
HPSEC on molecular weights
Electrochemical results Softwood lignin is much more capacitive than hardwood or and
herbaceous lignins
Others Hansen solubility parameters rationalize solubility observations

89
Table 17 List of minor hurdles met during this master thesis. On the right, the perspectives of improvement
for these problems.
The three fractionation methods did work, according to HPSEC, NMR and FTIR data. pH
fractionation was the most simple, but it did not work on DPL. Sonication did show an
increase of Mw in HPSEC, between 20 and 30%. Still, no changes were observed in FTIR
data. The collection of 31
P or 2D NMR data could confirm or invalidate the method as
efficient or inefficient for repolymerization. We also showed that ball-milling had little effect
on lignin molecular weight and none on functionality content.
Finally, preliminary CV measurement were performed on DPL, HL and BL. DPL had similar
values to the reference value [9], i.e. ~16 mAh/g. BL and HL displayed 8 and 4 times lower
capacity values, respectively. These results highlighted the fact that the type of lignin, with a
high G content, had a major impact, while the difference in pretreatment (alkaline vs Kraft)
did not seem to have impacted the result.
Minor hurdles (tab. 17) include the dependence of HPSEC values on a non-related polymer to
calibrate the retention time-molecular weight relationship, because we assumed polystyrene
does not behave like lignin in solution, and thus is not reliable for a reference hydrodynamic
volume. Perspectives include osmometry, which relies on colligative properties, and not
hydrodynamic volume, viscosimetry, which relies on friction, and light scattering, which
relies on colloidal diffusion.
The poor lignin-carbon film homogeneity we observe in SEM could probably be bettered by
grain size reduction in dry ball-milling, or ball-milling in NMP, even more so since we
showed in this master thesis that it did not affect functionality content.
Hurdles Perspectives
HPSEC calibration curve Osmometry, viscosimetry, light scattering
Poor film homogeneity Ball-milling, optimization
NMR insolubility Replace CDCl3 by DMF-d7
Organic solvent sequence has no trend Create a new sequence based on Hansen
solubility parameters
Aromatics and C-O too complex FTIR 2D-NMR
Stepwise fractionation Parallel fractionation

90
The organic sequence we tested (EtOAc, MEK, MeOH, dioxane:water 95:5) worked
empirically, but did not follow any trend, preventing solubility interpretations. Using Hansen
solubility parameters, we could create rationalized sequences that would fractionate and
highlight certain functionalities. For example, using the table in Appendix III, we could test
the sequence: methyl iso-amyl ketone, n-butyl propionate, ethyl acetate, isopentyl alcohol and
2-butanol, which have similar δD (~16) and δP (~5) while their δH value varies: 4.1, 5.9, 7.2,
13.3 and 14.5, respectively.
As we discussed in section 5.6, DMF-d7, expensive but more performing than CDCl3, could
be used to help solubilize some fractions in NMR. Also, hard-to-analyze FTIR bands could be
supported by HSQC NMR data. In these, the second dimension allows for identification and
dosage of each linkage, thus of aromatics and ethers, for example.
With stepwise fractionation, we were not able to observe some of the lignin-organic solvent
interactions. If a molecule had dissolved in solvent 1, then we were not allowed to see its
interactions with solvent 2 or any of the following solvents. Consequently, we think a parallel
fractionation, i.e. the dissolution of pristine lignin in all solvents, would bring complementary
and important pieces of data to stepwise fractionation.
Finally, we think DPL-F1 and DPL-SH3, low molecular weight fractions, should give better
results in CV than DPL alone. The reasoning is: DPL-INS shows a null specific capacity, and
it makes up 15% of DPL. It contains all the highest molecular weight molecules. Therefore,
smaller lignin fractions should be the most redox-active. Once rid of non-redox-active, high
molecular weight molecules, small molecular weight lignins should, per gram, be more
performing. Further investigation of small molecular weight is thus needed and advised.
If the small molecular weight lignin molecules happen to be more capacitive than large
molecular weight lignin, then their valorization should go through fractionation. We showed
that acetone/water 6:4 and ethyl acetate preferentially extracted small lignins. Therefore, in a
biorefinery perspective, we would advise to choose acetone/water, since water is harmless and
acetone can be bio-sourced. The other fractions could then be valorized in other
electrochemical applications (binder, insulator, carbonized in porous carbon) or in lower value
applications (cement, fertilizer, low-grade fuel), paving the way for the complete valorization
of lignin.

91
7. Bibliography
[1] V. Menon and M. Rao, “Trends in bioconversion of lignocellulose: Biofuels, platform
chemicals & biorefinery concept,” Prog. Energy Combust. Sci., vol. 38, no. 4, pp. 522–
550, 2012.
[2] W. Tang et al., “Natural biomass-derived carbons for electrochemical energy storage,”
Mater. Res. Bull., vol. 88, pp. 234–241, 2017.
[3] D. M. Le, A. D. Nielsen, H. R. Sørensen, and A. S. Meyer, “Characterisation of
Authentic Lignin Biorefinery Samples by Fourier Transform Infrared Spectroscopy and
Determination of the Chemical Formula for Lignin,” Bioenergy Res., vol. 10, no. 4, pp.
1025–1035, 2017.
[4] S. Admassie, F. N. Ajjan, A. Elfwing, and O. Inganäs, “Biopolymer hybrid electrodes
for scalable electricity storage,” Mater. Horiz., vol. 3, no. 3, pp. 174–185, 2016.
[5] Z. Strassberger, S. Tanase, and G. Rothenberg, “The pros and cons of lignin
valorisation in an integrated biorefinery,” RSC Adv., vol. 4, no. 48, pp. 25310–25318,
2014.
[6] V. Natalis, “Utilisation de solvants eutectiques profonds ( DEP ) et de solvants
commutables comme méthodologie verte pour l ’ extraction et la valorisation de la
biomasse lignocellulosique et de ses composants apparentés Introduction,” no. figure 1,
2017.
[7] W. Boerjan, J. Ralph, and M. Baucher, “LIGNIN BIOSYNTHESIS,” Annu. Rev. Plant
Biol., vol. 54, no. 1, pp. 519–546, 2003.
[8] W. Liu et al., “Lignin-derived carbon nanosheets for high-capacitance
supercapacitors,” RSC Adv., vol. 7, no. 77, pp. 48537–48543, 2017.
[9] S. Chaleawlert-umpon, T. Berthold, X. Wang, M. Antonietti, and C. Liedel, “Kraft
Lignin as Electrode Material for Sustainable Electrochemical Energy Storage,” Adv.
Mater. Interfaces, vol. 1700698, pp. 1–7, 2017.

92
[10] H. Wang, Y. Yang, and L. Guo, “Renewable-Biomolecule-Based Electrochemical
Energy-Storage Materials,” Adv. Energy Mater., vol. 1700663, pp. 1–6, 2017.
[11] S. Chaleawlert-umpon and C. Liedel, “More sustainable energy storage: lignin based
electrodes with glyoxal crosslinking,” J. Mater. Chem. A, pp. 24344–24352, 2017.
[12] A. Mukhopadhyay, Y. Jiao, R. Katahira, P. N. Ciesielski, M. Himmel, and H. Zhu,
“Heavy Metal-Free Tannin from Bark for Sustainable Energy Storage,” Nano Lett., vol.
17, no. 12, pp. 7897–7907, 2017.
[13] A. J. Ragauskas et al., “Lignin valorization: Improving lignin processing in the
biorefinery,” Science (80-. )., vol. 344, no. 6185, 2014.
[14] H. Zhang et al., “Alkaline lignin derived porous carbon as an efficient scaffold for
lithium-selenium battery cathode,” Carbon N. Y., vol. 122, pp. 547–555, 2017.
[15] F. N. Ajjan et al., “High performance PEDOT/lignin biopolymer composites for
electrochemical supercapacitors,” J. Mater. Chem. A, vol. 4, no. 5, pp. 1838–1847,
2016.
[16] A. K. Kumar and B. S. Parikh, “Natural deep eutectic solvent mediated pretreatment of
rice straw : bioanalytical characterization of lignin extract and enzymatic hydrolysis of
pretreated biomass residue,” Environ. Sci. Pollut. Res., pp. 9265–9275, 2016.
[17] M. J. Uddin, P. K. Alaboina, L. Zhang, and S. J. Cho, “A low-cost, environment-
friendly lignin-polyvinyl alcohol nanofiber separator using a water-based method for
safer and faster lithium-ion batteries,” Mater. Sci. Eng. B Solid-State Mater. Adv.
Technol., vol. 223, pp. 84–90, 2017.
[18] A. K. Kumar and S. Sharma, “Recent updates on different methods of pretreatment of
lignocellulosic feedstocks: a review,” Bioresour. Bioprocess., vol. 4, no. 1, p. 7, 2017.
[19] R. Rinaldi et al., “Paving the Way for Lignin Valorisation: Recent Advances in
Bioengineering, Biorefining and Catalysis,” Angew. Chemie - Int. Ed., vol. 55, no. 29,
pp. 8164–8215, 2016.
[20] G. D. Mcglnnls, W. W. Wllson, and C. I. M. E. Mullen, “Biomass Pretreatment with
Water and High-pressure Oxygen . The Wet-Oxidation Process,” pp. 352–357, 1983.

93
[21] C. Mart, H. B. Klinke, and A. Belinda, “Wet oxidation as a pretreatment method for
enhancing the enzymatic convertibility of sugarcane bagasse,” vol. 40, pp. 426–432,
2007.
[22] C.-J. Wei and C.-Y. Cheng, “Effect of hydrogen peroxide pretreatment on the structural
features and the enzymatic hydrolysis of rice straw,” Biotechnol. Bioeng., vol. 27, no.
10, pp. 1418–1426, 1985.
[23] C. J. Chuck, H. J. Parker, R. W. Jenkins, and J. Donnelly, “Renewable biofuel additives
from the ozonolysis of lignin,” Bioresour. Technol., vol. 143, pp. 549–554, 2013.
[24] Y. Zhao, Y. Wang, J. Y. Zhu, A. Ragauskas, and Y. Deng, “Enhanced enzymatic
hydrolysis of spruce by alkaline pretreatment at low temperature,” Biotechnol. Bioeng.,
vol. 99, no. 6, pp. 1320–1328, 2008.
[25] X. Zhao, K. Cheng, and D. Liu, “Organosolv pretreatment of lignocellulosic biomass
for enzymatic hydrolysis,” Appl. Microbiol. Biotechnol., vol. 82, no. 5, pp. 815–827,
2009.
[26] Z. Wu and Y. Y. Lee, “Ammonia recycled percolation as a complementary
pretreatment to the dilute-acid process.,” Appl. Biochem. Biotechnol., vol. 63–65, pp.
21–34, 1997.
[27] F. F. De Menezes et al., “Alkaline Pretreatment Severity Leads to Different Lignin
Applications in Sugar Cane Biorefineries,” ACS Sustain. Chem. Eng., vol. 5, no. 7, pp.
5702–5712, 2017.
[28] F. Cotana, M. Barbanera, D. Foschini, E. Lascaro, and C. Buratti, “Preliminary
optimization of alkaline pretreatment for ethanol production from vineyard pruning,”
Energy Procedia, vol. 82, pp. 389–394, 2015.
[29] W. Palz, D. Pirrwitz, and C. of the E. Communities, “Energy from Biomass,” pp. 1–4,
1984.
[30] S. Xie et al., “Advanced Chemical Design for Efficient Lignin Bioconversion,” ACS
Sustain. Chem. Eng., vol. 5, no. 3, pp. 2215–2223, 2017.
[31] R. J. A. Gosselink, Lignin as a renewable aromatic resource for the chemical industry,

94
no. December. 2011.
[32] C. G. Boeriu, D. Bravo, R. J. A. Gosselink, and J. E. G. Van Dam, “Characterisation of
structure-dependent functional properties of lignin with infrared spectroscopy,” Ind.
Crops Prod., vol. 20, no. 2, pp. 205–218, 2004.
[33] “Phenol price.”
[34] J. S. Lupoi, S. Singh, R. Parthasarathi, B. A. Simmons, and R. J. Henry, “Recent
innovations in analytical methods for the qualitative and quantitative assessment of
lignin,” Renew. Sustain. Energy Rev., vol. 49, pp. 871–906, 2015.
[35] E. A. B. da Silva et al., “An integrated process to produce vanillin and lignin-based
polyurethanes from Kraft lignin,” Chem. Eng. Res. Des., vol. 87, no. 9, pp. 1276–1292,
2009.
[36] X. H. Li and S. Bin Wu, “Chemical structure and pyrolysis characteristics of the soda-
alkali lignin fractions,” BioResources, vol. 9, no. 4, pp. 6277–6289, 2014.
[37] A. Ang, Z. Ashaari, E. S. Bakar, and N. A. Ibrahim, “Characterisation of sequential
solvent fractionation and base-catalysed depolymerisation of treated alkali lignin,”
BioResources, vol. 10, no. 3, pp. 4137–4151, 2015.
[38] J. Domínguez-Robles, T. Tamminen, T. Liitiä, M. S. Peresin, A. Rodríguez, and A. S.
Jääskeläinen, “Aqueous acetone fractionation of kraft, organosolv and soda lignins,”
Int. J. Biol. Macromol., vol. 106, pp. 979–987, 2018.
[39] D. P. Dubal, O. Ayyad, V. Ruiz, and P. Gómez-Romero, “Hybrid energy storage: the
merging of battery and supercapacitor chemistries,” Chem. Soc. Rev., vol. 44, no. 7, pp.
1777–1790, 2015.
[40] E. J. Son, J. H. Kim, K. Kim, and C. B. Park, “Quinone and its derivatives for energy
harvesting and storage materials,” J. Mater. Chem. A, vol. 4, no. 29, pp. 11179–11202,
2016.
[41] N. Guo, M. Li, X. Sun, F. Wang, and R. Yang, “Enzymatic hydrolysis lignin derived
hierarchical porous carbon for supercapacitors in ionic liquids with high power and
energy densities,” Green Chem., vol. 19, no. 11, pp. 2595–2602, 2017.

95
[42] D. Yoon, J. Hwang, W. Chang, and J. Kim, “Carbon with Expanded and Well-
Developed Graphene Planes Derived Directly from Condensed Lignin as a High-
Performance Anode for Sodium-Ion Batteries,” ACS Appl. Mater. Interfaces, vol. 10,
no. 1, pp. 569–581, 2018.
[43] R. Pucciariello, M. D’Auria, V. Villani, G. Giammarino, G. Gorrasi, and G. Shulga,
“Lignin/Poly(ε-Caprolactone) blends with tuneable mechanical properties prepared by
high energy ball-milling,” J. Polym. Environ., vol. 18, no. 3, pp. 326–334, 2010.
[44] C. D. Tran, H. C. Ho, J. K. Keum, J. Chen, N. C. Gallego, and A. K. Naskar,
“Sustainable Energy-Storage Materials from Lignin–Graphene Nanocomposite-
Derived Porous Carbon Film,” Energy Technol., vol. 5, no. 11, pp. 1927–1935, 2017.
[45] K. Ojha, B. Kumar, and A. K. Ganguli, “Biomass derived graphene-like activated and
non-activated porous carbon for advanced supercapacitors,” J. Chem. Sci., vol. 129, no.
3, pp. 397–404, 2017.
[46] M. Klose et al., “Softwood Lignin as a Sustainable Feedstock for Porous Carbons as
Active Material for Supercapacitors Using an Ionic Liquid Electrolyte,” ACS Sustain.
Chem. Eng., vol. 5, no. 5, pp. 4094–4102, 2017.
[47] L. Zhu, F. Shen, R. L. Smith, L. Yan, L. Li, and X. Qi, “Black liquor-derived porous
carbons from rice straw for high-performance supercapacitors,” Chem. Eng. J., vol.
316, pp. 770–777, 2017.
[48] S. Hu and Y.-L. Hsieh, “Lignin derived activated carbon particulates as an electric
supercapacitor: carbonization and activation on porous structures and microstructures,”
RSC Adv., vol. 7, no. 48, pp. 30459–30468, 2017.
[49] S. Hu, S. Zhang, N. Pan, and Y. Lo Hsieh, “High energy density supercapacitors from
lignin derived submicron activated carbon fibers in aqueous electrolytes,” J. Power
Sources, vol. 270, no. x, pp. 106–112, 2014.
[50] C. Lai et al., “Free-standing and mechanically flexible mats consisting of electrospun
carbon nanofibers made from a natural product of alkali lignin as binder-free electrodes
for high-performance supercapacitors,” J. Power Sources, vol. 247, pp. 134–141, 2014.
[51] D. Saha et al., “Studies on supercapacitor electrode material from activated lignin-

96
derived mesoporous carbon,” Langmuir, vol. 30, pp. 900–910, 2014.
[52] F. Chen et al., “Self-assembly of NiO nanoparticles in lignin-derived mesoporous
carbons for supercapacitor applications,” Green Chem., vol. 15, no. 11, p. 3057, 2013.
[53] W. E. Tenhaeff, O. Rios, K. More, and M. A. McGuire, “Highly robust lithium ion
battery anodes from lignin: An abundant, renewable, and low-cost material,” Adv.
Funct. Mater., vol. 24, no. 1, pp. 86–94, 2014.
[54] T. Chen, J. Hu, L. Zhang, J. Pan, Y. Liu, and Y. T. Cheng, “High performance binder-
free SiOx/C composite LIB electrode made of SiOxand lignin,” J. Power Sources, vol.
362, pp. 236–242, 2017.
[55] X. Geng et al., “Bioinspired Ultrastable Lignin Cathode via Graphene Reconfiguration
for Energy Storage,” ACS Sustain. Chem. Eng., vol. 5, no. 4, pp. 3553–3561, 2017.
[56] J. Sameni, S. Krigstin, and M. Sain, “Solubility of Lignin and Acetylated Lignin in
Organic Solvents,” BioResources, vol. 12, no. 1, pp. 1548–1565, 2017.
[57] “Table de pKa.” [Online]. Available: http://ccchemteach.com/?page_id=64.
[58] E. I. Evstigneev, “Factors affecting lignin solubility,” Russ. J. Appl. Chem., vol. 84, no.
6, pp. 1040–1045, 2011.
[59] T. B. Nielsen and C. M. Hansen, “Elastomer swelling and Hansen solubility
parameters,” Polym. Test., vol. 24, no. 8, pp. 1054–1061, 2005.
[60] “Hansen Parameters Table.” [Online]. Available: https://www.hansen-
solubility.com/downloads.php.
[61] O. Y. Abdelaziz and C. P. Hulteberg, “Physicochemical Characterisation of Technical
Lignins for Their Potential Valorisation,” Waste and Biomass Valorization, vol. 8, no.
3, pp. 859–869, 2017.
[62] A. Casas, M. V. Alonso, M. Oliet, E. Rojo, and F. Rodríguez, “FTIR analysis of lignin
regenerated from Pinus radiata and Eucalyptus globulus woods dissolved in
imidazolium-based ionic liquids,” J. Chem. Technol. Biotechnol., vol. 87, no. 4, pp.
472–480, 2012.

97
[63] M. Konstantopoulou et al., “Variation in susceptibility to microbial lignin oxidation in
a set of wheat straw cultivars : influence of genetic , seasonal and environmental
factors,” vol. 32, no. 4, 2017.
[64] H. Kim, J. Ralph, N. Yahiaoui, M. Pean, and A. M. Boudet, “Cross-coupling of
hydroxycinnamyl aldehydes into lignins,” Org. Lett., vol. 2, no. 15, pp. 2197–2200,
2000.
[65] G. Hatfield, G. Maciel, O. Erbatur, and G. Erbatur, “Qualitative and Quantitative
Analysis of Solid Lignin Samples by Carbon- 13 Nuclear Magnetic Resonance
Spectrometry,” Anal. Chem., vol. 59, pp. 172–179, 1987.
[66] A. Guerra, A. R. Gaspar, S. Contreras, L. A. Lucia, C. Crestini, and D. S.
Argyropoulos, “On the propensity of lignin to associate: A size exclusion
chromatography study with lignin derivatives isolated from different plant species,”
Phytochemistry, vol. 68, no. 20, pp. 2570–2583, 2007.
[67] T. Wells, M. Kosa, and A. J. Ragauskas, “Polymerization of Kraft lignin via
ultrasonication for high-molecular- weight applications,” Ultrason. Sonochem., vol. 20,
no. 6, pp. 1463–1469, 2013.
[68] D. Dong and A. Fricke, “Intrinsic viscosity and the molecular weight of kraft lignin,”
Polymer (Guildf)., vol. 36, no. 10, pp. 2075–2078, 1995.
[69] M. G. Neira-Velázquez, M. T. Rodríguez-Hernández, E. Hernández-Hernández, and A.
R. Y. Ruiz-Martínez, “Polymer Molecular Weight Measurement,” Handb. Polym.
Synth. Charact. Process., pp. 355–366, 2013.
[70] “Price DMF-d7.” [Online]. Available:
https://www.sigmaaldrich.com/catalog/product/aldrich/189979?lang=fr®ion=BE
[71] “Price CDCl3.” [Online]. Available:
https://www.sigmaaldrich.com/catalog/product/aldrich/151823?lang=fr®ion=BE&g
clid=CjwKCAjwpIjZBRBsEiwA0TN1r1DOMBrVRSy45OPvtWcdMA1QnyGEgd5rhz
wQqkCG80KdNt6vgqH31hoCnTMQAvD_BwE
[72] “Hardwood symbol.” [Online]. Available: https://visualpharm.com/free-icons/oak tree-
595b40b75ba036ed117d7c11.

98
[73] “Softwood symbol.” [Online]. Available:
https://www.pinterest.com/pin/280138039300249796/.
[74] “Grass symbol.” [Online]. Available: https://icon-icons.com/es/icono/alta-
hierba/38534.
[75] “Lignin scheme.” [Online]. Available: https://www.nrel.gov/research/gregg-
beckham.html.
[76] Y. Pu, S. Cao, and A. J. Ragauskas, “Application of quantitative 31P NMR in biomass
lignin and biofuel precursors characterization,” Energy Environ. Sci., vol. 4, no. 9, p.
3154, 2011.

99
8. Appendixes
Appendix I : Klason calculations
Table 18 Ashes (inorganic salts) calculation for Douglas Pine lignin, given as an exemple. The ashes are
weighted by difference after carbonization of acid insoluble lignin.
N° sample
sample mass (g)
dry matter
(%)
dry crucible mass (g)
crucible mass + dry matter
(g)
crucible + ashes (g)
dry solid residue (g)
ashes (%)
ashes average
(%)
1 0.1002 95.10 49.0468 49.1276 49.0473 0.0808 0.52
1.92 2 0.1025 95.30 50.3547 50.4360 50,.3581 0.0813 3.48
3 0.1020 95.10 50.3401 50.4222 50,.3418 0.0821 1.75
Table 19bis Acid soluble lignin determination of Douglas Pine lignin by UV absorption at 280 nm.
N° sample Dilution (x
times) Absorbance average (AU)
Acid soluble
lignin (%)
Acid soluble lignin (mg/g)
Acid soluble lignin
average
Standard deviation acid soluble lignin
(%)
1 50 0.3327 13.76 137.63
15.15 2.36 2 50 0.3423 13.82 138.16
3 50 0.4400 17.88 178.82

100
1270-1265 1220 1220-1215 1215-1210 1190 1150-1140 1130 1125 1115 1085-1080 1035-1030 860-855 845-835 820-810
phenol
primary
secondary
CH
CH2
CH3
Ar-OCH3
Aromatic skeleton
C=C
C-C
Carbonyl unconjugated
conjugated
COOH
Ether aromatic
aliphatic
S unit (G contamination)
no contamination
G unit C-H deformation
C-O stretch
alcohols
alcane
Appendix II : FTIR data
Table 20 FTIR assignation table, drawn and summarized from literature. Region 1270-810 cm-1
. Black: at least two sources. Grey: one source. Sources: [3], [32], [61]–[63]

101
3460-3100 2960-2925 2850-2840 3000-2500 1735-1700 1660-1650 1600-1585 1515-1500 1425-1417 1375-1365 1330-1325
phenol
primary
secondary
CH
CH2
CH3
Ar-OCH3
Aromatic skeleton
C=C
C-C
Carbonyl unconjugated
conjugated
COOH
Ether aromatic
aliphatic
S unit (G contamination)
no contamination
G unit C-H deformation
C-O stretch
alcohols
alcane
Table 21 FTIR assignation table, drawn and summarized from literature. Region 3460-1325 cm-1
. Black: at least two sources. Grey: one source. Sources: [3], [32], [61]–[63]

102
Figure 50 Comparative spectrum of BL, zoom on the 3600-2700 cm-1
region. F1 in red, F2 in pink, F3 in
blue, F4 in green and INS in black.
Figure 49 Comparative spectrum of BL, zoom on the 1800-900 cm-1
region. F1 in red, F2 in pink, F3 in
blue, F4 in green and INS in black.

103
Figure 52 Comparative spectrum of the acetone/water fractions of HL: SA1 (red), SA2 (black) and SA3 (blue)
Figure 51 Comparative spectrum of BL-BM 36h (black) and BL-BM-108 (red)

104
Figure 53 Comparative spectrum of HL, zoom on the 3600-2700 cm-1
region. F1 in red, F2 in pink, F3 in
blue, F4 in green and INS in black.
Figure 54 Comparative spectrum of BL, zoom on the 1800-900 cm-1
region. F1 in red, F2 in pink, F3 in
blue, F4 in green and INS in black.

105
Figure 55 Comparative spectrum of HL-BM 36 (red), HL-BM72 (black) and BL-BM108 (blue)
Figure 56 Comparative spectrum of HL (black) and HL-S45 (red)

106
APPENDIX III : Hansen parameters
Table 22 Table of Hansen parameters for common solvents and polymers. The Ra was computed from the
Hansen parameters of lignin. In green, solvents with Ra < 11,5 [60].
Solvents dD dP dH Ra
Acetone 15,5 10,4 7 16,6
Acetonitrile 15,3 18 6,1 17,5
n-Amyl Acetate 15,8 3,3 6,1 19,5
n-Amyl Alcohol 15,9 5,9 13,9 14,8
Benzene 18,4 0 2 21,7
Benzyl Alcohol 18,4 6,3 13,7 11,0
Benzyl Benzoate 20 5,1 5,2 15,2
1-Butanol 16 5,7 15,8 14,5
2-Butanol 15,8 5,7 14,5 15,0
n-Butyl Acetate 15,8 3,7 6,3 19,2
t-Butyl Acetate 15 3,7 6 20,4
t-Butyl Alcohol 15,2 5,1 14,7 16,3
Butyl Benzoate 18,3 5,6 5,5 15,9
Butyl Diglycol Acetate 16 4,1 8,2 17,7
Butyl Glycol Acetate 15,3 7,5 6,8 17,9
n-Butyl Propionate 15,7 5,5 5,9 18,7
Caprolactone (Epsilon) 19,7 15 7,4 10,5
Chloroform 17,8 3,1 5,7 17,7
m-Cresol 18,5 6,5 13,7 10,7
Cyclohexane 16,8 0 0,2 24,1
Cyclohexanol 17,4 4,1 13,5 13,9
Cyclohexanone 17,8 8,4 5,1 15,5
Di-isoButyl Ketone 16 3,7 4,1 20,3
Diacetone Alcohol 15,8 8,2 10,8 14,9
Diethyl Ether 14,5 2,9 4,6 22,3
Diethylene Glycol Monobutyl Ether 16 7 10,6 15,1
Dimethyl Cyclohexane 16,1 0 1,1 24,1
Dimethyl Sulfoxide (DMSO) 18,4 16,4 10,2 10,0
1,4-Dioxane 17,5 1,8 9 17,1
1,3-Dioxolane 18,1 6,6 9,3 13,1
Dipropylene Glycol 16,5 10,6 17,7 11,4
Dipropylene Glycol Methyl Ether 15,5 5,7 11,2 16,3
Dipropylene Glycol Mono n-Butyl Ether 15,7 6,5 10 16,1
Ethanol 15,8 8,8 19,4 13,5
Ethyl Acetate 15,8 5,3 7,2 17,9
Ethyl Benzene 17,8 0,6 1,4 22,1
Ethyl Lactate 16 7,6 12,5 14,2
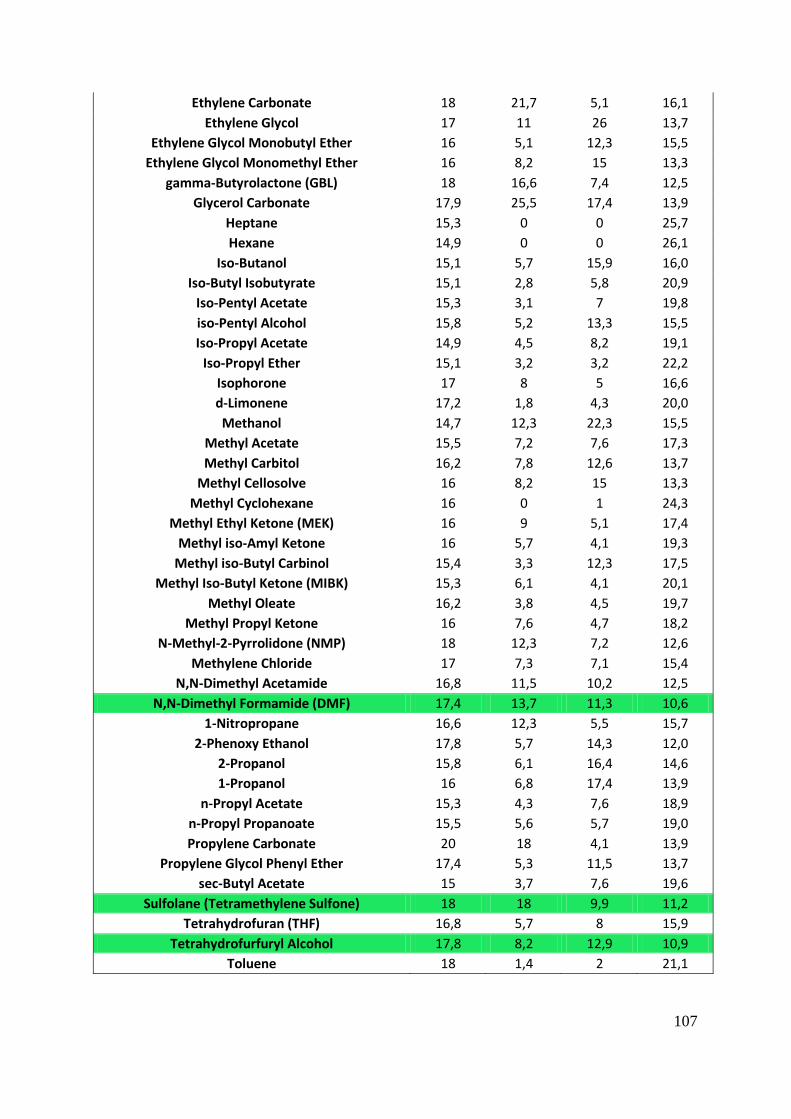
107
Ethylene Carbonate 18 21,7 5,1 16,1
Ethylene Glycol 17 11 26 13,7
Ethylene Glycol Monobutyl Ether 16 5,1 12,3 15,5
Ethylene Glycol Monomethyl Ether 16 8,2 15 13,3
gamma-Butyrolactone (GBL) 18 16,6 7,4 12,5
Glycerol Carbonate 17,9 25,5 17,4 13,9
Heptane 15,3 0 0 25,7
Hexane 14,9 0 0 26,1
Iso-Butanol 15,1 5,7 15,9 16,0
Iso-Butyl Isobutyrate 15,1 2,8 5,8 20,9
Iso-Pentyl Acetate 15,3 3,1 7 19,8
iso-Pentyl Alcohol 15,8 5,2 13,3 15,5
Iso-Propyl Acetate 14,9 4,5 8,2 19,1
Iso-Propyl Ether 15,1 3,2 3,2 22,2
Isophorone 17 8 5 16,6
d-Limonene 17,2 1,8 4,3 20,0
Methanol 14,7 12,3 22,3 15,5
Methyl Acetate 15,5 7,2 7,6 17,3
Methyl Carbitol 16,2 7,8 12,6 13,7
Methyl Cellosolve 16 8,2 15 13,3
Methyl Cyclohexane 16 0 1 24,3
Methyl Ethyl Ketone (MEK) 16 9 5,1 17,4
Methyl iso-Amyl Ketone 16 5,7 4,1 19,3
Methyl iso-Butyl Carbinol 15,4 3,3 12,3 17,5
Methyl Iso-Butyl Ketone (MIBK) 15,3 6,1 4,1 20,1
Methyl Oleate 16,2 3,8 4,5 19,7
Methyl Propyl Ketone 16 7,6 4,7 18,2
N-Methyl-2-Pyrrolidone (NMP) 18 12,3 7,2 12,6
Methylene Chloride 17 7,3 7,1 15,4
N,N-Dimethyl Acetamide 16,8 11,5 10,2 12,5
N,N-Dimethyl Formamide (DMF) 17,4 13,7 11,3 10,6
1-Nitropropane 16,6 12,3 5,5 15,7
2-Phenoxy Ethanol 17,8 5,7 14,3 12,0
2-Propanol 15,8 6,1 16,4 14,6
1-Propanol 16 6,8 17,4 13,9
n-Propyl Acetate 15,3 4,3 7,6 18,9
n-Propyl Propanoate 15,5 5,6 5,7 19,0
Propylene Carbonate 20 18 4,1 13,9
Propylene Glycol Phenyl Ether 17,4 5,3 11,5 13,7
sec-Butyl Acetate 15 3,7 7,6 19,6
Sulfolane (Tetramethylene Sulfone) 18 18 9,9 11,2
Tetrahydrofuran (THF) 16,8 5,7 8 15,9
Tetrahydrofurfuryl Alcohol 17,8 8,2 12,9 10,9
Toluene 18 1,4 2 21,1

108
Figure 57 2D slice of Hansen space. All dots represent one solvent that was used in this master thesis. On the
right, in blue, lignin.
Figure 58 2D slice of Hansen space. All dots represent one solvent that was used in this master thesis. On the
right, in blue, lignin.
δP [(MPa)1/2]
δD [(MPa)1/2]
δH [(MPa)1/2]
δP [(MPa)1/2]

109
Appendix IV : HPSEC polystyrene calibration
curve
Table 23 Polystyrene retention times and mass average molecular weights. The relationship between log (Mw)
and tr is linear and can be used to transform one into the other
Calibration curve
Polystyrene molecular weight MW (Da) log (MW) Retention time (min)
1000 3.00 29.016
2000 3.30 27.693
3000 3.48 26.646
4000 3.60 26.152
10000 4.00 24.106
20000 4.30 22.704
30000 4.48 21.781
Figure 59 Calibration curve of polystyrene for HPSEC, coming from the data in table 22
j
y = -4.9196x + 43.827 R² = 0.9994
20
22
24
26
28
30
2,80 3,30 3,80 4,30 4,80
Series1
Linear (Series1)