Validity and Reliability of the 112-Mile Run-Walk as an · PDF fileValidity and Reliability of...
13
Pediatric Exercise Science, 1996, 8, 130-1 42 0 1996 Human Kinetics Publishers. Inc. Validity and Reliability of the 112-Mile Run-Walk as an Indicator of Aerobic Fitness in Children With Mental Retardation Bo Fernhall, Ken Pitetti, Nancy Stubbs, and Louis Stadler, Jr. The purpose of this study was to determine the relationship between V0,max and the 112-mile run-walk and the reliability of each in children with mental retardation (MR). Twenty-three children (13 boys, 10 girls) with mild or moderate MR participated in the study. Two maximal treadmill protocols with metabolic measurements and two 112-mile run-walk trials were ran- domly conducted on separate days. There was no difference between Trial 1 and Trial 2 for V0,max (28.2 vs. 29.6 ml . kg-' . min-I), maximal heart rate (175 vs. 177 bpm), or run-walk time (7.2 vs. 7.1 min). The test-retest corre- lations were r = .90 for VO,max, r = .81 for maximal heart rate, and r = .96 for the 112-mile run-walk @ < .05). The correlation between V0,max and the ID-mile run-walk was r = -.60 0, < .05). Adding body mass index to the model improved R to .67 (SEE = 7.3). The 112-mile run-walk was a reliable test, but had questionable validity as an indicator of aerobic capacity in chil- dren with mild and moderate MR. A high level of cardiorespiratory fitness (aerobic capacity) has been associ- ated with a decreased risk of hypertension, coronary heart disease, and cancer in adults (4, 5). Since at least some of these conditions find their genesis in child- hood, aerobic capacity is also considered important for children, and tests of aero- bic capacity have been included in several national test batteries (34, 35). Peak oxygen uptake (V0,peak) is considered the best test of aerobic capacity, but it is usually not a practical alternative. Instead, run-walk tests have been developed that estimate V0,peak (7,9). Many different run-walk tests of various lengths have been developed for use by children (3,17,22,24,39). However, Disch et al. (10) and Cureton et al. (8) showed, through a factor and path analytic approach, that runs shorter than 600 yards loaded on factors not related to distance running (i.e., factors other than distance running were more important for performance). For runs between 600 yards and 1 mile, the loading was primarily on the distance run factor. The highest loading was on distances longer than one mile (lo), suggesting that field-running B. Fernhall is with the Exercise Science Programs, School of Medicine and Health Sciences at The George Washington University, 817 23rd St. NW, Washington, DC 20052. K. Pitetti, N. Stubbs, and L. Stadler, Jr., are with the School of Health Science at Wichita State University, Wichita, KS 67260-0043.
Transcript of Validity and Reliability of the 112-Mile Run-Walk as an · PDF fileValidity and Reliability of...

Pediatric Exercise Science, 1996, 8, 130-1 42 0 1996 Human Kinetics Publishers. Inc.
Validity and Reliability of the 112-Mile Run-Walk as an Indicator of Aerobic Fitness in Children
With Mental Retardation
Bo Fernhall, Ken Pitetti, Nancy Stubbs, and Louis Stadler, Jr.
The purpose of this study was to determine the relationship between V0,max and the 112-mile run-walk and the reliability of each in children with mental retardation (MR). Twenty-three children (13 boys, 10 girls) with mild or moderate MR participated in the study. Two maximal treadmill protocols with metabolic measurements and two 112-mile run-walk trials were ran- domly conducted on separate days. There was no difference between Trial 1 and Trial 2 for V0,max (28.2 vs. 29.6 ml . kg-' . min-I), maximal heart rate (175 vs. 177 bpm), or run-walk time (7.2 vs. 7.1 min). The test-retest corre- lations were r = .90 for VO,max, r = .81 for maximal heart rate, and r = .96 for the 112-mile run-walk @ < .05). The correlation between V0,max and the ID-mile run-walk was r = -.60 0, < .05). Adding body mass index to the model improved R to .67 (SEE = 7.3). The 112-mile run-walk was a reliable test, but had questionable validity as an indicator of aerobic capacity in chil- dren with mild and moderate MR.
A high level of cardiorespiratory fitness (aerobic capacity) has been associ- ated with a decreased risk of hypertension, coronary heart disease, and cancer in adults (4, 5). Since at least some of these conditions find their genesis in child- hood, aerobic capacity is also considered important for children, and tests of aero- bic capacity have been included in several national test batteries (34, 35). Peak oxygen uptake (V0,peak) is considered the best test of aerobic capacity, but it is usually not a practical alternative. Instead, run-walk tests have been developed that estimate V0,peak (7,9).
Many different run-walk tests of various lengths have been developed for use by children (3,17,22,24,39). However, Disch et al. (10) and Cureton et al. (8) showed, through a factor and path analytic approach, that runs shorter than 600 yards loaded on factors not related to distance running (i.e., factors other than distance running were more important for performance). For runs between 600 yards and 1 mile, the loading was primarily on the distance run factor. The highest loading was on distances longer than one mile (lo), suggesting that field-running
B. Fernhall is with the Exercise Science Programs, School of Medicine and Health Sciences at The George Washington University, 817 23rd St. NW, Washington, DC 20052. K. Pitetti, N. Stubbs, and L. Stadler, Jr., are with the School of Health Science at Wichita State University, Wichita, KS 67260-0043.

112-Mile Run-Walk - 131
tests of cardiorespiratory fitness should be at least 600 yards long, but under ideal circumstances, one mile or longer (10).
Although several studies have shown that both children and adults with mental retardation (MR) have very low levels of aerobic capacity (11, 12, 15, 20, 32), there are no validated field tests available for children with MR (11, 12, 13, 15, 28). For adults with MR, the 1.5-mile run, I-mile walk, 20-m shuttle run, and a step test have been found to be valid measures of V02peak (14, 16, 19, 26, 33). The 300-yard run has been used for children with MR (23,32), and more recently, use of the 600-yard and 112-mile runs have been advocated (20,3 1). Though the 112-mile run was found to be reliable with children with MR (31), neither the 600-yard nor the 112-mile run have been validated for use with this population.
Considering that populations with MR present unique problems, such as task understanding, motivation, and movement efficiency (11,28,31,36,37), it is important that the reliability and validity of any field test of aerobic capacity be specifically determined for this population. Since persons with MR also have low levels of aerobic capacity (1 1,12, 15,20,32), improvements in this area may be of even greater importance. However, valid and reliable measures must be developed before training programs can be evaluated. Our pilot testing suggested that chil- dren with MR stayed motivated and could perform run-walk tests up to 112 mile, but that motivation and performance dropped off for distances longer than 112 mile. Therefore, the purpose of this study was to determine the validity and reli- ability of the 112-mile run-walk in children with MR.
Methods
Subjects
Twenty-three children with mild and moderate MR (13 boys and 10 girls) between the ages of 10 and 17 years participated in the study. The subjects were mmited h m a summer school program, and both subject and parental informed consent were obtained prior to testing. Individual IQ scores were not released by the school, but all children had to be classified with either mild or moderate MR to be eligible for the summer school pro- gram. Eight of the 23 children also had Down syndrome.
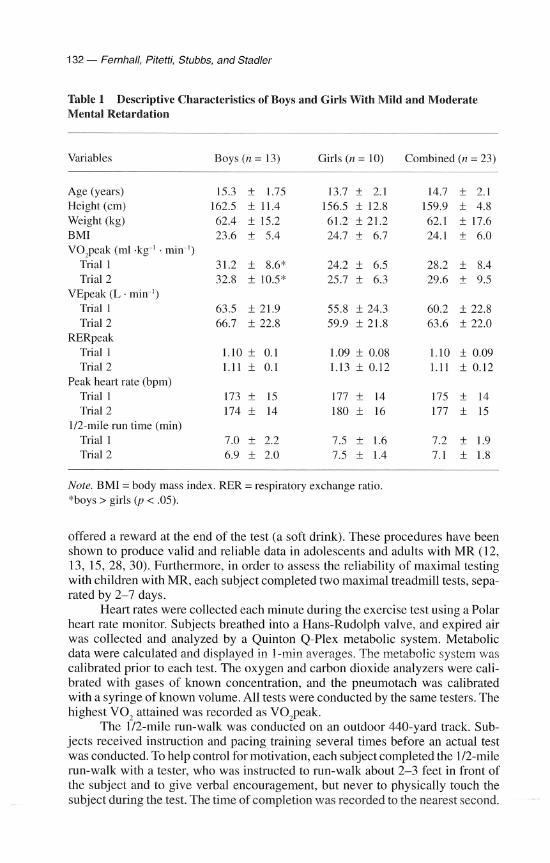
None of the subjects had any medical contraindications to exercise. Any subjects with congenital heart defects or on medications affecting heart function were excluded from the study. Furthermore, none of the subjects had any orthope- dic or motor limitations that prevented them from walking or jogging. The de- scriptive characteristics of the subjects are shown in Table 1.
Testing Protocol
The laboratory testing for V02peak followed the procedures described by Fernhall and Tymeson (15) and Pitetti et al. (28) for subjects with MR. Briefly, subjects were familiarized with the laboratory setting, treadmill walking, and use of the headgear prior to any data collection. The number of familiarization ses- sions varied from two to four times, depending on the subject.
A walking treadmill protocol was used with the speed individualized to the ability of the subjects (2-4 mph), following the suggestions of Femhall and Tymeson (15) and Pitetti et al. (28). The subjects started at 0% grade, and the grade was increased 4% every 2 min until the subjects could no longer continue. The subjects were verbally encouraged to push themselves as far as they could, and they were
132 - Fernhall, Piteffi, Stubbs, and Stadler
Table 1 Descriptive Characteristics of Boys and Girls With Mild and Moderate Mental Retardation
Variables Boys (n = 13) Girls (n = 10) Combined (n = 23)
Age (years) Height (cm) Weight (kg) BMI V0,peak (ml .kg-' . min-I)
Trial 1 Trial 2
VEpeak (L . min-I) Trial 1 Trial 2
RERpeak Trial 1 Trial 2
Peak heart rate (bpm) Trial 1 Trial 2
112-mile run time (min) Trial 1 Trial 2
Note. BMI = body mass index. RER = respiratory exchange ratio. *boys > girls ( p < .05).
offered a reward at the end of the test (a soft drink). These procedures have been shown to produce valid and reliable data in adolescents and adults with MR (12, 13, 15, 28, 30). Furthermore, in order to assess the reliability of maximal testing with children with MR, each subject completed two maximal treadmill tests, sepa- rated by 2-7 days.
Heart rates were collected each minute during the exercise test using a Polar heart rate monitor. Subjects breathed into a Hans-Rudolph valve, and expired air was collected and analyzed by a Quinton Q-Plex metabolic system. Metabolic data were calculated and displayed in 1-min averages. The metabolic system was calibrated prior to each test. The oxygen and carbon dioxide analyzers were cali- brated with gases of known concentration, and the pneumotach was calibrated with a syringe of known volume. All tests were conducted by the same testers. The highest VO, attained was recorded as V0,peak.
The 112-mile run-walk was conducted on an outdoor 440-yard track. Sub- jects received instruction and pacing training several times before an actual test was conducted. To help control for motivation, each subject completed the 112-mile run-walk with a tester, who was instructed to run-walk about 2-3 feet in front of the subject and to give verbal encouragement, but never to physically touch the subject during the test. The time of completion was recorded to the nearest second.

IR-Mile Run-Walk - 133
Subjects wore a Polar heart rate monitor during the test, and heart rates were re- corded every minute and at the completion of the test. Each subject completed two tests, separated by 2-3 days. If the time of completion was not within 45 s, a third test was conducted. The two test times within 45 seconds of each other were used in the data analysis.
Data Treatment
A test-retest intraclass reliability coefficient was calculated for V02peak, peak heart rate, peak minute ventilation, and 112-mile completion times. The relationship be- tween V0,peak and 112-mile run-walk time was determined by Pearson product-moment correlation. Since age, gender, and body mass index (BMI) can in- fluence the relationship between run-walk time and V0,peak (9), a stepwise multiple regression was conducted to evaluate the contribution of these variables, in conjunc- tion with 112-mile completion time, to V02peak. Furthermore, separate correlational analyses and ANOVAs were conducted for boys and girls, and for subjects with and without Down syndrome, to further evaluate the influence of gender and the presence of Down syndrome. An alpha level of .05 was used throughout.
Results Descriptive characteristics for the group as a whole and separated by gender are displayed in Table 1. The descriptive characteristics separated by the presence of Down syndrome are shown in Table 2. Boys exhibited significantly higher V02peak than the girls @ < .05), but there were no other significant differences between genders, although there was a trend toward faster 10-mile completion times for the boys. Individuals with Down syndrome completed the 112-mile run-walk sig- nificantly slower than their peers without Down syndrome (p < .05). Although their V02peak was also lower, this difference was not significant, probably be- cause of the low number of subjects with Down syndrome. There were no other significant differences between subjects with and without Down syndrome. There were also no significant differences between Test 1 and Test 2, either on the tread- mill or the 112-mile run-walk, for the group as a whole or for any of the subgroups.
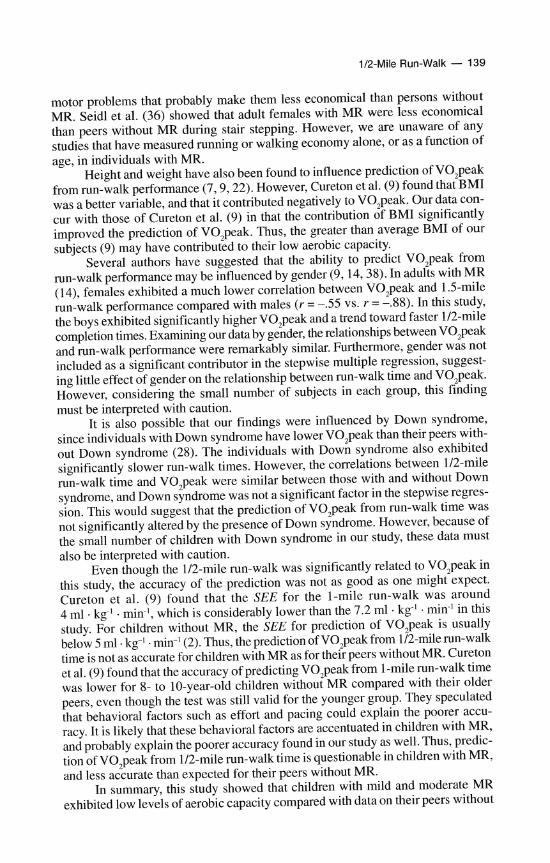
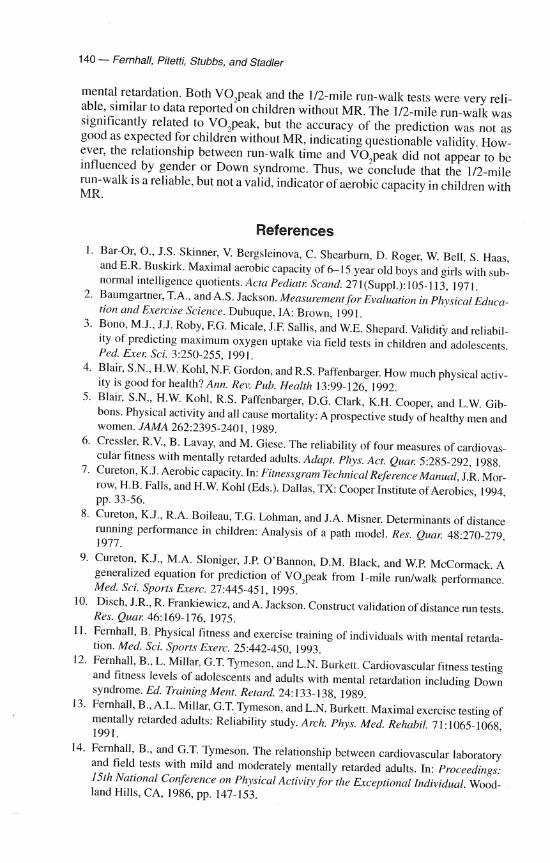
Both V02peak (Figure 1) and 112-mile completion times (Figure 2) were highly reliable (r = .90 and r = .96, respectively; p < .05). Maximal minute venti- lation was also highly reliable (r = .93). Although maximal heart rates were also reliable (r = .82), they were not as reliable as the other variables.
A correlation matrix between age, height, weight, BMI, V02peak, and 112-mile run-walk completion times is shown in Table 3. Weight was not related to either V0,peak or 112-mile completion times. However, height was significantly related to 112-mile completion times (r = .58, p < .05), whereas BMI was signifi- cantly related to V02peak (r = -.50, p < .05). The 112-mile completion time was significantly related to V02peak (r = -.60, p < .05) (Figure 3). The correlation matrix displayed in Table 4 shows that boys and girls had very similar results. The correlation matrix in Table 5 shows that subjects with and without Down syn- drome also exhibited similar relationships.
The stepwise multiple regression showed that only the 112-mile run-walk completion time and BMI were significantly related to V02peak. Neither age, gen- der, nor Down syndrome contributed to the equation (p > . l), suggesting that nei- ther subgroup influenced the results of the group as a whole. The multiple R was

134 - Fernhall, Pitetfi, Stubbs, and Stadler
Table 2 Descriptive Characteristics of Subjects With and Without Down Syndrome
Variable With Down syndrome No Down syndrome (n = 8) (n = 15)
Age (years) Height (cm) Weight (kg) BMI V0,peak (ml .kg-' . min-')
Trial 1 Trial 2
VEpeak (L . min-I) Trial 1 Trial 2
RERpeak Trial 1 Trial 2
Peak heart rate (bpm) Trial 1 Trial 2
112-mile run time (min) Trial 1 Trial 2
Note. BMI = body mass index. RER = respiratory exchange ratio. *Subjects with Down syndrome significantly slower than subjects without Down syndrome @ < .05).
0 Boys without DS Boys with DS
A Girls without DS
A Girls with DS
\jOppeak - Test 1 (rnl.kg-l-rnin-1)
Figure 1 - The reliability of V0,peak in children with mild and moderate mental retardation. The line of identity is also shown.

1R-Mile Run-Walk - 135
r=0.96
0 Boys without DS @ Boys with DS
A Girls without DS
A Girls with DS
Run Walk Time - Test 1 (min)
Figure 2 -The reliability of 112-mile run-walk time in children with mild and moder- ate mental retardation. The line of identity is also shown.
Table 3 Correlation Matrix for All Subjects
Age Height Weight BMI Run-walk time V0,peak
Age 1 .OO .58* .47 .30 -. 14 .15 Height 1 .OO .57* .16 -.64* .46 Weight 1 .OO .89* .01 -.22 BMI 1 .OO .35 -.50* Run-walk time 1 .OO -.60* V0,peak 1 .OO
Note. N = 23. BMI = body mass index. *p < .01.
.67, with an SEE of 7.3. The regression equation was V0,peak = -2.49 (112-mile time) - 0.52 (BMI) + 59.9 ( p < .05).
Discussion Because of the demonstrated relationship between aerobic capacity and health, it is common to test for this aspect of fitness in both youth and adults. Our data indicate that the children in this study exhibited low V0,peak values and were aerobically unfit. These findings are consistent with data on adults with MR (1 1,

136 - Fernhall, Pitetti, Stubbs, and Stadler
0 Boys w i t h o u t DS Boys with DS
A Girls w i t h o u t DS A Girls with DS
Run Walk Time (min)
Figure 3 - The relationship between V0,peak and 112-mile run-walk time in children with mild and moderate mental retardation. The regression line is shown, and the correlation was statistically significantp < .05).
13, 15, 27, 29, 30). However, previous studies measuring V0,peak in children with MR have reported V0,peak values that were 10-70% higher than our find- ings (1,40). This may be due to subject sampling differences, since Bar-Or et al. (1) used children with subnormal IQ, but the mean IQ in their study was 79, which is not low enough to be classified with MR (1 1,28). Yoshizawa et al. (40), report- ing on Japanese children with MR, also included many subjects that would not be classified with MR according to current standards, and their higher values may also reflect a cultural difference. Conversely, our data are consistent with the find- ings reported by Fernhall et al. (12) on adolescents with Down syndrome. Further- more, the run-walk times were much slower than would be expected for children without MR, consistent with previous studies (20,31). This shows that as a group, children correctly classified with MR have low levels of aerobic capacity.
Maximal exercise testing has been shown to be both valid and reliable for adults with MR, and the test-retest correlations reported have consistently been above .9 (13, 19, 30). The reliability has also been shown to be high for maximal work capacity in adolescents with Down syndrome (.94) (13). The children in this study exhibited similarly high reliability for VO,peak, and the peak RER and heart rates (Tables 1 and 2) also suggest that they exerted maximal efforts. Thus, our data indicate that maximal testing in children with MR is valid and reliable.
Field testing with individuals with MR has not always been shown to be as reliable. Both Cressler et al. (6) and Pizzaro (31) showed that walk-run test of 12-min and 112 mile, respectively, showed reliability coefficients of 30-.90. This is slightly lower than the r = .96 found in this study. The difference may be due to

112-Mile Run-Walk - 137
Table 4 Correlation Matrix for Boys (n = 13) and Girls (n = 10)
Age Height Weight BMI Run-walk time V0,peak
Age Boys 1.00 .61 .73* .49 Girls 1.00 .47 .36 .30
Height Boys 1 .OO .47 -.05 Girls 1 .OO .70 .44
Weight Boys 1 .OO .85* Girls 1 .OO .94*
BMI Boys 1 .OO Girls I .OO
Run-walk time Boys Girls
V0,peak Boys Girls
Note. BMI =body mass index. *p < .05.
the longer test duration employed in the study by Cressler et al. (6). Pizzaro (31) only allowed one practice session prior to testing with only 1 min of actual prac- tice. Even so, the reliability coefficients for the children with MR were higher than for children without MR (3-.9 vs. .75). Pizarro (31) also did not indicate whether a pacer was used for motivational purposes with the children with MR. As sug- gested by previous research (6,37), we used apacer and gave the subjects substan- tial practice opportunities. Following these procedures, the reliability of the 112-mile run-walk was excellent and similar to that previously reported for adults with MR for the one mile walk (19). The reliability of the 112-mile run-walk was also simi- lar or higher to what has been reported for children and adults without MR (7).
For populations without MR, run-walk tests of 1 mile or longer tend to be better predictors of V0,peak than shorter tests (7,9). However, for younger chil- dren, tests between 600 years and l mile are better predictors of V0,peak (22,39). One might argue that we should have used a test longer than 112 mile, considering the mean age of our subjects was 14 years. However, our pilot data indicated that the subjects did not stay motivated, nor did they put forth a good effort for dis- tances longer than 112 mile. Similar findings were reported by Pizarro (31) in a group of children with MR of similar age. Thus, we suggest that the 112-mile distance is probably approaching the upper limit of maximal performance capa- bilities and motivation to perform in children with MR.
The main finding of this study was that V0,peak was moderately related to 112-mile run-walk performance. The correlation (r = -.60) was similar to those

138 - Fernhall, Pitetti, Stubbs, and Stadler
Table 5 Correlation Matrix for Children With Down Syndrome (DS) (n = 8) and Without Down Syndrome (n = 15)
Age Height Weight BMI Run-walk time V0,peak
Age No DS 1.00 With DS 1.00
Height No DS With DS
Weight No DS With DS
BMI No DS With DS
Run-walk time No DS With DS
V0,peak No DS With DS
Note. BMI = body mass index.
reported in previous studies on children without MR, for distances of 600-1,200 yards (8, 22,25). More recently, Cureton et al. (9) showed that the 1-mile run-walk was similarly related to V02peak in a large sample of subjects, including children of various ages. However, this relationship was considerably weaker than those re- ported for V0,peak and 1.5 mile, 1 mile, and shuttle run performance in adults with MR. Fernhall and Tymeson (16) found a correlation of r = -.88 between 1.5-mile walk-run performance and V02peak, whereas Kittridge et al. (19) and Rintala et al. (33) both reported correlations of r = -31 between V0,peak and the 1-mile walk. Also in adults with MR, Montgomery et al. (26) found correlations of .78 and .72 between shuttle run and step test performance, respectively, and V0,peak.
It is not surprising that V02peak and run-walk performance are more highly correlated in adult subjects. Adults have fewer problems with understanding a task and with motivation. Furthermore, age influences the relationship between run performance and V0,peak in individuals without MR because running economy improves with age in children (21). Cureton et al. (9) found that age was a signifi- cant factor in predicting V0,peak from 1-mile run-walk time, and they included age in their prediction equation. However, when we conducted a stepwise multiple regression, age was not a significant contributor to R2. By forcing age into the equation, R2 was only improved by .02. Thus, in our sample, age did not influence the prediction of V0,peak.
It is possible that the economy of movement may not improve with age to the same extent in persons with and without MR. Many individuals with MR have
1/2-Mile Run-Walk - 139
motor problems that probably make them less economical than persons without MR. Seidl et al. (36) showed that adult females with MR were less economical than peers without MR during stair stepping. However, we are unaware of any studies that have measured running or walking economy alone, or as a function of age, in individuals with MR.
Height and weight have also been found to influence prediction of V0,peak from run-walk performance (7,9,22). However, Cureton et al. (9) found that BMI was a better variable, and that it contributed negatively to V0,peak. Our data con- cur with those of Cureton et al. (9) in that the contribution of BMI significantly improved the prediction of V0,peak. Thus, the greater than average BMI of our subjects (9) may have contributed to their low aerobic capacity.
Several authors have suggested that the ability to predict V0,peak from run-walk performance may be influenced by gender (9,14,38). In adults with MR (14), females exhibited a much lower correlation between V0,peak and 1.5-mile run-walk performance compared with males (r = -.55 vs. r = -38). In this study, the boys exhibited significantly higher V0,peak and a trend toward faster 112-mile completion times. Examining our data by gender, the relationships between V02peak and run-walk performance were remarkably similar. Furthermore, gender was not included as a significant contributor in the stepwise multiple regression, suggest- ing little effect of gender on the relationship between run-walk time and V0,peak. However, considering the small number of subjects in each group, this finding must be interpreted with caution.
It is also possible that our findings were influenced by Down syndrome, since individuals with Down syndrome have lower V02peak than their peers with- out Down syndrome (28). The individuals with Down syndrome also exhibited significantly slower run-walk times. However, the correlations between 112-mile run-walk time and V0,peak were similar between those with and without Down syndrome, and Down syndrome was not a significant factor in the stepwise regres- sion. This would suggest that the prediction of V0,peak from run-walk time was not significantly altered by the presence of Down syndrome. However, because of the small number of children with Down syndrome in our study, these data must also be interpreted with caution.
Even though the 112-mile run-walk was significantly related to V0,peak in this study, the accuracy of the prediction was not as good as one might expect. Cureton et al. (9) found that the SEE for the 1-mile run-walk was around 4 ml . kg-' . min-I, which is considerably lower than the 7.2 ml . kg-' . min-' in this study. For children without MR, the SEE for prediction of V02peak is usually below 5 ml . kg-' - min-I (2). Thus, the prediction of V0,peakfrom 112-mile run-walk time is not as accurate for children with MR as for their peers without MR. Cureton et ai. (9) found that the accuracy of predicting V0,peak from 1-mile run-walk time was lower for 8- to 10-year-old children without MR compared with their older peers, even though the test was still valid for the younger group. They speculated that behavioral factors such as effort and pacing could explain the poorer accu- racy. It is likely that these behavioral factors are accentuated in children with MR, and probably explain the poorer accuracy found in our study as well. Thus, predic- tion of V0,peak from 112-mile run-walk time is questionable in children with MR, and less accurate than expected for their peers without MR.
In summary, this study showed that children with mild and moderate MR exhibited low levels of aerobic capacity compared with data on their peers without
140 - Fernhall, Pitetti, Stubbs, and Stadler
mental retardation. Both V0,peak and the 112-mile run-walk tests were very reli- able, similar to data reported on children without MR. The 112-mile run-walk was significantly related to V02peak, but the accuracy of the prediction was not as good as expected for children without MR, indicating questionable validity. How- ever, the relationship between run-walk time and V02peak did not appear to be influenced by gender or Down syndrome. Thus, we conclude that the 112-mile run-walk is a reliable, but not a valid, indicator of aerobic capacity in children with MR.
References 1. Bar-Or, O., J.S. Skinner, V. Bergsleinova, C. Shearburn, D. Roger, W. Bell, S. Haas,
and E.R. Buskirk. Maximal aerobic capacity of 6-15 year old boys and girls with sub- normal intelligence quotients. Acta Pediatl: Scand. 271(Suppl.): 105-1 13, 1971.
2. Baumgartner, T.A., and A.S. Jackson. Measurement for Evaluation in Physical Educa- tion and Exercise Science. Dubuque, IA: Brown, 1991.
3. Bono, M.J., J.J. Roby, F.G. Micale, J.F. Sallis, and W.E. Shepard. Valid;+ and reliabil- ity of predicting maximum oxygen uptake via field tests in children and adolescents. Ped. Exel: Sci. 3:250-255, 1991.
4. Blair, S.N., H.W. Kohl, N.F. Gordon, and R.S. Paffenbarger. How much physical activ- ity is good for health?Ann. Rev. Pub. Health 13:99-126, 1992.
5. Blair, S.N., H.W. Kohl, R.S. Paffenbarger, D.G. Clark, K.H. Cooper, and L.W. Gib- bons. Physical activity and all cause mortality: Aprospective study of healthy men and women. JAMA 262:2395-2401, 1989.
6. Cressler, R.V., B. Lavay, and M. Giese. The reliability of four measures of cardiovas- cular fitness with mentally retarded adults. Adapt. Phys. Act. Qual: 5:285-292, 1988.
7. Cureton, K.J. Aerobic capacity. In: Fitnessgram Technical Reference Manual, J.R. Mor- row, H.B. Falls, and H.W. Kohl (Eds.). Dallas, TX: Cooper Institute of Aerobics, 1994, pp. 33-56.
8. Cureton, K.J., R.A. Boileau, T.G. Lohman, and J.A. Misner. Determinants of distance running performance in children: Analysis of a path model. Res. Qual: 48:270-279, 1977.
9. Cureton, K.J., M.A. Sloniger, J.P. O'Bannon, D.M. Black, and W.P. McComack. A generalized equation for prediction of V0,peak from 1-mile runlwalk performance. Med. Sci. Sports Exerc. 27:445-451, 1995.
10. Disch, J.R., R. Frankiewicz, and A. Jackson. Construct validation of distance run tests. Res. Qual: 46: 169-176, 1975.
11. Fernhall, B. Physical fitness and exercise training of individuals with mental retarda- tion. Med. Sci. Sports Exerc. 25:442-450, 1993.
12. Fernhall, B., L. Millar, G.T. Tymeson, and L.N. Burkett. Cardiovascular fitness testing and fitness levels of adolescents and adults with mental retardation including Down syndrome. Ed. Training Ment. Retard. 24:133-138, 1989.
13. Fernhall, B., A.L. Millar, G.T. Tymeson, and L.N. Burkett. Maximal exercise testing of mentally retarded adults: Reliability study. Arch. Phys. Med. Rehabil. 71:1065-1068, 1991.
14. Fernhall, B., and G.T. Tymeson. The relationship between cardiovascular laboratory and field tests with mild and moderately mentally retarded adults. In: Proceedings: 15th National Conference on Physical Activity for the Exceptional Individual. Wood- land Hills, CA, 1986, pp. 147-153.

1M-Mile Run-Walk - 141
15. Fernhall, B., and G.T. Tymeson. Graded exercise testing of mentally retarded adults: A study of feasibility. Arch. Phys. Med. Rehabil. 68:363-365,1987.
16. Fernhall, B., and G.T. Tymeson. Validation of a cardiovascular fitness field test for adults with mental retardation. Adapt. Phys. Act. Quar. 5:49-59,1988.
17. Kearny, J.T., and W.C. Byrnes. Relationship between running performance and pre- dicted maximum oxygen uptake among divergent ability groups. Res. Quar. 45:9-14, 1974.
18. Kelly, L.E., J.H. Rimmer, and R.A. Ness. Obesity levels of institutionalized mentally retarded adults. Adapt. Phys. Act. Quar. 3: 167-176,1986.
19. Kittridge, J.M., J.H. Rimmer, and M. Looney. Validation of the Rockport fitness walk- ing test for adults with mental retardation. Med. Sci. Sports Exerc. 26:95-102, 1994.
20. Koh, M.S., and E.J. Watkinson. Endurance run pacing of moderately mentally handi- capped children. Can. Assoc. Health Phys. Ed. Rec. J. 54:12-15, 1988.
21. Krahenbuhl, G.S., D.W. Morgan, and R.P. Pangrazi. Longitudinal changes in distance running performance of young males. Int. J. Sports Med. 10:92-96, 1989.
22. Krahenbuhl, G.S., R.P. Pangrazi, L.N. Burkett, M.J. Schneider, and G.W. Petersen. Field estimation of V0,max in children eight years of age. Med. Sci. Sports 9:37-40, 1977.
23. Londeree, B.R., and L.E. Johnson. Motor fitness of TMR vs EMR and normal children. Med. Sci. Sports 9:247-252, 1974.
24. McCormack, W.P., K.J. Cureton, T.A. Bullock, and P.G. Weyand. Metabolic determi- nants of I-mile run/walk performance in children. Med. Sci. Sports Exerc. 23:611-617, 1991.
25. Metz, K.F., and J.F. Alexander. An investigation of the relationship between maximum aerobic work capacity and physical fitness in twelve to fifteen year old boys. Res. Quar. 41:75-81, 1970.
26. Montgomery, D.L., G. Reid, and L.P. Koziris. Reliability and validity of three fitness tests for adults with mental handicaps. Can. J. Sport Sci. 17:309-315, 1992.
27. Pitetti, K.H., J.A. Jackson, N.B. Stubbs, K.D. Campbell, and S.S. Battar. Fitness levels of adult Special Olympics participants. Adapt. Phys. Act. Quar. 6:254-270, 1989.
28. Pitetti, K.H., J.H. Rimmer, and B. Fernhall. Physical fitness and adults with mental retardation: An overview of current research and future directions. Sports Med. 16:23-56, 1993.
29. Pitetti, K.H., and D.M. Tan. Cardiorespiratory responses of mentally retarded adults to air-brake ergometry and treadmill exercise. Arch. Phys. Med. Rehabil. 7 1 :3 18-321, 1990.
30. Pitetti, K.H., and D.M. Tan. Effects of a minimally supervised exercise program for mentally retarded adults. Med. Sci. Sports Exerc. 23594-601, 1991.
31. Pizarro, D.C. Reliability of the health related fitness test for mainstreamed educable and trainable mentally handicapped adolescents. Adapt. Phys. Act. Quar. 7:240-248, 1990.
32. Rarick, G.L., J.H. Widdop, and G.D. Broadhead. The physical fitness and motor per- formance of educable mentally retarded children. Exceptional Children 36509-519, 1970.
33. Rintala, P., J.M. Dunn, J.A. McCubbin, and C. Quinn. Validity of a cardiovascular fitness test for men with mental retardation. Med. Sci. Sports Exerc. 24:941-945, 1992.
34. Ross, J.G., C.O. Dotson, G.G. Gilbert, and S.J. Katz. New standards for fitness mea- surements. J. Phys. Educ. Rec. Dance 54(1):20-24, 1985.
35. Ross, J.G., R.R. Pate, L.A. Delpy, R.S. Gold, and M. Silvar. New health related fitness

142 - Fernhall, Pitetti, Stubbs, and Stadler
norms. J. Phys. Educ. Rec. Dance 58(11):66-70, 1987. 36. Seidl, C., D.L. Montgomery, and G. Reid. Stair stepping efficiency of mentally handi-
capped and nonhandicapped adult females. Ergonomics 32519-526. 37. Seidl, C., G. Reid, and D.L. Montgomery. A critique of cardiovascular fitness testing
with mentally retarded persons. Adapt. Phys. Act. Quar. 4:106-116, 1987. 38. Sparling, P.B., and K.J. Cureton. Biological determinants of the sex difference in 12-min
run performance. Med. Sci. Sports Exerc. 15:218-223, 1983. 39. Stone, W.J. Running tests for 7-9 year old children. AAHPERD Symp. Papers 154-57,
1978. 40. Yoshizawa, S., T. Ishizaki, and H. Honda. Aerobic capacity of mentally retarded boys
and girls in junior high schools. J. Hum. Ergol. 4:15-26, 1975.
National Registry for Children With CIPD
The Guillain Barre Syndrome Foundation International is establishing a registry of children with chronic inflammatory demyelinating polyneuropa- thy (CIPD) or chronic Guillain Barre Syndrome. Researchers requesting the use of this registry will be screened by the medical advisory board of the Guillain Barre Syndrome Foundation International. Names and addresses of children will not be released without written permission of parents or guard- ians.
Please submit names for this new national registry to the Guillain Barre Syndrome Foundation International, c/o Patricia Schardt, PO Box 608, Deshler, NE 68340.