VALIDATION OF VOLUNTEERED GEOGRAPHIC INFORMATION … · professionals. Volunteered Geographic...
81
VALIDATION OF VOLUNTEERED GEOGRAPHIC INFORMATION QUALITY COMPONENTS FOR INCIDENTS OF LAW ENFORCEMENT USE OF FORCE by Lance E. Farman A Thesis Presented to the FACULTY OF THE USC GRADUATE SCHOOL UNIVERSITY OF SOUTHERN CALIFORNIA In Partial Fulfillment of the Requirements for the Degree MASTER OF SCIENCE (GEOGRAPHIC INFORMATION SCIENCE AND TECHNOLOGY) December 2015 Copyright 2015 Lance E. Farman
Transcript of VALIDATION OF VOLUNTEERED GEOGRAPHIC INFORMATION … · professionals. Volunteered Geographic...
VALIDATION OF VOLUNTEERED GEOGRAPHIC INFORMATION QUALITY
COMPONENTS
FOR INCIDENTS OF LAW ENFORCEMENT USE OF FORCE
by
Lance E. Farman
A Thesis Presented to the
FACULTY OF THE USC GRADUATE SCHOOL
UNIVERSITY OF SOUTHERN CALIFORNIA
In Partial Fulfillment of the
Requirements for the Degree
MASTER OF SCIENCE
(GEOGRAPHIC INFORMATION SCIENCE AND TECHNOLOGY)
December 2015
Copyright 2015 Lance E. Farman

ii
DEDICATION
I dedicate this study to anybody who has been impacted by violence. May you be at peace.
Moreover, this study is for all of society, especially those who truly work toward justice.

iii
ACKNOWLEDGMENTS
I couldn’t have done this project without the aid of many individuals. To Caiti, my better half,
who stood by me through it all (it’s your turn next). To Dr. Vos, my committee chair, who was
always willing to help. Your insight kept me focused and grounded. Thank you, Dr. Kemp, for
your sage advice on all that is spatial, and Dr. Finch, for your willingness to work with me on
this project. Thanks go to my cousin, Jen, who used her editing expertise to weed out all those
pesky typos. Special thanks to Mr. Brian Burghart who made all of this possible by initiating the
Fatal Encounters project. I appreciate your openness and willingness to talk about your dataset.
Walt Lockley must be acknowledged for verifying my own work. Credit goes to the Gun
Violence Archive who put together a custom dataset for me. Lastly, thank you to all the public
servants I interacted with during the sampling process. Your efforts were all an integral
component of this study.
i
TABLE OF CONTENTS
DEDICATION ................................................................................................................................ ii
ACKNOWLEDGMENTS ............................................................................................................. iii
LIST OF TABLES ......................................................................................................................... iv
LIST OF FIGURES ........................................................................................................................ v
LIST OF ABBREVIATIONS ........................................................................................................ vi
ABSTRACT .................................................................................................................................. vii
CHAPTER 1: INTRODUCTION ................................................................................................... 1
1.1 Research Objective ............................................................................................................... 2
1.2 Motivation ............................................................................................................................. 3
1.3 Purpose .................................................................................................................................. 5
1.4 Organization of Thesis .......................................................................................................... 6
CHAPTER 2: THE FATAL ENCOUNTERS DATABASE .......................................................... 8
2.1 Fatal Encounters Collection Systems.................................................................................... 8
2.1.1 Public Records Requests............................................................................................ 8
2.1.2 Mining Similar Datasets............................................................................................. 9
2.1.3 Specialized Researchers............................................................................................ 10
2.1.4 Data Capture from Volunteers.................................................................................. 10
2.1.5 Verifying Records..................................................................................................... 11
2.2 Administration Hierarchy ................................................................................................... 11
2.3 Fatal Encounters Summary ................................................................................................. 12
ii
CHAPTER 3: LITERATURE, QUALITY COMPONENTS, AND RELATED DATA ............. 13
3.1 Volunteered Geographic Information and the Need for Data Quality Assurance .............. 13
3.1.1 Volunteered Geographic Information Projects......................................................... 13
3.1.2 Volunteered Geographic Information Literature...................................................... 15
3.2 Quality Assurance Components .......................................................................................... 20
3.3 Competing Datasets ............................................................................................................ 22
3.3.1 Datasets Collecting Related Data............................................................................. 23
3.3.2 Datasets Collecting Same Data................................................................................ 24
3.4 Analysis Possibilities .......................................................................................................... 27
CHAPTER 4: METHODOLOGY ................................................................................................ 28
4.1 Dimensions of Quality Assurance ...................................................................................... 28
4.1.1 Completeness............................................................................................................ 29
4.1.2 Attribute Accuracy, Completeness, and Consistency............................................... 33
4.1.3 Positional Accuracy.................................................................................................. 34
4.2 Hotspot Analysis ................................................................................................................. 36
CHAPTER 5: RESULTS .............................................................................................................. 39
5.1 Lineage and Attribute Accuracy ......................................................................................... 39
5.1.1 Name......................................................................................................................... 39
5.1.2. Age........................................................................................................................... 40
5.1.3 Gender....................................................................................................................... 40
5.1.4 Race.......................................................................................................................... 41
5.1.5 Date of Injury............................................................................................................ 41
iii
5.1.6 Image URL............................................................................................................... 42
5.1.7 City, State, Zip Code, County.................................................................................. 42
5.1.8 Agency Responsible for Death................................................................................. 42
5.1.9 Cause of Death......................................................................................................... 43
5.1.10 Symptoms of Mental Illness................................................................................... 43
5.1.11 Official Disposition of Death................................................................................. 44
5.1.12 Source..................................................................................................................... 45
5.1.13 Submitter................................................................................................................ 45
5.1.14 Source Validation................................................................................................... 46
5.1.15 Redundant Entries.................................................................................................. 46
5.2 Completeness ...................................................................................................................... 47
5.2.1 Freedom of Information Requests............................................................................ 47
5.2.2 Killed by Police........................................................................................................ 50
5.2.3 Gun Violence Archive.............................................................................................. 51
5.2.4 Arrest Related Deaths Program and Deadspin Dataset............................................ 52
5.3 Spatial Accuracy and Precision .......................................................................................... 52
5.4 Hotspot Analysis ................................................................................................................. 53
CHAPTER 6: DISCUSSION ........................................................................................................ 59
6.1 Fatal Encounters as Volunteered Geographic Information ................................................. 60
6.2 Strengths and Weaknesses .................................................................................................. 61
6.3 The Future of Fatal Encounters........................................................................................... 62
REFERENCES ............................................................................................................................. 65
iv
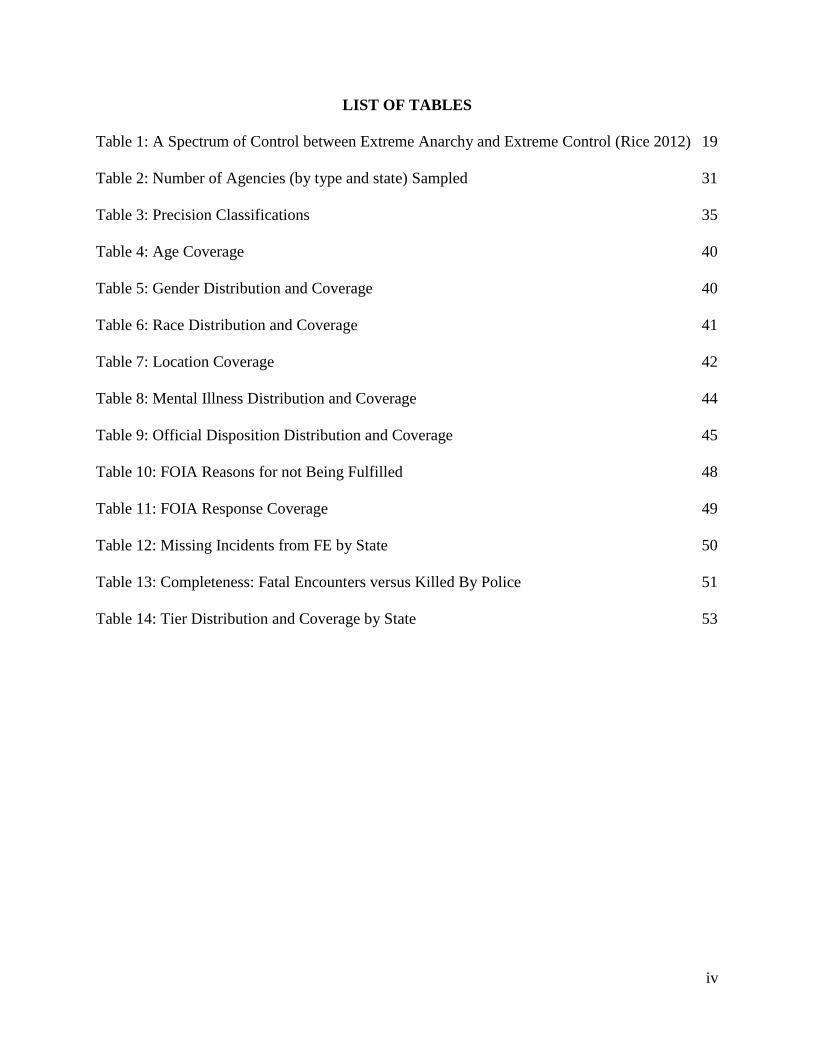
LIST OF TABLES
Table 1: A Spectrum of Control between Extreme Anarchy and Extreme Control (Rice 2012) 19
Table 2: Number of Agencies (by type and state) Sampled 31
Table 3: Precision Classifications 35
Table 4: Age Coverage 40
Table 5: Gender Distribution and Coverage 40
Table 6: Race Distribution and Coverage 41
Table 7: Location Coverage 42
Table 8: Mental Illness Distribution and Coverage 44
Table 9: Official Disposition Distribution and Coverage 45
Table 10: FOIA Reasons for not Being Fulfilled 48
Table 11: FOIA Response Coverage 49
Table 12: Missing Incidents from FE by State 50
Table 13: Completeness: Fatal Encounters versus Killed By Police 51
Table 14: Tier Distribution and Coverage by State 53
v
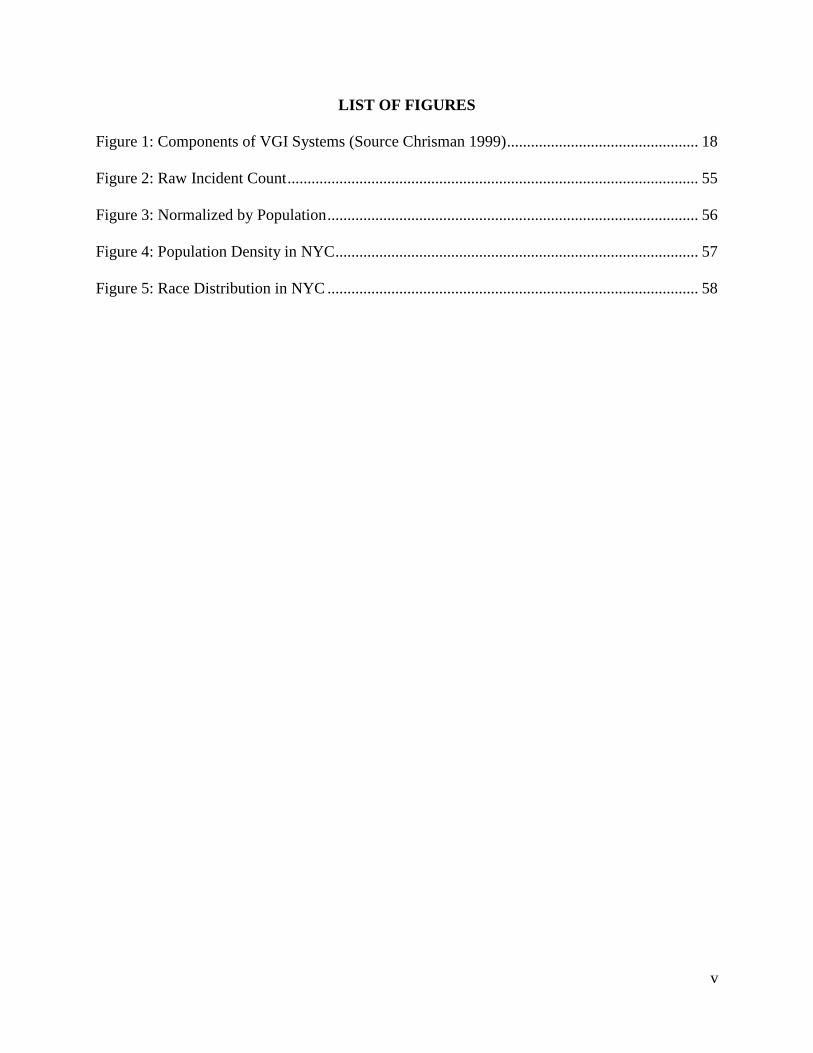
LIST OF FIGURES
Figure 1: Components of VGI Systems (Source Chrisman 1999) ................................................ 18
Figure 2: Raw Incident Count ....................................................................................................... 55
Figure 3: Normalized by Population ............................................................................................. 56
Figure 4: Population Density in NYC ........................................................................................... 57
Figure 5: Race Distribution in NYC ............................................................................................. 58

vi
LIST OF ABBREVIATIONS
AGI Ambient Geographic Information
ARD Arrest Related Deaths Program
BOJ Bureau of Justice
BOJS Bureau of Justice Statistics
CDG Crowdsourced Geospatial Data
CRS Creative Research Systems
DOJ Department of Justice
FBI Federal Bureau of Investigation
FE Fatal Encounters
FGDC Federal Geographic Data Committee
GIScience Geographic Information Science
GIS Geographic Information Systems
ICT Information and Communications Technology
KDE Kernel Density Estimation
NFIC National Freedom of Information Coalition
QA Quality Assessment
UGC User Generated Content
VGI Volunteered Geographic Information
vii
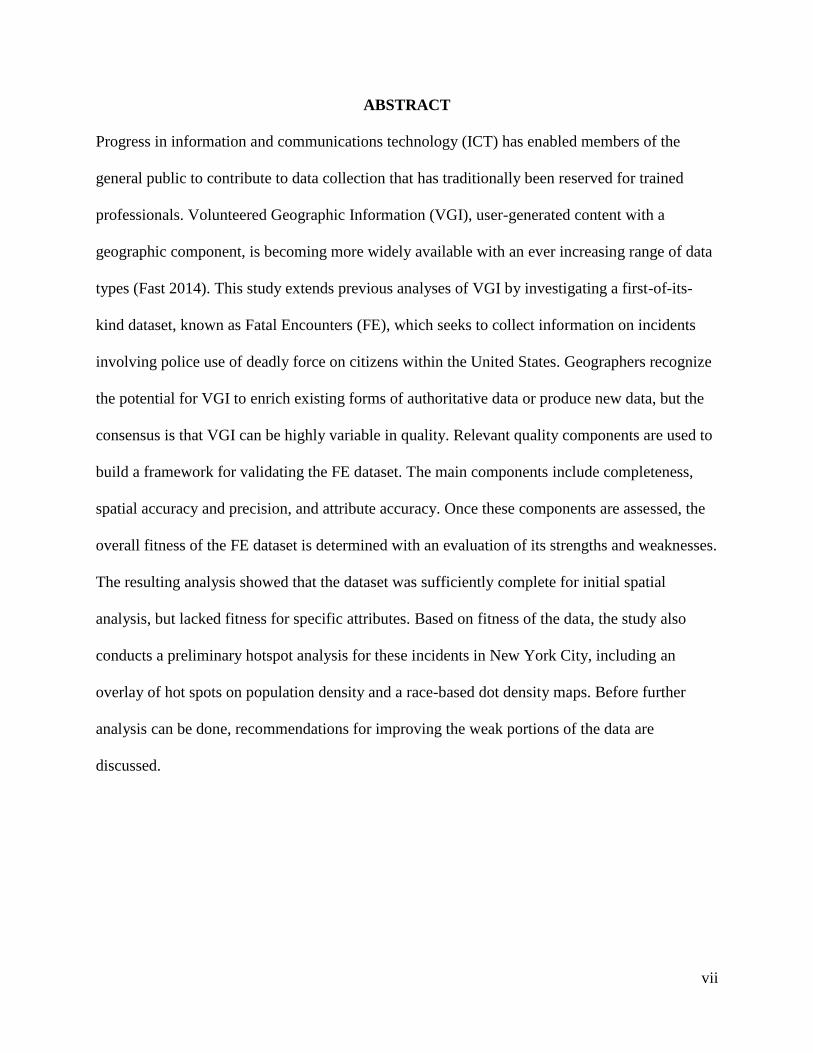
ABSTRACT
Progress in information and communications technology (ICT) has enabled members of the
general public to contribute to data collection that has traditionally been reserved for trained
professionals. Volunteered Geographic Information (VGI), user-generated content with a
geographic component, is becoming more widely available with an ever increasing range of data
types (Fast 2014). This study extends previous analyses of VGI by investigating a first-of-its-
kind dataset, known as Fatal Encounters (FE), which seeks to collect information on incidents
involving police use of deadly force on citizens within the United States. Geographers recognize
the potential for VGI to enrich existing forms of authoritative data or produce new data, but the
consensus is that VGI can be highly variable in quality. Relevant quality components are used to
build a framework for validating the FE dataset. The main components include completeness,
spatial accuracy and precision, and attribute accuracy. Once these components are assessed, the
overall fitness of the FE dataset is determined with an evaluation of its strengths and weaknesses.
The resulting analysis showed that the dataset was sufficiently complete for initial spatial
analysis, but lacked fitness for specific attributes. Based on fitness of the data, the study also
conducts a preliminary hotspot analysis for these incidents in New York City, including an
overlay of hot spots on population density and a race-based dot density maps. Before further
analysis can be done, recommendations for improving the weak portions of the data are
discussed.
1
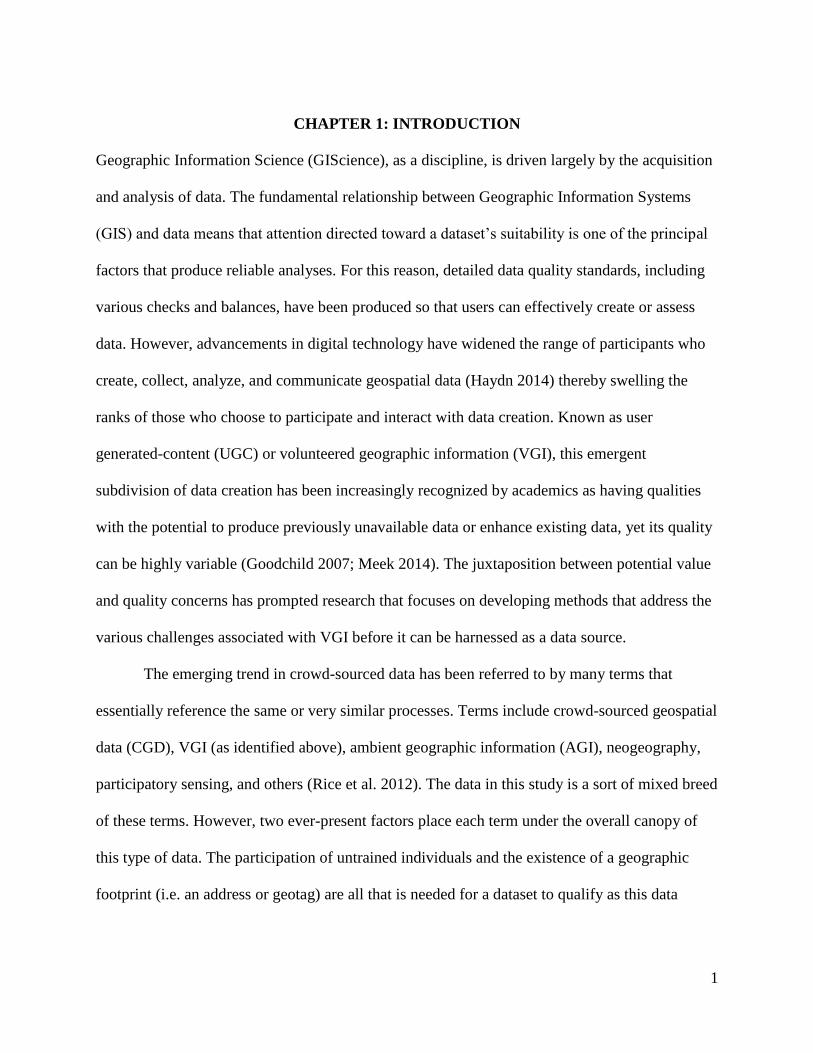
CHAPTER 1: INTRODUCTION
Geographic Information Science (GIScience), as a discipline, is driven largely by the acquisition
and analysis of data. The fundamental relationship between Geographic Information Systems
(GIS) and data means that attention directed toward a dataset’s suitability is one of the principal
factors that produce reliable analyses. For this reason, detailed data quality standards, including
various checks and balances, have been produced so that users can effectively create or assess
data. However, advancements in digital technology have widened the range of participants who
create, collect, analyze, and communicate geospatial data (Haydn 2014) thereby swelling the
ranks of those who choose to participate and interact with data creation. Known as user
generated-content (UGC) or volunteered geographic information (VGI), this emergent
subdivision of data creation has been increasingly recognized by academics as having qualities
with the potential to produce previously unavailable data or enhance existing data, yet its quality
can be highly variable (Goodchild 2007; Meek 2014). The juxtaposition between potential value
and quality concerns has prompted research that focuses on developing methods that address the
various challenges associated with VGI before it can be harnessed as a data source.
The emerging trend in crowd-sourced data has been referred to by many terms that
essentially reference the same or very similar processes. Terms include crowd-sourced geospatial
data (CGD), VGI (as identified above), ambient geographic information (AGI), neogeography,
participatory sensing, and others (Rice et al. 2012). The data in this study is a sort of mixed breed
of these terms. However, two ever-present factors place each term under the overall canopy of
this type of data. The participation of untrained individuals and the existence of a geographic
footprint (i.e. an address or geotag) are all that is needed for a dataset to qualify as this data
2
subtype. The remainder of this work uses the terms VGI and crowd-sourced data interchangably
and does not focus on where the data belongs in the accepted terminolgy.
This thesis project focuses on a first-of-its-kind VGI dataset, referred to as Fatal
Encounters (FE), relating to police use of deadly force on citizens in the United States. The
determination for creating the dataset was to compile a list of every United States citizen whose
encounter with law enforcement resulted in loss of life, and the effort employs a variety of
methods for compiling each incident. This study relies upon GIS standards to evaluate the
collection processes, completeness, accuracy, and consistency of the FE dataset. To accomplish
this task, a hybrid framework is developed based on other VGI quality assessments (QA) so that
the FE dataset can be appraised. Construction of a unique framework is necessary because none
of the prior VGI QAs have examined a dataset with qualities like FE. It is intended that the basis
for evaluating the FE dataset will either confirm or deny its soundness, which will determine its
utility for scientific analysis.
1.1 Research Objective
The guiding principle in this thesis is that a better understanding of the frameworks that enhance
the quality of VGI data will support an adaptive QA of the FE dataset. An exploration of
currently existing VGI projects enables better classification of the FE data and a context for
determining which components affect quality. Moreover, academic development of VGI QA
frameworks meant to assess quality are typically comprised of individual components that
influence the overall integrity of the data. The first objective is to identify which components of
other VGI QA frameworks may also affect the FE dataset. After gathering the relevant quality
components, this study builds a customized framework as the basis for testing the validity of the
FE dataset.
3
The applicable components of VGI QA frameworks are then compared to the FE dataset.
The performance of the FE data, with regard to its collection processes, completeness, and
spatial accuracy versus the quality controls serves to identify its strengths and weaknesses. The
function of this process is to identify the areas where the dataset is fit for analysis or not.
Portions of the dataset deemed inadequate are discussed to suggest where weaknesses could be
strengthened through curation, modifying collection protocol, or clarifying definitions. Where
possible, direct curation is used to improve the dataset, while other weaknesses, where curation
is impossible, are evaluated solely to determine fitness for analysis.
The portion of the data that passed QA and was found to be fit was New York State.
Incidents were geodcoded intoArcMap for a preliminary hotspot spatial analysis, in New York
City, on the raw incident count and the incident count normalized by population. Accompanying
the hotspot analysis are a population density map and a dot density map of racial dispersion.
Key considerations for this study include the following questions:
1. Can the different methods for validating VGI be customized to assess a dataset
unique to other crowdsourced VGI?
2. Is the FE dataset considered fit for analyses based on the custom framework?
3. What are the sources of uncertainty in the FE data and how can these issues be
mitigated?
4. Can spatial analysis provide geographic context for FE?
1.2 Motivation
2014 was a year where amplified attention in the United States was directed toward the use of
deadly force by law enforcement officers. Nationally recognized cases – such as the shooting of
Michael Brown in Ferguson, Missouri (Lowery 2014) and the asphyxiation of Eric Garner in
4
New York City (Goodman 2015) – generated waves of scrutiny and fueled debate regarding the
frequency, distribution, justification, and possible racial profiling regarding these incidents.
Amidst alligations of police brutality, answering society’s concerns with relevant data and
scientific analysis has been stymied by the fact that no formal data currently exists that identifies
incidents where citizens are killed by law enforcement. The absence of this data is remarkable
considering that the Bureau of Justice (BOJ) and the Federal Bureau of Investigation (FBI)
collect extensive information on aggravated assualt, hate crimes, officers killed in the line of
duty, and many other areas (Maimon 2011). The obvious gap in data availability was clearly
revealed when FBI director James Comey stated: “It’s ridiculous that I can’t tell you how many
people were shot by police last week, last month, last year” (Fossett 2015, 1).
This data void exists, not because government has been apathetic, but rather because it
has been unsuccessful in collecting data on these types of incidents. The FBI’s Uniform Crime
Report recorded around 400 justifiable homicides per year between 2008 and 2012 (FBI 2012).
Meanwhile the Bureau of Justice (BOJ) compiled roughly 488 arrest-related deaths from 2003 to
2009 (BOJ 2015). The official statistics of FE for the years when the most complete information
was available (2013 with 1,198 incidents and 2014 with 1,233 incidents (FE 2015)), show counts
that more than double both the FBI and BOJ figures (FBI 2012; BOJ 2015). It would seem that
the number of incidents has increased dramatically in a short period of time. This is unlikely,
however, and is explained by the government’s own admission that its data is insufficient. The
Bureau of Justice Statstics published a report in March of 2015 stating that, “At best, the Arrest
Related Deaths (ARD) program captured approximately half of the estimated law enforcement
homicides in the United Sates during 2003-09 and 2011” (BOJ 2015, 2). The report sites an array
of reasons why data collection has failed.
5
Hence, the dearth of available data specific to police use of deadly force, coupled with
the inability of government to effectively track them, has motivated determined citizens to find
alternatives. At present, five crowd sourced datasets have emerged that attempt to capture every
incident where police use of deadly force occurs. Each dataset has its own unique features, but
one stands out as the most likely to hold up to QA inspection.
Reasons for undertaking this project are numerous. First, testing the FE dataset serves as
an indicator for whether this type of data is being adequately collected and whether the data that
has been collected thus far is sufficient for analysis. Second, vetting the FE dataset to gain a
better understanding of its quality is a necessary step before its value can be realized. Finally,
evaluating a dataset from the perspective of GIScience augments the idea of what type of crowd
sourced-data has potential for spatial analyses. Ultimately, the hope is that the work conducted in
this thesis serves as progress toward making available a dataset in an controversial area with a
significant data vacuum.
1.3 Purpose
The anticipation generated from the construction of a dataset that lists each instance of police use
of deadly force is substantial and is supported by the fact that FE has already seen attention from
multiple popular media outlets. The prospect for finally possessing a means for understanding
what the national landscape looks like for law enforcement’s use of deadly force is tremendous.
Citizens in the United States, for the first time, could possess a window that might help
contextualize where, why, when, and with what frequency these incidents occur. However,
before any analysis and/or conclusions can be attempted, the validity of the FE dataset must be
established and weaknesses identified.
6
The reason for proposing this study stems from its intrinsic value to both the spatial
sciences and society. If the FE data is deemed fit, any future analyses will produce the first
academically recognized works looking at police use of deadly force on a national scale through
the lens of GIS or other sciences. Furthermore, improvements in collection protocol or curation
in areas where FE is not of sufficient quality will pave the way for future, more in-depth,
analyses. Lastly, this type of crowd-sourced data has never been vetted and therefore adds to the
variety of VGI data being studied from a GIScience perspective. Examples in literature where
VGI systems implementation is studied are consistently directed to datasets such as Wikimapia
or Open Street Map, so the addition of the differing context the FE data offers should be
welcome. Finally, the systems that help analyze the nature of VGI are not yet advanced or
refined enough for formal standards to be created. The work done in this thesis is a step toward a
more formal blueprint.
Another reason for undertaking this study was to help position FE as being the most
robust dataset with regard to completeness, attribute richness, and temporal depth. Additionally,
this study seeks to define where FE fits into the domain of VGI in comparison to other projects.
Understanding the unique characteristics of FE enables the critique of it to establish where
improvements will improve overall quality.
1.4 Organization of Thesis
The remainder of this thesis is arranged as follows. Chapter Two summarizes the background
and collection protocols of the FE dataset. Chapter Three consists of an examination of VGI and
the literature that focuses on quality assessment. An outline of similar, competing datasets is also
presented. Also included is a look at the type of spatial analysis used to understand crime-like
data that are appropriate for initial spatial analysis. Chapter Four describes the specific methods
7
employed to test the FE dataset, followed by a description of the actions taken to build a sample
dataset to use for comparison. Included are methods for sampling and geocoding the data along
with the preliminary spatial analysis. Chapter Five presents and discusses the results of the
validation process, outlining areas of uncertainty and recommendations for improvement. This
chapter also includes the results of the spatial analysis for New York City. Chapter Six discusses
the significance of the results and whether the FE dataset can be considered fit for analysis. It
continues by discussing the potential for analysis FE possesses once its quality is deemed to be
sound.
8
CHAPTER 2: THE FATAL ENCOUNTERS DATABASE
The origin of VGI is consistent and typically begins from a perceived problem, such as a
political crisis or natural disaster (Fast 2014). By the same token, out of a deep concern with the
frequency of incidents resulting in death between police and citizens in the United States, on
May 18, 2012, D. Brian Burghart, editor of the Reno-Review Journal, began compiling instances
where citizens were killed by police. Mr. Burghart’s goal was to create a comprehensive national
database listing every incident from January 1, 2000 through present day. Stimulated by the urge
to grant society access to data detailing officer-involved homicides, Mr. Burghart recognized
there were multiple methods that could be used to populate such a database. He knew he had to
capture all retroactive incidents while also compiling any present day incidents. To accomplish
this he developed a multi-tiered system (Burghart 2015). This chapter provides a background of
the FE dataset, including its modes for data collection, definitions, scope, administrative
hierarchy, and information sources.
2.1 Fatal Encounters Collection Systems
Each of the methods developed by FE calls for varying levels of participation from the
administration and volunteers. Depending on the task, the amount of time a volunteer contributes
can range from 15 minutes to many hours on consecutive days. The direction of a task fluctuates
from querying a search engine and filling out an online form or filing a public records request
with law enforcement agencies, to specialized participants who focus on searching one state at a
time. The following subsections detail the collection systems used by FE.
2.1.1 Public Records Requests
The first data collection method relies on records obtained from law enforcement agencies
through requests made under the Freedom of Information Act (FOIA). Mr. Burghart began by

9
filing a public records request to the FBI asking for the address of every law enforcement agency
that contributes records, such as officers killed in the line of duty, to the FBI’s Uniform Crime
Report (UCR). A 2008 census conducted by the BOJ found 17,985 state and local law
enforcement agencies with at least one full-time officer (BOJ 2008). After studying FOIA
exceptions – legally valid reasons for turning down a request – it was determined that 15 data
fields could reasonably be requested. They include: subject’s name, age, gender, race, date of
death, location of death (address, city, state, zip code), agency responsible, cause of death, a brief
description of circumstances, and whether the incident was justified or not.
Given the large number of agencies in the UCR database, Mr. Burghart made available
on the FE website the name and address for each agency, selectable by state or county. FOIA
requests are designated for federal agencies only, but often state and local agencies will honor
them. However, each state has separate laws for public records requests meaning that obtaining
records from each agency is likely to require special attention. Mr. Burghart had in mind that
volunteers from each state would be able to file requests since they were more likely to be
familiar with that state’s laws. Some agencies require tedious back and forth communications
concerning laws or fees before any records are released.
2.1.2 Mining Similar Datasets
The second system includes parsing records from partial, yet related datasets. The objective was
to sift through an array of crowd-sourced datasets to accumulate as many incidents as possible,
without regard to date or location, so that a preliminary database of names could be built and
details researched later. Once these datasets were mined and the names of decedents began
accumulating, the incidents could be cross-referenced to a media source.

10
For this process, volunteers work with two spreadsheets (the official database and the
research queue) which are available on the FE website through Google documents. Volunteers
are instructed first to pick a name in the research queue that has not been highlighted as
completed, and then search the official database by last name to ensure that it has not already
been examined. Next, the volunteer is told to enter the victim’s name into their desired search
engine, comb through the results (at least the first 10 entries), and fill in the submission form on
the FE website. Once the record is submitted, Mr. Burghart moves the entry to a third
spreadsheet, unavailable to the public, where he personally verifies the record from the links
provided by the volunteer. The entry is then moved to the official database and deleted from the
research queue.
2.1.3 Specialized Researchers
In this method FE incidents are found through rigorous search engine queries conducted by one
specialized researcher, Mr. Walt Lockley. Generally focusing on one state at a time and using a
personal methodology he developed to comb media archives, he moves temporally and spatially
through the state’s media records. From his work alone, FE has seen a dramatic upturn in the
number of states they consider to be complete. Once an incident is identified, the information is
compiled and sent directly to Mr. Burghart.
2.1.4 Data Capture from Volunteers
The final system is meant to sustain the FE dataset by capturing data that the first two methods
do not. Here, volunteers are encouraged to fill in the same submission form mentioned in the
previous section with links to their information sources. New entries must also be searched
against the official database so as to avoid redundancy. Note that the instructions in this section
emphasize finding the most accurate address as possible. The county is found through plugging

11
the address, city and state into Google maps, then inserting the zip code into the National
Association of Counties (NACO) to get the county. The survey form becomes more specific for
address entry. It states:
Be as specific as possible with street addresses. For example, 613 North Anna
Drive is best; 600 block of North Anna Drive will work; North Anna Drive will
work; North Anna Drive and La Palma Avenue will work for an intersection.
Most other variations won’t work. If you’re uncertain, just try what you have in
Google Maps. Whatever you do, don’t guess. Let the fact-checker look it up
(Fatal Encounters 2015).
Written just above the survey form the FE website attempts to enlist volunteers to point out any
errors, repeats, or needed clarification through a link to a corrections form. Finally, once all
fields are filled in, participants submit directly to Mr. Burghart. Each form is then fact checked
for validity before it is moved to the main database.
2.1.5 Verifying Records
Reiterating that Mr. Burghart personally fact-checks every entry submitted is important for
recognizing that all data is filtered before becoming accessible. Other VGI studies do not have
the benefit of this mechanism. The advantage of one person acting as gate-keeper has a number
of positive influences on the data. Mr. Burghart can change inaccurate information, double-check
that incidents align with the scope of FE, and expunge redundant entries.
2.2 Administration Hierarchy
Mr. Burghart is the gatekeeper through which all data must pass. Unlike other VGI projects
where any user can affect the overall outcome of the data, FE only allows data approved by Mr.
Burghart. Mr. Lockley is the second highest level volunteer contributing regularly. Below them
are a handful of regular contributors and finally other volunteers allowed to submit information
through a registered account or anonymously if they choose.
12
Other volunteers have helped Mr. Burghart develop tools such as the online submission
form, the Google document spreadsheet, and have made video media or preliminary maps
supporting the FE website, but they do not directly contribute to data creation (Burghart 2015).
Essentially, Mr. Burghart is the sole proprietor and administrator of the data and no entries make
it to the master database without his approval.
2.3 Fatal Encounters Summary
FE is a 501(c)(3) non-profit organization that accepts donations. Moneys from donations are not
significant enough to pay full-time researchers, but it does help pay FOIA fees and allows small
portions of money to be given to regular contributors. At present, funding is being sought
through proposals to Federal agencies and an Indiegogo campaign.
Combined, these methods have yielded 7,022 incidents from January 1, 2000 through
June 15, 2015. Mr. Burghart estimates the dataset is approximately 40% complete (Burkhart
2015). However, there are twelve states that are listed as complete: Connecticut, Florida, Maine,
Massachusetts, Montana, New Hampshire, Nevada, New York, Oregon, Rhode Island, South
Dakota, and Vermont. The states declared to be complete have a consistent temporal dispersion
which indicates, based on the assumption that incidents are spread mostly even over time, they
are indeed nearing completion. Also, the years 2013 and 2014 are closer to complete than other
years due to augmentation from competing datasets and increased attention overall from media
outlets.
13
CHAPTER 3: LITERATURE, QUALITY COMPONENTS, AND RELATED DATA
This chapter surveys literature pertaining to quality assurance of VGI data. It also includes a
brief summary of popular VGI projects and their relationship to FE. Following this is a
discussion of competing datasets to FE that attempt to compile the same information, or are
similar enough to capture the data of interest within its scope. This chapter concludes with a
discussion of the common types of analyses used for crime data and how they can direct
potential analyses on FE.
3.1 Volunteered Geographic Information and the Need for Data Quality Assurance
The rapid advancement of digital technology and information availability has dramatically
changed how information is produced, disseminated, and used, often leveraging community (or
crowd) participation to contribute data that had previously been reserved for trained personnel
(Fan 2014). The term VGI, coined by Goodchild (2007), is defined as the use of tools to create,
assemble, and disseminate geographic data voluntarily provided by individuals (Brown 2012).
The definition is necessarily broad, and is meant to encompass various projects that relate to this
new data category. Discussed briefly in Chapter One, the dynamic nature of this data type has
seen the creation of many terms meant to describe the variety of projects with the process of
collective authorship by a community of end-users (Howe 2008). Some projects consist of crowd
wisdom, crowd creation, crowd voting, or crowd funding. The FE dataset pertains most closely
to crowd creation and the associated quality pitfalls.
3.1.1 Volunteered Geographic Information Projects
Crowd data is derived from non-authoritative sources and can be primarily geospatial in nature
or contain information without any specific geographic purpose, yet still possess a geographic
footprint, such as an address or geotweet (Haydn 2014). The vast majority of VGI projects rely
14
on participants’ use of hardware (i.e. GPS-enabled cameras, smartphones, etc.) to geotag their
position along with a photograph or other piece of information (Comber 2013). Examples of
these projects include tracking wildlife poaching (Stevens et al. 2013), urban noise pollution
(Gura 2013), responses to climate change (Beaubien 2011), and logging or drawing features in
OpenStreetMap (Fan 2014).
The diversity of these projects illustrates the dynamism of VGI; however, the signature
for this subdivision of data, a geographic footprint, is ever-present. In his journal article, See et
al. (2013) points out that the direct manner by which volunteers provide location, such as in the
VGI projects mentioned above, the crowd can also produce sources of spatially relevant data in a
less direct manner. Referred to as “incidental data” (Criscuolo 2013), these projects rely on
mining data from blogs, forums, twitter, media, government and other web-based media. The FE
dataset falls into the latter category of VGI, where the geographic footprint manifests from
addresses, cross streets, or other place-based nomenclatures harvested from retroactive
information, such as media accounts or government records.
What separates VGI from Professional Geographic Information (PGI) is the influence of
developed data standards. For example, the National Spatial Data Infrastructure (NSDI) hosted
by the Federal Geographic Data Committee (FGDC) provides for the coordinated development,
use, sharing, and dissemination of geographic data on a national level (FGDC 2015).
Infrastructures like these promote quality data practices which in turn give authority to users of
such data. Further, professionals who develop data using refined standards are putting into use
practices that help alleviate concerns over quality.
Despite the lack of influence from standardized protocols, as increased attention is
directed toward VGI, members of the academic community are attempting to understand if the
15
perceived value of the data is supported by its quality, noting that the characteristics that mold
the information may not be as rigorous as traditional scientific data reporting (Jackson et al.
2013). Jackson et al. continue by asserting that quantifying the key quality characteristics of VGI
data would be a step toward realizing the standards that can reasonably be expected to be
included in contributed datasets. The implication here is that once these characteristics are
identified, the contributed data can then be compared to other, similar professional datasets,
termed reference datasets. The first studies of VGI that compare the data to authoritative data
were conducted by Haklay (2010), Mooney et al., (2010), and Zielstra (2010). However, in a
dataset like FE, no reference source is available for comparison. Since authoritative data
comparison is impossible, this study relies upon extracting relevant QA components from
academic literature that address VGI quality.
3.1.2 Volunteered Geographic Information Literature
Despite its relative youth, literature concerning VGI data has become quite robust, with one
common theme resounding throughout. Consensus among academics is that QA’s are essential,
no matter the project. With QA concerns ever-present, the emphasis of literature can range from
VGI project case studies, (Jackson et al. 2010, Fan 2014, Heipke 2010), to developing validation
frameworks (Meek 2014; Fast 2014; Haydn 2014). Some focus on understanding the motivation
for participation or creation (Zook and Graham 2010), while others discuss the social
implications for the emergence of VGI, like the potential erosion of privacy (Obermeyer 2007),
erecting new platforms of activism (Turner 2006), or influencing new forms of exclusion (Zook
et al. 2007). The overall diversity of the literature reflects the wide assortment of VGI data. Yet,
it is apparent that the same core literature is cited among the works that consider VGI, including
16
in particular Haklay (2010) and Goodchild (2007). Thus, the best way to characterize and extract
QA factors relevant to the FE dataset is to use a conglomeration of the available literature.
3.1.3 Active versus Passive
According to Meek (2014), VGI can be divided into two main types, active (i.e. geotagging and
describing a location, digitizing a road, or collecting coordinates) and passive (i.e. information
mined from Twitter or media accounts). Dovetailing VGI into one these two categories suffices
for most projects but FE cannot be categorized as one or the other because it is both active and
passive. FE is active in the sense that participants fill out forms for recent incidents, and passive
through the mining of incidents from media accounts or government records. It stands to reason
that the ambient nature of the FE dataset requires both active and passive methods in order to
collect both retroactive and present data. Ambient, as it were, is data that references location and
description to momentary social hotspots (Stefanidis et al. 2013). Because attention is given to
instances when law enforcement uses force, there are often archived accounts of the incident. FE
relies upon these accounts to gather data both actively and passively.
3.1.4 Describing Location
Sui (2014) explains that the perception and description of space and place for geographers differs
from that of the general public. GIScientists emphasize as precise a description of a feature as
possible (i.e. X, Y coordinates), expending great effort to ensure boundaries and locations are
accurate and easily discernable. As such, GIS functionality is best when these descriptors are
most accurate. In contrast, VGI, because it emanates from the crowd, reflects more closely the
popular interpretations of place. People tend to refer to locations by place-names, addresses, or a
point of interest, with little relation to precisely bounded features (Sui 2014). This presents a
problem when attempting to apply VGI to GIS. How can informal human discourse for places be
17
translated to precise locations on the earth’s surface? The imprecision in human discourse is a
significant factor for the FE dataset. For example, a media report may describe an incident’s
location as being in “Southeast Portland” rather than referring to a street address. Any instance
where informal rhetoric is used directly affects the ability to precisely locate an incident.
Here it is important to distinguish between accuracy, precision, and the possible error for
both. Accuracy is the degree to which the information in a database matches the true or accepted
values (Rambaldi 2006). Conveyance of accurate information is a risk for FE because it relies on
accounts from media and government along with, at times, further interpretation from volunteers
or administration. Vague or misguided descriptions of place can have large effects on how well
an incident can be located on a map. Precision refers to the spatial resolution or the exactness of
the description (Rambaldi 2006). For FE, an example of optimal precision and accuracy would
be a truthfully reported numbered street address. The FE dataset is at risk for increased locational
error whenever reports are erroneous or lack specific description.
The address field presents the best possibility for precise locating but is most susceptible
to ambiguities, and therefore inaccuracies, because the information is derived from accounts with
varying degrees of description. These sources can vary widely in their portrayal of place,
sometimes providing a full address, while in other instances, only cross-streets or single roads
are given. Furthermore, there is no system for determining which address best fits an incident.
There is also no descriptor indicating whether the event happened inside a building or outside,
thereby decreasing the certainty of the exact location of the event. For this reason, the source
from which the data is derived comes into question just as much as the participant researching
the incident. There is no way to evaluate media or government sources accounts of address, or
how they chose to describe a particular location. The FE dataset relies on well reported records
18
for each incident, meaning any imprecision in reporting is expressed in the data. However, a
marginal level of positional uncertainty for the FE data may be permissible for some analyses as
is discussed in the methodology.
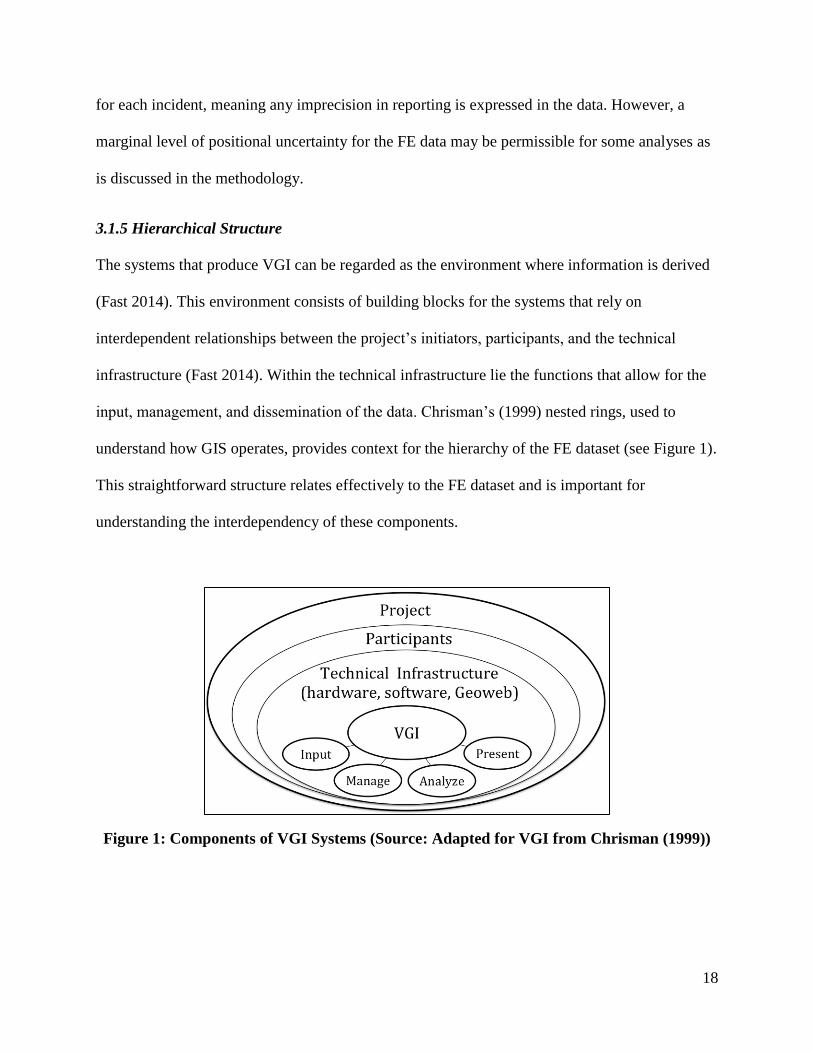
3.1.5 Hierarchical Structure
The systems that produce VGI can be regarded as the environment where information is derived
(Fast 2014). This environment consists of building blocks for the systems that rely on
interdependent relationships between the project’s initiators, participants, and the technical
infrastructure (Fast 2014). Within the technical infrastructure lie the functions that allow for the
input, management, and dissemination of the data. Chrisman’s (1999) nested rings, used to
understand how GIS operates, provides context for the hierarchy of the FE dataset (see Figure 1).
This straightforward structure relates effectively to the FE dataset and is important for
understanding the interdependency of these components.
Figure 1: Components of VGI Systems (Source: Adapted for VGI from Chrisman (1999))
19
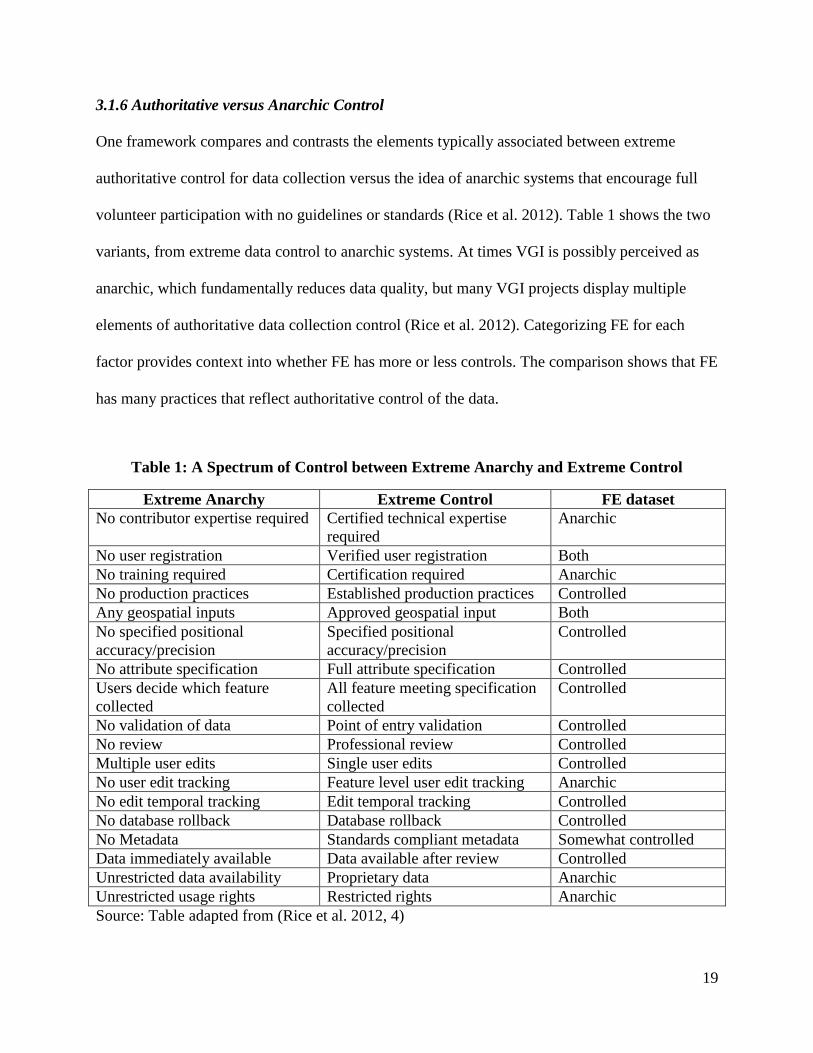
3.1.6 Authoritative versus Anarchic Control
One framework compares and contrasts the elements typically associated between extreme
authoritative control for data collection versus the idea of anarchic systems that encourage full
volunteer participation with no guidelines or standards (Rice et al. 2012). Table 1 shows the two
variants, from extreme data control to anarchic systems. At times VGI is possibly perceived as
anarchic, which fundamentally reduces data quality, but many VGI projects display multiple
elements of authoritative data collection control (Rice et al. 2012). Categorizing FE for each
factor provides context into whether FE has more or less controls. The comparison shows that FE
has many practices that reflect authoritative control of the data.
Table 1: A Spectrum of Control between Extreme Anarchy and Extreme Control
Extreme Anarchy Extreme Control FE dataset
No contributor expertise required Certified technical expertise
required
Anarchic
No user registration Verified user registration Both
No training required Certification required Anarchic
No production practices Established production practices Controlled
Any geospatial inputs Approved geospatial input Both
No specified positional
accuracy/precision
Specified positional
accuracy/precision
Controlled
No attribute specification Full attribute specification Controlled
Users decide which feature
collected
All feature meeting specification
collected
Controlled
No validation of data Point of entry validation Controlled
No review Professional review Controlled
Multiple user edits Single user edits Controlled
No user edit tracking Feature level user edit tracking Anarchic
No edit temporal tracking Edit temporal tracking Controlled
No database rollback Database rollback Controlled
No Metadata Standards compliant metadata Somewhat controlled
Data immediately available Data available after review Controlled
Unrestricted data availability Proprietary data Anarchic
Unrestricted usage rights Restricted rights Anarchic
Source: Table adapted from (Rice et al. 2012, 4)
20
3.2 Quality Assurance Components
Quality issues associated with VGI have been widely deliberated by academics and geospatial
practitioners. Many of the traditional concepts for quality assurance arose from the practice of
paper mapping but have been subsequently adapted to accommodate the transition to electronic
GIS (Rice et al. 2012). Considering that the FE dataset has no authoritative data for comparison,
the strategy for analyzing its quality is guided by multiple sources that outline common fitness
indicators. This section introduces the components that might cause FE’s fitness to suffer.
3.2.1 Lineage
In the Federal Geographic Data Committee’s (FGDC) Content Standard for Digital Geospatial
Metadata, they define lineage this way: “Information about events, parameters, and source data
which constructed the data set, and information about the responsible parties” (FGDC 2012, 1).
Lineage is especially important for the FE dataset because information is derived from a number
of different sources. Ideally, lineage has a stored component for each feature in a dataset.
However, lineage can be quantified by enumerating the primary source(s) for each entry.
The quality of the source is also important, as discussed earlier, where media or
government accounts inevitably vary in the accuracy and /or precision of their reporting. Because
of the heavy reliance on these sources, this is an inherent deficiency for this type of data.
3.2.2 Attribute Accuracy, Completeness, and Consistency
Attributes, in a geospatial sense, are the non-spatial data that are connected to location (Haklay
2014a). For the FE dataset, attribute accuracy is inextricably linked to lineage. The accuracy of
attributes is directly reliant on the quality of the sources. Knowing how effectively these sources
populate the database is one aspect that needs to be measured. The number of null values in a
field versus the number of entries populated by data is a function of completeness.
21
Attributes assigned to a field are only as good as the definitions and rules that govern
them (Morris 2008). For example, the cause of death should have specific rules stating
information that can be entered for each incident. If there are multiple causes of death, there
should be clear rules for dealing with outliers. Another example would be the difference in the
interpretation of a journalist versus what the justice department might consider as to whether an
officer’s use of force was justified. One might be an opinion, while the other is the result of due
process. Errors due to misclassification or incorrect attribute values can be common in VGI
(Rice et al. 2012).
Once fields are established, the information contained within them must be consistent.
Number fields should contain only numbers and text fields should have only text. Features, like
cities should be entered the same every time. New York City cannot also be listed as NYC.
Exploring the database for these potential problems will give an idea how well the data would
perform in analyses.
3.2.3 Positional Accuracy
Positional accuracy refers to the deviation of feature positions from their real world position in
the vertical and horizontal domains (Rice et al. 2012). The positional accuracy for the FE dataset
is not as reliant on exact location as other VGI projects. However, it is important to establish
what is meant by the location of an incident and how well the address field defines an incident’s
location. Further, helping alleviate positional accuracy concerns, vertical data is not relevant to
the FE dataset. Yet, it is important to understand how well the database can describe the location
of an incident.
The address field in FE identifies location through place name. For example, a numbered
address is given in most instances, which provides an acceptable positional accuracy. However,
22
other instances simply list cross roads or a street name, which degrades the ability to precisely
locate incidents. Low-level description is a concern for the FE dataset. Instances where
locational description is vague must be inspected and curated before they can be properly
imported into GIS.
3.2.4 Completeness
Completeness is the number of objects expected to be found in the database but are missing or
are present but should be excluded (Haklay 2010). It is vital to ensure that the definitions of
criteria for information that should be included in a dataset are as precise as possible. Without
the ability to discern which incidents qualify as fatal encounters, the risk for entering non-
applicable cases escalates. Also, comprehensively capturing incidents is of paramount
importance. An incident not being captured by FE is likely to be the greatest source of criticism
from critics and analysts of VGI. However, the assessment of each of these components yielded
the first academic understanding of the data’s fitness.
3.3 Competing Datasets
Before describing the FE data set in detail, it is important to understand how other similar
datasets relate. Police use of deadly force has always been a topic that has generated debate, but
in the last two years, increased attention has been directed toward gun violence, including mass
shootings and cases where law enforcement’s use of deadly force is perceived to be excessive.
Given the fact that data is useful for providing context to violence in the United States, several
datasets now exist where gun violence or law enforcement’s use of force is being compiled,
whether it be by an individual, the collective public, or government entities.
23
3.3.1 Datasets Collecting Related Data
The scope of a project is important for determining exactly what information should be collected.
Two entities collect data that overlaps with the scope of the FE dataset.
3.3.1.1 Homicide Watch D.C.
Homicide Watch D.C. tracks the details of every homicide, from crime to conviction, within the
bounds of the District of Columbia (Homicide Watch D.C. 2015). Using media reporting, court
documents, social media, and the help of involved families or neighbors to compile information,
this group of local citizens has built an open-access database (Homicide Watch D.C. 2015). The
advantage this dataset has over the FE dataset is that the study area is small enough that members
can personally follow each case. Furthermore, the crowd, in this example, consists of a few
contributors, which eliminate the variability of relying on possibly hundreds of volunteers to
compile the data. Because of the scale Homicide Watch D.C. can focus solely on local
information sources, which results in greater confidence in completeness.
3.3.1.2 Gun Violence Archive
Another group began compiling every gun related incident in the United States since the
Newton, Connecticut shooting on December 14, 2012. After one year of sourcing only media
accounts, the project was picked up by the Gun Violence Archive (GVA), a non-profit
organization who now detail near real-time data concerning every incident involving firearms
(GVA 2015). Comprised of 10 paid researchers, the GVA perpetually scans 1,200 media,
government, and commercial sources (GVA 2015). Utilizing full-time employees enables the
GVA to effectively gather and publish information in a real-time, user-friendly interface. Gun
violence is categorized into one of a possible 100 associated causes. Among them are hate
crimes, domestic violence, gang involvement, and police action. Data also includes whether
24
victims were injured or killed. The spatial precision is high and provides both the address of the
incident and X, Y coordinates. How the high degree of precision is achieved is unclear, but the
project’s high level of organization and polish exhibits authoritative qualities. Despite the GVA’s
authoritative surface, clean website design, and near instantaneous updates, the GVA lacks
temporal depth, which limits retroactive analysis. However, the ability to sort by law
enforcement-related incidents makes the GVA a prime candidate for comparison to the FE
dataset.
3.3.2 Datasets Collecting Same Data
Other datasets compete directly with the FE dataset. They attempt to compile the same
information but have variations that, for one reason or another, make them less attractive for
validation and subsequent analysis.
3.3.2.1 Killed By Police
There are three datasets that focus solely on police use of force on citizens. The first, Killed by
Police (KBP), was initiated on May 1, 2013, and is compiled solely by an individual who prefers
to remain anonymous. This individual utilizes media-sourced searches to hunt for incidents daily.
KBP defines incidents in its database as: “corporate news reports of people killed by nonmilitary
law enforcement officers, whether in the line of duty or not, and regardless of reason or method
with inclusion implying neither wrongdoing nor justification on the part of the victim or the
officer involved” (KBP 2013). Averaging approximately four incidents per day for nearly two
years, the data appears complete but not broad, enlisting only seven fields (date of death, state,
gender, race, name, age, and a link(s) to the media source). While likely capturing the bulk of
incidents, KBP lacks a precise geospatial footprint (i.e. address field). Given that KBP is
operated by one individual, the variation introduced by crowdsourced data is not a factor,

25
meaning that the collection protocol is likely consistent. Given that KBP has just over 2 years of
data, its main weaknesses are a lack of explicit protocol, attribute broadness and temporal depth.
Because of its similarity to the FE dataset, KBP is an excellent candidate for comparison.
3.3.2.2 U.S. Police Shooting Data
The final relevant dataset was started by a journalist, Kyle Wagner, from Deadspin who is
attempting to compile every officer-involved shooting – including non-fatal incidents – since
January 1, 2011 (Wagner 2014). This project is purely crowdsourced. There are explicit
instructions for volunteers to upload data through a form for days that have yet to be researched.
Volunteers query search engines, filter by day and research, and then enter all incidents for that
date. As of April 2015, they claim to have incidents for 60% of the days since January 1, 2011
(U.S. Police Shootings Data 2015). The database is similar to the FE dataset but is again missing
a field with a specific geographic footprint, like an address. Also, this dataset does not have an
administrative fact-checking team, which has left a large number of entries with missing field
values, thereby lowering attribute consistency. The strength of this dataset is that participants can
access an interactive spreadsheet to see which days are complete and do their research for
specific dates. Early participant momentum has declined significantly since the project’s
inception. However, this data is directly relevant to the FE dataset, thus justifying a comparison.
3.3.2.3 Arrest Related Deaths Program
The Arrest Related Deaths Program (ARD) is a spinoff from a program initiated in 2003 by the
BOJ, under legislation for the Deaths in Custody Reporting Program (DCRP). This program
utilizes state-reporting coordinators (SRCs) to track deaths that occur while an offender or
suspect is in the custody of a local jail or state prison facility as well as deaths that occur anytime
a person’s freedom to leave is restricted by law enforcement (BOJ 2015). The goal of the ARD
26
program is to have a comprehensive data-collection process that compiles information from
every state and law enforcement agency in the United States.
The ARD program has data from 2003-2009 and 2011. It possesses a much clearer
collection protocol and very detailed definitions for describing which incidents to include, and
also has a broad range of attributes. However, the program does not mandate that each state
participate making contribution to the program voluntary. Nevertheless, participation has been
high with as many as 46 states contributing in a given year.
Despite these strengths the Bureau of Justice Statistics (BOJS) published a technical
report in March 2015 analyzing the program’s data quality. The deficiencies found in the data
and collection process were extensive. The ARD is explicit for describing what type of incident
qualifies and how the data can be submitted by SRCs, but allows collection methodologies to be
determined by the SRC in that state. This variability has resulted in a lack of standardization at
the state level. The report states: “The manner in which incidents are identified and subsequent
information collected varies between and within states and over time, leading to nonsampling
errors from differences in use and interpretation of definition, scope, and data collection modes”
(BOJ 2015, 11). Concerns about the coverage, bias, reliability, and completeness of the ARD
data are extended by the fact that their technical report estimates that only approximately 50% of
all incidents were captured during 2003-2009 and 2011 (BOJ 2015). Furthermore, even though
SRCs have a less restrictive access to law enforcement records, the report indicates that the
primary source for gathering information come from media related searches. Admittedly, the
ARD data is unfit for analysis, but because it emanates from government and dates farther back
than the other projects mentioned above, it remains as a good candidate for comparing to the FE
dataset.
27
3.4 Analysis Possibilities
FE is similar in nature to crime data which is frequently analyzed to inform policy makers.
Crime analysis and mapping, realized through GIS, plays a major role in the reduction of crime
and improving police strategies (Kumar 2011). Publications by Chainey (2013) and Levine
(2004) have emerged as popular guidelines for crime analysts. These works are lengthy and
provide many examples for analyzing crime. One such method is the Getis-Ord Gi* statistic,
which is a complement to Kernel Density Estimation (KDE), and are both available in ArcMap.
The tool works by looking at each feature within the context of neighboring features to identify
statistically significant hot and cold spots (Esri 2015).
The idea for using hotspot analysis with the FE data is similar to law enforcement’s use
of the strategy to mitigate crime. Understanding where hotspots exist allows analysts to focus
greater attention on these areas so that they can uncover underlying reasons for the causes of the
hotspots. Of course, the fitness of the FE data is contingent upon producing analyses that are
useful for understanding police use of force.
28
CHAPTER 4: METHODOLOGY
This study endeavored to develop a customized framework for validating a unique VGI dataset
that is attempting to compile a list of every citizen who has died through interaction with law
enforcement. As such, this study individually examines a number of various components,
discussed in Chapter Two that affect the overall quality of VGI data. Through an array of
evaluation strategies of the FE dataset, the fitness of the data, including the identification of its
main strengths and weaknesses was determined. A better understanding of the quality will
increase the confidence of users who wish to use the data, as well as provide advice to the
administrators of the dataset regarding where and how their methods might be improved.
This chapter discusses the methodology for evaluating each of the quantifiable quality
assurance components. The strategy for designing a hybrid framework is based on components
outlined in other VGI QA studies (Haklay 2010, 2014; Meek 2014; Fast 2014). These are
combined to customize an approach that addresses the specific features that make up the FE
dataset. Next, methods used for geocoding incidents into ArcMap and the process for conducting
the subsequent preliminary hotspot analysis are outlined at the end of the chapter. Also, the
reasons for selecting the study area where the analysis was undertaken are explained.
4.1 Dimensions of Quality Assurance
The factors that affect data quality vary. It is for this reason that each of these factors is seen as a
separate dimension that should be evaluated individually, building strategies customized to
address specific characteristics. That is to say that the general criteria for quality need to be
defined and based upon the planned use of a given dataset (Sui 2014). This approach is necessary
because some quality elements might seem independent of a specific application, but in reality
they can only be evaluated within a specific context of use (Haklay 2014). For example, the
29
question of completeness can only be measured within the bounds of the area of interest within
the scope of what qualifies as the type of incident in question.
Often, reviewing metadata is the fundamental method to evaluate data quality (Rice et al.
2012). However, the FE dataset does not have formal metadata and therefore requires an ad hoc
evaluation of the main quality components that affect quality. Because the FE dataset is not yet
100% complete, the evaluation of each quality component focuses on different portions of the
dataset both spatially and temporally depending on the quality component being assessed.
Since the FE database is continually updated, the data underwent analysis from a download on
June 15, 2015. Any errors, such as repeat entries, within the data were documented and sent to
administration for curation. These errors were also corrected in the version used for analysis.
4.1.1 Completeness
Arguably the most important data quality component for FE is completeness. It is defined by the
number of objects expected to be found in the database but are missing, as well as the existence
of excess entries that should not be included (Haklay 2014). Assessing this requires a multi-
faceted approach. If it is found that several incidents are not being captured by FE collection
methods, the integrity of the data suffers. One of the main worries from media, is that crowd-
sourced projects compiling police use of force are missing large portions of data (Fossett 2015).
The strategies for quantifying completeness are outlined in the proceeding sections.
4.1.1.1 Public Records Requests
The FE dataset claims there are 12 states (CT, FL, MA, ME, MT, NH, NV, NY, OR, RI, SD,
VT) where every incident has been collected from January 1, 2000 through June 20, 2015
(Burkhart 2014). To test if FE is capturing incidents in these states, FOIA requests were sent to a
stratified random sample of law enforcement agencies. Maine was exempted from this process
30
because they are one of two states who require that the State Attorney General investigate
incidents where police use deadly force so data was acquired directly from this source (Maine
Attorney General 2015).
For all states except Maine, a database of the law enforcement agencies, obtained from a
2008 FBI census, was used to determine how many and which agencies to sample. The sample
size was determined by compiling the total number of agencies within 11 of the states, then
inputting that number into an online sample size calculator, developed by Creative Research
Systems (CRS 2015), The CRS calculator returns a sample size based on a desired confidence
level and confidence interval. These values were set at 95% and +/- 5% respectively. After
calculating the sample size for agencies to be sampled, the sample size was increased by 25%
(oversample) to provide extra samples in case of delayed or non-responses to the FOIA requests.
The total number of samples required was 410.
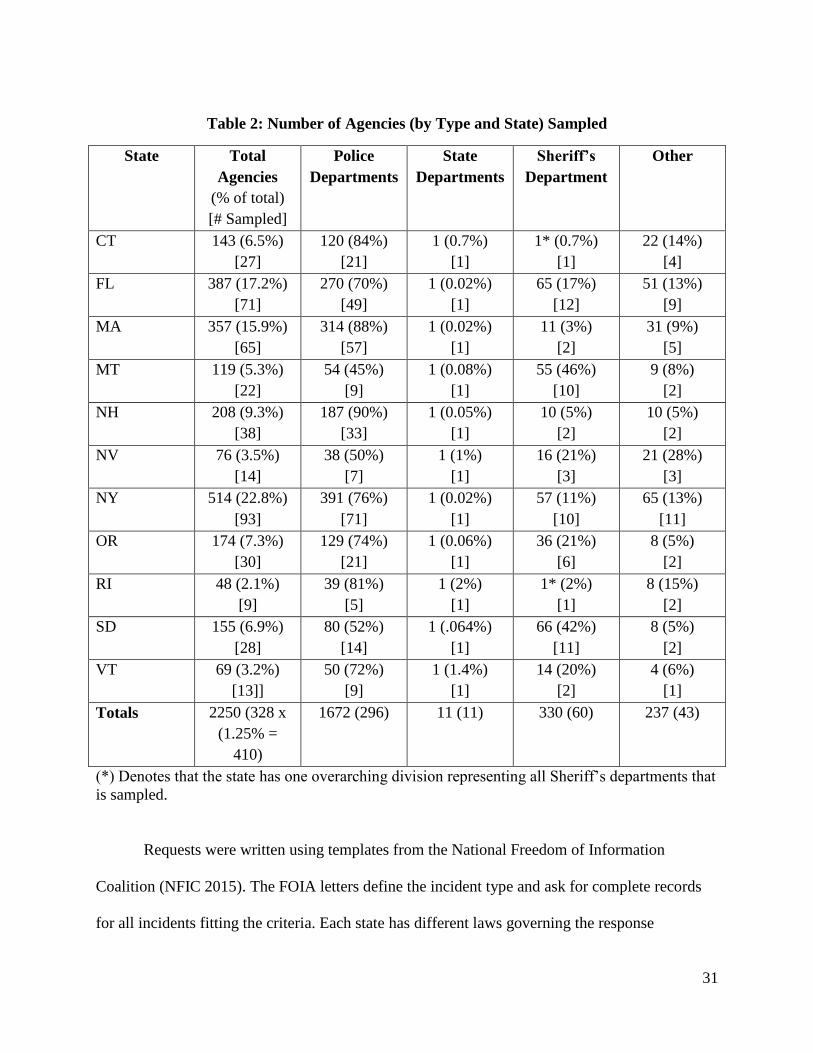
The sample was also stratified by state and agency type (local Police, Sheriff, State Patrol
and other, i.e. University, Airport, Game and Fish, etc.). The proportion of agencies was
calculated against the total sample size to determine how many agencies, by type, to be sampled.
Since there is only one State Patrol department in each state, a records request was automatically
sent to this agency. Table 2 lists the total sample for each state along with the total for each
agency type, calculated as a proportion. The calculations and the number of agencies, by type
can also be viewed in Table 2.
31
Table 2: Number of Agencies (by Type and State) Sampled
State Total
Agencies
(% of total)
[# Sampled]
Police
Departments
State
Departments
Sheriff’s
Department
Other
CT 143 (6.5%)
[27]
120 (84%)
[21]
1 (0.7%)
[1]
1* (0.7%)
[1]
22 (14%)
[4]
FL 387 (17.2%)
[71]
270 (70%)
[49]
1 (0.02%)
[1]
65 (17%)
[12]
51 (13%)
[9]
MA 357 (15.9%)
[65]
314 (88%)
[57]
1 (0.02%)
[1]
11 (3%)
[2]
31 (9%)
[5]
MT 119 (5.3%)
[22]
54 (45%)
[9]
1 (0.08%)
[1]
55 (46%)
[10]
9 (8%)
[2]
NH 208 (9.3%)
[38]
187 (90%)
[33]
1 (0.05%)
[1]
10 (5%)
[2]
10 (5%)
[2]
NV 76 (3.5%)
[14]
38 (50%)
[7]
1 (1%)
[1]
16 (21%)
[3]
21 (28%)
[3]
NY 514 (22.8%)
[93]
391 (76%)
[71]
1 (0.02%)
[1]
57 (11%)
[10]
65 (13%)
[11]
OR 174 (7.3%)
[30]
129 (74%)
[21]
1 (0.06%)
[1]
36 (21%)
[6]
8 (5%)
[2]
RI 48 (2.1%)
[9]
39 (81%)
[5]
1 (2%)
[1]
1* (2%)
[1]
8 (15%)
[2]
SD 155 (6.9%)
[28]
80 (52%)
[14]
1 (.064%)
[1]
66 (42%)
[11]
8 (5%)
[2]
VT 69 (3.2%)
[13]]
50 (72%)
[9]
1 (1.4%)
[1]
14 (20%)
[2]
4 (6%)
[1]
Totals 2250 (328 x
(1.25% =
410)
1672 (296)
11 (11) 330 (60) 237 (43)
(*) Denotes that the state has one overarching division representing all Sheriff’s departments that
is sampled.
Requests were written using templates from the National Freedom of Information
Coalition (NFIC 2015). The FOIA letters define the incident type and ask for complete records
for all incidents fitting the criteria. Each state has different laws governing the response
32
timeframe limit, which was cited within the body of the letter. Also, a waiver of fees was
requested for academic purposes that would benefit society without commercial application.
During the response period, a database was constructed using the received records. It was
expected that not all requests would be filled due to the provisions of various laws, extensive
fees, or extended time to complete the request. The database was designed to include the same 15
fields as FE. However, when agencies could not provide the entire record, a reduced request was
made asking for basic information (name of decedent, age, date of injury causing death, and
address). Monetary fees less than or equal to $20 were paid in order to receive records. In cases
where fees were extensive and could not be waived a request was rescinded. The new FOIA
database was then used to compare to the FE dataset, noting which records were in the new
FOIA database versus the FE dataset.
4.1.1.2 Comparison to competing datasets
The years 2013 and 2014 are considered complete by the FE administration. In order to test
completeness for these years, the FE dataset was also compared against two competing datasets:
KPD and GVA. The ARD program and the Deadspin dataset were not evaluated against FE.
Data for the ARD program could not be obtained in time, despite concerted effort by Michael
Planty from the BOJ. The Deadspin data was deemed impossible to compare due to extensive
missing attribute values and copious redundant entries. All of the relevant datasets had
differences in the attributes they reported but the name, state, and age fields were common,
enabling comparison. Association between datasets occurred manually by printing each dataset
and highlighting the entries that matched and counting those that did not. Completeness for the
years 2013 and 2014 was determined by reporting the percent of entries represented in each
competing dataset versus the FE dataset. Any records in KBP or GVA and not in FE were
33
researched to determine if they fell outside the scope of FE. Any missing incidents not in scope
were not counted against FE.
4.1.2 Attribute Accuracy, Completeness, and Consistency
Understanding the overall quality of sources used to populate the FE dataset is difficult. Linked
to each entry in the FE dataset is the main source from which information is mined. Because the
FE data does not have stored information detailing the source for each of the 15 fields, an
evaluation of the source linked to each entry was conducted. In order to assess the credibility of
media accounts, a sample of the FE dataset was used to verify the information contained in the
media account versus attribute content in the FE database. Using the CRS sample calculator,
with 95% confidence level and +/- 5% confidence interval, 364 entries needed to be verified
based on the 7,022 incidents in the FE database. After randomizing, the incidents were removed
from the FE dataset and each media link was examined to verify that the correct data had been
extracted and entered correctly. Any differences were tracked and reported. Unfortunately, it was
not possible to assess the quality of the information in media accounts because they were written
relative to what each journalist deemed was important to report. This also made it impossible to
validate the accuracy of reporting.
The completeness of the attributes within the FE database was assessed. The occurrence
of incomplete fields, or null values, was counted for each field. To check this, each field was
sorted and the number of null values was calculated as a percent against the number of populated
entries. Throughout the process, a logical check for the classification of each field was done. For
example, were the categories for cause of death clear-cut and without ambiguities? A field’s
ability to report information with a high degree of completeness, along with sound logic for the
content being reported, is a crucial component to understand before analysis can be undertaken.
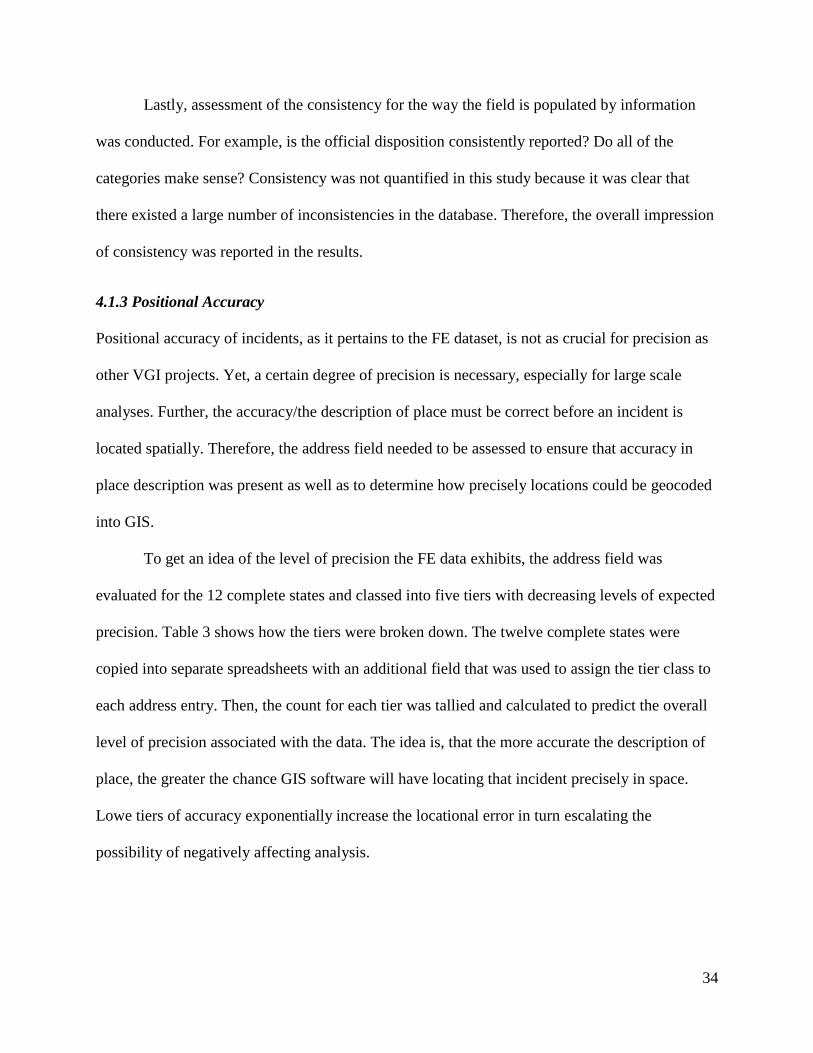
34
Lastly, assessment of the consistency for the way the field is populated by information
was conducted. For example, is the official disposition consistently reported? Do all of the
categories make sense? Consistency was not quantified in this study because it was clear that
there existed a large number of inconsistencies in the database. Therefore, the overall impression
of consistency was reported in the results.
4.1.3 Positional Accuracy
Positional accuracy of incidents, as it pertains to the FE dataset, is not as crucial for precision as
other VGI projects. Yet, a certain degree of precision is necessary, especially for large scale
analyses. Further, the accuracy/the description of place must be correct before an incident is
located spatially. Therefore, the address field needed to be assessed to ensure that accuracy in
place description was present as well as to determine how precisely locations could be geocoded
into GIS.
To get an idea of the level of precision the FE data exhibits, the address field was
evaluated for the 12 complete states and classed into five tiers with decreasing levels of expected
precision. Table 3 shows how the tiers were broken down. The twelve complete states were
copied into separate spreadsheets with an additional field that was used to assign the tier class to
each address entry. Then, the count for each tier was tallied and calculated to predict the overall
level of precision associated with the data. The idea is, that the more accurate the description of
place, the greater the chance GIS software will have locating that incident precisely in space.
Lowe tiers of accuracy exponentially increase the locational error in turn escalating the
possibility of negatively affecting analysis.
35
Table 3: Precision Classifications
Tier 1 Numbered Street or
Cross Streets
452 Aberdeen Rd
Aberdeen Rd and Crowley St
Tier 2 Hundreds Block 300 Block Aberdeen Rd
Tier 3 Road Name I-94 or Platte St
Tier 4 Place Name New York City Hall
Tier 5 Unknown N/A
Once it was known how precisely the address could be geocoded into ArcMap, it was
determined that New York state had a high number of incidents plus a high percentage of tier
one and tier two address entries. Because of these traits it was selected for curation and
subsequent analysis. Curating insufficient addresses required a number of creative strategies.
The strategies employed used an array of resources in an attempt to improve descriptive
precision for the 32 incidents not falling under tier one or tier two. First, in depth research
through search engines was done to explore alternative sources other than the source provided
from FE. For 14 of the cases the address was found within the body of a media account. This
information was then written as the new address and the record was upgraded to tier one. In eight
instances a place descriptor was given such as the name of a business, apartment complex, or an
on-ramp for a highway. For these cases, Google maps was used to ascertain the address. In
another case, a photo preceding an article depicted the house number where the incident
occurred. In three cases, the address was found within the records received from the FOIA
sample. Three more cases occurred on roads that were less than 300m in length or occurred in a
cul-de-sac. For these instances the address was ascertained by clicking a spot in the middle of the
road in Google Maps. Three remaining cases could not be curated and were omitted before
analysis.
36
As a result of the curation process, the overall precision of the address field for the state
of New York was improved spatially to an approximate error of 300m. This error could
potentially be large enough to affect some large scale analyses but was deemed acceptable for
the analysis in this thesis.
4.2 Hotspot Analysis
Preliminary hotspot analysis for this study was conducted in the New York City area which
included all five boroughs (Queens, Manhattan, Staten Island, Bronx, and Brooklyn). This area
was chosen because it had a high density and high number of incidents. Hotspot analysis is
sounder when there is a larger incident count (Esri 2015).
To ensure that distance was preserved during spatial calculations, each layer used in the
analysis was projected using the NAD 1983 StatePlane NY FIPS Meters. Next the FE data was
geocoded using the U.S. Geocoding service, requiring a match score of at least 80%. If any
entries were not matched with the requisite score, the entry was re-matched to the next closest
street address as long as it was within 50 points above or below the actual address being
geocoded. This decreased precision but stayed within the accepted 300m error band for an
incident.
Hotspot analysis cannot be calculated using point data. Instead it requires weighted or
count data. To accomplish this, a hexagonal polygon grid was built with a width of 1,200m, and
then clipped to the study area. The width was determined by two factors. First 1,200m is a
effective width for achieving a variable count of incidents within each polygon in the grid.
Greater count variation within the polygons increases the statistical robustness of the hotspot
analysis. Secondly, a study from the department of planning from the city of New York created a
boundaries shapefile, known as neighborhood tabulation areas (NTAs), was created by the city’s
37
GIS department to project demographics in small areas. They state that their new geographic
areas offer a good compromise between the overly detailed data for census tracts and the broad
strokes provided by community districts (NYC Planning 2014). These units have value because
they enable the city to look at data at the neighborhood level. The logic used above also made
sense for this study because the average area of these units was approximately equivalent to the
width of polygons in the grid created in order to achieve an acceptable variance count of
incidents per unit.
Often hotspot analysis is conducted using a square polygons grid. In contrast, there seem
to be strong qualitative advantages from using hexagonal polygons. Birch (2007) points out that
hexagonal grids have a simpler and more symmetric nearest neighbor, are better for measuring
connectivity between neighbors, outperform for dispersal modelling, adhere more naturally to
the shape of the earth, and provide greater clarity for visualization. For these reasons the
hexagonal grid was chosen as the geometry unit to be used for the hotspot analysis.
The hexagonal grid was created by downloading a script that would create the hexes,
obtained from a link on the Esri (2013) blog. Once the grid was created and clipped to the New
York City area, the geocoded FE incident points were spatially joined to the hexagons to create a
field with the count for the number of incidents within each hexagon.
It was determined that two hotspot analyses would be conducted. The first would be with
the raw incident count and the other would be normalized by total populaton. Using a weighted
overlay technique in ArcMap, T.I.G.E.R. census tract demographic data polygons were used as
input data to reaggregate race counts into the newly created hexagons. The tabulate intersection
tool calculated the ratio of the census block polygon within each hexagon, then assigned a
percentage of the population based on the containment ratio. The output was a table that was
38
then joined to the the hexagon layer with the incident count. Lastly, a field was created for the
normalization calculation which was a division of total population and incident count per
hexagon.
The hotspot analysis calculation requires the specification of the distance band. This
specifies a cutoff distance for what is considered a neighbor. Anything outside the distance
neighborhood has no influence on the calculation. The distance was decided from the peak z-
score taken from the incremental spatial autocorrelation tool. This tool calcalutes the level of
influence features have upon one another and plots the results on a graph. The peak z-score
indicates the distance with the most interaction between neighbors. Using this strategy, this study
decided on the fixed distance of 6,500m.
After the hotspot analysis was run, two additional maps were produced for comparison.
The first map was simply a population density map of New York City. The second map was a
dot density map of the four predominant races in the study area. They were White, Black, Asian,
and Hispanic. These maps were preliminarily examined without asserting any conclusion except
that these types of analyses can be done with FE data when and where it is sound.

39
CHAPTER 5: RESULTS
This chapter reports the results from testing the various quality assurance components against the
FE dataset. Of the various data quality tests, for hotspot analysis, the most important components
are spatial accuracy and completeness. Numerous other aspects of the dataset were evaluated
with some found to be lacking for analysis. Another number of attributes were short on
consistency and quality. The problems with these attributes limit other analyses that might be
contemplated but does not affect the hotspot analysis in this study.
The findings of these tests are the focus of this chapter which is divided into four
sections. Section 5.1 concerns FE’s lineage and attribute accuracy. Section 5.2 addresses
completeness. Section 5.3 details the spatial accuracy. Lastly, section 5.4 illustrates the result of
the hotspot analysis.
5.1 Lineage and Attribute Accuracy
Each of the 15 fields in the FE database was examined in two ways. First, how many entries per
field have null values? Second, how well does the FE database adhere to specified class
parameters? The address field is excluded here because it was evaluated in the previous section.
It was found that there were some fields that were very complete and consistent while others
were deemed inadequate.
5.1.1 Name
The name field consists of at least the first and last name of the decedent. In some cases the
middle name is provided or the nickname is given in quotations between the first and last name.
Of the 7,022 incidents contained within the FE database there occur 87 instances where the name
is not complete. In these cases, the entry lists that the “name is withheld by police.” Thus, the FE

40
database provides the name of the decedent 98.8% of the time. This indicates that one of the
most reported facts in sources is the name.
5.1.2. Age
The age field simply lists the number of years the decedent had lived until death. The field is not
as precise as using the actual date of birth despite the actual date of birth being reported
regularly. Table 4 depicts the evaluation of the field. Only the exact age was considered
complete in the calculation with any variation considered incomplete. The age field should be
considered fit for analysis.
Table 4: Age Coverage
Exact age 6,916
Age range < 10 years 8
Age range < 5 years 4
Unknown 94
% where age is known 98.5%
5.1.3 Gender
The gender field can be entered as male or female. Table 5 shows the number of entries for both
along with the number of incidents where gender was unknown. This field is very accurate and
could be used for gender-based analysis.
Table 5: Gender Distribution and Coverage
Male 6,481
Female 537
Unknown 4
% where gender is known 99.9%
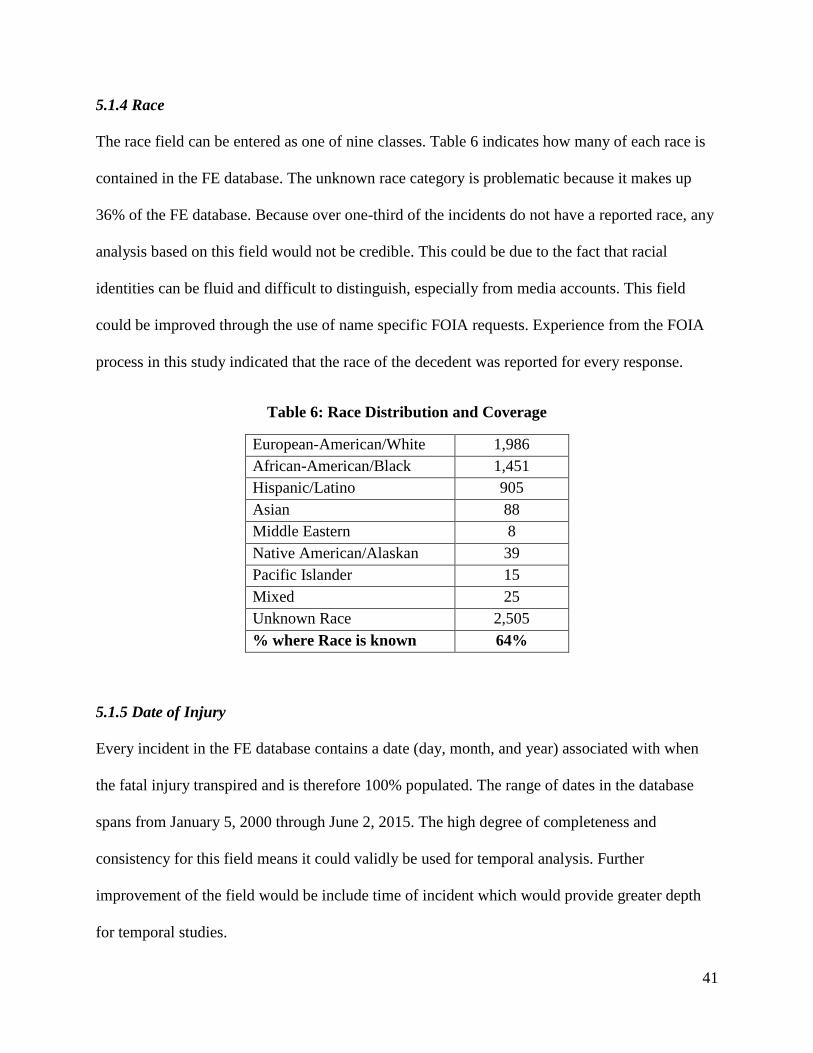
41
5.1.4 Race
The race field can be entered as one of nine classes. Table 6 indicates how many of each race is
contained in the FE database. The unknown race category is problematic because it makes up
36% of the FE database. Because over one-third of the incidents do not have a reported race, any
analysis based on this field would not be credible. This could be due to the fact that racial
identities can be fluid and difficult to distinguish, especially from media accounts. This field
could be improved through the use of name specific FOIA requests. Experience from the FOIA
process in this study indicated that the race of the decedent was reported for every response.
Table 6: Race Distribution and Coverage
European-American/White 1,986
African-American/Black 1,451
Hispanic/Latino 905
Asian 88
Middle Eastern 8
Native American/Alaskan 39
Pacific Islander 15
Mixed 25
Unknown Race 2,505
% where Race is known 64%
5.1.5 Date of Injury
Every incident in the FE database contains a date (day, month, and year) associated with when
the fatal injury transpired and is therefore 100% populated. The range of dates in the database
spans from January 5, 2000 through June 2, 2015. The high degree of completeness and
consistency for this field means it could validly be used for temporal analysis. Further
improvement of the field would be include time of incident which would provide greater depth
for temporal studies.
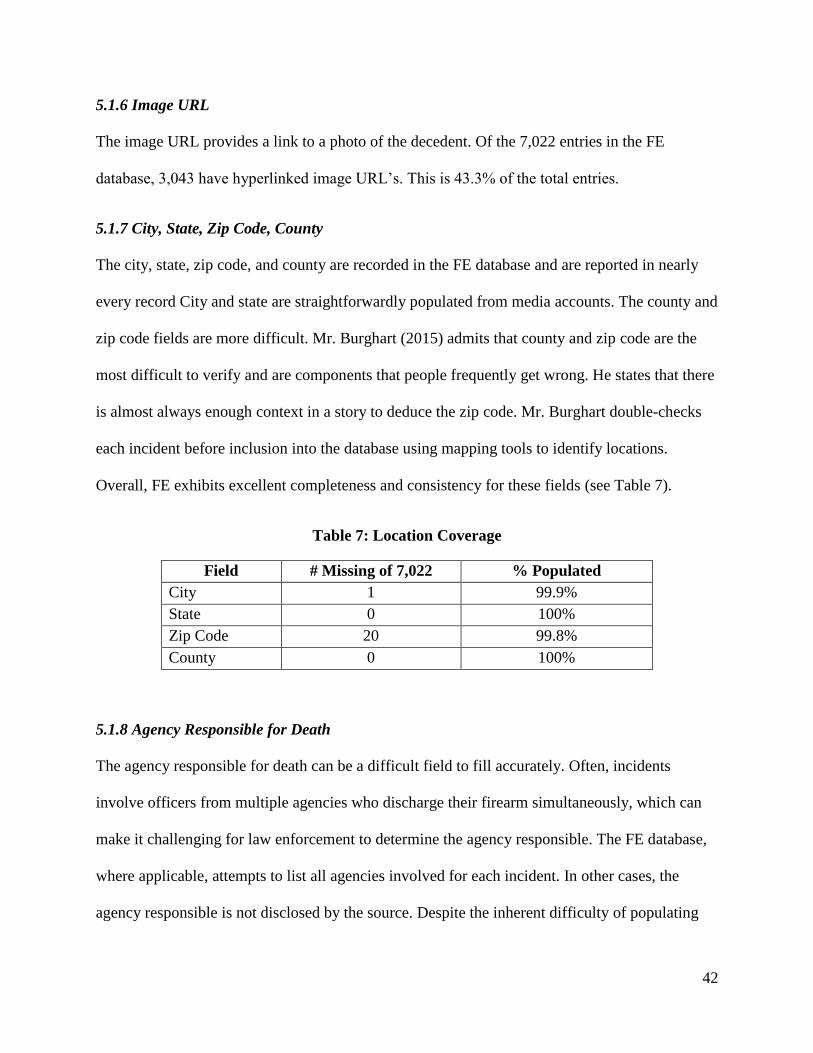
42
5.1.6 Image URL
The image URL provides a link to a photo of the decedent. Of the 7,022 entries in the FE
database, 3,043 have hyperlinked image URL’s. This is 43.3% of the total entries.
5.1.7 City, State, Zip Code, County
The city, state, zip code, and county are recorded in the FE database and are reported in nearly
every record City and state are straightforwardly populated from media accounts. The county and
zip code fields are more difficult. Mr. Burghart (2015) admits that county and zip code are the
most difficult to verify and are components that people frequently get wrong. He states that there
is almost always enough context in a story to deduce the zip code. Mr. Burghart double-checks
each incident before inclusion into the database using mapping tools to identify locations.
Overall, FE exhibits excellent completeness and consistency for these fields (see Table 7).
Table 7: Location Coverage
Field # Missing of 7,022 % Populated
City 1 99.9%
State 0 100%
Zip Code 20 99.8%
County 0 100%
5.1.8 Agency Responsible for Death
The agency responsible for death can be a difficult field to fill accurately. Often, incidents
involve officers from multiple agencies who discharge their firearm simultaneously, which can
make it challenging for law enforcement to determine the agency responsible. The FE database,
where applicable, attempts to list all agencies involved for each incident. In other cases, the
agency responsible is not disclosed by the source. Despite the inherent difficulty of populating

43
this field, the FE database manages to list involved agencies for a majority of the incidents. 233
of the 7,022 entries do not list an involved agency which calculates as 96.7% coverage. This
field should be considered fit for analysis.
5.1.9 Cause of Death
The FE database allows 12 different categorizations for cause of death (gunshot, vehicle, taser,
bludgeon with instrument, beaten, medical emergency, asphyxiation, domestic violence, stabbed,
drug overdose, beanbag rounds, and other). The “other” category is necessary because often
interpreting the cause of death can be ambiguous. This problem is apparent in the database where
numerous entries list multiple causes of death. Further examination of individual incident
descriptions showed that even when only one cause of death was listed, there could have been
others selected as well.
Only 15 incidents have an undetermined cause of death which calculates as a 99.8%
population rate. The database lists gunshot as the cause of death for 5,818 of the 7,022 incidents
which is 82.9% of the total. However, this field should not be considered sound because of the
difficulty of determining cause of death. This field needs exact definition for cause of death,
better categorization of incidents, and curation of the incidents already in the database before any
analysis.
5.1.10 Symptoms of Mental Illness
The mental illness field is populated and determined by whether the officer(s) should have
known at the time of contact if the decedent was mentally ill or altered by drugs or alcohol.
Table 8 shows how many of the incidents fall into each category.
Mental illness is another field that requires interpretation from the submitter. There are
cases where a healthy or mentally ill person could be on drugs or alcohol which makes it difficult
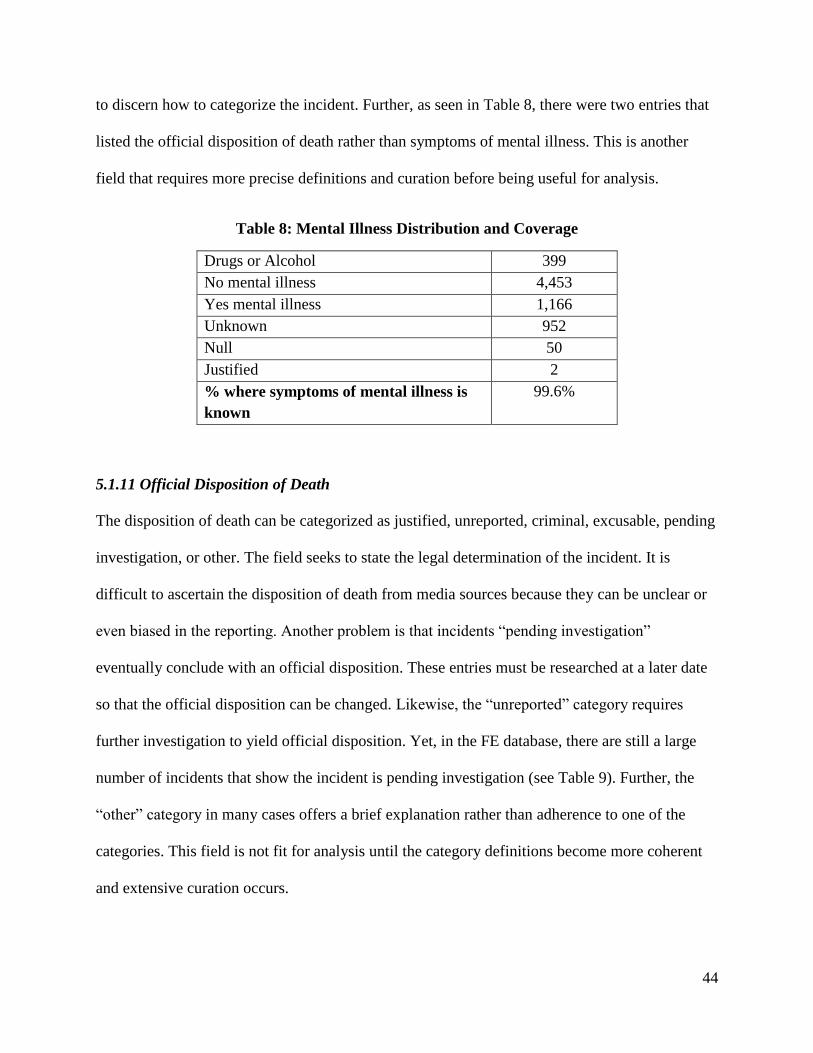
44
to discern how to categorize the incident. Further, as seen in Table 8, there were two entries that
listed the official disposition of death rather than symptoms of mental illness. This is another
field that requires more precise definitions and curation before being useful for analysis.
Table 8: Mental Illness Distribution and Coverage
Drugs or Alcohol 399
No mental illness 4,453
Yes mental illness 1,166
Unknown 952
Null 50
Justified 2
% where symptoms of mental illness is
known
99.6%
5.1.11 Official Disposition of Death
The disposition of death can be categorized as justified, unreported, criminal, excusable, pending
investigation, or other. The field seeks to state the legal determination of the incident. It is
difficult to ascertain the disposition of death from media sources because they can be unclear or
even biased in the reporting. Another problem is that incidents “pending investigation”
eventually conclude with an official disposition. These entries must be researched at a later date
so that the official disposition can be changed. Likewise, the “unreported” category requires
further investigation to yield official disposition. Yet, in the FE database, there are still a large
number of incidents that show the incident is pending investigation (see Table 9). Further, the
“other” category in many cases offers a brief explanation rather than adherence to one of the
categories. This field is not fit for analysis until the category definitions become more coherent
and extensive curation occurs.
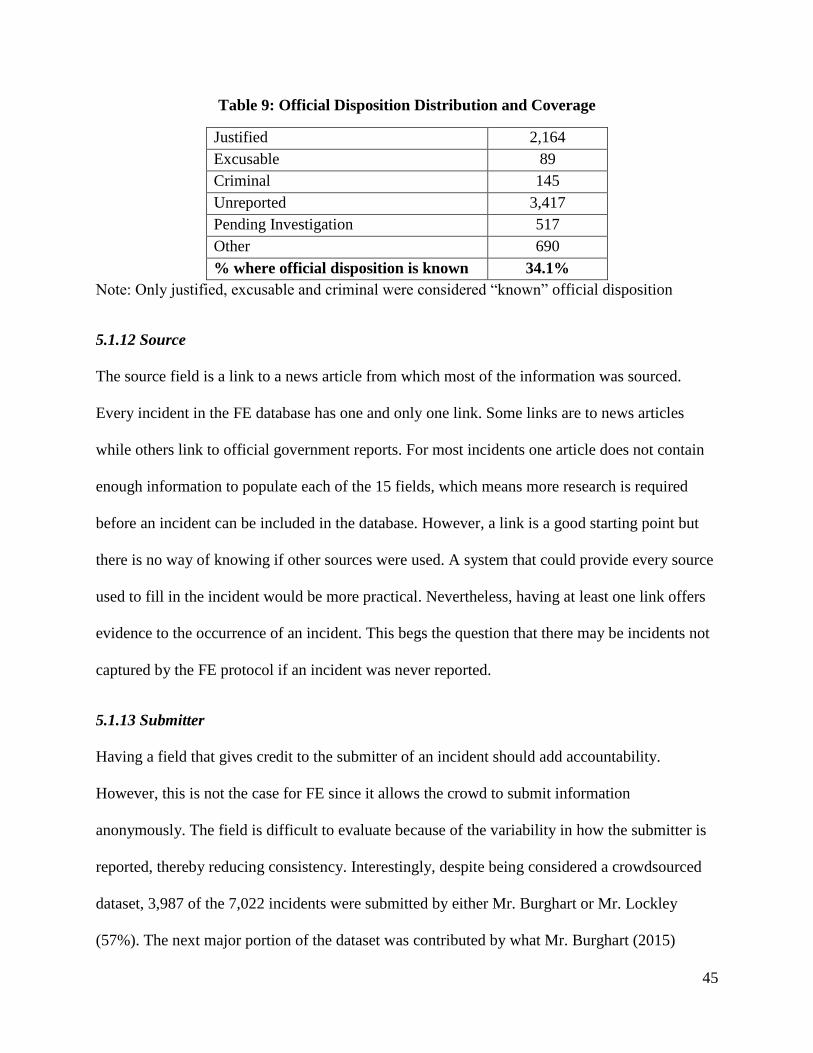
45
Table 9: Official Disposition Distribution and Coverage
Justified 2,164
Excusable 89
Criminal 145
Unreported 3,417
Pending Investigation 517
Other 690
% where official disposition is known 34.1%
Note: Only justified, excusable and criminal were considered “known” official disposition
5.1.12 Source
The source field is a link to a news article from which most of the information was sourced.
Every incident in the FE database has one and only one link. Some links are to news articles
while others link to official government reports. For most incidents one article does not contain
enough information to populate each of the 15 fields, which means more research is required
before an incident can be included in the database. However, a link is a good starting point but
there is no way of knowing if other sources were used. A system that could provide every source
used to fill in the incident would be more practical. Nevertheless, having at least one link offers
evidence to the occurrence of an incident. This begs the question that there may be incidents not
captured by the FE protocol if an incident was never reported.
5.1.13 Submitter
Having a field that gives credit to the submitter of an incident should add accountability.
However, this is not the case for FE since it allows the crowd to submit information
anonymously. The field is difficult to evaluate because of the variability in how the submitter is
reported, thereby reducing consistency. Interestingly, despite being considered a crowdsourced
dataset, 3,987 of the 7,022 incidents were submitted by either Mr. Burghart or Mr. Lockley
(57%). The next major portion of the dataset was contributed by what Mr. Burghart (2015)
46
described as regular contributors with at least 50 entries each. A total of 12 users have
contributed an additional 2,725 (39%) of the entries. The remainder of entries has been added by
approximately 234 different members of the crowd, sometimes working jointly. Therefore, the
majority of the FE dataset has been built by individuals who supplement the dataset on a regular
basis.
Overall, the submitter field is inconsistent making it difficult to track who the contributor
was. Over half of the entries cite more than one submitter further confusing things. This field
needs more precise definitions in how the submitter is documented. It could be argued that this
field is somewhat arbitrary since every incident is cross-checked by Burghart meaning that any
errors in the database emanate directly from administration.
5.1.14 Source Validation
A random sample of 364 entries from the FE dataset was generated to test for source validation,
giving a 95%, +/- 5% (n=364) confidence. For each of these entries the source link was followed
and the information contained in the link was compared to the attributes for each entry. The
source link for each incident contains varying degrees of information. However, after comparing
the information in FE to the source for the incidents in the sample, the results were that the
information was input successfully in 100% of the incidents evaluated. Thus, it can be deduced
that the processes for mining sources is effective.
5.1.15 Redundant Entries
The result of combing the FE database for redundant entries yielded 44 instances where the same
incident was recorded. These entries were recorded and sent to the FE administration where they
were confirmed and edited. One potential reason for these redundant entries is that the lack of
consistency in the database as a whole makes it more difficult to pick out redundant entries. For
47
example, the decedent’s name was often misspelled in one entry. However, as a result of this
task the FE database no longer has any redundant entries.
5.2 Completeness
As described in Chapter 4, comparisons with several alternative datasets were carried out to
analyze how completely the FE dataset captures incidents where interaction with law
enforcement results in death. The result for each of these comparisons is reported separately and
then combined to summarize overall completeness. Overall, the FE dataset exhibited a high level
of completeness. It outperformed comparisons to competing datasets and was found to have only
about 1-2% of missing observations from the FOIA process. As detailed below, the coverage for
a few particular states may be somewhat less complete and was also difficult to verify.
Every incident found to be missing from FE was forwarded to FE administration to verify that
the records do in fact belong in the dataset. Once missing incidents were confirmed they were
added to the database.
5.2.1 Freedom of Information Requests
The FOIA sampling process was challenging to execute, especially in a 3-month study period.
However, of the 410 agencies sampled, enough responses were obtained to achieve the number
necessary for the desired confidence interval 95%, +/- 5% (n=328). Yet, the original plan to
obtain all records within the scope of FE was not achievable. Obstacles preventing this were
numerous. Some agencies asked for fees in the thousands of dollars, others did not have
databases that allowed a search for the type of encounters being requested. Other than Montana,
New Hampshire, and South Dakota, there did not seem to be a discernible pattern showing why a
request was filled or not. The three states mentioned above often cited specific state laws
explaining why a request could not be filled. In other instances, agencies were willing to fulfill
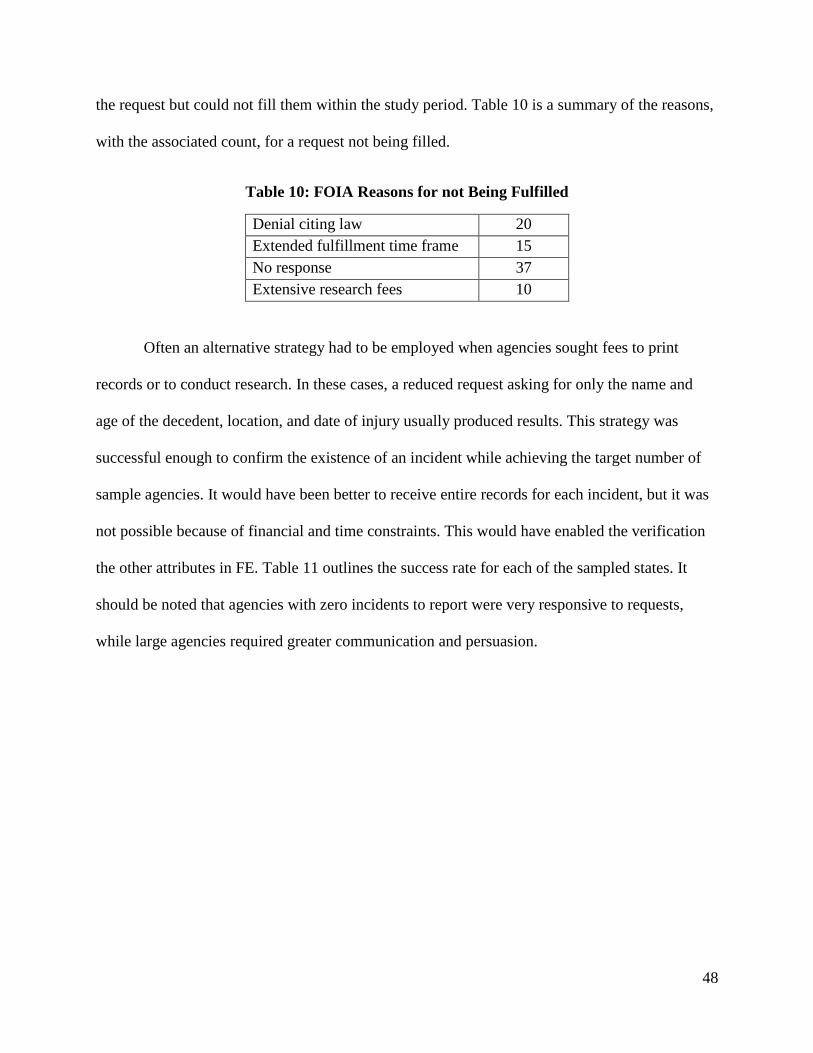
48
the request but could not fill them within the study period. Table 10 is a summary of the reasons,
with the associated count, for a request not being filled.
Table 10: FOIA Reasons for not Being Fulfilled
Denial citing law 20
Extended fulfillment time frame 15
No response 37
Extensive research fees 10
Often an alternative strategy had to be employed when agencies sought fees to print
records or to conduct research. In these cases, a reduced request asking for only the name and
age of the decedent, location, and date of injury usually produced results. This strategy was
successful enough to confirm the existence of an incident while achieving the target number of
sample agencies. It would have been better to receive entire records for each incident, but it was
not possible because of financial and time constraints. This would have enabled the verification
the other attributes in FE. Table 11 outlines the success rate for each of the sampled states. It
should be noted that agencies with zero incidents to report were very responsive to requests,
while large agencies required greater communication and persuasion.
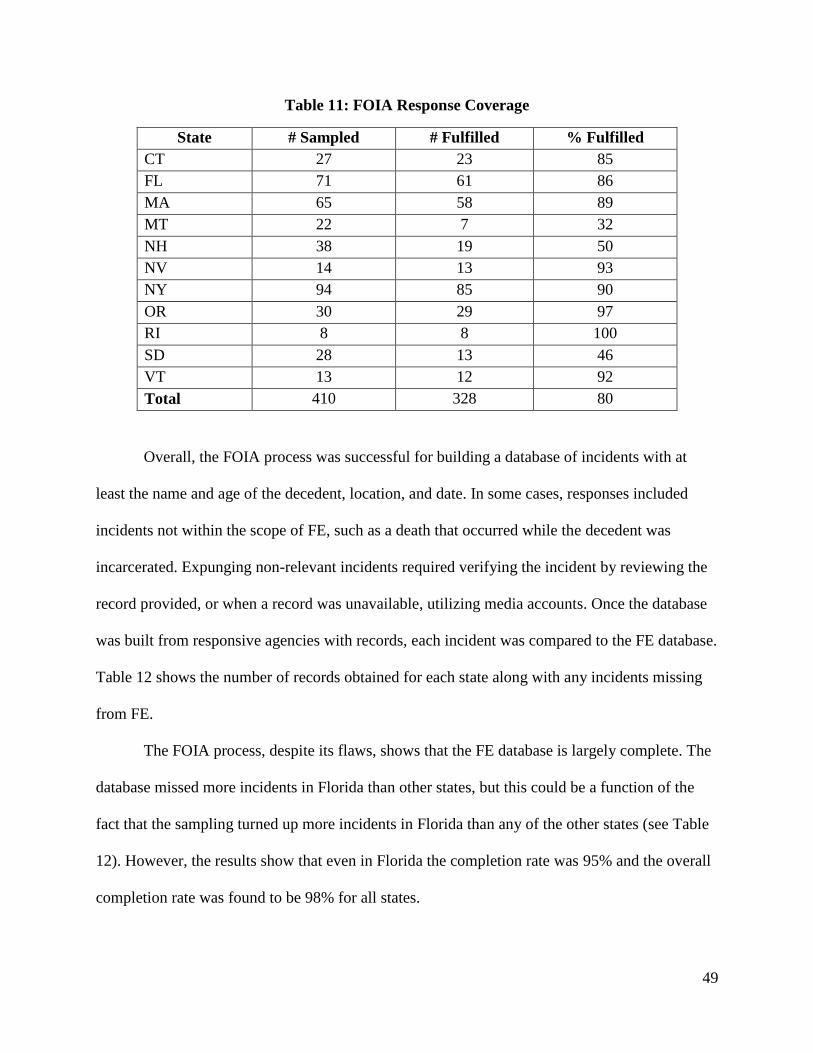
49
Table 11: FOIA Response Coverage
State # Sampled # Fulfilled % Fulfilled
CT 27 23 85
FL 71 61 86
MA 65 58 89
MT 22 7 32
NH 38 19 50
NV 14 13 93
NY 94 85 90
OR 30 29 97
RI 8 8 100
SD 28 13 46
VT 13 12 92
Total 410 328 80
Overall, the FOIA process was successful for building a database of incidents with at
least the name and age of the decedent, location, and date. In some cases, responses included
incidents not within the scope of FE, such as a death that occurred while the decedent was
incarcerated. Expunging non-relevant incidents required verifying the incident by reviewing the
record provided, or when a record was unavailable, utilizing media accounts. Once the database
was built from responsive agencies with records, each incident was compared to the FE database.
Table 12 shows the number of records obtained for each state along with any incidents missing
from FE.
The FOIA process, despite its flaws, shows that the FE database is largely complete. The
database missed more incidents in Florida than other states, but this could be a function of the
fact that the sampling turned up more incidents in Florida than any of the other states (see Table
12). However, the results show that even in Florida the completion rate was 95% and the overall
completion rate was found to be 98% for all states.
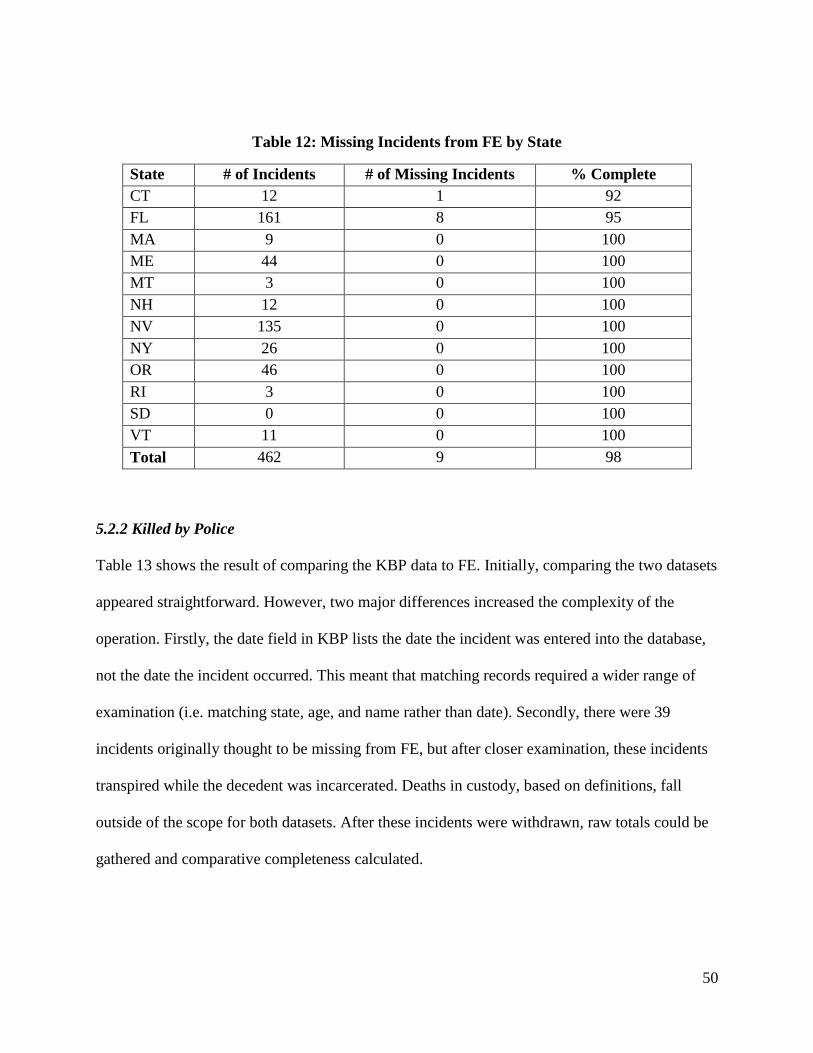
50
Table 12: Missing Incidents from FE by State
State # of Incidents # of Missing Incidents % Complete
CT 12 1 92
FL 161 8 95
MA 9 0 100
ME 44 0 100
MT 3 0 100
NH 12 0 100
NV 135 0 100
NY 26 0 100
OR 46 0 100
RI 3 0 100
SD 0 0 100
VT 11 0 100
Total 462 9 98
5.2.2 Killed by Police
Table 13 shows the result of comparing the KBP data to FE. Initially, comparing the two datasets
appeared straightforward. However, two major differences increased the complexity of the
operation. Firstly, the date field in KBP lists the date the incident was entered into the database,
not the date the incident occurred. This meant that matching records required a wider range of
examination (i.e. matching state, age, and name rather than date). Secondly, there were 39
incidents originally thought to be missing from FE, but after closer examination, these incidents
transpired while the decedent was incarcerated. Deaths in custody, based on definitions, fall
outside of the scope for both datasets. After these incidents were withdrawn, raw totals could be
gathered and comparative completeness calculated.
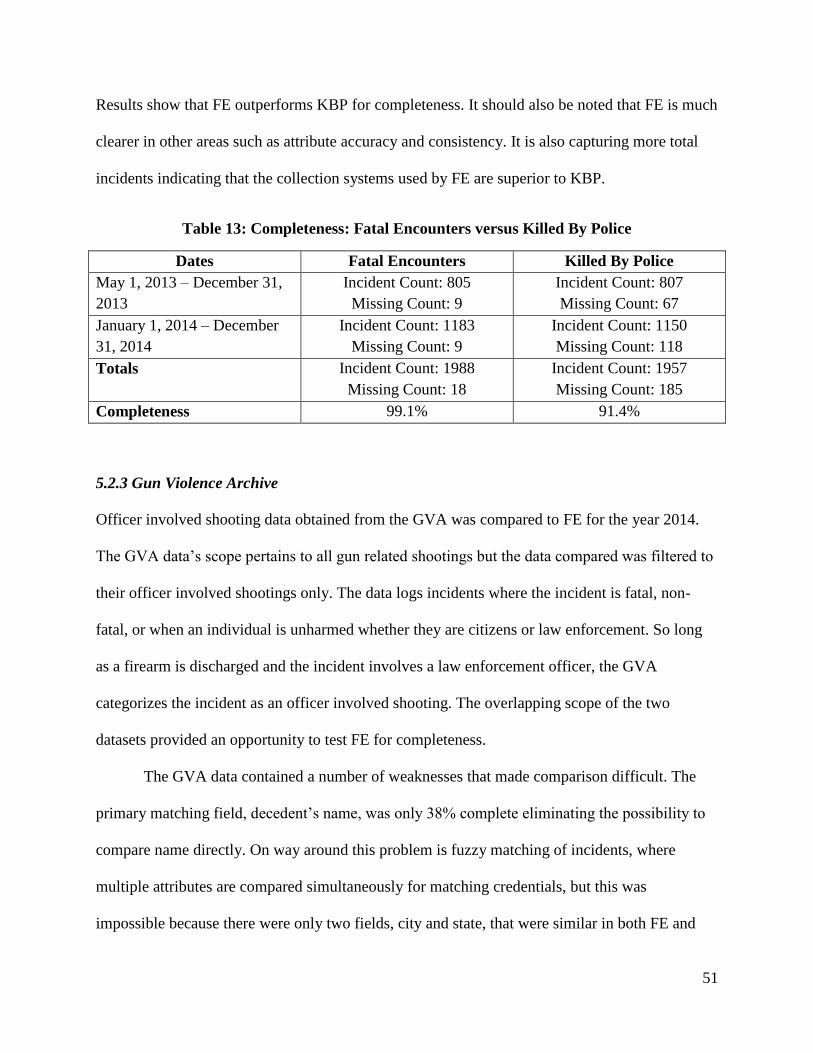
51
Results show that FE outperforms KBP for completeness. It should also be noted that FE is much
clearer in other areas such as attribute accuracy and consistency. It is also capturing more total
incidents indicating that the collection systems used by FE are superior to KBP.
Table 13: Completeness: Fatal Encounters versus Killed By Police
Dates Fatal Encounters Killed By Police
May 1, 2013 – December 31,
2013
Incident Count: 805
Missing Count: 9
Incident Count: 807
Missing Count: 67
January 1, 2014 – December
31, 2014
Incident Count: 1183
Missing Count: 9
Incident Count: 1150
Missing Count: 118
Totals Incident Count: 1988
Missing Count: 18
Incident Count: 1957
Missing Count: 185
Completeness 99.1% 91.4%
5.2.3 Gun Violence Archive
Officer involved shooting data obtained from the GVA was compared to FE for the year 2014.
The GVA data’s scope pertains to all gun related shootings but the data compared was filtered to
their officer involved shootings only. The data logs incidents where the incident is fatal, non-
fatal, or when an individual is unharmed whether they are citizens or law enforcement. So long
as a firearm is discharged and the incident involves a law enforcement officer, the GVA
categorizes the incident as an officer involved shooting. The overlapping scope of the two
datasets provided an opportunity to test FE for completeness.
The GVA data contained a number of weaknesses that made comparison difficult. The
primary matching field, decedent’s name, was only 38% complete eliminating the possibility to
compare name directly. On way around this problem is fuzzy matching of incidents, where
multiple attributes are compared simultaneously for matching credentials, but this was
impossible because there were only two fields, city and state, that were similar in both FE and
52
GVA. Further reducing the count of comparative incidents was the fact that the 821 incidents
with a name, 112 were redundant. Once attribute inconsistencies, and out of scope incidents were
removed, 709 entries were checked against FE. Of those, four incidents were not in FE and can
be counted as missing from the database. The completeness calculation showed that FE was
99.4% complete when compared to GVA.
5.2.4 Arrest Related Deaths Program and Deadspin Dataset
The arrest ARD program data had not yet been obtained at the time of writing despite consistent,
helpful, and informative assistance from Mr. Michael Planty of the Bureau of Justice Statistics
(BOJS). According to the BOJS they are in the process of redacting the names of decedents in
adherence to the law. Future comparison and reporting of the ARD data is recommended once
the data is released.
The Deadspin dataset was not compared to FE because of the gross number of errors in
the data. Errors spanned from redundant entries to high levels of attribute accuracy and
completion. In short, the Deadspin data was not fit for comparison.
5.3 Spatial Accuracy and Precision
The classification of incidents for the complete states into their respective tiers showed that 88%
of the incidents were tier one or two (see Table 14). These two tiers could be geocoded into a
GIS with a relatively high degree of precision or within 100m of the description of that location
(Goldberg 2008). The other three tiers made up 12% of the incidents where geocoding precision
is questionable. These incidents could possibly have an associated error of many kilometers or
may not be able to be geocoded at all. For these incidents geocoding the zip code or curation
would be the only alternatives that could improve the precision of lower tiers. Thus, the
reduction of 12% of the incidents, due to unacceptable spatial imprecision, is significant.
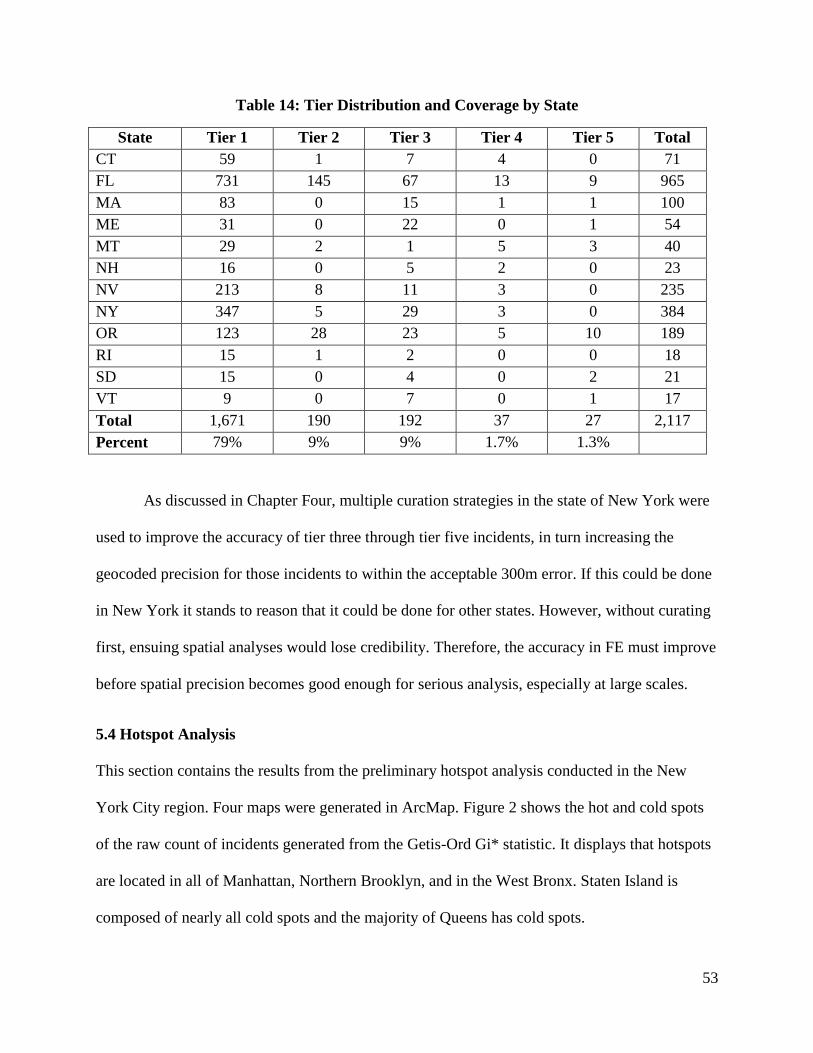
53
Table 14: Tier Distribution and Coverage by State
State Tier 1 Tier 2 Tier 3 Tier 4 Tier 5 Total
CT 59 1 7 4 0 71
FL 731 145 67 13 9 965
MA 83 0 15 1 1 100
ME 31 0 22 0 1 54
MT 29 2 1 5 3 40
NH 16 0 5 2 0 23
NV 213 8 11 3 0 235
NY 347 5 29 3 0 384
OR 123 28 23 5 10 189
RI 15 1 2 0 0 18
SD 15 0 4 0 2 21
VT 9 0 7 0 1 17
Total 1,671 190 192 37 27 2,117
Percent 79% 9% 9% 1.7% 1.3%
As discussed in Chapter Four, multiple curation strategies in the state of New York were
used to improve the accuracy of tier three through tier five incidents, in turn increasing the
geocoded precision for those incidents to within the acceptable 300m error. If this could be done
in New York it stands to reason that it could be done for other states. However, without curating
first, ensuing spatial analyses would lose credibility. Therefore, the accuracy in FE must improve
before spatial precision becomes good enough for serious analysis, especially at large scales.
5.4 Hotspot Analysis
This section contains the results from the preliminary hotspot analysis conducted in the New
York City region. Four maps were generated in ArcMap. Figure 2 shows the hot and cold spots
of the raw count of incidents generated from the Getis-Ord Gi* statistic. It displays that hotspots
are located in all of Manhattan, Northern Brooklyn, and in the West Bronx. Staten Island is
composed of nearly all cold spots and the majority of Queens has cold spots.

54
The distribution of the hot and cold spots can be explained by the fact that Getis-Ord Gi*
is an inferential statistic, meaning that the result of its calculation is interpreted within the
context of the null hypothesis. The null hypothesis supposes that incidents are distributed
randomly across the study area. So, if the statistic rejects the null hypothesis then the output
denotes where the spatial clustering of incidents occurs. The calculation yields a z-score,
measured by the standard deviation from the mean, where high values indicate stronger
clustering intensity, low values indicate negative clustering intensity, and near zero values
indicate no apparent spatial clustering.
The final z-score computed for each hexagon in the study area is the result of taking into
account the incident count for every hexagon within the specified distance. These hexagons are
considered neighbors while every other hexagon farther than the specified distance is omitted
from the calculation. Thus, hexagons without any incidents can still receive a high z-score
because their neighbors contain a significant number of incidents. This is also the case for cold
spots where a hexagon and its neighbors have a significant absence of incidents so as to produce
a negative z-score.
Getis-Ord Gi* is a local statistic useful for finding variance across a study area. Global
statistics measure the pattern of the entire study area and does not indicate where specific
patterns occur, whereas local statistics identify variation across the study area, focusing on
individual features and their relationships to nearby features (Chainey 2014). Figure 2 is the
representation of incidents that are unusual in a statistical sense and are not the result of complete
spatial randomness. The legend’s thematic descriptions were derived from the resulting z-score
where the hot and cold spots have the highest and lowest values and are depicted by the relative
intensity of clustering. The not significant category show areas were the z-score was near zero.
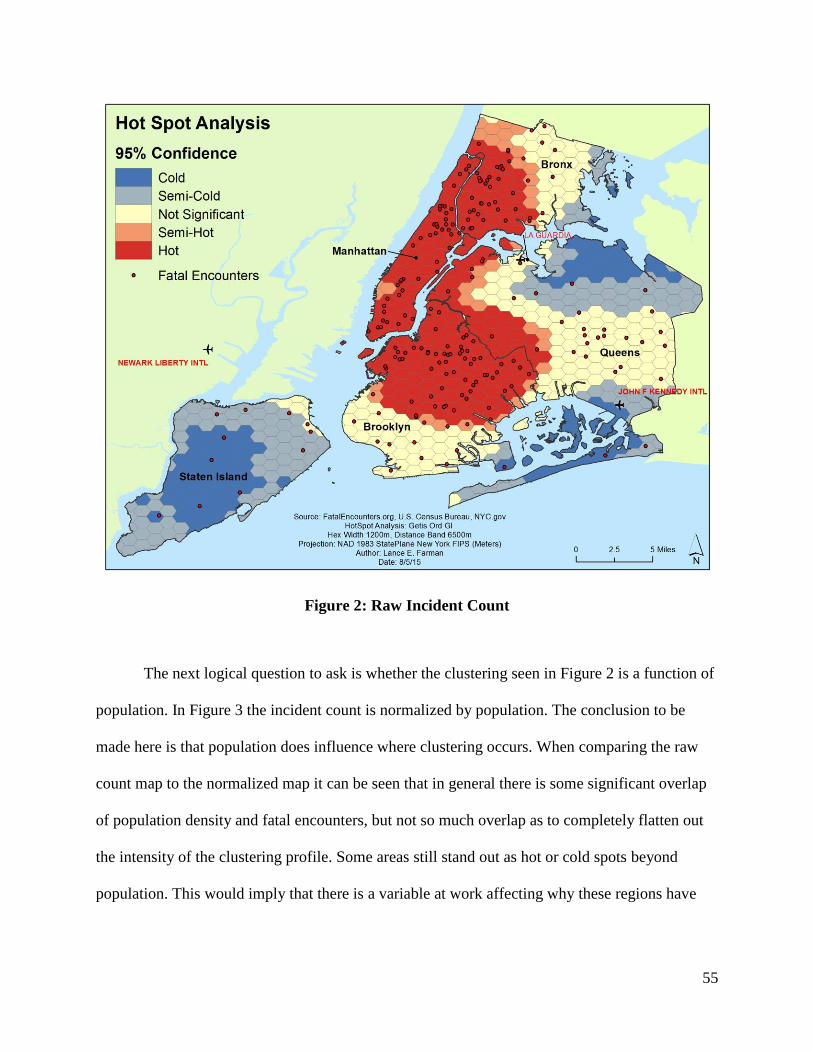
55
Figure 2: Raw Incident Count
The next logical question to ask is whether the clustering seen in Figure 2 is a function of
population. In Figure 3 the incident count is normalized by population. The conclusion to be
made here is that population does influence where clustering occurs. When comparing the raw
count map to the normalized map it can be seen that in general there is some significant overlap
of population density and fatal encounters, but not so much overlap as to completely flatten out
the intensity of the clustering profile. Some areas still stand out as hot or cold spots beyond
population. This would imply that there is a variable at work affecting why these regions have
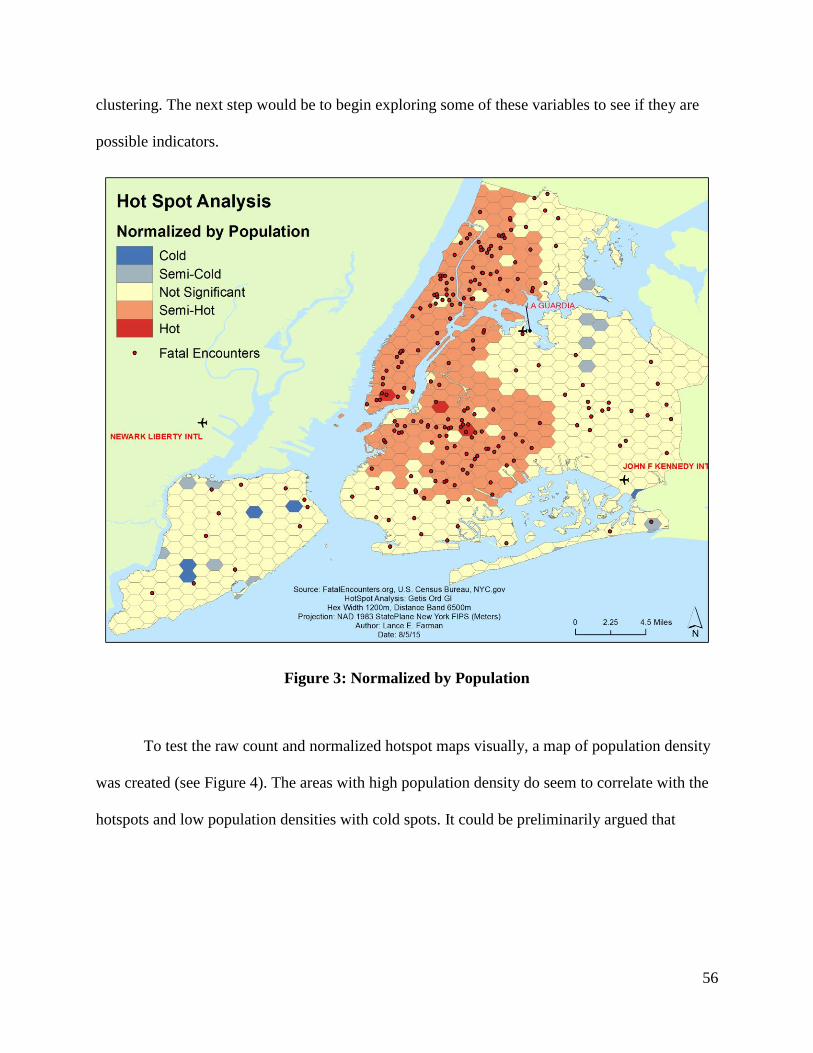
56
clustering. The next step would be to begin exploring some of these variables to see if they are
possible indicators.
Figure 3: Normalized by Population
To test the raw count and normalized hotspot maps visually, a map of population density
was created (see Figure 4). The areas with high population density do seem to correlate with the
hotspots and low population densities with cold spots. It could be preliminarily argued that
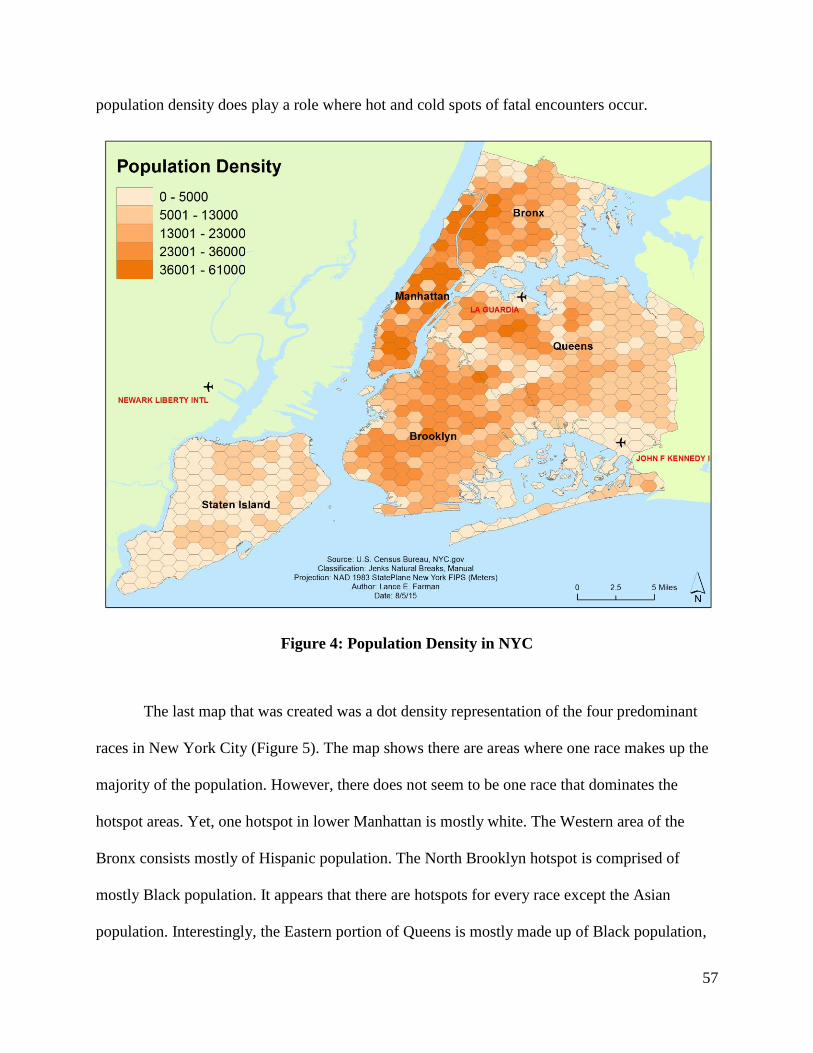
57
population density does play a role where hot and cold spots of fatal encounters occur.
Figure 4: Population Density in NYC
The last map that was created was a dot density representation of the four predominant
races in New York City (Figure 5). The map shows there are areas where one race makes up the
majority of the population. However, there does not seem to be one race that dominates the
hotspot areas. Yet, one hotspot in lower Manhattan is mostly white. The Western area of the
Bronx consists mostly of Hispanic population. The North Brooklyn hotspot is comprised of
mostly Black population. It appears that there are hotspots for every race except the Asian
population. Interestingly, the Eastern portion of Queens is mostly made up of Black population,
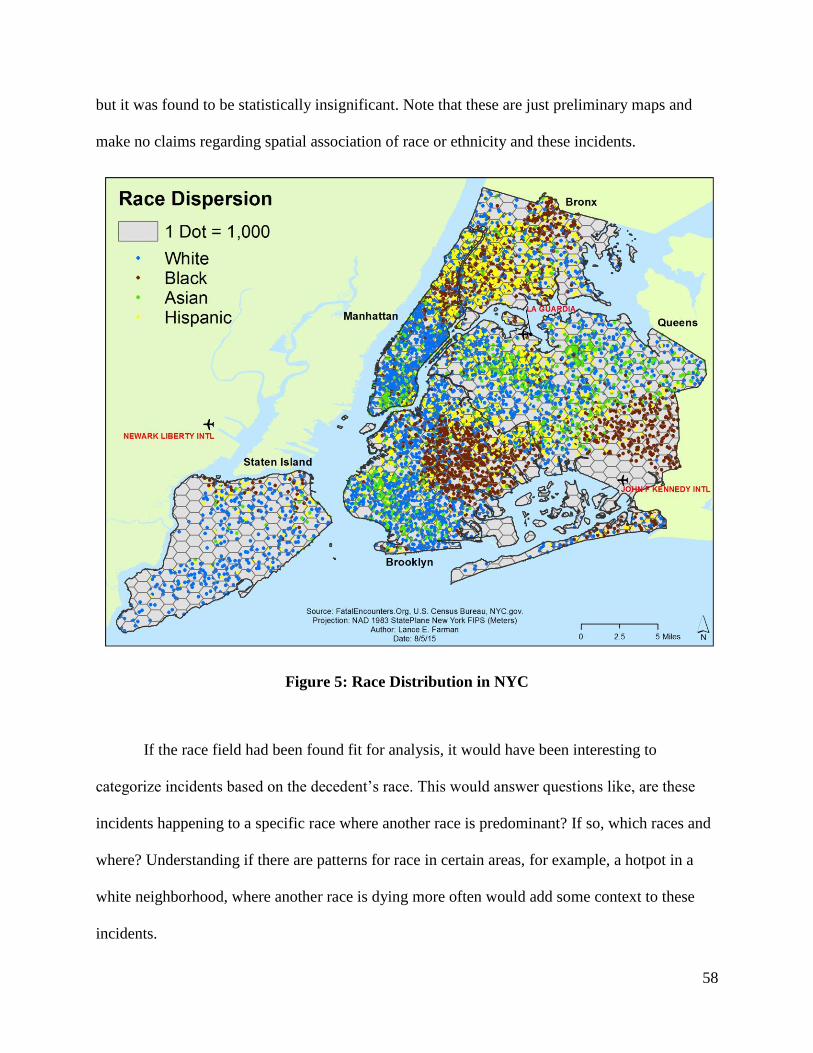
58
but it was found to be statistically insignificant. Note that these are just preliminary maps and
make no claims regarding spatial association of race or ethnicity and these incidents.
Figure 5: Race Distribution in NYC
If the race field had been found fit for analysis, it would have been interesting to
categorize incidents based on the decedent’s race. This would answer questions like, are these
incidents happening to a specific race where another race is predominant? If so, which races and
where? Understanding if there are patterns for race in certain areas, for example, a hotpot in a
white neighborhood, where another race is dying more often would add some context to these
incidents.
59
CHAPTER 6: DISCUSSION
This study endeavored to build a customized framework for validating the FE dataset. The
custom framework relied on parsing QA components from other studies that could directly affect
the overall quality of the FE dataset. These components were evaluated in order to check that the
collection protocols are rigorous, reliable, and verifiable. The results of the validation checks
showed where the FE data’s strengths and weaknesses existed. FE was found to possess a high
level of completeness in the complete states and for the years 2013 and 2014. The spatial
accuracy and precision were on the cusp of being acceptable for analysis but need further
curation. Attribute accuracy, consistency, and lineage were determined to be of insufficient
quality for any credible analysis and need both curation and concise definitions. To this end, one
purpose of this thesis, determining the overall fitness of the dataset, was achieved.
Moreover, this study looked at FE from a VGI perspective. This was done in order to
produce insight into how FE fits into the VGI domain. Doing so provided valuable insight into
the reliance of crowd data upon QA controls no matter what the project focus is. This study
reinforced the idea that FE, though it is not like traditional VGI projects, does qualify as being in
the same domain because it contains a geographic footprint that can geocoded into a GIS.
The final part of this study was devoted to conducting a preliminary hotspot analysis in a
location and at a scale where there were enough incidents for a more robust statistical calculation
as well as where the data could be made fit for spatial analysis. As such, the hotspot analysis was
successful for identifying where incidents cluster in New York City.
The remainder of Chapter 6 discusses these findings further and is composed of three
sections. In section 6.1 the relation of FE to other VGI projects is discussed. Section 6.2
discusses the strengths and weaknesses of the FE dataset and includes recommendations for
60
future improvements. Section 6.3 discusses the future of FE and potential analyses that might be
done once the data is ready.
6.1 Fatal Encounters as Volunteered Geographic Information
There is no doubt that FE is within the domain of VGI because of its ability to describe location
through its geographic footprint. In addition, FE is certainly an emanation from the crowd. If the
crowd is composed of people who are untrained in professional data management then FE
qualifies in many ways. Mr. Burghart, very much a member of the crowd, started FE with little
training in the management or creation of data. Further, every contributor to the dataset, whether
a journalist writing a story, a law enforcement agency creating a record, or a volunteer who
mines information, is a member of the crowd. The influence of professional data managers is
absent at all levels.
FE is completely reliant on what are essentially secondhand accounts of incidents. It was
not possible for this study to confirm that the information contained within records or media
accounts were actually accurate. One underlying assumption by the FE dataset is that its sources
are reported correctly. This is an inherent weakness in the data because the sources are very
difficult to verify themselves. This problem makes FE different than other VGI projects because
source information can usually always be verified via ground truthing or from another
authoritative source.
FE is a unique dataset from typical VGI in many other ways. First it has a defined
hierarchical structure. Mr. Burghart is the gatekeeper double-checking every piece of work from
the volunteering crowed before uploading to the main database. Secondly, FE imposes
parameters on volunteers, via a submission form, ultimately limiting the criteria that can be
contributed. This reduces the breadth of errors that the crowd can commit versus a project like
61
Wikimapia, where a volunteer can digitize anything they choose in any place. Lastly, because FE
can limit contribution criteria, small tweaks to collection protocol, definitions, and database
design/curation would significantly boost overall quality. Other projects may not be as flexible in
this regard. This fact gives FE an advantage over other VGI because of its potential to adapt.
6.2 Strengths and Weaknesses
The evaluation framework and strategies employed in this study exposed the dataset’s strengths
and weaknesses. It turned out that FE is a good dataset but is in need of improvements.
Fortunately, it will be possible in the future to improve the areas deemed to be unfit. The relative
youth of the dataset, along with the fact that it is not yet complete, means that a slight overhaul at
this stage would have a direct and immediate positive effect.
It would have been a heavy blow to FE if it had been found that it was not counting
incidents in places it believed to be complete. Moreover, completeness is arguably the greatest
hurdle and the most susceptible to criticism, meaning this was a crucial component to verify.
However, the data was found to exhibit a high level of completeness, missing only 1-2% of
incidents from the checks in this study. Compare these results to the ARD program’s self-
analysis of completeness for their data as being only 49% complete. The results of this study
should reduce the concern that FE is letting a large number of incidents slip through the cracks.
Nevertheless, the FOIA sampling process should be extended to all agencies in the future. This
would ensure that as many incidents are being collected as are possible.
Spatial accuracy and precision were found to be mostly suitable. The top two tiers for
accuracy comprised of 88% of the incidents in the complete states, meaning there is only
approximately a 300m error for precision for the majority of incidents in those states. It was
shown that the lower accuracy tiers could be curated for improvement. In addition, it was found
62
that the records obtained from law enforcement consistently contained an accurate description of
place. FE could benefit from sending a decedent specific FOIA to the responsible agencies to
further improve the accuracy of the geographic footprint. These records could also be compared
each of the other attributes which would improve the accuracy of the database as a whole.
Consistency in the FE database was found to be lacking for two main reasons. Firstly, the
data entered into the database needs to be curated so that every field, along with the
corresponding categories, is uniform. A knowledgeable data manager could easily redesign the
database by implementing it into data management software. This would improve the cleanliness
and cohesion of the FE database. Secondly, the definitions that describe each field need to be
concisely expressed so that there is no ambiguity as to what is being meant. Additionally, FE
would benefit from the development of metadata so there is no question as to what is being
meant. Doing so would be a big step toward solidifying credibility. In conclusion, FE is excellent
at nominating incidents but needs to be better at confirming and verifying the associated
attributes.
6.3 The Future of Fatal Encounters
As expressed earlier, FE is a young dataset that was created on the fly from a reaction to the
social status quo. With every new entry, the dearth of data on police use of deadly force is in the
progress of being reversed. However, FE may undergo some growing pains if it wants to
maintain the early attention it has received from the media. It will be subject to even higher
levels of inquiry than in this study. The recommendations suggested above are meant to enable
FE to strengthen its qualities so that it can withstand intensified scrutiny.
Furthermore, fitness would open the door to an array of subsequent analyses. Not just in
the spatial realm but many others. The type of analysis done in this study could be redone with
63
greater depth and in other areas, potentially unearthing any underlying patterns. An example of
one approach might be combine spatial analysis of the predominant race in a given area with the
race of the individual decedents in that area. Disparity between the two might indicate that
policing in that area is motivated by racial bias.
Another potential analysis would be to use law enforcement jurisdictions to identify
agencies with unbalanced numbers of decedents or who are targeting a particular race, gender, or
age group more often. In response to the unrest in Ferguson, MO over the death of Michael
Brown, the DOJ conducted an investigation on the Ferguson Police Department (FPD). The
results were staggering. The investigation found that the city’s law enforcement practices focus
on revenue rather than public safety. This results in unconstitutional policing, injustices during
due process, the sowing of citizen distrust toward police, and extreme discriminatory bias toward
African Americans (DOJ 2015). The study shows that an agency’s approach to law enforcement
can profoundly affect the outcomes of their interactions with citizens. Information regarding
FPD’s enforcement tactics were only unearthed after residents expressed discontent, receiving
substantial national attention. It begs the question: Where else might Ferguson like police culture
be taking place?
FE offers the opportunity to detect possible problem areas. Early identification of these
areas, unlike in Ferguson, would enable the DOJ to evaluate policing and to implement reform
for the agency in question before tumultuous situations arise. A comparison to agencies in non-
problem areas might also yield examples of effective policing protocols that could then be used
to inform others. This might shift the paradigm of government response from being reactive to
proactive.
64
But, before any of this can occur, FE needs to continue recording incidents in areas where
coverage is not complete and upgrade the quality of the information it reports. If FE improves its
quality, it will undoubtedly be the most comprehensive dataset regarding police use of force.
This would in turn grant society, for the first time, access to a dataset that could begin to explain
the context behind these incidents. Ford (2015, 1) writes: “Statistics are more than just numbers:
they focus the attention of the politicians, drive allocation of resources, and define the public
debate.” The truth resounding in this statement amplifies the effect a sound and valid FE could
have upon society.
65
REFERENCES
Beaubien, Elisabeth. 2011. “Planned Phenology Networks of Citizen Scientists:
Recommendations from Two Decades of Experience in Canada.” International Journal
of Biometeorology 72, no. 6: 833-841.
Birch, Colin. 2007. “Rectangular and hexagonal grids used for observation, experiment and
simulation in ecology.” Ecological Modeling 206, no. 3: 347-359.
BOJ (Bureau of Justice). U.S. Department of Justice. 2008. Data Collection: Census of State and
Local Law Enforcement Agencies. Accessed May 31, 2015.
http://www.bjs.gov/index.cfm?ty=dcdetail&iid=249
BOJ (Bureau of Justice). U.S. Department of Justice. 2015. Arrest-Related Deaths Program:
Data Quality Profile. Accessed July 1, 2015.
http://www.bjs.gov/content/pub/pdf/ardpdqp.pdf
Brown, Greg. 2012. “Public participation GIS (PPGIS) for regional and environmental planning:
Reflections on a decade of empirical research.” URISA J. Urban Reg. Ing. Syst. Assoc.
24: 7-18.
Burghart, Brian. 2015. Interview by author. E-mail message. June 7.
Burghart, Brian. 2014. “Fatal Encounters: About.” Fatal Encounters. Accessed February 11,
2015. http://www.fatalencounters.org/why-fe-exists2/.
Chainey, Spencer. 2014. GIS and Crime Mapping. The Jill Dando Insitiute of Security and
Crime Science. London: University College London.
Chrisman, Nicholas. 1999. “What does "GIS" mean?” Trans. GIS 3: 175-186.
66
Comber, Alexis. S. 2013. “Using control data to determine the reliability of volunteered
geographic information about land cover.” International Journal of Applied Earth
Observation and Geoinformation 5, no. 12: 37-48.
Criscuolo, Laura. 2013. “Alpine glaciology: An Historical Collaboration Between Volunteers
and Scientists and the Challenge Presented by an Integrated Approach”. ISPRS
International Journal of Geographic Information 11, no. 5: 680-703.
CRS (Creative Research Systems). 2015. “Sample Size Calculator”. Accessed July 4, 2015.
http://www.surveysystem.com/sscalc.htm
DOJ (Department of Justice). Civil Rights Division. 2015. Investigation of the Ferguson Police
Department.
Esri. 2013. “A New Tool for Creating Sampling Hexagons.” ArcGIS Resources: Blog, May 12,
2013. Accessed June 1, 2015. http://blogs.esri.com/esri/arcgis/2013/05/06/a-new-tool-for-
creating-sampling-hexagons/
Esri. 2015. “Hot Spot Analysis (Getis-Ord Gi*).” Esri Developer Network. Accessed August 10,
2015.
http://edndoc.esri.com/arcobjects/9.2/net/shared/geoprocessing/spatial_statistics_tools/ho
t_spot_analysis_getis_ord_gi_star_spatial_statistics_.htm
Fan, Hongchao. 2014. “Quality Assessment for Building Footprints Data on OpenStreetMap.”
Internation Journal of Geographical Information Science 28, no. 4: 700-719.
Fast, Victoria. 2014. “A Systems Perspective on Volunteered Geographic Information”. ISPRS
International Journal of Geo-Information, 1278-1292.
67
FE (Fatal Encounters). 2015. “Submit Fatal Encounters.” Accessed April 20, 2015.
http://www.fatalencounters.org/google-form/
FBI (Federal Bureau of Investigation). 2012. “Uniform Crime Report: Exapanded Homicide
Data Table.” Accessed February 8, 2015. http://www.fbi.gov/about-us/cjis/ucr/crime-in-
the-u.s/2012/crime-in-the-u.s.-2012/offenses-known-to-law-enforcement/expanded-
homicide/expanded_homicide_data_table_14_justifiable_homicide_by_weapon_law_enf
orcement_2008-2012.xls
FGDC (Federal Geographic Data Committee). Geospatial Metadata Standards: Endorsed ISO
Metadata Standards [cited June 18, 2015]. Available from
http://www.fgdc.gov/metadata/geospatial-metadatastandards#fgdcendorsedisostandards
Ford, Matt. 2015. “The Missing Statistics of Criminal Justice.” The Atlantic, May 31. Accessed
July 31, 2015. http://www.theatlantic.com/politics/archive/2015/05/what-we-dont-know-
about-mass-incarceration/394520/
Fossett, Katelyn. 2015, “The DIY Effort to Count Who Police Kill.” Politico Magazine, June 9.
Accessed August 2, 2015. http://www.politico.com/magazine/story/2015/06/diy-effort-
police-shootings-118796_Page2.html#.VfMNIZdUdyU
Goldberg, Daniel. 2008. A Geocoding Best Practices Guide. Springfield, IL: North American
Association of Central Cancer Registries.
Goodchild, Michael. 2007. “Citizens as Sensors: The World of Vounteered Geography.”
GeoJournal 69, no. 4: 211-221.
Goodman, David. 2015. “Eric Garner Case is Settled by New York City for $5.9 Million.” New
York Times, July 13. Accessed August 5, 2015.
68
http://www.nytimes.com/2015/07/14/nyregion/eric-garner-case-is-settled-by-new-york-
city-for-5-9-million.html?_r=0
Gura, Trisha. 2013. “Citizen science: Amateur experts.” Nature 496, no. 1: 259-261.
Haklay, Muki. 2010. “How Good is Volunteered Geographical Information? A Comparative
Study of OpenStreetMap and Ordnance Survey Datasets.” Environement and Planning
37, no. 4: 682-701.
Haklay, Muki. Septemeber 19, 2014, “Volunteered Geographic Information, Quality
Assurance”, Muki Haklay’s Personal Blog, Accessed March 1, 2015.
https://povesham.wordpress.com/2014/09/19/international-encyclopedia-of-geography-
quality-assurance-of-vgi/
Haydn, Lawrence. 2010. “Integrated Spatial Analysis of Volunteered Geographic Information.”
Master’s Thesis, Wilfred Laurier University.
Heipke, Christian. 2010. “Crowdsourcing geospatial data.” ISPRS Journal of Photogrammetry
and Remote Sensing, 550-557.
Homicide Watch D.C. 2015. Homicide Watch D.C. Accessed April 2, 2015.
http://homicidewatch.org/
Howe, Jeff. 2008. Crowdsourcing: Why the Power of the Crowd is Driving the Future of
Business. New York: Crown Business.
Jackson, Steven P., William Mullen, Peggy Agouris, Andrew Crooks, Arie Croitoru, and
Anthony Stefanidis. 2013. “Assessing Completeness and Spatial Error of Features in
Volunteered Geographic Information.” IQT Quarterly 5, no. 2: 22-26.

69
KBP (Killed By Police). 2015. “Killed By Police”. Accessed April 8, 2015.
http://www.killedbypolice.net/kbp2014.html
Kumar, Vijaya M. and Chandrasekar. 2011. “GIS Technologies in Crime Analysis and Crime
Mapping.” International Jourman of Soft Computing and Engineering (IJSCE) 1, no. 5:
2231-2307.
Levine, Ned. 2004. CrimeStat III: A Spatial Statistics Program for the Analysis of Crime
Incident Locations (version 3.0). Houston: DC: National Institute of Justice.
Maimon, Alan. 2011. “National Data on Shootings by Police not Collected.” Las Vegas Review
Journal, November 29. Accessed February 8, 2015.
http://www.reviewjournal.com/news/deadly-force/142-dead-and-rising/national-data-
shootings-police-not-collected
Meek, Sam. 2014. “A Flexible Framework for Assessing the Quality of Crowdsourced Data.”
Lecture, International Conference on Geographic Information Science, Castellon.
Mooney, Peter C., Padraig Corcoran, Adam Winstanley. 2010. “Towards Quality Metrics in
Open Street Map.” Proceedings, 18th SIGSPATIAL Internation Conference on Advances
in Geographic Information Systems, New York, NY, USA, 514-517.
Morris, Ashley. 2008. “Uncertainty in Spatial Databases.” Malden, MA: Blackwell. The
Handbook of Geographic Information Science, 80-93.
NFIC (National Freedom of Information Coalition). 2015. National Freedom of Information
Coalition - State Sample FOIA Request Letters. Accessed June 10 , 2015.
http://www.nfoic.org/state-sample-foia-request-letters
70
NYC Planning. 2014. “Neighborhood Tabulation Areas.” Accessed August 2, 2015.
http://www.nyc.gov/html/dcp/html/bytes/dwn_nynta.shtml
Obermeyer, Nancy. 2007. “Thoughts on Volunteered (Geo)Slavery.” Accessed August 4, 2015.
http://www.ncgia.ucsb.edu/projects/vgi/participants.html
Rambaldi, Giacomo. 2006. “Precision for Whom? Mapping Ambiguity and Certainty in
(Participatory) GIS.” Mapping for Change: Practice, Technologies, and Communication
3, no. 3: 114 - 120.
Rice, Matthew T., Fabiana Paez, Aaron Mulhollen, and Brandon Shore. 2012. Crowdsourced
Geospatial Data: A Report on the Emerging Phenomenon of Crowdsourced and User-
Generated Geospatial Data. Fairfax, VA: George Mason University.
See, Linda F., Steffen Fritz , and Jan de Leeuw. 2013. “The rise of collaborative mapping: trends
and future directions.” ISPRS International Journal of Geographic Information, 955-958.
Stefanidis, Anthony, Andrew Crooks, and Jacek Radzikowski. 2013. “Harvesting Ambient
Geospatial Information from Social Media Feeds.” GeoJournal 78, no. 12: 319-338.
Stevens, Matthias, Michalis Vitos, Jerome Lewis, and Muki Haklay. 2013. “Participatory
monitoring of poaching in the Congo basin.” Accessed April 4 , 2015.
http://www.geos.ed.ac.uk/~gisteac/proceedingsonline/GISRUK2013_submission_12.pdf
Sui, Daniel, Sarah Elwood, and Michael Goodchild, eds. 2014. Crowdsourcing Geographic
Knowledge: Volunteered Geographic Informaton in Theory and Practice. NewYork:
Springer.

71
Wagner, Kyle. 2014. “Police-Shooting Database” Deadspin Kyle Wagner Blog, August 27.
Accessed April 3, 2015.
http://regressing.deadspin.com/deadspin-police-shooting-database-update-were-still-go-
1627414202
Wiggins, Andrea, Robert Stevenson, and Greg Newman. 2011. “Mechanisms for Data Quality
and Validation in Citizen Science: Computing for Citizen Science." Workshop, IEEE
eScience Conference, Syracuse University, Stockholm, Sweden.
Zook, Matthew and Mark Graham. 2007. “The Creative Ceconstruction of the Internet: Google
and the Privatization of Cyberspace and DigiPlace.” GeoForum 38, no. 12: 1322-1343.
Zook, Matthew, Mark Graham, Taylor Shelton, and Sean Gorman. 2010. “Volunteered
Geographic Information and Crowdsourcing Disaster Relief: A Case Study of the Haitian
Earthquake.” World Medical & Health Policy, 2, no. 2: 7-33.


![Towards a Protocol for the Collection of VGI Vector Data...Geographic Information 1. Introduction Volunteered Geographic Information (VGI) [1] is now an important component in GIS](https://static.fdocuments.in/doc/165x107/5fff9ded47ccc152c97e98c2/towards-a-protocol-for-the-collection-of-vgi-vector-data-geographic-information.jpg)