VALIDATION OF THE MIX DESIGN PROCESS FOR …publications.iowa.gov/5311/1/tr474 phaseII.pdf ·...
261
VALIDATION OF THE MIX DESIGN PROCESS FOR COLD IN-PLACE REHABILITATION USING FOAMED ASPHALT Final Report (IHRB Project TR 474) Hosin “David” Lee, Ph. D., P.E. Associated Professor Yongjoo Kim Research Assistant Report on Research Sponsored by Iowa Highway Research Board PUBLIC POLICY CENTER CIVIL AND ENVIRONMENTAL ENGINEERING UNIVERSITY OF IOWA
Transcript of VALIDATION OF THE MIX DESIGN PROCESS FOR …publications.iowa.gov/5311/1/tr474 phaseII.pdf ·...
VALIDATION OF THE MIX DESIGN PROCESS FOR COLD IN-PLACE REHABILITATION USING FOAMED ASPHALT
Final Report (IHRB Project TR 474)
Hosin “David” Lee, Ph. D., P.E. Associated Professor Yongjoo Kim Research Assistant
Report on Research Sponsored by Iowa Highway Research Board
PUBLIC POLICY CENTER CIVIL AND ENVIRONMENTAL ENGINEERING
UNIVERSITY OF IOWA

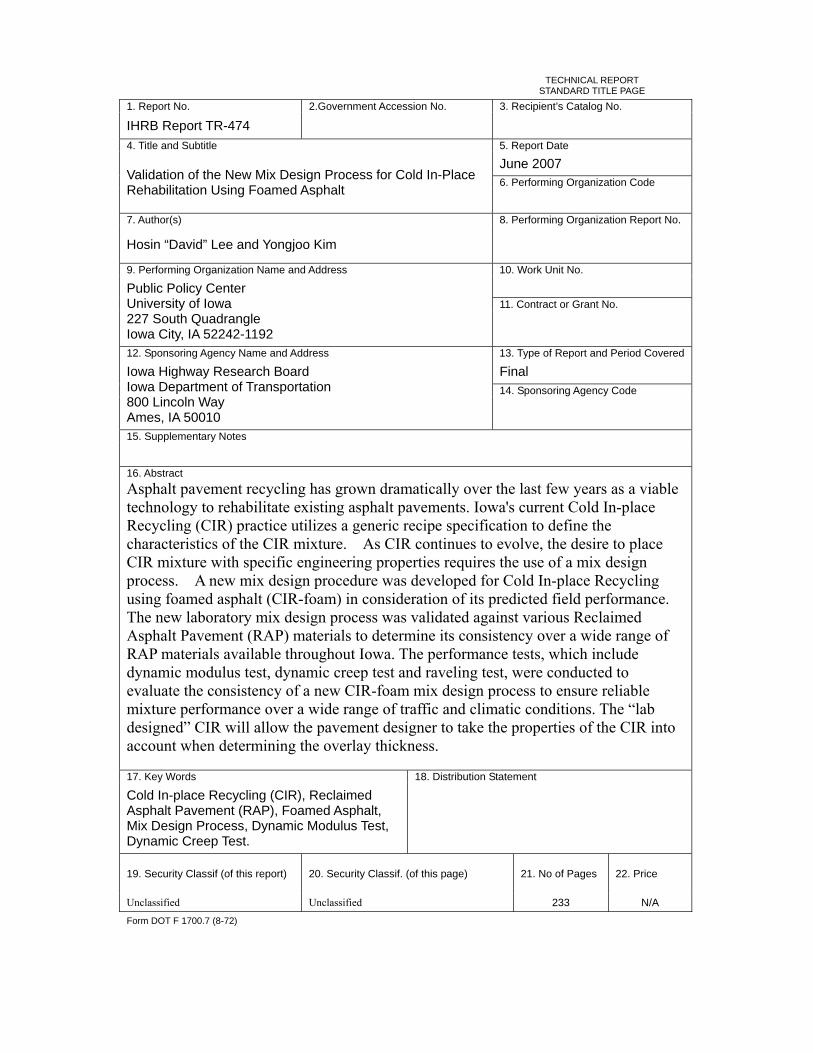
TECHNICAL REPORT STANDARD TITLE PAGE
1. Report No. 2.Government Accession No. 3. Recipient’s Catalog No.
IHRB Report TR-474
4. Title and Subtitle 5. Report Date
June 2007 6. Performing Organization Code Validation of the New Mix Design Process for Cold In-Place
Rehabilitation Using Foamed Asphalt
7. Author(s) 8. Performing Organization Report No.
Hosin “David” Lee and Yongjoo Kim
9. Performing Organization Name and Address 10. Work Unit No.
11. Contract or Grant No. Public Policy Center University of Iowa 227 South Quadrangle Iowa City, IA 52242-1192
12. Sponsoring Agency Name and Address 13. Type of Report and Period Covered
Final 14. Sponsoring Agency Code
Iowa Highway Research Board Iowa Department of Transportation 800 Lincoln Way Ames, IA 50010
15. Supplementary Notes 16. Abstract Asphalt pavement recycling has grown dramatically over the last few years as a viable technology to rehabilitate existing asphalt pavements. Iowa's current Cold In-place Recycling (CIR) practice utilizes a generic recipe specification to define the characteristics of the CIR mixture. As CIR continues to evolve, the desire to place CIR mixture with specific engineering properties requires the use of a mix design process. A new mix design procedure was developed for Cold In-place Recycling using foamed asphalt (CIR-foam) in consideration of its predicted field performance. The new laboratory mix design process was validated against various Reclaimed Asphalt Pavement (RAP) materials to determine its consistency over a wide range of RAP materials available throughout Iowa. The performance tests, which include dynamic modulus test, dynamic creep test and raveling test, were conducted to evaluate the consistency of a new CIR-foam mix design process to ensure reliable mixture performance over a wide range of traffic and climatic conditions. The “lab designed” CIR will allow the pavement designer to take the properties of the CIR into account when determining the overlay thickness. 17. Key Words 18. Distribution Statement
Cold In-place Recycling (CIR), Reclaimed Asphalt Pavement (RAP), Foamed Asphalt, Mix Design Process, Dynamic Modulus Test, Dynamic Creep Test.
19. Security Classif (of this report) 20. Security Classif. (of this page) 21. No of Pages 22. Price
Unclassified Unclassified 233 N/A
Form DOT F 1700.7 (8-72)

Advisory Committee Steve Buckner, Flint Hills Resources, [email protected] Mark Haines, Koss Construction, [email protected] Mike Heitzman, Iowa DOT, [email protected] John Hinrichsen, Iowa DOT, [email protected] Bill Kahl, W.K. Construction, [email protected] Mike Kvach, APAI, [email protected] Larry Mattusch, APAI, [email protected] Bob Nady, Consultant, [email protected] Mark Nahra, Delaware County, [email protected] Greg Parker, Johnson County, [email protected] Dan Seward, Iowa DOT, [email protected]

VALIDATION OF THE MIX DESIGN PROCESS FOR COLD IN-PLACE REHABILITATION USING FOAMED ASPHALT Hosin “David” Lee, Ph. D., P.E., Associated Professor and Yongjoo Kim, Research Assistant The University of Iowa June 15, 2007
i
TABLE OF CONTENT EXECUTIVE SUMMARY............................................................................................... xv
1. INTRODUCTION .......................................................................................................... 1
2. SUMMARY FROM PHASE I STUDY.......................................................................... 3
3. PILOT VALIDATION STUDY ...................................................................................... 8
3.1 RAP Materials....................................................................................................... 8 3.2 Evaluation of RAP Materials ................................................................................ 9
3.2.1 RAP Gradation Analysis ............................................................................ 9 3.2.2 Characteristics of Extracted Asphalt and Aggregates from RAP Materials........................................................................................................................... 10 3.2.3 Flatness and Elongation of RAP Materials ...............................................11
3.3 Compaction Characteristics of CIR-Foam.......................................................... 13 3.3.1 Sample Observation ................................................................................. 14 3.3.2 Volumetric Characteristics ....................................................................... 16 3.3.3 Wet Indirect Tensile Strength Test ........................................................... 21 3.3.4 Correlation between Bulk Specific Gravities by Gyratory and Marshall Compactions ..................................................................................................... 24 3.3.5 Correlation between Indirect Tensile Strength and Gmb (and Air Voids) . 27
3.4 Effects of Fine Contents...................................................................................... 31
4. COLLECTION OF RAP MATERIALS FROM VARIOUS SOURCES IN IOWA ..... 33
4.1 Description of Project Sites ................................................................................ 34 4.2 Visual Condition Survey of the Existing Pavement............................................ 43 4.3 Evaluation of the Collected CIR-Foam Mixtures from Three Job Sites............. 45
4.3.1 Bulk Specific Gravity and Air Void ......................................................... 45 4.3.2 Wet Indirect Tensile Strength................................................................... 47
5. EVALUATION OF RAP MATERIALS ....................................................................... 48
5.1 RAP Gradation Analysis ..................................................................................... 49 5.2 Characteristics of Extracted RAP ....................................................................... 51 5.3 Flatness and Elongation of RAP......................................................................... 52
6. COMPACTION CHARACTERISTICS OF RAP MATERIALS................................. 54
6.1 Sample Observation ............................................................................................ 54 6.2 Gyratory Compacted RAP Specimens without Water or Foamed Asphalt ......... 57 6.3 Gyratory Compacted RAP Specimens with 4.0% Water .................................... 60
ii
6.4 Gyratory Compacted RAP Specimens with 4.0% Water and Foamed Asphalt .. 63
7. VALIDATION OF MIX DESIGN AGAINST VARIOUS RAP MATERIALS............ 69
7.1 Sample Preparation ............................................................................................. 69 7.2 Visual Observation.............................................................................................. 71 7.3 Volumetric Characteristics .................................................................................. 72
7.3.1 Bulk Specific Gravities ............................................................................ 72 7.3.2 Maximum Theoretical Gravities .............................................................. 78 7.3.3 Air Void .................................................................................................... 78
7.4 Wet Indirect Tensile Strength.............................................................................. 84 7.5 Correlations between Average OFAC and RAP Characteristics......................... 90 7.6 Equivalent Number of Gyrations for 75-blow Marshall..................................... 96
8. PERFOMANCE PREDICTION OF MIX DESIGN USING SIMPLE
PERFORMANCE TESTS ................................................................................................ 98
8.1 Dynamic Modulus Test ....................................................................................... 98 8.1.1 Theory ...................................................................................................... 99 8.1.2 Dynamic Modulus Testing Procedure.................................................... 101 8.1.3 Experimental Plan.................................................................................. 103 8.1.4 Results and Discussion .......................................................................... 104
8.2 Dynamic Creep Test.......................................................................................... 139 8.2.1 Theory .................................................................................................... 139 8.2.2. Dynamic Creep Testing Procedure ....................................................... 141 8.2.3. Experimental Plan................................................................................. 142 8.2.4 Results and Discussion .......................................................................... 142
8.3. Raveling Test.................................................................................................... 154 8.3.1 Raveling Testing Procedure ................................................................... 154 8.3.2 Test Results and Discussion................................................................... 155
8.4 Summary and Discussion.................................................................................. 157
9. SHORT-TERM PEROFRMANCE OF CIR PAVEMENTS ....................................... 161
9.1 Data Collection and Analysis Tools for Surveying Pavement Distress ............ 161 9.2 Surface Conditions of the Overlaid HMA Pavement on CIR Layer................. 162 9.3 Analysis Process from the Measured Distress Data.......................................... 170 9.4 Pavement Condition Index (PCI)...................................................................... 177 9.5 Summary ........................................................................................................... 178
10. OBSERVATION OF CIR-FOAM CONSTRUCTION PROCESS........................... 180
10.1 Description of Project Sites ............................................................................ 180 10.2 Visual Condition Survey of the Existing Pavement........................................ 186 10.3 Description of CIR-Foam Construction Process............................................. 188 10.4 Pavenment Tempertures during CIR-foam Process ........................................ 191
iii
10.5 Visual Observation of CIR-Foam Quality ...................................................... 194 10.6 Evaluation of RAP Materials and CIR-Foam Mixtures.................................. 198
10.6.1 Description of Sampling Locations ..................................................... 199 10.6.2 RAP Gradations ................................................................................... 202 10.6.3 RAP Aggregate Gradations and Asphalt Contents Using Burn-Off Oven..........................................................................................................................211 10.6.4 Evaluation of CIR-Foam Mixtures ...................................................... 220
11. CONCLUSIONS AND RECOMMENDATIONS .................................................... 227
REFERENCE.................................................................................................................. 231
GLOSSARY OF ACRONYMS ...................................................................................... 233
iv
LIST OF TABLES
Table 2-1. Optimum foamed asphalt content and water content for three different
gradations at the first and second rounds ........................................................... 6
Table 3-1. Basic information of collected RAP materials................................................... 9
Table 3-2. Characteristics of extracted RAP materials from US-20 Highway ................. 10
Table 3-3. Test results of flat and elongated RAP particles using a 3:1 ratio ................... 12
Table 3-4. Number of specimens prepared under various compaction and curing
conditions ......................................................................................................... 14
Table 3-5. Design parameters for the compaction study................................................... 14
Table 3-6. Wet condition process ...................................................................................... 22
Table 3-7. Equivalent of number of gyrations at three different FAC contents ................ 24
Table 3-8. Proportion of three different fine contents....................................................... 32
Table 4-1. Basic information for seven project sites......................................................... 34
Table 4-2. CIR design information for seven project sites ............................................... 35
Table 4-3. Summary of surface conditions from the existing pavement .......................... 43
Table 4-4. Number of specimens for evaluating field CIR-Foam mixtures...................... 45
Table 5-1. Properties of extracted asphalt and extracted aggregates ................................ 52
Table 6-1. Test condition for gyratory compaction of RAP materials .............................. 54
Table 6-2. Gmb of gyratory compacted RAP specimens without water adding any
additional material............................................................................................ 58
Table 6-3. Gmb of gyratory compacted RAP specimens without 4.0% water ................... 61
Table 7-1. Design parameters for validation of laboratory mix design ............................ 69
Table 7-2. Number of specimens prepared for each design parameter............................. 70
Table 7-3. Estimated Gmb of Marshall compacted foamed asphalt samples for seven
different sources of RAP materials................................................................... 74
Table 7-4. Estimated Gmb of gyratory compacted foamed asphalt samples for seven
different sources of RAP materials................................................................... 75
Table 7-5. Calculated air void of Marshall compacted foamed asphalt samples for seven
different sources of RAP materials................................................................... 80
Table 7-6. Calculated air void of gyratory compacted foamed asphalt samples for seven
v
different sources of RAP materials................................................................... 81
Table 7-7. Indirect tensile strength of Marshall compacted foamed asphalt samples for
seven different RAP materials.......................................................................... 86
Table 7-8. Indirect tensile strength of gyratory compacted foamed asphalt samples for
seven different RAP materials.......................................................................... 87
Table 7-9. Summary of RAP characteristics and average optimum foamed asphalt
contents............................................................................................................. 93
Table 7-10. Equivalent of number of gyrations at three different FAC contents and two
different curing temperatures ........................................................................... 97
Table 8-1. Laboratory conditions for three simple performance tests .............................. 98
Table 8-2. Loading cycles for dynamic modulus test sequence...................................... 103
Table 8-3. Design parameters selected for SPT specimens ............................................ 104
Table 8-4. Bulk specific gravities (Gmb) and air voids of CIR-foam specimens prepared
for dynamic modulus test ............................................................................... 105
Table 8-5. Summary of dynamic moduli of CIR-foam mixtures from Hardin County .. 107
Table 8-6. Summary of dynamic moduli of CIR-foam mixtures from Lee County ....... 108
Table 8-7. Summary of dynamic moduli of CIR-foam mixtures from Webster County 109
Table 8-8. Summary of dynamic moduli of CIR-foam mixtures from Bremer County ..110
Table 8-9. Summary of dynamic moduli of CIR-foam mixtures from Wapello County .111
Table 8-10. Summary of dynamic moduli of CIR-foam mixtures from Montgomery
County .............................................................................................................112
Table 8-11. Summary of dynamic moduli of CIR-foam mixtures from Muscatine County
.........................................................................................................................113
Table 8-12. Rankings of dynamic modulus at three foamed asphalt contents from seven
different RAP sources......................................................................................114
Table 8-13. Model parameters of constructed master curves.......................................... 126
Table 8-14. Summary of measured dynamic moduli and predicted dynamic moduli from
seven RAP sources at FAC=1.0% .................................................................. 131
Table 8-15. Summary of measured dynamic moduli and predicted dynamic moduli from
seven RAP sources at FAC=2.0% .................................................................. 132
Table 8-16. Summary of measured dynamic moduli and predicted dynamic moduli from
vi
seven RAP sources at FAC=3.0% .................................................................. 133
Table 8-17. Bulk specific gravities (Gmb) and air voids of CIR-foam specimens for
dynamic creep test .......................................................................................... 144
Table 8-18. Flow number and strain at flow number...................................................... 146
Table 8-19. Rankings of flow number from seven different RAP sources ..................... 150
Table 9-1. Distress data of CIR-foam site surveyed in Muscatine County..................... 163
Table 9-2. Distress data of the CIR-ReFlex site surveyed in Webster County ............... 164
Table 9-3. Distress data of the CIR-foam site surveyed in Hardin County .................... 165
Table 9-4. Distress data of the CIR-ReFlex site surveyed in Montgomery County ....... 166
Table 9-5. Distress data of the CIR-ReFlex site surveyed in Bremer County ................ 167
Table 9-6. Distress data of the CIR-ReFlex site surveyed in Lee County ...................... 168
Table 9-7. Distress data of the CIR-foam site surveyed in Wapello County .................. 169
Table 9-8. Summary of distress data from seven CIR project sites ................................ 170
Table 10-1. Basic information for demonstration project sites....................................... 181
Table 10-2. CIR design information for demonstration project sites.............................. 181
Table 10-3. Summary of surface conditions from the existing pavement ...................... 187
Table 10-4. Measured temperatures form three CIR-foam project sites......................... 192
Table 10-5. Gradation summary of RAP materials collected from Decatur County ...... 205
Table 10-6. Gradation summary of RAP materials collected from Harrison County project
site .................................................................................................................. 205
Table 10-7. Gradation summary of RAP materials collected from Johnson County...... 206
Table 10-8. Gradation summary of RAP materials passing 25 mm sieve collected from
Decatur County .............................................................................................. 208
Table 10-9. Gradation summary of RAP materials passing 25 mm sieve collected from
Harrison County ............................................................................................. 208
Table 10-10. Gradation summary of RAP materials passing 25 mm sieve collected from
Johnson County .............................................................................................. 209
Table 10-11. Gradations and residual asphalt contents of foamed asphalt mixture and
RAP materials collected at 10:30 a.m. ........................................................... 213
Table 10-12. Gradations and residual asphalt contents of foamed asphalt mixture and
RAP materials collected at 12:30 p.m. ........................................................... 214
vii
Table 10-13. Gradations and residual asphalt contents of foamed asphalt mixture and
RAP materials collected at 1:30 p.m. ............................................................. 215
Table 10-14. Gradations and residual asphalt contents of foamed asphalt mixture and
RAP materials collected at 3:30 p.m. ............................................................. 216
Table 10-15. Number of specimens for evaluation of field foamed asphalt mixtures .... 220
Table 10-16. Volumetric characteristics and ITS of foamed asphalt mixtures collected in
the Johnson County project ............................................................................ 225
viii
LIST OF FIGURES
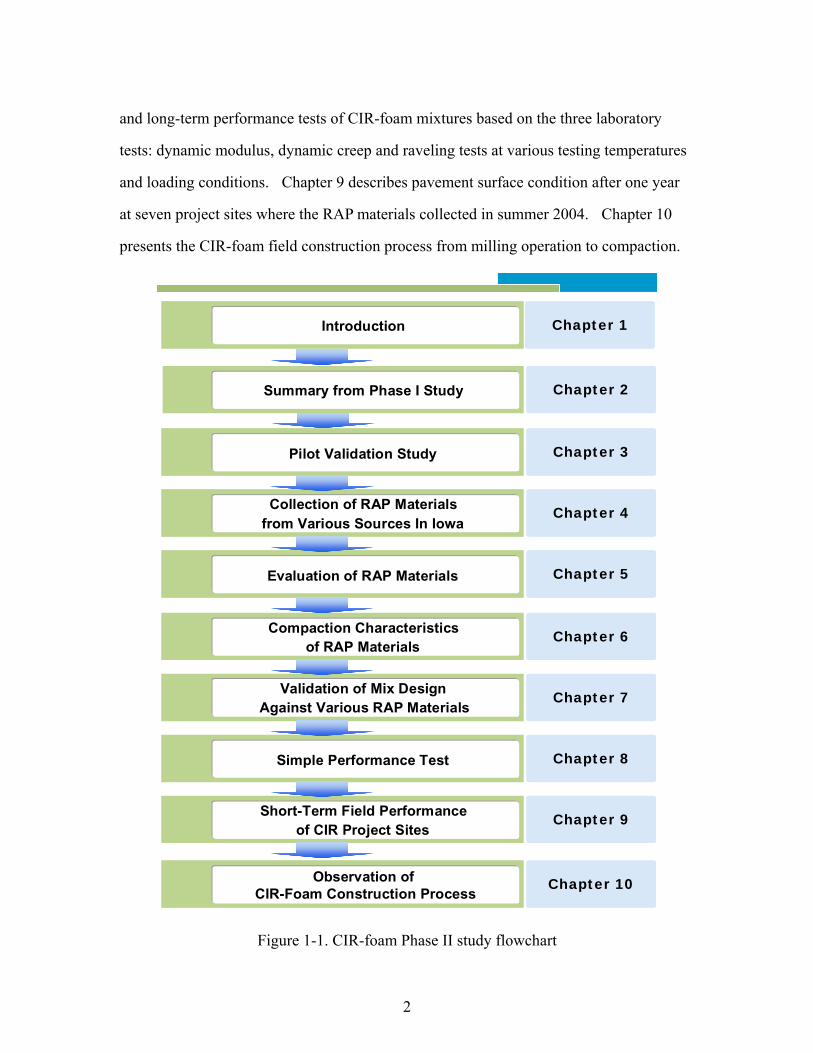
Figure 1-1. CIR-foam Phase II study flowchart.................................................................. 2
Figure 2-1. Wirtgen foaming equipment (a) and production of famed asphalt (b)............. 4
Figure 2-2. Developed new laboratory mix design procedure of CIR-foam ...................... 7
Figure 3-1. Test flowchart and parameters of pilot study ................................................... 8
Figure 3-2. RAP gradations of two different RAP materials ............................................ 10
Figure 3-3. Measuring flatness and elongation of RAP materials .....................................11
Figure 3-4. Comparison of % flat and elongated particles at two different RAP sources 12
Figure 3-5. Pictures of gyratory and Marshall compacted specimens (FAC=2.5%) ........ 15
Figure 3-6. Pictures of gyratory compacted specimens at 30 and 50 gyrations (US 20).. 16
Figure 3-7. Plot of maximum theoretical specific gravity against FAC contents ............. 17
Figure 3-8. Plots of Gmb against FAC at five different levels of compaction ................. 19
Figure 3-9. Plots of air void vs. FAC at different levels of compaction ........................... 20
Figure 3-10. Plots of indirect tensile strength against FAC contents at five different
compaction levels ........................................................................................... 23
Figure 3-11. Correlation of Gmb and air void between gyratory and Marshall compacted
foamed asphalt specimens (US-20 Highway) ................................................ 25
Figure 3-12. Correlation of Gmb and air void between gyratory and Marshall compacted
foamed asphalt specimens (Delaware County) .............................................. 26
Figure 3-13. Correlation between Marshall stability and Gmb for dry and wet specimens
compacted using Marshall hammer................................................................ 28
Figure 3-14. Correlation between indirect tensile strength and Gmb for dry and wet
specimens compacted using Marshall hammer .............................................. 29
Figure 3-15. Plots of correlation between ITS and Gmb (and air void) of specimens at two
different curing temperatures (US Highway RAP) ........................................ 30
Figure 3-16. Plots of correlation between ITS and Gmb (and air void) at two different
curing temperatures (Delaware County RAP)................................................ 30
Figure 3-17. Plots of Gmb and ITS against FAC at three different fine content ................ 32
Figure 4-1. Locations of CIR project sites where RAP materials were collected............. 33
Figure 4-2. Location of the CIR-foam construction site in Muscatine County ................ 36
ix
Figure 4-3. Pictures of job site in Muscatine County ....................................................... 36
Figure 4-4. Location of the CIR-ReFlex construction site in Webster County................. 37
Figure 4-5. Pictures of CIR-ReFlex job site in Webster County ...................................... 37
Figure 4-6. Location of the CIR-foam construction site in Hardin County...................... 38
Figure 4-7. Pictures of CIR-foam job site in Hardin County............................................ 38
Figure 4-8. Location of the CIR-ReFlex construction site in Montgomery County......... 39
Figure 4-9. Pictures of CIR-ReFlex job site in Montgomery County............................... 39
Figure 4-10. Location of the CIR-ReFlex construction site in Bremer County................ 40
Figure 4-11. Pictures of CIR-ReFlex job site in Bremer County...................................... 40
Figure 4-12. Location of the CIR-ReFlex construction site in Lee County...................... 41
Figure 4-13. Pictures of CIR-ReFlex Job Site in Lee County .......................................... 41
Figure 4-14. Location of the CIR-foam construction site in Wapello County.................. 42
Figure 4-15. Pictures of CIR-foam job site in Wapello County........................................ 42
Figure 4-16. Pictures of surface conditions on existing pavement ................................... 44
Figure 4-17. Estimated Gmb and air void against compaction levels at two different curing
temperatures.................................................................................................... 46
Figure 4-18. Indirect tensile strength against compaction levels at two different curing
temperatures.................................................................................................... 47
Figure 5-1. Drying process of the RAP materials at the laboratory.................................. 48
Figure 5-2. Sorted RAP materials in 5-gallon buckets ..................................................... 49
Figure 5-3. Gradation plot of seven different RAP materials ........................................... 50
Figure 5-4. Gradation plot of seven different RAP materials passing 25mm sieve.......... 50
Figure 5-5. Cumulated gradation bar charts of seven different RAP materials passing
25mm sieve..................................................................................................... 51
Figure 5-6. Plot of percent flat and elongation of RAP materials from seven counties ... 53
Figure 6-1. Pictures of compacted specimens at three different RAP conditions (Wapello
County) ........................................................................................................... 55
Figure 6-2. Pictures of compacted specimens at three different RAP conditions (Hardin
County) ........................................................................................................... 56
Figure 6-3. Plots of Gmb of RAP materials against the number of gyrations up to 200.... 59
Figure 6-4. Plots of Gmb of RAP materials against the number of gyrations up to 30...... 59
x
Figure 6-5. Gmb of RAP materials with 4.0% water against the number of gyrations up to
200 .................................................................................................................. 62
Figure 6-6. Plots of Gmb of RAP materials with 4.0% water against the number of
gyrations up to 30 ........................................................................................... 62
Figure 6-7. Plots of Gmb of RAP materials with 1.0% FAC against the number of
gyrations up to 30 ........................................................................................... 64
Figure 6-8. Plots of Gmb of RAP materials with 1.5% FAC against the number of
gyrations up to 30 ........................................................................................... 64
Figure 6-9. Plots of Gmb of RAP materials with 2.0% FAC against the number of
gyrations up to 30 ........................................................................................... 65
Figure 6-10. Plots of Gmb of RAP materials with 2.5% FAC against the number of
gyrations up to 30 ........................................................................................... 65
Figure 6-11. Plots of Gmb of RAP materials with 3.0% FAC against the number of
gyrations up to 30 ........................................................................................... 66
Figure 6-12. Plots of bulk specific gravities against the number of gyrations (1)............ 67
Figure 6-13. Plots of bulk specific gravities against the number of gyrations (2)............ 68
Figure 7-1. Pictures of gyratory and Marshall compacted specimens (FAC=2.5%) ........ 71
Figure 7-2. Pictures of compacted and cured foamed asphalt specimens......................... 72
Figure 7-3. Gmb of Marshall hammer compacted specimens against FAC (40°C) ........... 76
Figure 7-4. Gmb of gyratory compacted speciemns against FAC (40°C).......................... 76
Figure 7-5. Gmb of Marshall hammer compacted specimens against FAC (60°C) ........... 77
Figure 7-6. Gmb of gyratory compacted specimens against FAC (60°C).......................... 77
Figure 7-7. Plots of maximum theoretical specific gravities ............................................ 78
Figure 7-8. Air void of Marshall hammer compacted specimens against FAC (40°C) .... 82
Figure 7-9. Air void of gyratory compacted specimens against FAC (40°C) ................... 82
Figure 7-10. Air void of Marshall hammer compacted specimens against FAC (60°C) .. 83
Figure 7-11. Air void of gyratory compacted specimens against FAC (60°C) ................. 83
Figure 7-12. Vacuum saturation procedure for making wet specimens............................ 84
Figure 7-13. ITS of Marshall compacted foamed asphalt specimens (40°C) ................... 88
Figure 7-14. ITS of gyratory compacted foamed asphalt specimens (40°C).................... 88
Figure 7-15. ITS of Marshall compacted foamed asphalt specimens (60°C) ................... 89

xi
Figure 7-16. ITS of gyratory compacted foamed asphalt specimens (60°C).................... 89
Figure 7-17. Indirect tensile strength against foamed asphalt content (Marshall hammer
compacted samples)........................................................................................ 91
Figure 7-18. Indirect tensile strength against foamed asphalt content (Gyratory compacted
samples) .......................................................................................................... 92
Figure 7-19. Correlations between optimum foamed asphalt content and testing
temperature of DSR ...................................................................................... 94
Figure 7-20. Correlations between optimum foamed asphalt content and residual aspahlt
stiffness ......................................................................................................... 95
Figure 7-21. Correlations between optimum foamed asphalt content and residual asphalt
content .......................................................................................................... 96
Figure 8-1. Testing components of the dynamic modulus .............................................. 100
Figure 8-2. Simple performance testing equipment........................................................ 101
Figure 8-3. Glued magnetic gauge points placed on both sides SPT specimen.............. 102
Figure 8-4. Plots of dynamic moduli against six loading frequencies for three foamed
asphalt contents at 4.4˚C................................................................................116
Figure 8-5. Plots of dynamic moduli against six loading frequencies for three foamed
asphalt contents at 21.1˚C..............................................................................117
Figure 8-6. Plots of dynamic modulus value against six loading frequencies for three
foamed asphalt contents at 37.8˚C.................................................................118
Figure 8-7. Dynamic moduli against three temperatures at 25Hz .................................. 120
Figure 8-8. Dynamic moduli against three foamed asphalt contents at 25Hz ................ 122
Figure 8-9. Construction of master curve ....................................................................... 123
Figure 8-10. Mater curves at three FAC’s from Hardin County ..................................... 127
Figure 8-11. Mater curves at three FAC’s from Lee County .......................................... 127
Figure 8-12. Mater curves at three FAC’s from Webster County ................................... 128
Figure 8-13. Mater curves at three FAC’s from Bremer County .................................... 128
Figure 8-14. Mater curves at three FAC’s from Wapello County ................................... 129
Figure 8-15. Mater curves at three FAC’s from Montgomery County ........................... 129
Figure 8-16. Mater curves at three FAC’s from Muscatine County................................ 130
xii
Figure 8-17. Shift factors against three temperatures ..................................................... 130
Figure 8-18. Correlations between dynamic moduli and residual asphalt content at three
different temperatures................................................................................... 135
Figure 8-19. Correlations between dynamic moduli and residual asphalt stiffness at three
different temperatures................................................................................... 136
Figure 8-20. Correlations between dynamic moduli and amount of fine RAP materials
passing No. 8 sieve at three different temperatures...................................... 137
Figure 8-21. Correlations between dynamic moduli and flat & elongation ratio at three
different temperatures................................................................................... 138
Figure 8-22. Permanent deformation behavior against loading cycles........................... 140
Figure 8-23. Dynamic creep test results ......................................................................... 141
Figure 8-24. Plots of cumulative strain versus loading cycle at FAC=1.0% .................. 147
Figure 8-25. Plots of cumulative strain versus loading cycle at FAC=2.0% .................. 148
Figure 8-26. Plots of cumulative strain versus loading cycle at FAC=3.0% .................. 149
Figure 8-27. Correlations between flow number and residual asphalt content............... 152
Figure 8-28. Correlations between flow number and residual asphalt stiffness ............. 152
Figure 8-29. Correlations between flow number and % passing No.8 sieve.................. 153
Figure 8-30. Correlations between flow number and % of flat and elongation.............. 153
Figure 8-31. Pictures of raveling test equipment ............................................................ 154
Figure 8-32. Damaged surface of specimens at two curing time periods (FAC=2.5%) . 155
Figure 8-33. Percent raveling losses of foamed asphalt specimens from seven different
RAP sources.................................................................................................. 157
Figure 9-1. Picture of automated image collection system............................................. 162
Figure 9-2. Digital image dimension .............................................................................. 162
Figure 9-3. Longitudinal, transverse, and alligator cracks measured from overlaid HMA
pavement on CIR layer ................................................................................. 171
Figure 9-4. Longitudinal and transverse cracks at the interface between rehabilitated
pavement and un-rehabilitated pavement ..................................................... 172
Figure 9-5. Longitudinal cracks created along the shoulder of both lanes ..................... 172
Figure 9-6. Transverse crack patterns measured from Webster County ......................... 173
Figure 9-7. Longitudinal crack patterns measured form Hardin County........................ 173
xiii
Figure 9-8. Transverse crack patterns measured from Hardin County ........................... 174
Figure 9-9. Alligator cracks at the interface between rehabilitated pavement and existing
concrete bridge ........................................................................................... 174
Figure 9-10. Longitudinal and transverse cracks measured from Montgomery County 175
Figure 9-11. Longitudinal and transverse cracks measured from Bremer County ......... 175
Figure 9-12. Cracks created at the interface between rehabilitated pavement and un-
rehabilitated pavement.................................................................................. 176
Figure 9-13. Longitudinal and transverse cracks measured from Lee County ............... 176
Figure 9-14. Images captured from survey from Wapello County ................................. 177
Figure 9-15. Main panel of PAVER software to calculate PCI....................................... 178
Figure 9-16. Comparison of PCI from distress data at seven CIR project sites ............. 178
Figure 10-1. Locations of specified three CIR project sites ........................................... 180
Figure 10-2. Location of the CIR-foam project site in Decatur County......................... 182
Figure 10-3. Pictures of CIR-foam job site in Decatur County ...................................... 183
Figure 10-4. Location of the CIR-foam project site in Harrison County........................ 184
Figure 10-5. Pictures of CIR-foam job site in Harrison County..................................... 184
Figure 10-6. Location of the CIR-foam project site in Johnson County ........................ 185
Figure 10-7. Pictures of CIR-foam job site in Johnson County...................................... 186
Figure 10-8. Pictures of existing old pavement surface conditions ................................ 188
Figure 10-9. Schematic diagram of the CIR-foam process............................................. 189
Figure 10-10. Pictures of CIR-foam construction equipment......................................... 190
Figure 10-11. Locations of measured temperatures from CIR-foam process................. 191
Figure 10-12. Changes of measured temperatures in CIR-foam project sites ................ 193
Figure 10-13. Pictures of paved foamed asphalt mixtures observed from CIR-foam field
projects.......................................................................................................... 195
Figure 10-14. Pictures of tire and steel rollers used in CIR-foam compaction process.. 196
Figure 10-15. Pictures of surface problems at the rehabilitated CIR-foam pavement.... 197
Figure 10-16. Comparison of CIR-foam pavement raveling at two different FAC s ..... 197
Figure 10-17. Comparison of CIR-foam pavement between traffic path and shoulder.. 198
Figure 10-18. Locations of collected RAP materials and foamed asphalt mixtures in
Decatur County project sites......................................................................... 199
xiv
Figure 10-19. Pictures of field sampling methods in Decatur County project ............... 200
Figure 10-20. Locations of collected RAP materials and paved foamed asphalt mixtures
in Harrison County project sites ................................................................... 200
Figure 10-21. Pictures of field sampling methods in Harrison County project site ....... 201
Figure 10-22. Locations of collected RAP materials and foamed asphalt mixtures in
Johnson County project sites ........................................................................ 202
Figure 10-23. Drying process of the RAP materials at the laboratory............................ 203
Figure 10-24. Sorted RAP materials in 5-gallon buckets ............................................... 203
Figure 10-25. Gradation plots of RAP materials passing 25 mm sieve colleted at five
different time periods in Decatur County project ......................................... 210
Figure 10-26. Gradation plots of RAP materials passing 25mm colleted at six different
time periods in Harrison County project ...................................................... 210
Figure 10-27. Gradation plots of RAP materials passing 25 mm colleted at one time
period in Johnson County project ..................................................................211
Figure 10-28. Gradations of burned foamed asphalt mixture aggregates collected at 10:30
a.m. across the lane....................................................................................... 217
Figure 10-29. Gradations of burned foamed asphalt mixture aggregates collected at 12:30
p.m. across the lane....................................................................................... 217
Figure 10-30. Gradations of burned foamed asphalt mixture aggregates collected at 1:30
p.m. across the lane....................................................................................... 218
Figure 10-31. Gradations of burned foamed asphalt mixture aggregates collected at 3:30
p.m. across the lane....................................................................................... 218
Figure 10-32. Residual asphalt contents of foamed asphalt mixtures across the lane.... 219
Figure 10-33. Foamed asphalt contents against five different spots across lane ............ 219
Figure 10-34. Volumetric characteristics and ITS of foamed asphalt mixture collected
from Decatur County project ........................................................................ 222
Figure 10-35. Volumetric characteristics and ITS of foamed asphalt mixture collected
from Harrison County project....................................................................... 224
Figure 10-36. Comparisons of volumetric characteristics and ITS of foamed asphalt
mixture collected from three CIR-foam project sites ................................... 226
xv
EXECUTIVE SUMMERY Iowa's current Cold In-place Recycling (CIR) practice utilizes a generic recipe specification to define the characteristics of the CIR mixture. The contractor is given latitude to adjust the proportions of stabilizing agent to achieve a specified level of density. As CIR continues to evolve, the desire to place CIR mixture with specific engineering properties requires the use of a mix design process. The “lab designed” CIR will allow the pavement designer to take the properties of the CIR into account when determining the overlay thickness. A significant drawback to using emulsion as the stabilizing agent is the amount of water associated with the emulsion. High amounts of water limit the ability to increase binder content and extent the time required to cure the CIR layer. Using foamed asphalt as the stabilizing agent could significantly reduce these limitations. During the phase I study, a new mix design process was developed for evaluating CIR-foam mixtures. Some strengths and weaknesses of the mix design parameters were identified and the laboratory test procedure was modified to improve the consistency of the mix design process of Cold In-place Recycling using foamed asphalt (CIR-foam). Based upon the critical mixture parameters identified, a new mix design procedure using indirect tensile test and vacuum-saturated wet specimens was developed. Phase II study was then launched to validate the developed laboratory mix design process against various Reclaimed Asphalt Pavement (RAP) materials to determine its consistency over a wide range of RAP materials available throughout Iowa. Collection and Evaluation of RAP Materials During the summer of 2004, in order to validate the mix design process developed during the phase I study, RAP materials were collected from seven different CIR project sites: three CIR-foam and four CIR-ReFlex sites. CIR project sites were selected across the state of the Iowa, which included Muscatine County, Webster County, Hardin County, Montgomery County, Bremer County, Lee County, and Wapello County. First, RAP materials were divided into six stockpiles that were retained on the following sieves: 25mm, 19mm, 9.5mm, 4.75mm, 1.18mm, and those passing through the 1.18mm sieve. The sorted RAP materials were then weighed and their relative proportions were computed. All RAP materials were considered from dense to coarse with very small amount of fine aggregates passing through the 0.075mm (No. 200) sieve. All RAP materials passed through the 38.1 mm sieve and less than 1.0% was retained on the 25mm sieve except those at Muscatine (2.6%), Hardin (6.0%), and Wapello Counties (1.3%). Gradation analyses for seven RAP sources were conducted and the RAP materials from Muscatine County were the coarsest followed by Montgomery, Webster and Wapello Counties; and those from Hardin, Bremer and Lee Counties were finer. Overall, gradations of extracted aggregates were relatively fine with a large amount of fine material passing through a 0.075mm sieve.
xvi
The flat and elongation ratio test was performed on RAP materials in accordance with ASTM D 4791. All RAP materials exceeded the 10% limit of a 3:1 ratio and RAP materials from Lee County were the most flat and elongated, followed by Wapello County. The least flat and elongated materials were from Hardin, Montgomery and Bremer Counties. Very few RAP materials were flat and elongated at a ratio greater than 5:1. To investigate compaction characteristics of RAP materials, as a reference point, RAP materials were compacted using a gyratory compactor without adding water or foamed asphalt. There was a significant increase in bulk specific gravity by adding foamed asphalt. The extracted asphalt content ranged from 4.59% for RAP materials collected from Wapello County to 6.06% from Hardin County. The extracted asphalt of RAP material from Montgomery County exhibited the highest penetration of 28 and a small G*/sin δ value of 1.08 at the lowest test temperature of 76°C whereas that of Lee County showed the lowest penetration of 15 and G*/sin δ value of 1.06 at the highest test temperature of 94°C. Validation of a New Mix Design Process The indirect tensile strength test of the vacuum-saturated specimens was conducted using seven different RAP materials at five foamed asphalt contents, 1.0%, 1.5%, 2.0%, 2.5%, and 3.0%, given a fixed moisture content of 4.0%. The specimens were compacted by gyratory compactor at 30 gyrations or by Marshall hammer at 75 blows and were cured at 40°C oven for three days or 60°C for two days. The indirect tensile strength of gyratory compacted and vacuum-saturated specimens was more sensitive to foamed asphalt contents than that of Marshall hammer compacted and vacuum-saturated specimens. The indirect tensile strength of CIR-foam specimens cured for two days at 60°C oven was significantly higher than that of CIR-foam specimens cured for three days at 40°C oven. The optimum foamed asphalt content was determined when the highest indirect tensile strength of vacuum saturated specimens was obtained. Based on the test results, neither air voids nor flat and elongation characteristics of RAP materials affected the indirect tensile strength of the CIR-foam mixtures. The highest indirect tensile strengths were obtained from the RAP materials with a large amount of hard residual asphalt. However, the optimum foamed asphalt content was not affected by the amount of residual asphalt content. Performance Test Results The performance tests, which include dynamic modulus test, dynamic creep test and raveling test, were conducted to evaluate the consistency of a new CIR-foam mix design process to ensure reliable mixture performance over a wide range of traffic and climatic conditions.
xvii
The dynamic modulus tests were performed on CIR-foam mixtures at six different loading frequencies, 0.1, 0.5, 1, 5, 10 and 25 Hz, and three different test temperatures, 4.4, 21.1 and 37.8°C. Within each source of RAP materials, the dynamic moduli of RAP materials were not affected by loading frequencies but significantly affected by the test temperatures. The dynamic moduli measured at three foamed asphalt contents were significantly different among seven RAP sources. Rankings of RAP materials by the dynamic modulus value changed when the foamed asphalt was increased from 1.0% to 3.0%, which indicates that the dynamic modulus values are affected by a combination of foamed asphalt content and RAP aggregate structure. At 4.4°C, dynamic modulus of RAP materials from Muscatine County was the highest, Webster County was second and Lee and Hardin Counties were the lowest. At 21.1°C, dynamic modulus of RAP materials from Webster County was the highest followed by Muscatine County whereas Lee and Hardin Counties stayed at the lowest level. At 37.8°C, dynamic modulus of RAP materials from Muscatine became the lowest whereas Webster County was the highest. It can be postulated that RAP material from Muscatine is sensitive to temperature because they were the coarsest with least amount of residual asphalt content. Therefore, the coarse RAP materials with a small amount of residual asphalt content may be more fatigue resistant at a low temperature but more susceptible to rutting at a high temperature. On the other hand, fine RAP materials with a large amount of hard residual asphalt content like Hardin County may be more resistant to rutting at high temperature but more susceptible to fatigue cracking at low temperature. A master curve was constructed for a reference temperature of 20˚C for each of seven RAP sources. Master curves are relatively flat compared to HMA mixtures, which supports that foamed asphalt mixtures are not as viscoelastic as HMA. More viscoelastic behavior was observed from the foamed asphalt mixtures with higher foamed asphalt content. Based on the dynamic creep test, RAP materials from Muscatine County exhibited the lowest flow number at all foamed asphalt contents whereas those from Lee and Webster Counties reached the highest flow number. The lower the foamed asphalt contents, the flow number was higher, which indicates the foamed asphalt content with 1.0% is more resistant to rutting than 2.0% and 3.0%. RAP materials from seven different sources were ranked by the flow number. Overall, the rankings of RAP materials did not change when the foamed asphalt was increased from 1.0% to 3.0%, which indicates that flow number is affected more dominantly by the RAP aggregate structure than by the foamed asphalt content. The finer RAP materials with a higher amount of the harder binder were more resistant to rutting. This result is consistent with the findings based on dynamic modulus test performed at 37.8˚C. Based on the laboratory performance test results, it can be postulated that RAP materials from Wapello and Webster Counties would be more resistant to both fatigue and rutting.
xviii
RAP materials from Muscatine, Bremer and Montgomery Counties would be more resistant to fatigue cracking but less resistant to rutting. RAP materials from Hardin and Lee Counties would be more resistant to rutting but less resistant to fatigue cracking. Based on the raveling test results, the foamed asphalt specimens at 2.5% foamed asphalt content showed less raveling loss than those of 1.5% foamed asphalt content. It was found that the raveling test was very sensitive to the curing period and foamed asphalt content of the CIR-foam specimens. To increase cohesive strength quickly, it is necessary to use higher foamed asphalt content of 2.5% instead of 1.5%. Short Term Performance of CIR Pavements To evaluate the short-term performance of CIR pavements, the digital images were collected from these CIR project sites using the Automated Image Collection System (AICS) and the images were analyzed to measure the length, extent, and severity of different types of distress. Based upon the condition survey result performed in one year after the construction, all have performed very well without any serious distress observed. Some minor longitudinal and transverse cracks were observed near the interface between rehabilitated and un-rehabilitated pavements in Montgomery, Hardin, and Bremer Counties. Transverse cracks occurred more frequently than longitudinal cracks at most pavement sections, which can be considered as the early distress type. Conclusions Asphalt pavement recycling has grown dramatically over the last few years as a viable technology to rehabilitate existing asphalt pavements. Rehabilitation of existing asphalt pavements has employed different techniques; one of them, Cold In-place Recycling with foamed asphalt (CIR-foam), has been effectively applied in Iowa. This research was conducted to develop and validate a new laboratory mix design process for CIR-foam in consideration of its predicted field performance. Based on the extensive laboratory experiments, the following conclusions are derived:
Gyratory compactor produces the more consistent CIR-foam laboratory specimen than Marshall hammer.
Indirect tensile strength of gyratory compacted specimens is higher than that of Marshall hammer compacted specimens.
Indirect tensile strength of the mixtures cured in the oven at 60˚C for 2 days is significantly higher than that of mixtures cured in the oven at 40˚C for 3 days.
Dynamic modulus of CIR-foam is affected by a combination of the RAP sources and foamed asphalt contents.
The coarse RAP materials with a small amount of residual asphalt content may be more resistant to fatigue cracking but less resistant to rutting.
CIR-foam is not as sensitive to temperature or loading frequency as HMA.
xix
Based on the dynamic creep tests performed at 40˚C, CIR-foam with 1.0% foamed asphalt is more resistant to rutting than CIR-foam with 2.0% or 3.0%.
Based on the dynamic creep tests performed at 40˚C, RAP aggregate structure has a predominant impact on its resistant to rutting.
Based on the dynamic creep test results performed at 40˚C and dynamic modulus
test performed at 37.8˚C, the finer RAP materials with the more and harder residual asphalt were more resistant to rutting.
CIR-foam specimens with 2.5% foamed asphalt content are more resistant to raveling than ones with 1.5%.
There is a significant variation in distribution of foamed asphalt across the lane during the CIR-foam construction, which could affect its field performance.
Recommendations Based on the extensive laboratory experiments and the field evaluations, the following recommendations are made:
30 gyrations are recommended for producing the equivalent laboratory specimens produced by 75-blow Marshall hammer.
Laboratory specimens should be cured in the oven at 60°C for 2 days. To determine the optimum foamed asphalt content, indirect tensile strength test
should be performed on vacuum saturated specimen. Gyratory compacted specimens should be placed in 25˚C water for 20 minutes,
vacuumed saturated at 20 mm Hg for 30 minutes and left under water for additional 30 minutes without vacuum.
The optimum foamed asphalt content should be increased from 1.5% to 2.5% if the penetration index of the residual asphalt from RAP materials increases from 28 to 15.
The proposed mix design procedure should be implemented to assure the optimum performance of CIR-foam pavements in the field.
Future Studies
CIR-foam pavements should be constructed following the new mix design process and their long-term field performance should be monitored and verified against the laboratory performance test results.
New mix design and laboratory simple performance tests should be performed on the CIR-foam mixtures using stiffer asphalt binder grade, i.e., PG 58-28 or 64-22.
Static creep test should be evaluated for a possible addition to the performance test protocol.
New mix design and laboratory performance tests should be evaluated for CIR-emulsion mixtures.

xx
To better simulate the field performance as a base, performance tests should be performed on both CIR-foam and CIR-emulsion specimens with a horizontal confined pressure.
A comprehensive database of mix design, dynamic modulus, flow number and raveling for both CIR-foam and CIR-emulsion should be developed to allow for an input to the Mechanistic-Empirical Pavement Design Guide (MEPDG).

1
1. INTRODUCTION
During the previous phase I study, some strengths and weaknesses of the mix
design parameters were identified and the laboratory test procedure was modified to
improve the consistency of the mix design process of CIR using foamed asphalt (CIR-
foam). Both Marshall and indirect tensile strength test procedures were evaluated as a
foamed asphalt mix design procedure using Reclaimed Asphalt Pavement (RAP)
materials collected from US-20 Highway in Iowa. Based upon the critical mixture
parameters identified, a new mix design procedure using indirect tensile testing
equipment and vacuum-saturated wet specimens was developed.
However, the proposed new mix design procedure would be only applicable to
the specific RAP materials obtained from US-20 Highway, near the city of Manchester in
Buchanan County, Iowa. Therefore, phase II study was launched to validate the
developed laboratory mix design process against various RAP materials to determine its
consistency over a wide range of RAP materials available throughout Iowa.
Figure 1-1 shows the tasks, which were performed from phase II study. Chapter
1 introduces study objective and the scope of phase II study. Chapter 2 summarizes the
findings, conclusions, and recommendations obtained from phase I study. Chapter 3
presents the results of a pilot study that evaluated the mix design procedure using two
different RAP materials. Chapter 4 summarizes the basic CIR design information about
seven job sites where the condition of the existing pavement had been evaluated before
the pavement was milled. Chapter 5 evaluates the fundamental characteristics of
collected RAP materials, which may influence their compaction characteristics and field
performance. Chapter 6 investigates the compaction characteristics of RAP materials,
which were compacted using a gyratory compactor without adding any additional foamed
asphalt. Chapter 7 validates the developed mix design process against seven different
RAP materials at five different foamed asphalt contents. Chapter 8 presents the short-
2
and long-term performance tests of CIR-foam mixtures based on the three laboratory
tests: dynamic modulus, dynamic creep and raveling tests at various testing temperatures
and loading conditions. Chapter 9 describes pavement surface condition after one year
at seven project sites where the RAP materials collected in summer 2004. Chapter 10
presents the CIR-foam field construction process from milling operation to compaction.
Chapter 2Summary from Phase I Study
Chapter 3Pilot Validation Study
Chapter 4Collection of RAP Materials from Various Sources In Iowa
Chapter 5Evaluation of RAP Materials
Chapter 1Introduction
Chapter 6Compaction Characteristics of RAP Materials
Chapter 7Validation of Mix Design Against Various RAP Materials
Chapter 8Simple Performance Test
Chapter 9Short-Term Field Performance of CIR Project Sites
Chapter 10Observation of CIR-Foam Construction Process
Figure 1-1. CIR-foam Phase II study flowchart
3
2. SUMMARY FROM PHASE I STUDY
Iowa's current Cold In-Place Recycling (CIR) practice utilizes a generic recipe
specification to define the characteristics of the CIR mixture. The contractor is given
latitude to adjust the proportions of stabilizing agent to achieve a specified level of
density. As CIR continues to evolve, the desire to place CIR mixture with specific
engineering properties requires the use of a mix design process. The “lab designed” CIR
will allow the pavement designer to take the properties of the CIR into account when
determining the overlay thickness. A significant drawback to using emulsion as the
stabilizing agent is the amount of water associated with the emulsion. High amounts of
water limit the ability to increase binder content and extent the time required to cure the
CIR layer. Using foamed asphalt as the stabilizing agent could significantly reduce both
of these limitations. However, there is no design procedure available for the CIR using
foamed asphalt (CIR-foam).
The main objective of CIR-foam phase I study was to develop a new mix design
process for CIR-foam. During phase I, some strengths and weaknesses of the mix design
parameters were identified and the laboratory test procedure was modified to improve the
consistency of the mix design process of Cold In-place Recycling using foamed asphalt
(CIR-foam). laboratory analysis of numerous mixture components was performed. The
foaming process, distribution and amount of the asphalt, RAP gradation, compaction,
curing, and mixture strength were examined. Various foamed asphalt mix design
parameters produced from the past numerous studies for Full-Depth Reclamation (FDR)
and CIR were reviewed and detailed laboratory test results were documented in the final
report which was submitted to IHRB in December 2003 (Lee and Kim, 2003).
First, the foamed asphalt laboratory equipment was purchased from Wirtgen, Inc.,
which is capable of varying different parameters such as the asphalt temperature
(140°C~200°C), water content (0%~5%), air pressure (0 bar~10 bar) and the injection
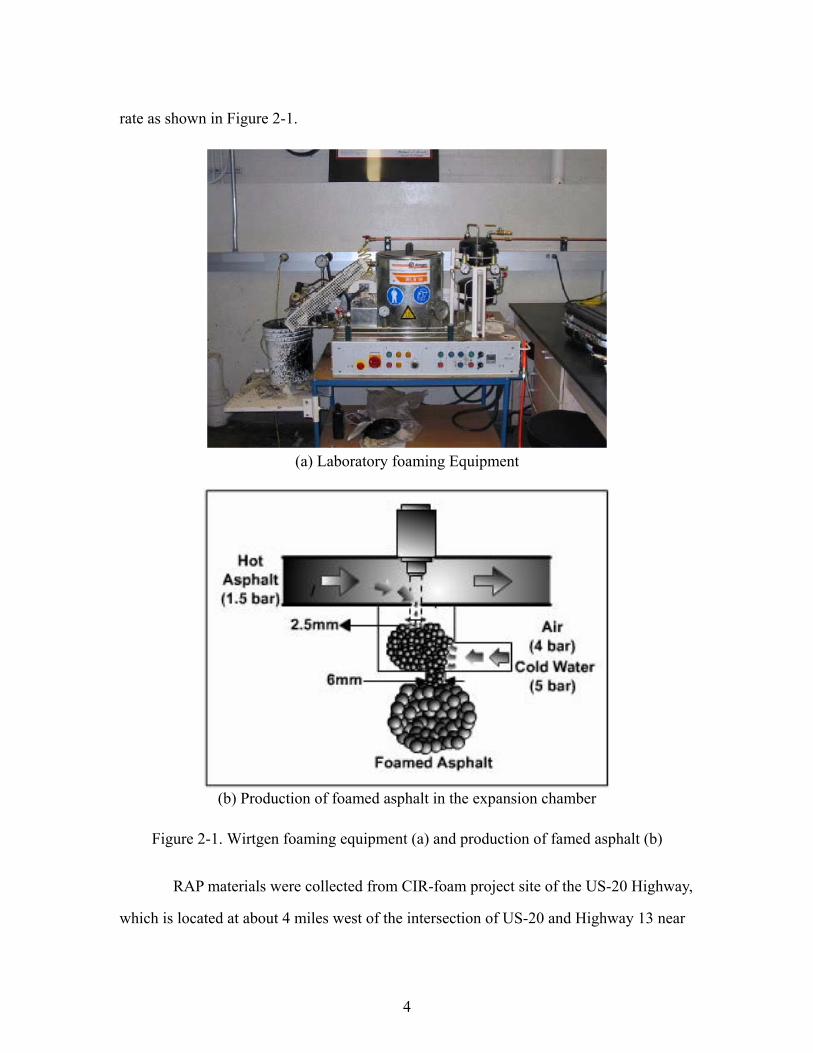
4
rate as shown in Figure 2-1.
(a) Laboratory foaming Equipment
(b) Production of foamed asphalt in the expansion chamber
Figure 2-1. Wirtgen foaming equipment (a) and production of famed asphalt (b)
RAP materials were collected from CIR-foam project site of the US-20 Highway,
which is located at about 4 miles west of the intersection of US-20 and Highway 13 near
5
city of Manchester. The existing asphalt pavement was milled throughout the day and,
to identify the possible variation in RAP gradations, temperatures of the milled RAP
materials were measured throughout the day. Based on the limited study samples, the
time of the milling and temperature of pavement during the milling process did
significantly affect the RAP gradation. To identify the impact of the RAP gradation on
the mix design, three different RAP gradations were produced as “Fine”, “Field”, and
“Coarse.”
The laboratory foaming process was validated by varying different amounts of
water and asphalt content. The PG 52-34 asphalt binder was used as the stabilizing
agent for the laboratory foamed asphalt mix design. The foaming water content of 1.3%
created the optimum foaming characteristics in terms of an expansion ratio of 10-12.5
and a half-life of 12-15 at 170°C under an air pressure of 4 bars and a water pressure of 5
bars.
Based on the first round of tests, the maximum Marshall stability (both wet and
dry), bulk specific gravity, and indirect tensile strength (both dry and wet) were all
obtained at a foamed asphalt content of approximately 2.5% at the RAP aggregate
Optimum Moisture Content (OMC)-0.5% or OMC-1.0%. There was a significant drop
in these values (except for bulk density) at foamed asphalt contents above 2.5%. The
“Fine” gradation produced the highest stability and indirect tensile strengths.
During the second round of laboratory tests, due to the vacuum saturation
conditioning process, most wet specimens lost their test values significantly by up to 50%.
This indicates that CIR-foam mixtures may be susceptible to water damage. Although
test values of dry specimens were higher at low FAC of 1.5%, they lost significant
strength after they were vacuum-saturated. Specimens at 2.5% FAC, however, retained
their wet indirect tensile strengths reasonably well. For “wet” specimens, the “Fine”
gradation produced the lowest stability and indirect tensile strength. For a given optimum
FAC of 2.5%, the “Coarse” gradation produced the highest stability and indirect tensile
6
strength. The highest test values were obtained at 4.5% MC for “Fine” gradation, 4.0%
MC for “Field” gradation, and 3.5%~4.0% MC for “Coarse” gradation.
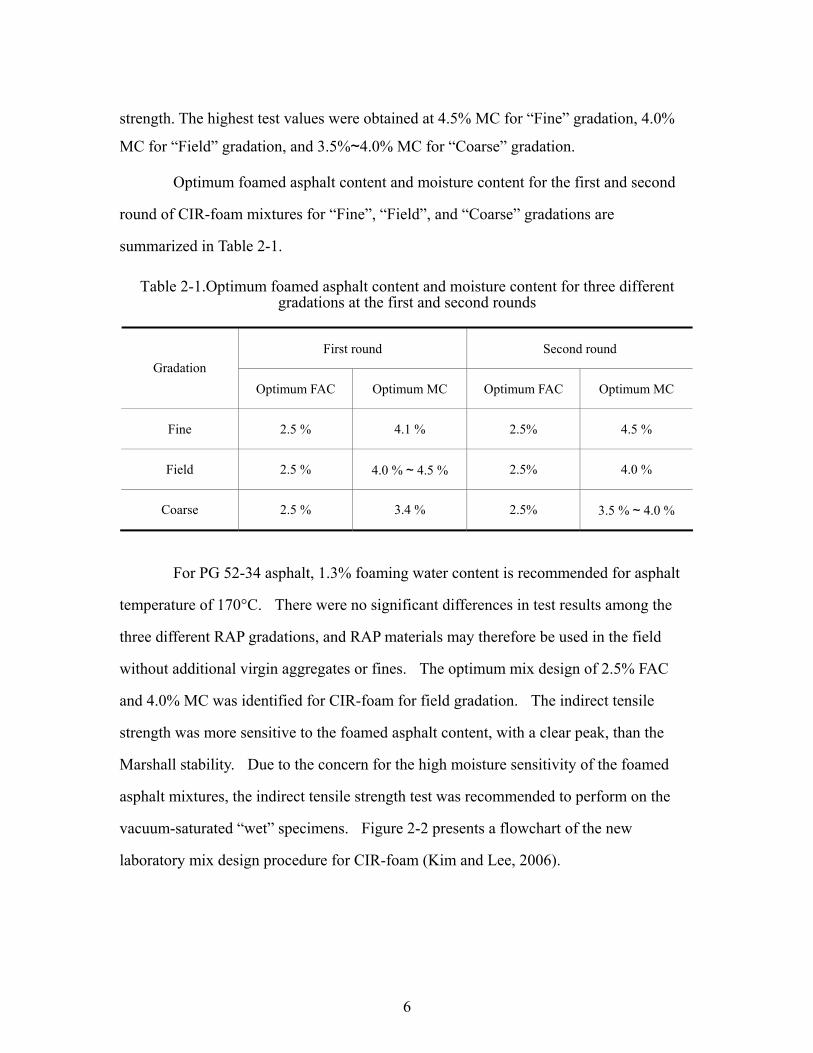
Optimum foamed asphalt content and moisture content for the first and second
round of CIR-foam mixtures for “Fine”, “Field”, and “Coarse” gradations are
summarized in Table 2-1.
Table 2-1.Optimum foamed asphalt content and moisture content for three different gradations at the first and second rounds
First round Second round Gradation
Optimum FAC Optimum MC Optimum FAC Optimum MC
Fine 2.5 % 4.1 % 2.5% 4.5 %
Field 2.5 % 4.0 % ~ 4.5 % 2.5% 4.0 %
Coarse 2.5 % 3.4 % 2.5% 3.5 % ~ 4.0 %
For PG 52-34 asphalt, 1.3% foaming water content is recommended for asphalt
temperature of 170°C. There were no significant differences in test results among the
three different RAP gradations, and RAP materials may therefore be used in the field
without additional virgin aggregates or fines. The optimum mix design of 2.5% FAC
and 4.0% MC was identified for CIR-foam for field gradation. The indirect tensile
strength was more sensitive to the foamed asphalt content, with a clear peak, than the
Marshall stability. Due to the concern for the high moisture sensitivity of the foamed
asphalt mixtures, the indirect tensile strength test was recommended to perform on the
vacuum-saturated “wet” specimens. Figure 2-2 presents a flowchart of the new
laboratory mix design procedure for CIR-foam (Kim and Lee, 2006).
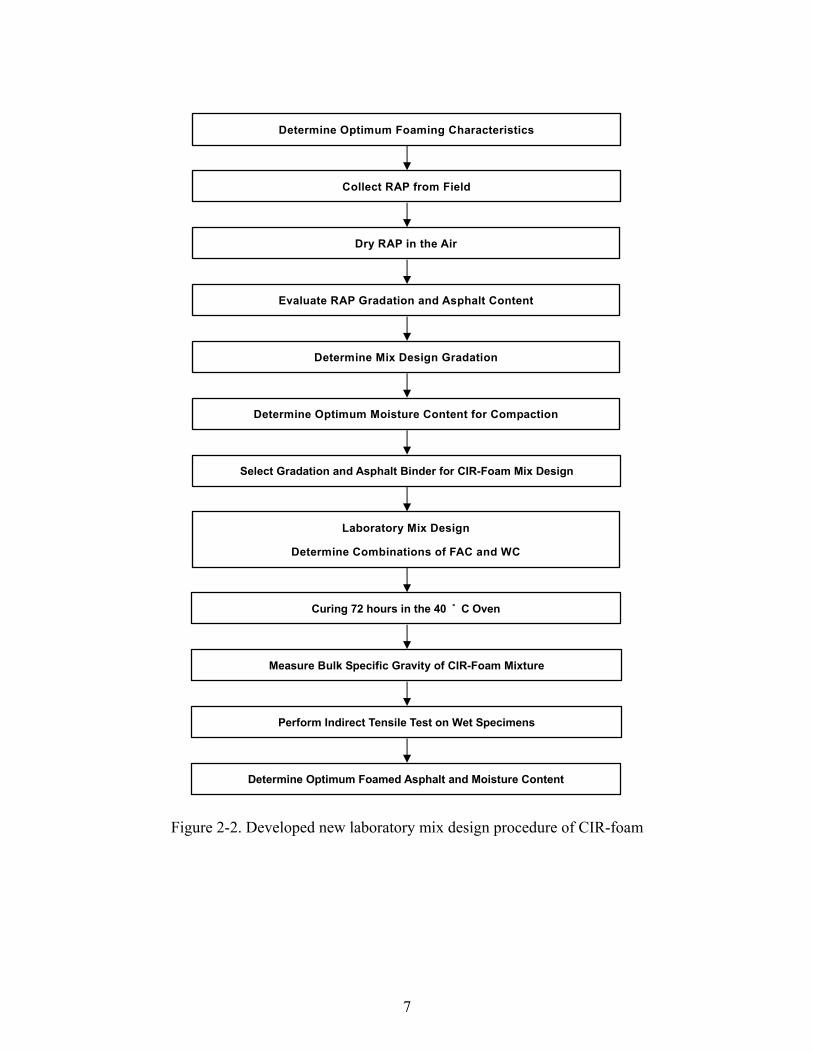
7
Determine Optimum Foaming Characteristics
Collect RAP from Field
Dry RAP in the Air
Evaluate RAP Gradation and Asphalt Content
Determine Mix Design Gradation
Determine Optimum Moisture Content for Compaction
Select Gradation and Asphalt Binder for CIR-Foam Mix Design
Laboratory Mix Design
Determine Combinations of FAC and WC
Curing 72 hours in the 40 ˚ C Oven
Measure Bulk Specific Gravity of CIR-Foam Mixture
Perform Indirect Tensile Test on Wet Specimens
Determine Optimum Foamed Asphalt and Moisture Content
Figure 2-2. Developed new laboratory mix design procedure of CIR-foam
8
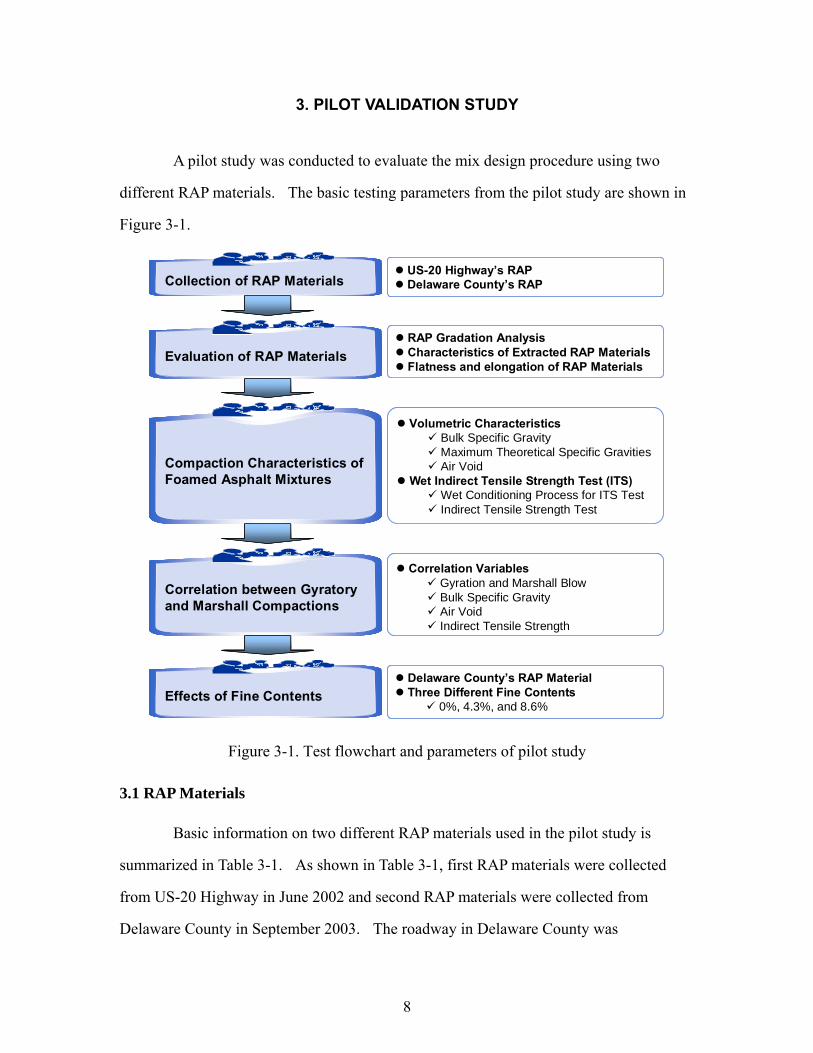
3. PILOT VALIDATION STUDY
A pilot study was conducted to evaluate the mix design procedure using two
different RAP materials. The basic testing parameters from the pilot study are shown in
Figure 3-1.
US-20 Highway’s RAPDelaware County’s RAPCollection of RAP Materials
RAP Gradation Analysis Characteristics of Extracted RAP MaterialsFlatness and elongation of RAP Materials
Evaluation of RAP Materials
Volumetric CharacteristicsBulk Specific Gravity Maximum Theoretical Specific Gravities Air Void
Wet Indirect Tensile Strength Test (ITS)Wet Conditioning Process for ITS TestIndirect Tensile Strength Test
Compaction Characteristics of Foamed Asphalt Mixtures
Correlation VariablesGyration and Marshall BlowBulk Specific Gravity Air Void Indirect Tensile Strength
Correlation between Gyratory and Marshall Compactions
Effects of Fine Contents Delaware County’s RAP MaterialThree Different Fine Contents
0%, 4.3%, and 8.6%
Figure 3-1. Test flowchart and parameters of pilot study
3.1 RAP Materials
Basic information on two different RAP materials used in the pilot study is
summarized in Table 3-1. As shown in Table 3-1, first RAP materials were collected
from US-20 Highway in June 2002 and second RAP materials were collected from
Delaware County in September 2003. The roadway in Delaware County was
9
constructed in 1956 and US-20 Highway was constructed in 1970. Due to its age, the
residual asphalt extracted from RAP materials collected from Delaware County may be
stiffer than the US-20 Highway.
Table 3-1. Basic information of collected RAP materials
Source Item US-20 Highway Delaware County
Performance Age 1970 – 2002 (32 years) 1956 – 2003 (47 years)
Maintenance History 2” of surface mix replaced (1989) No maintenance
Milling Date June, 2002 September, 2003
Pavement Surfacing Temperature during Milling
25.2°C ~ 30.4°C
(7:40 a.m. ~ 8:50 a.m.)
49.0°C ~ 52.2 °C
(12:50 p.m. ~ 13:55 p.m.)
44.2°C ~ 50.0°C
(15:55 p.m. ~ 16:50 p.m.)
N/A
Type of Milling Machine CMI PR-1000 N/A
Recycling Agent Cold In-Place Recycling (CIR-foam)
Cold In-Place Recycling (CIR-foam)
3.2 Evaluation of RAP Materials
RAP materials from US-20 Highway were dried outside for two days at 32°C and
the moisture contents of the dried RAP materials were between 1.0% and 0.3%. RAP
materials from Delaware County were brought to the laboratory and dried at between
25°C and 27°C for 10 days. The moisture content of the dried RAP materials was
between 0.2% and 0.3%.
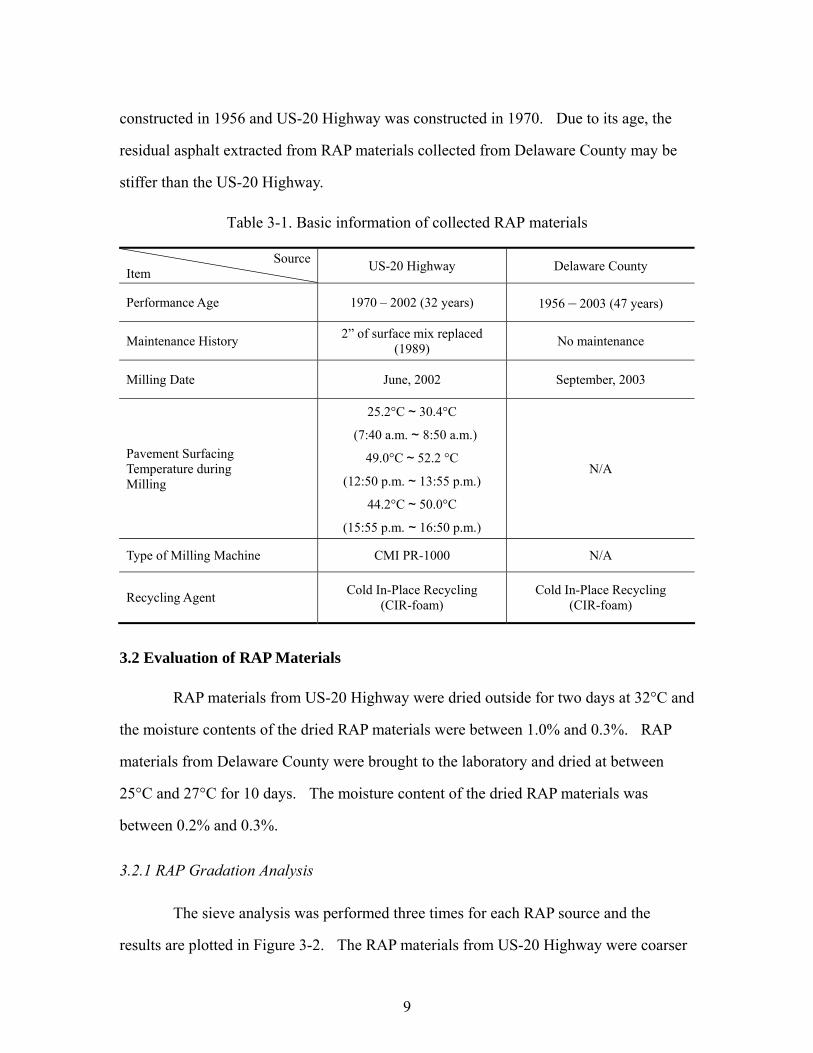
3.2.1 RAP Gradation Analysis
The sieve analysis was performed three times for each RAP source and the
results are plotted in Figure 3-2. The RAP materials from US-20 Highway were coarser
10
than ones from Delaware County, more RAP materials passing sieves between 19.0mm
and 9.5mm.
0
10
20
30
40
50
60
70
80
90
100
Sieve Size(mm) Raised to 0.45 Power
Pass
ing
Perc
enta
ge (%
)
Delaware County (IA)
US-20 Highway (IA)
#200 #50 #16 #8 #4 9.5mm 19mm 25mm 38.1mm#100 #30 12.5mm
Figure 3-2. RAP gradations of two different RAP materials
3.2.2 Characteristics of Extracted Asphalt and Aggregates from RAP Materials
The sieve analysis result of the extracted aggregate and the extracted asphalt
content of RAP material from US-20 Highway are summarized in Table 3-2.
Table 3-2. Characteristics of extracted RAP materials from US-20 Highway
Sieve Size Property
25.0 mm
19.0 mm
12.5 mm
9.50 mm
4.75 mm
2.36 mm
1.18 mm
0.6 mm
0.3 mm
0.15 mm
0.075 mm
Passing % 100 100 93.3 84.3 61.7 46.7 38.0 30.0 20.0 13.0 10.0
Residual AC (%) 4.62%
11
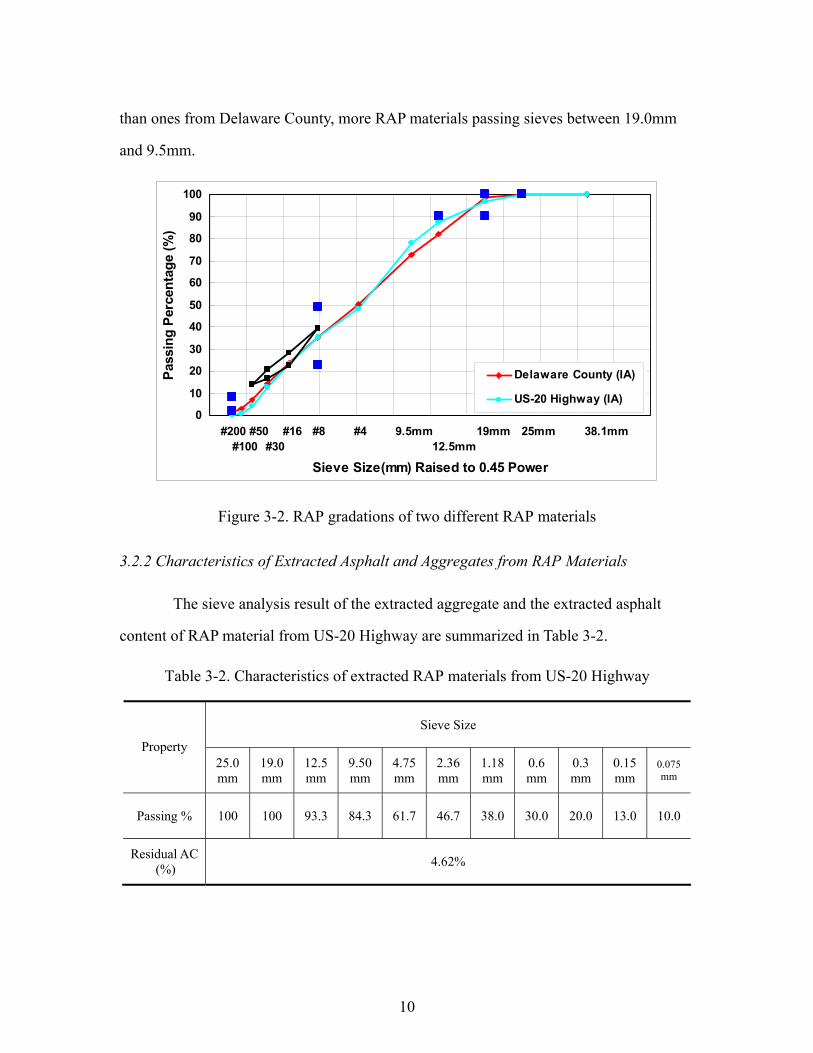
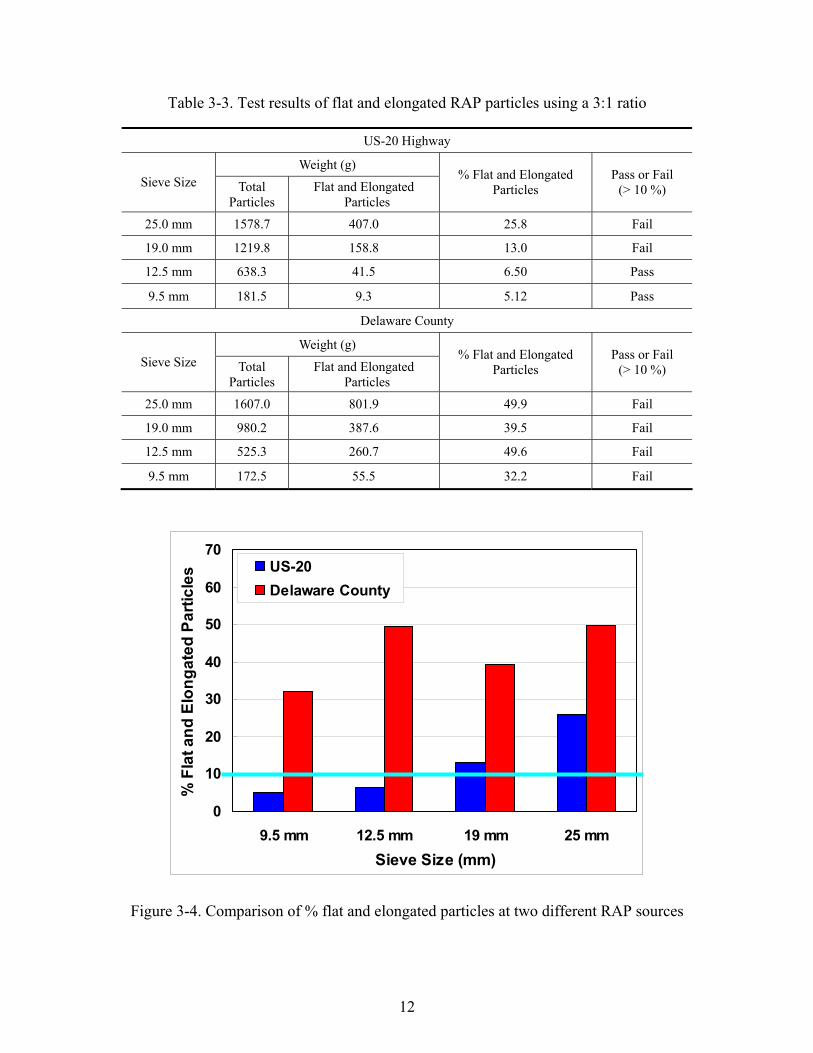
3.2.3 Flatness and Elongation of RAP Materials
RAP materials retained on the sieve size of 9.5mm and larger were tested for
flatness and elongation. RAP materials of each sieve were weighted to determine a
percentage of flat and elongated RAP materials. Superpave specifications require hot
mix asphalt to have less than 10% flat and elongated particles of 3:1 ratio measured using
the caliper as shown in Figure 3-3. The percentages of flat and elongated particles were
computed to the nearest 1.0% for each sieve size greater than 9.5mm. Flatness and
elongation ratio of two different RAP materials are summarized in Table 3-3 and plotted
in Figure 3-4. As shown in Table 3-3 and Figure 3-4, RAP materials of 12.5mm and
9.5mm collected from US-20 Highway passed whereas RAP materials of 25mm and
19mm failed. RAP particles collected from Delaware Country failed at all sizes.
(a) Checking flatness (b) Checking elongation
Figure 3-3. Measuring flatness and elongation of RAP materials
12
Table 3-3. Test results of flat and elongated RAP particles using a 3:1 ratio
US-20 Highway
Weight (g) Sieve Size Total
Particles Flat and Elongated
Particles
% Flat and Elongated Particles
Pass or Fail (> 10 %)
25.0 mm 1578.7 407.0 25.8 Fail
19.0 mm 1219.8 158.8 13.0 Fail
12.5 mm 638.3 41.5 6.50 Pass
9.5 mm 181.5 9.3 5.12 Pass
Delaware County
Weight (g) Sieve Size Total
Particles Flat and Elongated
Particles
% Flat and Elongated Particles
Pass or Fail (> 10 %)
25.0 mm 1607.0 801.9 49.9 Fail
19.0 mm 980.2 387.6 39.5 Fail
12.5 mm 525.3 260.7 49.6 Fail
9.5 mm 172.5 55.5 32.2 Fail
0
10
20
30
40
50
60
70
9.5 mm 12.5 mm 19 mm 25 mmSieve Size (mm)
% F
lat a
nd E
long
ated
Par
ticle
s US-20Delaware County
Figure 3-4. Comparison of % flat and elongated particles at two different RAP sources
13
3.3 Compaction Characteristics of CIR-foam
A recent survey by the Rocky Mountain User Producer Group of 38 states (1999)
recommended 50-blow Marshall compaction as standard for determining optimum
moisture and emulsified asphalt content of CIR mixtures. However, Salomon and
Newcomb (2001) recommended that CIR-Emulsion mixtures should be compacted with
gyratory compactors that produce consistent air voids. They reported that, at 10
gyrations, relative densities were in the range of 85% to 90% of the maximum density,
and, at 60 gyrations, they were between 90% and 95% of maximum density. Density
was reported to stay constant after 60 gyrations. To achieve a desired density of 130 pcf
for a laboratory test specimen, Lee et al. (2003) recommended 37 gyrations for CIR-
Emulsion. To achieve the field density, Thomas and Kadrmas (2003) suggested 30
gyrations for CIR-Emulsion mixtures. To match the field density, Stephen (2002)
recommended 30 to 35 gyrations for CIR-Emulsion mixtures.
Brennen et al. (1970) reported that Marshall stability of the gyratory compacted
FDR-foam specimens produced at 20 gyrations under a pressure of 200 psi was two to
three times higher than that of Marshall hammer compacted specimens at 75 blows.
Nataatmadja (2001) reported that the gyratory compacted FDR-foam specimens with 85
gyrations consistently produced the higher densities than Marshall hammer compacted
specimens with 75 blows.
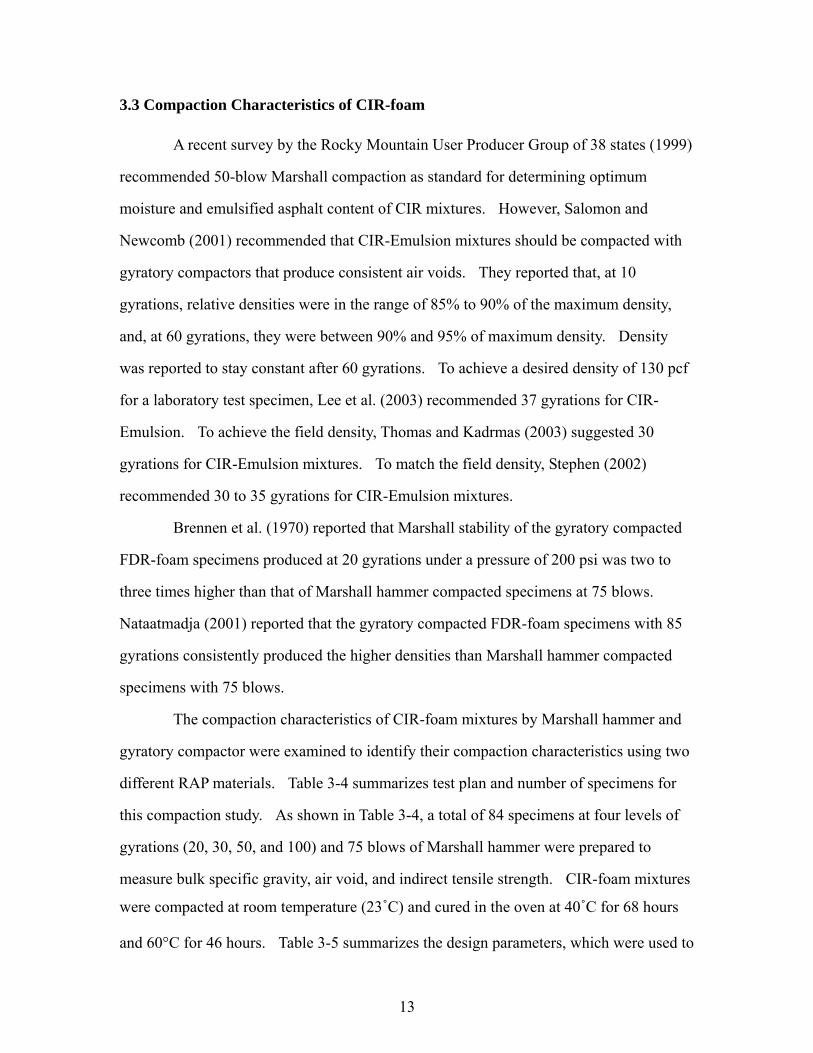
The compaction characteristics of CIR-foam mixtures by Marshall hammer and
gyratory compactor were examined to identify their compaction characteristics using two
different RAP materials. Table 3-4 summarizes test plan and number of specimens for
this compaction study. As shown in Table 3-4, a total of 84 specimens at four levels of
gyrations (20, 30, 50, and 100) and 75 blows of Marshall hammer were prepared to
measure bulk specific gravity, air void, and indirect tensile strength. CIR-foam mixtures
were compacted at room temperature (23˚C) and cured in the oven at 40˚C for 68 hours
and 60°C for 46 hours. Table 3-5 summarizes the design parameters, which were used to
14
produce CIR-foam mixtures. As shown in Table 3-5, foamed asphalt mixtures were
produced at four different foamed asphalt contents, 1.0%, 2.0%, 2.5%, and 3.0% and
water content was fixed at 4.0%.
Table 3-4. Number of specimens prepared under various compaction and curing conditions
Number of Gyration
20 Gyrations
30 Gyrations
50 Gyrations
100 Gyrations
75 Blows
Curing Temp.
FAC (%)
40°C 60°C 40°C 60°C 40°C 60°C 40°C 60°C 40°C 60°C
1.5 % 2 2 2 2 3 2 2 2 2 2
2.0 % 2 2 2 2 3 2 2 2 2 2
2.5 % 2 2 2 2 3 2 2 2 2 2
3.0 % 2 2 2 2 3 2 2 2 2 2
Table 3-5. Design parameters for the compaction study
Asphalt Binder PG 52-34
Foaming Temperature (°C) 170 °C
Foaming Water Content (%) 1.3 %
Foamed Asphalt Content (%) 1.5 %, 2.0 %. 2.5 %, and 3.0 %
Moisture Content (%) 4.0 %
Curing Condition 40˚C oven for 68 hours 60°C oven for 46 hours
3.3.1 Sample Observation
The gyratory and Marshall compacted foamed asphalt specimens were visually
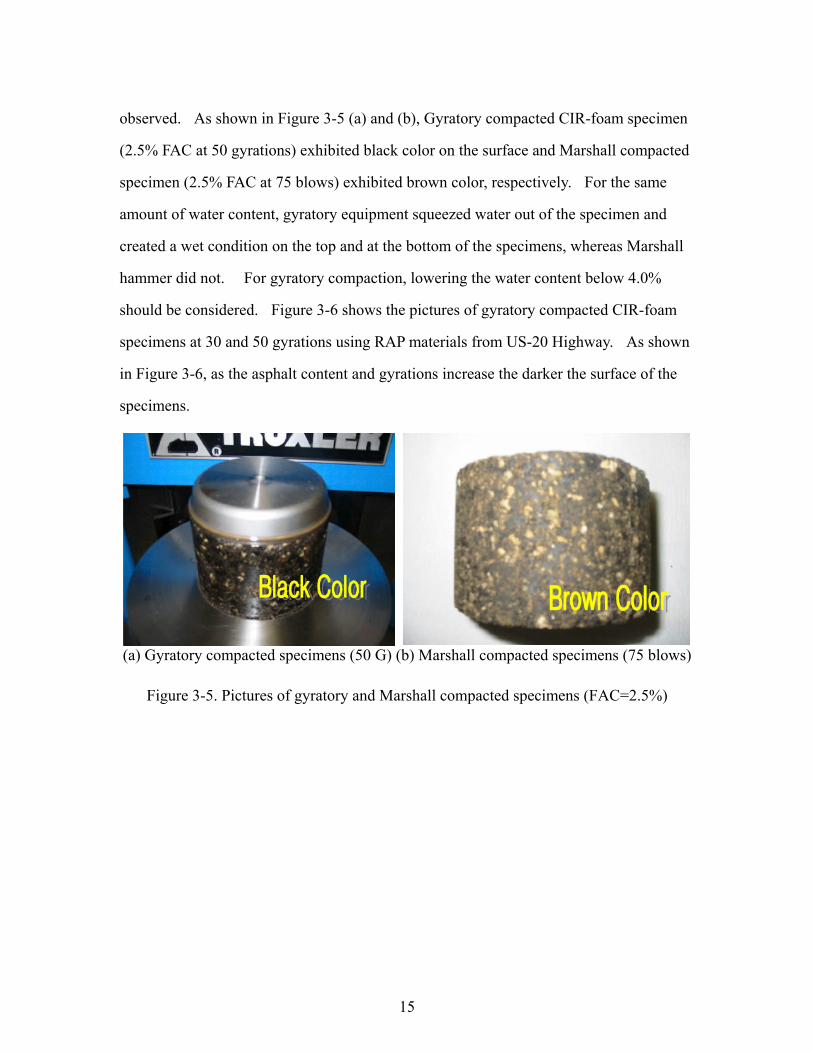
15
observed. As shown in Figure 3-5 (a) and (b), Gyratory compacted CIR-foam specimen
(2.5% FAC at 50 gyrations) exhibited black color on the surface and Marshall compacted
specimen (2.5% FAC at 75 blows) exhibited brown color, respectively. For the same
amount of water content, gyratory equipment squeezed water out of the specimen and
created a wet condition on the top and at the bottom of the specimens, whereas Marshall
hammer did not. For gyratory compaction, lowering the water content below 4.0%
should be considered. Figure 3-6 shows the pictures of gyratory compacted CIR-foam
specimens at 30 and 50 gyrations using RAP materials from US-20 Highway. As shown
in Figure 3-6, as the asphalt content and gyrations increase the darker the surface of the
specimens.
(a) Gyratory compacted specimens (50 G) (b) Marshall compacted specimens (75 blows)
Figure 3-5. Pictures of gyratory and Marshall compacted specimens (FAC=2.5%)
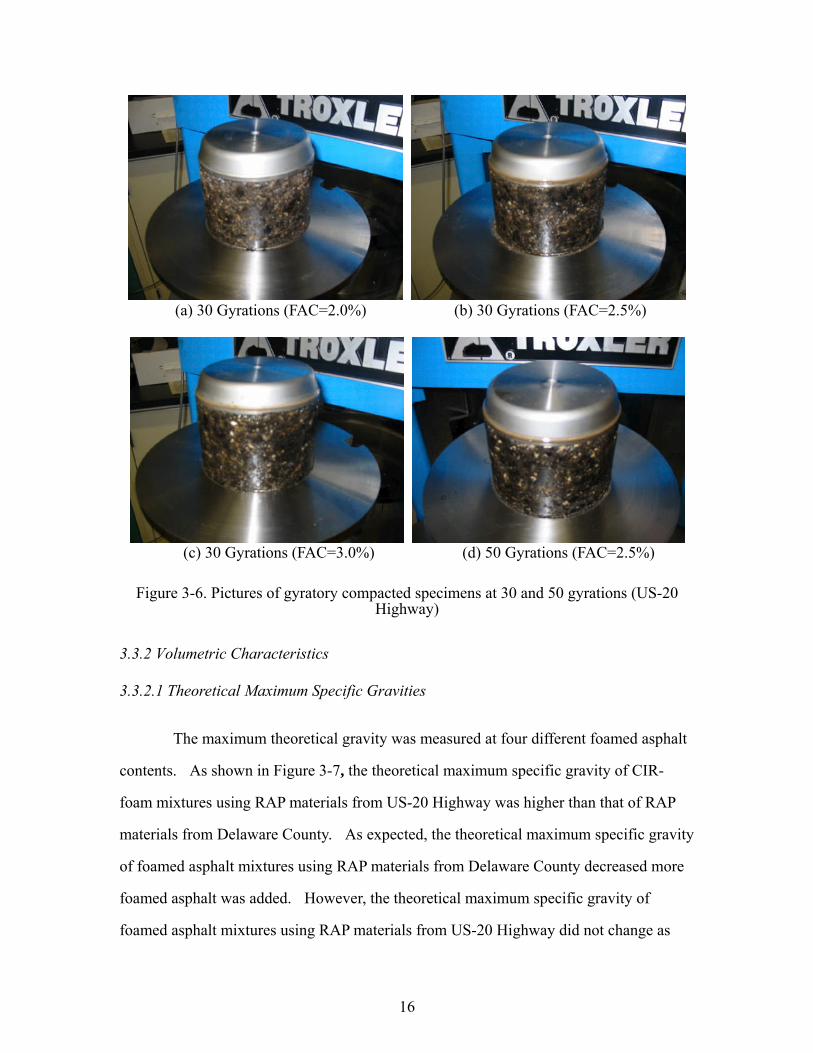
16
(a) 30 Gyrations (FAC=2.0%) (b) 30 Gyrations (FAC=2.5%)
(c) 30 Gyrations (FAC=3.0%) (d) 50 Gyrations (FAC=2.5%)
Figure 3-6. Pictures of gyratory compacted specimens at 30 and 50 gyrations (US-20 Highway)
3.3.2 Volumetric Characteristics
3.3.2.1 Theoretical Maximum Specific Gravities
The maximum theoretical gravity was measured at four different foamed asphalt
contents. As shown in Figure 3-7, the theoretical maximum specific gravity of CIR-
foam mixtures using RAP materials from US-20 Highway was higher than that of RAP
materials from Delaware County. As expected, the theoretical maximum specific gravity
of foamed asphalt mixtures using RAP materials from Delaware County decreased more
foamed asphalt was added. However, the theoretical maximum specific gravity of
foamed asphalt mixtures using RAP materials from US-20 Highway did not change as
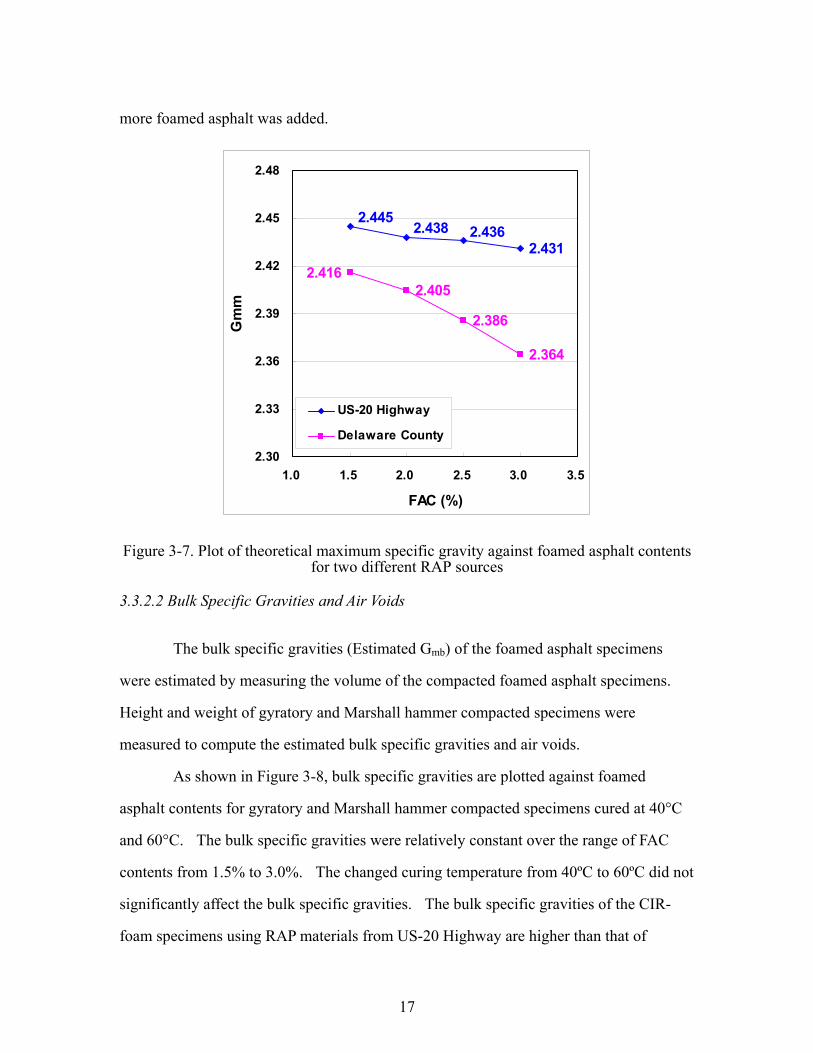
17
more foamed asphalt was added.
2.431
2.405
2.386
2.364
2.4362.4382.445
2.416
2.30
2.33
2.36
2.39
2.42
2.45
2.48
1.0 1.5 2.0 2.5 3.0 3.5
FAC (%)
Gm
m
US-20 Highway
Delaware County
Figure 3-7. Plot of theoretical maximum specific gravity against foamed asphalt contents for two different RAP sources
3.3.2.2 Bulk Specific Gravities and Air Voids
The bulk specific gravities (Estimated Gmb) of the foamed asphalt specimens
were estimated by measuring the volume of the compacted foamed asphalt specimens.
Height and weight of gyratory and Marshall hammer compacted specimens were
measured to compute the estimated bulk specific gravities and air voids.
As shown in Figure 3-8, bulk specific gravities are plotted against foamed
asphalt contents for gyratory and Marshall hammer compacted specimens cured at 40°C
and 60°C. The bulk specific gravities were relatively constant over the range of FAC
contents from 1.5% to 3.0%. The changed curing temperature from 40ºC to 60ºC did not
significantly affect the bulk specific gravities. The bulk specific gravities of the CIR-
foam specimens using RAP materials from US-20 Highway are higher than that of
18
specimens using RAP materials from Delaware County, which is the same result as the
theoretical maximum specific gravity. The equivalent bulk specific gravities of 75-blow
Marshall compacted specimens using RAP materials from US-20 Highway were achieved
at between 30 and 50 gyrations. The equivalent bulk specific gravities of 75-blow
Marshall compacted specimens using RAP materials from Delaware County were
achieved at between 20 and 30 gyrations.
As shown in Figure 3-9, air voids are plotted against foamed asphalt contents for
gyratory and Marshall hammer compacted CIR-foam specimens cured at 40°C and 60°C.
As expected, air voids of the CIR-foam specimens using RAP materials collected from
Delaware County decreased as the foamed asphalt content increased. However, air voids
of the CIR-foam specimens using RAP materials collected from US-20 Highway stayed
relatively constant as the foamed asphalt content increased. Air voids of the foamed
asphalt specimens using RAP materials collected from US-20 highway were between
7.5% at 50 gyrations and 12.8% at 20 gyrations whereas air voids of the foamed asphalt
specimens using RAP materials collected from Delaware County were between 8.8% at
50 gyrations and 16.4% at 20 gyrations. For Marshall compacted foamed asphalt
specimens at 75 blows, air voids ranged from 9.5% to 10.8% for RAP materials collected
from US-20 Highway and air voids ranged from 12.0% to 15.4% for RAP materials
collected from Delaware County.

19
1.98
2.02
2.06
2.10
2.14
2.18
2.22
2.26
2.30
1.0 1.5 2.0 2.5 3.0 3.5
FAC (%)
Gm
b
20 Gyrations (Curing Temp. 40 °C)30 Gyrations (Curing Temp. 40 °C)50 Gyrations (Curing Temp. 40 °C)
100 Gyrations (Curing Temp. 40 °C)75 Blows (Curing Temp. 40 °C)
US-20 Highway
1.98
2.02
2.06
2.10
2.14
2.18
2.22
2.26
2.30
1.0 1.5 2.0 2.5 3.0 3.5
FAC (%)
Gm
b
20 Gyrations (Curing Temp. 60 °C)
30 Gyrations (Curing Temp. 60 °C)
50 Gyrations (Curing Temp. 60 °C)
100 Gyrations (Curing Temp. 60 °C)
75 Blows (Curing Temp. 60 °C)
US-20 Highway
1.98
2.02
2.06
2.10
2.14
2.18
2.22
2.26
2.30
1.0 1.5 2.0 2.5 3.0 3.5
FAC (%)
Gm
b
20 Gyrations (Curing Temp. 40 °C)30 Gyrations (Curing Temp. 40 °C)50 Gyrations (Curing Temp. 40 °C)100 Gyrations (Curing Temp. 40 °C)75 Blows (Curing Temp. 40 °C)
Delaware County
1.98
2.02
2.06
2.10
2.14
2.18
2.22
2.26
2.30
1.0 1.5 2.0 2.5 3.0 3.5
FAC (%)
Gm
b
20 Gyrations (Curing Temp. 60 °C)30 Gyrations (Curing Temp. 60 °C)50 Gyrations (Curing Temp. 60 °C)100 Gyrations (Curing Temp. 60 °C)75 Blows (Curing Temp. 60 °C)
Delaware County
(a) Curing temperature: 40°C (b) Curing temperature: 60°C
Figure 3-8. Plots of Gmb against FAC at five different levels of compaction
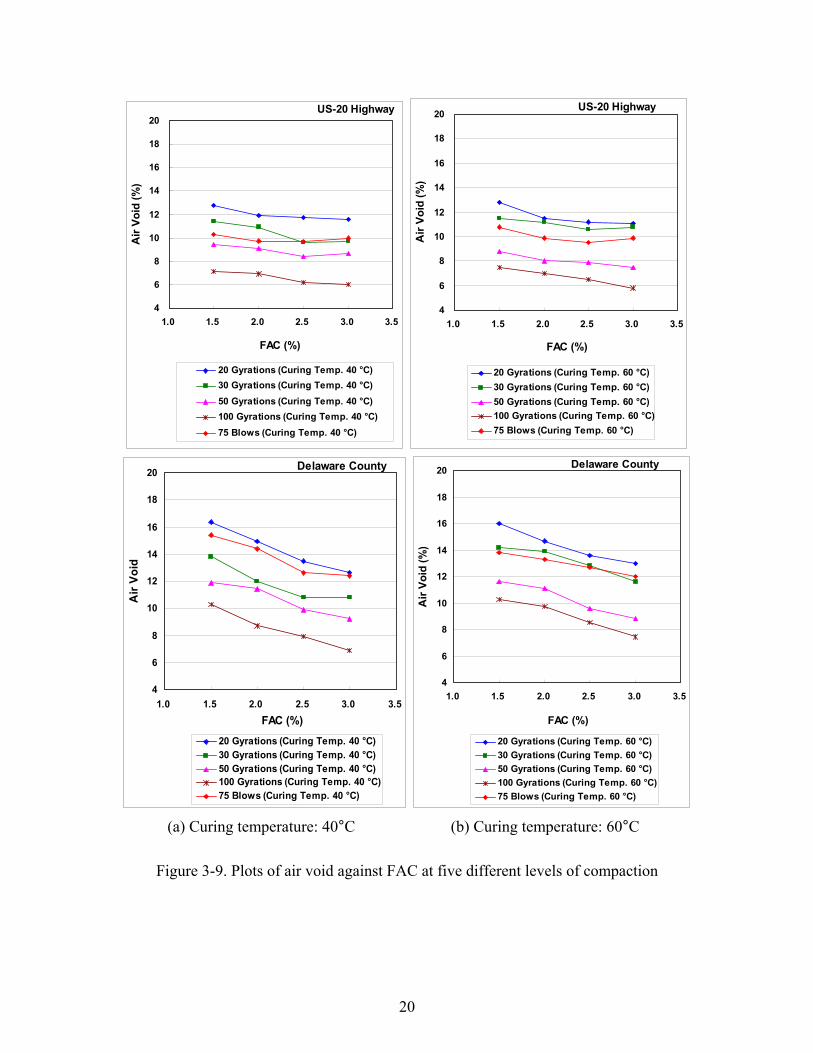
20
4
6
8
10
12
14
16
18
20
1.0 1.5 2.0 2.5 3.0 3.5
FAC (%)
Air
Void
(%)
20 Gyrations (Curing Temp. 40 °C)30 Gyrations (Curing Temp. 40 °C)50 Gyrations (Curing Temp. 40 °C)100 Gyrations (Curing Temp. 40 °C)75 Blows (Curing Temp. 40 °C)
US-20 Highway
4
6
8
10
12
14
16
18
20
1.0 1.5 2.0 2.5 3.0 3.5
FAC (%)
Air
Void
(%)
20 Gyrations (Curing Temp. 60 °C)30 Gyrations (Curing Temp. 60 °C)50 Gyrations (Curing Temp. 60 °C)100 Gyrations (Curing Temp. 60 °C)75 Blows (Curing Temp. 60 °C)
US-20 Highway
4
6
8
10
12
14
16
18
20
1.0 1.5 2.0 2.5 3.0 3.5FAC (%)
Air
Void
20 Gyrations (Curing Temp. 40 °C)30 Gyrations (Curing Temp. 40 °C)50 Gyrations (Curing Temp. 40 °C)100 Gyrations (Curing Temp. 40 °C)75 Blows (Curing Temp. 40 °C)
Delaware County
4
6
8
10
12
14
16
18
20
1.0 1.5 2.0 2.5 3.0 3.5
FAC (%)
Air
Void
(%)
20 Gyrations (Curing Temp. 60 °C)30 Gyrations (Curing Temp. 60 °C)50 Gyrations (Curing Temp. 60 °C)100 Gyrations (Curing Temp. 60 °C)75 Blows (Curing Temp. 60 °C)
Delaware County
(a) Curing temperature: 40°C (b) Curing temperature: 60°C
Figure 3-9. Plots of air void against FAC at five different levels of compaction

21
3.3.3 Wet Indirect Tensile Strength Test
3.3.3.1 Wet Conditioning of ITS Test
To avoid damaging foamed asphalt specimens by over-vacuuming, the optimum
vacuuming duration was determined for wet conditioning. As shown in Table 3-6, three
different levels of vacuum procedure were tested to determine the optimum vacuuming
duration.
• Procedure A of applying 20 mmHg vacuum for 50 minutes.
• Procedure B: Bubbling stopped after 30 minutes of vacuum saturation at 20
mmHg.
• Procedure C: Bubbling stopped after 30 minutes of vacuum saturation at 25
mmHg. Additional 20 minutes of vacuum at 25 mmHg were applied to the
specimen (no bubbling). When vacuum level was increased from 25 to 20
mmHg bubbling started again for 20 minutes.
• Procedure D: Bubbling stopped after 20 minutes of vacuum saturation at 30
mmHg. Additional 30 minutes of vacuum at 30 mmHg were applied to the
specimen (no bubbling). When vacuum level was increased from 30 to 20
mmHg bubbling started again for 20 minutes.
Based on the experiment, procedure B (30 min at 20 mmHg) was chosen as the
optimum vacuuming level and duration for producing “wet” specimens.
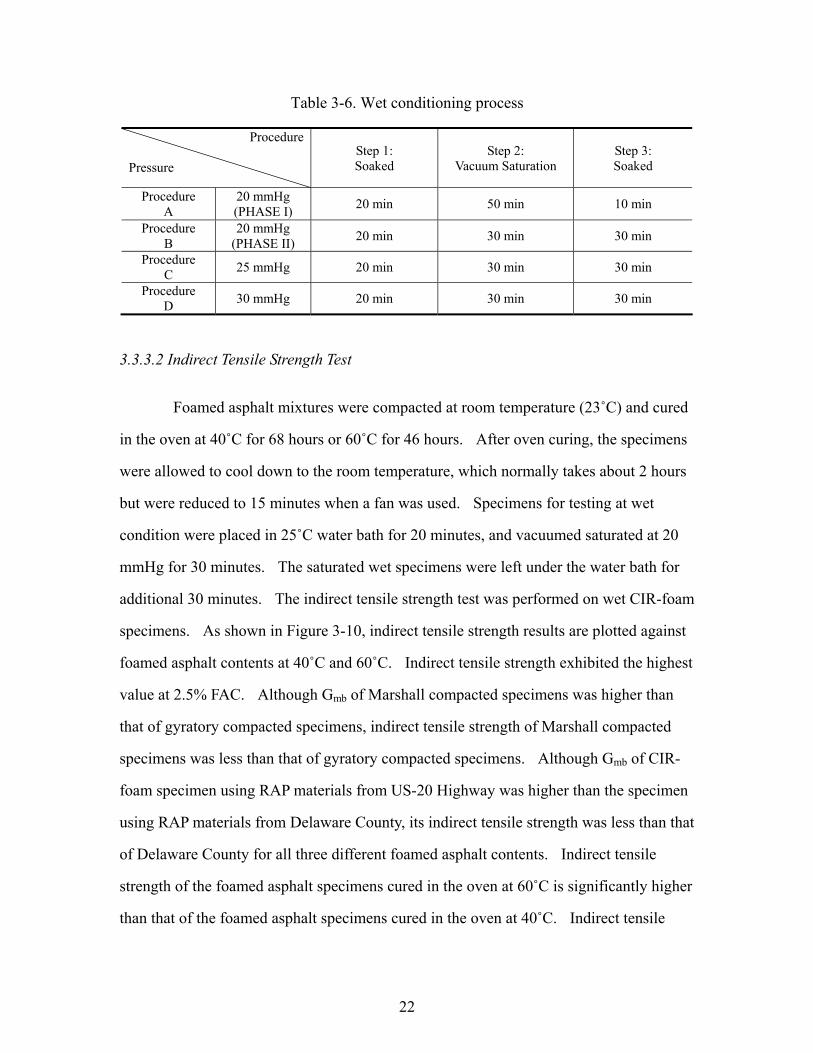
22
Table 3-6. Wet conditioning process
Procedure
Pressure Step 1: Soaked
Step 2: Vacuum Saturation
Step 3: Soaked
Procedure A
20 mmHg (PHASE I) 20 min 50 min 10 min
Procedure B
20 mmHg (PHASE II) 20 min 30 min 30 min
Procedure C 25 mmHg 20 min 30 min 30 min
Procedure D 30 mmHg 20 min 30 min 30 min
3.3.3.2 Indirect Tensile Strength Test
Foamed asphalt mixtures were compacted at room temperature (23˚C) and cured
in the oven at 40˚C for 68 hours or 60˚C for 46 hours. After oven curing, the specimens
were allowed to cool down to the room temperature, which normally takes about 2 hours
but were reduced to 15 minutes when a fan was used. Specimens for testing at wet
condition were placed in 25˚C water bath for 20 minutes, and vacuumed saturated at 20
mmHg for 30 minutes. The saturated wet specimens were left under the water bath for
additional 30 minutes. The indirect tensile strength test was performed on wet CIR-foam
specimens. As shown in Figure 3-10, indirect tensile strength results are plotted against
foamed asphalt contents at 40˚C and 60˚C. Indirect tensile strength exhibited the highest
value at 2.5% FAC. Although Gmb of Marshall compacted specimens was higher than
that of gyratory compacted specimens, indirect tensile strength of Marshall compacted
specimens was less than that of gyratory compacted specimens. Although Gmb of CIR-
foam specimen using RAP materials from US-20 Highway was higher than the specimen
using RAP materials from Delaware County, its indirect tensile strength was less than that
of Delaware County for all three different foamed asphalt contents. Indirect tensile
strength of the foamed asphalt specimens cured in the oven at 60˚C is significantly higher
than that of the foamed asphalt specimens cured in the oven at 40˚C. Indirect tensile
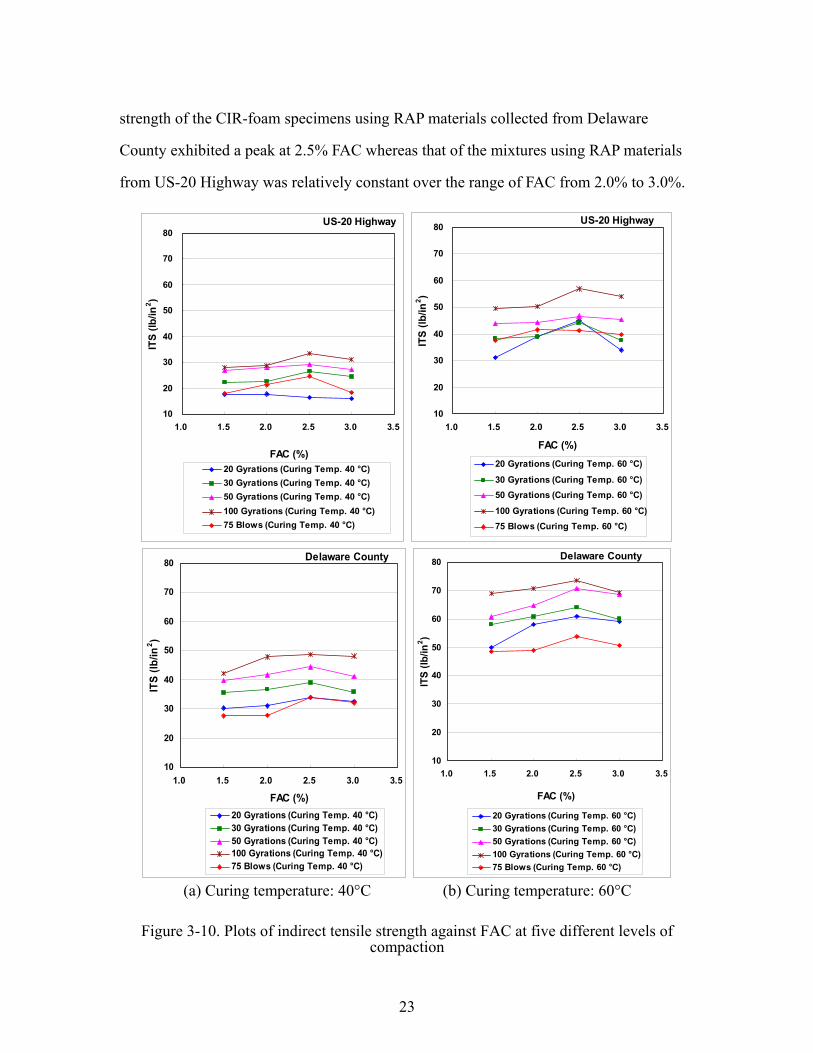
23
strength of the CIR-foam specimens using RAP materials collected from Delaware
County exhibited a peak at 2.5% FAC whereas that of the mixtures using RAP materials
from US-20 Highway was relatively constant over the range of FAC from 2.0% to 3.0%.
10
20
30
40
50
60
70
80
1.0 1.5 2.0 2.5 3.0 3.5
FAC (%)
ITS
(lb/in
2 )
20 Gyrations (Curing Temp. 40 °C)30 Gyrations (Curing Temp. 40 °C)50 Gyrations (Curing Temp. 40 °C)100 Gyrations (Curing Temp. 40 °C)75 Blows (Curing Temp. 40 °C)
US-20 Highway
10
20
30
40
50
60
70
80
1.0 1.5 2.0 2.5 3.0 3.5
FAC (%)
ITS
(lb/in
2 )
20 Gyrations (Curing Temp. 60 °C)
30 Gyrations (Curing Temp. 60 °C)50 Gyrations (Curing Temp. 60 °C)
100 Gyrations (Curing Temp. 60 °C)75 Blows (Curing Temp. 60 °C)
US-20 Highway
10
20
30
40
50
60
70
80
1.0 1.5 2.0 2.5 3.0 3.5
FAC (%)
ITS
(lb/in
2 )
20 Gyrations (Curing Temp. 40 °C)30 Gyrations (Curing Temp. 40 °C)50 Gyrations (Curing Temp. 40 °C)100 Gyrations (Curing Temp. 40 °C)75 Blows (Curing Temp. 40 °C)
Delaware County
10
20
30
40
50
60
70
80
1.0 1.5 2.0 2.5 3.0 3.5
FAC (%)
ITS
(lb/in
2 )
20 Gyrations (Curing Temp. 60 °C)30 Gyrations (Curing Temp. 60 °C)50 Gyrations (Curing Temp. 60 °C)100 Gyrations (Curing Temp. 60 °C)75 Blows (Curing Temp. 60 °C)
Delaware County
(a) Curing temperature: 40°C (b) Curing temperature: 60°C
Figure 3-10. Plots of indirect tensile strength against FAC at five different levels of compaction
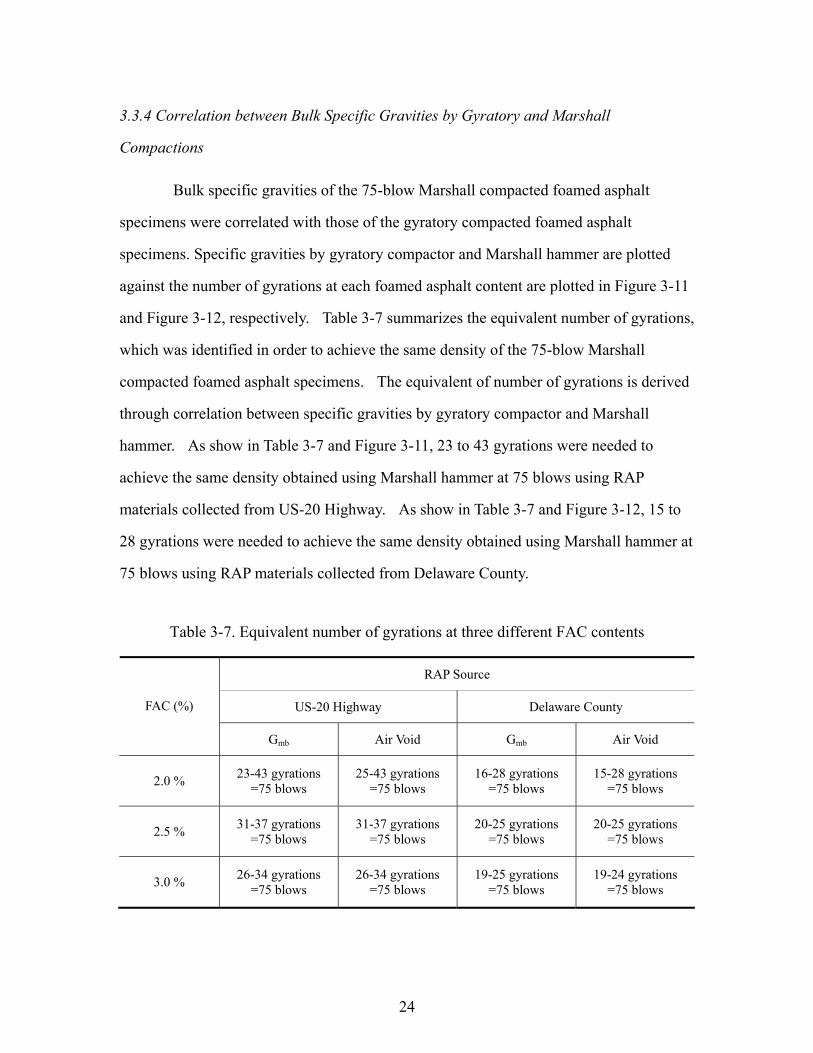
24
3.3.4 Correlation between Bulk Specific Gravities by Gyratory and Marshall
Compactions
Bulk specific gravities of the 75-blow Marshall compacted foamed asphalt
specimens were correlated with those of the gyratory compacted foamed asphalt
specimens. Specific gravities by gyratory compactor and Marshall hammer are plotted
against the number of gyrations at each foamed asphalt content are plotted in Figure 3-11
and Figure 3-12, respectively. Table 3-7 summarizes the equivalent number of gyrations,
which was identified in order to achieve the same density of the 75-blow Marshall
compacted foamed asphalt specimens. The equivalent of number of gyrations is derived
through correlation between specific gravities by gyratory compactor and Marshall
hammer. As show in Table 3-7 and Figure 3-11, 23 to 43 gyrations were needed to
achieve the same density obtained using Marshall hammer at 75 blows using RAP
materials collected from US-20 Highway. As show in Table 3-7 and Figure 3-12, 15 to
28 gyrations were needed to achieve the same density obtained using Marshall hammer at
75 blows using RAP materials collected from Delaware County.
Table 3-7. Equivalent number of gyrations at three different FAC contents
RAP Source
US-20 Highway Delaware County FAC (%)
Gmb Air Void Gmb Air Void
2.0 % 23-43 gyrations =75 blows
25-43 gyrations =75 blows
16-28 gyrations =75 blows
15-28 gyrations =75 blows
2.5 % 31-37 gyrations =75 blows
31-37 gyrations =75 blows
20-25 gyrations =75 blows
20-25 gyrations =75 blows
3.0 % 26-34 gyrations =75 blows
26-34 gyrations =75 blows
19-25 gyrations =75 blows
19-24 gyrations =75 blows
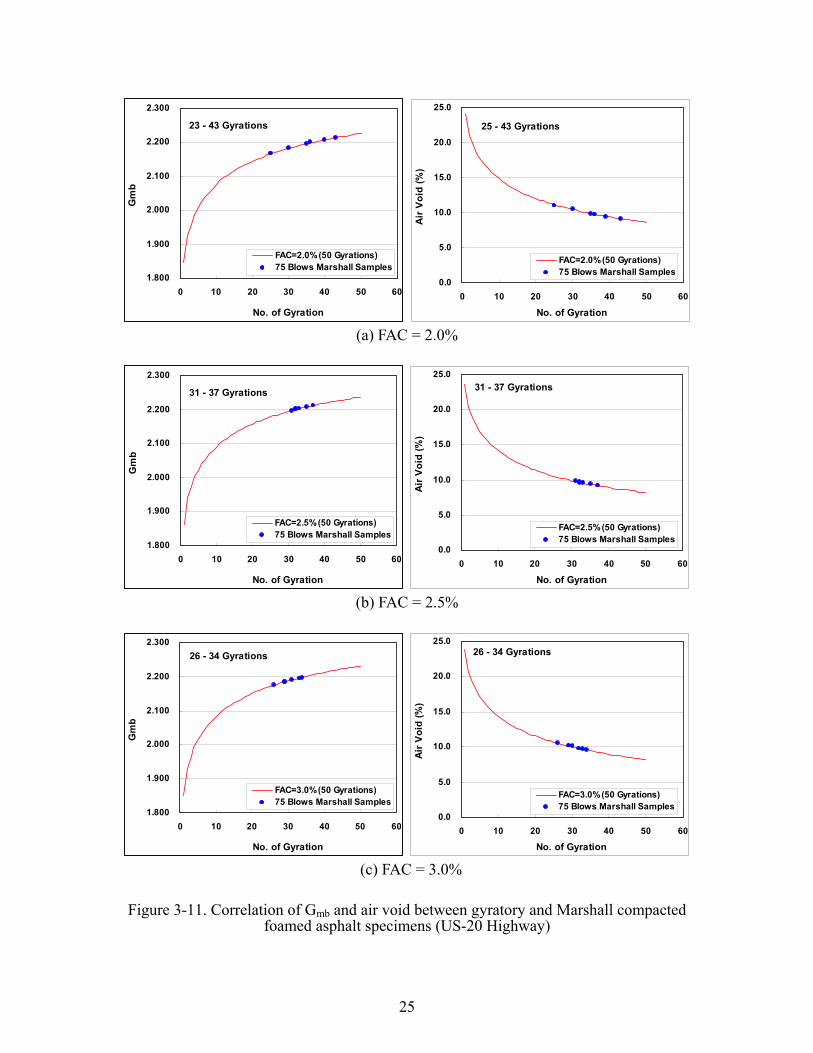
25
1.800
1.900
2.000
2.100
2.200
2.300
0 10 20 30 40 50 60
No. of Gyration
Gm
b
FAC=2.0% (50 Gyrations)75 Blows Marshall Samples
23 - 43 Gyrations
0.0
5.0
10.0
15.0
20.0
25.0
0 10 20 30 40 50 60
No. of Gyration
Air V
oid
(%)
FAC=2.0% (50 Gyrations)75 Blows Marshall Samples
25 - 43 Gyrations
(a) FAC = 2.0%
1.800
1.900
2.000
2.100
2.200
2.300
0 10 20 30 40 50 60
No. of Gyration
Gm
b
FAC=2.5% (50 Gyrations)75 Blows Marshall Samples
31 - 37 Gyrations
0.0
5.0
10.0
15.0
20.0
25.0
0 10 20 30 40 50 60
No. of Gyration
Air
Voi
d (%
)
FAC=2.5% (50 Gyrations)75 Blows Marshall Samples
31 - 37 Gyrations
(b) FAC = 2.5%
1.800
1.900
2.000
2.100
2.200
2.300
0 10 20 30 40 50 60
No. of Gyration
Gm
b
FAC=3.0% (50 Gyrations)75 Blows Marshall Samples
26 - 34 Gyrations
0.0
5.0
10.0
15.0
20.0
25.0
0 10 20 30 40 50 60
No. of Gyration
Air
Voi
d (%
)
FAC=3.0% (50 Gyrations)75 Blows Marshall Samples
26 - 34 Gyrations
(c) FAC = 3.0%
Figure 3-11. Correlation of Gmb and air void between gyratory and Marshall compacted foamed asphalt specimens (US-20 Highway)
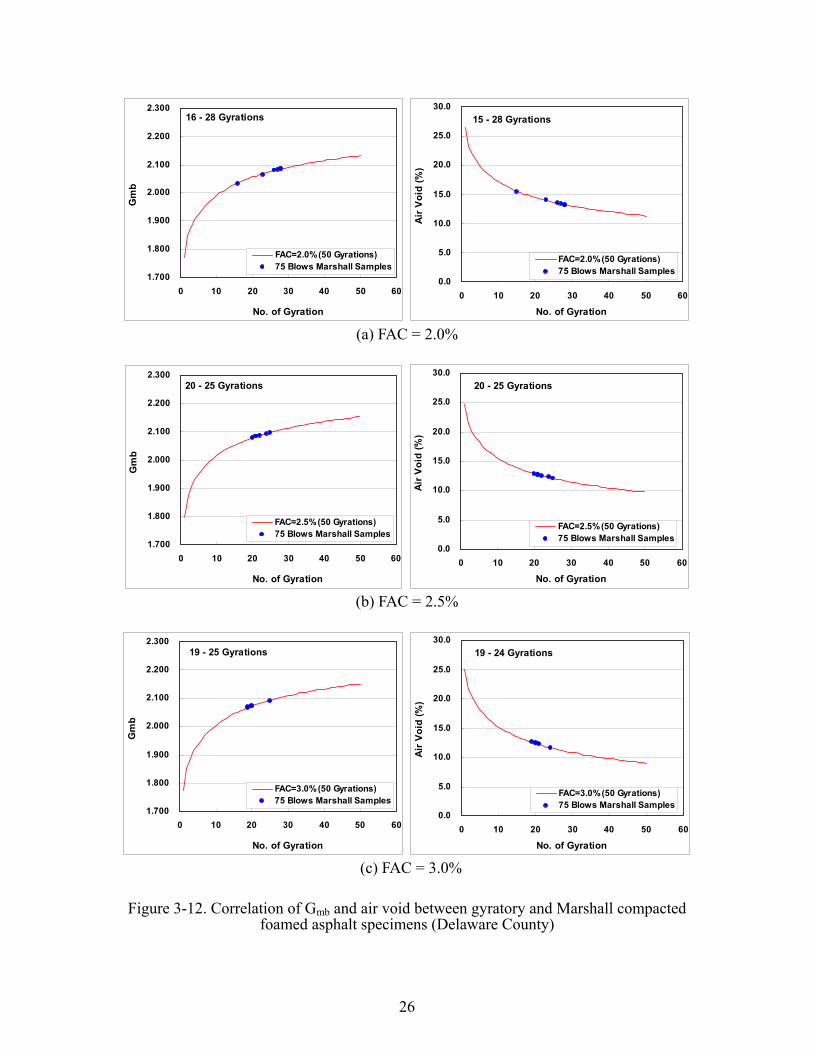
26
1.700
1.800
1.900
2.000
2.100
2.200
2.300
0 10 20 30 40 50 60
No. of Gyration
Gm
b
FAC=2.0% (50 Gyrations)75 Blows Marshall Samples
16 - 28 Gyrations
0.0
5.0
10.0
15.0
20.0
25.0
30.0
0 10 20 30 40 50 60
No. of Gyration
Air V
oid
(%)
FAC=2.0% (50 Gyrations)75 Blows Marshall Samples
15 - 28 Gyrations
(a) FAC = 2.0%
1.700
1.800
1.900
2.000
2.100
2.200
2.300
0 10 20 30 40 50 60
No. of Gyration
Gm
b
FAC=2.5% (50 Gyrations)75 Blows Marshall Samples
20 - 25 Gyrations
0.0
5.0
10.0
15.0
20.0
25.0
30.0
0 10 20 30 40 50 60
No. of Gyration
Air V
oid
(%)
FAC=2.5% (50 Gyrations)75 Blows Marshall Samples
20 - 25 Gyrations
(b) FAC = 2.5%
1.700
1.800
1.900
2.000
2.100
2.200
2.300
0 10 20 30 40 50 60
No. of Gyration
Gm
b
FAC=3.0% (50 Gyrations)75 Blows Marshall Samples
19 - 25 Gyrations
0.0
5.0
10.0
15.0
20.0
25.0
30.0
0 10 20 30 40 50 60
No. of Gyration
Air
Void
(%)
FAC=3.0% (50 Gyrations)75 Blows Marshall Samples
19 - 24 Gyrations
(c) FAC = 3.0%
Figure 3-12. Correlation of Gmb and air void between gyratory and Marshall compacted foamed asphalt specimens (Delaware County)
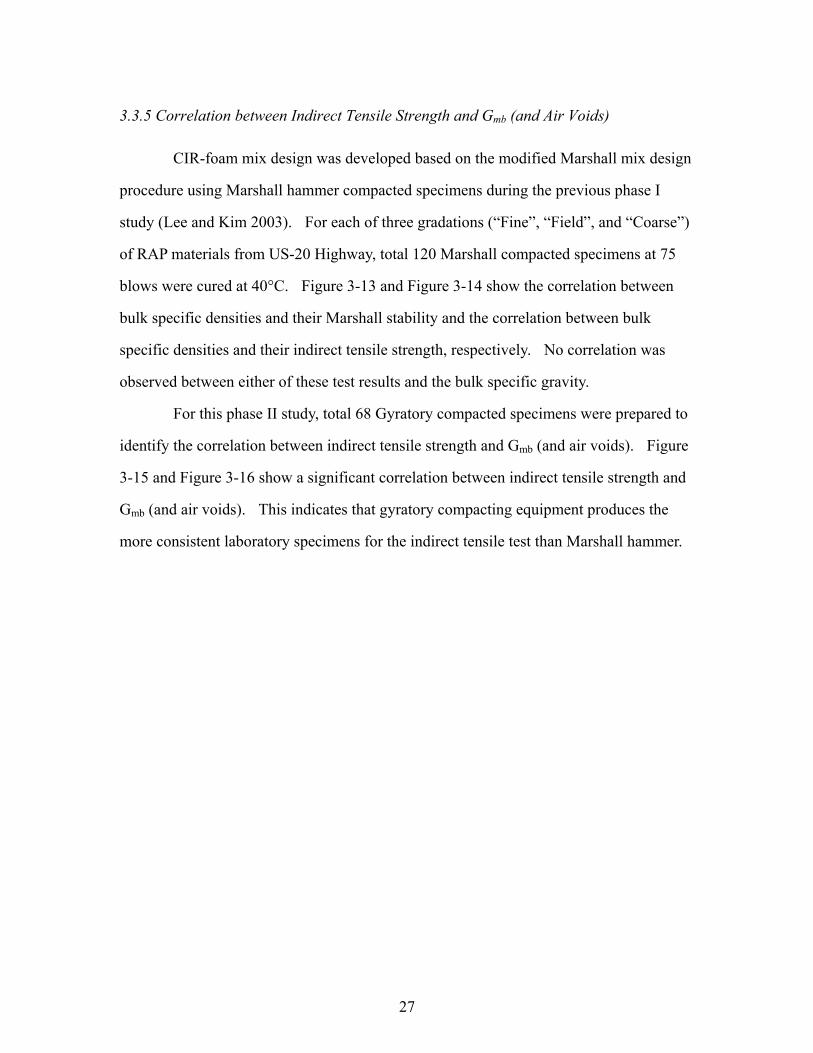
27
3.3.5 Correlation between Indirect Tensile Strength and Gmb (and Air Voids)
CIR-foam mix design was developed based on the modified Marshall mix design
procedure using Marshall hammer compacted specimens during the previous phase I
study (Lee and Kim 2003). For each of three gradations (“Fine”, “Field”, and “Coarse”)
of RAP materials from US-20 Highway, total 120 Marshall compacted specimens at 75
blows were cured at 40°C. Figure 3-13 and Figure 3-14 show the correlation between
bulk specific densities and their Marshall stability and the correlation between bulk
specific densities and their indirect tensile strength, respectively. No correlation was
observed between either of these test results and the bulk specific gravity.
For this phase II study, total 68 Gyratory compacted specimens were prepared to
identify the correlation between indirect tensile strength and Gmb (and air voids). Figure
3-15 and Figure 3-16 show a significant correlation between indirect tensile strength and
Gmb (and air voids). This indicates that gyratory compacting equipment produces the
more consistent laboratory specimens for the indirect tensile test than Marshall hammer.
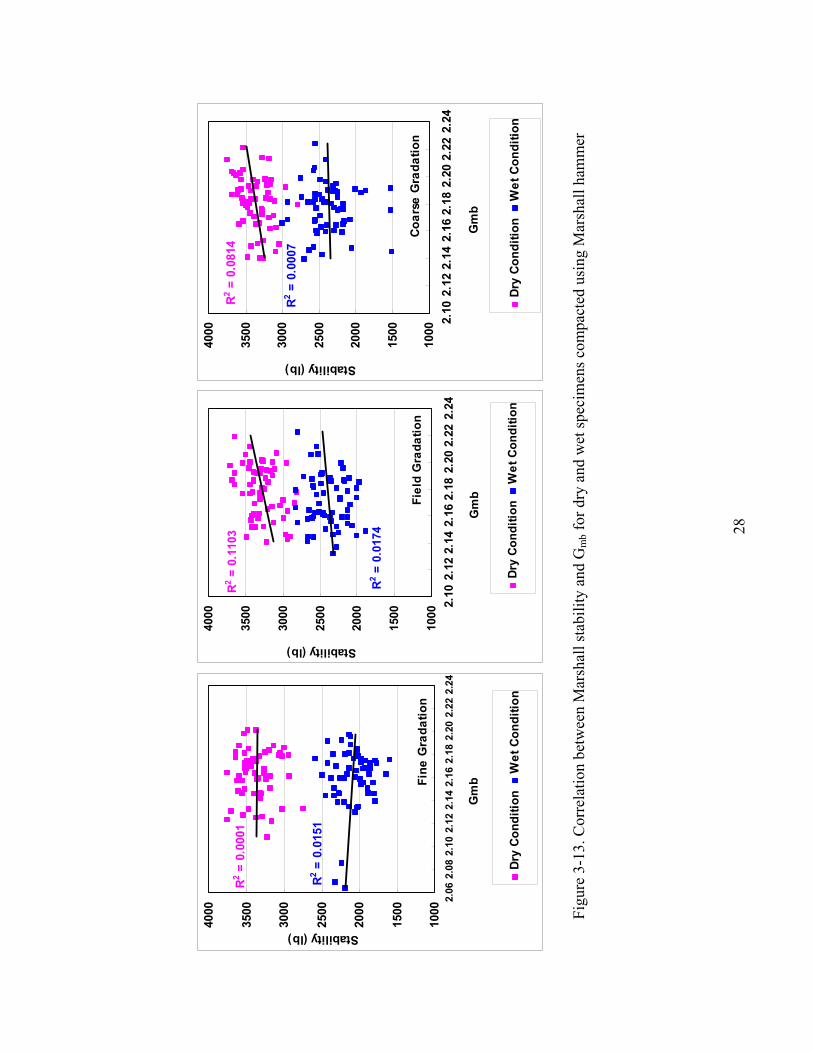
28
R2 = 0
.015
1
R2 = 0
.000
1
1000
1500
2000
2500
3000
3500
4000
2.06
2.08
2.10
2.12
2.14
2.16
2.18
2.20
2.22
2.24
Gm
b
Stability (lb)
Dry
Cond
ition
Wet
Con
ditio
n
Fine
Gra
datio
n
R2 = 0
.017
4
R2 = 0
.110
3
1000
1500
2000
2500
3000
3500
4000
2.10
2.12
2.14
2.16
2.18
2.20
2.22
2.24
Gm
b
Stability (lb)
Dry
Cond
ition
Wet
Con
ditio
n
Fiel
d G
rada
tion
R2 = 0
.000
7
R2 = 0
.081
4
1000
1500
2000
2500
3000
3500
4000
2.10
2.12
2.14
2.16
2.18
2.20
2.22
2.24
Gm
b
Stability (lb)
Dry
Cond
ition
Wet
Con
ditio
n
Coar
se G
rada
tion
Figu
re 3
-13.
Cor
rela
tion
betw
een
Mar
shal
l sta
bilit
y an
d G
mb f
or d
ry a
nd w
et sp
ecim
ens c
ompa
cted
usi
ng M
arsh
all h
amm
er
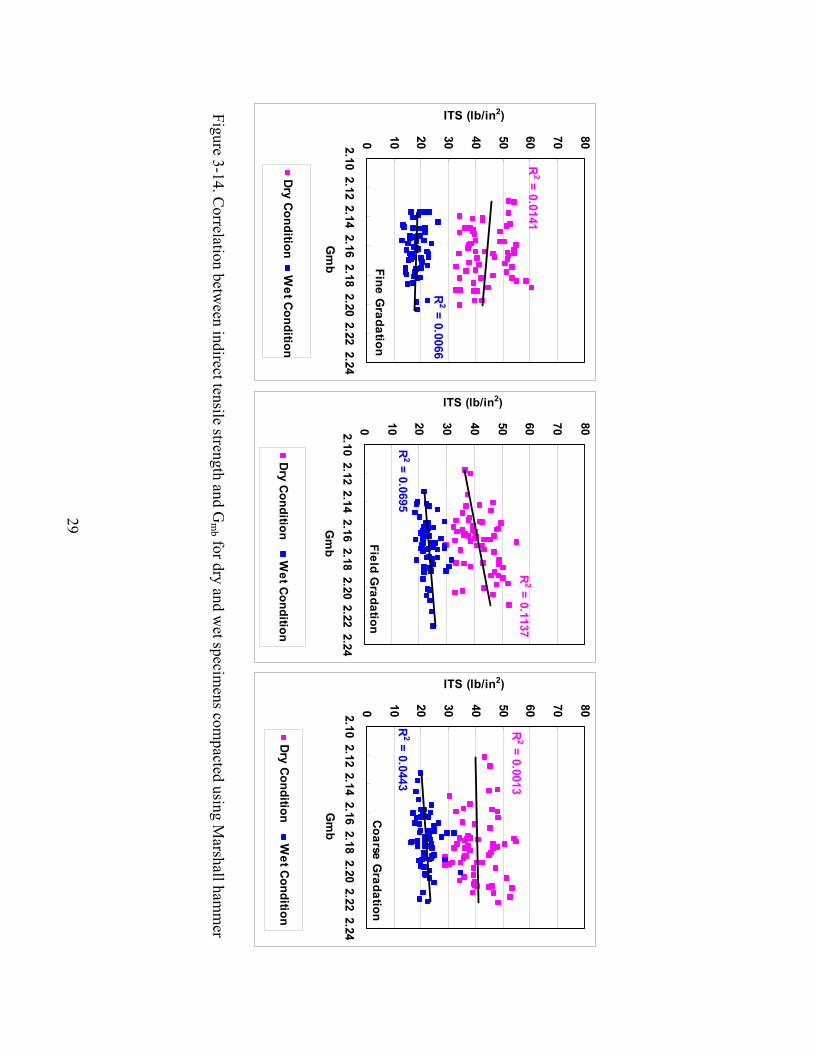
29
R2 = 0.0066
R2 = 0.0141
0 10 20 30 40 50 60 70 802.102.12
2.142.16
2.182.20
2.222.24
Gm
b
ITS (lb/in2)
Dry Condition
Wet C
ondition
Fine Gradation
R2 = 0.0695
R2 = 0.1137
0 10 20 30 40 50 60 70 802.102.12
2.142.16
2.182.20
2.222.24
Gm
b
ITS (lb/in2)
Dry C
ondition W
et Condition
Field Gradation
R2 = 0.0013
R2 = 0.0443
0 10 20 30 40 50 60 70 802.102.12
2.142.16
2.182.20
2.222.24
Gm
b
ITS (lb/in2)
Dry Condition W
et Condition
Coarse Gradation
Figure 3-14. Correlation betw
een indirect tensile strength and Gm
b for dry and wet specim
ens compacted using M
arshall hamm
er
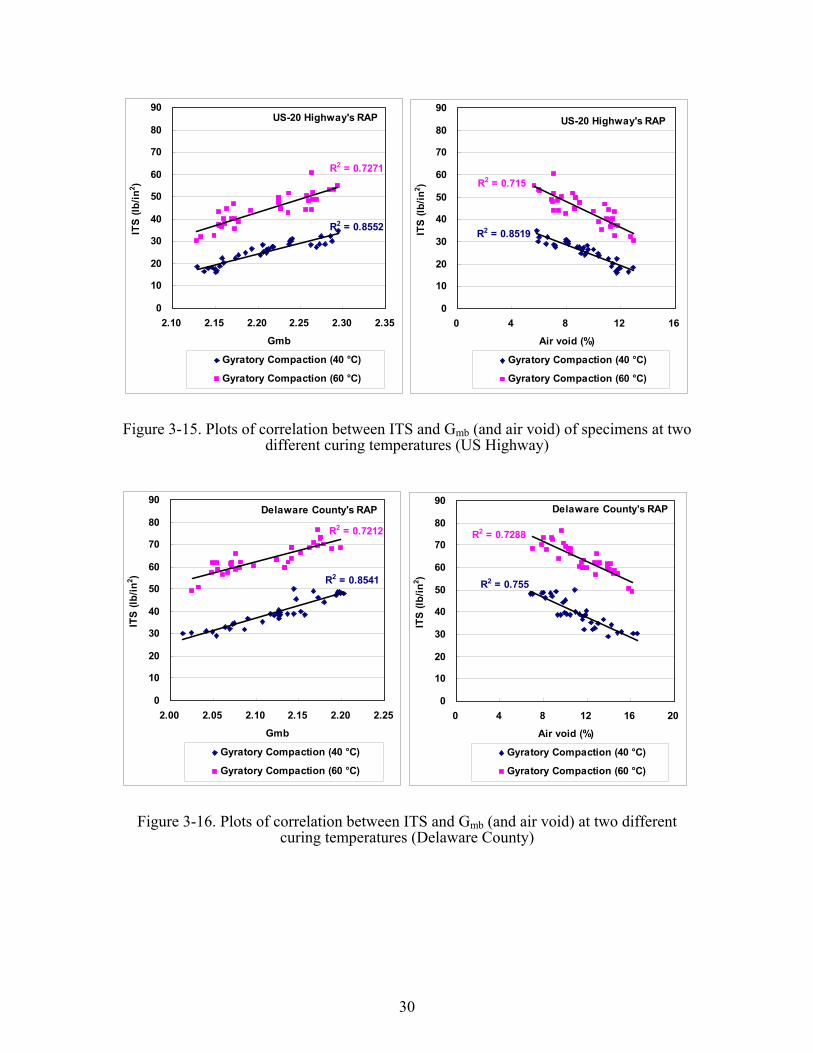
30
R2 = 0.7271
R2 = 0.8552
0
10
20
30
40
50
60
70
80
90
2.10 2.15 2.20 2.25 2.30 2.35
Gmb
ITS
(lb/
in2 )
Gyratory Compaction (40 °C)
Gyratory Compaction (60 °C)
US-20 Highway's RAP
R2 = 0.715
R2 = 0.8519
0
10
20
30
40
50
60
70
80
90
0 4 8 12 16
Air void (%)
ITS
(lb/
in2 )
Gyratory Compaction (40 °C)
Gyratory Compaction (60 °C)
US-20 Highway's RAP
Figure 3-15. Plots of correlation between ITS and Gmb (and air void) of specimens at two different curing temperatures (US Highway)
R2 = 0.7212
R2 = 0.8541
0
10
20
30
40
50
60
70
80
90
2.00 2.05 2.10 2.15 2.20 2.25
Gmb
ITS
(lb/
in2 )
Gyratory Compaction (40 °C)
Gyratory Compaction (60 °C)
Delaware County's RAP
R2 = 0.7288
R2 = 0.755
0
10
20
30
40
50
60
70
80
90
0 4 8 12 16 20
Air void (%)
ITS
(lb/in
2 )
Gyratory Compaction (40 °C)
Gyratory Compaction (60 °C)
Delaware County's RAP
Figure 3-16. Plots of correlation between ITS and Gmb (and air void) at two different curing temperatures (Delaware County)
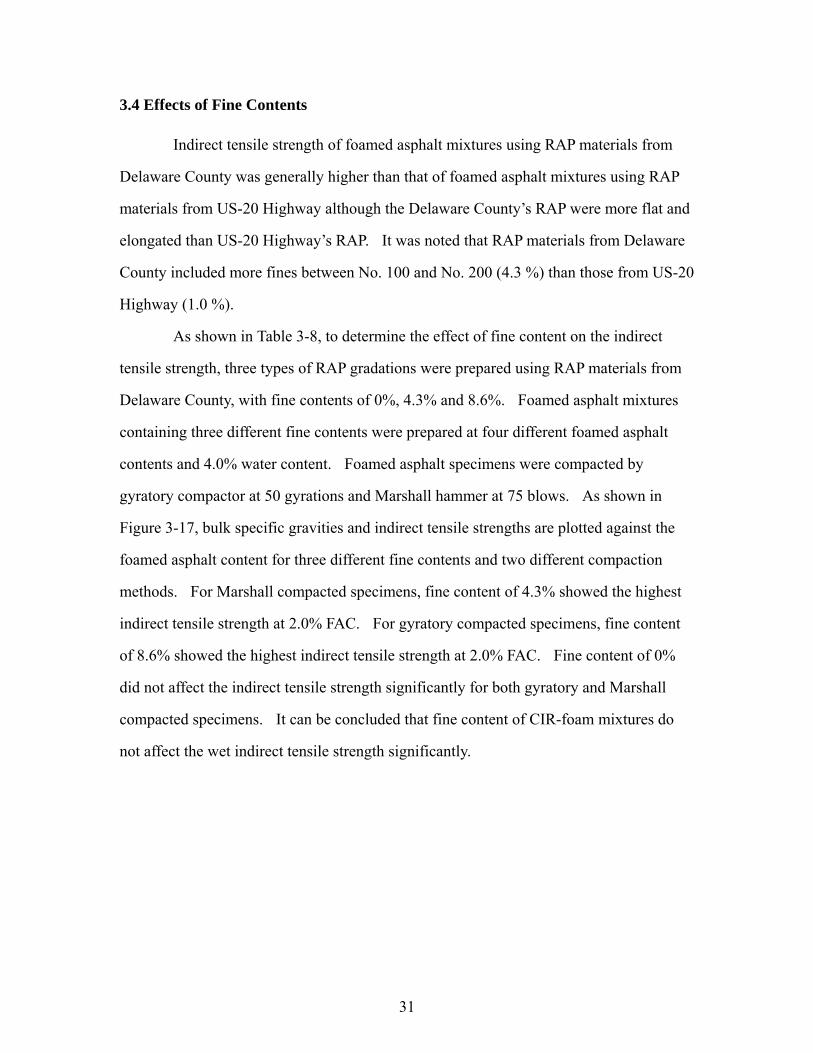
31
3.4 Effects of Fine Contents
Indirect tensile strength of foamed asphalt mixtures using RAP materials from
Delaware County was generally higher than that of foamed asphalt mixtures using RAP
materials from US-20 Highway although the Delaware County’s RAP were more flat and
elongated than US-20 Highway’s RAP. It was noted that RAP materials from Delaware
County included more fines between No. 100 and No. 200 (4.3 %) than those from US-20
Highway (1.0 %).
As shown in Table 3-8, to determine the effect of fine content on the indirect
tensile strength, three types of RAP gradations were prepared using RAP materials from
Delaware County, with fine contents of 0%, 4.3% and 8.6%. Foamed asphalt mixtures
containing three different fine contents were prepared at four different foamed asphalt
contents and 4.0% water content. Foamed asphalt specimens were compacted by
gyratory compactor at 50 gyrations and Marshall hammer at 75 blows. As shown in
Figure 3-17, bulk specific gravities and indirect tensile strengths are plotted against the
foamed asphalt content for three different fine contents and two different compaction
methods. For Marshall compacted specimens, fine content of 4.3% showed the highest
indirect tensile strength at 2.0% FAC. For gyratory compacted specimens, fine content
of 8.6% showed the highest indirect tensile strength at 2.0% FAC. Fine content of 0%
did not affect the indirect tensile strength significantly for both gyratory and Marshall
compacted specimens. It can be concluded that fine content of CIR-foam mixtures do
not affect the wet indirect tensile strength significantly.
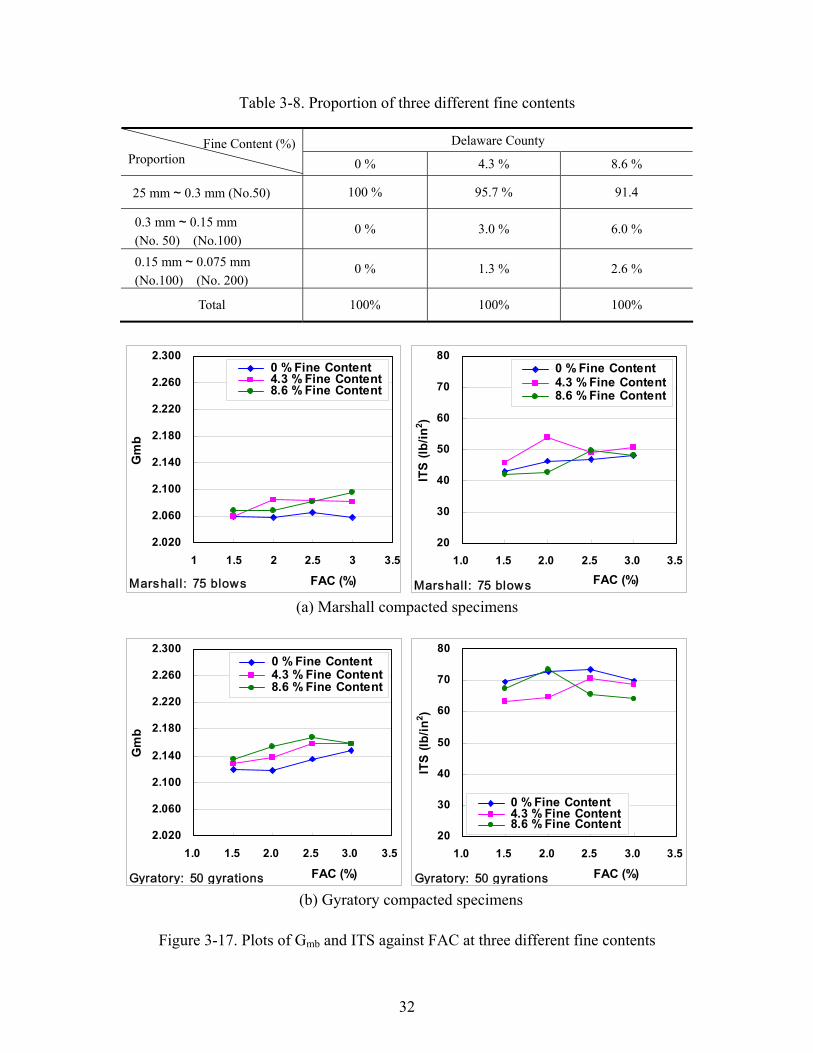
32
Table 3-8. Proportion of three different fine contents
Delaware County Fine Content (%) Proportion 0 % 4.3 % 8.6 %
25 mm ~ 0.3 mm (No.50) 100 % 95.7 % 91.4
0.3 mm ~ 0.15 mm (No. 50) (No.100)
0 % 3.0 % 6.0 %
0.15 mm ~ 0.075 mm (No.100) (No. 200)
0 % 1.3 % 2.6 %
Total 100% 100% 100%
2.020
2.060
2.100
2.140
2.180
2.220
2.260
2.300
1 1.5 2 2.5 3 3.5
FAC (%)
Gm
b
0 % Fine Content 4.3 % Fine Content 8.6 % Fine Content
Marshall: 75 blows
20
30
40
50
60
70
80
1.0 1.5 2.0 2.5 3.0 3.5
FAC (%)
ITS
(lb/
in2 )
0 % Fine Content 4.3 % Fine Content 8.6 % Fine Content
Marshall : 75 blows (a) Marshall compacted specimens
2.020
2.060
2.100
2.140
2.180
2.220
2.260
2.300
1.0 1.5 2.0 2.5 3.0 3.5
FAC (%)
Gm
b
0 % Fine Content 4.3 % Fine Content 8.6 % Fine Content
Gyratory: 50 gyrations
20
30
40
50
60
70
80
1.0 1.5 2.0 2.5 3.0 3.5
FAC (%)
ITS
(lb/
in2 )
0 % Fine Content 4.3 % Fine Content 8.6 % Fine Content
Gyratory: 50 gyrations (b) Gyratory compacted specimens
Figure 3-17. Plots of Gmb and ITS against FAC at three different fine contents
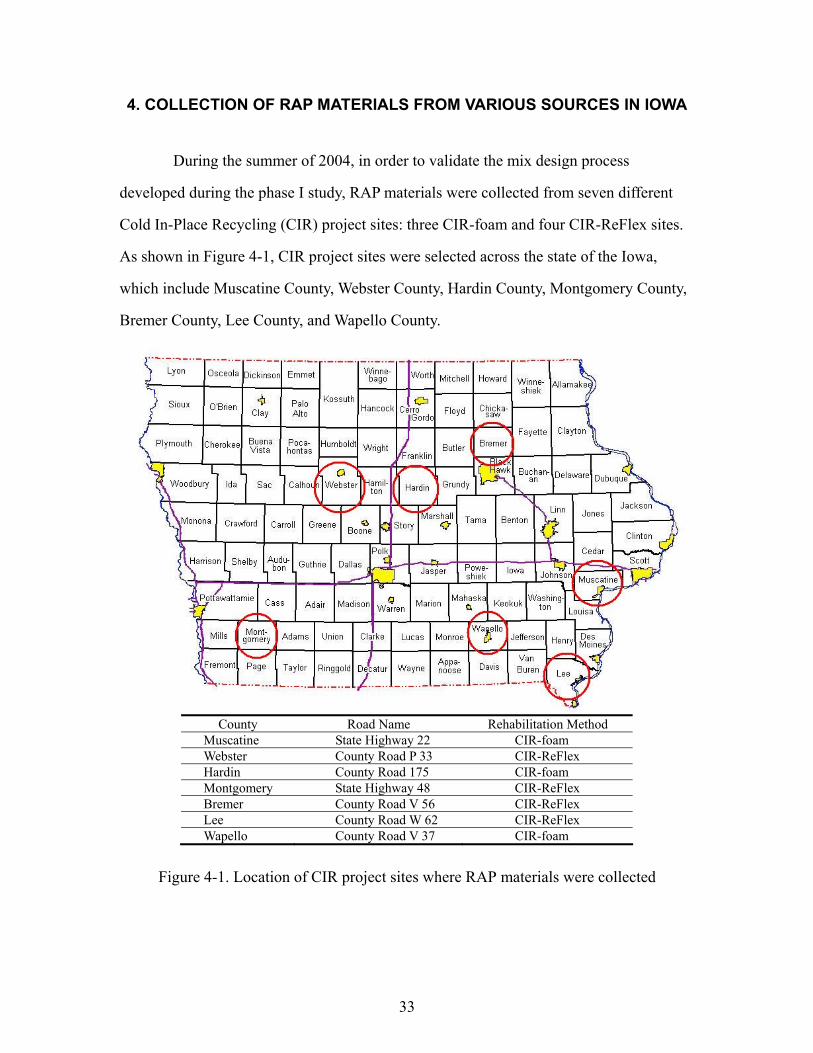
33
4. COLLECTION OF RAP MATERIALS FROM VARIOUS SOURCES IN IOWA
During the summer of 2004, in order to validate the mix design process
developed during the phase I study, RAP materials were collected from seven different
Cold In-Place Recycling (CIR) project sites: three CIR-foam and four CIR-ReFlex sites.
As shown in Figure 4-1, CIR project sites were selected across the state of the Iowa,
which include Muscatine County, Webster County, Hardin County, Montgomery County,
Bremer County, Lee County, and Wapello County.
County Road Name Rehabilitation Method
Muscatine State Highway 22 CIR-foam Webster County Road P 33 CIR-ReFlex Hardin County Road 175 CIR-foam Montgomery State Highway 48 CIR-ReFlex Bremer County Road V 56 CIR-ReFlex Lee County Road W 62 CIR-ReFlex Wapello County Road V 37 CIR-foam
Figure 4-1. Location of CIR project sites where RAP materials were collected
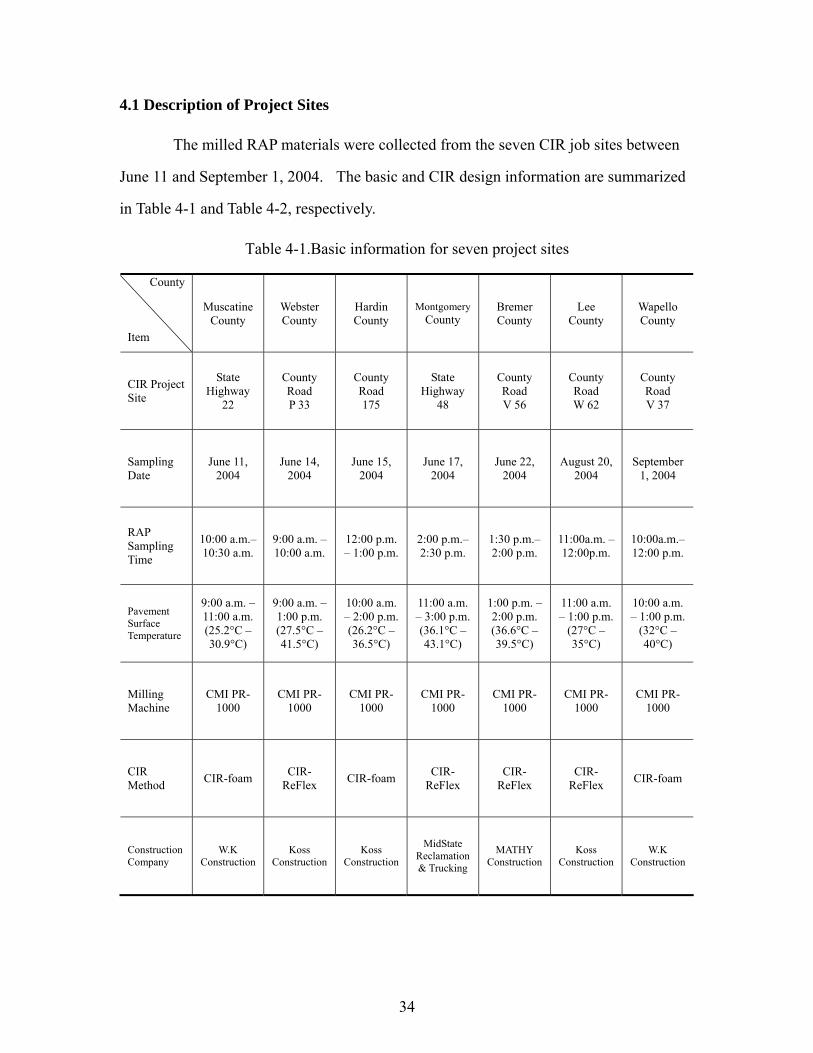
34
4.1 Description of Project Sites
The milled RAP materials were collected from the seven CIR job sites between
June 11 and September 1, 2004. The basic and CIR design information are summarized
in Table 4-1 and Table 4-2, respectively.
Table 4-1.Basic information for seven project sites
County Item
Muscatine County
Webster County
Hardin County
Montgomery County
Bremer County
Lee County
Wapello County
CIR Project Site
State Highway
22
County Road P 33
County Road 175
State Highway
48
County Road V 56
County Road W 62
County Road V 37
Sampling Date
June 11, 2004
June 14, 2004
June 15, 2004
June 17, 2004
June 22, 2004
August 20, 2004
September 1, 2004
RAP Sampling Time
10:00 a.m.– 10:30 a.m.
9:00 a.m. – 10:00 a.m.
12:00 p.m. – 1:00 p.m.
2:00 p.m.– 2:30 p.m.
1:30 p.m.– 2:00 p.m.
11:00a.m. – 12:00p.m.
10:00a.m.– 12:00 p.m.
Pavement Surface Temperature
9:00 a.m. – 11:00 a.m. (25.2°C – 30.9°C)
9:00 a.m. – 1:00 p.m. (27.5°C – 41.5°C)
10:00 a.m. – 2:00 p.m. (26.2°C – 36.5°C)
11:00 a.m. – 3:00 p.m. (36.1°C – 43.1°C)
1:00 p.m. –2:00 p.m. (36.6°C – 39.5°C)
11:00 a.m. – 1:00 p.m.
(27°C – 35°C)
10:00 a.m. – 1:00 p.m.
(32°C – 40°C)
Milling Machine
CMI PR-1000
CMI PR-1000
CMI PR-1000
CMI PR-1000
CMI PR-1000
CMI PR-1000
CMI PR-1000
CIR Method CIR-foam CIR-
ReFlex CIR-foam CIR-ReFlex
CIR-ReFlex
CIR-ReFlex CIR-foam
Construction Company
W.K Construction
Koss Construction
Koss Construction
MidState Reclamation & Trucking
MATHY Construction
Koss Construction
W.K Construction
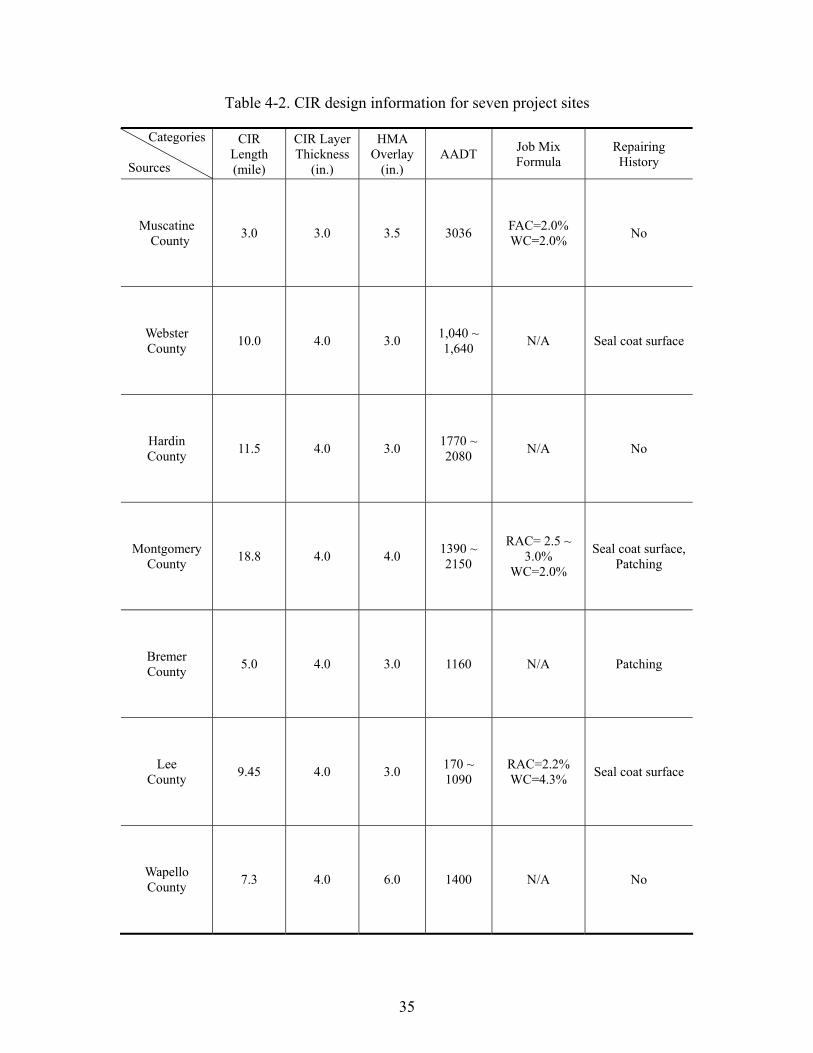
35
Table 4-2. CIR design information for seven project sites
Categories
Sources
CIR Length (mile)
CIR Layer Thickness
(in.)
HMA Overlay
(in.) AADT Job Mix
Formula Repairing History
Muscatine County 3.0 3.0 3.5 3036 FAC=2.0%
WC=2.0% No
Webster County 10.0 4.0 3.0 1,040 ~
1,640 N/A Seal coat surface
Hardin County 11.5 4.0 3.0 1770 ~
2080 N/A No
Montgomery County 18.8 4.0 4.0 1390 ~
2150
RAC= 2.5 ~ 3.0%
WC=2.0%
Seal coat surface, Patching
Bremer County 5.0 4.0 3.0 1160 N/A Patching
Lee County 9.45 4.0 3.0 170 ~
1090 RAC=2.2% WC=4.3% Seal coat surface
Wapello County 7.3 4.0 6.0 1400 N/A No
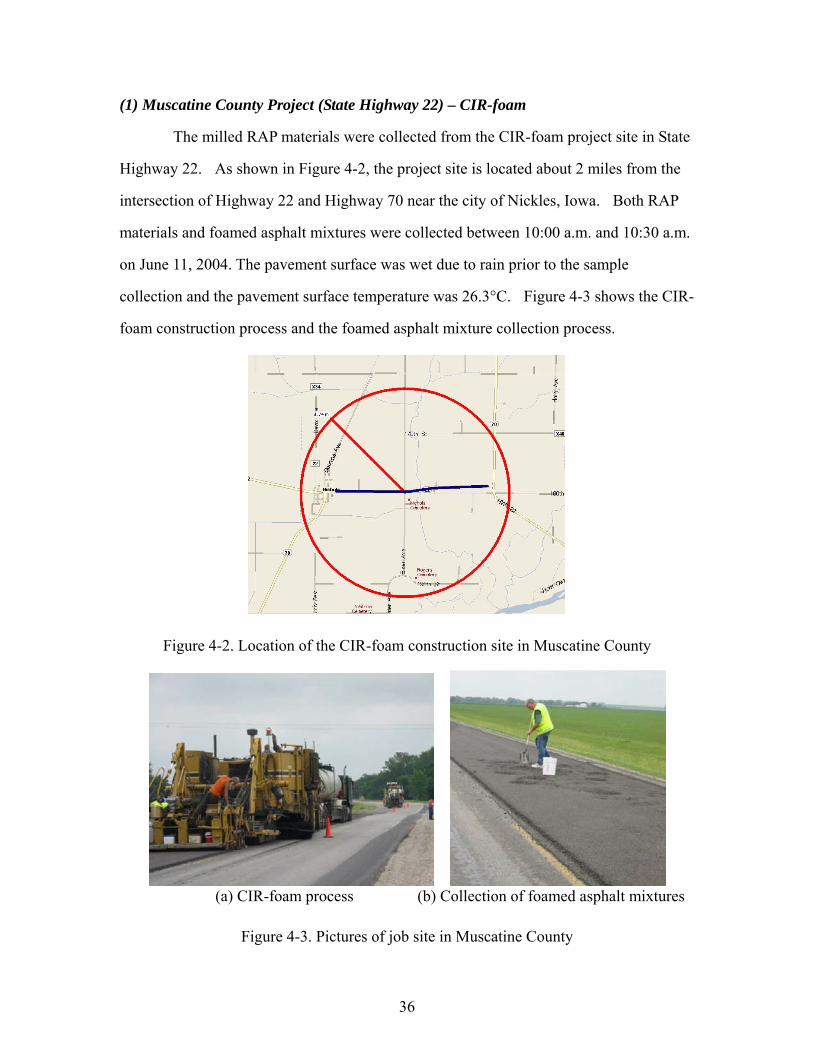
36
(1) Muscatine County Project (State Highway 22) – CIR-foam
The milled RAP materials were collected from the CIR-foam project site in State
Highway 22. As shown in Figure 4-2, the project site is located about 2 miles from the
intersection of Highway 22 and Highway 70 near the city of Nickles, Iowa. Both RAP
materials and foamed asphalt mixtures were collected between 10:00 a.m. and 10:30 a.m.
on June 11, 2004. The pavement surface was wet due to rain prior to the sample
collection and the pavement surface temperature was 26.3°C. Figure 4-3 shows the CIR-
foam construction process and the foamed asphalt mixture collection process.
Figure 4-2. Location of the CIR-foam construction site in Muscatine County
(a) CIR-foam process (b) Collection of foamed asphalt mixtures
Figure 4-3. Pictures of job site in Muscatine County
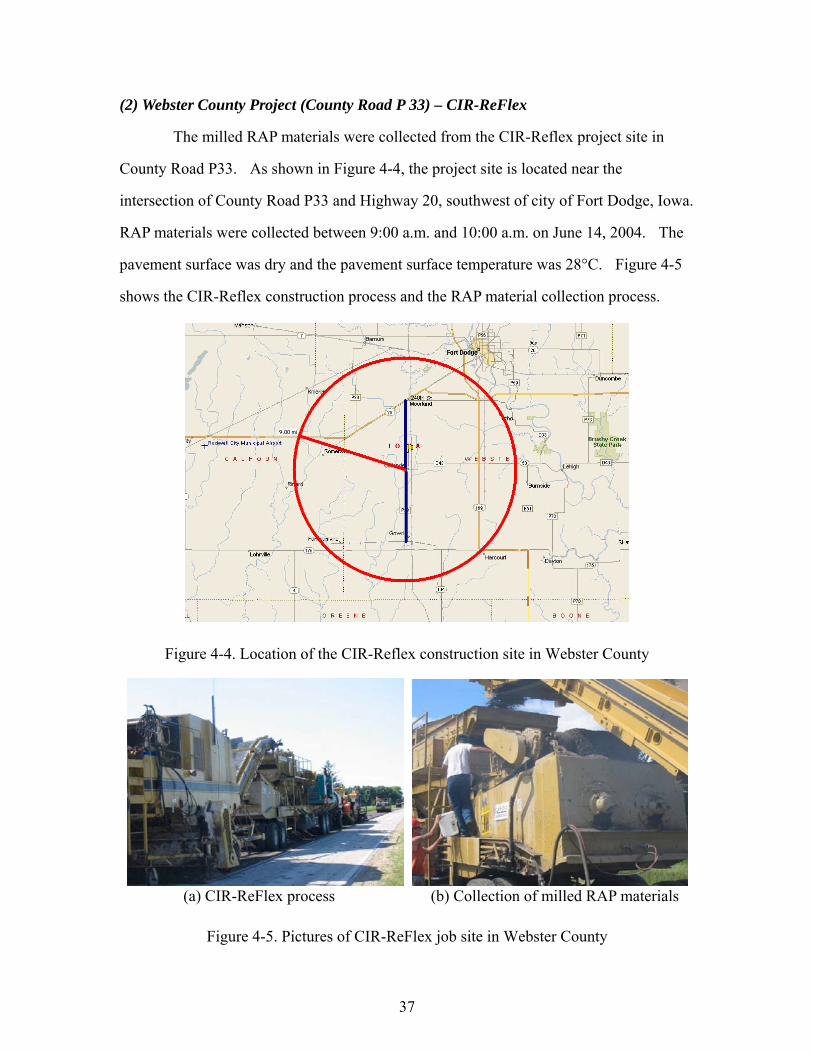
37
(2) Webster County Project (County Road P 33) – CIR-ReFlex
The milled RAP materials were collected from the CIR-Reflex project site in
County Road P33. As shown in Figure 4-4, the project site is located near the
intersection of County Road P33 and Highway 20, southwest of city of Fort Dodge, Iowa.
RAP materials were collected between 9:00 a.m. and 10:00 a.m. on June 14, 2004. The
pavement surface was dry and the pavement surface temperature was 28°C. Figure 4-5
shows the CIR-Reflex construction process and the RAP material collection process.
Figure 4-4. Location of the CIR-Reflex construction site in Webster County
(a) CIR-ReFlex process (b) Collection of milled RAP materials
Figure 4-5. Pictures of CIR-ReFlex job site in Webster County
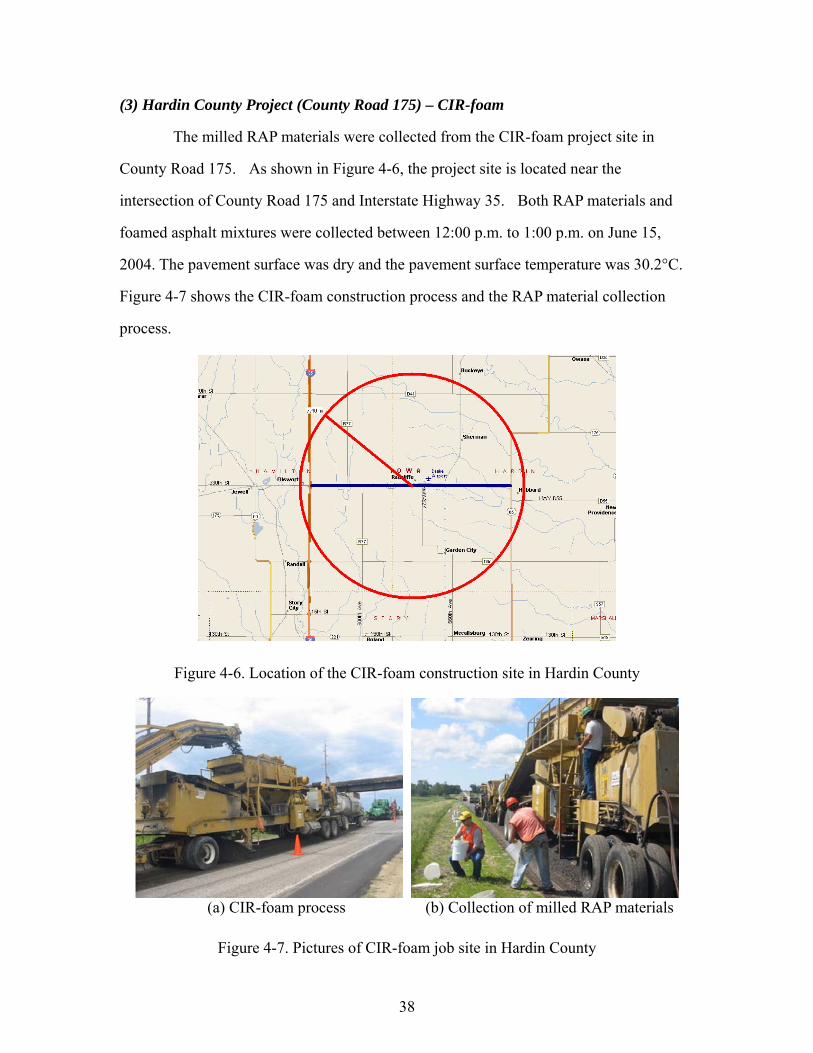
38
(3) Hardin County Project (County Road 175) – CIR-foam
The milled RAP materials were collected from the CIR-foam project site in
County Road 175. As shown in Figure 4-6, the project site is located near the
intersection of County Road 175 and Interstate Highway 35. Both RAP materials and
foamed asphalt mixtures were collected between 12:00 p.m. to 1:00 p.m. on June 15,
2004. The pavement surface was dry and the pavement surface temperature was 30.2°C.
Figure 4-7 shows the CIR-foam construction process and the RAP material collection
process.
Figure 4-6. Location of the CIR-foam construction site in Hardin County
(a) CIR-foam process (b) Collection of milled RAP materials
Figure 4-7. Pictures of CIR-foam job site in Hardin County
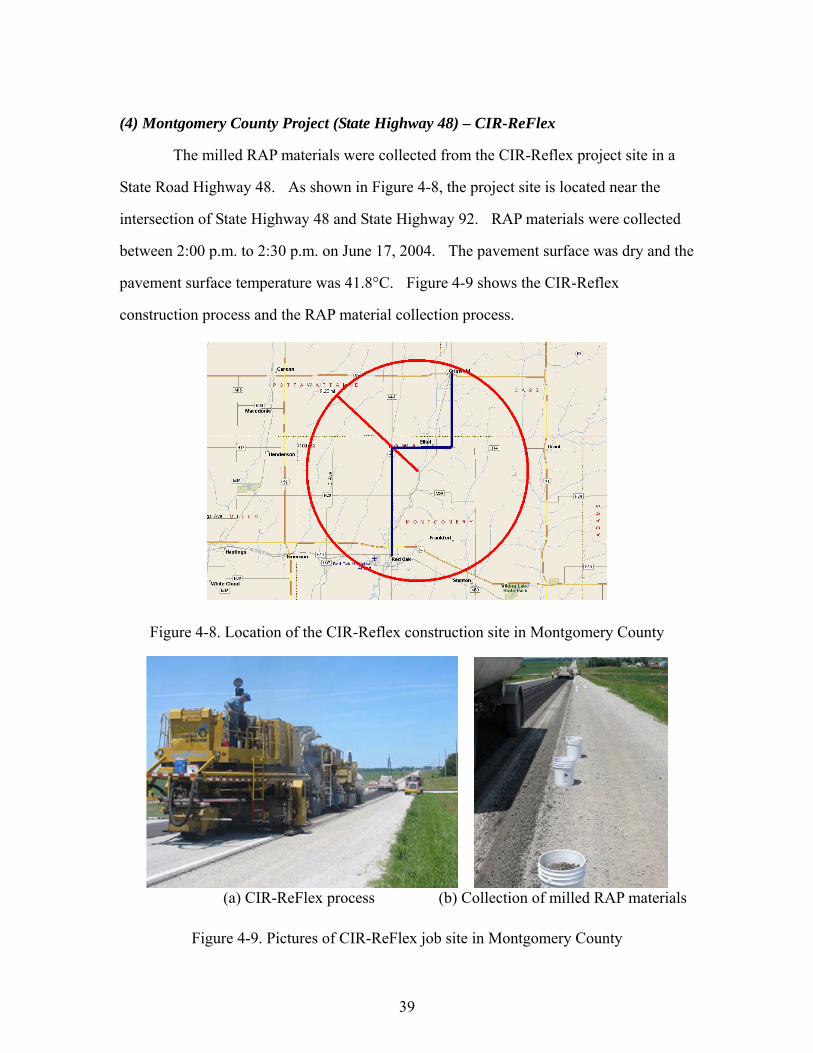
39
(4) Montgomery County Project (State Highway 48) – CIR-ReFlex
The milled RAP materials were collected from the CIR-Reflex project site in a
State Road Highway 48. As shown in Figure 4-8, the project site is located near the
intersection of State Highway 48 and State Highway 92. RAP materials were collected
between 2:00 p.m. to 2:30 p.m. on June 17, 2004. The pavement surface was dry and the
pavement surface temperature was 41.8°C. Figure 4-9 shows the CIR-Reflex
construction process and the RAP material collection process.
Figure 4-8. Location of the CIR-Reflex construction site in Montgomery County
(a) CIR-ReFlex process (b) Collection of milled RAP materials
Figure 4-9. Pictures of CIR-ReFlex job site in Montgomery County
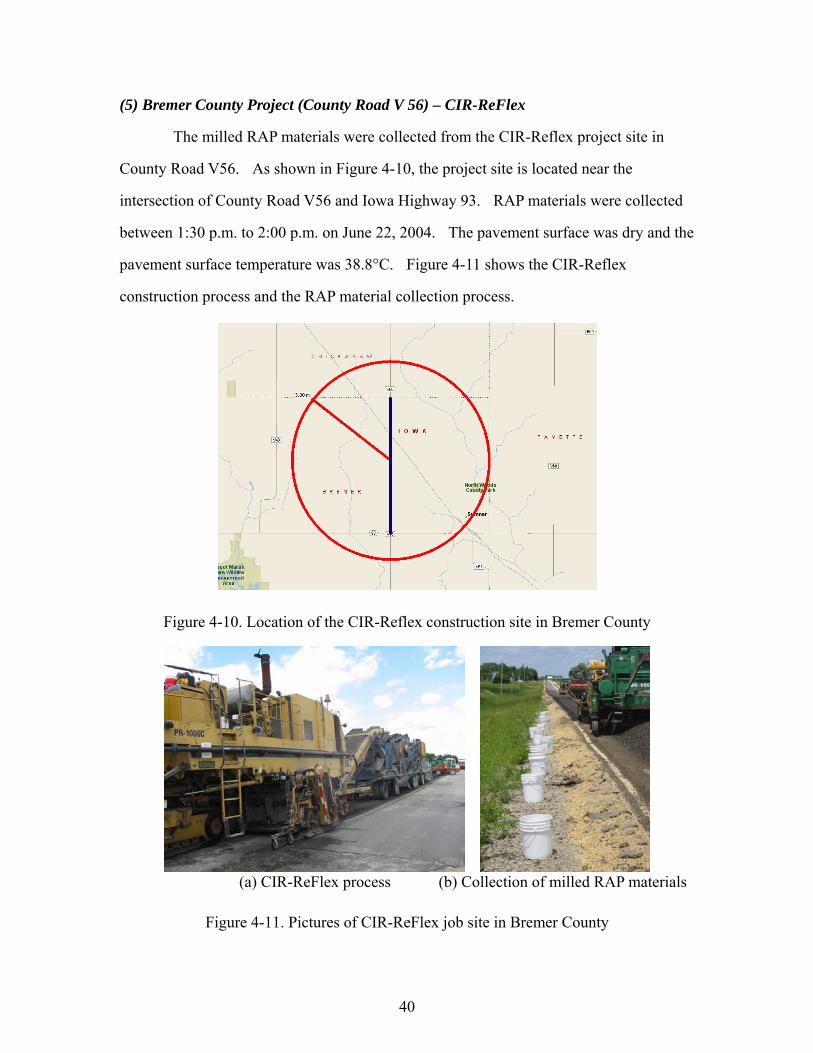
40
(5) Bremer County Project (County Road V 56) – CIR-ReFlex
The milled RAP materials were collected from the CIR-Reflex project site in
County Road V56. As shown in Figure 4-10, the project site is located near the
intersection of County Road V56 and Iowa Highway 93. RAP materials were collected
between 1:30 p.m. to 2:00 p.m. on June 22, 2004. The pavement surface was dry and the
pavement surface temperature was 38.8°C. Figure 4-11 shows the CIR-Reflex
construction process and the RAP material collection process.
Figure 4-10. Location of the CIR-Reflex construction site in Bremer County
(a) CIR-ReFlex process (b) Collection of milled RAP materials
Figure 4-11. Pictures of CIR-ReFlex job site in Bremer County
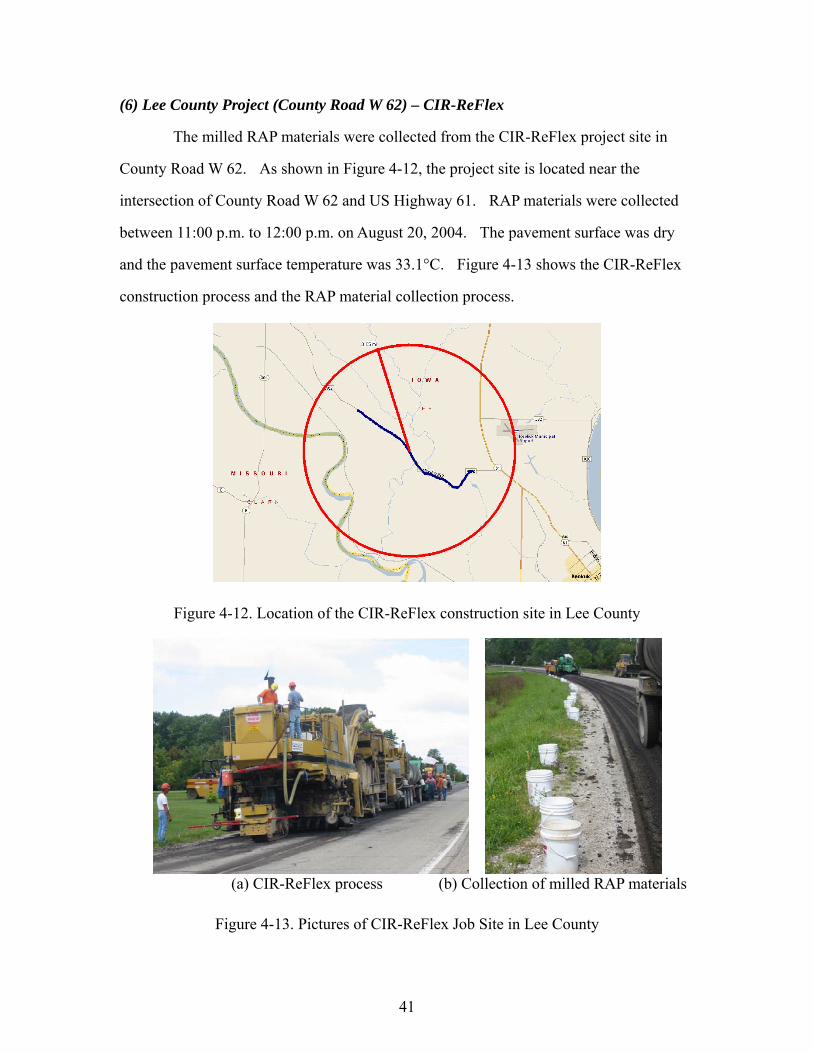
41
(6) Lee County Project (County Road W 62) – CIR-ReFlex
The milled RAP materials were collected from the CIR-ReFlex project site in
County Road W 62. As shown in Figure 4-12, the project site is located near the
intersection of County Road W 62 and US Highway 61. RAP materials were collected
between 11:00 p.m. to 12:00 p.m. on August 20, 2004. The pavement surface was dry
and the pavement surface temperature was 33.1°C. Figure 4-13 shows the CIR-ReFlex
construction process and the RAP material collection process.
Figure 4-12. Location of the CIR-ReFlex construction site in Lee County
(a) CIR-ReFlex process (b) Collection of milled RAP materials
Figure 4-13. Pictures of CIR-ReFlex Job Site in Lee County
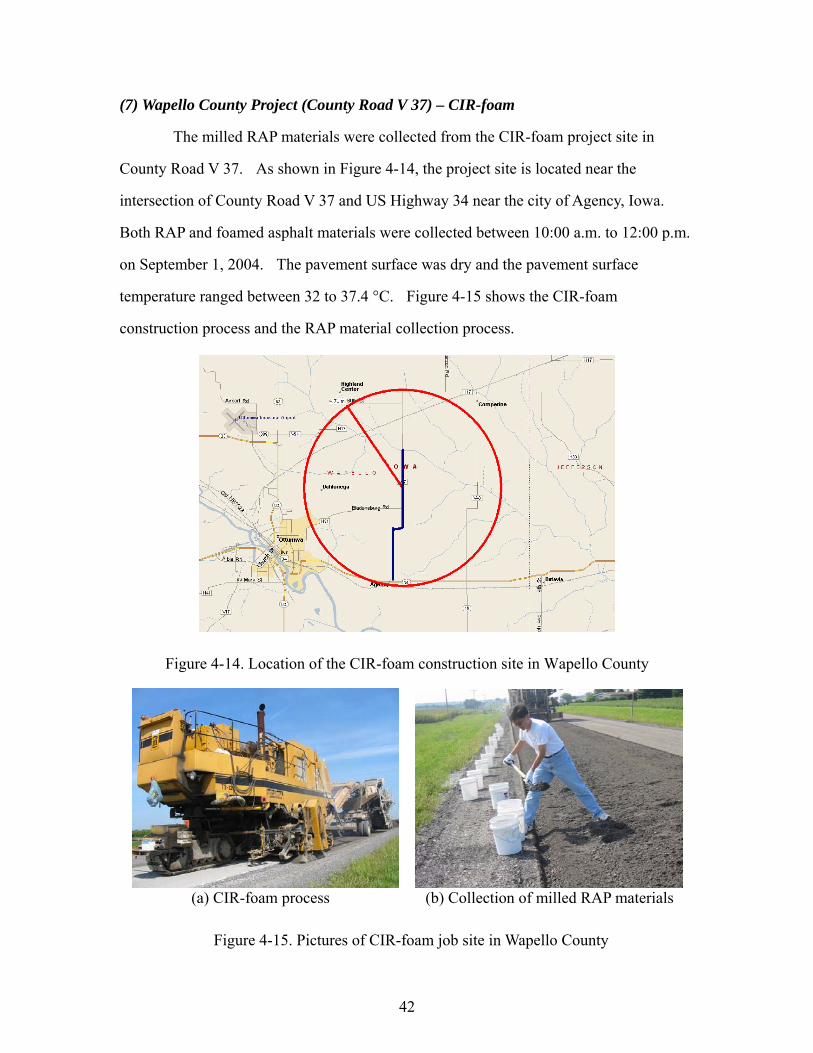
42
(7) Wapello County Project (County Road V 37) – CIR-foam
The milled RAP materials were collected from the CIR-foam project site in
County Road V 37. As shown in Figure 4-14, the project site is located near the
intersection of County Road V 37 and US Highway 34 near the city of Agency, Iowa.
Both RAP and foamed asphalt materials were collected between 10:00 a.m. to 12:00 p.m.
on September 1, 2004. The pavement surface was dry and the pavement surface
temperature ranged between 32 to 37.4 °C. Figure 4-15 shows the CIR-foam
construction process and the RAP material collection process.
Figure 4-14. Location of the CIR-foam construction site in Wapello County
(a) CIR-foam process (b) Collection of milled RAP materials
Figure 4-15. Pictures of CIR-foam job site in Wapello County
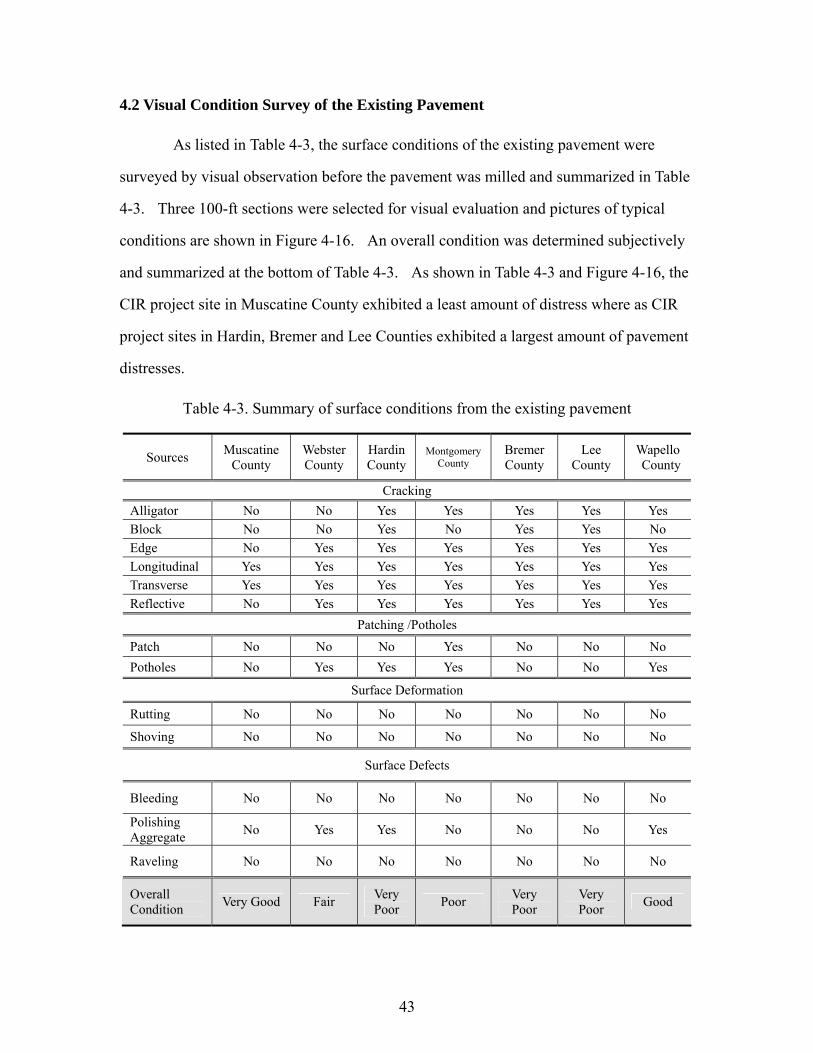
43
4.2 Visual Condition Survey of the Existing Pavement
As listed in Table 4-3, the surface conditions of the existing pavement were
surveyed by visual observation before the pavement was milled and summarized in Table
4-3. Three 100-ft sections were selected for visual evaluation and pictures of typical
conditions are shown in Figure 4-16. An overall condition was determined subjectively
and summarized at the bottom of Table 4-3. As shown in Table 4-3 and Figure 4-16, the
CIR project site in Muscatine County exhibited a least amount of distress where as CIR
project sites in Hardin, Bremer and Lee Counties exhibited a largest amount of pavement
distresses.
Table 4-3. Summary of surface conditions from the existing pavement
Sources Muscatine County
Webster County
Hardin County
Montgomery County
Bremer County
Lee County
Wapello County
Cracking Alligator No No Yes Yes Yes Yes Yes Block No No Yes No Yes Yes No Edge No Yes Yes Yes Yes Yes Yes Longitudinal Yes Yes Yes Yes Yes Yes Yes Transverse Yes Yes Yes Yes Yes Yes Yes Reflective No Yes Yes Yes Yes Yes Yes
Patching /Potholes
Patch No No No Yes No No No Potholes No Yes Yes Yes No No Yes
Surface Deformation
Rutting No No No No No No No
Shoving No No No No No No No
Surface Defects
Bleeding No No No No No No No
Polishing Aggregate No Yes Yes No No No Yes
Raveling No No No No No No No
Overall Condition Very Good Fair Very
Poor Poor Very Poor
Very Poor Good
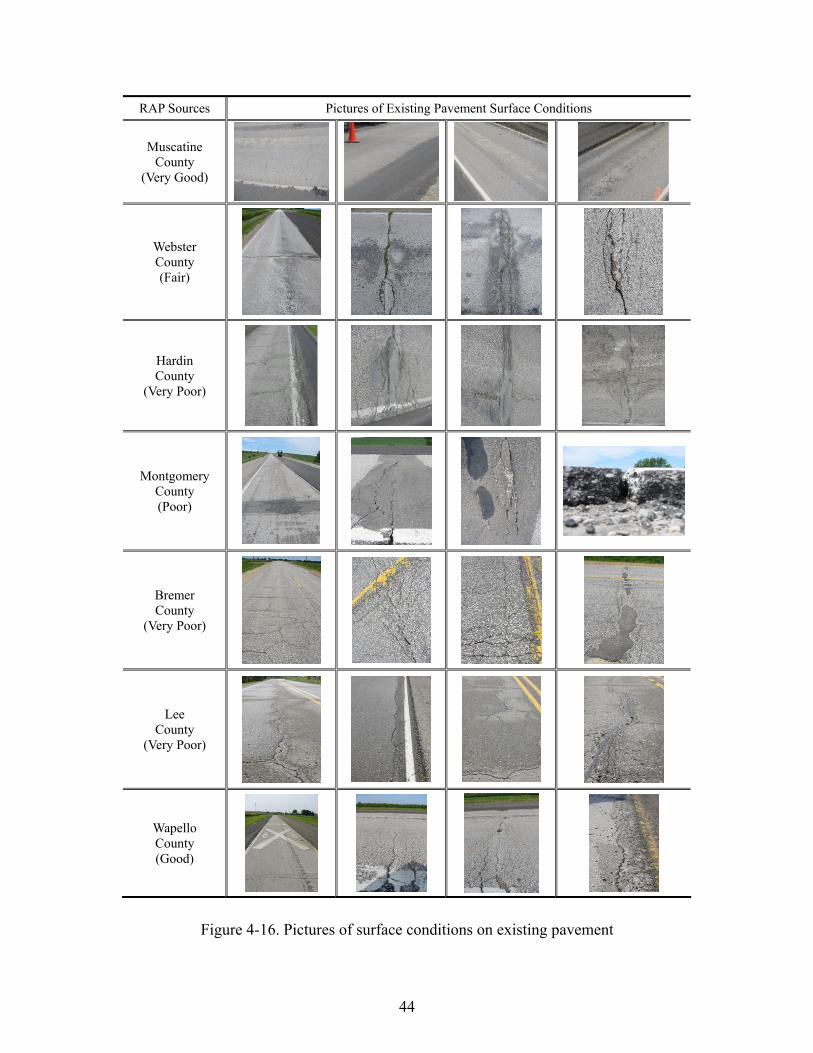
44
RAP Sources Pictures of Existing Pavement Surface Conditions
Muscatine County
(Very Good)
Webster County (Fair)
Hardin County
(Very Poor)
Montgomery County (Poor)
Bremer County
(Very Poor)
Lee County
(Very Poor)
Wapello County (Good)
Figure 4-16. Pictures of surface conditions on existing pavement

45
4.3 Evaluation of the Collected CIR-foam Mixtures from Three Job Sites
CIR-foam field mixtures were collected from three project sites in Muscatine
County, Hardin County, and Wapello County. They were compacted at the laboratory
using a Marshall hammer and a gyratory compactor without adding additional water and
cured in the oven at 40°C for three days or at 60°C for two days. The foamed asphalt
specimens were saturated under vacuum and tested to determine their “wet” indirect
tensile strengths. As shown in Table 4-4, six 75-blow Marshall compacted specimens
were prepared and a set of three specimens was cured in the oven at 40°C or 60°C. Four
30-gyration compacted specimens and four 50-gyration compacted specimens were also
prepared. Out of four specimens made at each gyration level, two specimens were cured
in the oven at 40°C for three days and the other two specimens were cured in the oven at
60°C for two days. The cured foamed asphalt specimens were placed in 25˚C water bath
for a total of 1.5 hours, 30 minutes without vacuum, 30 minutes with 20mmHg vacuum,
and 30 minutes without vacuum.
Table 4-4. Number of specimens for evaluating field CIR-foam mixtures
Compaction Method 75 blows 30 gyrations 50 gyrations
Curing Condition Specimen Condition No. of specimens
40°C for 3 days Vacuum-saturated 3 2 2
60°C for 2 days Vacuum-saturated 3 2 2
4.3.1 Bulk Specific Gravity and Air Void
The estimated bulk specific gravities (Gmb) of the foamed asphalt mixtures were
estimated by measuring volume of the compacted specimens. The maximum specific
gravities were measured by the Rice test method. Figure 4-17 shows the estimated bulk
specific gravities and air void for three different compaction levels and two different
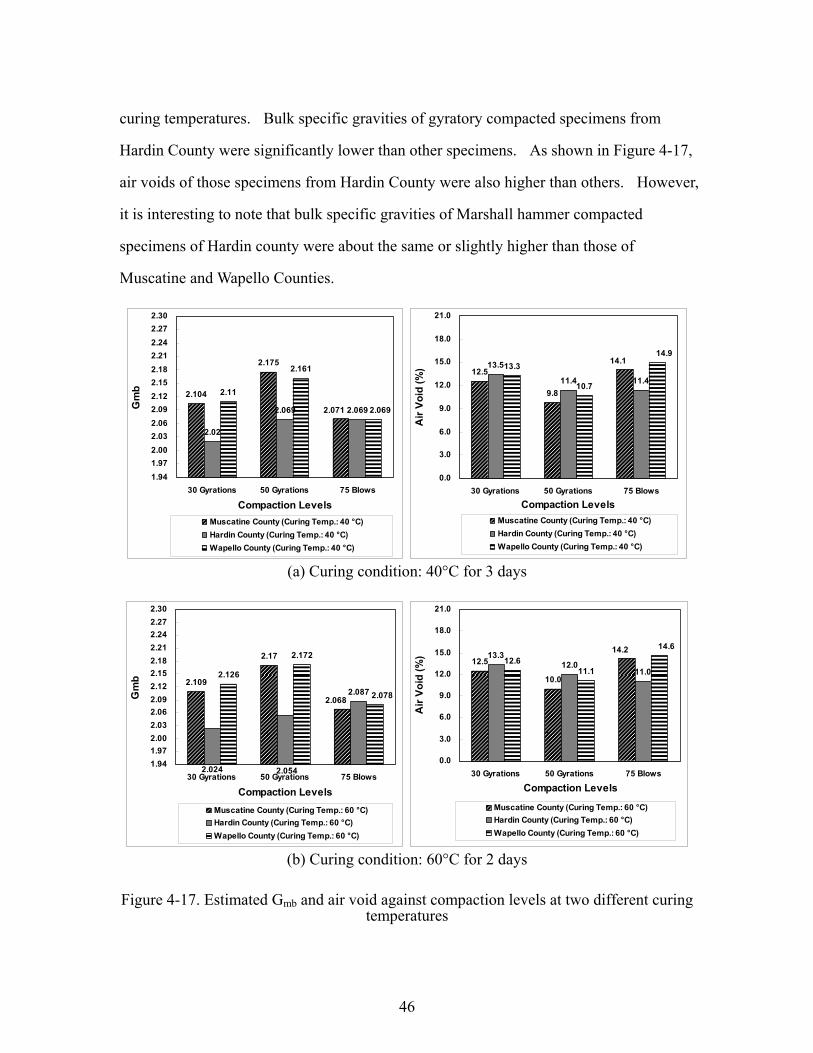
46
curing temperatures. Bulk specific gravities of gyratory compacted specimens from
Hardin County were significantly lower than other specimens. As shown in Figure 4-17,
air voids of those specimens from Hardin County were also higher than others. However,
it is interesting to note that bulk specific gravities of Marshall hammer compacted
specimens of Hardin county were about the same or slightly higher than those of
Muscatine and Wapello Counties.
2.104
2.175
2.02
2.069 2.069
2.161
2.071 2.069
2.11
1.941.972.002.032.062.092.122.152.182.212.242.272.30
30 Gyrations 50 Gyrations 75 Blows
Compaction Levels
Gm
b
Muscatine County (Curing Temp.: 40 °C)Hardin County (Curing Temp.: 40 °C)Wapello County (Curing Temp.: 40 °C)
`
12.5
9.8
13.5
11.4 11.410.7
14.113.314.9
0.0
3.0
6.0
9.0
12.0
15.0
18.0
21.0
30 Gyrations 50 Gyrations 75 Blows
Compaction Levels
Air
Void
(%)
Muscatine County (Curing Temp.: 40 °C)Hardin County (Curing Temp.: 40 °C)Wapello County (Curing Temp.: 40 °C)
`
(a) Curing condition: 40°C for 3 days
2.109
2.17
2.087
2.172
2.068
2.0542.024
2.078
2.126
1.941.972.002.032.062.092.122.152.182.212.242.272.30
30 Gyrations 50 Gyrations 75 Blows
Compaction Levels
Gm
b
Muscatine County (Curing Temp.: 60 °C)Hardin County (Curing Temp.: 60 °C)Wapello County (Curing Temp.: 60 °C)
`
12.5
10.0
13.312.0
11.011.1
14.212.6
14.6
0.0
3.0
6.0
9.0
12.0
15.0
18.0
21.0
30 Gyrations 50 Gyrations 75 Blows
Compaction Levels
Air
Void
(%)
Muscatine County (Curing Temp.: 60 °C)Hardin County (Curing Temp.: 60 °C)Wapello County (Curing Temp.: 60 °C)
`
(b) Curing condition: 60°C for 2 days
Figure 4-17. Estimated Gmb and air void against compaction levels at two different curing temperatures
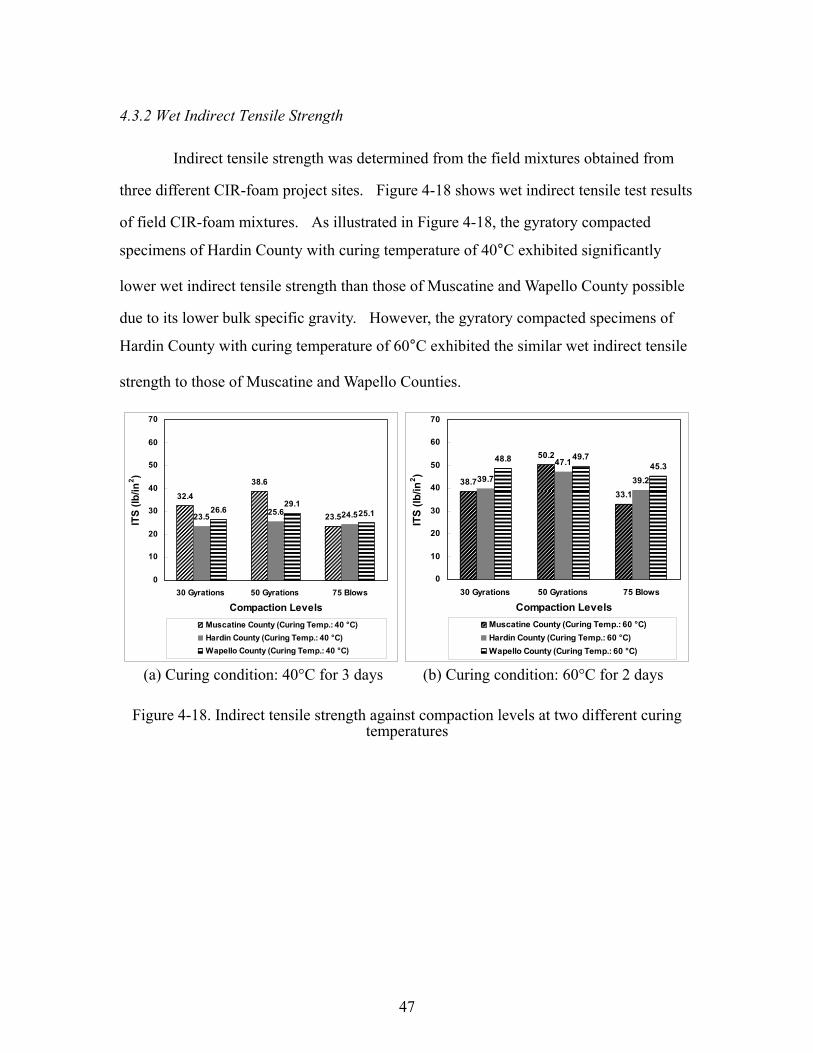
47
4.3.2 Wet Indirect Tensile Strength
Indirect tensile strength was determined from the field mixtures obtained from
three different CIR-foam project sites. Figure 4-18 shows wet indirect tensile test results
of field CIR-foam mixtures. As illustrated in Figure 4-18, the gyratory compacted
specimens of Hardin County with curing temperature of 40°C exhibited significantly
lower wet indirect tensile strength than those of Muscatine and Wapello County possible
due to its lower bulk specific gravity. However, the gyratory compacted specimens of
Hardin County with curing temperature of 60°C exhibited the similar wet indirect tensile
strength to those of Muscatine and Wapello Counties.
32.4
38.6
23.523.5 25.6 24.526.629.1
25.1
0
10
20
30
40
50
60
70
30 Gyrations 50 Gyrations 75 Blows
Compaction Levels
ITS
(lb/in
2 )
Muscatine County (Curing Temp.: 40 °C)Hardin County (Curing Temp.: 40 °C)Wapello County (Curing Temp.: 40 °C)
38.7
50.2
33.1
39.7
47.1
39.2
48.8 49.745.3
0
10
20
30
40
50
60
70
30 Gyrations 50 Gyrations 75 Blows
Compaction Levels
ITS
(lb/in
2 )
Muscatine County (Curing Temp.: 60 °C)Hardin County (Curing Temp.: 60 °C)Wapello County (Curing Temp.: 60 °C)
(a) Curing condition: 40°C for 3 days (b) Curing condition: 60°C for 2 days
Figure 4-18. Indirect tensile strength against compaction levels at two different curing temperatures
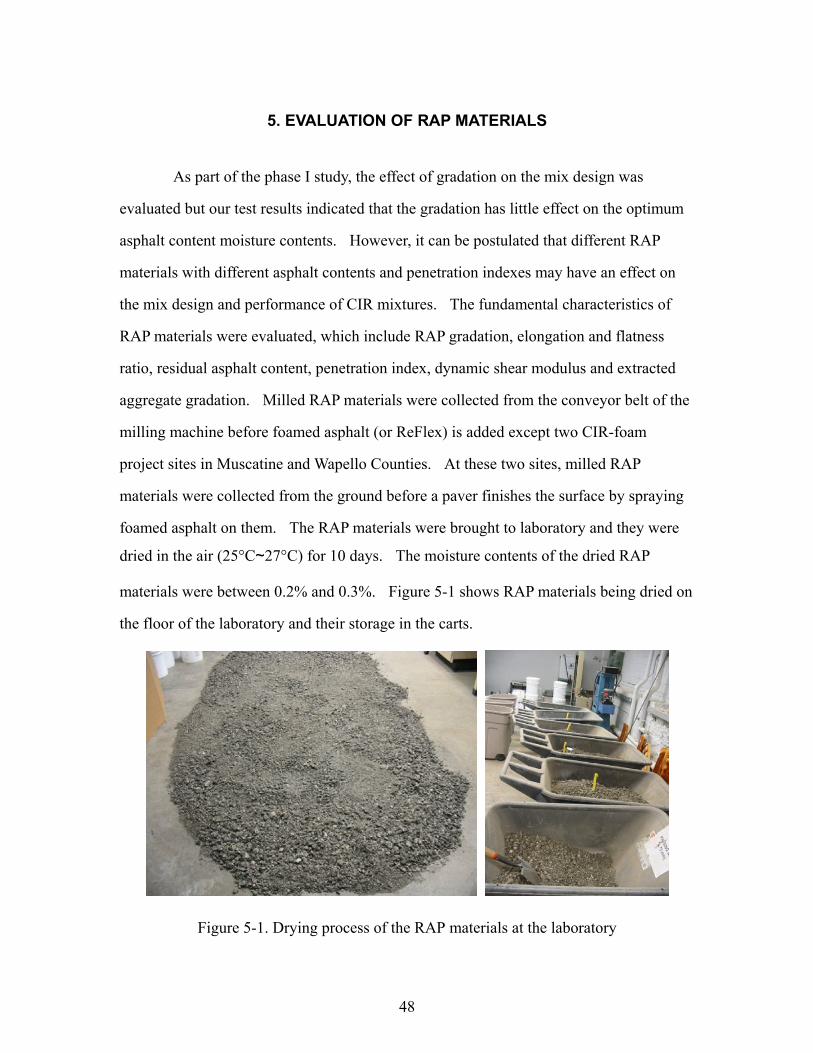
48
5. EVALUATION OF RAP MATERIALS
As part of the phase I study, the effect of gradation on the mix design was
evaluated but our test results indicated that the gradation has little effect on the optimum
asphalt content moisture contents. However, it can be postulated that different RAP
materials with different asphalt contents and penetration indexes may have an effect on
the mix design and performance of CIR mixtures. The fundamental characteristics of
RAP materials were evaluated, which include RAP gradation, elongation and flatness
ratio, residual asphalt content, penetration index, dynamic shear modulus and extracted
aggregate gradation. Milled RAP materials were collected from the conveyor belt of the
milling machine before foamed asphalt (or ReFlex) is added except two CIR-foam
project sites in Muscatine and Wapello Counties. At these two sites, milled RAP
materials were collected from the ground before a paver finishes the surface by spraying
foamed asphalt on them. The RAP materials were brought to laboratory and they were
dried in the air (25°C~27°C) for 10 days. The moisture contents of the dried RAP
materials were between 0.2% and 0.3%. Figure 5-1 shows RAP materials being dried on
the floor of the laboratory and their storage in the carts.
Figure 5-1. Drying process of the RAP materials at the laboratory
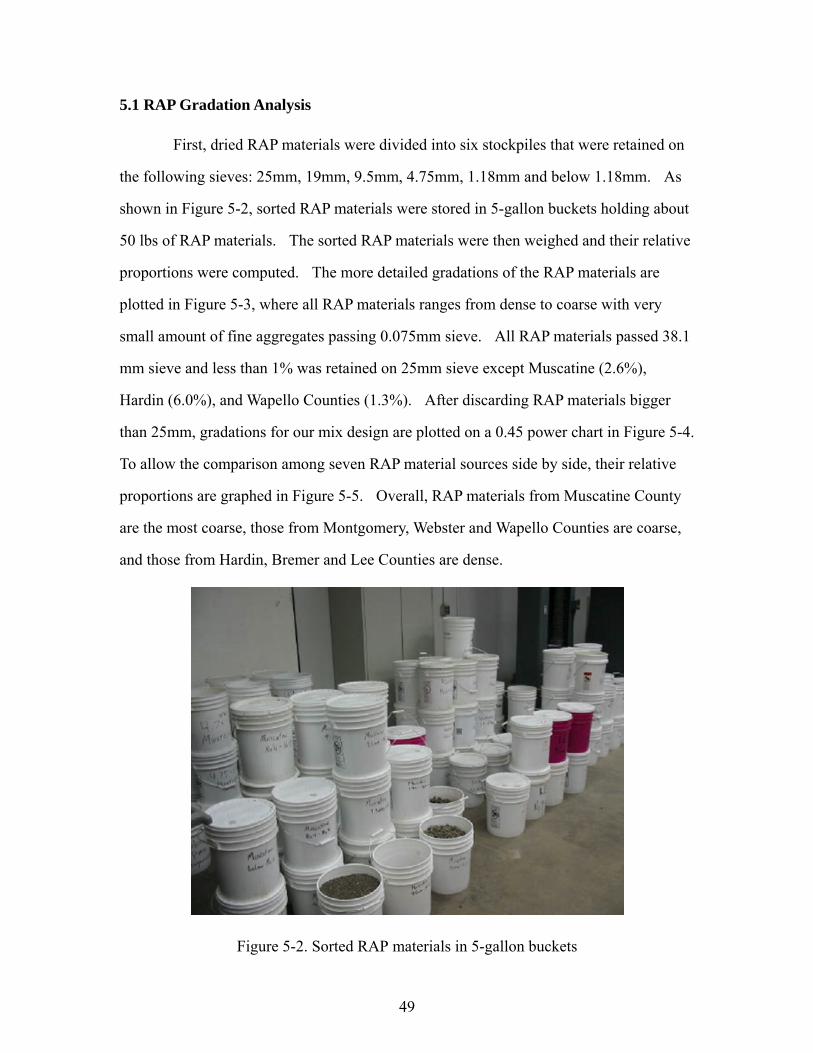
49
5.1 RAP Gradation Analysis
First, dried RAP materials were divided into six stockpiles that were retained on
the following sieves: 25mm, 19mm, 9.5mm, 4.75mm, 1.18mm and below 1.18mm. As
shown in Figure 5-2, sorted RAP materials were stored in 5-gallon buckets holding about
50 lbs of RAP materials. The sorted RAP materials were then weighed and their relative
proportions were computed. The more detailed gradations of the RAP materials are
plotted in Figure 5-3, where all RAP materials ranges from dense to coarse with very
small amount of fine aggregates passing 0.075mm sieve. All RAP materials passed 38.1
mm sieve and less than 1% was retained on 25mm sieve except Muscatine (2.6%),
Hardin (6.0%), and Wapello Counties (1.3%). After discarding RAP materials bigger
than 25mm, gradations for our mix design are plotted on a 0.45 power chart in Figure 5-4.
To allow the comparison among seven RAP material sources side by side, their relative
proportions are graphed in Figure 5-5. Overall, RAP materials from Muscatine County
are the most coarse, those from Montgomery, Webster and Wapello Counties are coarse,
and those from Hardin, Bremer and Lee Counties are dense.
Figure 5-2. Sorted RAP materials in 5-gallon buckets
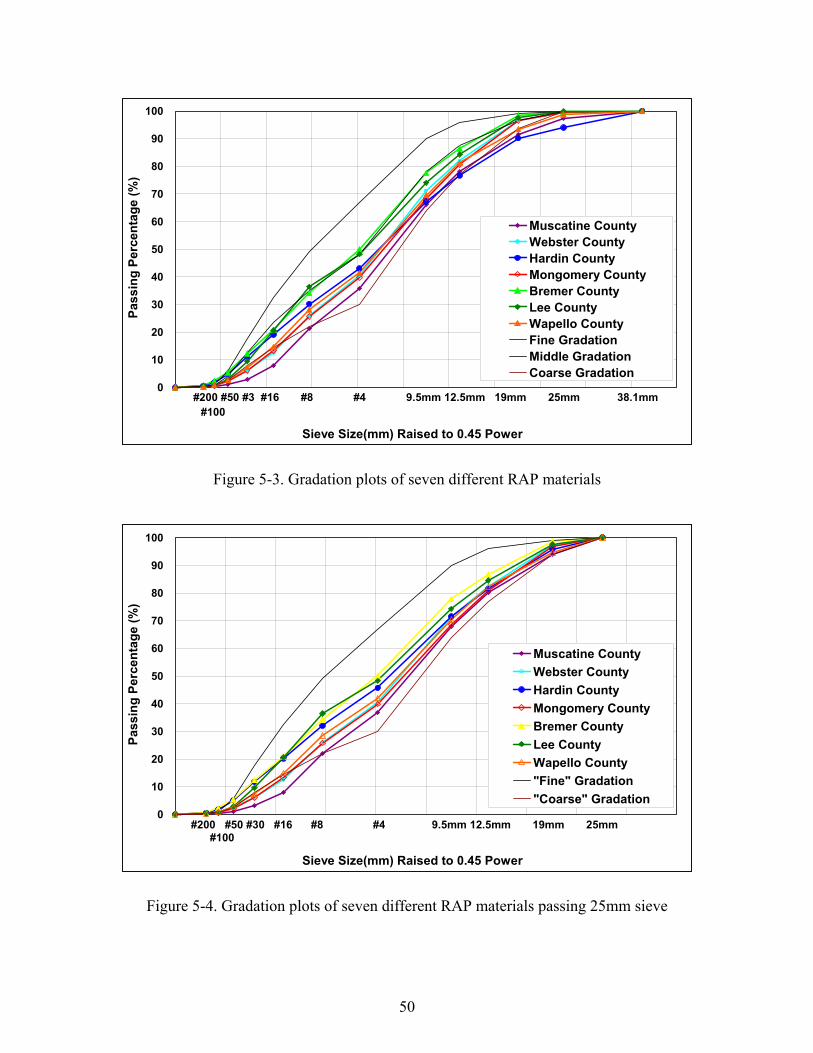
50
0
10
20
30
40
50
60
70
80
90
100
Sieve Size(mm) Raised to 0.45 Power
Pass
ing
Perc
enta
ge (%
)
Muscatine CountyWebster CountyHardin CountyMongomery CountyBremer CountyLee CountyWapello CountyFine GradationMiddle GradationCoarse Gradation
#200 #50 #3 #16 #8 #4 9.5mm 12.5mm 19mm 25mm 38.1mm#100
Figure 5-3. Gradation plots of seven different RAP materials
0
10
20
30
40
50
60
70
80
90
100
Sieve Size(mm) Raised to 0.45 Power
Pass
ing
Perc
enta
ge (%
)
Muscatine CountyWebster CountyHardin CountyMongomery CountyBremer CountyLee CountyWapello County"Fine" Gradation"Coarse" Gradation
#200 #50 #30 #16 #8 #4 9.5mm 12.5mm 19mm 25mm#100
Figure 5-4. Gradation plots of seven different RAP materials passing 25mm sieve
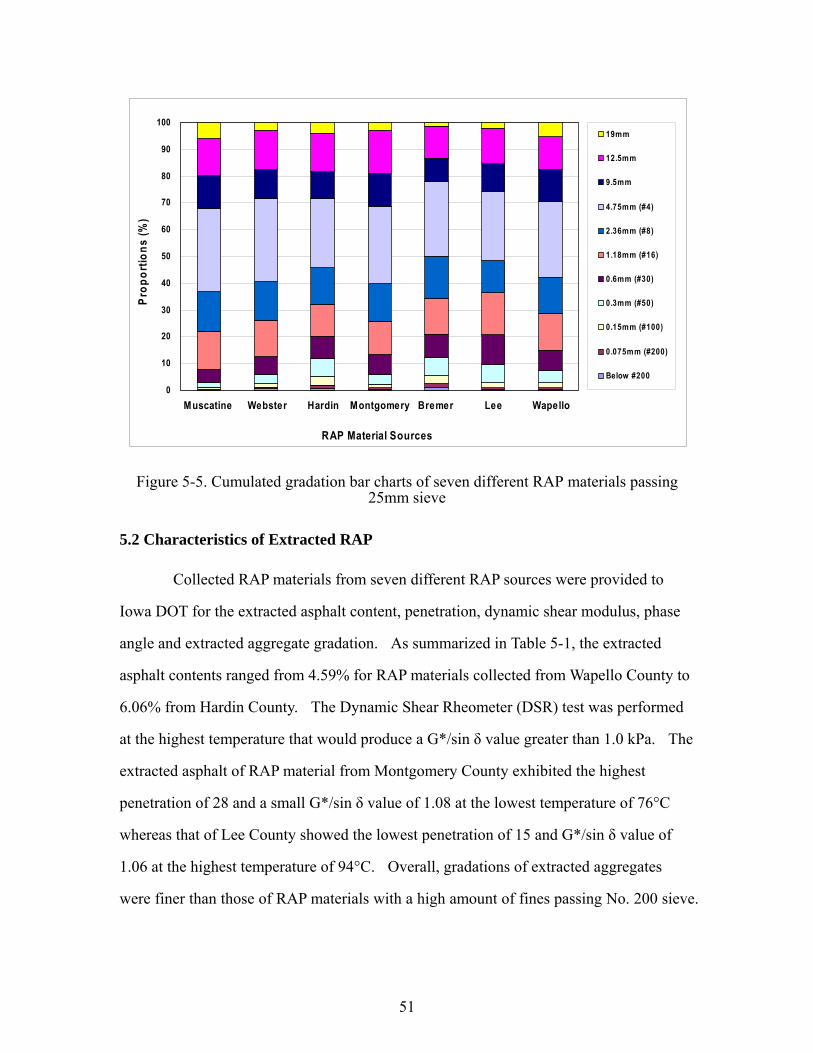
51
0
10
20
30
40
50
60
70
80
90
100
RAP Material Sources
Prop
ortio
ns (%
)19mm
12.5mm
9.5mm
4.75mm (#4)
2.36mm (#8)
1.18mm (#16)
0.6mm (#30)
0.3mm (#50)
0.15mm (#100)
0.075mm (#200)
Below #200
Hardin MontgomeryMuscatine Webster WapelloBremer Lee
Figure 5-5. Cumulated gradation bar charts of seven different RAP materials passing 25mm sieve
5.2 Characteristics of Extracted RAP
Collected RAP materials from seven different RAP sources were provided to
Iowa DOT for the extracted asphalt content, penetration, dynamic shear modulus, phase
angle and extracted aggregate gradation. As summarized in Table 5-1, the extracted
asphalt contents ranged from 4.59% for RAP materials collected from Wapello County to
6.06% from Hardin County. The Dynamic Shear Rheometer (DSR) test was performed
at the highest temperature that would produce a G*/sin δ value greater than 1.0 kPa. The
extracted asphalt of RAP material from Montgomery County exhibited the highest
penetration of 28 and a small G*/sin δ value of 1.08 at the lowest temperature of 76°C
whereas that of Lee County showed the lowest penetration of 15 and G*/sin δ value of
1.06 at the highest temperature of 94°C. Overall, gradations of extracted aggregates
were finer than those of RAP materials with a high amount of fines passing No. 200 sieve.
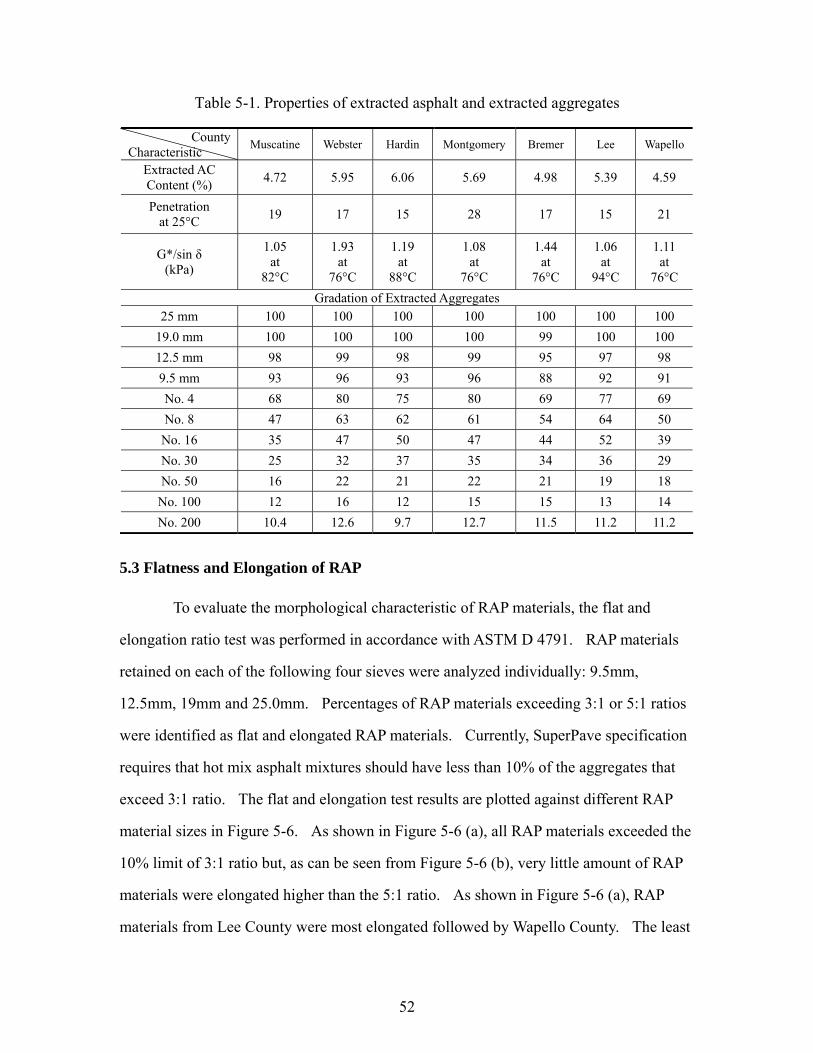
52
Table 5-1. Properties of extracted asphalt and extracted aggregates
County Characteristic Muscatine Webster Hardin Montgomery Bremer Lee Wapello
Extracted AC Content (%) 4.72 5.95 6.06 5.69 4.98 5.39 4.59
Penetration at 25°C 19 17 15 28 17 15 21
G*/sin δ (kPa)
1.05 at
82°C
1.93 at
76°C
1.19 at
88°C
1.08 at
76°C
1.44 at
76°C
1.06 at
94°C
1.11 at
76°C Gradation of Extracted Aggregates
25 mm 100 100 100 100 100 100 100 19.0 mm 100 100 100 100 99 100 100 12.5 mm 98 99 98 99 95 97 98 9.5 mm 93 96 93 96 88 92 91 No. 4 68 80 75 80 69 77 69 No. 8 47 63 62 61 54 64 50
No. 16 35 47 50 47 44 52 39 No. 30 25 32 37 35 34 36 29 No. 50 16 22 21 22 21 19 18
No. 100 12 16 12 15 15 13 14 No. 200 10.4 12.6 9.7 12.7 11.5 11.2 11.2
5.3 Flatness and Elongation of RAP
To evaluate the morphological characteristic of RAP materials, the flat and
elongation ratio test was performed in accordance with ASTM D 4791. RAP materials
retained on each of the following four sieves were analyzed individually: 9.5mm,
12.5mm, 19mm and 25.0mm. Percentages of RAP materials exceeding 3:1 or 5:1 ratios
were identified as flat and elongated RAP materials. Currently, SuperPave specification
requires that hot mix asphalt mixtures should have less than 10% of the aggregates that
exceed 3:1 ratio. The flat and elongation test results are plotted against different RAP
material sizes in Figure 5-6. As shown in Figure 5-6 (a), all RAP materials exceeded the
10% limit of 3:1 ratio but, as can be seen from Figure 5-6 (b), very little amount of RAP
materials were elongated higher than the 5:1 ratio. As shown in Figure 5-6 (a), RAP
materials from Lee County were most elongated followed by Wapello County. The least

53
elongated materials were from Hardin, Montgomery and Bremer Counties.
0
10
20
30
40
50
60
25 mm 19mm 12.5 mm 9.5 mm
Size of RAP Materials (mm)
% F
lat a
nd E
long
ated
Pat
icle
s
Muscatine County
Webster County
Hadin County
Montgomery County
Bremer County
Lee County
Wapello County
3:1 ratio
Superpave 10% allowable limit
(a) 3:1 ratio
0
10
20
30
40
50
60
25 mm 19mm 12.5 mm 9.5 mm
Size of RAP Materials (mm)
% F
lat a
nd E
long
ated
Pat
icle
s
Muscatine County
Webster County
Hadin County
Montgomery County
Bremer County
Lee County
Wapello County
5:1 ratio
Superpave 10% allowable limit
(b) 5:1 ratio
Figure 5-6. Plots of percent flat and elongation of RAP materials from seven counties
54
6. Compaction Characteristics of RAP Materials
To investigate compaction characteristics of RAP materials, as a reference point,
RAP materials were compacted using a gyratory compactor without adding water or
foamed asphalt. As shown in Table 6-1, RAP materials were also compacted with 4.0%
water added and dried in the oven at 40°C for 3 days. Two specimens were compacted
up to 200 gyrations for each case.
Table 6-1. Test condition for gyratory compaction of RAP materials
RAP Condition Number of Specimens Compaction Level Curing Condition
RAP only 2 200 Gyrations Not necessary
RAP + 4.0% WC 2 200 Gyrations 40°C oven for 3 days
6.1 Sample Observation
Figure 6-1 (a), (b), and (c) show the pictures of the compacted RAP materials
from Wapello County with (a) no water or foamed asphalt (b) 4.0% water and (c) 2.5%
foamed asphalt and 4.0% water. Without water or foamed asphalt, RAP materials did
not compact evenly as can be seen from the irregular surface in Figure 6-1 (a). With
4.0% water and 2.5% foamed asphalt, RAP materials seemed to have been over-
compacted as can be seen from thick and dark asphalt spots on the surface in Figure 6-1
(c). RAP materials from Wapello County produced the highest Gmb.
Figure 6-2 (a), (b), and (c) show the pictures of the compacted RAP materials
from Hardin County with (a) no water or foamed asphalt (b) 4.0% water and (c) 2.5%
foamed asphalt and 4.0% water. Without water or foamed asphalt, RAP materials
seemed to have been compacted better than those from Wapello County as shown in
Figure 6-2 (c). With 4.0% water and 2.5% foamed asphalt, RAP materials seemed to
have been well compacted as can be seen from well distributed asphalt spots on the
surface as shown in Figure 6-2 (c). RAP materials from Hardin County produced the
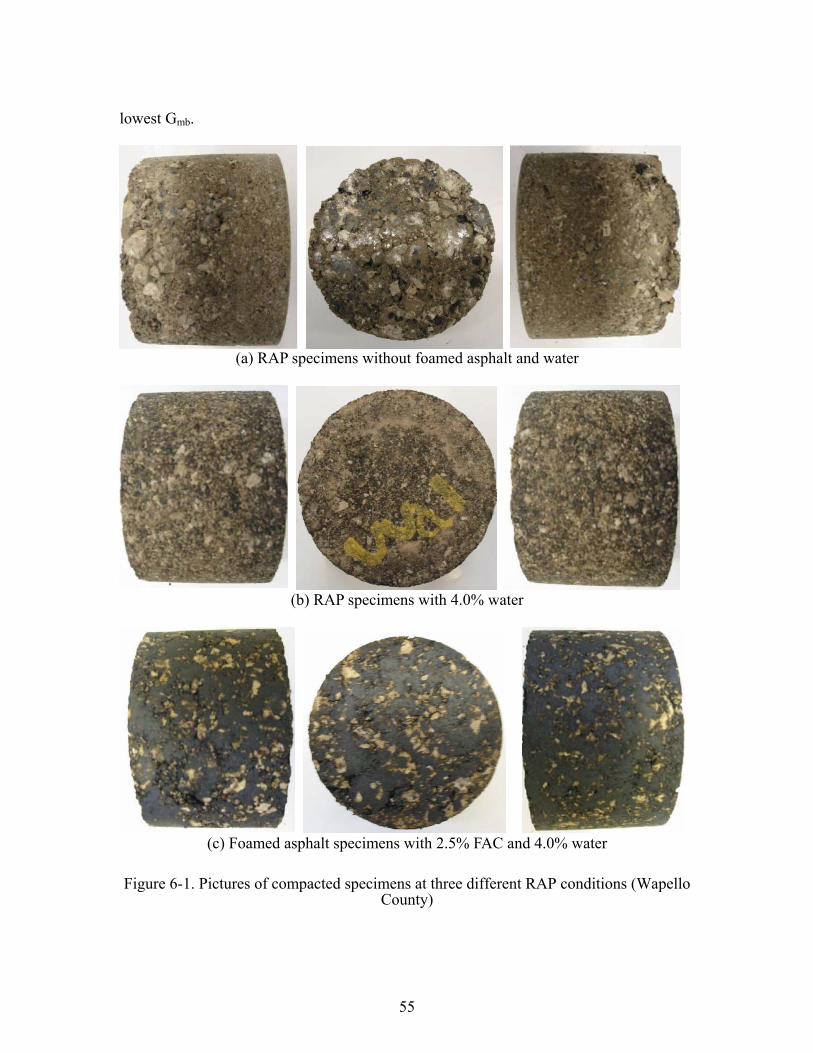
55
lowest Gmb.
(a) RAP specimens without foamed asphalt and water
(b) RAP specimens with 4.0% water
(c) Foamed asphalt specimens with 2.5% FAC and 4.0% water
Figure 6-1. Pictures of compacted specimens at three different RAP conditions (Wapello County)
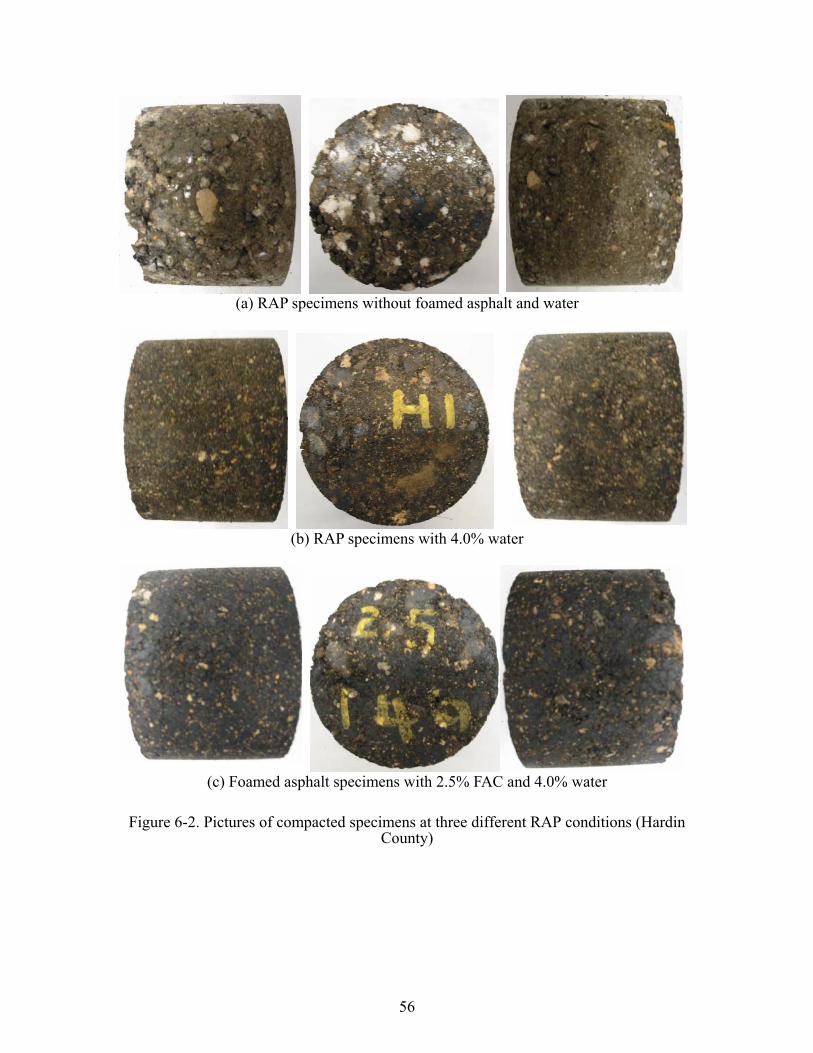
56
(a) RAP specimens without foamed asphalt and water
(b) RAP specimens with 4.0% water
(c) Foamed asphalt specimens with 2.5% FAC and 4.0% water
Figure 6-2. Pictures of compacted specimens at three different RAP conditions (Hardin County)
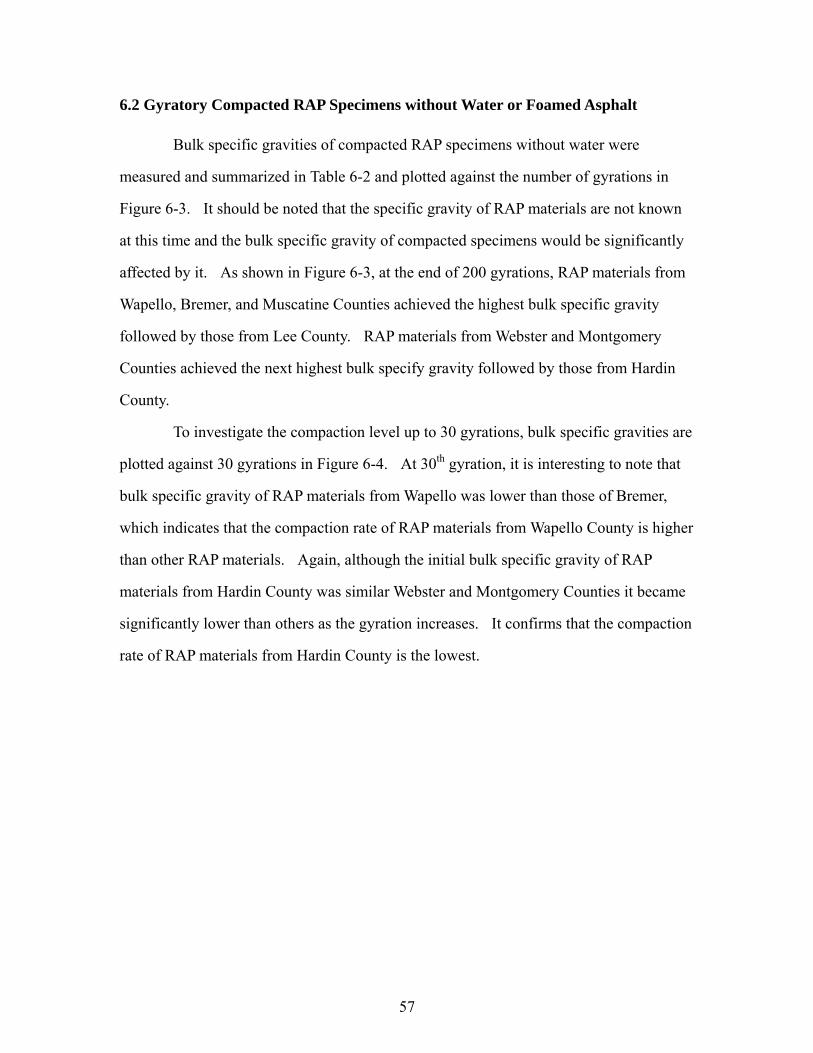
57
6.2 Gyratory Compacted RAP Specimens without Water or Foamed Asphalt
Bulk specific gravities of compacted RAP specimens without water were
measured and summarized in Table 6-2 and plotted against the number of gyrations in
Figure 6-3. It should be noted that the specific gravity of RAP materials are not known
at this time and the bulk specific gravity of compacted specimens would be significantly
affected by it. As shown in Figure 6-3, at the end of 200 gyrations, RAP materials from
Wapello, Bremer, and Muscatine Counties achieved the highest bulk specific gravity
followed by those from Lee County. RAP materials from Webster and Montgomery
Counties achieved the next highest bulk specify gravity followed by those from Hardin
County.
To investigate the compaction level up to 30 gyrations, bulk specific gravities are
plotted against 30 gyrations in Figure 6-4. At 30th gyration, it is interesting to note that
bulk specific gravity of RAP materials from Wapello was lower than those of Bremer,
which indicates that the compaction rate of RAP materials from Wapello County is higher
than other RAP materials. Again, although the initial bulk specific gravity of RAP
materials from Hardin County was similar Webster and Montgomery Counties it became
significantly lower than others as the gyration increases. It confirms that the compaction
rate of RAP materials from Hardin County is the lowest.
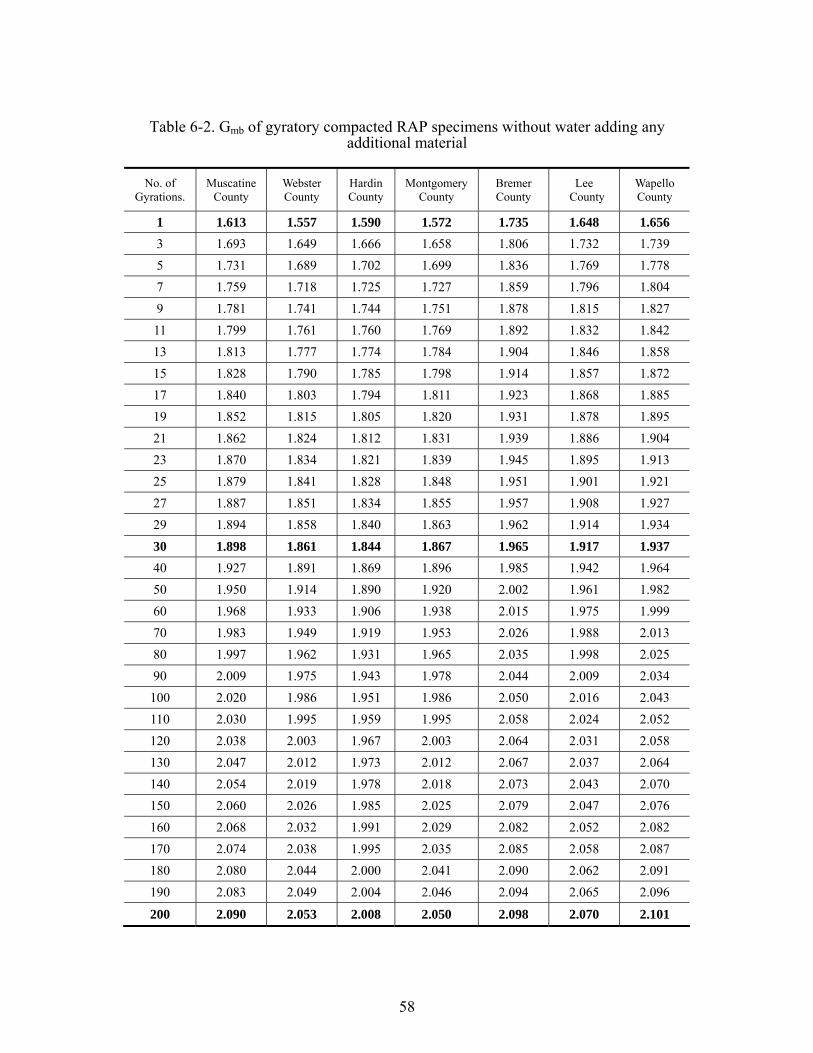
58
Table 6-2. Gmb of gyratory compacted RAP specimens without water adding any additional material
No. of Gyrations.
Muscatine County
Webster County
Hardin County
Montgomery County
Bremer County
Lee County
Wapello County
1 1.613 1.557 1.590 1.572 1.735 1.648 1.656 3 1.693 1.649 1.666 1.658 1.806 1.732 1.739 5 1.731 1.689 1.702 1.699 1.836 1.769 1.778 7 1.759 1.718 1.725 1.727 1.859 1.796 1.804 9 1.781 1.741 1.744 1.751 1.878 1.815 1.827 11 1.799 1.761 1.760 1.769 1.892 1.832 1.842 13 1.813 1.777 1.774 1.784 1.904 1.846 1.858 15 1.828 1.790 1.785 1.798 1.914 1.857 1.872 17 1.840 1.803 1.794 1.811 1.923 1.868 1.885 19 1.852 1.815 1.805 1.820 1.931 1.878 1.895 21 1.862 1.824 1.812 1.831 1.939 1.886 1.904 23 1.870 1.834 1.821 1.839 1.945 1.895 1.913 25 1.879 1.841 1.828 1.848 1.951 1.901 1.921 27 1.887 1.851 1.834 1.855 1.957 1.908 1.927 29 1.894 1.858 1.840 1.863 1.962 1.914 1.934 30 1.898 1.861 1.844 1.867 1.965 1.917 1.937 40 1.927 1.891 1.869 1.896 1.985 1.942 1.964 50 1.950 1.914 1.890 1.920 2.002 1.961 1.982 60 1.968 1.933 1.906 1.938 2.015 1.975 1.999 70 1.983 1.949 1.919 1.953 2.026 1.988 2.013 80 1.997 1.962 1.931 1.965 2.035 1.998 2.025 90 2.009 1.975 1.943 1.978 2.044 2.009 2.034 100 2.020 1.986 1.951 1.986 2.050 2.016 2.043 110 2.030 1.995 1.959 1.995 2.058 2.024 2.052 120 2.038 2.003 1.967 2.003 2.064 2.031 2.058 130 2.047 2.012 1.973 2.012 2.067 2.037 2.064 140 2.054 2.019 1.978 2.018 2.073 2.043 2.070 150 2.060 2.026 1.985 2.025 2.079 2.047 2.076 160 2.068 2.032 1.991 2.029 2.082 2.052 2.082 170 2.074 2.038 1.995 2.035 2.085 2.058 2.087 180 2.080 2.044 2.000 2.041 2.090 2.062 2.091 190 2.083 2.049 2.004 2.046 2.094 2.065 2.096
200 2.090 2.053 2.008 2.050 2.098 2.070 2.101
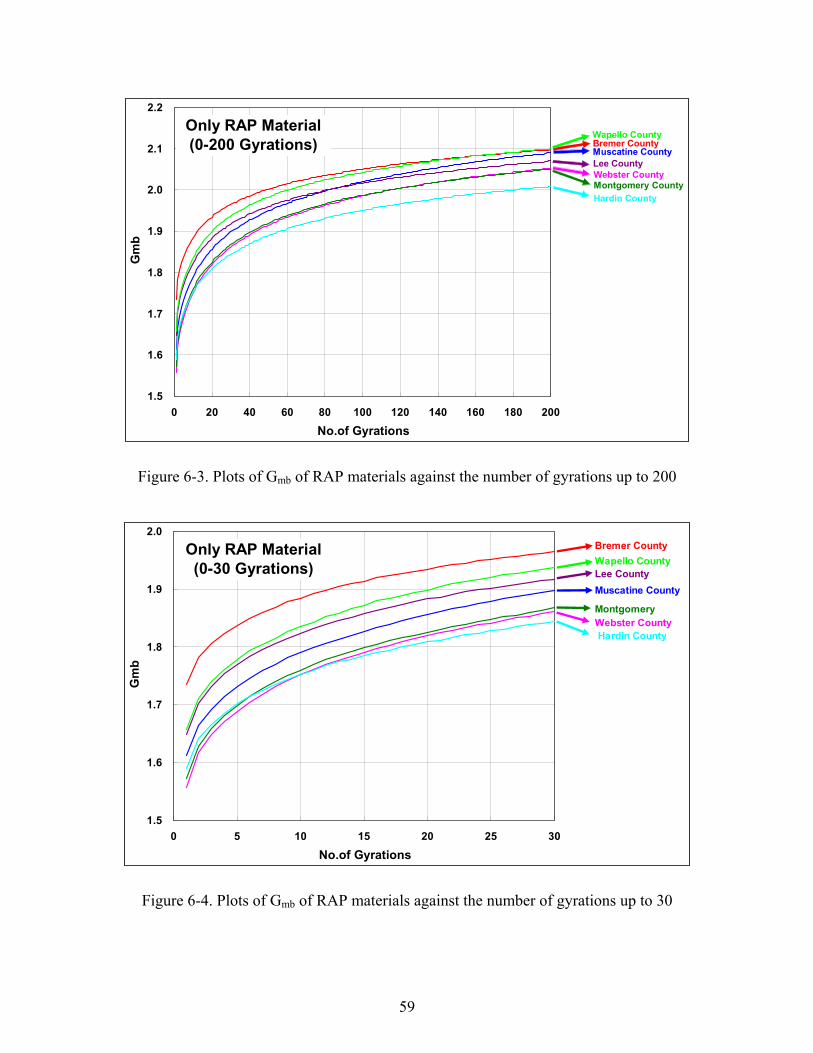
59
1.5
1.6
1.7
1.8
1.9
2.0
2.1
2.2
0 20 40 60 80 100 120 140 160 180 200
No.of Gyrations
Gm
bOnly RAP Material(0-200 Gyrations) Bremer County
Wapello County
Lee CountyMuscatine County
Montgomery CountyWebster County
Hardin County
Figure 6-3. Plots of Gmb of RAP materials against the number of gyrations up to 200
1.5
1.6
1.7
1.8
1.9
2.0
0 5 10 15 20 25 30
No.of Gyrations
Gm
b
Only RAP Material(0-30 Gyrations)
Bremer CountyWapello CountyLee CountyMuscatine County
MontgomeryWebster CountyHardin County
Figure 6-4. Plots of Gmb of RAP materials against the number of gyrations up to 30
60
6.3 Gyratory Compacted RAP Specimens with 4.0% Water
Bulk specific gravities of compacted RAP specimens with 4.0% water were
measured and summarized in Table 6-3 and plotted against the number of gyrations in
Figure 6-5. As shown in Figure 6-5, at the end of 200 gyrations, RAP materials from
Wapello County achieved the highest bulk specific gravity followed by those from
Bremer County. RAP materials from Muscatine, Lee, Webster and Montgomery
Counties achieved the next highest bulk specify gravity followed by those from Hardin
County. Although the bulk specific gravities have significantly increased due to water, it
did not significantly affect the relative compactability of RAP materials.
To investigate the compaction characteristic up to 30 gyrations, bulk specific
gravities are plotted against 30 gyrations in Figure 6-6. At 30th gyrations, it is interesting
to note that bulk specific gravity of RAP materials from Wapello was lower than those of
Bremer, which indicates that the compaction rate of RAP materials from Wapello County
is higher than other RAP materials. Again, although the initial bulk specific gravity of
RAP materials from Hardin County was similar Webster, Muscatine and Montgomery
Counties it became significantly lower than others as the gyration increases. It confirms
that the compaction rate of RAP materials from Hardin County is the lowest.
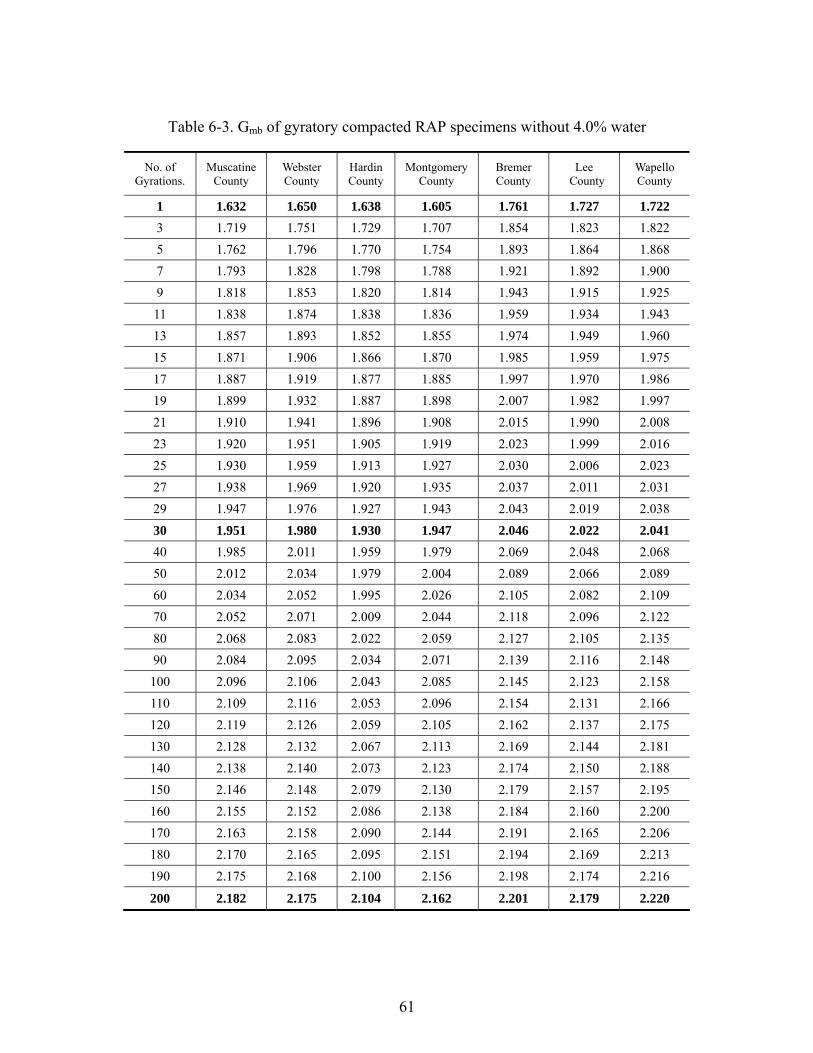
61
Table 6-3. Gmb of gyratory compacted RAP specimens without 4.0% water
No. of Gyrations.
Muscatine County
Webster County
Hardin County
Montgomery County
Bremer County
Lee County
Wapello County
1 1.632 1.650 1.638 1.605 1.761 1.727 1.722 3 1.719 1.751 1.729 1.707 1.854 1.823 1.822 5 1.762 1.796 1.770 1.754 1.893 1.864 1.868 7 1.793 1.828 1.798 1.788 1.921 1.892 1.900 9 1.818 1.853 1.820 1.814 1.943 1.915 1.925 11 1.838 1.874 1.838 1.836 1.959 1.934 1.943 13 1.857 1.893 1.852 1.855 1.974 1.949 1.960 15 1.871 1.906 1.866 1.870 1.985 1.959 1.975 17 1.887 1.919 1.877 1.885 1.997 1.970 1.986 19 1.899 1.932 1.887 1.898 2.007 1.982 1.997 21 1.910 1.941 1.896 1.908 2.015 1.990 2.008 23 1.920 1.951 1.905 1.919 2.023 1.999 2.016 25 1.930 1.959 1.913 1.927 2.030 2.006 2.023 27 1.938 1.969 1.920 1.935 2.037 2.011 2.031 29 1.947 1.976 1.927 1.943 2.043 2.019 2.038 30 1.951 1.980 1.930 1.947 2.046 2.022 2.041 40 1.985 2.011 1.959 1.979 2.069 2.048 2.068 50 2.012 2.034 1.979 2.004 2.089 2.066 2.089 60 2.034 2.052 1.995 2.026 2.105 2.082 2.109 70 2.052 2.071 2.009 2.044 2.118 2.096 2.122 80 2.068 2.083 2.022 2.059 2.127 2.105 2.135 90 2.084 2.095 2.034 2.071 2.139 2.116 2.148 100 2.096 2.106 2.043 2.085 2.145 2.123 2.158 110 2.109 2.116 2.053 2.096 2.154 2.131 2.166 120 2.119 2.126 2.059 2.105 2.162 2.137 2.175 130 2.128 2.132 2.067 2.113 2.169 2.144 2.181 140 2.138 2.140 2.073 2.123 2.174 2.150 2.188 150 2.146 2.148 2.079 2.130 2.179 2.157 2.195 160 2.155 2.152 2.086 2.138 2.184 2.160 2.200 170 2.163 2.158 2.090 2.144 2.191 2.165 2.206 180 2.170 2.165 2.095 2.151 2.194 2.169 2.213 190 2.175 2.168 2.100 2.156 2.198 2.174 2.216
200 2.182 2.175 2.104 2.162 2.201 2.179 2.220
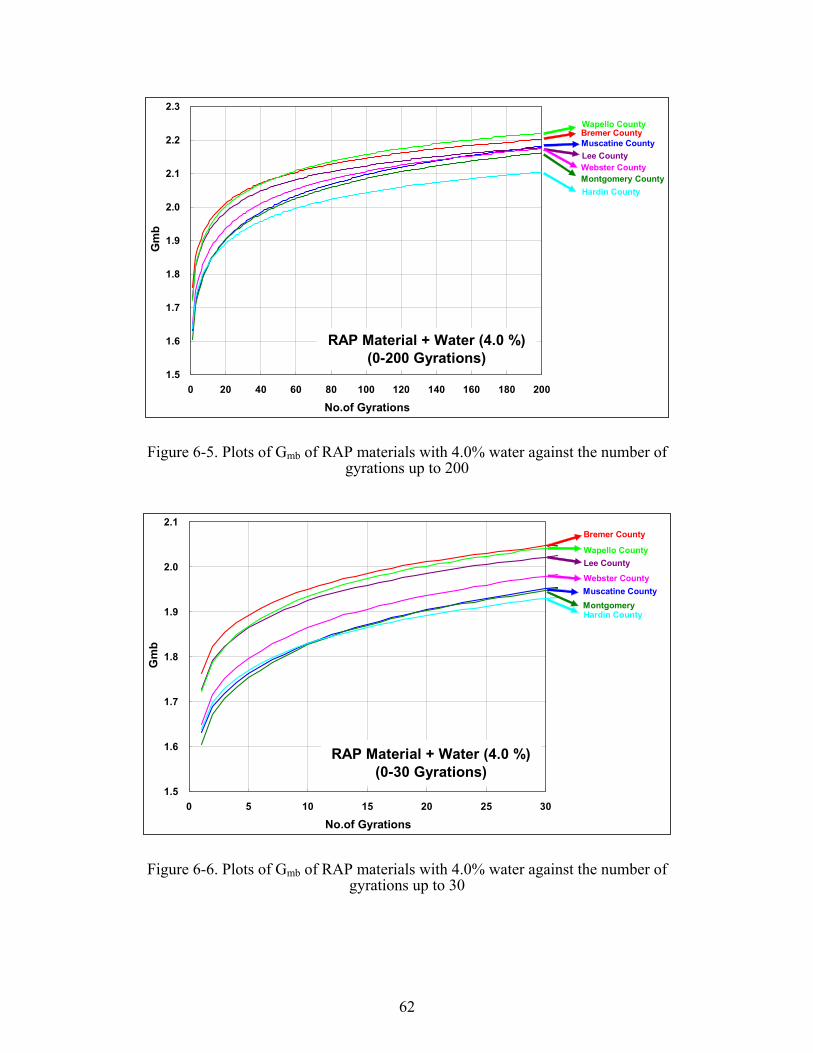
62
1.5
1.6
1.7
1.8
1.9
2.0
2.1
2.2
2.3
0 20 40 60 80 100 120 140 160 180 200
No.of Gyrations
Gm
b
RAP Material + Water (4.0 %)(0-200 Gyrations)
Bremer CountyWapello County
Lee CountyMuscatine County
Montgomery CountyWebster County
Hardin County
Figure 6-5. Plots of Gmb of RAP materials with 4.0% water against the number of gyrations up to 200
1.5
1.6
1.7
1.8
1.9
2.0
2.1
0 5 10 15 20 25 30
No.of Gyrations
Gm
b
RAP Material + Water (4.0 %)(0-30 Gyrations)
Bremer County
Wapello CountyLee County
Muscatine CountyMontgomery
Webster County
Hardin County
Figure 6-6. Plots of Gmb of RAP materials with 4.0% water against the number of gyrations up to 30
63
6.4 Gyratory Compacted RAP Specimens with 4.0% Water and Foamed Asphalt
To investigate compaction characteristics of RAP materials with foamed asphalt,
RAP materials were compacted using a gyratory compactor for five different foamed
asphalt contents while fixing the water content to 4.0%. The compacted specimens were
dried in the oven at 40°C for 3 days. Two specimens were compacted up to 30 gyrations
for each case.
Bulk specific gravities of compacted RAP specimens with foamed asphalt of
1.0%, 1.5%, 2.0%, 2.5%, and 3.0% were measured and plotted against the number of
gyrations in Figure 6-7, Figure 6-8, Figure 6-9, Figure 6-10, and Figure 6-11, respectively.
As can be seen from these figures, at 30th gyration, RAP materials from Wapello County
achieved the highest bulk specific gravity whereas those from Hardin County achieved
the lowest bulk specific gravity. It is interesting to note that the initial bulk specific
gravity of RAP materials from Hardin County was higher than that of RAP materials
from Muscatine County but it gradually became lower than it. Overall, the variation
among specific gravities of different RAP materials decreased as the foamed asphalt
contents increased. For example, at the highest foamed asphalt content of 3.0%, RAP
materials from Bremer, Montgomery, Muscatine, Webster and Lee Counties produced
very similar bulk specific gravity values.

64
1.7
1.8
1.9
2.0
2.1
2.2
2.3
0 5 10 15 20 25 30
No.of Gyrations
Gm
bFAC = 1.0 %
(0-30 Gyrations)Wapello County
Muscatine County
Montgomery CountyWebster County
Hardin County
Bremer County
Figure 6-7. Plots of Gmb of RAP materials with 1.0% FAC against the number of gyrations up to 30
1.7
1.8
1.9
2.0
2.1
2.2
2.3
0 5 10 15 20 25 30
No.of Gyrations
Gm
b
FAC = 1.5 % (0-30 Gyrations)
Bremer CountyWapello County
Lee County
Muscatine County
Montgomery CountyWebster County
Hardin County
Figure 6-8. Plots of Gmb of RAP materials with 1.5% FAC against the number of gyrations up to 30
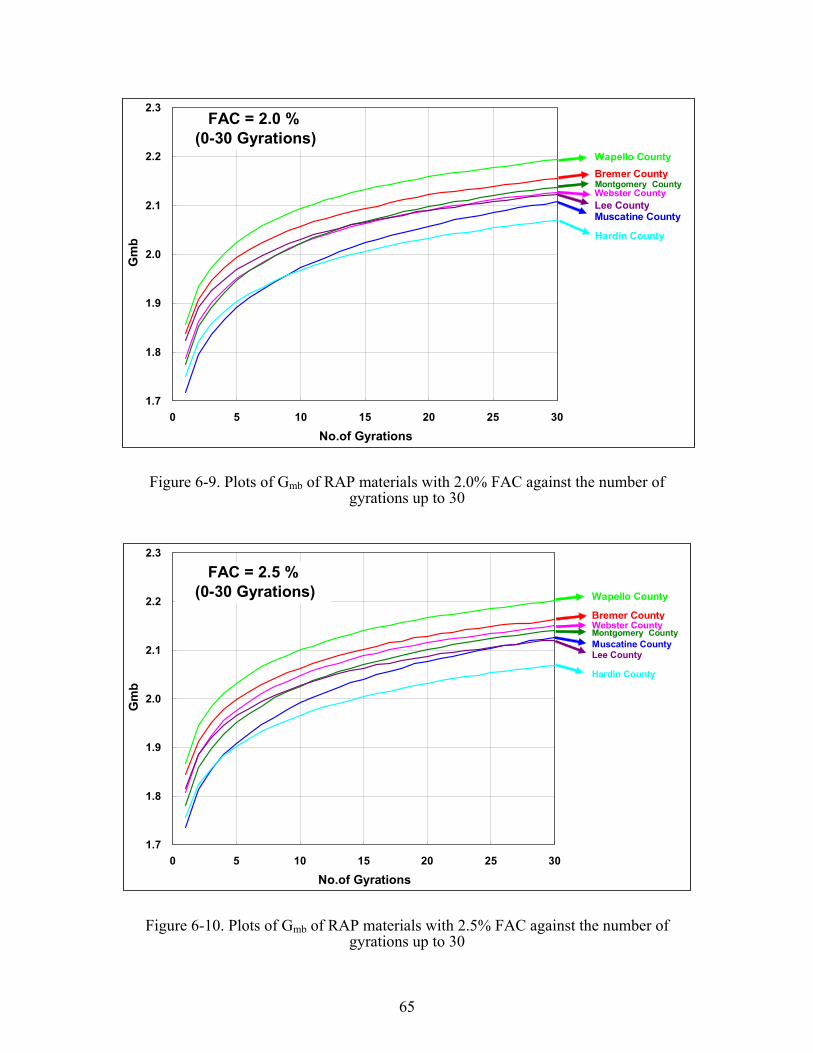
65
1.7
1.8
1.9
2.0
2.1
2.2
2.3
0 5 10 15 20 25 30
No.of Gyrations
Gm
bFAC = 2.0 %
(0-30 Gyrations)
Bremer CountyWapello County
Lee CountyMuscatine County
Montgomery CountyWebster County
Hardin County
Figure 6-9. Plots of Gmb of RAP materials with 2.0% FAC against the number of gyrations up to 30
1.7
1.8
1.9
2.0
2.1
2.2
2.3
0 5 10 15 20 25 30
No.of Gyrations
Gm
b
FAC = 2.5 % (0-30 Gyrations)
Bremer County
Wapello County
Lee CountyMuscatine CountyMontgomery CountyWebster County
Hardin County
Figure 6-10. Plots of Gmb of RAP materials with 2.5% FAC against the number of gyrations up to 30

66
1.7
1.8
1.9
2.0
2.1
2.2
2.3
0 5 10 15 20 25 30
No.of Gyrations
Gm
bFAC = 3.0 %
(0-30 Gyrations)Bremer CountyWapello County
Lee CountyMuscatine County
Montgomery CountyWebster County
Hardin County
Figure 6-11. Plots of Gmb of RAP materials with 3.0% FAC against the number of gyrations up to 30
Bulk specific gravities of seven different RAP specimens compacted without
water or foamed asphalt, with 4.0% water, and with 4.0% water and foamed asphalt of
1.0%, 1.5%, 2.0%, 2.5%, and 3.0% are plotted in Figure 6-12. As can be seen from
Figure 6-12, there is a significant increase in bulk specific gravity by adding foamed
asphalt compared to the mixtures without foamed asphalt. It is interesting to note that
the bulk specific gravities of RAP materials from Bremer, Wapello, and Lee Counties did
not change very much as the foamed asphalt content increased from 1.0 % to 3.0 %.
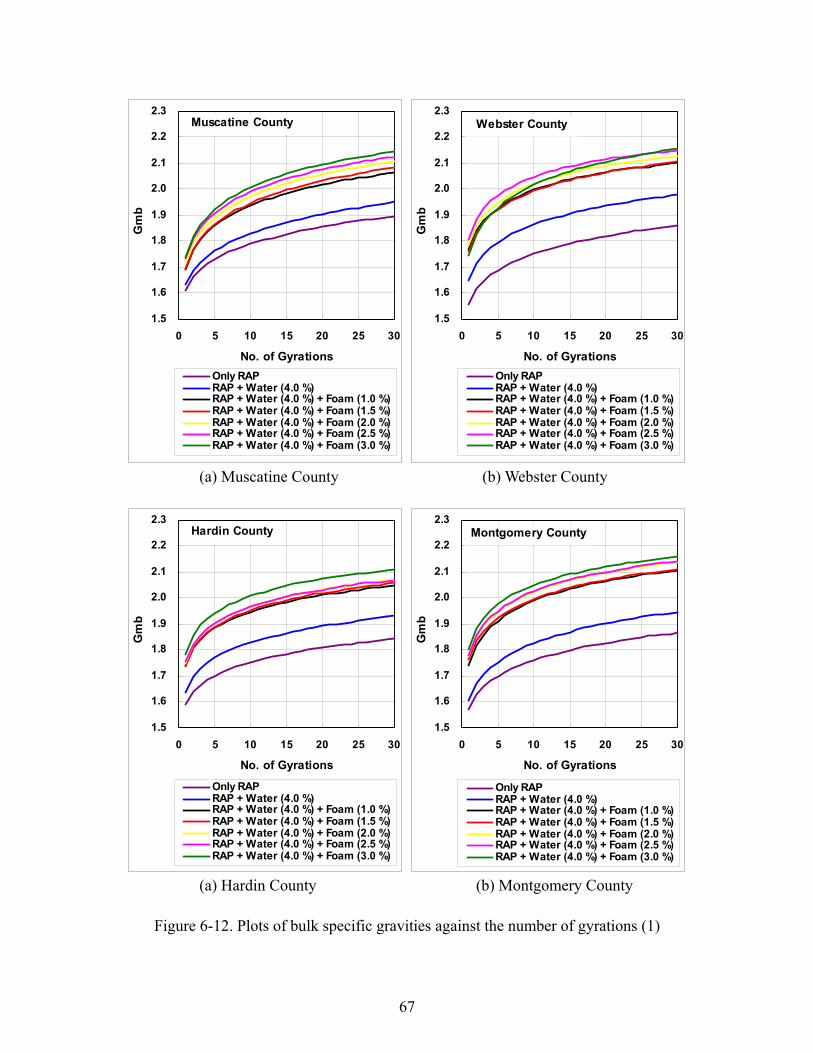
67
1.5
1.6
1.7
1.8
1.9
2.0
2.1
2.2
2.3
0 5 10 15 20 25 30
No. of Gyrations
Gm
b
Only RAPRAP + Water (4.0 %)RAP + Water (4.0 %) + Foam (1.0 %)RAP + Water (4.0 %) + Foam (1.5 %)RAP + Water (4.0 %) + Foam (2.0 %)RAP + Water (4.0 %) + Foam (2.5 %)RAP + Water (4.0 %) + Foam (3.0 %)
Muscatine County
1.5
1.6
1.7
1.8
1.9
2.0
2.1
2.2
2.3
0 5 10 15 20 25 30
No. of Gyrations
Gm
b
Only RAPRAP + Water (4.0 %)RAP + Water (4.0 %) + Foam (1.0 %)RAP + Water (4.0 %) + Foam (1.5 %)RAP + Water (4.0 %) + Foam (2.0 %)RAP + Water (4.0 %) + Foam (2.5 %)RAP + Water (4.0 %) + Foam (3.0 %)
Webster County
(a) Muscatine County (b) Webster County
1.5
1.6
1.7
1.8
1.9
2.0
2.1
2.2
2.3
0 5 10 15 20 25 30
No. of Gyrations
Gm
b
Only RAPRAP + Water (4.0 %)RAP + Water (4.0 %) + Foam (1.0 %)RAP + Water (4.0 %) + Foam (1.5 %)RAP + Water (4.0 %) + Foam (2.0 %)RAP + Water (4.0 %) + Foam (2.5 %)RAP + Water (4.0 %) + Foam (3.0 %)
Hardin County
1.5
1.6
1.7
1.8
1.9
2.0
2.1
2.2
2.3
0 5 10 15 20 25 30
No. of Gyrations
Gm
b
Only RAPRAP + Water (4.0 %)RAP + Water (4.0 %) + Foam (1.0 %)RAP + Water (4.0 %) + Foam (1.5 %)RAP + Water (4.0 %) + Foam (2.0 %)RAP + Water (4.0 %) + Foam (2.5 %)RAP + Water (4.0 %) + Foam (3.0 %)
Montgomery County
(a) Hardin County (b) Montgomery County
Figure 6-12. Plots of bulk specific gravities against the number of gyrations (1)

68
1.5
1.6
1.7
1.8
1.9
2.0
2.1
2.2
2.3
0 5 10 15 20 25 30
No. of Gyrations
Gm
b
Only RAPRAP + Water (4.0 %)RAP + Water (4.0 %) + Foam (1.0 %)RAP + Water (4.0 %) + Foam (1.5 %)RAP + Water (4.0 %) + Foam (2.0 %)RAP + Water (4.0 %) + Foam (2.5 %)RAP + Water (4.0 %) + Foam (3.0 %)
Bremer County
1.5
1.6
1.7
1.8
1.9
2.0
2.1
2.2
2.3
0 5 10 15 20 25 30
No. of Gyrations
Gm
b
Only RAPRAP + Water (4.0 %)RAP + Water (4.0 %) + Foam (1.0 %)RAP + Water (4.0 %) + Foam (1.5 %)RAP + Water (4.0 %) + Foam (2.0 %)RAP + Water (4.0 %) + Foam (2.5 %)RAP + Water (4.0 %) + Foam (3.0 %)
Lee County
(e) Bremer County (f) Lee County
1.5
1.6
1.7
1.8
1.9
2.0
2.1
2.2
2.3
0 5 10 15 20 25 30
No. of Gyrations
Gm
b
Only RAPRAP + Water (4.0 %)RAP + Water (4.0 %) + Foam (1.0 %)RAP + Water (4.0 %) + Foam (1.5 %)RAP + Water (4.0 %) + Foam (2.0 %)RAP + Water (4.0 %) + Foam (2.5 %)RAP + Water (4.0 %) + Foam (3.0 %)
Wapello County
(g) Wapello County
Figure 6-13. Plots of bulk specific gravities against the number of gyrations (2)

69
7. VALIDATION OF MIX DESIGN AGAINST VARIOUS RAP MATERIALS
During the phase I, a mix design was performed based on both Marshall and
indirect tensile tests on both dry and wet test specimens. Based on the results obtained
from the phase I study, the indirect tensile test on wet gyratory compacted test specimen
was recommended as the most appropriate mix design test procedure (rather than
Marshall mix design). The developed mix design process should be validated if it is
applicable for different RAP materials. Therefore, indirect tensile test was performed on
wet specimens from seven different RAP sources at five different foamed asphalt contents.
As shown in Table 7-1, the mix design parameters identified from phase 1 study
were adopted for five different foamed asphalts (1.0%, 1.5%, 2.0%. 2.5%, and 3.0%) and
one fixed water content (4.0%).
Table 7-1. Design parameters for validation of laboratory mix design
Asphalt Binder PG 52-34
Foaming Temperature (°C) 170 °C
Foaming Water Content (%) 1.3 %
Foamed Asphalt Content (%) 1.0 %, 1.5 %, 2.0 %. 2.5 %, and 3.0 %
Water Content of RAP (%) 4.0 %
7.1 Sample Preparation
First, the number of gyrations, which would produce the same density as the one
compacted using Marshall hammer with 75 blows should be determined. Table 7-2
shows the number of test specimens prepared for a combination of five foamed asphalt
contents, two compaction methods (Marshall at 75 below and gyratory compactor at 30
gyrations), and two curing temperatures (40°C and 60°C) using seven different sources of
RAP materials. Each test specimen was used to measure the bulk specific gravity and the
indirect tensile strength at wet condition.
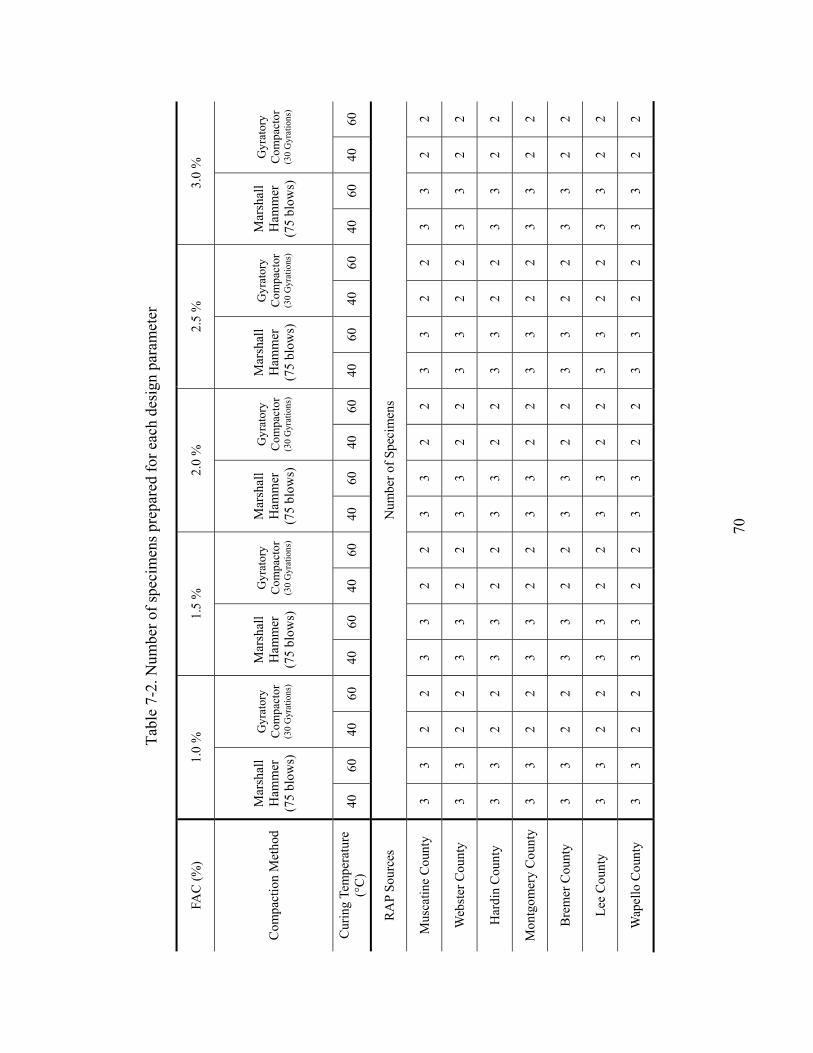
70
Tabl
e 7-
2. N
umbe
r of s
peci
men
s pre
pare
d fo
r eac
h de
sign
par
amet
er
FAC
(%)
1.0
%
1.5
%
2.0
%
2.5
%
3.0
%
Com
pact
ion
Met
hod
Mar
shal
l H
amm
er
(75
blow
s)
Gyr
ator
y C
ompa
ctor
(3
0 G
yrat
ions
)
Mar
shal
l H
amm
er
(75
blow
s)
Gyr
ator
y C
ompa
ctor
(3
0 G
yrat
ions
)
Mar
shal
l H
amm
er
(75
blow
s)
Gyr
ator
y C
ompa
ctor
(3
0 G
yrat
ions
)
Mar
shal
l H
amm
er
(75
blow
s)
Gyr
ator
y C
ompa
ctor
(3
0 G
yrat
ions
)
Mar
shal
l H
amm
er
(75
blow
s)
Gyr
ator
y C
ompa
ctor
(3
0 G
yrat
ions
)
Cur
ing
Tem
pera
ture
(°
C)
40
60
40
60
40
60
40
60
40
60
40
60
40
60
40
60
40
60
40
60
RA
P So
urce
s N
umbe
r of S
peci
men
s
Mus
catin
e C
ount
y 3
3 2
2 3
3 2
2 3
3 2
2 3
3 2
2 3
3 2
2
Web
ster
Cou
nty
3 3
2 2
3 3
2 2
3 3
2 2
3 3
2 2
3 3
2 2
Har
din
Cou
nty
3 3
2 2
3 3
2 2
3 3
2 2
3 3
2 2
3 3
2 2
Mon
tgom
ery
Cou
nty
3 3
2 2
3 3
2 2
3 3
2 2
3 3
2 2
3 3
2 2
Bre
mer
Cou
nty
3 3
2 2
3 3
2 2
3 3
2 2
3 3
2 2
3 3
2 2
Lee
Cou
nty
3 3
2 2
3 3
2 2
3 3
2 2
3 3
2 2
3 3
2 2
Wap
ello
Cou
nty
3 3
2 2
3 3
2 2
3 3
2 2
3 3
2 2
3 3
2 2

71
7.2 Visual Observation
Generally, gyratory compacted specimens exhibited black color on the surface as
shown in Figure 7-1 (a) whereas Marshall hammer compacted specimens exhibited
brown color as shown in Figure 7-1 (b). As shown in Figure 7-2, specimens cured at
60°C exhibited darker color on the surface than those cured at 40 °C.
(a) Gyratory compacted specimens (b) Marshall compacted specimens
Figure 7-1. Pictures of gyratory and Marshall compacted specimens (FAC=2.5%)
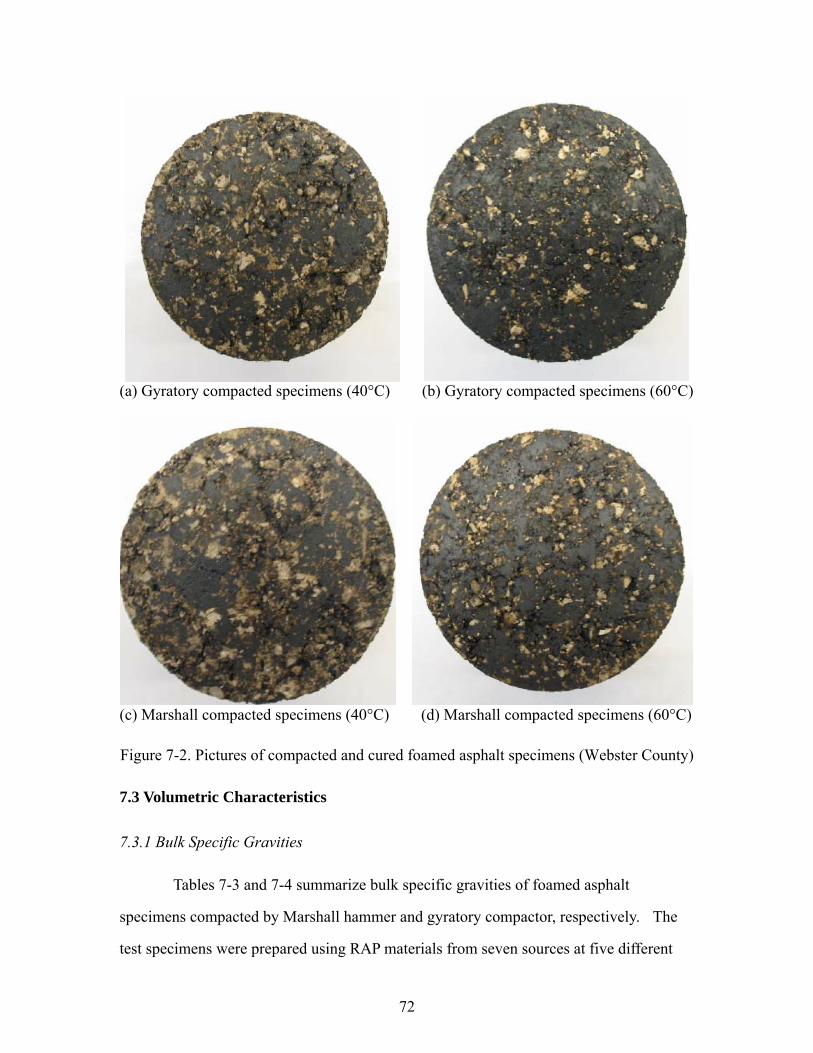
72
(a) Gyratory compacted specimens (40°C) (b) Gyratory compacted specimens (60°C)
(c) Marshall compacted specimens (40°C) (d) Marshall compacted specimens (60°C)
Figure 7-2. Pictures of compacted and cured foamed asphalt specimens (Webster County)
7.3 Volumetric Characteristics
7.3.1 Bulk Specific Gravities
Tables 7-3 and 7-4 summarize bulk specific gravities of foamed asphalt
specimens compacted by Marshall hammer and gyratory compactor, respectively. The
test specimens were prepared using RAP materials from seven sources at five different

73
foamed asphalt contents (1.0 %, 1.5 %, 2.0 %, 2.5 % and 3.0 %), cured at two different
temperatures (40°C and 60°C).
Bulk specific gravities are plotted against foamed asphalt contents for Marshall
hammer compaction at 40°C in Figure 7-3, gyratory compaction at 40°C in Figure 7-4,
Marshall hammer compaction at 60°C in Figure 7-5, and gyratory compaction at 60°C in
Figure 7-6. As shown in these figures, the bulk specific gravity of specimens compacted
by gyratory compactor at 30 gyrations seemed to be close to that of specimens compacted
by Marshall hammer at 75 blow. Overall, the bulk specific gravities seemed to increase
as the foamed asphalt content increased. RAP materials from Hardin County showed the
lowest value where as those from Wapello County showed highest value.
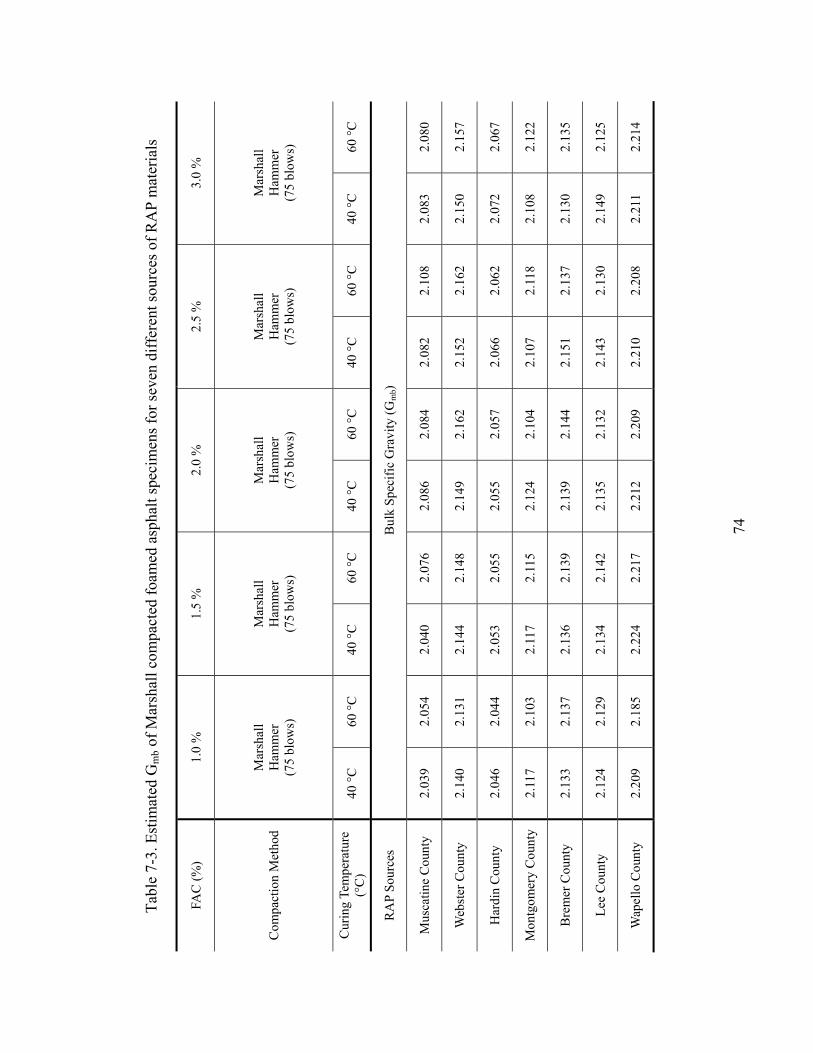
74
Tabl
e 7-
3. E
stim
ated
Gm
b of M
arsh
all c
ompa
cted
foam
ed a
spha
lt sp
ecim
ens f
or se
ven
diff
eren
t sou
rces
of R
AP
mat
eria
ls
FAC
(%)
1.0
%
1.5
%
2.0
%
2.5
%
3.0
%
Com
pact
ion
Met
hod
Mar
shal
l H
amm
er
(75
blow
s)
Mar
shal
l H
amm
er
(75
blow
s)
Mar
shal
l H
amm
er
(75
blow
s)
Mar
shal
l H
amm
er
(75
blow
s)
Mar
shal
l H
amm
er
(75
blow
s)
Cur
ing
Tem
pera
ture
(°
C)
40 °C
60
°C
40 °C
60
°C
40 °C
60
°C
40 °C
60
°C
40 °C
60
°C
RA
P So
urce
s B
ulk
Spec
ific
Gra
vity
(Gm
b)
Mus
catin
e C
ount
y 2.
039
2.05
4 2.
040
2.07
6 2.
086
2.08
4 2.
082
2.10
8 2.
083
2.08
0
Web
ster
Cou
nty
2.14
0 2.
131
2.14
4 2.
148
2.14
9 2.
162
2.15
2 2.
162
2.15
0 2.
157
Har
din
Cou
nty
2.04
6 2.
044
2.05
3 2.
055
2.05
5 2.
057
2.06
6 2.
062
2.07
2 2.
067
Mon
tgom
ery
Cou
nty
2.11
7 2.
103
2.11
7 2.
115
2.12
4 2.
104
2.10
7 2.
118
2.10
8 2.
122
Bre
mer
Cou
nty
2.13
3 2.
137
2.13
6 2.
139
2.13
9 2.
144
2.15
1 2.
137
2.13
0 2.
135
Lee
Cou
nty
2.12
4 2.
129
2.13
4 2.
142
2.13
5 2.
132
2.14
3 2.
130
2.14
9 2.
125
Wap
ello
Cou
nty
2.20
9 2.
185
2.22
4 2.
217
2.21
2 2.
209
2.21
0 2.
208
2.21
1 2.
214

75
Table 7-4. Estimated G
mb of gyratory com
pacted foamed asphalt specim
ens for seven different sources of RA
P materials
FAC
(%)
1.0 %
1.5 %
2.0 %
2.5 %
3.0 %
Com
paction Method
Gyratory
Com
pactor (30 G
yrations)
Gyratory
Com
pactor (30 G
yrations)
Gyratory
Com
pactor (30 G
yrations)
Gyratory
Com
pactor (30 G
yrations)
Gyratory
Com
pactor (30 G
yrations)
Curing Tem
perature (°C
) 40 °C
60 °C
40 °C
60 °C
40 °C
60 °C
40 °C
60 °C
40 °C
60 °C
RA
P Sources B
ulk Specific Gravity (G
mb )
Muscatine C
ounty 2.064
2.100 2.083
2.125 2.107
2.155 2.125
2.180 2.146
2.178
Webster C
ounty 2.102
2.126 2.106
2.138 2.127
2.151 2.151
2.173 2.157
2.178
Hardin C
ounty 2.048
2.068 2.057
2.092 2.068
2.093 2.069
2.120 2.111
2.129
Montgom
ery County
2.106 2.142
2.110 2.142
2.138 2.163
2.141 2.169
2.158 2.175
Brem
er County
2.122 2.133
2.149 2.156
2.156 2.176
2.162 2.185
2.158 2.183
Lee County
2.105 2.116
2.111 2.132
2.122 2.138
2.120 2.141
2.136 2.156
Wapello C
ounty 2.174
2.196 2.177
2.211 2.193
2.213 2.002
2.227 2.191
2.210
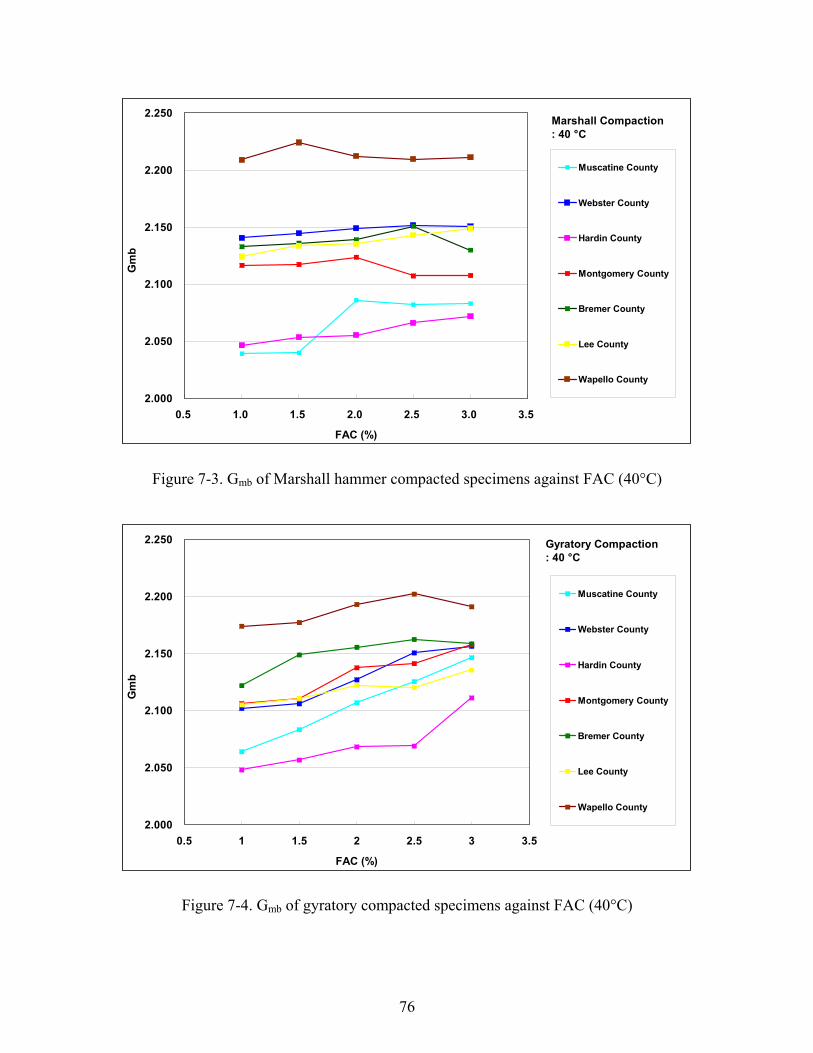
76
2.000
2.050
2.100
2.150
2.200
2.250
0.5 1.0 1.5 2.0 2.5 3.0 3.5
FAC (%)
Gm
b
Muscatine County
Webster County
Hardin County
Montgomery County
Bremer County
Lee County
Wapello County
Marshall Compaction: 40 °C
Figure 7-3. Gmb of Marshall hammer compacted specimens against FAC (40°C)
2.000
2.050
2.100
2.150
2.200
2.250
0.5 1 1.5 2 2.5 3 3.5
FAC (%)
Gm
b
Muscatine County
Webster County
Hardin County
Montgomery County
Bremer County
Lee County
Wapello County
Gyratory Compaction: 40 °C
Figure 7-4. Gmb of gyratory compacted specimens against FAC (40°C)
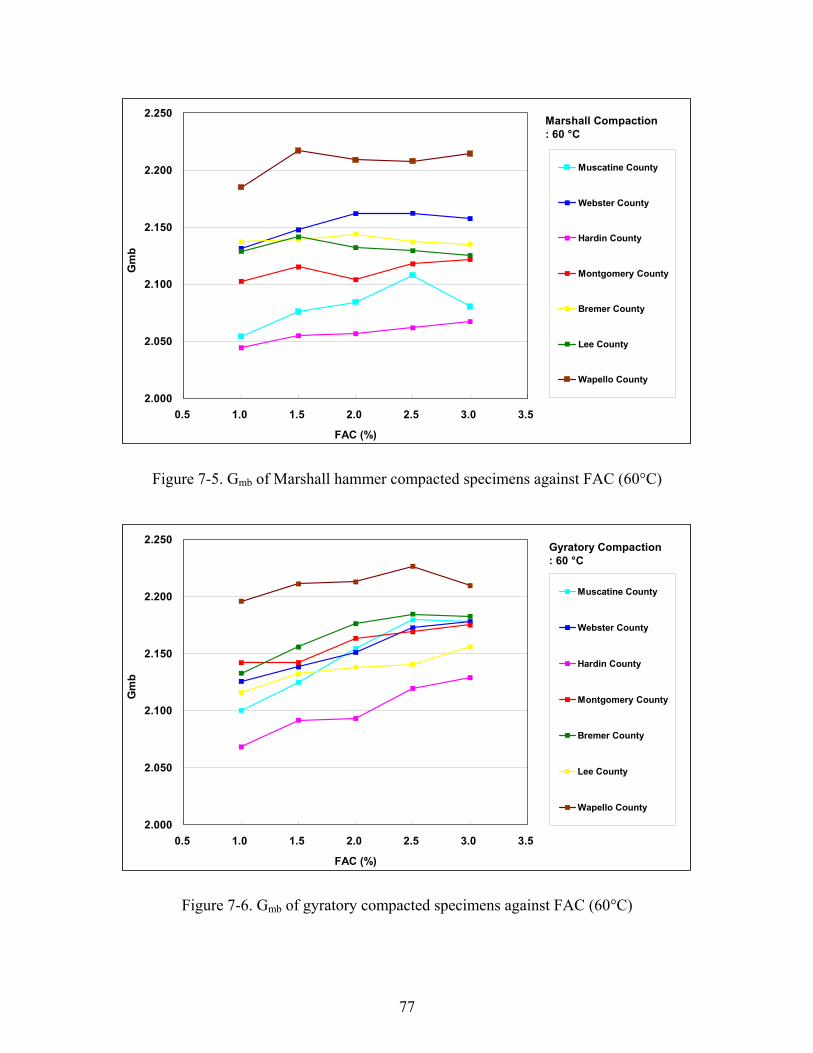
77
2.000
2.050
2.100
2.150
2.200
2.250
0.5 1.0 1.5 2.0 2.5 3.0 3.5
FAC (%)
Gm
b
Muscatine County
Webster County
Hardin County
Montgomery County
Bremer County
Lee County
Wapello County
Marshall Compaction: 60 °C
Figure 7-5. Gmb of Marshall hammer compacted specimens against FAC (60°C)
2.000
2.050
2.100
2.150
2.200
2.250
0.5 1.0 1.5 2.0 2.5 3.0 3.5
FAC (%)
Gm
b
Muscatine County
Webster County
Hardin County
Montgomery County
Bremer County
Lee County
Wapello County
Gyratory Compaction: 60 °C
Figure 7-6. Gmb of gyratory compacted specimens against FAC (60°C)
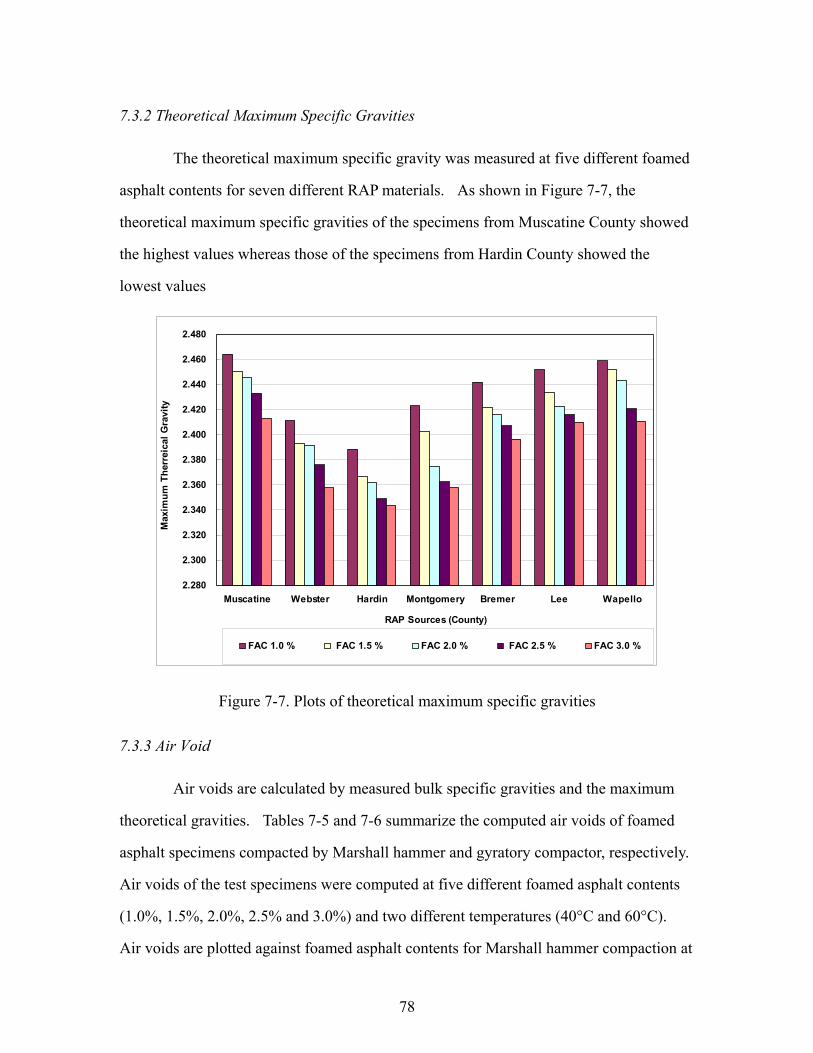
78
7.3.2 Theoretical Maximum Specific Gravities
The theoretical maximum specific gravity was measured at five different foamed
asphalt contents for seven different RAP materials. As shown in Figure 7-7, the
theoretical maximum specific gravities of the specimens from Muscatine County showed
the highest values whereas those of the specimens from Hardin County showed the
lowest values
2.280
2.300
2.320
2.340
2.360
2.380
2.400
2.420
2.440
2.460
2.480
Muscatine Webster Hardin Montgomery Bremer Lee Wapello
RAP Sources (County)
Max
imum
The
rrei
cal G
ravi
ty
FAC 1.0 % FAC 1.5 % FAC 2.0 % FAC 2.5 % FAC 3.0 %
Figure 7-7. Plots of theoretical maximum specific gravities
7.3.3 Air Void
Air voids are calculated by measured bulk specific gravities and the maximum
theoretical gravities. Tables 7-5 and 7-6 summarize the computed air voids of foamed
asphalt specimens compacted by Marshall hammer and gyratory compactor, respectively.
Air voids of the test specimens were computed at five different foamed asphalt contents
(1.0%, 1.5%, 2.0%, 2.5% and 3.0%) and two different temperatures (40°C and 60°C).
Air voids are plotted against foamed asphalt contents for Marshall hammer compaction at

79
40°C in Figure 7-8, gyratory compaction at 40°C in Figure 7-9, Marshall hammer
compaction at 60°C in Figure 7-10, and gyratory compaction at 60°C in Figure 7-11. As
expected, air voids decreased gradually as the foamed asphalt content increased.
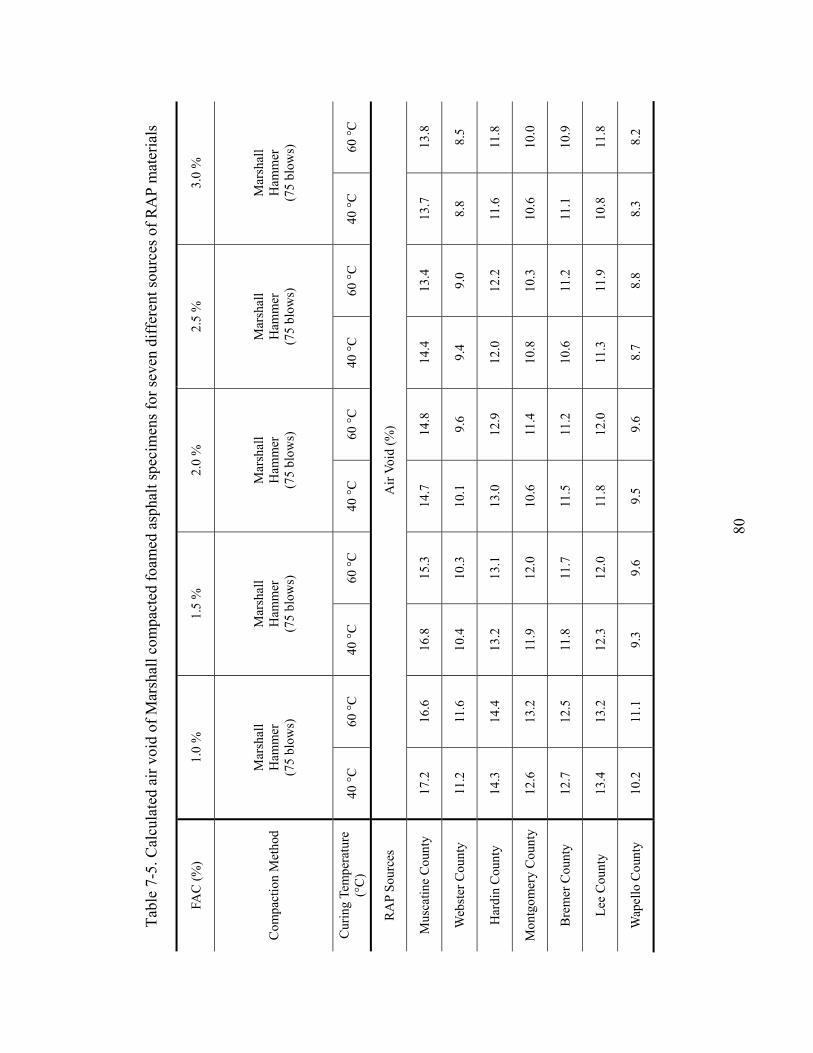
80
Tabl
e 7-
5. C
alcu
late
d ai
r voi
d of
Mar
shal
l com
pact
ed fo
amed
asp
halt
spec
imen
s for
seve
n di
ffer
ent s
ourc
es o
f RA
P m
ater
ials
FAC
(%)
1.0
%
1.5
%
2.0
%
2.5
%
3.0
%
Com
pact
ion
Met
hod
Mar
shal
l H
amm
er
(75
blow
s)
Mar
shal
l H
amm
er
(75
blow
s)
Mar
shal
l H
amm
er
(75
blow
s)
Mar
shal
l H
amm
er
(75
blow
s)
Mar
shal
l H
amm
er
(75
blow
s)
Cur
ing
Tem
pera
ture
(°
C)
40 °C
60
°C
40 °C
60
°C
40 °C
60
°C
40 °C
60
°C
40 °C
60
°C
RA
P So
urce
s A
ir Vo
id (%
)
Mus
catin
e C
ount
y 17
.2
16.6
16
.8
15.3
14
.7
14.8
14
.4
13.4
13
.7
13.8
Web
ster
Cou
nty
11.2
11
.6
10.4
10
.3
10.1
9.
6 9.
4 9.
0 8.
8 8.
5
Har
din
Cou
nty
14.3
14
.4
13.2
13
.1
13.0
12
.9
12.0
12
.2
11.6
11
.8
Mon
tgom
ery
Cou
nty
12.6
13
.2
11.9
12
.0
10.6
11
.4
10.8
10
.3
10.6
10
.0
Bre
mer
Cou
nty
12.7
12
.5
11.8
11
.7
11.5
11
.2
10.6
11
.2
11.1
10
.9
Lee
Cou
nty
13.4
13
.2
12.3
12
.0
11.8
12
.0
11.3
11
.9
10.8
11
.8
Wap
ello
Cou
nty
10.2
11
.1
9.3
9.6
9.5
9.6
8.7
8.8
8.3
8.2
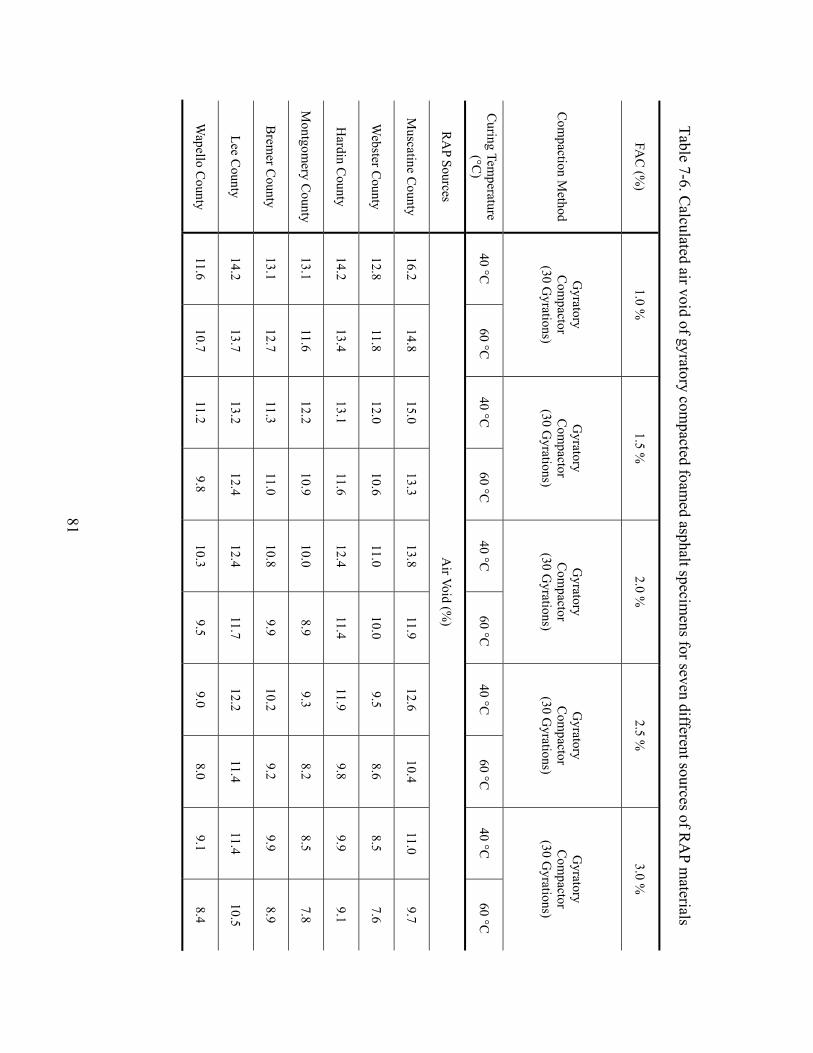
81
Table 7-6. Calculated air void of gyratory com
pacted foamed asphalt specim
ens for seven different sources of RA
P materials
FAC
(%)
1.0 %
1.5 %
2.0 %
2.5 %
3.0 %
Com
paction Method
Gyratory
Com
pactor (30 G
yrations)
Gyratory
Com
pactor (30 G
yrations)
Gyratory
Com
pactor (30 G
yrations)
Gyratory
Com
pactor (30 G
yrations)
Gyratory
Com
pactor (30 G
yrations)
Curing Tem
perature (°C
) 40 °C
60 °C
40 °C
60 °C
40 °C
60 °C
40 °C
60 °C
40 °C
60 °C
RA
P Sources A
ir Void (%)
Muscatine C
ounty 16.2
14.8 15.0
13.3 13.8
11.9 12.6
10.4 11.0
9.7
Webster C
ounty 12.8
11.8 12.0
10.6 11.0
10.0 9.5
8.6 8.5
7.6
Hardin C
ounty 14.2
13.4 13.1
11.6 12.4
11.4 11.9
9.8 9.9
9.1
Montgom
ery County
13.1 11.6
12.2 10.9
10.0 8.9
9.3 8.2
8.5 7.8
Brem
er County
13.1 12.7
11.3 11.0
10.8 9.9
10.2 9.2
9.9 8.9
Lee County
14.2 13.7
13.2 12.4
12.4 11.7
12.2 11.4
11.4 10.5
Wapello C
ounty 11.6
10.7 11.2
9.8 10.3
9.5 9.0
8.0 9.1
8.4
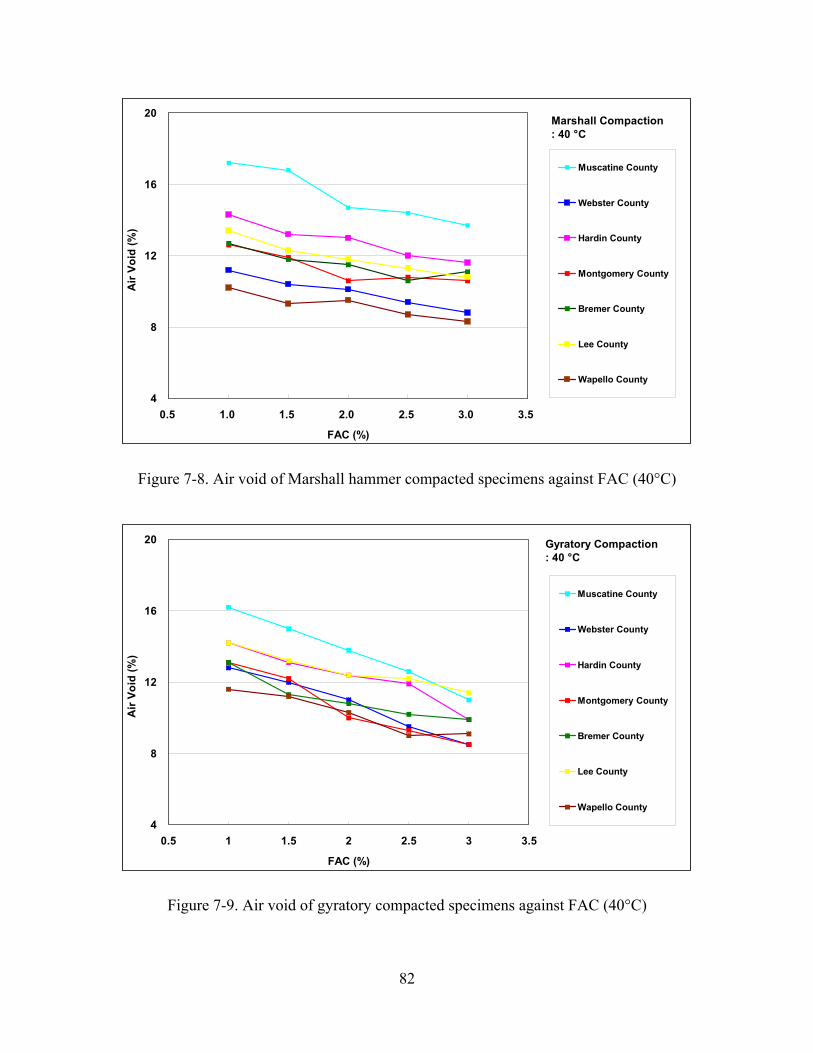
82
4
8
12
16
20
0.5 1.0 1.5 2.0 2.5 3.0 3.5
FAC (%)
Air
Void
(%)
Muscatine County
Webster County
Hardin County
Montgomery County
Bremer County
Lee County
Wapello County
Marshall Compaction: 40 °C
Figure 7-8. Air void of Marshall hammer compacted specimens against FAC (40°C)
4
8
12
16
20
0.5 1 1.5 2 2.5 3 3.5
FAC (%)
Air
Void
(%)
Muscatine County
Webster County
Hardin County
Montgomery County
Bremer County
Lee County
Wapello County
Gyratory Compaction: 40 °C
Figure 7-9. Air void of gyratory compacted specimens against FAC (40°C)
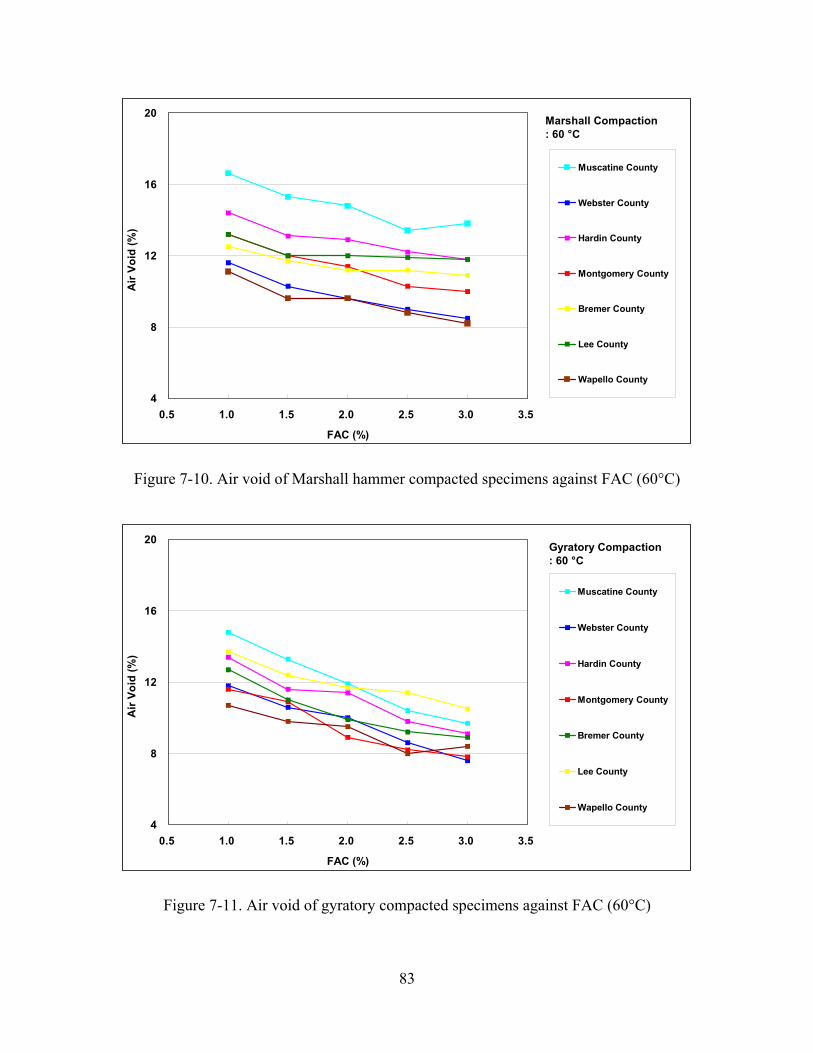
83
4
8
12
16
20
0.5 1.0 1.5 2.0 2.5 3.0 3.5
FAC (%)
Air
Void
(%)
Muscatine County
Webster County
Hardin County
Montgomery County
Bremer County
Lee County
Wapello County
Marshall Compaction: 60 °C
Figure 7-10. Air void of Marshall hammer compacted specimens against FAC (60°C)
4
8
12
16
20
0.5 1.0 1.5 2.0 2.5 3.0 3.5
FAC (%)
Air
Void
(%)
Muscatine County
Webster County
Hardin County
Montgomery County
Bremer County
Lee County
Wapello County
Gyratory Compaction: 60 °C
Figure 7-11. Air void of gyratory compacted specimens against FAC (60°C)

84
7.4 Wet Indirect Tensile Strength
For the Indirect tensile test, a total of 10 specimens were prepared for each RAP
source: 1) three for Marshall hammer compacted and cured at 40˚C for three days, 2)
three for Marshall hammer compacted and cured at 60˚C for two days, 3) two for
gyratory compacted and cured at 40˚C for three days and 4) two for gyratory compacted
and cured at 60˚C for two days. After oven curing, the specimens were allowed to cool
to room temperature. This normally took about 2 hours, but it was reduced to 15
minutes if a fan was used. Specimens were placed in 25˚C water for 30 minutes as
shown in Figure 7-12 (a), vacuumed at 20 mmHg for 30 minutes as shown in Figure 7-12
(b), and remained under water for additional 30 minutes as shown in Figure 7-12 (c).
(a) Soaking (b) Vacuuming (c) Soaking
Figure 7-12. Vacuum saturation procedure for making wet specimens
Tables 7-7 and 7-8 summarize indirect tensile strengths of foamed asphalt
specimens compacted by Marshall hammer and gyratory compactor, respectively. The
test specimens were prepared using RAP materials from seven sources at five different
foamed asphalt contents (1.0%, 1.5%, 2.0%, 2.5% and 3.0%) and cured at two different
temperatures (40°C and 60°C). Indirect tensile strengths are plotted against foamed
asphalt contents for Marshall hammer compaction at 40°C in Figure 7-13, gyratory
compaction at 40°C in Figure 7-14, Marshall hammer compaction at 60°C in Figure 7-15,

85
and gyratory compaction at 60°C in Figure 7-16. As shown in these figures, the indirect
tensile strength of the gyratory compacted specimens is higher than that of Marshall
hammer compacted specimens. Indirect tensile strength of foamed asphalt specimens
cured at 60°C for two days is significantly higher than that of foamed asphalt specimens
cured at 40°C for three days. There is a clear peak in indirect strength test results
obtained from gyratory compacted specimens cured at 60°C.
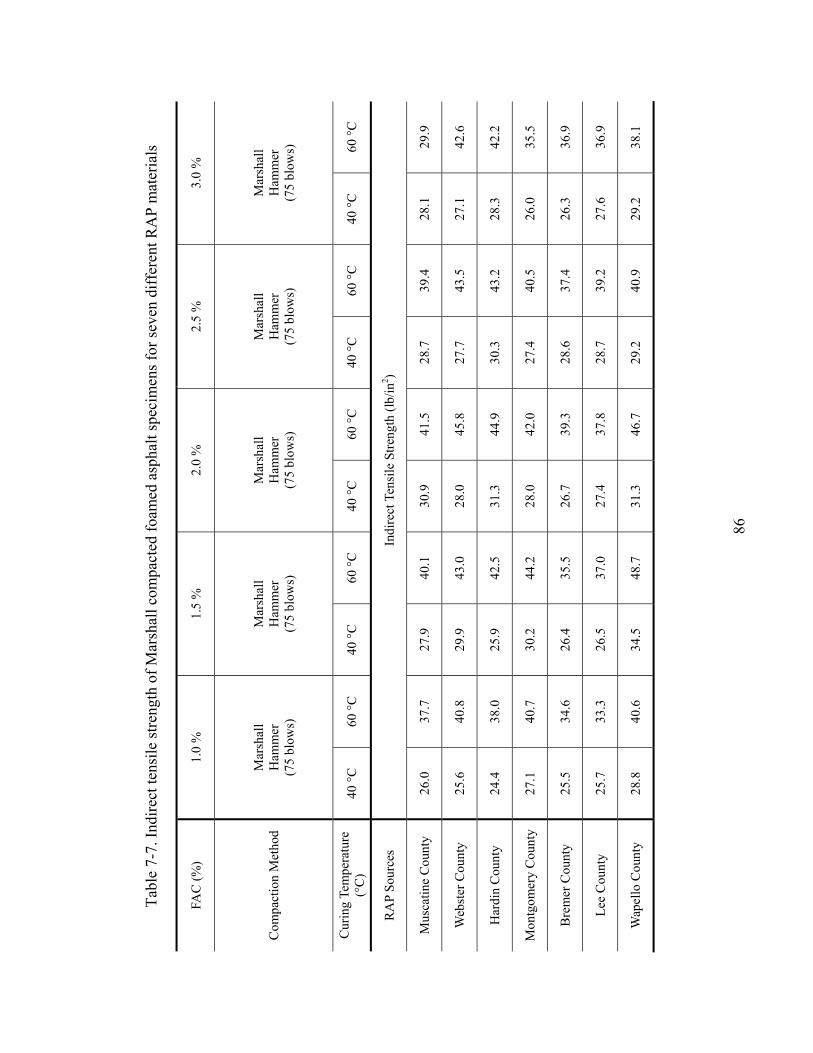
86
Tabl
e 7-
7. In
dire
ct te
nsile
stre
ngth
of M
arsh
all c
ompa
cted
foam
ed a
spha
lt sp
ecim
ens f
or se
ven
diff
eren
t RA
P m
ater
ials
FAC
(%)
1.0
%
1.5
%
2.0
%
2.5
%
3.0
%
Com
pact
ion
Met
hod
Mar
shal
l H
amm
er
(75
blow
s)
Mar
shal
l H
amm
er
(75
blow
s)
Mar
shal
l H
amm
er
(75
blow
s)
Mar
shal
l H
amm
er
(75
blow
s)
Mar
shal
l H
amm
er
(75
blow
s)
Cur
ing
Tem
pera
ture
(°
C)
40 °C
60
°C
40 °C
60
°C
40 °C
60
°C
40 °C
60
°C
40 °C
60
°C
RA
P So
urce
s In
dire
ct T
ensi
le S
treng
th (l
b/in
2 )
Mus
catin
e C
ount
y 26
.0
37.7
27
.9
40.1
30
.9
41.5
28
.7
39.4
28
.1
29.9
Web
ster
Cou
nty
25.6
40
.8
29.9
43
.0
28.0
45
.8
27.7
43
.5
27.1
42
.6
Har
din
Cou
nty
24.4
38
.0
25.9
42
.5
31.3
44
.9
30.3
43
.2
28.3
42
.2
Mon
tgom
ery
Cou
nty
27.1
40
.7
30.2
44
.2
28.0
42
.0
27.4
40
.5
26.0
35
.5
Bre
mer
Cou
nty
25.5
34
.6
26.4
35
.5
26.7
39
.3
28.6
37
.4
26.3
36
.9
Lee
Cou
nty
25.7
33
.3
26.5
37
.0
27.4
37
.8
28.7
39
.2
27.6
36
.9
Wap
ello
Cou
nty
28.8
40
.6
34.5
48
.7
31.3
46
.7
29.2
40
.9
29.2
38
.1
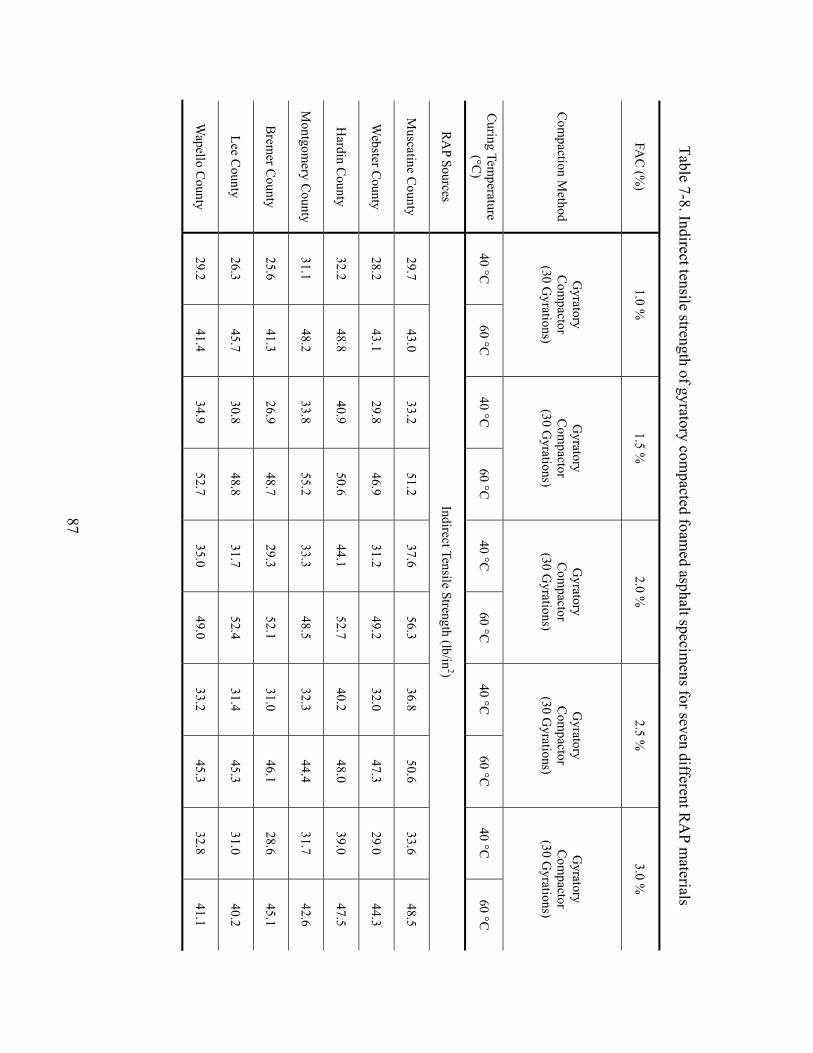
87
Table 7-8. Indirect tensile strength of gyratory compacted foam
ed asphalt specimens for seven different R
AP m
aterials
FAC
(%)
1.0 %
1.5 %
2.0 %
2.5 %
3.0 %
Com
paction Method
Gyratory
Com
pactor (30 G
yrations)
Gyratory
Com
pactor (30 G
yrations)
Gyratory
Com
pactor (30 G
yrations)
Gyratory
Com
pactor (30 G
yrations)
Gyratory
Com
pactor (30 G
yrations)
Curing Tem
perature (°C
) 40 °C
60 °C
40 °C
60 °C
40 °C
60 °C
40 °C
60 °C
40 °C
60 °C
RA
P Sources Indirect Tensile Strength (lb/in
2)
Muscatine C
ounty 29.7
43.0 33.2
51.2 37.6
56.3 36.8
50.6 33.6
48.5
Webster C
ounty 28.2
43.1 29.8
46.9 31.2
49.2 32.0
47.3 29.0
44.3
Hardin C
ounty 32.2
48.8 40.9
50.6 44.1
52.7 40.2
48.0 39.0
47.5
Montgom
ery County
31.1 48.2
33.8 55.2
33.3 48.5
32.3 44.4
31.7 42.6
Brem
er County
25.6 41.3
26.9 48.7
29.3 52.1
31.0 46.1
28.6 45.1
Lee County
26.3 45.7
30.8 48.8
31.7 52.4
31.4 45.3
31.0 40.2
Wapello C
ounty 29.2
41.4 34.9
52.7 35.0
49.0 33.2
45.3 32.8
41.1
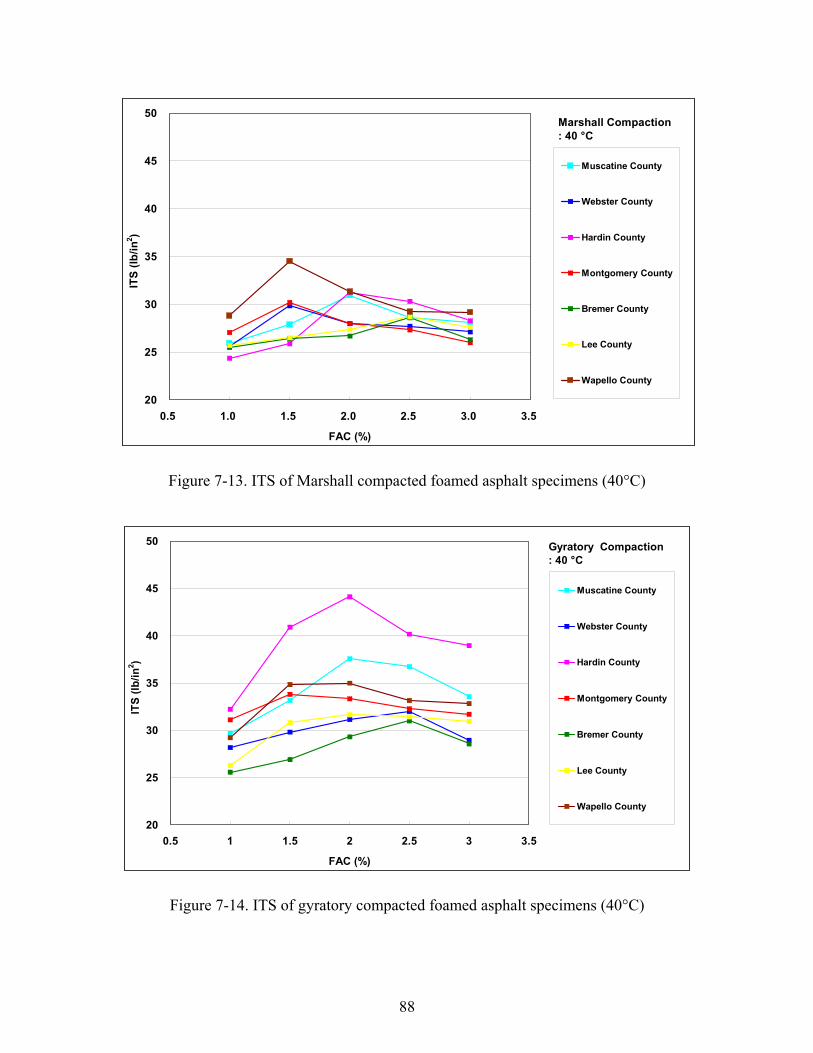
88
20
25
30
35
40
45
50
0.5 1.0 1.5 2.0 2.5 3.0 3.5
FAC (%)
ITS
(lb/in
2 )
Muscatine County
Webster County
Hardin County
Montgomery County
Bremer County
Lee County
Wapello County
Marshall Compaction: 40 °C
Figure 7-13. ITS of Marshall compacted foamed asphalt specimens (40°C)
20
25
30
35
40
45
50
0.5 1 1.5 2 2.5 3 3.5
FAC (%)
ITS
(lb/in
2 )
Muscatine County
Webster County
Hardin County
Montgomery County
Bremer County
Lee County
Wapello County
Gyratory Compaction: 40 °C
Figure 7-14. ITS of gyratory compacted foamed asphalt specimens (40°C)

89
20
25
30
35
40
45
50
55
60
0.5 1.0 1.5 2.0 2.5 3.0 3.5
FAC (%)
ITS
(lb/in
2 )
Muscatine County
Webster County
Hardin County
Montgomery County
Bremer County
Lee County
Wapello County
Marshall Compaction: 60 °C
Figure 7-15. ITS of Marshall compacted foamed asphalt specimens (60°C)
20.0
25.0
30.0
35.0
40.0
45.0
50.0
55.0
60.0
0.5 1.0 1.5 2.0 2.5 3.0 3.5
FAC (%)
ITS
(lb/in
2 )
Muscatine County
Webster County
Hardin County
Montgomery County
Bremer County
Lee County
Wapello County
Gyratory Compaction: 60 °C
Figure 7-16. ITS of gyratory compacted foamed asphalt specimens (60°C)

90
7.5 Correlations between OFAC and RAP Characteristics
The indirect tensile strength test on vacuum-saturated specimens was conducted
using these RAP materials at five foamed asphalt contents, 1.0%, 1.5%, 2.0%, 2.5%, and
3.0%, given a fixed moisture content of 4.0%. The specimens compacted by gyratory
compactor at 30 gyrations and by Marshall hammer at 75 blows were prepared and they
were cured at 40°C oven for three days and 60°C for two days, respectively. The
indirect tensile strength of gyratory compacted and vacuum-saturated specimens was
more sensitive to foamed asphalt contents than that of Marshall compacted and vacuum-
saturated specimens. The indirect tensile strength of CIR-foam specimens cured for two
days at 60°C oven was significantly higher than that of CIR-foam specimens cured for
three days at 40°C oven.
The optimum foamed asphalt content was determined when the highest indirect
tensile strength of vacuum saturated specimens was obtained. Based on the test results,
neither air voids nor flat and elongation characteristics of RAP materials affected the
indirect tensile strength of the CIR-foam mixtures.
Attempts were made to discover a correlation between foamed asphalt content
and RAP characteristics such as residual asphalt stiffness and residual asphalt content.
As shown in Figures 7-17 and 7-18, the optimum foamed asphalt content (OFAC) was
determined based on a polynomial regression equation and the results are summarized in
Table 7-9. A higher OFAC value was obtained from the RAP materials containing large
amount of hard residual asphalt. As shown in Figure 7-19 and Figure 7-21, a strong
correlation between OFAC and stiffness of residual asphalt exhibits, but no correlation
between OFAC and residual asphalt contents.
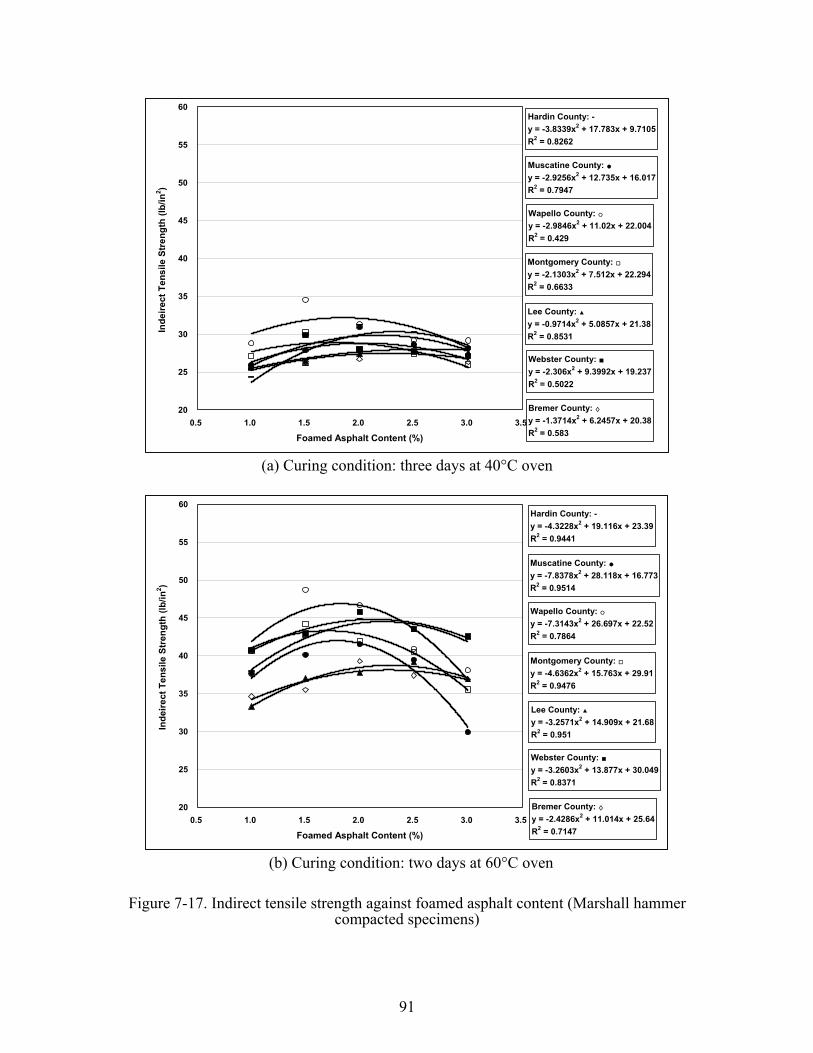
91
Hardin County: -y = -3.8339x2 + 17.783x + 9.7105R2 = 0.8262
Muscatine County: ●y = -2.9256x2 + 12.735x + 16.017R2 = 0.7947
Wapello County: ○y = -2.9846x2 + 11.02x + 22.004R2 = 0.429
Montgomery County: □y = -2.1303x2 + 7.512x + 22.294R2 = 0.6633
Lee County: ▲y = -0.9714x2 + 5.0857x + 21.38R2 = 0.8531
Webster County: ■y = -2.306x2 + 9.3992x + 19.237R2 = 0.5022
Bremer County: ◊y = -1.3714x2 + 6.2457x + 20.38R2 = 0.583
20
25
30
35
40
45
50
55
60
0.5 1.0 1.5 2.0 2.5 3.0 3.5
Foamed Asphalt Content (%)
Inde
irect
Ten
sile
Str
engt
h (lb
/in2 )
(a) Curing condition: three days at 40°C oven
Hardin County: -y = -4.3228x2 + 19.116x + 23.39R2 = 0.9441
Muscatine County: ●y = -7.8378x2 + 28.118x + 16.773R2 = 0.9514
Wapello County: ○y = -7.3143x2 + 26.697x + 22.52R2 = 0.7864
Montgomery County: □y = -4.6362x2 + 15.763x + 29.91R2 = 0.9476
Lee County: ▲y = -3.2571x2 + 14.909x + 21.68R2 = 0.951
Webster County: ■y = -3.2603x2 + 13.877x + 30.049R2 = 0.8371
Bremer County: ◊y = -2.4286x2 + 11.014x + 25.64R2 = 0.7147
20
25
30
35
40
45
50
55
60
0.5 1.0 1.5 2.0 2.5 3.0 3.5
Foamed Asphalt Content (%)
Inde
irect
Ten
sile
Str
engt
h (lb
/in2 )
(b) Curing condition: two days at 60°C oven
Figure 7-17. Indirect tensile strength against foamed asphalt content (Marshall hammer compacted specimens)
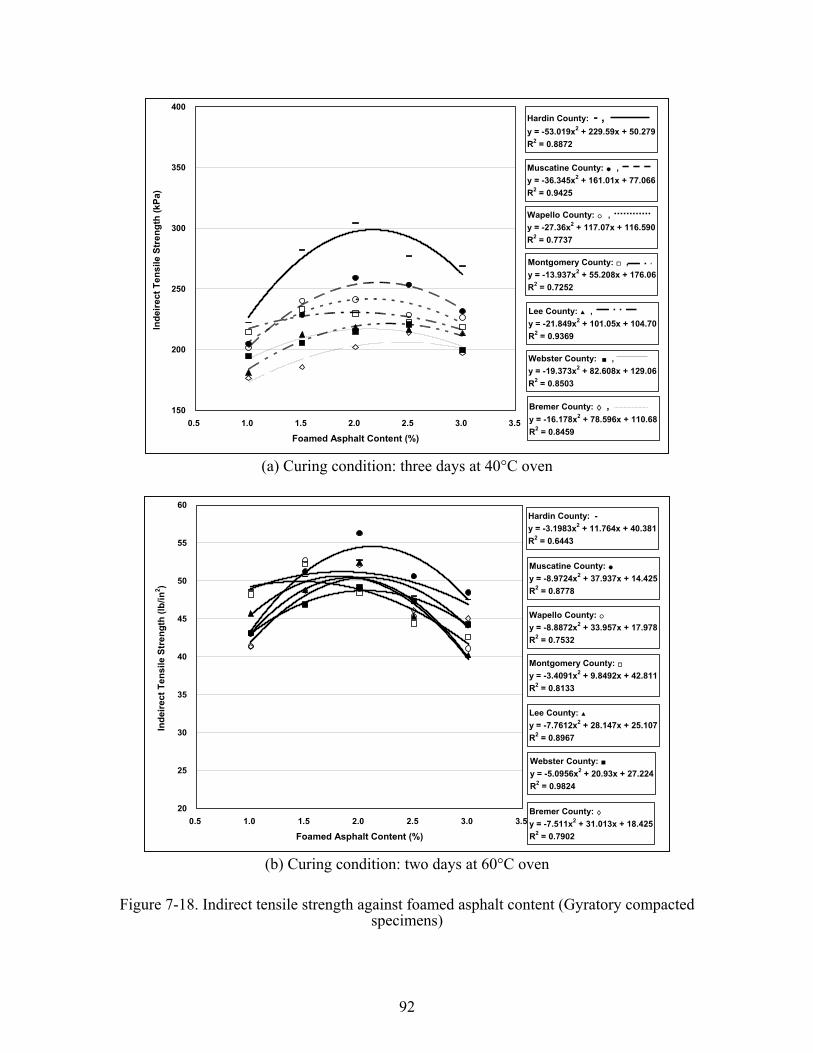
92
Hardin County: - ,y = -53.019x2 + 229.59x + 50.279R2 = 0.8872
Muscatine County: ● ,y = -36.345x2 + 161.01x + 77.066R2 = 0.9425
Wapello County: ○ ,y = -27.36x2 + 117.07x + 116.590R2 = 0.7737
Montgomery County: □ ,y = -13.937x2 + 55.208x + 176.06R2 = 0.7252
Lee County: ▲ ,y = -21.849x2 + 101.05x + 104.70R2 = 0.9369
Webster County: ■ ,y = -19.373x2 + 82.608x + 129.06R2 = 0.8503
Bremer County: ◊ ,y = -16.178x2 + 78.596x + 110.68R2 = 0.8459
150
200
250
300
350
400
0.5 1.0 1.5 2.0 2.5 3.0 3.5
Foamed Asphalt Content (%)
Inde
irect
Ten
sile
Str
engt
h (k
Pa)
(a) Curing condition: three days at 40°C oven
Hardin County: -y = -3.1983x2 + 11.764x + 40.381R2 = 0.6443
Muscatine County: ●y = -8.9724x2 + 37.937x + 14.425R2 = 0.8778
Wapello County: ○y = -8.8872x2 + 33.957x + 17.978R2 = 0.7532
Montgomery County: □y = -3.4091x2 + 9.8492x + 42.811R2 = 0.8133
Lee County: ▲y = -7.7612x2 + 28.147x + 25.107R2 = 0.8967
Webster County: ■y = -5.0956x2 + 20.93x + 27.224R2 = 0.9824
Bremer County: ◊y = -7.511x2 + 31.013x + 18.425R2 = 0.7902
20
25
30
35
40
45
50
55
60
0.5 1.0 1.5 2.0 2.5 3.0 3.5
Foamed Asphalt Content (%)
Inde
irect
Ten
sile
Str
engt
h (lb
/in2 )
(b) Curing condition: two days at 60°C oven
Figure 7-18. Indirect tensile strength against foamed asphalt content (Gyratory compacted specimens)
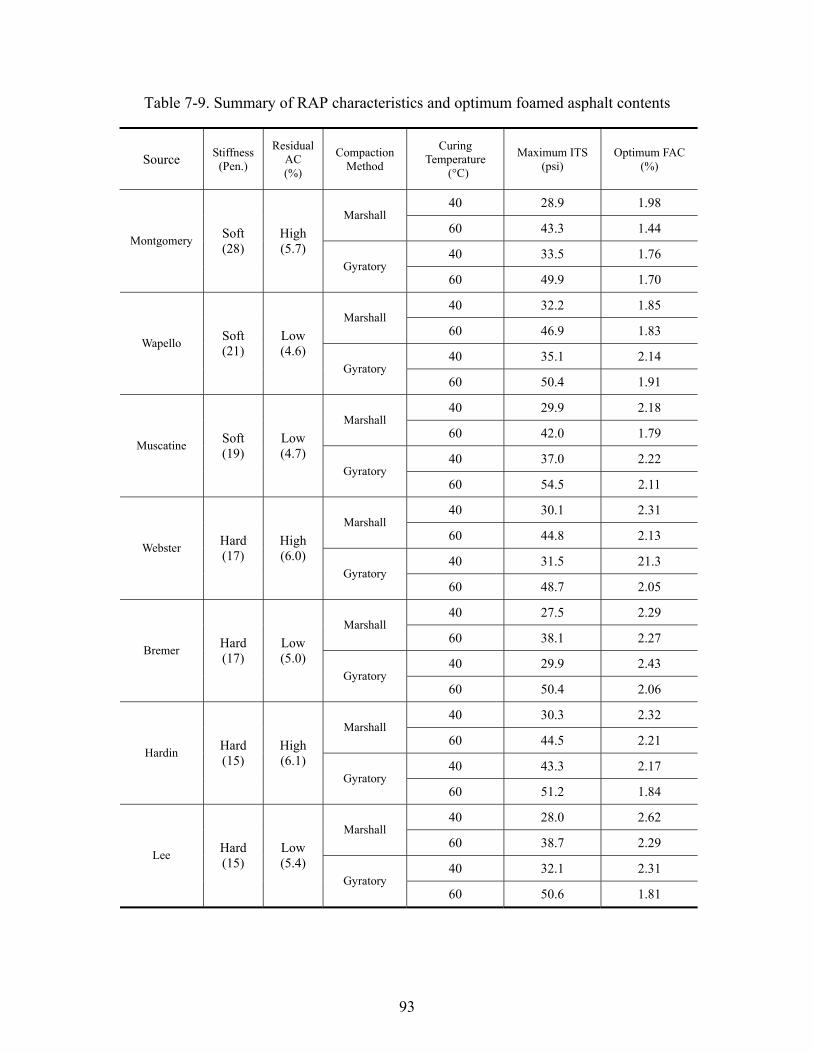
93
Table 7-9. Summary of RAP characteristics and optimum foamed asphalt contents
Source Stiffness (Pen.)
Residual AC (%)
Compaction Method
Curing Temperature
(°C)
Maximum ITS (psi)
Optimum FAC (%)
40 28.9 1.98 Marshall
60 43.3 1.44
40 33.5 1.76 Montgomery Soft
(28) High (5.7)
Gyratory 60 49.9 1.70
40 32.2 1.85 Marshall
60 46.9 1.83
40 35.1 2.14 Wapello Soft
(21) Low (4.6)
Gyratory 60 50.4 1.91
40 29.9 2.18 Marshall
60 42.0 1.79
40 37.0 2.22 Muscatine Soft
(19) Low (4.7)
Gyratory 60 54.5 2.11
40 30.1 2.31 Marshall
60 44.8 2.13
40 31.5 21.3 Webster Hard
(17) High (6.0)
Gyratory 60 48.7 2.05
40 27.5 2.29 Marshall
60 38.1 2.27
40 29.9 2.43 Bremer Hard
(17) Low (5.0)
Gyratory 60 50.4 2.06
40 30.3 2.32 Marshall
60 44.5 2.21
40 43.3 2.17 Hardin Hard
(15) High (6.1)
Gyratory 60 51.2 1.84
40 28.0 2.62 Marshall
60 38.7 2.29
40 32.1 2.31 Lee Hard
(15) Low (5.4)
Gyratory 60 50.6 1.81
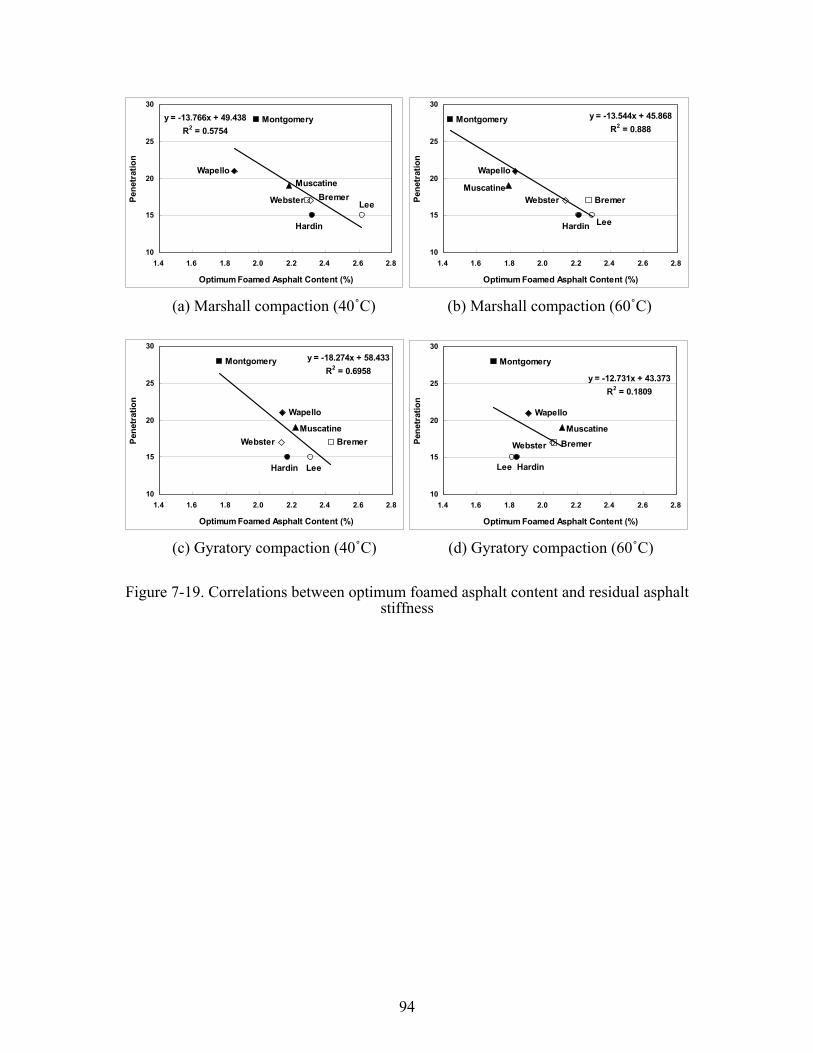
94
WapelloMuscatine
Hardin
Webster Lee
Montgomery
Bremer
y = -13.766x + 49.438R2 = 0.5754
10
15
20
25
30
1.4 1.6 1.8 2.0 2.2 2.4 2.6 2.8
Optimum Foamed Asphalt Content (%)
Pene
trat
ion
Wapello
Muscatine
Hardin
Webster
Lee
Montgomery
Bremer
y = -13.544x + 45.868R2 = 0.888
10
15
20
25
30
1.4 1.6 1.8 2.0 2.2 2.4 2.6 2.8
Optimum Foamed Asphalt Content (%)
Pene
trat
ion
(a) Marshall compaction (40˚C) (b) Marshall compaction (60˚C)
Wapello
Muscatine
Hardin
Webster
Lee
Montgomery
Bremer
y = -18.274x + 58.433R2 = 0.6958
10
15
20
25
30
1.4 1.6 1.8 2.0 2.2 2.4 2.6 2.8
Optimum Foamed Asphalt Content (%)
Pene
trat
ion
Wapello
Muscatine
Hardin
Webster
Lee
Montgomery
Bremer
y = -12.731x + 43.373R2 = 0.1809
10
15
20
25
30
1.4 1.6 1.8 2.0 2.2 2.4 2.6 2.8
Optimum Foamed Asphalt Content (%)
Pene
trat
ion
(c) Gyratory compaction (40˚C) (d) Gyratory compaction (60˚C)
Figure 7-19. Correlations between optimum foamed asphalt content and residual asphalt stiffness
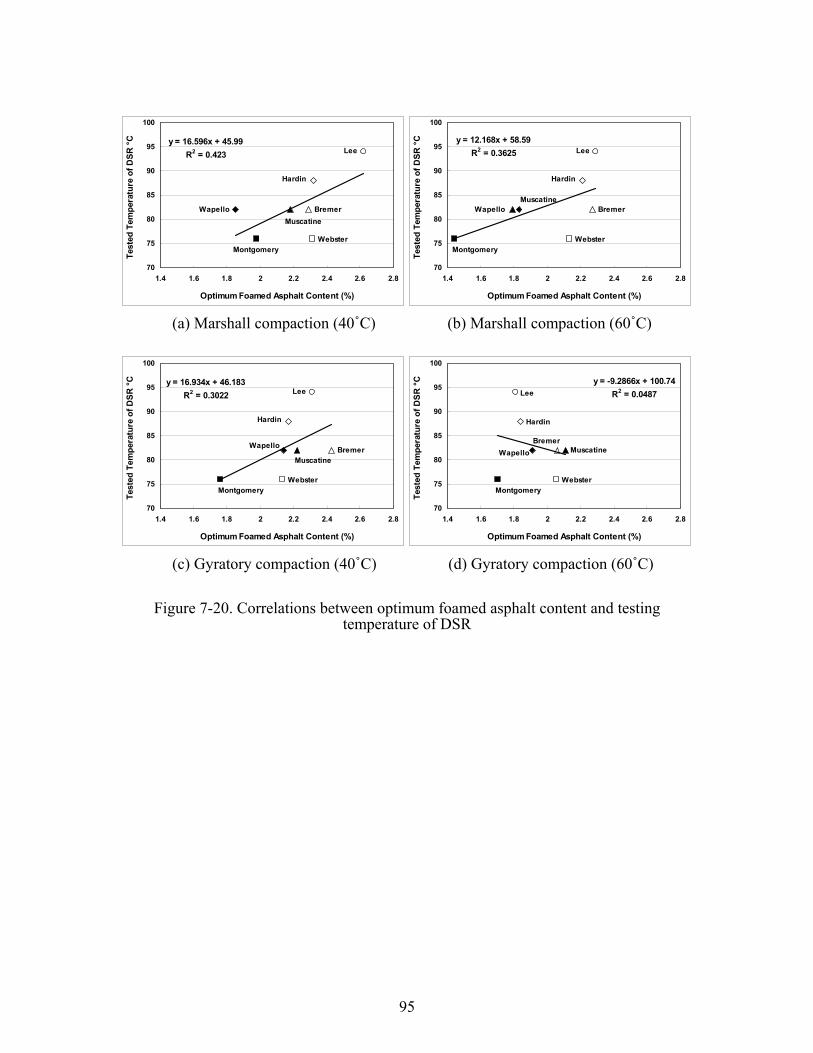
95
Lee
Hardin
Bremer
WebsterMontgomery
MuscatineWapello
y = 16.596x + 45.99R2 = 0.423
70
75
80
85
90
95
100
1.4 1.6 1.8 2 2.2 2.4 2.6 2.8
Optimum Foamed Asphalt Content (%)
Test
ed T
empe
ratu
re o
f DSR
°C
Lee
Hardin
Bremer
WebsterMontgomery
MuscatineWapello
y = 12.168x + 58.59R2 = 0.3625
70
75
80
85
90
95
100
1.4 1.6 1.8 2 2.2 2.4 2.6 2.8
Optimum Foamed Asphalt Content (%)
Test
ed T
empe
ratu
re o
f DSR
°C
(a) Marshall compaction (40˚C) (b) Marshall compaction (60˚C)
Lee
Hardin
Bremer
WebsterMontgomery
Muscatine
Wapello
y = 16.934x + 46.183R2 = 0.3022
70
75
80
85
90
95
100
1.4 1.6 1.8 2 2.2 2.4 2.6 2.8
Optimum Foamed Asphalt Content (%)
Test
ed T
empe
ratu
re o
f DSR
°C
Lee
Hardin
Bremer
WebsterMontgomery
MuscatineWapello
y = -9.2866x + 100.74R2 = 0.0487
70
75
80
85
90
95
100
1.4 1.6 1.8 2 2.2 2.4 2.6 2.8
Optimum Foamed Asphalt Content (%)
Test
ed T
empe
ratu
re o
f DSR
°C
(c) Gyratory compaction (40˚C) (d) Gyratory compaction (60˚C)
Figure 7-20. Correlations between optimum foamed asphalt content and testing temperature of DSR
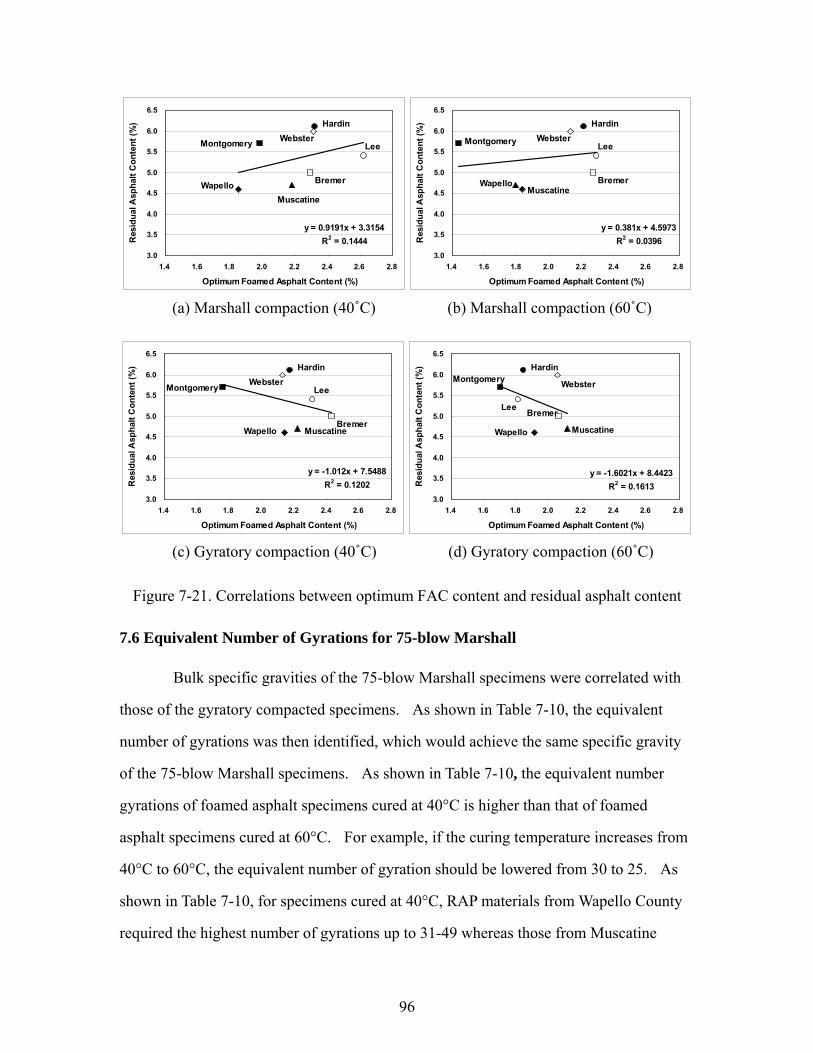
96
Bremer
LeeWebster
Hardin
MuscatineWapello
Montgomery
y = 0.9191x + 3.3154R2 = 0.1444
3.0
3.5
4.0
4.5
5.0
5.5
6.0
6.5
1.4 1.6 1.8 2.0 2.2 2.4 2.6 2.8
Optimum Foamed Asphalt Content (%)
Res
idua
l Asp
halt
Con
tent
(%)
Bremer
LeeWebster
Hardin
MuscatineWapello
Montgomery
y = 0.381x + 4.5973R2 = 0.0396
3.0
3.5
4.0
4.5
5.0
5.5
6.0
6.5
1.4 1.6 1.8 2.0 2.2 2.4 2.6 2.8
Optimum Foamed Asphalt Content (%)
Res
idua
l Asp
halt
Con
tent
(%)
(a) Marshall compaction (40˚C) (b) Marshall compaction (60˚C)
Bremer
LeeWebster
Hardin
MuscatineWapello
Montgomery
y = -1.012x + 7.5488R2 = 0.1202
3.0
3.5
4.0
4.5
5.0
5.5
6.0
6.5
1.4 1.6 1.8 2.0 2.2 2.4 2.6 2.8
Optimum Foamed Asphalt Content (%)
Res
idua
l Asp
halt
Con
tent
(%)
BremerLee
Webster
Hardin
MuscatineWapello
Montgomery
y = -1.6021x + 8.4423R2 = 0.1613
3.0
3.5
4.0
4.5
5.0
5.5
6.0
6.5
1.4 1.6 1.8 2.0 2.2 2.4 2.6 2.8
Optimum Foamed Asphalt Content (%)
Res
idua
l Asp
halt
Con
tent
(%)
(c) Gyratory compaction (40˚C) (d) Gyratory compaction (60˚C)
Figure 7-21. Correlations between optimum FAC content and residual asphalt content
7.6 Equivalent Number of Gyrations for 75-blow Marshall
Bulk specific gravities of the 75-blow Marshall specimens were correlated with
those of the gyratory compacted specimens. As shown in Table 7-10, the equivalent
number of gyrations was then identified, which would achieve the same specific gravity
of the 75-blow Marshall specimens. As shown in Table 7-10, the equivalent number
gyrations of foamed asphalt specimens cured at 40°C is higher than that of foamed
asphalt specimens cured at 60°C. For example, if the curing temperature increases from
40°C to 60°C, the equivalent number of gyration should be lowered from 30 to 25. As
shown in Table 7-10, for specimens cured at 40°C, RAP materials from Wapello County
required the highest number of gyrations up to 31-49 whereas those from Muscatine
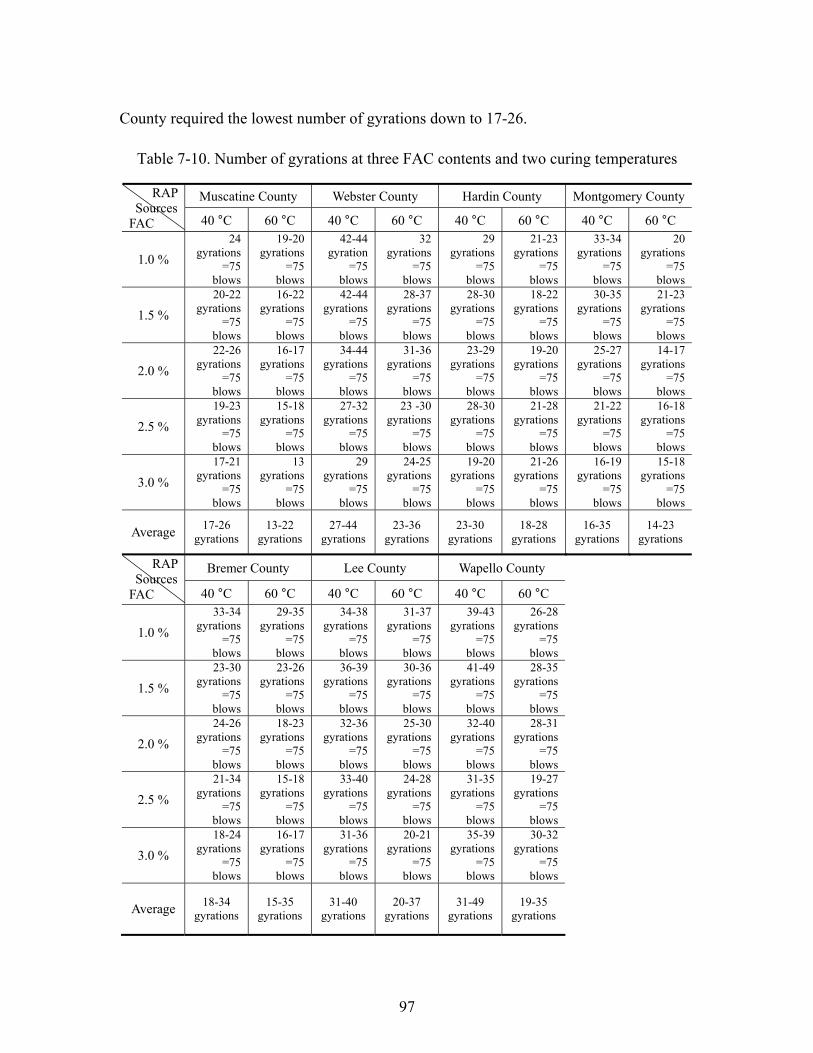
97
County required the lowest number of gyrations down to 17-26.
Table 7-10. Number of gyrations at three FAC contents and two curing temperatures
Muscatine County Webster County Hardin County Montgomery County RAP Sources
FAC 40 °C 60 °C 40 °C 60 °C 40 °C 60 °C 40 °C 60 °C
1.0 % 24
gyrations =75
blows
19-20 gyrations
=75 blows
42-44 gyration
=75 blows
32 gyrations
=75 blows
29 gyrations
=75 blows
21-23 gyrations
=75 blows
33-34 gyrations
=75 blows
20 gyrations
=75 blows
1.5 % 20-22
gyrations =75
blows
16-22 gyrations
=75 blows
42-44 gyrations
=75 blows
28-37 gyrations
=75 blows
28-30 gyrations
=75 blows
18-22 gyrations
=75 blows
30-35 gyrations
=75 blows
21-23 gyrations
=75 blows
2.0 % 22-26
gyrations =75
blows
16-17 gyrations
=75 blows
34-44 gyrations
=75 blows
31-36 gyrations
=75 blows
23-29 gyrations
=75 blows
19-20 gyrations
=75 blows
25-27 gyrations
=75 blows
14-17 gyrations
=75 blows
2.5 % 19-23
gyrations =75
blows
15-18 gyrations
=75 blows
27-32 gyrations
=75 blows
23 -30 gyrations
=75 blows
28-30 gyrations
=75 blows
21-28 gyrations
=75 blows
21-22 gyrations
=75 blows
16-18 gyrations
=75 blows
3.0 % 17-21
gyrations =75
blows
13 gyrations
=75 blows
29 gyrations
=75 blows
24-25 gyrations
=75 blows
19-20 gyrations
=75 blows
21-26 gyrations
=75 blows
16-19 gyrations
=75 blows
15-18 gyrations
=75 blows
Average 17-26 gyrations
13-22 gyrations
27-44 gyrations
23-36 gyrations
23-30 gyrations
18-28 gyrations
16-35 gyrations
14-23 gyrations
Bremer County Lee County Wapello County RAP Sources
FAC 40 °C 60 °C 40 °C 60 °C 40 °C 60 °C
1.0 % 33-34
gyrations =75
blows
29-35 gyrations
=75 blows
34-38 gyrations
=75 blows
31-37 gyrations
=75 blows
39-43 gyrations
=75 blows
26-28 gyrations
=75 blows
1.5 % 23-30
gyrations =75
blows
23-26 gyrations
=75 blows
36-39 gyrations
=75 blows
30-36 gyrations
=75 blows
41-49 gyrations
=75 blows
28-35 gyrations
=75 blows
2.0 % 24-26
gyrations =75
blows
18-23 gyrations
=75 blows
32-36 gyrations
=75 blows
25-30 gyrations
=75 blows
32-40 gyrations
=75 blows
28-31 gyrations
=75 blows
2.5 % 21-34
gyrations =75
blows
15-18 gyrations
=75 blows
33-40 gyrations
=75 blows
24-28 gyrations
=75 blows
31-35 gyrations
=75 blows
19-27 gyrations
=75 blows
3.0 % 18-24
gyrations =75
blows
16-17 gyrations
=75 blows
31-36 gyrations
=75 blows
20-21 gyrations
=75 blows
35-39 gyrations
=75 blows
30-32 gyrations
=75 blows
Average 18-34 gyrations
15-35 gyrations
31-40 gyrations
20-37 gyrations
31-49 gyrations
19-35 gyrations
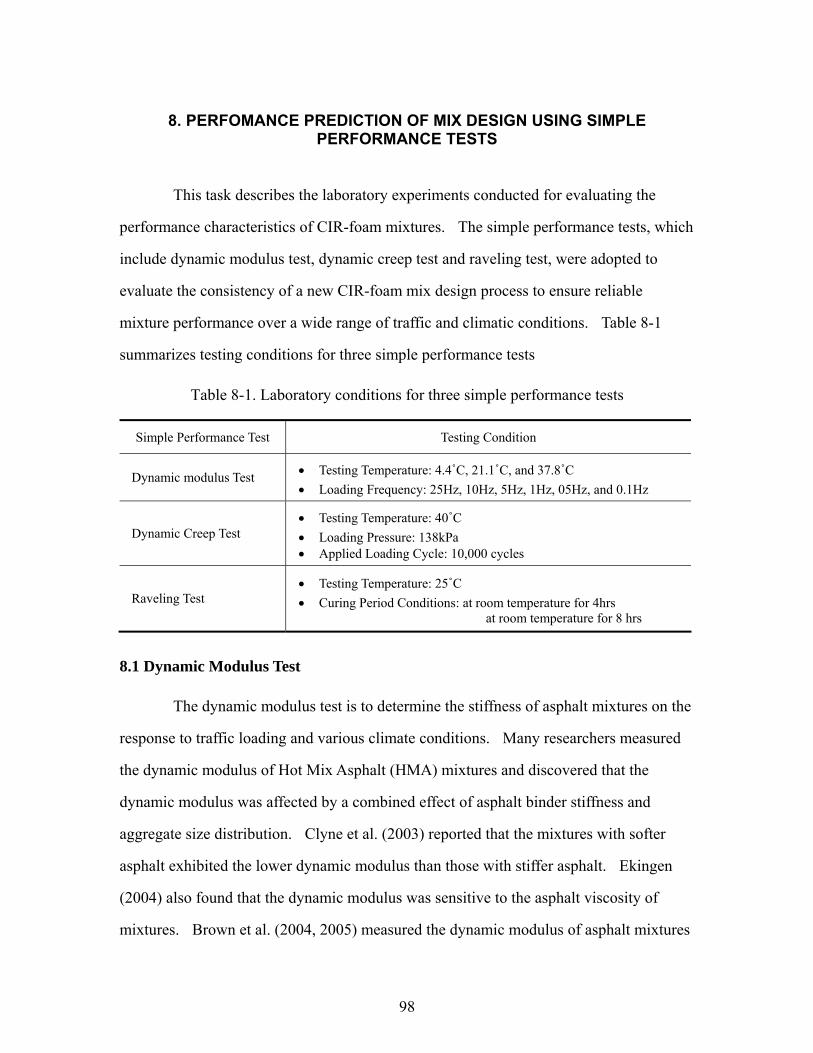
98
8. PERFOMANCE PREDICTION OF MIX DESIGN USING SIMPLE PERFORMANCE TESTS
This task describes the laboratory experiments conducted for evaluating the
performance characteristics of CIR-foam mixtures. The simple performance tests, which
include dynamic modulus test, dynamic creep test and raveling test, were adopted to
evaluate the consistency of a new CIR-foam mix design process to ensure reliable
mixture performance over a wide range of traffic and climatic conditions. Table 8-1
summarizes testing conditions for three simple performance tests
Table 8-1. Laboratory conditions for three simple performance tests
Simple Performance Test Testing Condition
Dynamic modulus Test • Testing Temperature: 4.4˚C, 21.1˚C, and 37.8˚C • Loading Frequency: 25Hz, 10Hz, 5Hz, 1Hz, 05Hz, and 0.1Hz
Dynamic Creep Test • Testing Temperature: 40˚C • Loading Pressure: 138kPa • Applied Loading Cycle: 10,000 cycles
Raveling Test • Testing Temperature: 25˚C • Curing Period Conditions: at room temperature for 4hrs
at room temperature for 8 hrs
8.1 Dynamic Modulus Test
The dynamic modulus test is to determine the stiffness of asphalt mixtures on the
response to traffic loading and various climate conditions. Many researchers measured
the dynamic modulus of Hot Mix Asphalt (HMA) mixtures and discovered that the
dynamic modulus was affected by a combined effect of asphalt binder stiffness and
aggregate size distribution. Clyne et al. (2003) reported that the mixtures with softer
asphalt exhibited the lower dynamic modulus than those with stiffer asphalt. Ekingen
(2004) also found that the dynamic modulus was sensitive to the asphalt viscosity of
mixtures. Brown et al. (2004, 2005) measured the dynamic modulus of asphalt mixtures
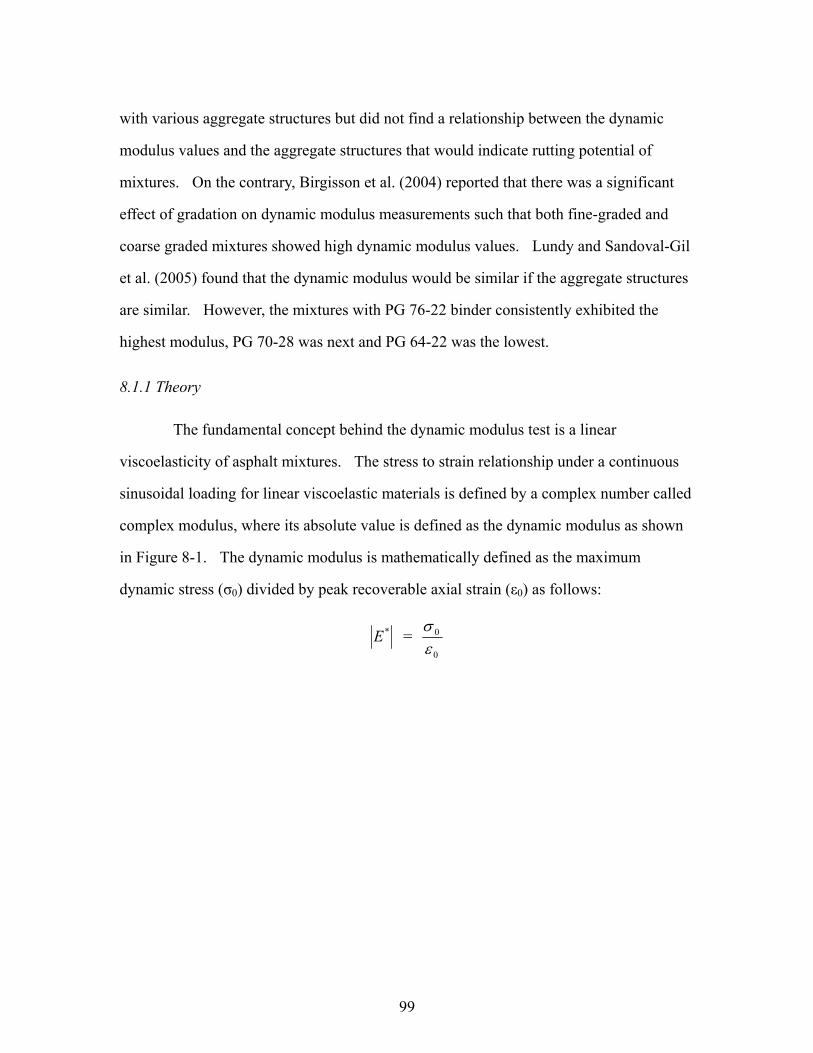
99
with various aggregate structures but did not find a relationship between the dynamic
modulus values and the aggregate structures that would indicate rutting potential of
mixtures. On the contrary, Birgisson et al. (2004) reported that there was a significant
effect of gradation on dynamic modulus measurements such that both fine-graded and
coarse graded mixtures showed high dynamic modulus values. Lundy and Sandoval-Gil
et al. (2005) found that the dynamic modulus would be similar if the aggregate structures
are similar. However, the mixtures with PG 76-22 binder consistently exhibited the
highest modulus, PG 70-28 was next and PG 64-22 was the lowest.
8.1.1 Theory
The fundamental concept behind the dynamic modulus test is a linear
viscoelasticity of asphalt mixtures. The stress to strain relationship under a continuous
sinusoidal loading for linear viscoelastic materials is defined by a complex number called
complex modulus, where its absolute value is defined as the dynamic modulus as shown
in Figure 8-1. The dynamic modulus is mathematically defined as the maximum
dynamic stress (σ0) divided by peak recoverable axial strain (ε0) as follows:
*E = 0
0
εσ
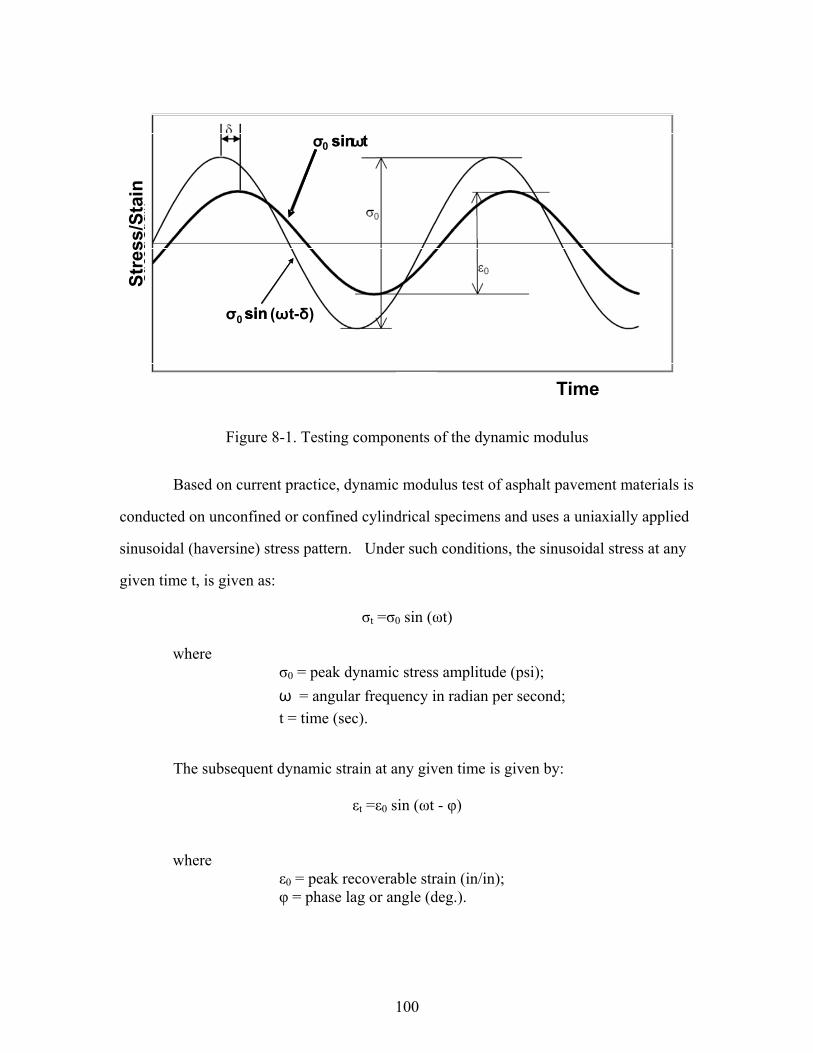
100
σ0 sinωtsin
σ0 sin (ωt-δ)sin
Time
Stre
ss/S
tain
σ0 sinωtsin
σ0 sin (ωt-δ)sin
Time
Stre
ss/S
tain
Figure 8-1. Testing components of the dynamic modulus
Based on current practice, dynamic modulus test of asphalt pavement materials is
conducted on unconfined or confined cylindrical specimens and uses a uniaxially applied
sinusoidal (haversine) stress pattern. Under such conditions, the sinusoidal stress at any
given time t, is given as:
σt =σ0 sin (ωt)
where σ0 = peak dynamic stress amplitude (psi); ω = angular frequency in radian per second; t = time (sec).
The subsequent dynamic strain at any given time is given by:
εt =ε0 sin (ωt - φ)
where ε0 = peak recoverable strain (in/in); φ = phase lag or angle (deg.).

101
8.1.2 Dynamic Modulus Testing Procedure
Witczak et al. (2002) and Bonaquist et al. (2003) described the development of
the SuperPave simple performance test (SPT) equipment, which can conduct dynamic
modulus test, dynamic creep (flow number) test and static creep (flow time) test at the
various temperature and loading conditions. As shown in Figure 8-2, the test specimen
is easy to access from all sides when the temperature and pressure vessel is at the open
position. Also, this system utilizes a magnetic mounted extensometer, which snaps on
the test specimen with minimum disruption to temperature control. A stand-alone
environmental unit can provide heated and refrigerated air to the environmental test
chamber. Using the environmental chamber, the foamed asphalt specimens are tested at
4˚C and 60˚C.
Figure 8-2. Simple performance testing equipment
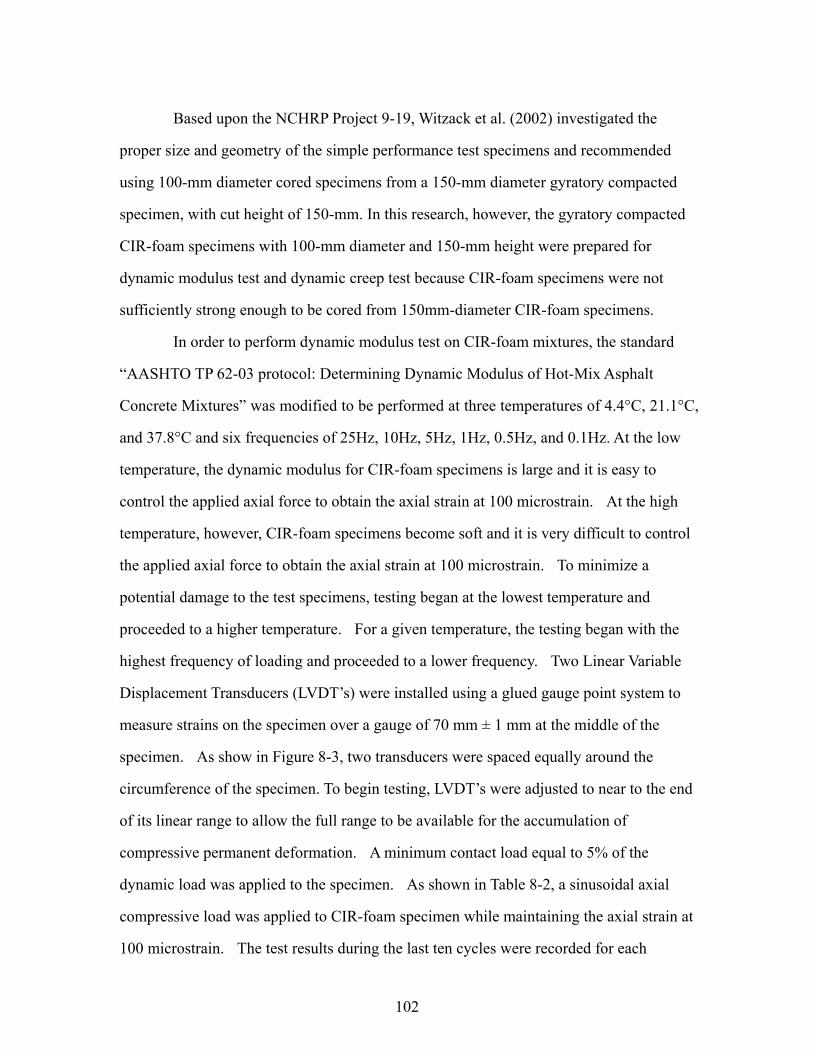
102
Based upon the NCHRP Project 9-19, Witzack et al. (2002) investigated the
proper size and geometry of the simple performance test specimens and recommended
using 100-mm diameter cored specimens from a 150-mm diameter gyratory compacted
specimen, with cut height of 150-mm. In this research, however, the gyratory compacted
CIR-foam specimens with 100-mm diameter and 150-mm height were prepared for
dynamic modulus test and dynamic creep test because CIR-foam specimens were not
sufficiently strong enough to be cored from 150mm-diameter CIR-foam specimens.
In order to perform dynamic modulus test on CIR-foam mixtures, the standard
“AASHTO TP 62-03 protocol: Determining Dynamic Modulus of Hot-Mix Asphalt
Concrete Mixtures” was modified to be performed at three temperatures of 4.4°C, 21.1°C,
and 37.8°C and six frequencies of 25Hz, 10Hz, 5Hz, 1Hz, 0.5Hz, and 0.1Hz. At the low
temperature, the dynamic modulus for CIR-foam specimens is large and it is easy to
control the applied axial force to obtain the axial strain at 100 microstrain. At the high
temperature, however, CIR-foam specimens become soft and it is very difficult to control
the applied axial force to obtain the axial strain at 100 microstrain. To minimize a
potential damage to the test specimens, testing began at the lowest temperature and
proceeded to a higher temperature. For a given temperature, the testing began with the
highest frequency of loading and proceeded to a lower frequency. Two Linear Variable
Displacement Transducers (LVDT’s) were installed using a glued gauge point system to
measure strains on the specimen over a gauge of 70 mm ± 1 mm at the middle of the
specimen. As show in Figure 8-3, two transducers were spaced equally around the
circumference of the specimen. To begin testing, LVDT’s were adjusted to near to the end
of its linear range to allow the full range to be available for the accumulation of
compressive permanent deformation. A minimum contact load equal to 5% of the
dynamic load was applied to the specimen. As shown in Table 8-2, a sinusoidal axial
compressive load was applied to CIR-foam specimen while maintaining the axial strain at
100 microstrain. The test results during the last ten cycles were recorded for each
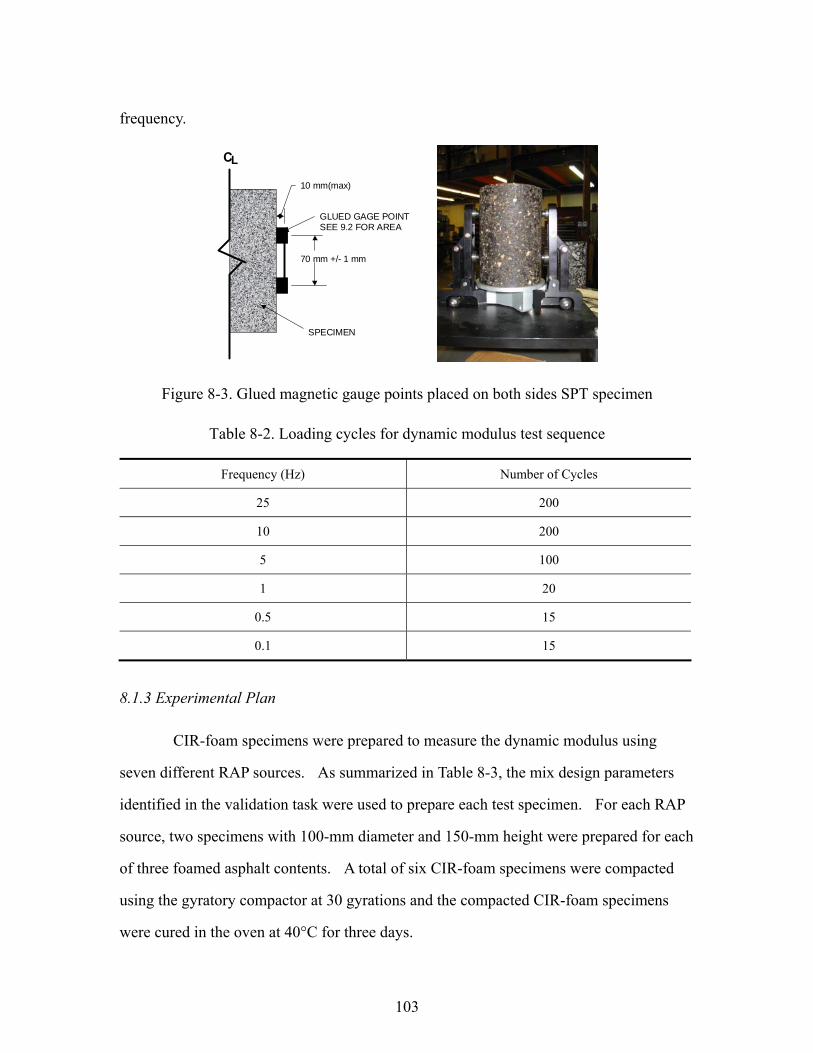
103
frequency.
70 mm +/- 1 mm
10 mm(max)
SPECIMEN
GLUED GAGE POINTSEE 9.2 FOR AREA
CL
Figure 8-3. Glued magnetic gauge points placed on both sides SPT specimen
Table 8-2. Loading cycles for dynamic modulus test sequence
Frequency (Hz) Number of Cycles
25 200
10 200
5 100
1 20
0.5 15
0.1 15
8.1.3 Experimental Plan
CIR-foam specimens were prepared to measure the dynamic modulus using
seven different RAP sources. As summarized in Table 8-3, the mix design parameters
identified in the validation task were used to prepare each test specimen. For each RAP
source, two specimens with 100-mm diameter and 150-mm height were prepared for each
of three foamed asphalt contents. A total of six CIR-foam specimens were compacted
using the gyratory compactor at 30 gyrations and the compacted CIR-foam specimens
were cured in the oven at 40°C for three days.

104
Table 8-3. Design parameters selected for SPT specimens
Parameters Condition
Foaming temperature 170˚C
Foaming water content 1.3 %
Foaming asphalt type PG 52-34
Foaming asphalt content 1.0%, 2.0%, and 3.0%
Moisture content 4.0%
Compaction method gyratory compaction applied 30gyration
Curing condition at 40˚C oven for 72 hours
Number of Specimen 2 specimens at each foamed asphalt content
8.1.4 Results and Discussion
The bulk specific gravities and air voids were measured for each CIR-foam
specimen. The dynamic modulus tests were performed to determine:
1. variations in dynamic modulus values among seven different RAP sources;
2. effect of the foamed asphalt content on dynamic modulus;
3. effect of test temperature and loading frequency on dynamic modulus; and
4. correlation between dynamic modulus and RAP material characteristics.
8.1.4.1 Volumetric Characteristics
The bulk specific gravities and air voids of each CIR-foam specimen were
determined following the AASHTO T 166 by measuring the dry mass and height. As
summarized in Table 8-4, overall, the bulk specific gravities seemed to increase as the
foamed asphalt content increased. RAP materials from Hardin County showed the
lowest bulk specific gravity where as those from Wapello County showed highest bulk
specific gravity. Air voids decreased gradually as the foamed asphalt content increased.
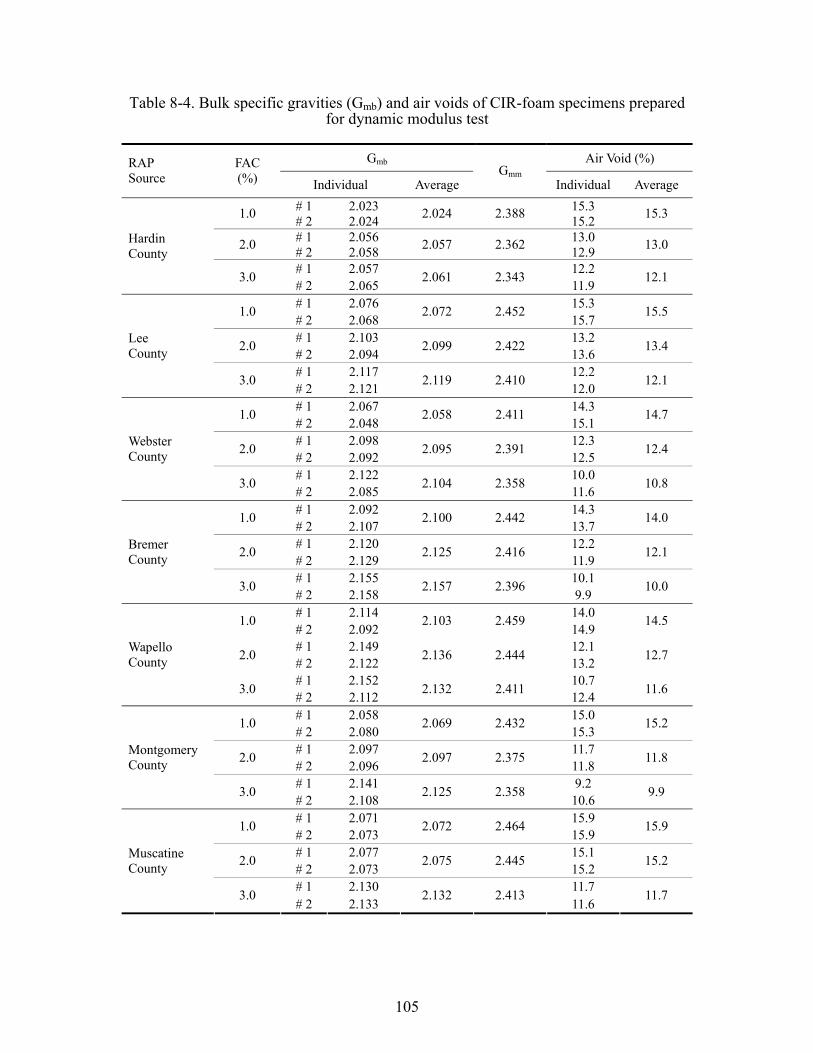
105
Table 8-4. Bulk specific gravities (Gmb) and air voids of CIR-foam specimens prepared for dynamic modulus test
Gmb Air Void (%) RAP Source
FAC (%) Individual Average
Gmm Individual Average
# 1 2.023 15.3 1.0 # 2 2.024 2.024 2.388 15.2 15.3
# 1 2.056 13.0 2.0 # 2 2.058 2.057 2.362 12.9 13.0
# 1 2.057 12.2
Hardin County
3.0 # 2 2.065 2.061 2.343 11.9 12.1
# 1 2.076 15.3 1.0 # 2 2.068
2.072 2.452 15.7
15.5
# 1 2.103 13.2 2.0 # 2 2.094 2.099 2.422 13.6 13.4
# 1 2.117 12.2
Lee County
3.0 # 2 2.121 2.119 2.410 12.0 12.1
# 1 2.067 14.3 1.0 # 2 2.048
2.058 2.411 15.1
14.7
# 1 2.098 12.3 2.0 # 2 2.092 2.095 2.391 12.5 12.4
# 1 2.122 10.0
Webster County
3.0 # 2 2.085 2.104 2.358 11.6 10.8
# 1 2.092 14.3 1.0 # 2 2.107
2.100 2.442 13.7
14.0
# 1 2.120 12.2 2.0 # 2 2.129 2.125 2.416 11.9 12.1
# 1 2.155 10.1
Bremer County
3.0 # 2 2.158 2.157 2.396 9.9 10.0
# 1 2.114 14.0 1.0 # 2 2.092
2.103 2.459 14.9
14.5
# 1 2.149 12.1 2.0 # 2 2.122 2.136 2.444 13.2 12.7
# 1 2.152 10.7
Wapello County
3.0 # 2 2.112 2.132 2.411 12.4 11.6
# 1 2.058 15.0 1.0 # 2 2.080
2.069 2.432 15.3
15.2
# 1 2.097 11.7 2.0 # 2 2.096 2.097 2.375 11.8 11.8
# 1 2.141 9.2
Montgomery County
3.0 # 2 2.108 2.125 2.358 10.6 9.9
# 1 2.071 15.9 1.0 # 2 2.073
2.072 2.464 15.9
15.9
# 1 2.077 15.1 2.0 # 2 2.073 2.075 2.445 15.2 15.2
# 1 2.130 11.7
Muscatine County
3.0 # 2 2.133
2.132 2.413 11.6
11.7

106
8.1.4.2 Dynamic Modulus Test Results
The dynamic modulus tests were performed on CIR-foam mixtures at six
different loading frequencies and three different test temperatures. The dynamic
modulus was measured from each specimen twice. Table 8-5 to Table 8-11 summarize
the average dynamic moduli of seven RAP sources measured for three different foamed
asphalt contents. Table 8-12 summarizes the rankings of dynamic modulus at three
different foamed asphalt contents for seven RAP sources. As can be easily observed
from table, the rankings of RAP materials changed when the foamed asphalt was
increased from 1.0% to 3.0%, which indicates that the dynamic modulus values are
affected by both foamed asphalt contents and RAP aggregate structure. Based on the
dynamic modulus test results performed at 4.4˚C, the coarser RAP materials were more
resistant to fatigue cracking. Based on the dynamic modulus test results performed at
37.8˚C, the finer RAP materials with the harder binder with a higher amount were more
resistant to rutting.
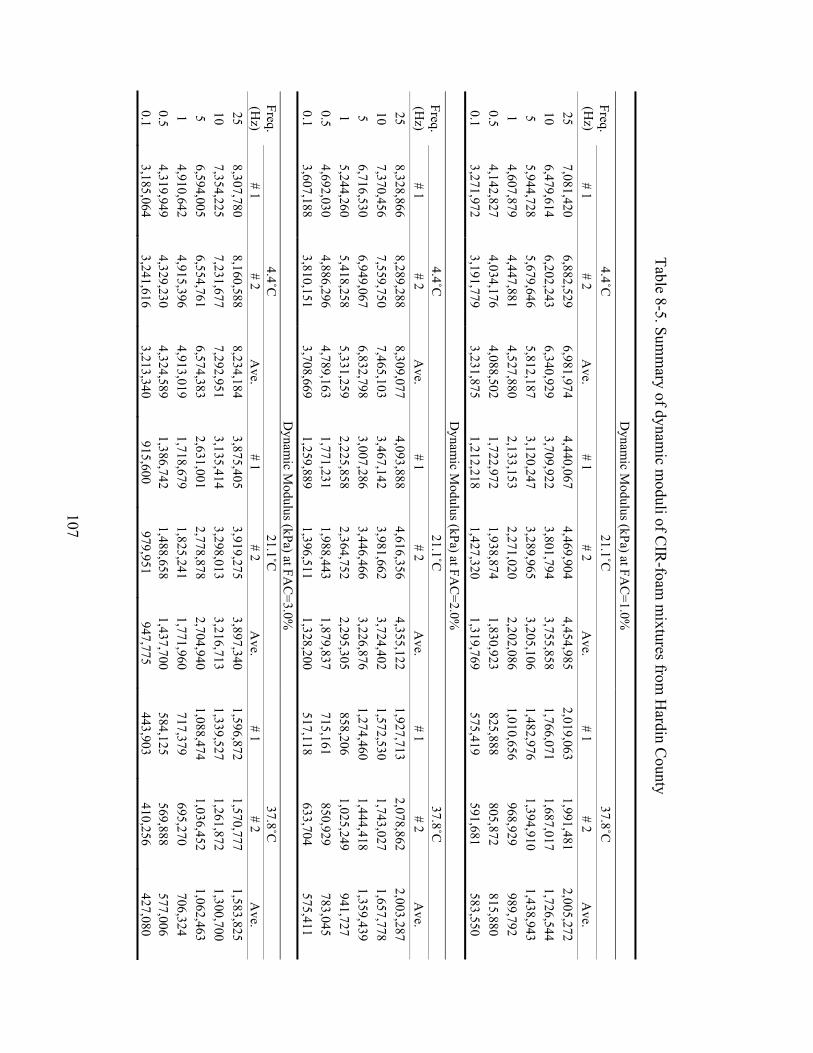
107
Table 8-5. Summ
ary of dynamic m
oduli of CIR
-foam m
ixtures from H
ardin County
Dynam
ic Modulus (kPa) at FA
C=1.0%
4.4˚C
21.1˚C
37.8˚C
Freq. (H
z) # 1
# 2 A
ve. # 1
# 2 A
ve. # 1
# 2 A
ve. 25
7,081,420 6,882,529
6,981,974 4,440,067
4,469,904 4,454,985
2,019,063 1,991,481
2,005,272 10
6,479,614 6,202,243
6,340,929 3,709,922
3,801,794 3,755,858
1,766,071 1,687,017
1,726,544 5
5,944,728 5,679,646
5,812,187 3,120,247
3,289,965 3,205,106
1,482,976 1,394,910
1,438,943 1
4,607,879 4,447,881
4,527,880 2,133,153
2,271,020 2,202,086
1,010,656 968,929
989,792 0.5
4,142,827 4,034,176
4,088,502 1,722,972
1,938,874 1,830,923
825,888 805,872
815,880 0.1
3,271,972 3,191,779
3,231,875 1,212,218
1,427,320 1,319,769
575,419 591,681
583,550 D
ynamic M
odulus (kPa) at FAC
=2.0%
4.4˚C
21.1˚C
37.8˚C
Freq. (H
z) # 1
# 2 A
ve. # 1
# 2 A
ve. # 1
# 2 A
ve. 25
8,328,866 8,289,288
8,309,077 4,093,888
4,616,356 4,355,122
1,927,713 2,078,862
2,003,287 10
7,370,456 7,559,750
7,465,103 3,467,142
3,981,662 3,724,402
1,572,530 1,743,027
1,657,778 5
6,716,530 6,949,067
6,832,798 3,007,286
3,446,466 3,226,876
1,274,460 1,444,418
1,359,439 1
5,244,260 5,418,258
5,331,259 2,225,858
2,364,752 2,295,305
858,206 1,025,249
941,727 0.5
4,692,030 4,886,296
4,789,163 1,771,231
1,988,443 1,879,837
715,161 850,929
783,045 0.1
3,607,188 3,810,151
3,708,669 1,259,889
1,396,511 1,328,200
517,118 633,704
575,411 D
ynamic M
odulus (kPa) at FAC
=3.0%
4.4˚C
21.1˚C
37.8˚C
Freq. (H
z) # 1
# 2 A
ve. # 1
# 2 A
ve. # 1
# 2 A
ve. 25
8,307,780 8,160,588
8,234,184 3,875,405
3,919,275 3,897,340
1,596,872 1,570,777
1,583,825 10
7,354,225 7,231,677
7,292,951 3,135,414
3,298,013 3,216,713
1,339,527 1,261,872
1,300,700 5
6,594,005 6,554,761
6,574,383 2,631,001
2,778,878 2,704,940
1,088,474 1,036,452
1,062,463 1
4,910,642 4,915,396
4,913,019 1,718,679
1,825,241 1,771,960
717,379 695,270
706,324 0.5
4,319,949 4,329,230
4,324,589 1,386,742
1,488,658 1,437,700
584,125 569,888
577,006 0.1
3,185,064 3,241,616
3,213,340 915,600
979,951 947,775
443,903 410,256
427,080

10
8
Tabl
e 8-
6. S
umm
ary
of d
ynam
ic m
odul
i of C
IR-f
oam
mix
ture
s fro
m L
ee C
ount
y
Dyn
amic
Mod
ulus
(kPa
) at F
AC
=1.0
%
4.4˚
C
21.1˚C
37
.8˚C
Fr
eq.
(Hz)
#
1 #
2 A
ve.
# 1
# 2
Ave
. #
1 #
2 A
ve.
25
7,84
2,62
9 8,
095,
422
7,96
9,02
5 4,
204,
950
4,28
7,05
0 4,
246,
000
2,08
8,77
0 1,
838,
019
1,96
3,39
5 10
6,
801,
359
7,17
4,03
6 6,
987,
698
3,47
2,31
0 3,
397,
758
3,43
5,03
4 1,
761,
683
1,56
9,67
4 1,
665,
678
5 6,
258,
756
6,61
6,34
5 6,
437,
550
2,96
6,84
7 2,
881,
232
2,92
4,03
9 1,
479,
187
1,31
9,01
2 1,
399,
099
1 4,
872,
456
5,18
2,48
1 5,
027,
468
1,97
6,25
2 1,
885,
010
1,93
0,63
1 97
5,63
3 86
6,82
2 92
1,22
7 0.
5 4,
364,
029
4,64
4,82
9 4,
504,
429
1,67
3,34
6 1,
538,
702
1,60
6,02
4 80
3,37
9 70
0,85
2 75
2,11
6 0.
1 3,
487,
061
3,73
3,04
8 3,
610,
054
1,17
1,40
6 1,
066,
794
1,11
9,10
0 58
2,74
9 51
3,52
7 54
8,13
8 D
ynam
ic M
odul
us (k
Pa) a
t FA
C=2
.0%
4.
4˚C
21
.1˚C
37
.8˚C
Fr
eq.
(Hz)
#
1 #
2 A
ve.
# 1
# 2
Ave
. #
1 #
2 A
ve.
25
7,80
8,43
6 7,
423,
043
7,61
5,73
9 4,
370,
489
3,84
3,03
8 4,
106,
763
2,14
0,28
7 1,
961,
838
2,05
1,06
2 10
7,
067,
300
6,67
6,56
8 6,
871,
934
3,71
8,58
0 3,
083,
954
3,40
1,26
7 1,
883,
105
1,66
6,30
1 1,
774,
703
5 6,
429,
540
6,02
0,82
7 6,
225,
184
3,14
1,81
5 2,
565,
236
2,85
3,52
6 1,
559,
552
1,30
6,61
1 1,
433,
081
1 4,
857,
811
4,55
3,43
5 4,
705,
623
2,01
3,99
4 1,
607,
752
1,81
0,87
3 1,
065,
031
879,
213
972,
122
0.5
4,33
4,53
1 4,
070,
927
4,20
2,72
9 1,
655,
937
1,27
6,54
8 1,
466,
242
866,
395
706,
915
786,
655
0.1
3,35
0,92
9 3,
176,
529
3,26
3,72
9 1,
141,
204
923,
300
1,03
2,25
2 64
5,90
1 49
8,63
1 57
2,26
6 D
ynam
ic M
odul
us (k
Pa) a
t FA
C=3
.0%
4.
4˚C
21
.1˚C
37
.8˚C
Fr
eq.
(Hz)
#
1 #
2 A
ve.
# 1
# 2
Ave
. #
1 #
2 A
ve.
25
7,62
7,33
7 7,
973,
660
7,80
0,49
8 4,
056,
574
4,36
3,50
3 4,
210,
038
1,87
1,71
4 1,
912,
584
1,89
2,14
9 10
6,
587,
986
7,02
2,60
7 6,
805,
296
3,42
2,82
6 3,
439,
640
3,43
1,23
3 1,
546,
263
1,57
9,88
7 1,
563,
075
5 5,
875,
698
6,29
5,33
7 6,
085,
517
2,86
7,34
6 2,
810,
012
2,83
8,67
9 1,
244,
497
1,28
9,99
7 1,
267,
247
1 4,
273,
706
4,64
1,00
9 4,
457,
358
1,81
5,58
0 1,
681,
338
1,74
8,45
9 83
2,36
5 87
9,99
0 85
6,17
7 0.
5 3,
741,
335
4,04
2,23
6 3,
891,
785
1,48
9,40
3 1,
368,
982
1,42
9,19
3 66
9,16
9 70
2,66
1 68
5,91
5 0.
1 2,
794,
600
3,03
4,01
3 2,
914,
306
1,01
6,42
0 91
8,48
4 96
7,45
2 49
5,86
4 52
5,87
1 51
0,86
7

109
Table 8-7. Summ
ary of dynamic m
oduli of CIR
-foam m
ixtures from W
ebster County
Dynam
ic Modulus (kPa) at FA
C=1.0%
4.4˚C
21.1˚C
37.8˚C
Freq. (H
z) # 1
# 2 A
ve. # 1
# 2 A
ve. # 1
# 2 A
ve. 25
9,233,945 9,012,592
9,123,268 5,696,051
5,687,946 5,691,998
2,427,663 2,527,409
2,477,536 10
8,507,457 8,641,064
8,574,260 4,894,512
5,063,267 4,978,889
2,000,215 2,087,652
2,043,933 5
7,958,213 8,241,050
8,099,631 4,202,011
4,396,795 4,299,403
1,619,352 1,715,053
1,667,202 1
6,715,226 6,572,393
6,643,809 2,716,718
2,885,058 2,800,888
972,348 1,077,532
1,024,940 0.5
6,179,604 6,020,018
6,099,811 2,254,103
2,397,290 2,325,696
791,803 900,277
846,040 0.1
5,010,165 4,838,191
4,924,178 1,523,308
1,691,955 1,607,632
550,738 637,490
594,114 D
ynamic M
odulus (kPa) at FAC
=2.0%
4.4˚C
21.1˚C
37.8˚C
Freq. (H
z) # 1
# 2 A
ve. # 1
# 2 A
ve. # 1
# 2 A
ve. 25
11,096,615 9,949,414
10,523,014 5,316,677
5,349,560 5,333,118
2,641,678 2,613,541
2,627,609 10
10,284,110 9,582,834
9,933,472 4,535,933
4,566,558 4,551,246
2,174,725 2,133,610
2,154,167 5
9,437,728 8,691,609
9,064,668 3,790,675
3,838,895 3,814,785
1,740,136 1,757,311
1,748,724 1
7,455,972 6,991,015
7,223,494 2,537,384
2,506,443 2,521,913
1,066,638 1,050,441
1,058,539 0.5
6,594,284 6,294,626
6,444,455 2,118,743
2,094,933 2,106,838
882,125 856,087
869,106 0.1
5,261,986 5,022,697
5,142,342 1,521,882
1,510,667 1,516,274
634,816 588,836
611,826 D
ynamic M
odulus (kPa) at FAC
=3.0%
4.4˚C
21.1˚C
37.8˚C
Freq. (H
z) # 1
# 2 A
ve. # 1
# 2 A
ve. # 1
# 2 A
ve. 25
9,743,510 10,203,841
9,973,676 5,200,941
4,959,039 5,079,990
2,168,865 1,832,419
2,000,642 10
8,678,760 9,502,767
9,090,763 4,359,787
4,061,434 4,210,610
1,725,779 1,422,496
1,574,137 5
8,012,725 8,827,272
8,419,998 3,728,916
3,374,908 3,551,912
1,410,653 1,129,722
1,270,187 1
6,069,932 6,912,626
6,491,279 2,372,269
2,084,225 2,228,247
867,961 682,990
775,476 0.5
5,383,310 6,131,524
5,757,417 1,970,677
1,706,951 1,838,814
715,709 579,826
647,768 0.1
4,253,301 4,778,300
4,515,800 1,284,917
1,089,064 1,186,991
514,567 384,558
449,563
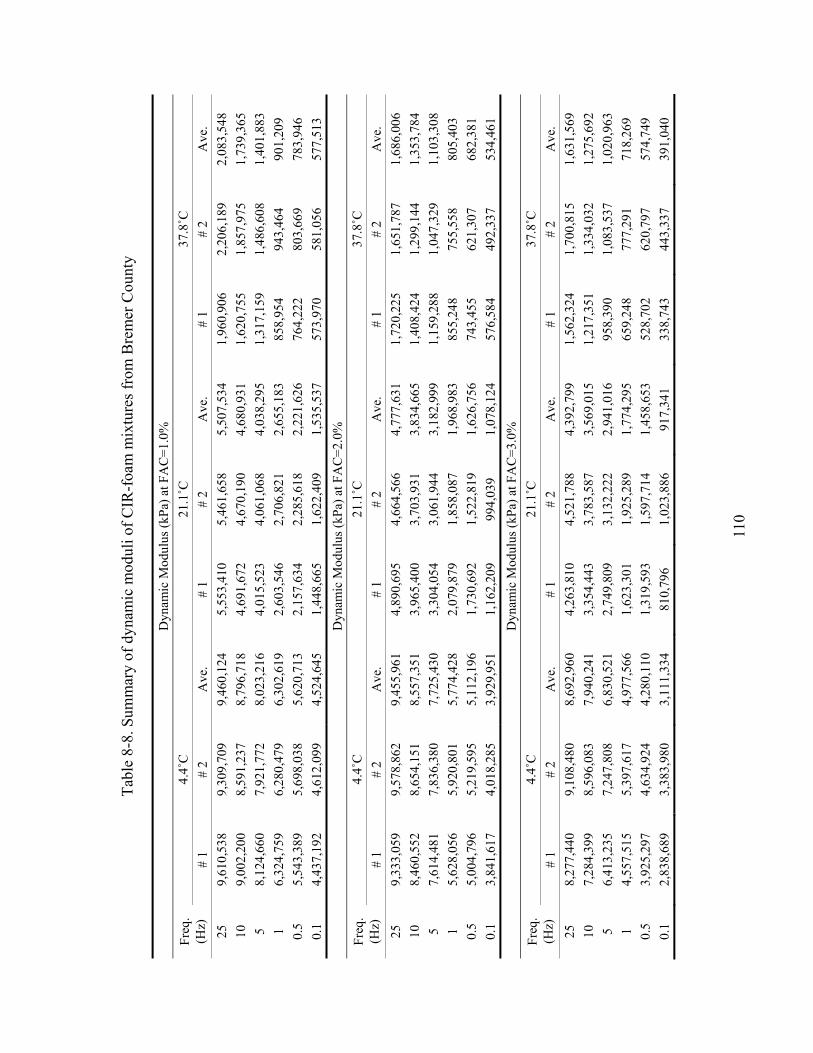
11
0
Tabl
e 8-
8. S
umm
ary
of d
ynam
ic m
odul
i of C
IR-f
oam
mix
ture
s fro
m B
rem
er C
ount
y
Dyn
amic
Mod
ulus
(kPa
) at F
AC
=1.0
%
4.4˚
C
21.1˚C
37
.8˚C
Fr
eq.
(Hz)
#
1 #
2 A
ve.
# 1
# 2
Ave
. #
1 #
2 A
ve.
25
9,61
0,53
8 9,
309,
709
9,46
0,12
4 5,
553,
410
5,46
1,65
8 5,
507,
534
1,96
0,90
6 2,
206,
189
2,08
3,54
8 10
9,
002,
200
8,59
1,23
7 8,
796,
718
4,69
1,67
2 4,
670,
190
4,68
0,93
1 1,
620,
755
1,85
7,97
5 1,
739,
365
5 8,
124,
660
7,92
1,77
2 8,
023,
216
4,01
5,52
3 4,
061,
068
4,03
8,29
5 1,
317,
159
1,48
6,60
8 1,
401,
883
1 6,
324,
759
6,28
0,47
9 6,
302,
619
2,60
3,54
6 2,
706,
821
2,65
5,18
3 85
8,95
4 94
3,46
4 90
1,20
9 0.
5 5,
543,
389
5,69
8,03
8 5,
620,
713
2,15
7,63
4 2,
285,
618
2,22
1,62
6 76
4,22
2 80
3,66
9 78
3,94
6 0.
1 4,
437,
192
4,61
2,09
9 4,
524,
645
1,44
8,66
5 1,
622,
409
1,53
5,53
7 57
3,97
0 58
1,05
6 57
7,51
3 D
ynam
ic M
odul
us (k
Pa) a
t FA
C=2
.0%
4.
4˚C
21
.1˚C
37
.8˚C
Fr
eq.
(Hz)
#
1 #
2 A
ve.
# 1
# 2
Ave
. #
1 #
2 A
ve.
25
9,33
3,05
9 9,
578,
862
9,45
5,96
1 4,
890,
695
4,66
4,56
6 4,
777,
631
1,72
0,22
5 1,
651,
787
1,68
6,00
6 10
8,
460,
552
8,65
4,15
1 8,
557,
351
3,96
5,40
0 3,
703,
931
3,83
4,66
5 1,
408,
424
1,29
9,14
4 1,
353,
784
5 7,
614,
481
7,83
6,38
0 7,
725,
430
3,30
4,05
4 3,
061,
944
3,18
2,99
9 1,
159,
288
1,04
7,32
9 1,
103,
308
1 5,
628,
056
5,92
0,80
1 5,
774,
428
2,07
9,87
9 1,
858,
087
1,96
8,98
3 85
5,24
8 75
5,55
8 80
5,40
3 0.
5 5,
004,
796
5,21
9,59
5 5,
112,
196
1,73
0,69
2 1,
522,
819
1,62
6,75
6 74
3,45
5 62
1,30
7 68
2,38
1 0.
1 3,
841,
617
4,01
8,28
5 3,
929,
951
1,16
2,20
9 99
4,03
9 1,
078,
124
576,
584
492,
337
534,
461
Dyn
amic
Mod
ulus
(kPa
) at F
AC
=3.0
%
4.4˚
C
21.1˚C
37
.8˚C
Fr
eq.
(Hz)
#
1 #
2 A
ve.
# 1
# 2
Ave
. #
1 #
2 A
ve.
25
8,27
7,44
0 9,
108,
480
8,69
2,96
0 4,
263,
810
4,52
1,78
8 4,
392,
799
1,56
2,32
4 1,
700,
815
1,63
1,56
9 10
7,
284,
399
8,59
6,08
3 7,
940,
241
3,35
4,44
3 3,
783,
587
3,56
9,01
5 1,
217,
351
1,33
4,03
2 1,
275,
692
5 6,
413,
235
7,24
7,80
8 6,
830,
521
2,74
9,80
9 3,
132,
222
2,94
1,01
6 95
8,39
0 1,
083,
537
1,02
0,96
3 1
4,55
7,51
5 5,
397,
617
4,97
7,56
6 1,
623,
301
1,92
5,28
9 1,
774,
295
659,
248
777,
291
718,
269
0.5
3,92
5,29
7 4,
634,
924
4,28
0,11
0 1,
319,
593
1,59
7,71
4 1,
458,
653
528,
702
620,
797
574,
749
0.1
2,83
8,68
9 3,
383,
980
3,11
1,33
4 81
0,79
6 1,
023,
886
917,
341
338,
743
443,
337
391,
040
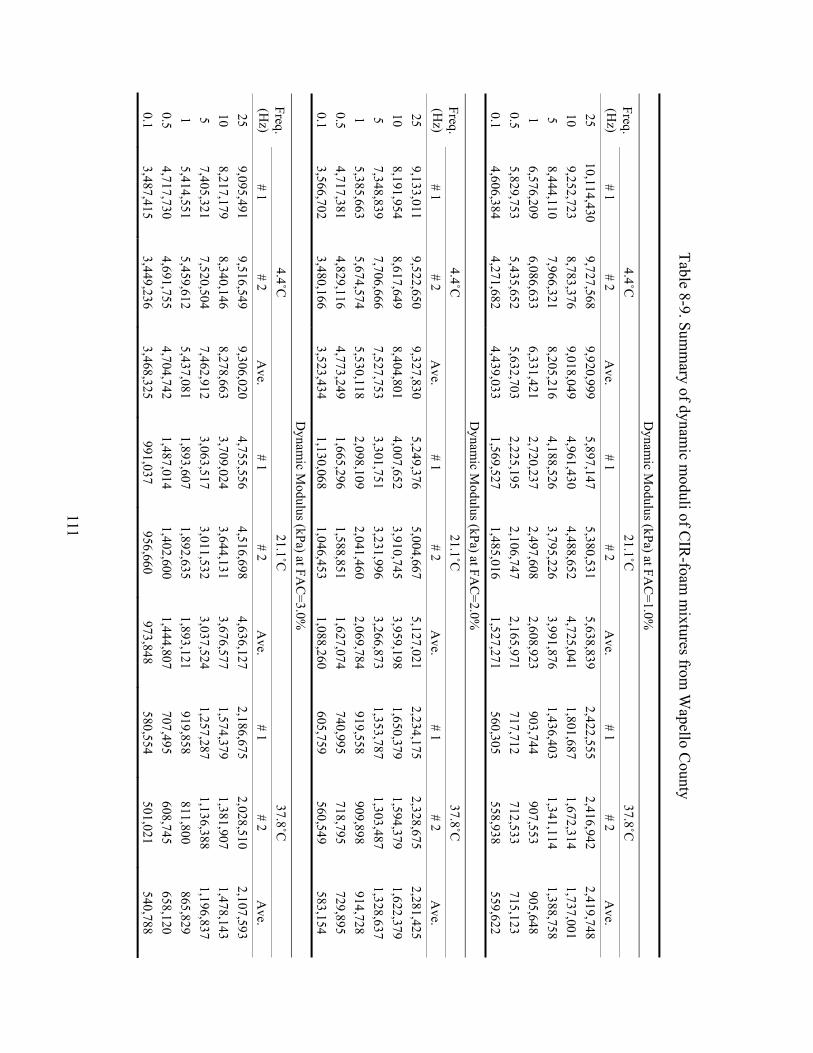
111
Table 8-9. Summ
ary of dynamic m
oduli of CIR
-foam m
ixtures from W
apello County
Dynam
ic Modulus (kPa) at FA
C=1.0%
4.4˚C
21.1˚C
37.8˚C
Freq. (H
z) # 1
# 2 A
ve. # 1
# 2 A
ve. # 1
# 2 A
ve. 25
10,114,430 9,727,568
9,920,999 5,897,147
5,380,531 5,638,839
2,422,555 2,416,942
2,419,748 10
9,252,723 8,783,376
9,018,049 4,961,430
4,488,652 4,725,041
1,801,687 1,672,314
1,737,001 5
8,444,110 7,966,321
8,205,216 4,188,526
3,795,226 3,991,876
1,436,403 1,341,114
1,388,758 1
6,576,209 6,086,633
6,331,421 2,720,237
2,497,608 2,608,923
903,744 907,553
905,648 0.5
5,829,753 5,435,652
5,632,703 2,225,195
2,106,747 2,165,971
717,712 712,533
715,123 0.1
4,606,384 4,271,682
4,439,033 1,569,527
1,485,016 1,527,271
560,305 558,938
559,622 D
ynamic M
odulus (kPa) at FAC
=2.0%
4.4˚C
21.1˚C
37.8˚C
Freq. (H
z) # 1
# 2 A
ve. # 1
# 2 A
ve. # 1
# 2 A
ve. 25
9,133,011 9,522,650
9,327,830 5,249,376
5,004,667 5,127,021
2,234,175 2,328,675
2,281,425 10
8,191,954 8,617,649
8,404,801 4,007,652
3,910,745 3,959,198
1,650,379 1,594,379
1,622,379 5
7,348,839 7,706,666
7,527,753 3,301,751
3,231,996 3,266,873
1,353,787 1,303,487
1,328,637 1
5,385,663 5,674,574
5,530,118 2,098,109
2,041,460 2,069,784
919,558 909,898
914,728 0.5
4,717,381 4,829,116
4,773,249 1,665,296
1,588,851 1,627,074
740,995 718,795
729,895 0.1
3,566,702 3,480,166
3,523,434 1,130,068
1,046,453 1,088,260
605,759 560,549
583,154 D
ynamic M
odulus (kPa) at FAC
=3.0%
4.4˚C
21.1˚C
37.8˚C
Freq. (H
z) # 1
# 2 A
ve. # 1
# 2 A
ve. # 1
# 2 A
ve. 25
9,095,491 9,516,549
9,306,020 4,755,556
4,516,698 4,636,127
2,186,675 2,028,510
2,107,593 10
8,217,179 8,340,146
8,278,663 3,709,024
3,644,131 3,676,577
1,574,379 1,381,907
1,478,143 5
7,405,321 7,520,504
7,462,912 3,063,517
3,011,532 3,037,524
1,257,287 1,136,388
1,196,837 1
5,414,551 5,459,612
5,437,081 1,893,607
1,892,635 1,893,121
919,858 811,800
865,829 0.5
4,717,730 4,691,755
4,704,742 1,487,014
1,402,600 1,444,807
707,495 608,745
658,120 0.1
3,487,415 3,449,236
3,468,325 991,037
956,660 973,848
580,554 501,021
540,788
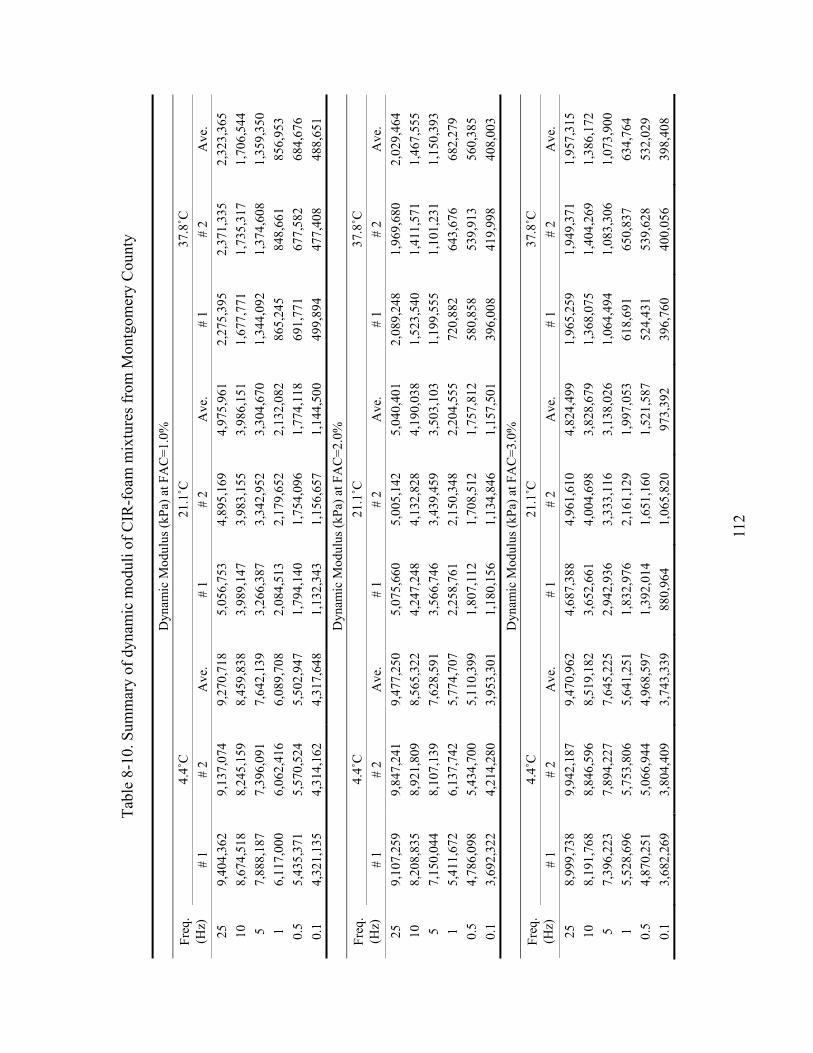
11
2
Tabl
e 8-
10. S
umm
ary
of d
ynam
ic m
odul
i of C
IR-f
oam
mix
ture
s fro
m M
ontg
omer
y C
ount
y
Dyn
amic
Mod
ulus
(kPa
) at F
AC
=1.0
%
4.4˚
C
21.1˚C
37
.8˚C
Fr
eq.
(Hz)
#
1 #
2 A
ve.
# 1
# 2
Ave
. #
1 #
2 A
ve.
25
9,40
4,36
2 9,
137,
074
9,27
0,71
8 5,
056,
753
4,89
5,16
9 4,
975,
961
2,27
5,39
5 2,
371,
335
2,32
3,36
5 10
8,
674,
518
8,24
5,15
9 8,
459,
838
3,98
9,14
7 3,
983,
155
3,98
6,15
1 1,
677,
771
1,73
5,31
7 1,
706,
544
5 7,
888,
187
7,39
6,09
1 7,
642,
139
3,26
6,38
7 3,
342,
952
3,30
4,67
0 1,
344,
092
1,37
4,60
8 1,
359,
350
1 6,
117,
000
6,06
2,41
6 6,
089,
708
2,08
4,51
3 2,
179,
652
2,13
2,08
2 86
5,24
5 84
8,66
1 85
6,95
3 0.
5 5,
435,
371
5,57
0,52
4 5,
502,
947
1,79
4,14
0 1,
754,
096
1,77
4,11
8 69
1,77
1 67
7,58
2 68
4,67
6 0.
1 4,
321,
135
4,31
4,16
2 4,
317,
648
1,13
2,34
3 1,
156,
657
1,14
4,50
0 49
9,89
4 47
7,40
8 48
8,65
1 D
ynam
ic M
odul
us (k
Pa) a
t FA
C=2
.0%
4.
4˚C
21
.1˚C
37
.8˚C
Fr
eq.
(Hz)
#
1 #
2 A
ve.
# 1
# 2
Ave
. #
1 #
2 A
ve.
25
9,10
7,25
9 9,
847,
241
9,47
7,25
0 5,
075,
660
5,00
5,14
2 5,
040,
401
2,08
9,24
8 1,
969,
680
2,02
9,46
4 10
8,
208,
835
8,92
1,80
9 8,
565,
322
4,24
7,24
8 4,
132,
828
4,19
0,03
8 1,
523,
540
1,41
1,57
1 1,
467,
555
5 7,
150,
044
8,10
7,13
9 7,
628,
591
3,56
6,74
6 3,
439,
459
3,50
3,10
3 1,
199,
555
1,10
1,23
1 1,
150,
393
1 5,
411,
672
6,13
7,74
2 5,
774,
707
2,25
8,76
1 2,
150,
348
2,20
4,55
5 72
0,88
2 64
3,67
6 68
2,27
9 0.
5 4,
786,
098
5,43
4,70
0 5,
110,
399
1,80
7,11
2 1,
708,
512
1,75
7,81
2 58
0,85
8 53
9,91
3 56
0,38
5 0.
1 3,
692,
322
4,21
4,28
0 3,
953,
301
1,18
0,15
6 1,
134,
846
1,15
7,50
1 39
6,00
8 41
9,99
8 40
8,00
3 D
ynam
ic M
odul
us (k
Pa) a
t FA
C=3
.0%
4.
4˚C
21
.1˚C
37
.8˚C
Fr
eq.
(Hz)
#
1 #
2 A
ve.
# 1
# 2
Ave
. #
1 #
2 A
ve.
25
8,99
9,73
8 9,
942,
187
9,47
0,96
2 4,
687,
388
4,96
1,61
0 4,
824,
499
1,96
5,25
9 1,
949,
371
1,95
7,31
5 10
8,
191,
768
8,84
6,59
6 8,
519,
182
3,65
2,66
1 4,
004,
698
3,82
8,67
9 1,
368,
075
1,40
4,26
9 1,
386,
172
5 7,
396,
223
7,89
4,22
7 7,
645,
225
2,94
2,93
6 3,
333,
116
3,13
8,02
6 1,
064,
494
1,08
3,30
6 1,
073,
900
1 5,
528,
696
5,75
3,80
6 5,
641,
251
1,83
2,97
6 2,
161,
129
1,99
7,05
3 61
8,69
1 65
0,83
7 63
4,76
4 0.
5 4,
870,
251
5,06
6,94
4 4,
968,
597
1,39
2,01
4 1,
651,
160
1,52
1,58
7 52
4,43
1 53
9,62
8 53
2,02
9 0.
1 3,
682,
269
3,80
4,40
9 3,
743,
339
880,
964
1,06
5,82
0 97
3,39
2 39
6,76
0 40
0,05
6 39
8,40
8
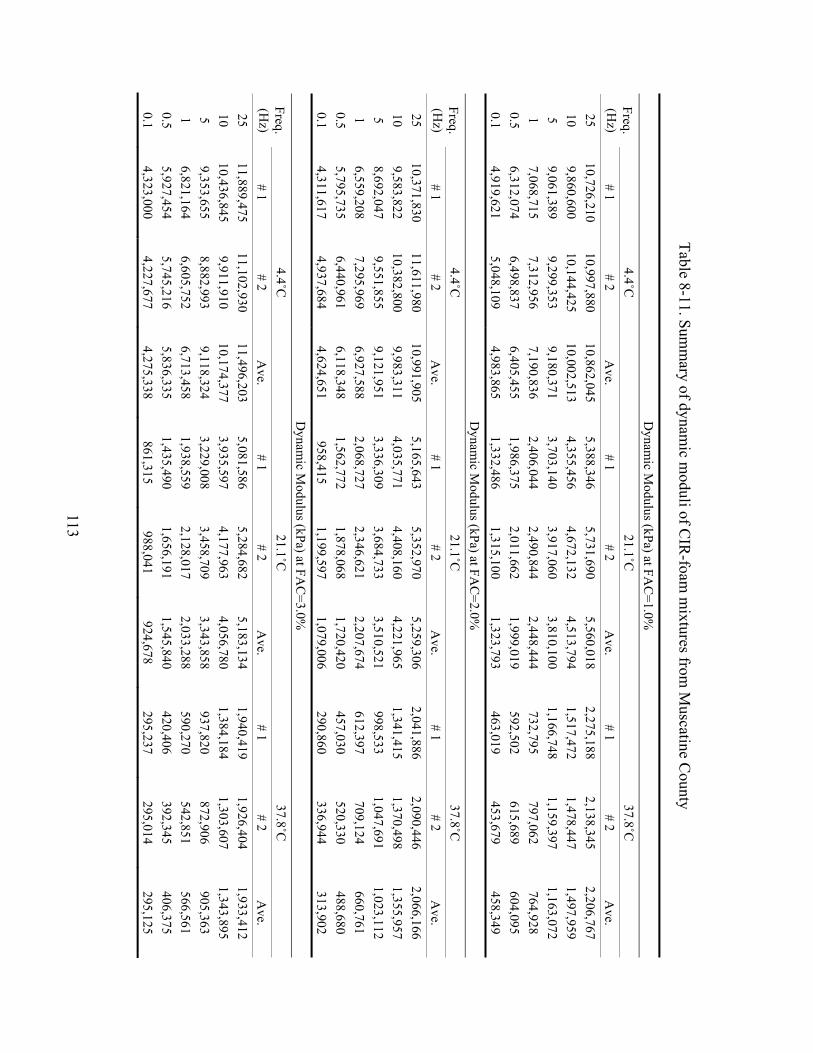
113
Table 8-11. Summ
ary of dynamic m
oduli of CIR
-foam m
ixtures from M
uscatine County
Dynam
ic Modulus (kPa) at FA
C=1.0%
4.4˚C
21.1˚C
37.8˚C
Freq. (H
z) # 1
# 2 A
ve. # 1
# 2 A
ve. # 1
# 2 A
ve. 25
10,726,210 10,997,880
10,862,045 5,388,346
5,731,690 5,560,018
2,275,188 2,138,345
2,206,767 10
9,860,600 10,144,425
10,002,513 4,355,456
4,672,132 4,513,794
1,517,472 1,478,447
1,497,959 5
9,061,389 9,299,353
9,180,371 3,703,140
3,917,060 3,810,100
1,166,748 1,159,397
1,163,072 1
7,068,715 7,312,956
7,190,836 2,406,044
2,490,844 2,448,444
732,795 797,062
764,928 0.5
6,312,074 6,498,837
6,405,455 1,986,375
2,011,662 1,999,019
592,502 615,689
604,095 0.1
4,919,621 5,048,109
4,983,865 1,332,486
1,315,100 1,323,793
463,019 453,679
458,349 D
ynamic M
odulus (kPa) at FAC
=2.0%
4.4˚C
21.1˚C
37.8˚C
Freq. (H
z) # 1
# 2 A
ve. # 1
# 2 A
ve. # 1
# 2 A
ve. 25
10,371,830 11,611,980
10,991,905 5,165,643
5,352,970 5,259,306
2,041,886 2,090,446
2,066,166 10
9,583,822 10,382,800
9,983,311 4,035,771
4,408,160 4,221,965
1,341,415 1,370,498
1,355,957 5
8,692,047 9,551,855
9,121,951 3,336,309
3,684,733 3,510,521
998,533 1,047,691
1,023,112 1
6,559,208 7,295,969
6,927,588 2,068,727
2,346,621 2,207,674
612,397 709,124
660,761 0.5
5,795,735 6,440,961
6,118,348 1,562,772
1,878,068 1,720,420
457,030 520,330
488,680 0.1
4,311,617 4,937,684
4,624,651 958,415
1,199,597 1,079,006
290,860 336,944
313,902 D
ynamic M
odulus (kPa) at FAC
=3.0%
4.4˚C
21.1˚C
37.8˚C
Freq. (H
z) # 1
# 2 A
ve. # 1
# 2 A
ve. # 1
# 2 A
ve. 25
11,889,475 11,102,930
11,496,203 5,081,586
5,284,682 5,183,134
1,940,419 1,926,404
1,933,412 10
10,436,845 9,911,910
10,174,377 3,935,597
4,177,963 4,056,780
1,384,184 1,303,607
1,343,895 5
9,353,655 8,882,993
9,118,324 3,229,008
3,458,709 3,343,858
937,820 872,906
905,363 1
6,821,164 6,605,752
6,713,458 1,938,559
2,128,017 2,033,288
590,270 542,851
566,561 0.5
5,927,454 5,745,216
5,836,335 1,435,490
1,656,191 1,545,840
420,406 392,345
406,375 0.1
4,323,000 4,227,677
4,275,338 861,315
988,041 924,678
295,237 295,014
295,125
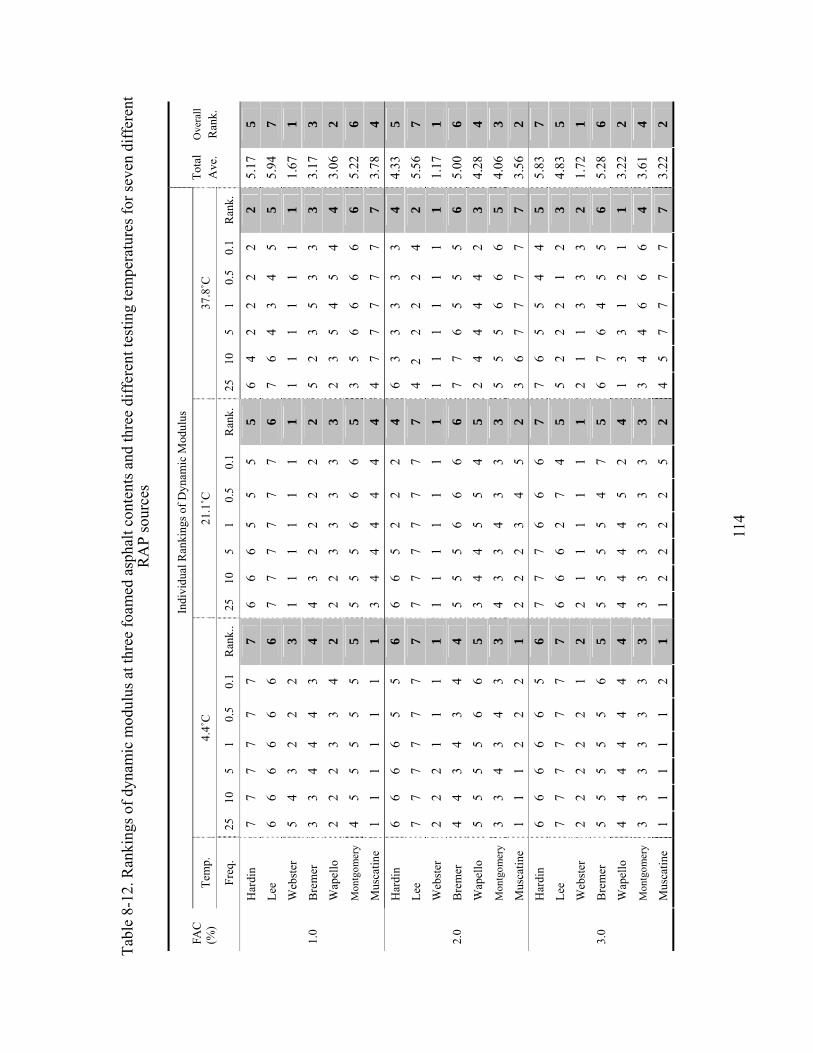
11
4
Tabl
e 8-
12. R
anki
ngs o
f dyn
amic
mod
ulus
at t
hree
foam
ed a
spha
lt co
nten
ts a
nd th
ree
diff
eren
t tes
ting
tem
pera
ture
s for
seve
n di
ffer
ent
RA
P so
urce
s
In
divi
dual
Ran
king
s of D
ynam
ic M
odul
us
Tem
p.
4.4˚
C
21.1˚C
37
.8˚C
FA
C
(%)
Freq
. 25
10
5
1 0.
5 0.
1 R
ank.
. 25
10
5
1 0.
5 0.
1 R
ank.
25
10
5
1 0.
5 0.
1 R
ank.
Tota
l A
ve.
Ove
rall
Ran
k.
Har
din
7 7
7 7
7 7
7 6
6 6
5 5
5 5
6 4
2 2
2 2
2 5.
17
5 Le
e 6
6 6
6 6
6 6
7 7
7 7
7 7
6 7
6 4
3 4
5 5
5.94
7
Web
ster
5
4 3
2 2
2 3
1 1
1 1
1 1
1 1
1 1
1 1
1 1
1.67
1
Bre
mer
3
3 4
4 4
3 4
4 3
2 2
2 2
2 5
2 3
5 3
3 3
3.17
3
Wap
ello
2
2 2
3 3
4 2
2 2
3 3
3 3
3 2
3 5
4 5
4 4
3.06
2
Mon
tgom
ery
4 5
5 5
5 5
5 5
5 5
6 6
6 5
3 5
6 6
6 6
6 5.
22
6
1.0
Mus
catin
e 1
1 1
1 1
1 1
3 4
4 4
4 4
4 4
7 7
7 7
7 7
3.78
4
Har
din
6 6
6 6
5 5
6 6
6 5
2 2
2 4
6 3
3 3
3 3
4 4.
33
5 Le
e 7
7 7
7 7
7 7
7 7
7 7
7 7
7 4
2 2
2 2
4 2
5.56
7
Web
ster
2
2 2
1 1
1 1
1 1
1 1
1 1
1 1
1 1
1 1
1 1
1.17
1
Bre
mer
4
4 3
4 3
4 4
5 5
5 6
6 6
6 7
7 6
5 5
5 6
5.00
6
Wap
ello
5
5 5
5 6
6 5
3 4
4 5
5 4
5 2
4 4
4 4
2 3
4.28
4
Mon
tgom
ery
3 3
4 3
4 3
3 4
3 3
4 3
3 3
5 5
5 6
6 6
5 4.
06
3
2.0
Mus
catin
e 1
1 1
2 2
2 1
2 2
2 3
4 5
2 3
6 7
7 7
7 7
3.56
2
Har
din
6 6
6 6
6 5
6 7
7 7
6 6
6 7
7 6
5 5
4 4
5 5.
83
7 Le
e 7
7 7
7 7
7 7
6 6
6 2
7 4
5 5
2 2
2 1
2 3
4.83
5
Web
ster
2
2 2
2 2
1 2
2 1
1 1
1 1
1 2
1 1
3 3
3 2
1.72
1
Bre
mer
5
5 5
5 5
6 5
5 5
5 5
4 7
5 6
7 6
4 5
5 6
5.28
6
Wap
ello
4
4 4
4 4
4 4
4 4
4 4
5 2
4 1
3 3
1 2
1 1
3.22
2
Mon
tgom
ery
3 3
3 3
3 3
3 3
3 3
3 3
3 3
3 4
4 6
6 6
4 3.
61
4
3.0
Mus
catin
e 1
1 1
1 1
2 1
1 2
2 2
2 5
2 4
5 7
7 7
7 7
3.22
2
115
The dynamic moduli for seven different RAP sources are plotted against six
loading frequencies at 4.4°C, 21.1°C, and 37.8°C in Figures 8-4, Figure 8-5 and Figure 8-
6, respectively. Under a constant loading frequency, the magnitude of the dynamic
modulus decreases as temperature increases. Under a constant testing temperature, the
magnitude of the dynamic modulus increases with an increase in the frequency. As
expected, the dynamic moduli measured at three foamed asphalt contents were different
among seven RAP sources. At 4.4°C, RAP materials from Muscatine County exhibited
the highest dynamic modulus values, RAP materials from Webster County was second
and RAP materials from Lee and Hardin Counties were the lowest for nearly all loading
frequencies. At 21.1°C, dynamic modulus of RAP materials from Webster County was
the highest followed by Muscatine County whereas Lee and Hardin Counties stayed at
the lowest level. At 37.8°C, it is interesting to note that dynamic modulus of RAP
materials from Muscatine became the lowest whereas Webster County was the highest.
It can be postulated that RAP material from Muscatine is sensitive to temperature because
they were the coarsest with least amount of residual asphalt content. Therefore, the
coarse RAP materials with a small amount of residual asphalt content may be more
fatigue resistant at a low temperature but more susceptible to rutting at a high temperature.
On the other hand, fine RAP materials with a large amount of hard residual asphalt
content like Hardin County may be more resistant to rutting at high temperature but more
susceptible to fatigue cracking at low temperature.
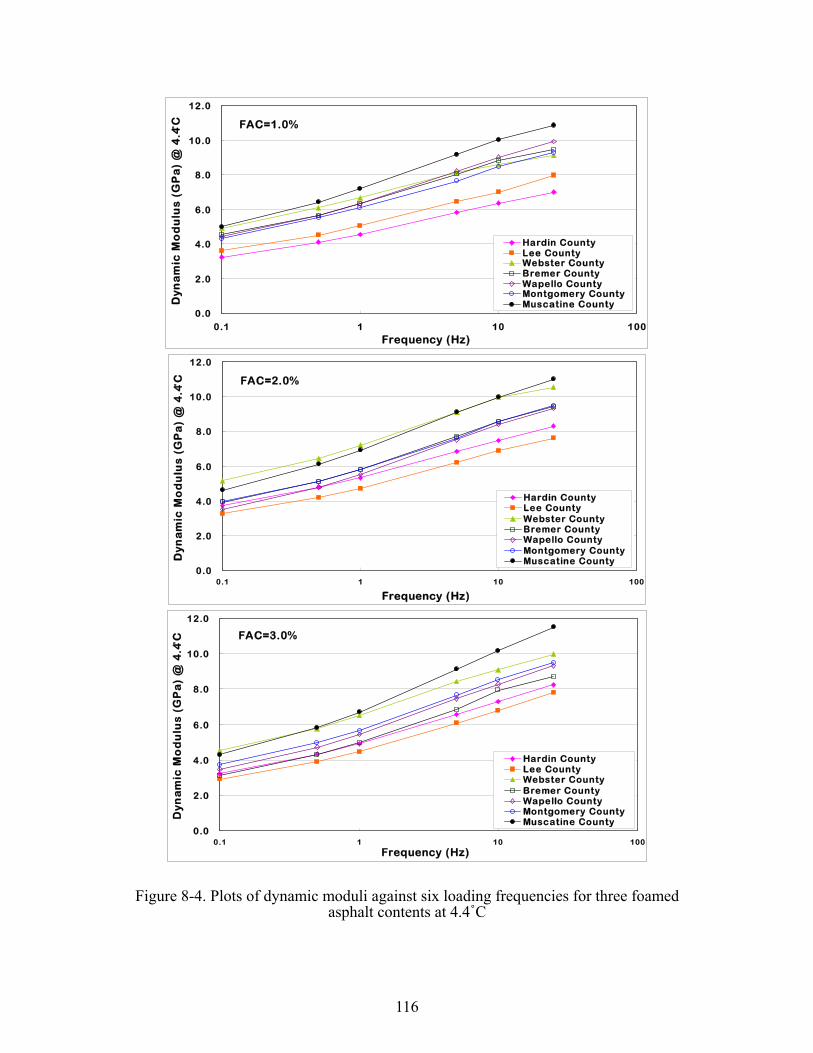
116
0.0
2.0
4.0
6.0
8.0
10.0
12.0
0.1 1 10 100Frequency (Hz)
Dyn
am
ic M
od
ulu
s (G
Pa
) @
4.4̊
C
Hardin CountyLee CountyWebster CountyBremer CountyWapello CountyMontgomery CountyMuscatine County
FAC=1.0%
0.0
2.0
4.0
6.0
8.0
10.0
12.0
0.1 1 10 100
Frequency (Hz)
Dyn
am
ic M
od
ulu
s (
GP
a)
@ 4
.4̊C
Hardin CountyLee CountyWebster CountyBremer CountyWapello CountyMontgomery CountyMuscatine County
FAC=2.0%
0.0
2.0
4.0
6.0
8.0
10.0
12.0
0.1 1 10 100
Frequency (Hz)
Dyn
am
ic M
od
ulu
s (G
Pa
) @
4.4̊
C
Hardin CountyLee CountyWebster CountyBremer CountyWapello CountyMontgomery CountyMuscatine County
FAC=3.0%
Figure 8-4. Plots of dynamic moduli against six loading frequencies for three foamed asphalt contents at 4.4˚C
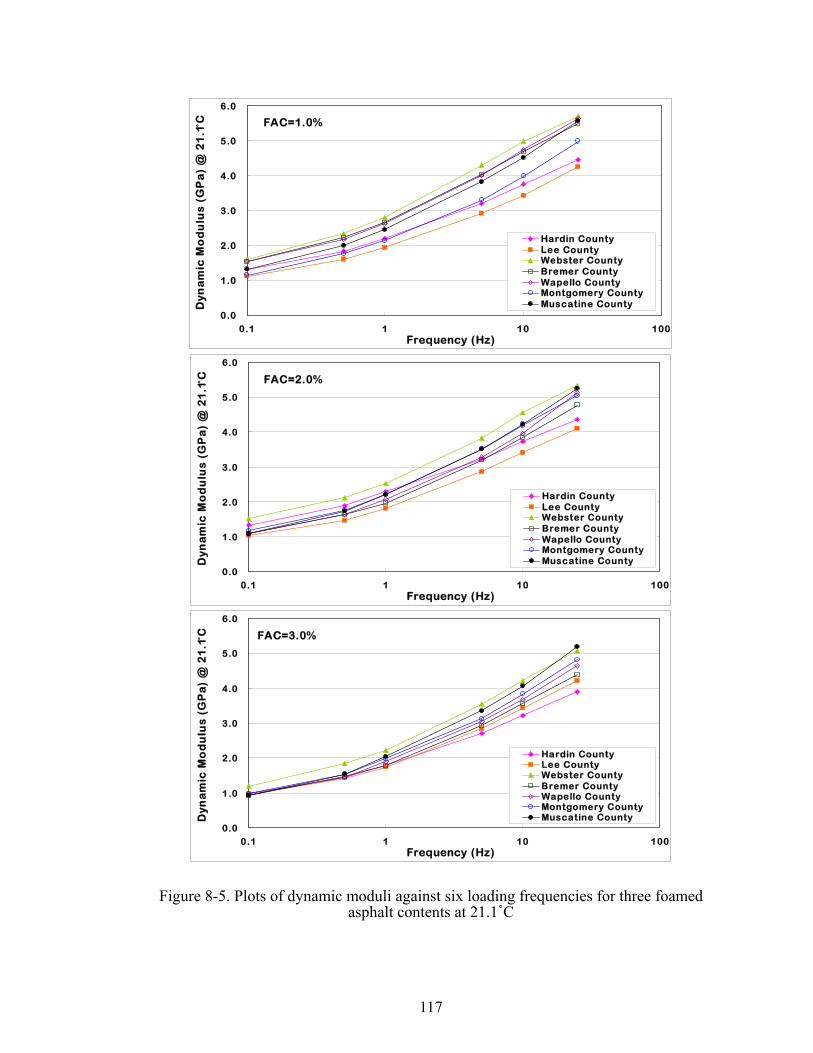
117
0.0
1.0
2.0
3.0
4.0
5.0
6.0
0.1 1 10 100Frequency (Hz)
Dyn
am
ic M
od
ulu
s (G
Pa
) @
21
.1̊C
Hardin CountyLee CountyWebster CountyBremer CountyWapello CountyMontgomery CountyMuscatine County
FAC=1.0%
0.0
1.0
2.0
3.0
4.0
5.0
6.0
0.1 1 10 100Frequency (Hz)
Dy
na
mic
Mo
du
lus
(G
Pa
) @
21
.1̊C
Hardin CountyLee CountyWebster CountyBremer CountyWapello CountyMontgomery CountyMuscatine County
FAC=2.0%
0.0
1.0
2.0
3.0
4.0
5.0
6.0
0.1 1 10 100Frequency (Hz)
Dyn
am
ic M
od
ulu
s (G
Pa
) @
21
.1̊C
Hardin CountyLee CountyWebster CountyBremer CountyWapello CountyMontgomery CountyMuscatine County
FAC=3.0%
Figure 8-5. Plots of dynamic moduli against six loading frequencies for three foamed asphalt contents at 21.1˚C
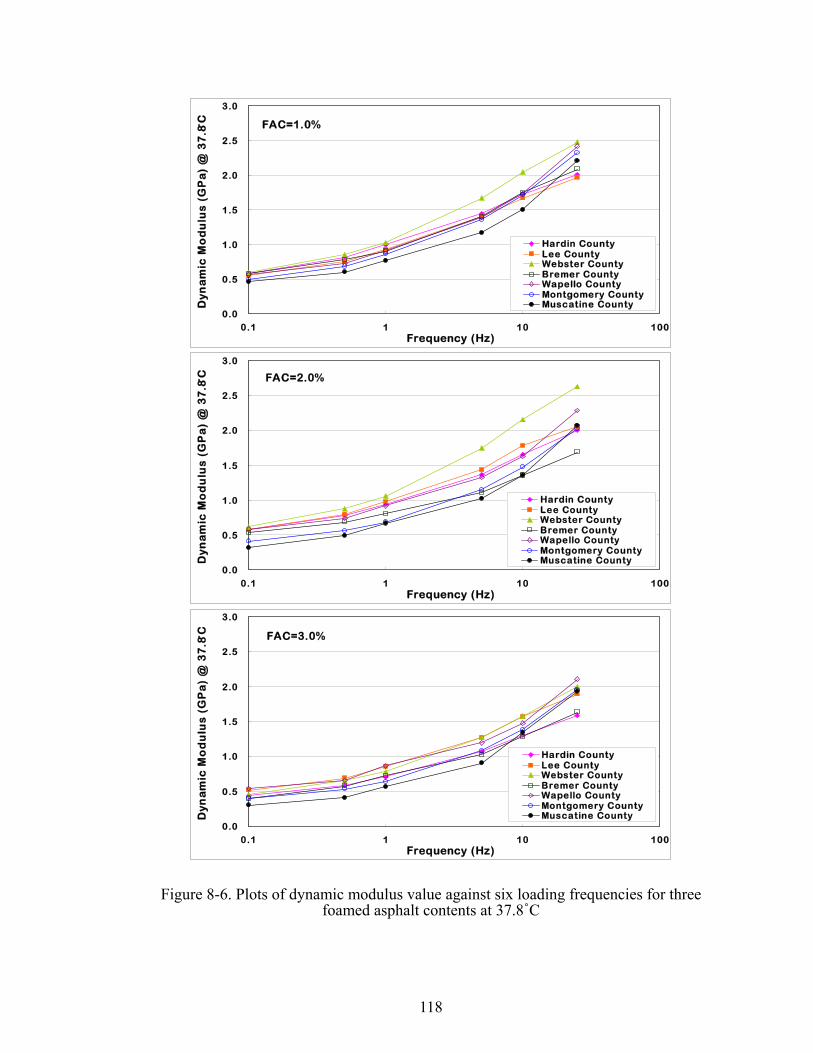
118
0.0
0.5
1.0
1.5
2.0
2.5
3.0
0.1 1 10 100Frequency (Hz)
Dyn
am
ic M
od
ulu
s (G
Pa
) @
37
.8̊C
Hardin CountyLee CountyWebster CountyBremer CountyWapello CountyMontgomery CountyMuscatine County
FAC=1.0%
0.0
0.5
1.0
1.5
2.0
2.5
3.0
0.1 1 10 100Frequency (Hz)
Dy
na
mic
Mo
du
lus
(G
Pa
) @
37
.8̊C
Hardin CountyLee CountyWebster CountyBremer CountyWapello CountyMontgomery CountyMuscatine County
FAC=2.0%
0.0
0.5
1.0
1.5
2.0
2.5
3.0
0.1 1 10 100Frequency (Hz)
Dyn
am
ic M
od
ulu
s (G
Pa
) @
37
.8̊C
Hardin CountyLee CountyWebster CountyBremer CountyWapello CountyMontgomery CountyMuscatine County
FAC=3.0%
Figure 8-6. Plots of dynamic modulus value against six loading frequencies for three foamed asphalt contents at 37.8˚C

119
Since dynamic modulus of RAP materials was not significantly affected by
loading frequencies, the frequency of 25 Hz, which represents a highway speed, was
selected for further analysis. Figure 8-7 shows dynamic moduli of RAP materials from
seven RAP sources plotted against three different temperatures. As shown in Figure 8-7,
dynamic modulus values were significantly lower at higher temperatures. It seemed that
the dynamic modulus values from seven different RAP sources were very similar at 37˚C.
Particularly, RAP materials form Muscatine County exhibited the highest dynamic
modulus at 4.4˚C but they decreased more than others at higher temperatures of 21.1˚C
and 37.8˚C.

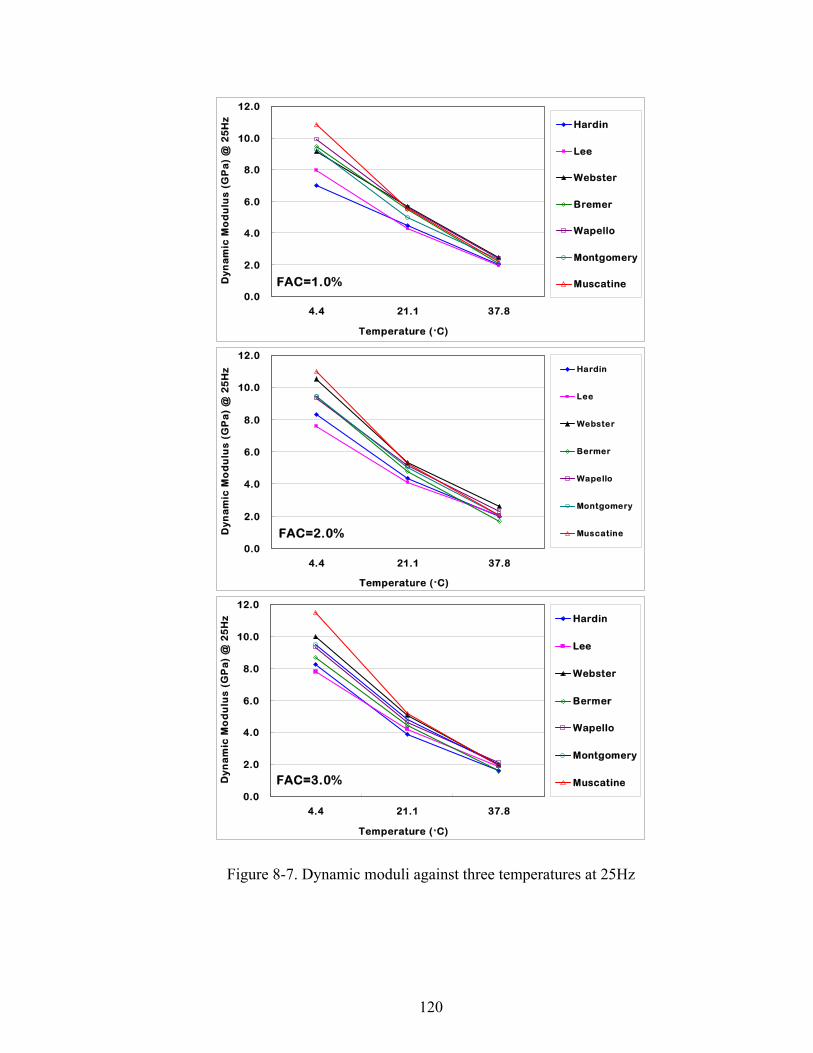
120
0.0
2.0
4.0
6.0
8.0
10.0
12.0
4.4 21.1 37.8
Temperature (˚C)
Dy
na
mic
Mo
du
lus
(G
Pa
) @
25
Hz Hardin
Lee
Webster
Bremer
Wapello
Montgomery
MuscatineFAC=1.0%
0.0
2.0
4.0
6.0
8.0
10.0
12.0
4.4 21.1 37.8
Temperature (˚C)
Dyn
am
ic M
od
ulu
s (G
Pa
) @
25
Hz Hardin
Lee
Webster
Bermer
Wapello
Montgomery
MuscatineFAC=2.0%
0.0
2.0
4.0
6.0
8.0
10.0
12.0
4.4 21.1 37.8
Temperature (˚C)
Dy
na
mic
Mo
du
lus
(GP
a)
@ 2
5H
z Hardin
Lee
Webster
Bermer
Wapello
Montgomery
MuscatineFAC=3.0%
Figure 8-7. Dynamic moduli against three temperatures at 25Hz
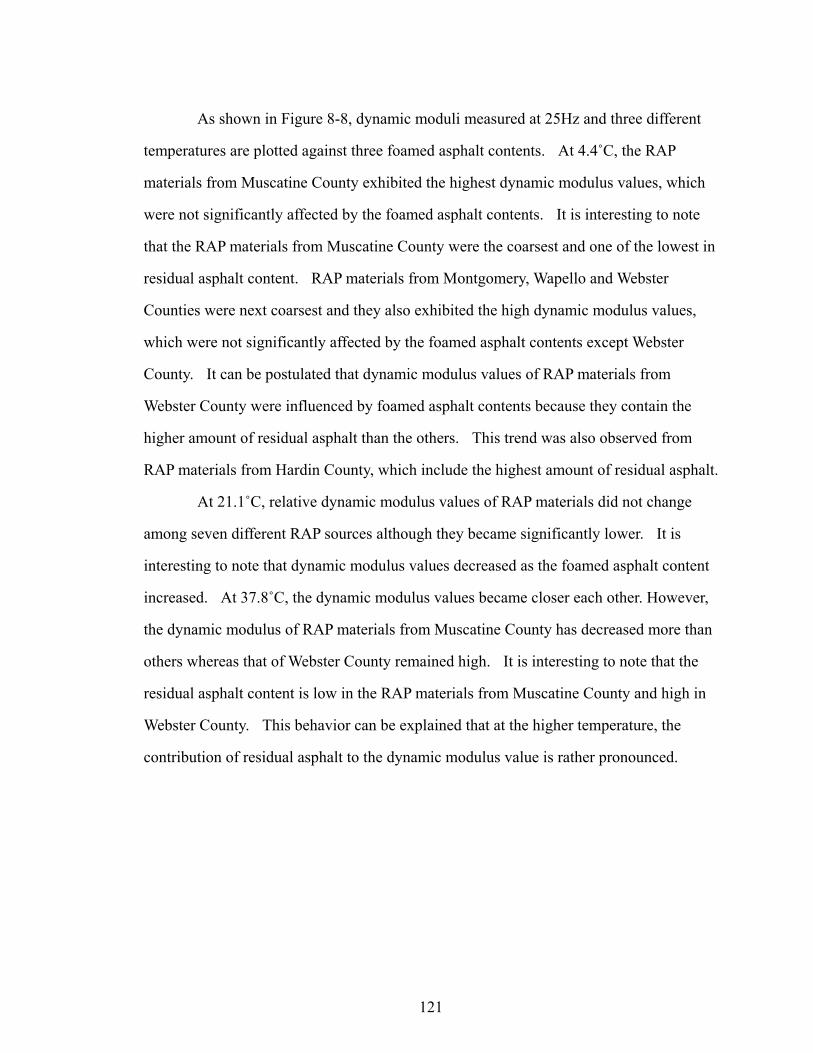
121
As shown in Figure 8-8, dynamic moduli measured at 25Hz and three different
temperatures are plotted against three foamed asphalt contents. At 4.4˚C, the RAP
materials from Muscatine County exhibited the highest dynamic modulus values, which
were not significantly affected by the foamed asphalt contents. It is interesting to note
that the RAP materials from Muscatine County were the coarsest and one of the lowest in
residual asphalt content. RAP materials from Montgomery, Wapello and Webster
Counties were next coarsest and they also exhibited the high dynamic modulus values,
which were not significantly affected by the foamed asphalt contents except Webster
County. It can be postulated that dynamic modulus values of RAP materials from
Webster County were influenced by foamed asphalt contents because they contain the
higher amount of residual asphalt than the others. This trend was also observed from
RAP materials from Hardin County, which include the highest amount of residual asphalt.
At 21.1˚C, relative dynamic modulus values of RAP materials did not change
among seven different RAP sources although they became significantly lower. It is
interesting to note that dynamic modulus values decreased as the foamed asphalt content
increased. At 37.8˚C, the dynamic modulus values became closer each other. However,
the dynamic modulus of RAP materials from Muscatine County has decreased more than
others whereas that of Webster County remained high. It is interesting to note that the
residual asphalt content is low in the RAP materials from Muscatine County and high in
Webster County. This behavior can be explained that at the higher temperature, the
contribution of residual asphalt to the dynamic modulus value is rather pronounced.
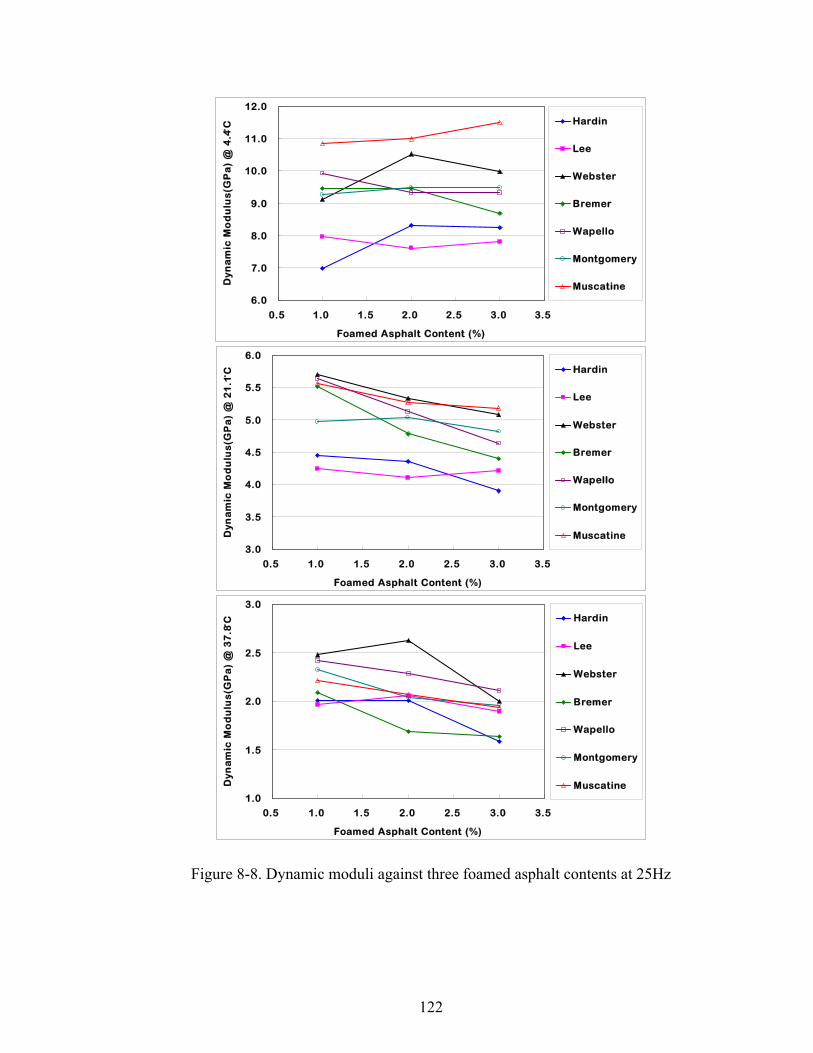
122
6.0
7.0
8.0
9.0
10.0
11.0
12.0
0.5 1.0 1.5 2.0 2.5 3.0 3.5
Foamed Asphalt Content (%)
Dy
na
mic
Mo
du
lus
(GP
a)
@ 4
.4̊C Hardin
Lee
Webster
Bremer
Wapello
Montgomery
Muscatine
3.0
3.5
4.0
4.5
5.0
5.5
6.0
0.5 1.0 1.5 2.0 2.5 3.0 3.5
Foamed Asphalt Content (%)
Dyn
am
ic M
od
ulu
s(G
Pa
) @
21
.1̊C Hardin
Lee
Webster
Bremer
Wapello
Montgomery
Muscatine
1.0
1.5
2.0
2.5
3.0
0.5 1.0 1.5 2.0 2.5 3.0 3.5
Foamed Asphalt Content (%)
Dyn
am
ic M
od
ulu
s(G
Pa
) @
37
.8̊C Hardin
Lee
Webster
Bremer
Wapello
Montgomery
Muscatine
Figure 8-8. Dynamic moduli against three foamed asphalt contents at 25Hz

123
8.1.4.3 Master Curve Construction Procedure
The measured dynamic modulus at different temperatures can be then shifted
relative to the time of frequency so that the various curves can be aligned to form a single
master curve. In constructing the master curves, as shown in Figure 8-9. the measured
dynamic moduli at test temperatures above the reference temperature horizontally shifted
to the left (low frequencies) and the measured dynamic moduli at test temperatures below
the reference temperature are shifted to the right (higher frequencies). The master curve
of an asphalt mixture allows comparisons to be made over extended ranges of frequencies
and temperature.
2.0
2.5
3.0
3.5
4.0
4.5
-4 -2 0 2 4
Log Reducued Frequency (Hz)
Lo
g D
yn
am
ic M
od
ulu
s (
MP
a)
Measured E*4.4˚C21.1˚C37.8˚CPredicted E*
Figure 8-9. Construction of master curve
Master curves can be constructed using the time-temperature correspondence
principle, which uses the following equivalency between frequency and temperature for
the range of dynamic moduli of asphalt mixtures.
log(fr) - log(f) = log[α(T)]

124
fr = reduced frequency (Hz) f = loading frequency (Hz) α(T)= shifting factor
First, the master curve should be constructed using an arbitrarily selected
reference temperature, Tref, to which all data are shifted. A commonly used formula for
the shift factor is the Williams-Landel-Ferry (WLF) equation (Williams et al., 1955). In
the WLF equation, the shift factor α(T) is defined as:
Log fr – log f = log α(T) = ref
ref
TTCTTC−+
−−
2
1 )(
fr = reduced frequency (Hz) f = loading frequency (Hz) C1, C2 = empirical constants
The frequency where the master curve should be read fr is defined as:
fr = α(T) x f
A master curve represented by a nonlinear sigmoidal function is defined in
AASHTTO 2002 Design Guide as:
rfeE log
*
1log γβ
αδ +++=
*log E = log of dynamic modulus (MPa),
δ=minimum modulus value, fr = reduced frequency (Hz), α=span of modulus value, β, γ= shape parameters,
Using the dynamic modulus test results measured at three different temperatures
and six different loading frequencies, a master curve was constructed for a reference
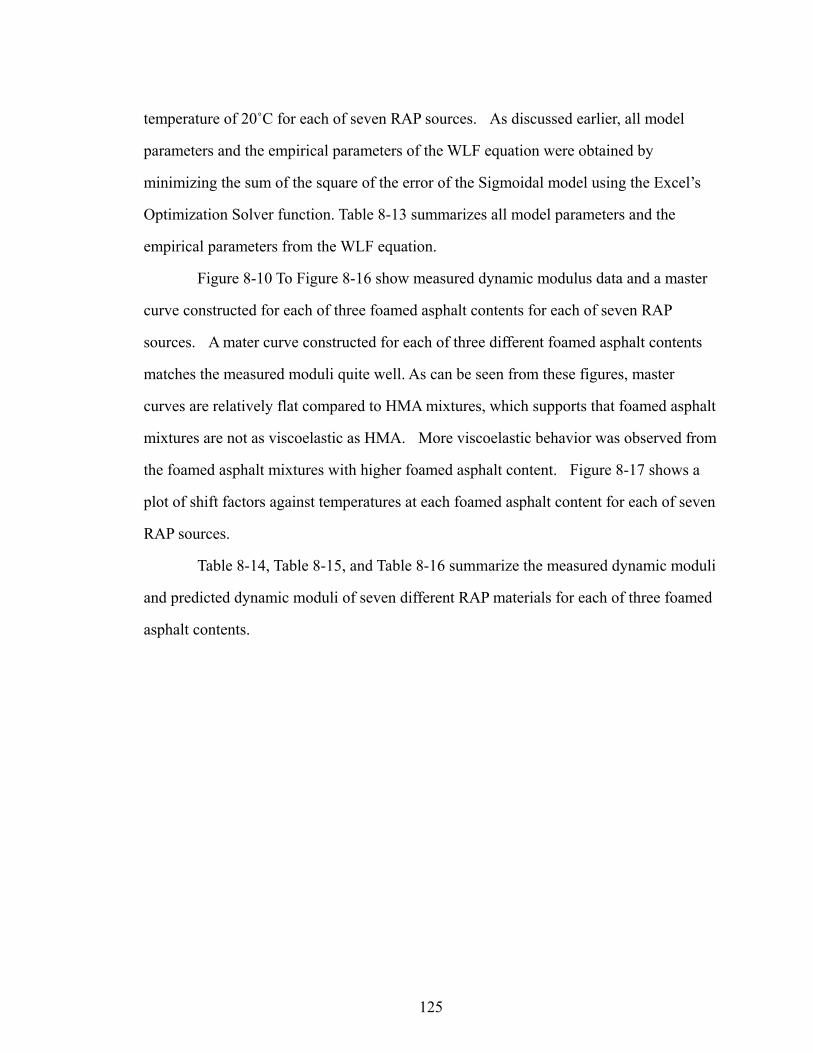
125
temperature of 20˚C for each of seven RAP sources. As discussed earlier, all model
parameters and the empirical parameters of the WLF equation were obtained by
minimizing the sum of the square of the error of the Sigmoidal model using the Excel’s
Optimization Solver function. Table 8-13 summarizes all model parameters and the
empirical parameters from the WLF equation.
Figure 8-10 To Figure 8-16 show measured dynamic modulus data and a master
curve constructed for each of three foamed asphalt contents for each of seven RAP
sources. A mater curve constructed for each of three different foamed asphalt contents
matches the measured moduli quite well. As can be seen from these figures, master
curves are relatively flat compared to HMA mixtures, which supports that foamed asphalt
mixtures are not as viscoelastic as HMA. More viscoelastic behavior was observed from
the foamed asphalt mixtures with higher foamed asphalt content. Figure 8-17 shows a
plot of shift factors against temperatures at each foamed asphalt content for each of seven
RAP sources.
Table 8-14, Table 8-15, and Table 8-16 summarize the measured dynamic moduli
and predicted dynamic moduli of seven different RAP materials for each of three foamed
asphalt contents.
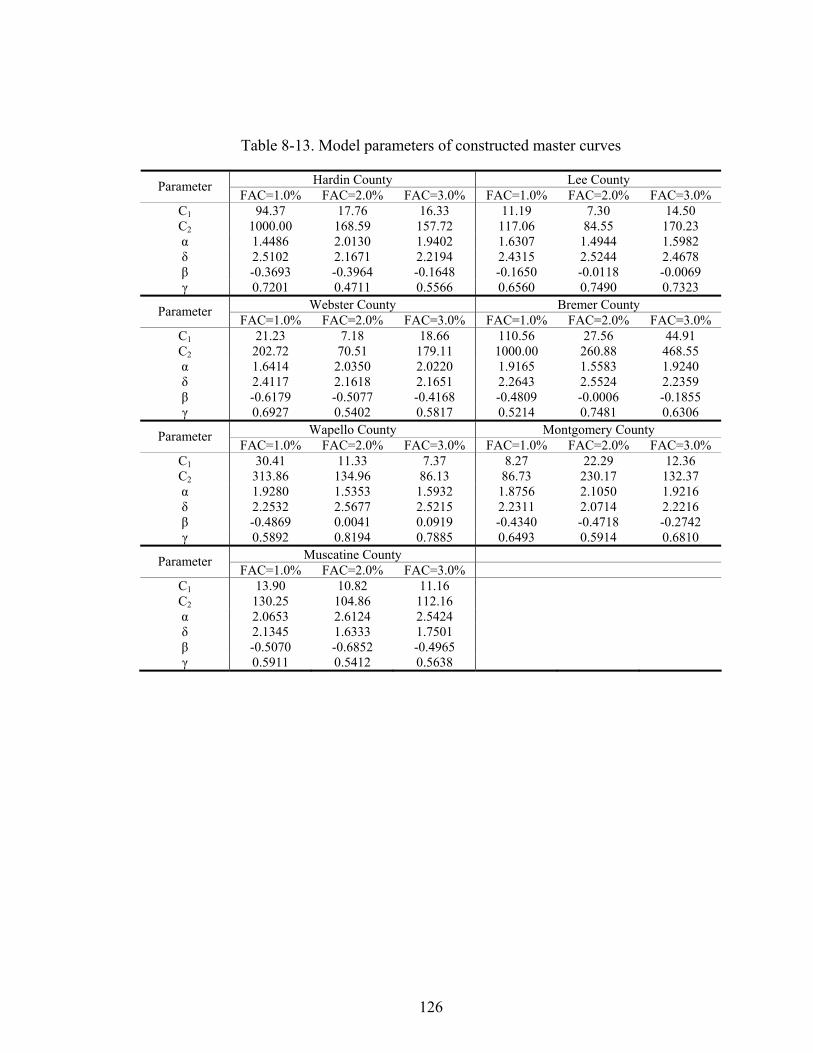
126
Table 8-13. Model parameters of constructed master curves
Hardin County Lee County Parameter FAC=1.0% FAC=2.0% FAC=3.0% FAC=1.0% FAC=2.0% FAC=3.0%
C1 94.37 17.76 16.33 11.19 7.30 14.50 C2 1000.00 168.59 157.72 117.06 84.55 170.23 α 1.4486 2.0130 1.9402 1.6307 1.4944 1.5982 δ 2.5102 2.1671 2.2194 2.4315 2.5244 2.4678 β -0.3693 -0.3964 -0.1648 -0.1650 -0.0118 -0.0069 γ 0.7201 0.4711 0.5566 0.6560 0.7490 0.7323
Webster County Bremer County Parameter FAC=1.0% FAC=2.0% FAC=3.0% FAC=1.0% FAC=2.0% FAC=3.0%
C1 21.23 7.18 18.66 110.56 27.56 44.91 C2 202.72 70.51 179.11 1000.00 260.88 468.55 α 1.6414 2.0350 2.0220 1.9165 1.5583 1.9240 δ 2.4117 2.1618 2.1651 2.2643 2.5524 2.2359 β -0.6179 -0.5077 -0.4168 -0.4809 -0.0006 -0.1855 γ 0.6927 0.5402 0.5817 0.5214 0.7481 0.6306
Wapello County Montgomery County Parameter FAC=1.0% FAC=2.0% FAC=3.0% FAC=1.0% FAC=2.0% FAC=3.0%
C1 30.41 11.33 7.37 8.27 22.29 12.36 C2 313.86 134.96 86.13 86.73 230.17 132.37 α 1.9280 1.5353 1.5932 1.8756 2.1050 1.9216 δ 2.2532 2.5677 2.5215 2.2311 2.0714 2.2216 β -0.4869 0.0041 0.0919 -0.4340 -0.4718 -0.2742 γ 0.5892 0.8194 0.7885 0.6493 0.5914 0.6810
Muscatine County Parameter FAC=1.0% FAC=2.0% FAC=3.0%
C1 13.90 10.82 11.16 C2 130.25 104.86 112.16 α 2.0653 2.6124 2.5424 δ 2.1345 1.6333 1.7501 β -0.5070 -0.6852 -0.4965 γ 0.5911 0.5412 0.5638
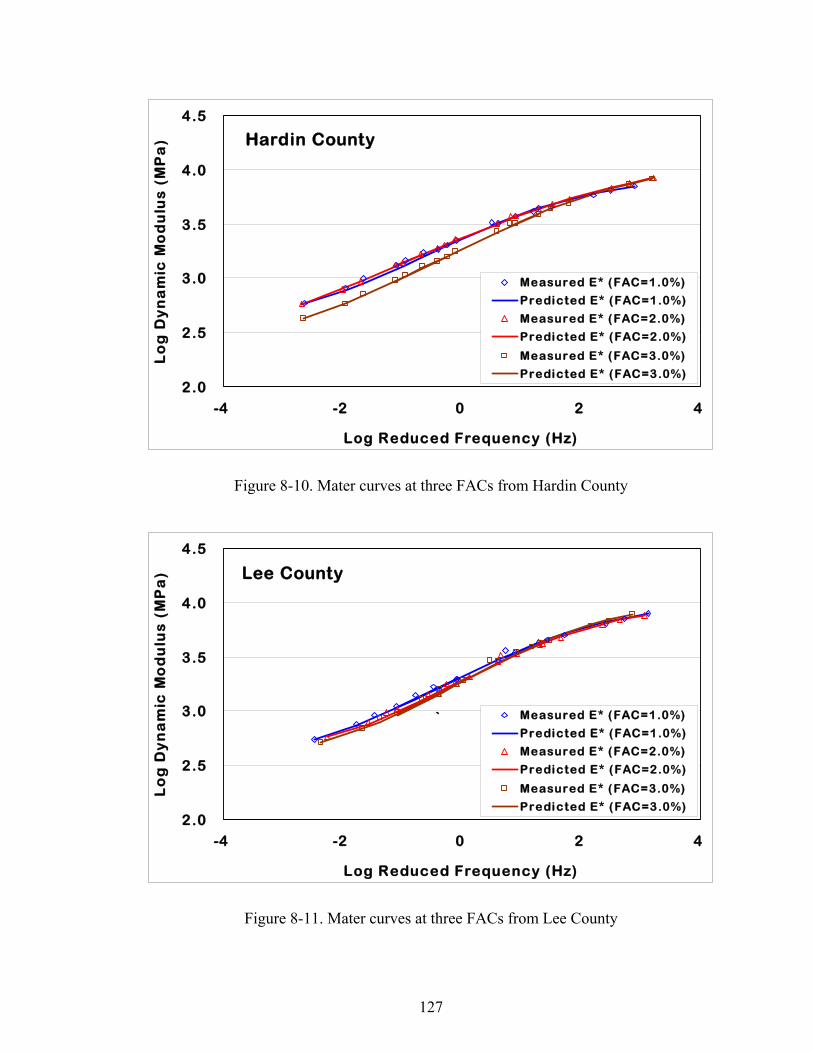
127
2.0
2.5
3.0
3.5
4.0
4.5
-4 -2 0 2 4
Log Reduced Frequency (Hz)
Lo
g D
yn
am
ic M
od
ulu
s (
MP
a)
Measured E* (FAC=1.0%)
Predicted E* (FAC=1.0%)
Measured E* (FAC=2.0%)
Predicted E* (FAC=2.0%)
Measured E* (FAC=3.0%)
Predicted E* (FAC=3.0%)
Hardin County
Figure 8-10. Mater curves at three FACs from Hardin County
2.0
2.5
3.0
3.5
4.0
4.5
-4 -2 0 2 4
Log Reduced Frequency (Hz)
Lo
g D
yn
am
ic M
od
ulu
s (
MP
a)
Measured E* (FAC=1.0%)
Predicted E* (FAC=1.0%)
Measured E* (FAC=2.0%)
Predicted E* (FAC=2.0%)
Measured E* (FAC=3.0%)
Predicted E* (FAC=3.0%)
Lee County
`
Figure 8-11. Mater curves at three FACs from Lee County
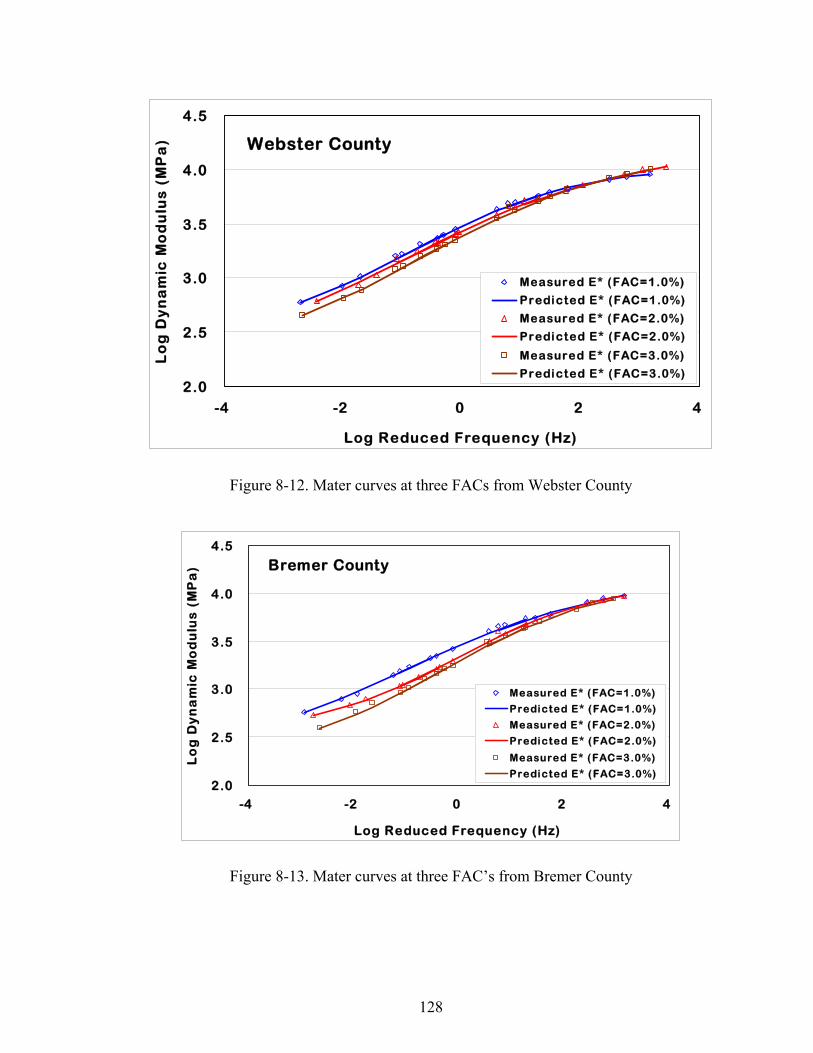
128
2.0
2.5
3.0
3.5
4.0
4.5
-4 -2 0 2 4
Log Reduced Frequency (Hz)
Lo
g D
yn
am
ic M
od
ulu
s (
MP
a)
Measured E* (FAC=1.0%)
Predicted E* (FAC=1.0%)
Measured E* (FAC=2.0%)
Predicted E* (FAC=2.0%)
Measured E* (FAC=3.0%)
Predicted E* (FAC=3.0%)
Webster County
Figure 8-12. Mater curves at three FACs from Webster County
2.0
2.5
3.0
3.5
4.0
4.5
-4 -2 0 2 4
Log Reduced Frequency (Hz)
Lo
g D
yn
am
ic M
od
ulu
s (
MP
a)
Measured E* (FAC=1.0%)
Predicted E* (FAC=1.0%)
Measured E* (FAC=2.0%)
Predicted E* (FAC=2.0%)
Measured E* (FAC=3.0%)
Predicted E* (FAC=3.0%)
Bremer County
Figure 8-13. Mater curves at three FAC’s from Bremer County
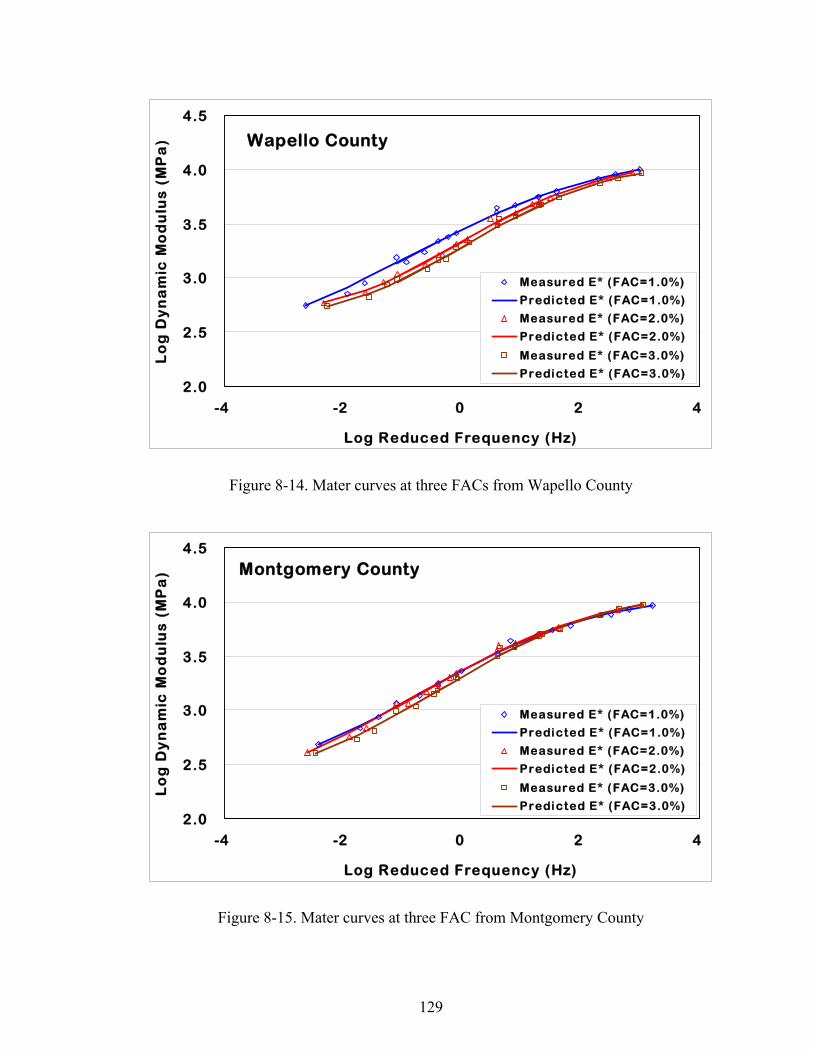
129
2.0
2.5
3.0
3.5
4.0
4.5
-4 -2 0 2 4
Log Reduced Frequency (Hz)
Lo
g D
yn
am
ic M
od
ulu
s (
MP
a)
Measured E* (FAC=1.0%)
Predicted E* (FAC=1.0%)
Measured E* (FAC=2.0%)
Predicted E* (FAC=2.0%)
Measured E* (FAC=3.0%)
Predicted E* (FAC=3.0%)
Wapello County
Figure 8-14. Mater curves at three FACs from Wapello County
2.0
2.5
3.0
3.5
4.0
4.5
-4 -2 0 2 4
Log Reduced Frequency (Hz)
Lo
g D
yn
am
ic M
od
ulu
s (
MP
a)
Measured E* (FAC=1.0%)
Predicted E* (FAC=1.0%)
Measured E* (FAC=2.0%)
Predicted E* (FAC=2.0%)
Measured E* (FAC=3.0%)
Predicted E* (FAC=3.0%)
Montgomery County
Figure 8-15. Mater curves at three FAC from Montgomery County
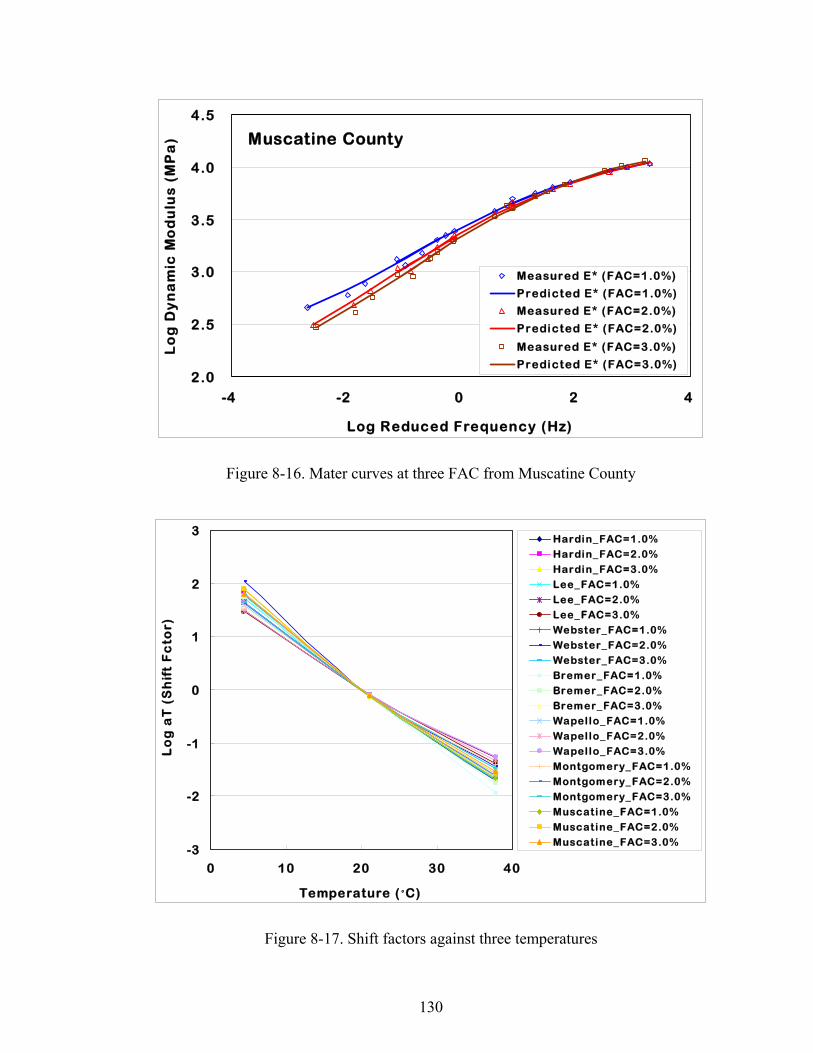
130
2.0
2.5
3.0
3.5
4.0
4.5
-4 -2 0 2 4
Log Reduced Frequency (Hz)
Lo
g D
yn
am
ic M
od
ulu
s (
MP
a)
Measured E* (FAC=1.0%)
Predicted E* (FAC=1.0%)
Measured E* (FAC=2.0%)
Predicted E* (FAC=2.0%)
Measured E* (FAC=3.0%)
Predicted E* (FAC=3.0%)
Muscatine County
Figure 8-16. Mater curves at three FAC from Muscatine County
-3
-2
-1
0
1
2
3
0 10 20 30 40
Temperature (˚C)
Lo
g a
T (
Sh
ift
Fc
tor)
Hardin_FAC=1.0%
Hardin_FAC=2.0%
Hardin_FAC=3.0%
Lee_FAC=1.0%
Lee_FAC=2.0%
Lee_FAC=3.0%
Webster_FAC=1.0%
Webster_FAC=2.0%
Webster_FAC=3.0%
Bremer_FAC=1.0%
Bremer_FAC=2.0%
Bremer_FAC=3.0%
Wapel lo_FAC=1.0%
Wapel lo_FAC=2.0%
Wapel lo_FAC=3.0%
Montgomery_FAC=1.0%
Montgomery_FAC=2.0%
Montgomery_FAC=3.0%
Muscatine_FAC=1.0%
Muscatine_FAC=2.0%
Muscatine_FAC=3.0%
Figure 8-17. Shift factors against three temperatures
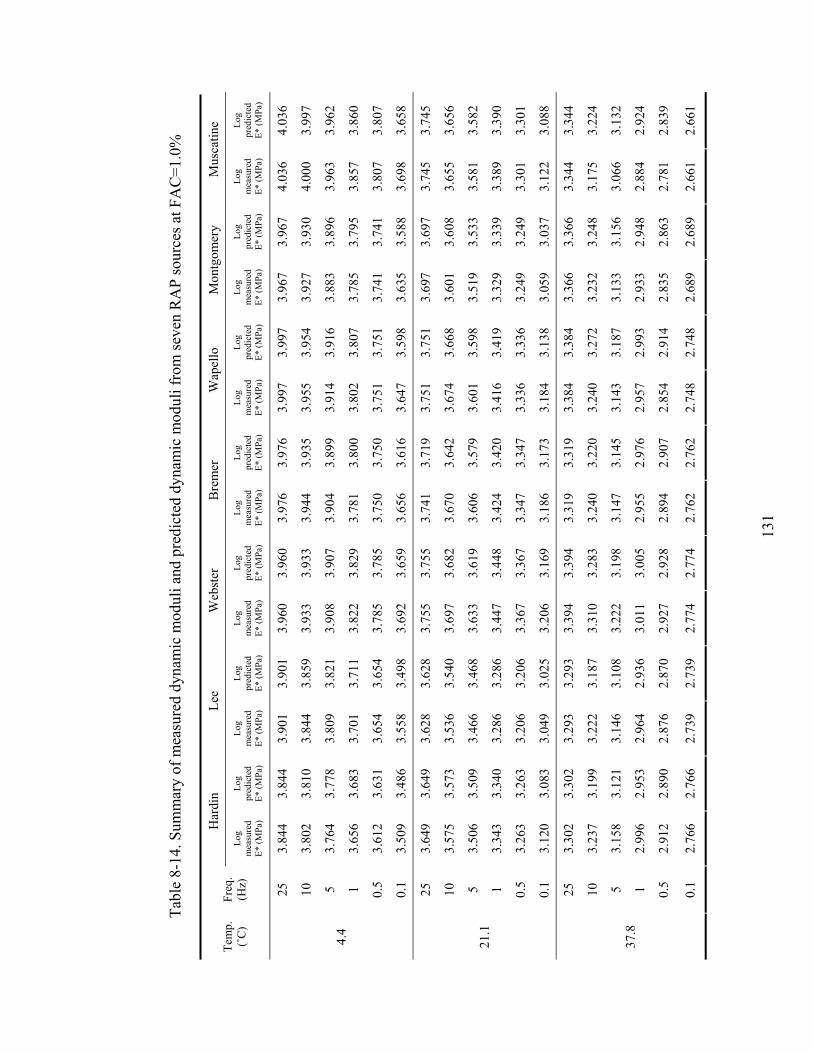
13
1
Tabl
e 8-
14. S
umm
ary
of m
easu
red
dyna
mic
mod
uli a
nd p
redi
cted
dyn
amic
mod
uli f
rom
seve
n R
AP
sour
ces a
t FA
C=1
.0%
Har
din
Lee
Web
ster
B
rem
er
Wap
ello
M
ontg
omer
y M
usca
tine
Tem
p.
(˚C
) Fr
eq.
(Hz)
Lo
g m
easu
red
E* (M
Pa)
Log
pred
icte
d E*
(MPa
)
Log
mea
sure
d E*
(MPa
)
Log
pred
icte
d E*
(MPa
)
Log
mea
sure
d E*
(MPa
)
Log
pred
icte
d E*
(MPa
)
Log
mea
sure
d E*
(MPa
)
Log
pred
icte
d E*
(MPa
)
Log
mea
sure
d E*
(MPa
)
Log
pred
icte
d E*
(MPa
)
Log
mea
sure
d E*
(MPa
)
Log
pred
icte
d E*
(MPa
)
Log
mea
sure
d E*
(MPa
)
Log
pred
icte
d E*
(MPa
)
25
3.84
4 3.
844
3.90
1 3.
901
3.96
0 3.
960
3.97
6 3.
976
3.99
7 3.
997
3.96
7 3.
967
4.03
6 4.
036
10
3.80
2 3.
810
3.84
4 3.
859
3.93
3 3.
933
3.94
4 3.
935
3.95
5 3.
954
3.92
7 3.
930
4.00
0 3.
997
5 3.
764
3.77
8 3.
809
3.82
1 3.
908
3.90
7 3.
904
3.89
9 3.
914
3.91
6 3.
883
3.89
6 3.
963
3.96
2
1 3.
656
3.68
3 3.
701
3.71
1 3.
822
3.82
9 3.
781
3.80
0 3.
802
3.80
7 3.
785
3.79
5 3.
857
3.86
0
0.5
3.61
2 3.
631
3.65
4 3.
654
3.78
5 3.
785
3.75
0 3.
750
3.75
1 3.
751
3.74
1 3.
741
3.80
7 3.
807
4.4
0.1
3.50
9 3.
486
3.55
8 3.
498
3.69
2 3.
659
3.65
6 3.
616
3.64
7 3.
598
3.63
5 3.
588
3.69
8 3.
658
25
3.64
9 3.
649
3.62
8 3.
628
3.75
5 3.
755
3.74
1 3.
719
3.75
1 3.
751
3.69
7 3.
697
3.74
5 3.
745
10
3.57
5 3.
573
3.53
6 3.
540
3.69
7 3.
682
3.67
0 3.
642
3.67
4 3.
668
3.60
1 3.
608
3.65
5 3.
656
5 3.
506
3.50
9 3.
466
3.46
8 3.
633
3.61
9 3.
606
3.57
9 3.
601
3.59
8 3.
519
3.53
3 3.
581
3.58
2
1 3.
343
3.34
0 3.
286
3.28
6 3.
447
3.44
8 3.
424
3.42
0 3.
416
3.41
9 3.
329
3.33
9 3.
389
3.39
0
0.5
3.26
3 3.
263
3.20
6 3.
206
3.36
7 3.
367
3.34
7 3.
347
3.33
6 3.
336
3.24
9 3.
249
3.30
1 3.
301
21.1
0.1
3.12
0 3.
083
3.04
9 3.
025
3.20
6 3.
169
3.18
6 3.
173
3.18
4 3.
138
3.05
9 3.
037
3.12
2 3.
088
25
3.30
2 3.
302
3.29
3 3.
293
3.39
4 3.
394
3.31
9 3.
319
3.38
4 3.
384
3.36
6 3.
366
3.34
4 3.
344
10
3.23
7 3.
199
3.22
2 3.
187
3.31
0 3.
283
3.24
0 3.
220
3.24
0 3.
272
3.23
2 3.
248
3.17
5 3.
224
5 3.
158
3.12
1 3.
146
3.10
8 3.
222
3.19
8 3.
147
3.14
5 3.
143
3.18
7 3.
133
3.15
6 3.
066
3.13
2
1 2.
996
2.95
3 2.
964
2.93
6 3.
011
3.00
5 2.
955
2.97
6 2.
957
2.99
3 2.
933
2.94
8 2.
884
2.92
4
0.5
2.91
2 2.
890
2.87
6 2.
870
2.92
7 2.
928
2.89
4 2.
907
2.85
4 2.
914
2.83
5 2.
863
2.78
1 2.
839
37.8
0.1
2.76
6 2.
766
2.73
9 2.
739
2.77
4 2.
774
2.76
2 2.
762
2.74
8 2.
748
2.68
9 2.
689
2.66
1 2.
661

132
Table 8-15. Summ
ary of measured dynam
ic moduli and predicted dynam
ic moduli from
seven RA
P sources at FAC
=2.0%
Hardin
Lee W
ebster B
remer
Wapello
Montgom
ery M
uscatine Tem
p. (˚C
) Freq. (H
z) Log
measured
E* (MPa)
Log predicted E* (M
Pa)
Log m
easured E* (M
Pa)
Log predicted E* (M
Pa)
Log m
easured E* (M
Pa)
Log predicted E* (M
Pa)
Log m
easured E* (M
Pa)
Log predicted E* (M
Pa)
Log m
easured E* (M
Pa)
Log predicted E* (M
Pa)
Log m
easured E* (M
Pa)
Log predicted E* (M
Pa)
Log m
easured E* (M
Pa)
Log predictedE* (M
Pa)
25 3.920
3.920 3.882
3.882 4.022
4.022 3.976
3.976 3.970
3.970 3.977
3.977 4.041
4.041
10 3.873
3.875 3.837
3.840 3.997
3.984 3.932
3.935 3.925
3.925 3.933
3.930 3.999
3.997
5 3.835
3.836 3.794
3.802 3.957
3.951 3.894
3.896 3.877
3.882 3.882
3.889 3.960
3.957
1 3.727
3.732 3.673
3.686 3.859
3.858 3.772
3.780 3.743
3.750 3.762
3.770 3.841
3.845
0.5 3.680
3.680 3.624
3.624 3.809
3.809 3.718
3.718 3.679
3.679 3.708
3.708 3.787
3.787
4.4
0.1 3.569
3.547 3.514
3.454 3.711
3.677 3.604
3.546 3.547
3.483 3.597
3.541 3.665
3.626
25 3.639
3.639 3.613
3.613 3.727
3.727 3.679
3.679 3.710
3.710 3.702
3.702 3.721
3.721
10 3.571
3.562 3.532
3.520 3.658
3.645 3.584
3.580 3.598
3.607 3.622
3.611 3.626
3.625
5 3.509
3.499 3.455
3.442 3.581
3.577 3.503
3.499 3.514
3.521 3.544
3.534 3.545
3.544
1 3.361
3.344 3.258
3.250 3.402
3.404 3.294
3.298 3.316
3.305 3.343
3.336 3.344
3.335
0.5 3.274
3.274 3.166
3.166 3.324
3.324 3.211
3.211 3.211
3.211 3.245
3.245 3.236
3.236
21.1
0.1 3.123
3.109 3.014
2.985 3.181
3.133 3.033
3.024 3.037
3.012 3.064
3.028 3.033
2.994
25 3.302
3.302 3.312
3.312 3.420
3.420 3.227
3.227 3.358
3.358 3.307
3.307 3.315
3.315
10 3.220
3.208 3.249
3.201 3.333
3.314 3.132
3.116 3.210
3.234 3.167
3.185 3.132
3.183
5 3.133
3.137 3.156
3.119 3.243
3.232 3.043
3.038 3.123
3.143 3.061
3.092 3.010
3.079
1 2.974
2.974 2.988
2.945 3.025
3.041 2.906
2.882 2.961
2.955 2.834
2.879 2.820
2.832
0.5 2.894
2.906 2.896
2.880 2.939
2.961 2.834
2.827 2.863
2.888 2.748
2.792 2.689
2.728
37.8
0.1 2.760
2.760 2.758
2.758 2.787
2.787 2.728
2.728 2.767
2.767 2.611
2.611 2.497
2.497
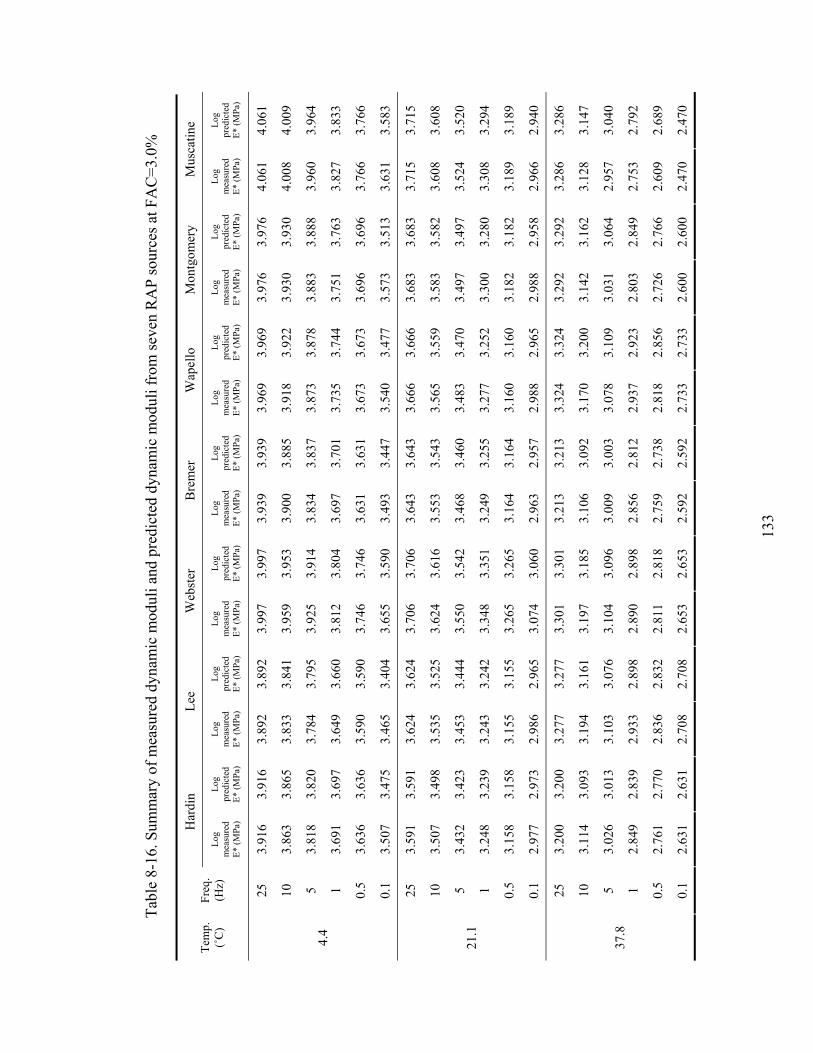
13
3
Tabl
e 8-
16. S
umm
ary
of m
easu
red
dyna
mic
mod
uli a
nd p
redi
cted
dyn
amic
mod
uli f
rom
seve
n R
AP
sour
ces a
t FA
C=3
.0%
Har
din
Lee
Web
ster
B
rem
er
Wap
ello
M
ontg
omer
y M
usca
tine
Tem
p.
(˚C
) Fr
eq.
(Hz)
Lo
g m
easu
red
E* (M
Pa)
Log
pred
icte
d E*
(MPa
)
Log
mea
sure
d E*
(MPa
)
Log
pred
icte
d E*
(MPa
)
Log
mea
sure
d E*
(MPa
)
Log
pred
icte
d E*
(MPa
)
Log
mea
sure
d E*
(MPa
)
Log
pred
icte
d E*
(MPa
)
Log
mea
sure
d E*
(MPa
)
Log
pred
icte
d E*
(MPa
)
Log
mea
sure
d E*
(MPa
)
Log
pred
icte
d E*
(MPa
)
Log
mea
sure
d E*
(MPa
)
Log
pred
icte
d E*
(MPa
)
25
3.91
6 3.
916
3.89
2 3.
892
3.99
7 3.
997
3.93
9 3.
939
3.96
9 3.
969
3.97
6 3.
976
4.06
1 4.
061
10
3.86
3 3.
865
3.83
3 3.
841
3.95
9 3.
953
3.90
0 3.
885
3.91
8 3.
922
3.93
0 3.
930
4.00
8 4.
009
5 3.
818
3.82
0 3.
784
3.79
5 3.
925
3.91
4 3.
834
3.83
7 3.
873
3.87
8 3.
883
3.88
8 3.
960
3.96
4
1 3.
691
3.69
7 3.
649
3.66
0 3.
812
3.80
4 3.
697
3.70
1 3.
735
3.74
4 3.
751
3.76
3 3.
827
3.83
3
0.5
3.63
6 3.
636
3.59
0 3.
590
3.74
6 3.
746
3.63
1 3.
631
3.67
3 3.
673
3.69
6 3.
696
3.76
6 3.
766
4.4
0.1
3.50
7 3.
475
3.46
5 3.
404
3.65
5 3.
590
3.49
3 3.
447
3.54
0 3.
477
3.57
3 3.
513
3.63
1 3.
583
25
3.59
1 3.
591
3.62
4 3.
624
3.70
6 3.
706
3.64
3 3.
643
3.66
6 3.
666
3.68
3 3.
683
3.71
5 3.
715
10
3.50
7 3.
498
3.53
5 3.
525
3.62
4 3.
616
3.55
3 3.
543
3.56
5 3.
559
3.58
3 3.
582
3.60
8 3.
608
5 3.
432
3.42
3 3.
453
3.44
4 3.
550
3.54
2 3.
468
3.46
0 3.
483
3.47
0 3.
497
3.49
7 3.
524
3.52
0
1 3.
248
3.23
9 3.
243
3.24
2 3.
348
3.35
1 3.
249
3.25
5 3.
277
3.25
2 3.
300
3.28
0 3.
308
3.29
4
0.5
3.15
8 3.
158
3.15
5 3.
155
3.26
5 3.
265
3.16
4 3.
164
3.16
0 3.
160
3.18
2 3.
182
3.18
9 3.
189
21.1
0.1
2.97
7 2.
973
2.98
6 2.
965
3.07
4 3.
060
2.96
3 2.
957
2.98
8 2.
965
2.98
8 2.
958
2.96
6 2.
940
25
3.20
0 3.
200
3.27
7 3.
277
3.30
1 3.
301
3.21
3 3.
213
3.32
4 3.
324
3.29
2 3.
292
3.28
6 3.
286
10
3.11
4 3.
093
3.19
4 3.
161
3.19
7 3.
185
3.10
6 3.
092
3.17
0 3.
200
3.14
2 3.
162
3.12
8 3.
147
5 3.
026
3.01
3 3.
103
3.07
6 3.
104
3.09
6 3.
009
3.00
3 3.
078
3.10
9 3.
031
3.06
4 2.
957
3.04
0
1 2.
849
2.83
9 2.
933
2.89
8 2.
890
2.89
8 2.
856
2.81
2 2.
937
2.92
3 2.
803
2.84
9 2.
753
2.79
2
0.5
2.76
1 2.
770
2.83
6 2.
832
2.81
1 2.
818
2.75
9 2.
738
2.81
8 2.
856
2.72
6 2.
766
2.60
9 2.
689
37.8
0.1
2.63
1 2.
631
2.70
8 2.
708
2.65
3 2.
653
2.59
2 2.
592
2.73
3 2.
733
2.60
0 2.
600
2.47
0 2.
470
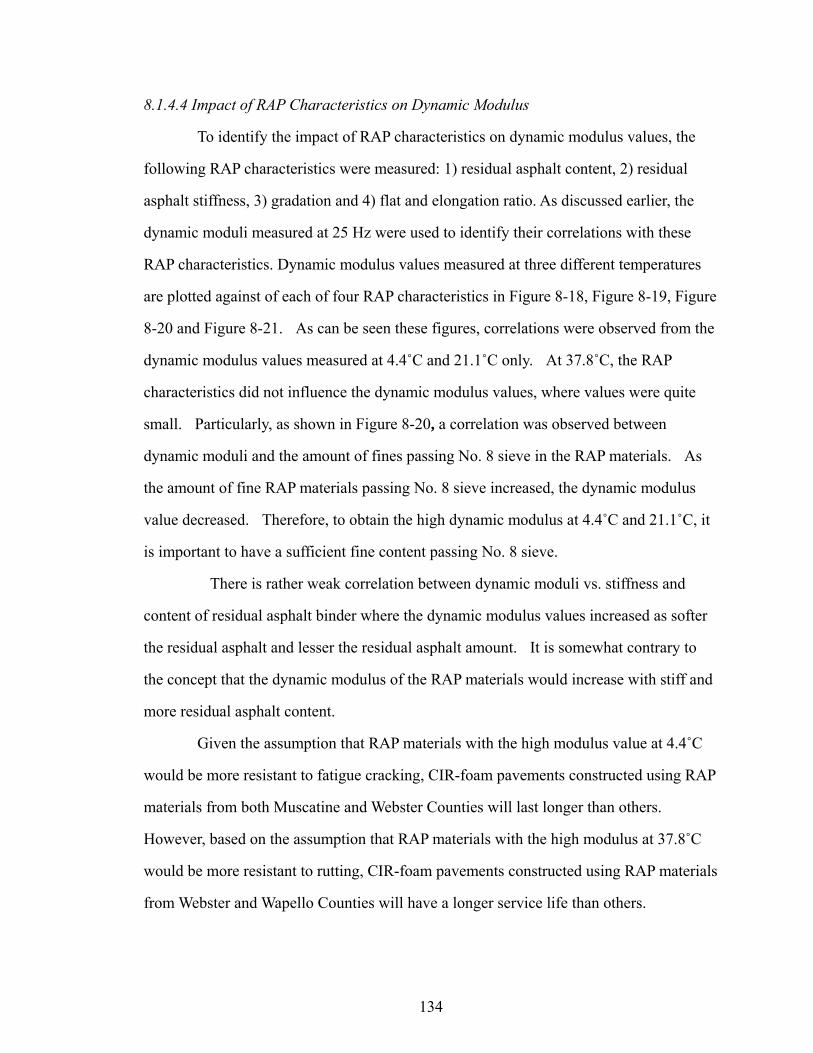
134
8.1.4.4 Impact of RAP Characteristics on Dynamic Modulus
To identify the impact of RAP characteristics on dynamic modulus values, the
following RAP characteristics were measured: 1) residual asphalt content, 2) residual
asphalt stiffness, 3) gradation and 4) flat and elongation ratio. As discussed earlier, the
dynamic moduli measured at 25 Hz were used to identify their correlations with these
RAP characteristics. Dynamic modulus values measured at three different temperatures
are plotted against of each of four RAP characteristics in Figure 8-18, Figure 8-19, Figure
8-20 and Figure 8-21. As can be seen these figures, correlations were observed from the
dynamic modulus values measured at 4.4˚C and 21.1˚C only. At 37.8˚C, the RAP
characteristics did not influence the dynamic modulus values, where values were quite
small. Particularly, as shown in Figure 8-20, a correlation was observed between
dynamic moduli and the amount of fines passing No. 8 sieve in the RAP materials. As
the amount of fine RAP materials passing No. 8 sieve increased, the dynamic modulus
value decreased. Therefore, to obtain the high dynamic modulus at 4.4˚C and 21.1˚C, it
is important to have a sufficient fine content passing No. 8 sieve.
There is rather weak correlation between dynamic moduli vs. stiffness and
content of residual asphalt binder where the dynamic modulus values increased as softer
the residual asphalt and lesser the residual asphalt amount. It is somewhat contrary to
the concept that the dynamic modulus of the RAP materials would increase with stiff and
more residual asphalt content.
Given the assumption that RAP materials with the high modulus value at 4.4˚C
would be more resistant to fatigue cracking, CIR-foam pavements constructed using RAP
materials from both Muscatine and Webster Counties will last longer than others.
However, based on the assumption that RAP materials with the high modulus at 37.8˚C
would be more resistant to rutting, CIR-foam pavements constructed using RAP materials
from Webster and Wapello Counties will have a longer service life than others.
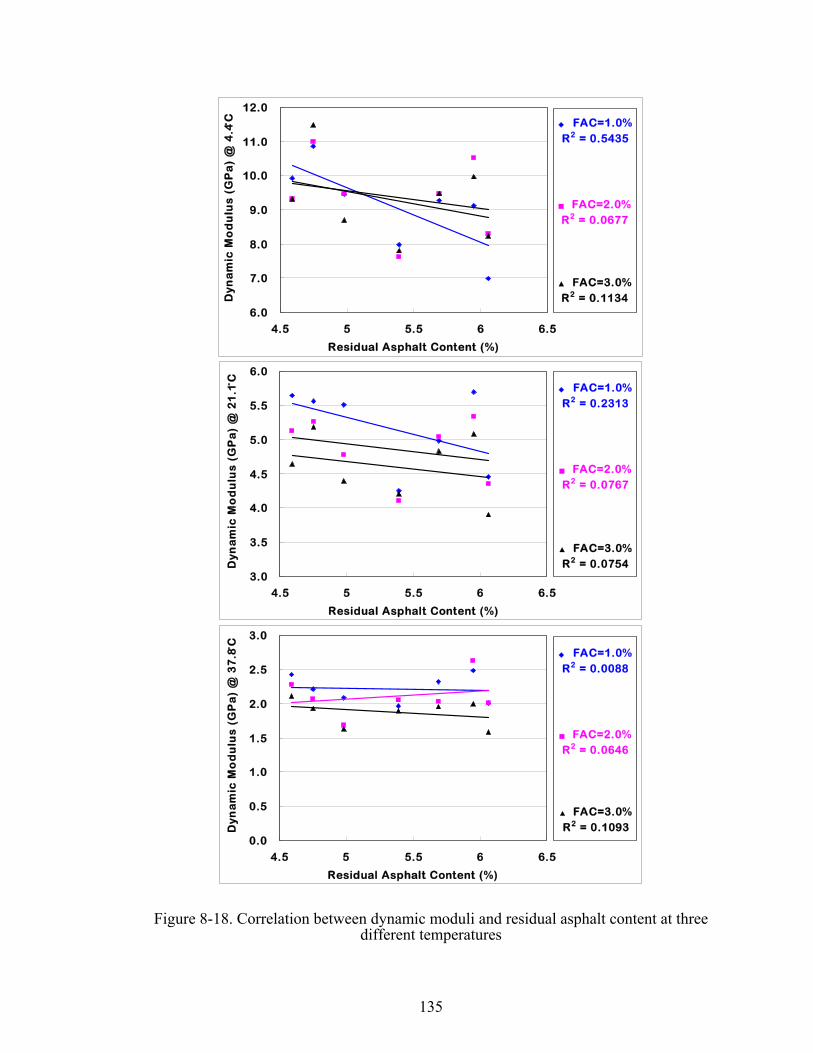
135
◆ FAC=1.0%R2 = 0.5435
■ FAC=2.0%R2 = 0.0677
▲ FAC=3.0%R2 = 0.1134
6.0
7.0
8.0
9.0
10.0
11.0
12.0
4.5 5 5.5 6 6.5
Residual Asphalt Content (%)
Dyn
am
ic M
od
ulu
s (G
Pa
) @
4.4̊
C
◆ FAC=1.0%R2 = 0.2313
■ FAC=2.0%R2 = 0.0767
▲ FAC=3.0%R2 = 0.0754
3.0
3.5
4.0
4.5
5.0
5.5
6.0
4.5 5 5.5 6 6.5
Residual Asphalt Content (%)
Dyn
am
ic M
od
ulu
s (G
Pa
) @
21
.1̊C
◆ FAC=1.0%R2 = 0.0088
■ FAC=2.0%R2 = 0.0646
▲ FAC=3.0%R2 = 0.1093
0.0
0.5
1.0
1.5
2.0
2.5
3.0
4.5 5 5.5 6 6.5
Residual Asphalt Content (%)
Dyn
am
ic M
od
ulu
s (G
Pa
) @
37
.8̊C
Figure 8-18. Correlation between dynamic moduli and residual asphalt content at three different temperatures
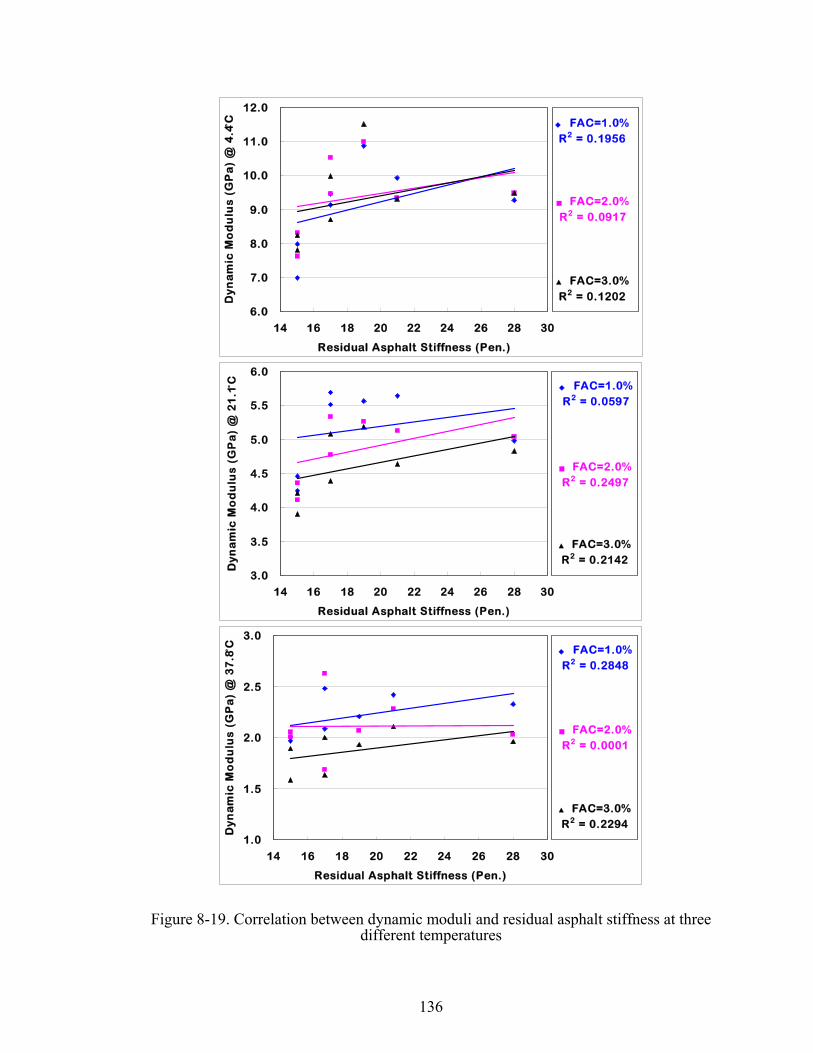
136
◆ FAC=1.0%R2 = 0.1956
■ FAC=2.0%R2 = 0.0917
▲ FAC=3.0%R2 = 0.1202
6.0
7.0
8.0
9.0
10.0
11.0
12.0
14 16 18 20 22 24 26 28 30
Residual Asphalt Stiffness (Pen.)
Dy
na
mic
Mo
du
lus
(GP
a)
@ 4
.4̊C
◆ FAC=1.0%R2 = 0.0597
■ FAC=2.0%R2 = 0.2497
▲ FAC=3.0%R2 = 0.2142
3.0
3.5
4.0
4.5
5.0
5.5
6.0
14 16 18 20 22 24 26 28 30
Residual Asphalt Stiffness (Pen.)
Dy
na
mic
Mo
du
lus
(GP
a)
@ 2
1.1̊
C
◆ FAC=1.0%R2 = 0.2848
▲ FAC=3.0%R2 = 0.2294
■ FAC=2.0%R2 = 0.0001
1.0
1.5
2.0
2.5
3.0
14 16 18 20 22 24 26 28 30
Residual Asphalt Stiffness (Pen.)
Dy
na
mic
Mo
du
lus
(G
Pa
) @
37
.8̊C
Figure 8-19. Correlation between dynamic moduli and residual asphalt stiffness at three different temperatures

137
◆ FAC=1.0%R2 = 0.5106
■ FAC=2.0%R2 = 0.592
▲ FAC=3.0%R2 = 0.7866
6.0
7.0
8.0
9.0
10.0
11.0
12.0
21 23 25 27 29 31 33 35 37
% Passing No. 8 Sieve of RAP
Dy
na
mic
Mo
du
lus
(G
Pa
) @
4.4̊
C
◆ FAC=1.0%R2 = 0.3427
■ FAC=2.0%R2 = 0.6715
▲ FAC=3.0%R2 = 0.6004
3.0
3.5
4.0
4.5
5.0
5.5
6.0
21 23 25 27 29 31 33 35 37
% Passing No. 8 Sieve of RAP
Dyn
am
ic M
od
ulu
s (G
Pa
) @
21
.1̊C
◆ FAC=1.0%R2 = 0.4428
■ FAC=2.0%R2 = 0.124
▲ FAC=3.0%R2 = 0.3308
0.0
0.5
1.0
1.5
2.0
2.5
3.0
21 23 25 27 29 31 33 35 37
% Passing No. 8 Sieve of RAP
Dy
na
mic
Mo
du
lus
(G
Pa
) @
37
.8̊C
Figure 8-20. Correlation between dynamic moduli and amount of fine RAP materials passing No. 8 sieve at three different temperatures
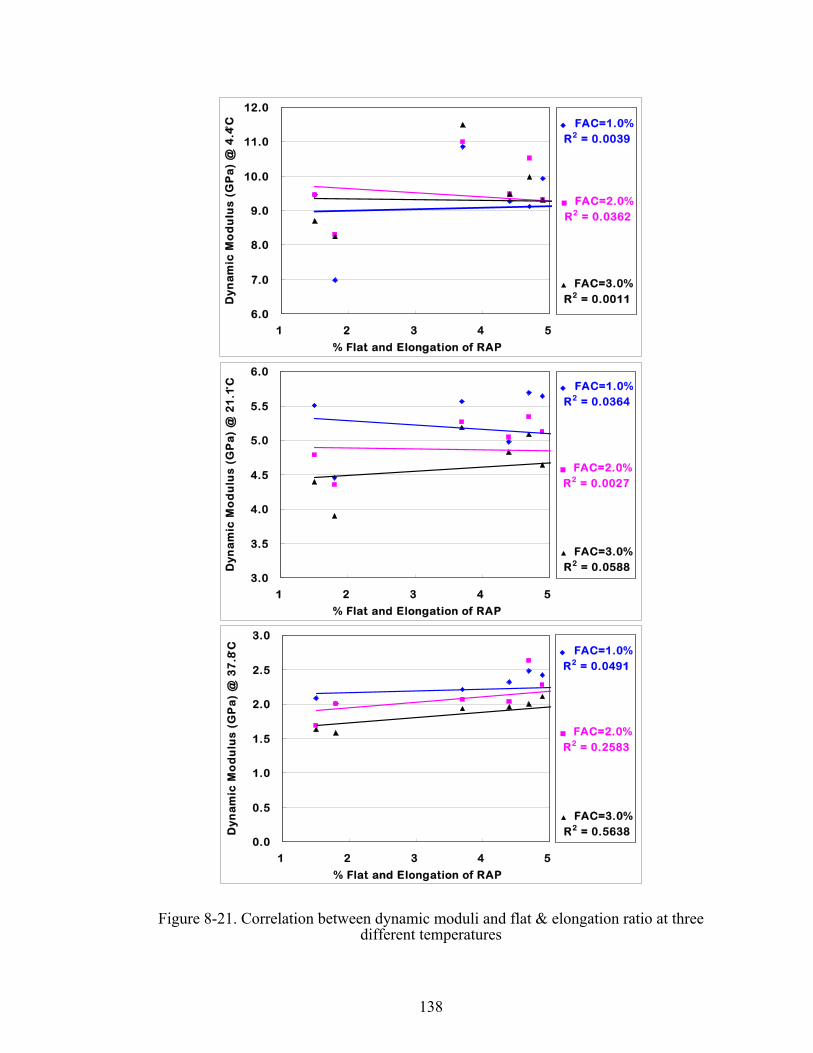
138
◆ FAC=1.0%R2 = 0.0039
■ FAC=2.0%R2 = 0.0362
▲ FAC=3.0%R2 = 0.0011
6.0
7.0
8.0
9.0
10.0
11.0
12.0
1 2 3 4 5
% Flat and Elongation of RAP
Dy
na
mic
Mo
du
lus
(G
Pa
) @
4.4̊
C
◆ FAC=1.0%R2 = 0.0364
■ FAC=2.0%R2 = 0.0027
▲ FAC=3.0%R2 = 0.0588
3.0
3.5
4.0
4.5
5.0
5.5
6.0
1 2 3 4 5
% Flat and Elongation of RAP
Dyn
am
ic M
od
ulu
s (G
Pa
) @
21
.1̊C
◆ FAC=1.0%R2 = 0.0491
■ FAC=2.0%R2 = 0.2583
▲ FAC=3.0%R2 = 0.5638
0.0
0.5
1.0
1.5
2.0
2.5
3.0
1 2 3 4 5
% Flat and Elongation of RAP
Dy
na
mic
Mo
du
lus
(G
Pa
) @
37
.8̊C
Figure 8-21. Correlation between dynamic moduli and flat & elongation ratio at three different temperatures
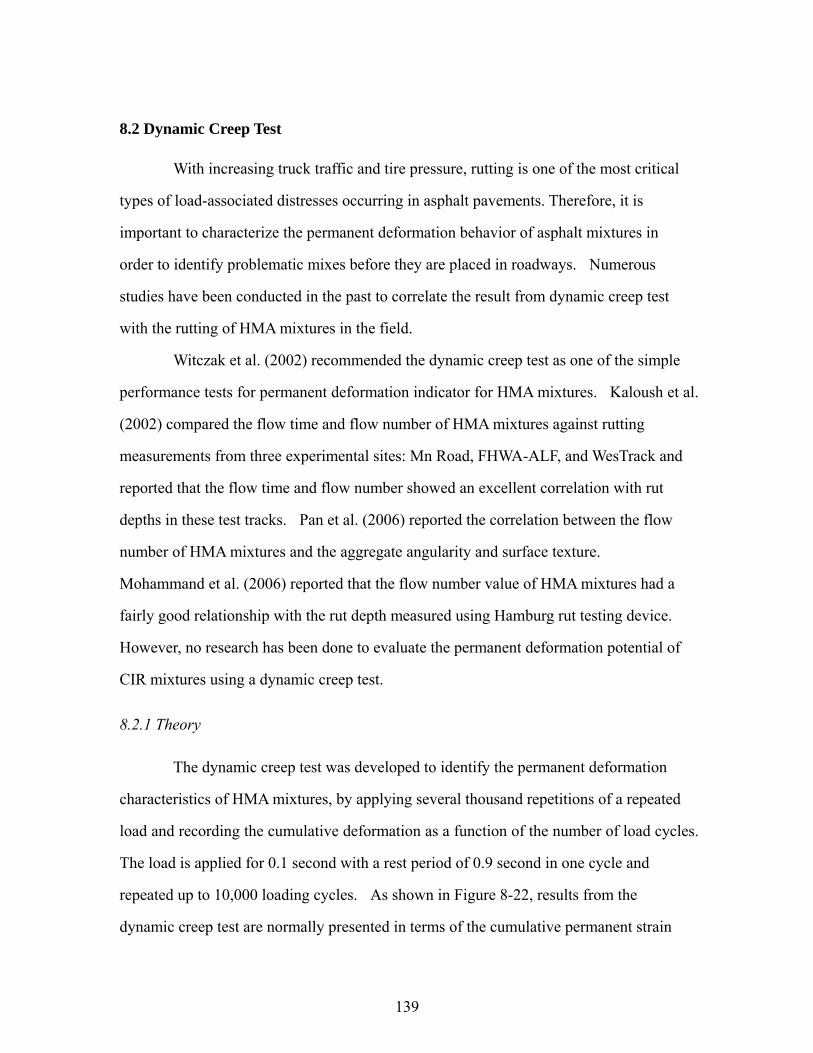
139
8.2 Dynamic Creep Test
With increasing truck traffic and tire pressure, rutting is one of the most critical
types of load-associated distresses occurring in asphalt pavements. Therefore, it is
important to characterize the permanent deformation behavior of asphalt mixtures in
order to identify problematic mixes before they are placed in roadways. Numerous
studies have been conducted in the past to correlate the result from dynamic creep test
with the rutting of HMA mixtures in the field.
Witczak et al. (2002) recommended the dynamic creep test as one of the simple
performance tests for permanent deformation indicator for HMA mixtures. Kaloush et al.
(2002) compared the flow time and flow number of HMA mixtures against rutting
measurements from three experimental sites: Mn Road, FHWA-ALF, and WesTrack and
reported that the flow time and flow number showed an excellent correlation with rut
depths in these test tracks. Pan et al. (2006) reported the correlation between the flow
number of HMA mixtures and the aggregate angularity and surface texture.
Mohammand et al. (2006) reported that the flow number value of HMA mixtures had a
fairly good relationship with the rut depth measured using Hamburg rut testing device.
However, no research has been done to evaluate the permanent deformation potential of
CIR mixtures using a dynamic creep test.
8.2.1 Theory
The dynamic creep test was developed to identify the permanent deformation
characteristics of HMA mixtures, by applying several thousand repetitions of a repeated
load and recording the cumulative deformation as a function of the number of load cycles.
The load is applied for 0.1 second with a rest period of 0.9 second in one cycle and
repeated up to 10,000 loading cycles. As shown in Figure 8-22, results from the
dynamic creep test are normally presented in terms of the cumulative permanent strain
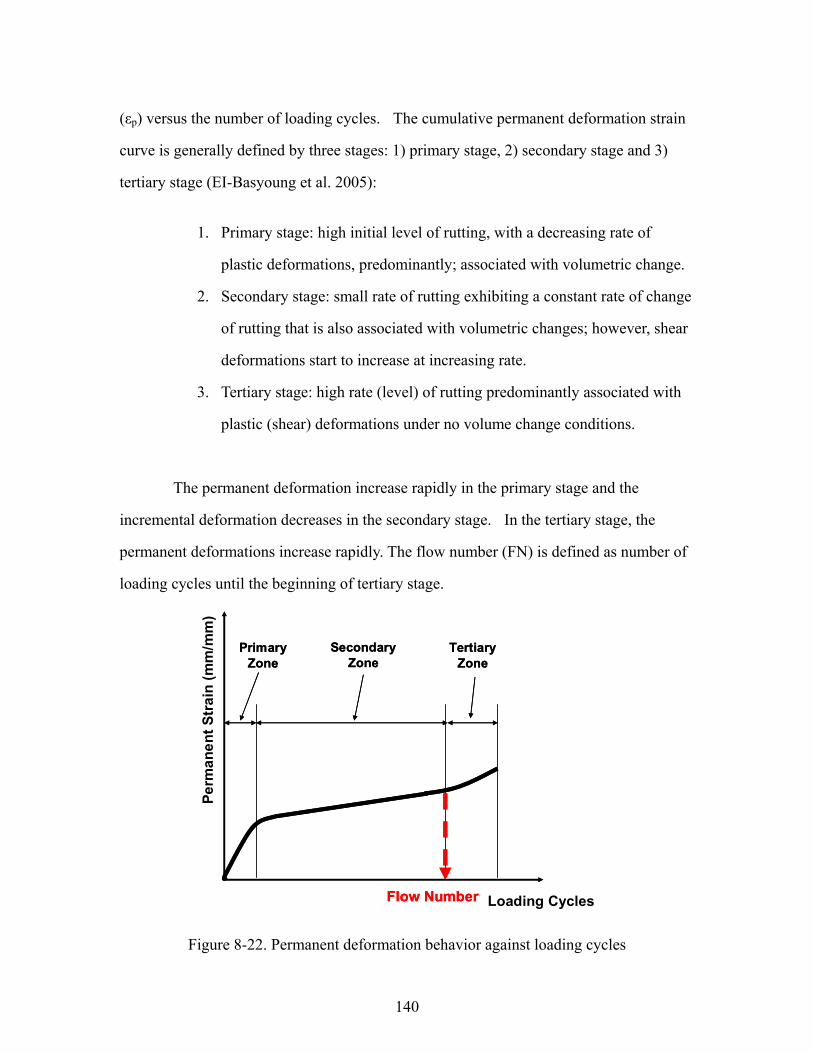
140
(εp) versus the number of loading cycles. The cumulative permanent deformation strain
curve is generally defined by three stages: 1) primary stage, 2) secondary stage and 3)
tertiary stage (EI-Basyoung et al. 2005):
1. Primary stage: high initial level of rutting, with a decreasing rate of
plastic deformations, predominantly; associated with volumetric change.
2. Secondary stage: small rate of rutting exhibiting a constant rate of change
of rutting that is also associated with volumetric changes; however, shear
deformations start to increase at increasing rate.
3. Tertiary stage: high rate (level) of rutting predominantly associated with
plastic (shear) deformations under no volume change conditions.
The permanent deformation increase rapidly in the primary stage and the
incremental deformation decreases in the secondary stage. In the tertiary stage, the
permanent deformations increase rapidly. The flow number (FN) is defined as number of
loading cycles until the beginning of tertiary stage.
Loading Cycles
Perm
anen
t Str
ain
(mm
/mm
)
Primary Zone
Secondary Zone
Tertiary Zone
Flow Number Loading Cycles
Perm
anen
t Str
ain
(mm
/mm
)
Primary Zone
Secondary Zone
Tertiary Zone
Flow Number
Figure 8-22. Permanent deformation behavior against loading cycles
141
Figure 8-23 (a) and (b) show plots of the accumulated permanent strain and the
rate of change in permanent strain versus loading cycles, respectively, from the dynamic
creep test conducted on the RAP materials from Hardin County. As shown in Figure 8-
23 (b), the flow number is determined at the number of loading cycles when the rate of
change in axial strain starts to increase near the 4,000 loading cycles.
0.0
0.5
1.0
1.5
2.0
2.5
3.0
3.5
4.0
4.5
5.0
0 1000 2000 3000 4000 5000 6000 7000 8000Pulse Number
Stra
in
(a) Plots of permanent strain versus loading cycle
0.0000
0.0005
0.0010
0.0015
0.0020
0.0025
0.0030
0.0035
0.0040
0.0045
0.0050
0 1000 2000 3000 4000 5000 6000 7000 8000Pulse Number
Stra
in d
s/dt
(b) Rate of change in permanent strain versus loading cycle
Figure 8-23. Dynamic creep test results
8.2.2. Dynamic Creep Testing Procedure
NCHRP’s dynamic creep testing protocol requires a specimen with 100-mm
diameter should be cored from a Gyratory compacted specimen with 150-mm diameter.
However, because CIR-foam specimens are not sufficiently stiff enough to be cored from
a 150mm-diameter specimen, a specimen with 100-mm diameter and 150-mm height was
prepared using a Gyratory compactor.
The uniaxial compression load without confinement was applied to obtain a
142
loading stress level of 138kPa (20 psi) at 40˚C. A loading stress level of 138kPa was
selected to attain tertiary flow in a reasonable number of cycles not exceeding 10,000.
Testing temperature of 40˚C was selected to represent the temperature of CIR base layer
in the field. The loading stress was applied in the form of a haversine curve with a
loading time of 0.1 second with a rest period of 0.9 second in one cycle. The test was
conducted up to 10,000 cycles or until achieving 5% of cumulative permanent stain.
8.2.3. Experimental Plan
CIR-foam specimens were prepared to measure a flow number using seven
different RAP sources. As summarized in Table 8-3, the mix design parameters
identified in validation task were used to prepare each test specimen. For each RAP
source, two specimens with 100-mm diameter and 150-mm height were prepared for each
of three foamed asphalt contents. Using RAP materials from each source, a total of six
CIR-foam specimens were compacted using the gyratory compactor at 30 gyrations and
the compacted CIR-foam specimens were cured in the oven at 40°C for three days.
8.2.4 Results and Discussion
The bulk specific gravities and air voids were measured for each CIR-foam
specimen. The dynamic creep tests were performed to evaluate:
1. rutting resistance of seven different RAP sources;
2. effect of the foamed asphalt content on rutting; and
3. correlation between flow number and RAP characteristics.
8.2.4.1 Volumetric Characteristics
The bulk specific gravities and air voids of each CIR-foam specimen were
determined following the AASHTO T 166 by measuring the dry mass and height. As
summarized in Table 8-17, overall, the bulk specific gravities seemed to increase as the

143
foamed asphalt content increased. RAP materials from Hardin County showed the lowest
bulk specific gravity whereas those from Wapello County showed highest bulk specific
gravity. Air voids decreased gradually as the foamed asphalt content increased.
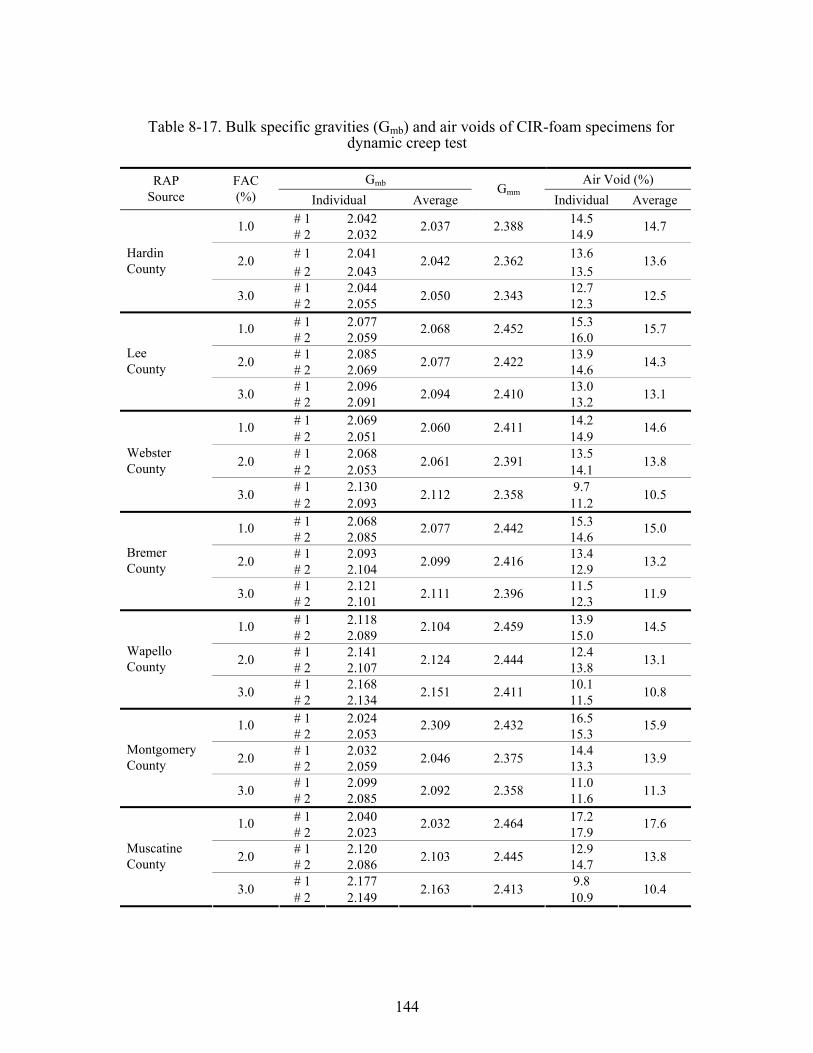
144
Table 8-17. Bulk specific gravities (Gmb) and air voids of CIR-foam specimens for dynamic creep test
Gmb Air Void (%) RAP Source
FAC (%) Individual Average
Gmm Individual Average
# 1 2.042 14.5 1.0 # 2 2.032 2.037 2.388 14.9 14.7
# 1 2.041 13.6 2.0 # 2 2.043
2.042 2.362 13.5
13.6
# 1 2.044 12.7
Hardin County
3.0 # 2 2.055 2.050 2.343 12.3 12.5
# 1 2.077 15.3 1.0 # 2 2.059
2.068 2.452 16.0
15.7
# 1 2.085 13.9 2.0 # 2 2.069 2.077 2.422 14.6 14.3
# 1 2.096 13.0
Lee County
3.0 # 2 2.091 2.094 2.410 13.2 13.1
# 1 2.069 14.2 1.0 # 2 2.051
2.060 2.411 14.9
14.6
# 1 2.068 13.5 2.0 # 2 2.053 2.061 2.391 14.1 13.8
# 1 2.130 9.7
Webster County
3.0 # 2 2.093 2.112 2.358 11.2 10.5
# 1 2.068 15.3 1.0 # 2 2.085
2.077 2.442 14.6
15.0
# 1 2.093 13.4 2.0 # 2 2.104 2.099 2.416 12.9 13.2
# 1 2.121 11.5
Bremer County
3.0 # 2 2.101 2.111 2.396 12.3 11.9
# 1 2.118 13.9 1.0 # 2 2.089
2.104 2.459 15.0
14.5
# 1 2.141 12.4 2.0 # 2 2.107 2.124 2.444 13.8 13.1
# 1 2.168 10.1
Wapello County
3.0 # 2 2.134 2.151 2.411 11.5 10.8
# 1 2.024 16.5 1.0 # 2 2.053
2.309 2.432 15.3
15.9
# 1 2.032 14.4 2.0 # 2 2.059 2.046 2.375 13.3 13.9
# 1 2.099 11.0
Montgomery County
3.0 # 2 2.085 2.092 2.358 11.6 11.3
# 1 2.040 17.2 1.0 # 2 2.023
2.032 2.464 17.9
17.6
# 1 2.120 12.9 2.0 # 2 2.086 2.103 2.445 14.7 13.8
# 1 2.177 9.8
Muscatine County
3.0 # 2 2.149 2.163 2.413 10.9 10.4
145
8.2.4.2 Dynamic Creep Test Results
The dynamic creep tests were performed on CIR-foam mixtures under a loading
stress level of 138kPa at 40˚C. For each RAP source, a total of six specimens were
prepared using three different foamed asphalt contents of 1.0%, 2.0% and 3.0%. Table
8-18 summarizes flow number and cumulative strain for three different foamed asphalt
contents of seven RAP sources.
Figure 8-24, Figure 8-25 and Figure 8-26 show plots of cumulative strain against
the number of loading cycles measured from fourteen specimens prepared using RAP
materials from seven RAP sources at the foamed asphalt contents of 1.0%, 2.0% and 3%,
respectively. As shown in these figures, RAP materials from Muscatine County
exhibited the lowest flow number at all foamed asphalt contents whereas those from Lee
and Webster Counties obtained the highest flow number. It is interesting to note that the
lower the foamed asphalt contents, the flow number was higher, which indicates the
foamed asphalt content with 1.0% is more resistant to rutting than 2.0% and 3.0%.
Characteristics of seven RAP materials are summarized in Table 8-19 along with the
rankings in terms of flow number. The failed test specimens with a tertiary flow within
10,000 cycles are shaded in the table. It is interesting to note that more specimens failed
as the foamed asphalt was increased from 1.0% to 3.0%. As can be easily observed from
the table, rankings of RAP materials did not change when the foamed asphalt was
increased from 1.0% to 3.0%, which confirms the consistency of the dynamic creep test
in evaluating the rutting susceptibility of RAP aggregate structure. It can be observed
that foamed asphalt content negatively affect the rutting resistance of CIR-foam mixtures.
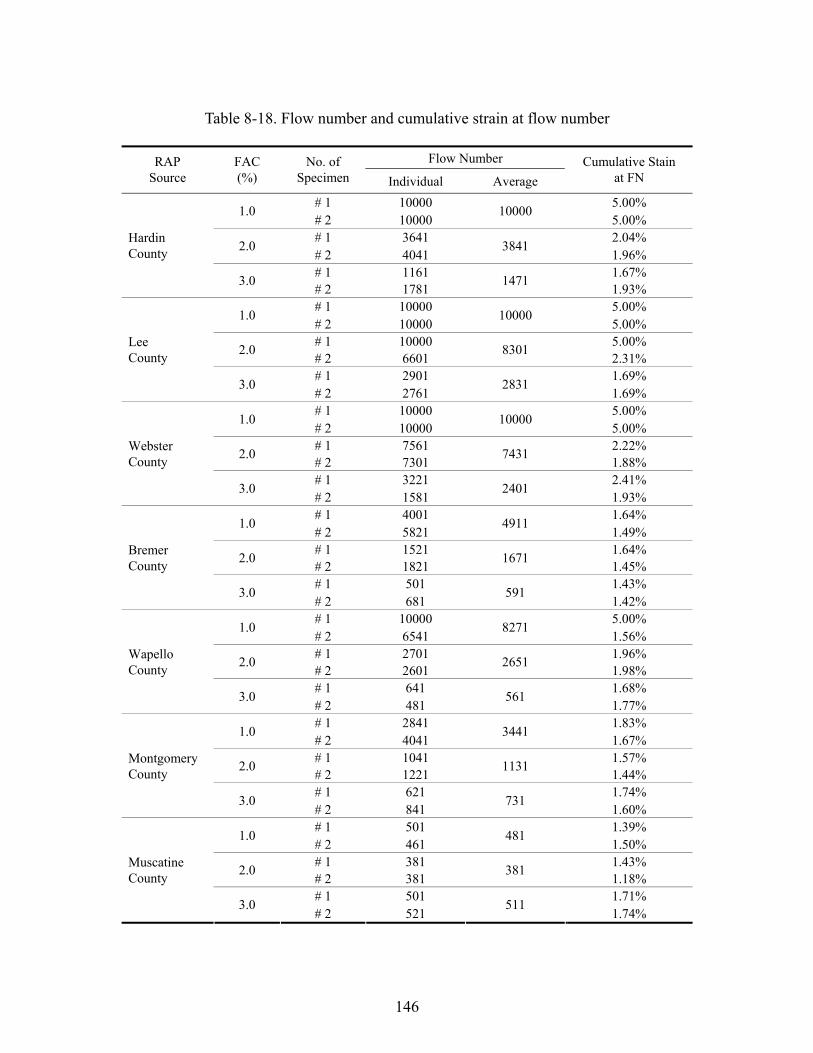
146
Table 8-18. Flow number and cumulative strain at flow number
Flow Number RAP Source
FAC (%)
No. of Specimen Individual Average
Cumulative Stain at FN
# 1 10000 5.00% 1.0 # 2 10000
10000 5.00%
# 1 3641 2.04% 2.0 # 2 4041
3841 1.96%
# 1 1161 1.67%
Hardin County
3.0 # 2 1781 1471 1.93% # 1 10000 5.00% 1.0 # 2 10000
10000 5.00%
# 1 10000 5.00% 2.0 # 2 6601 8301 2.31% # 1 2901 1.69%
Lee County
3.0 # 2 2761
2831 1.69%
# 1 10000 5.00% 1.0 # 2 10000
10000 5.00%
# 1 7561 2.22% 2.0 # 2 7301 7431 1.88% # 1 3221 2.41%
Webster County
3.0 # 2 1581
2401 1.93%
# 1 4001 1.64% 1.0 # 2 5821
4911 1.49%
# 1 1521 1.64% 2.0 # 2 1821 1671 1.45% # 1 501 1.43%
Bremer County
3.0 # 2 681
591 1.42%
# 1 10000 5.00% 1.0 # 2 6541
8271 1.56%
# 1 2701 1.96% 2.0 # 2 2601 2651 1.98% # 1 641 1.68%
Wapello County
3.0 # 2 481
561 1.77%
# 1 2841 1.83% 1.0 # 2 4041
3441 1.67%
# 1 1041 1.57% 2.0 # 2 1221 1131 1.44% # 1 621 1.74%
Montgomery County
3.0 # 2 841
731 1.60%
# 1 501 1.39% 1.0 # 2 461
481 1.50%
# 1 381 1.43% 2.0 # 2 381 381 1.18% # 1 501 1.71%
Muscatine County
3.0 # 2 521
511 1.74%
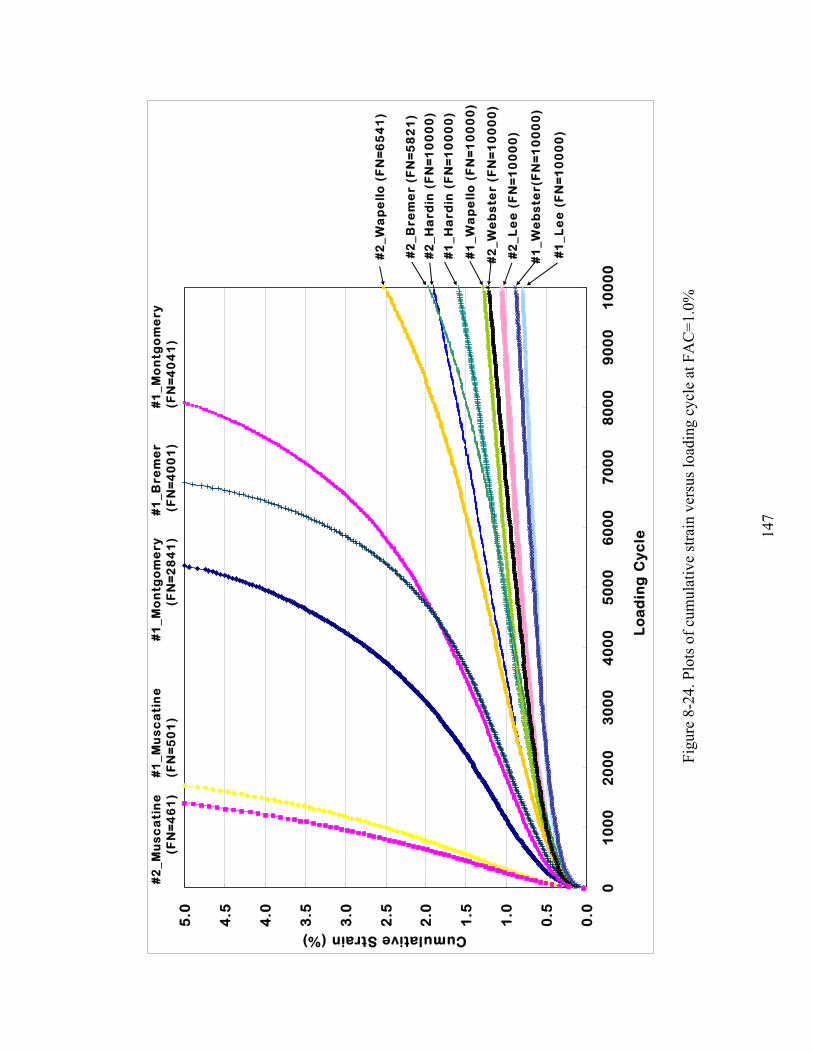
14
7
0.0
0.5
1.0
1.5
2.0
2.5
3.0
3.5
4.0
4.5
5.0
01
00
02
00
03
00
04
00
05
00
06
00
07
00
08
00
09
00
01
00
00
Lo
ad
ing
Cyc
le
Cumulative Strain (%)
#1
_Mo
ntg
om
ery
(FN
=2
84
1)
#1
_Bre
me
r (
FN
=4
00
1)
#1
_Mo
ntg
om
ery
(FN
=4
04
1)
#2
_Wa
pe
llo
(F
N=
65
41
)
#2
_Bre
me
r (F
N=
58
21
)
#2
_Ha
rdin
(F
N=
10
00
0)
#1
_Ha
rdin
(F
N=
10
00
0)
#1
_Wa
pe
llo
(F
N=
10
00
0)
#2
_We
bs
ter
(FN
=1
00
00
)
#2
_Le
e (
FN
=1
00
00
)
#1
_Le
e (
FN
=1
00
00
)
#1
_Mu
sc
ati
ne
(FN
=5
01
)#
2_M
us
ca
tin
e(F
N=
46
1)
#1
_We
bs
ter(
FN
=1
00
00
)
Figu
re 8
-24.
Plo
ts o
f cum
ulat
ive
stra
in v
ersu
s loa
ding
cyc
le a
t FA
C=1
.0%
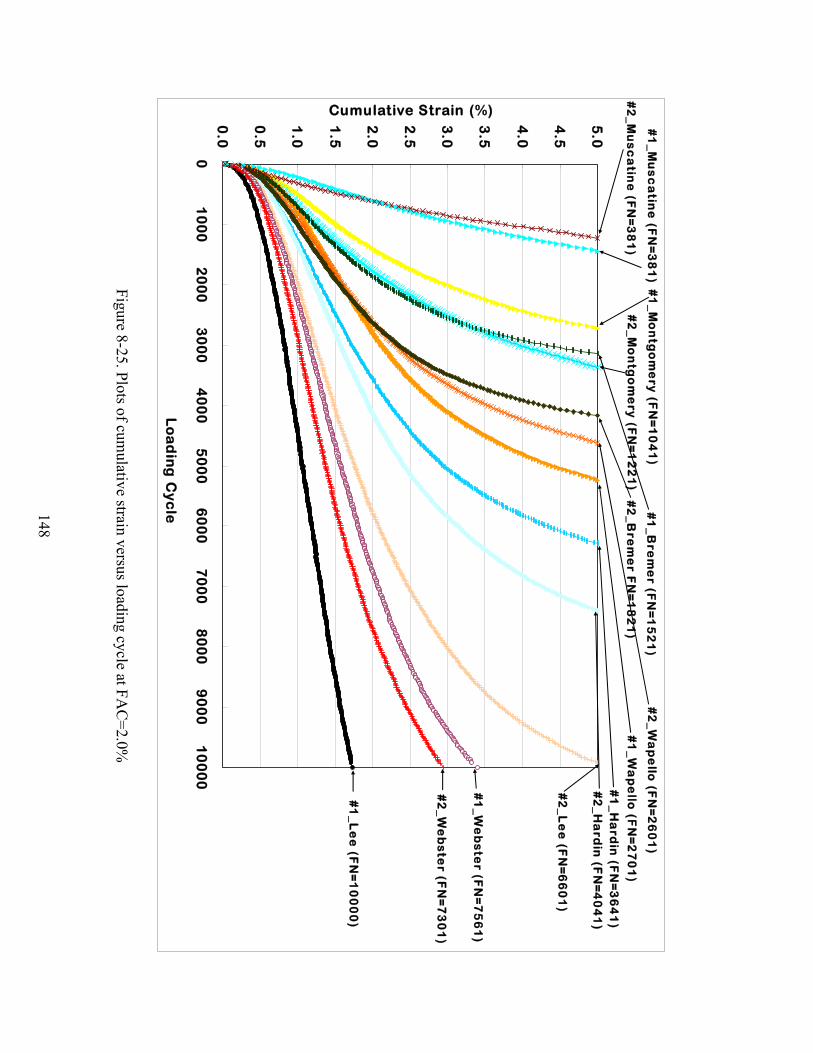
148
0.0
0.5
1.0
1.5
2.0
2.5
3.0
3.5
4.0
4.5
5.0
01
00
02
00
03
00
04
00
05
00
06
00
07
00
08
00
09
00
01
00
00
Lo
ad
ing
Cy
cle
Cumulative Strain (%)
#1
_Mo
ntg
om
ery
(FN
=1
04
1)
#2
_Mo
ntg
om
ery
(FN
=1
22
1)
#1
_Bre
me
r (FN
=1
52
1)
#2
_Bre
me
r FN
=1
82
1)
#2
_Wa
pe
llo (F
N=
26
01
)
#1
_Wa
pe
llo (F
N=
27
01
)
#1
_Ha
rdin
(FN
=3
64
1)
#2
_Ha
rdin
(FN
=4
04
1)
#2
_Le
e (F
N=
66
01
)
#2
_We
bs
ter (F
N=
73
01
)
#1
_We
bs
ter (F
N=
75
61
)
#1
_Mu
sc
atin
e (F
N=
38
1)
#2
_Mu
sc
atin
e (F
N=
38
1)
#1
_Le
e (F
N=
10
00
0)
Figure 8-25. Plots of cumulative strain versus loading cycle at FA
C=2.0%
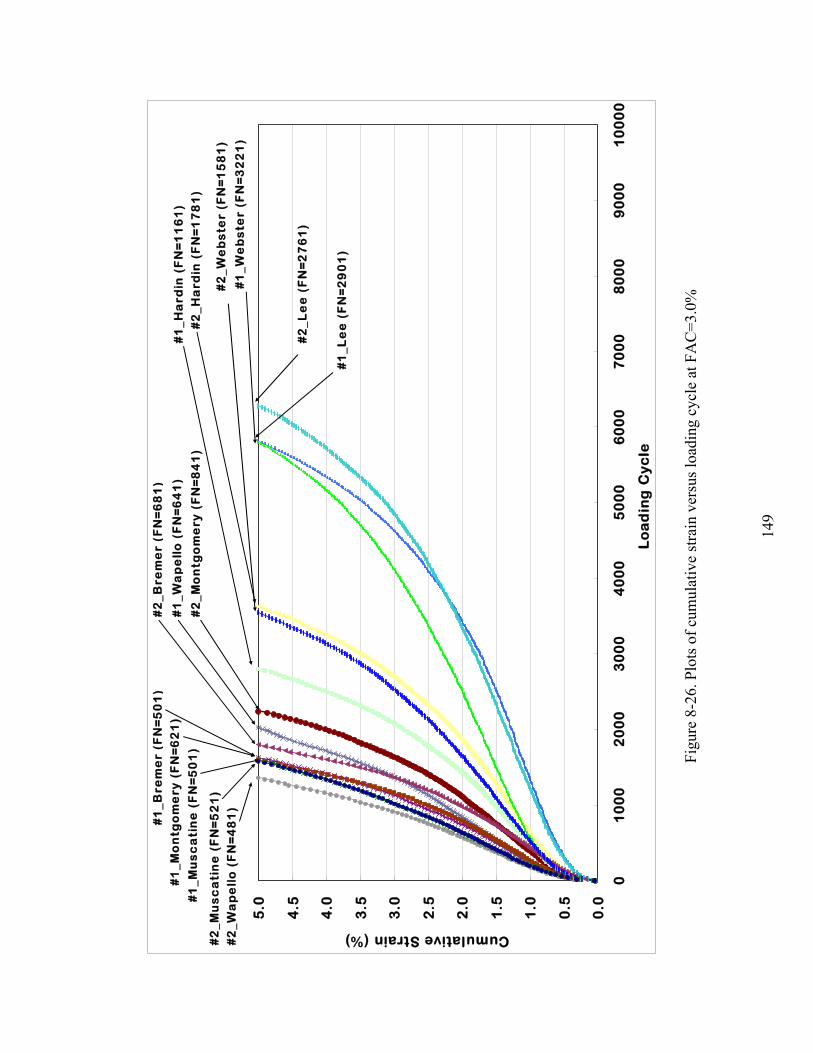
14
9
0.0
0.5
1.0
1.5
2.0
2.5
3.0
3.5
4.0
4.5
5.0
01
00
02
00
03
00
04
00
05
00
06
00
07
00
08
00
09
00
01
00
00
Lo
ad
ing
Cy
cle
Cumulative Strain (%)
#2
_Le
e (
FN
=2
76
1)
#1
_We
bs
ter
(FN
=3
22
1)
#2
_Ha
rdin
(F
N=
17
81
)#
1_H
ard
in (
FN
=1
16
1)
#2
_Mo
ntg
om
ery
(F
N=
84
1)
#2
_Wa
pe
llo
(F
N=
48
1)
#1
_Wa
pe
llo
(F
N=
64
1)
#2
_Bre
me
r (F
N=
68
1)
#1
_Bre
me
r (F
N=
50
1)
#1
_Mo
ntg
om
ery
(F
N=
62
1)
#1
_Mu
sc
ati
ne
(F
N=
50
1)
#2
_Mu
sc
ati
ne
(F
N=
52
1)
#1
_Le
e (
FN
=2
90
1)
#2
_We
bs
ter
(FN
=1
58
1)
Figu
re 8
-26.
Plo
ts o
f cum
ulat
ive
stra
in v
ersu
s loa
ding
cyc
le a
t FA
C=3
.0%

150
Table 8-19. Rankings of flow
number from
seven different RA
P sources
Ranking of Flow
Num
ber R
AP Source
Stiffness (Pen.)
Residual
AC
(%)
% Passing
No.8 Sieve
% Flat &
Elongation
FAC
=1.0%
FAC
=2.0%
FAC
=3.0%
Lee C
ounty H
ard (15)
Middle
(5.4%)
Fine (36.5%
) H
igh (6.8%
) 1
1 1
Webster
County
Hard
(17) H
igh (6.0%
) M
iddle (28.6%
) M
iddle (4.7%
) 2
2 2
Hardin
County
Hard
(15) H
igh (6.1%
) Fine
(32.0%)
Low
(1.8%)
3 3
3
Wapello
County
Soft (21)
Low
(4.6%)
Coarse
(26.0%)
Middle
(4.9%)
4 4
6
Brem
er C
ounty H
ard (17)
Middle
(5.0%)
Fine (34.4%
) Low
(1.5%
) 5
5 5
Montgom
ery C
ounty Soft (28)
High
(5.7%)
Coarse
(25.8%)
Middle
(4.4%)
6 6
4
Muscatine
County
Middle
(19) Low
(4.7%
) C
oarse (21.9%
) M
iddle (3.7%
) 7
7 7

151
8.2.4.3 Impact of RAP Characteristics on Flow Number
To identify the impact of RAP characteristics on flow number, the following
RAP characteristics were measured: 1) residual asphalt content, 2) residual asphalt
stiffness, 3) gradation and 4) flat and elongation ratio. As can be seen from Figure 8-24
(1.0%), seven out of fourteen specimens did not show a tertiary flow within 10,000
loading cycles and it was not possible to obtain the FN. Therefore, the impact of RAP
characteristics on flow number at 1.0% foamed asphalt content was not analyzed.
Overall, all RAP materials with 1.0% foamed asphalt were extremely resistant to the
permanent deformation except those from Muscatine, Montgomery and Bremer counties.
Fourteen FN measurements of RAP materials for two foamed asphalt contents of 2.0%
and 3.0% and seven RAP sources are plotted against each of four RAP characteristics in
Figure 8-27, Figure 8-28, Figure 8-29 and Figure 8-30.
As shown in Figure 8-27, there seems to be a correlation between residual
asphalt content and flow number, where the higher the residual asphalt content, the flow
number increased. This result indicates that the RAP materials with the more residual
binder are more resistant to rutting than ones with a small amount of residual binder. As
shown in Figure 8-28, RAP materials with softer residual binder decreased the flow
number whereas those with stiffer residual asphalt increased the flow number. This
result indicates that the RAP materials with the harder residual binder are more resistant
to rutting than ones with soft residual binder. As shown in Figure 8-29, there seems to
be a correlation between the amounts of fines in the RAP materials passing No. 8 sieve
and flow number. This result indicates that the RAP materials with a larger amount of
fine materials are more resistant to rutting than ones with a coarse gradation. As shown
in Figure 8-30, flat & elongation ratio of the RAP materials show a correlation where the
more flat & elongated RAP materials exist, the flow number increased. It is contrary to
the common belief that the more flat & elongated RAP materials would decrease the flow
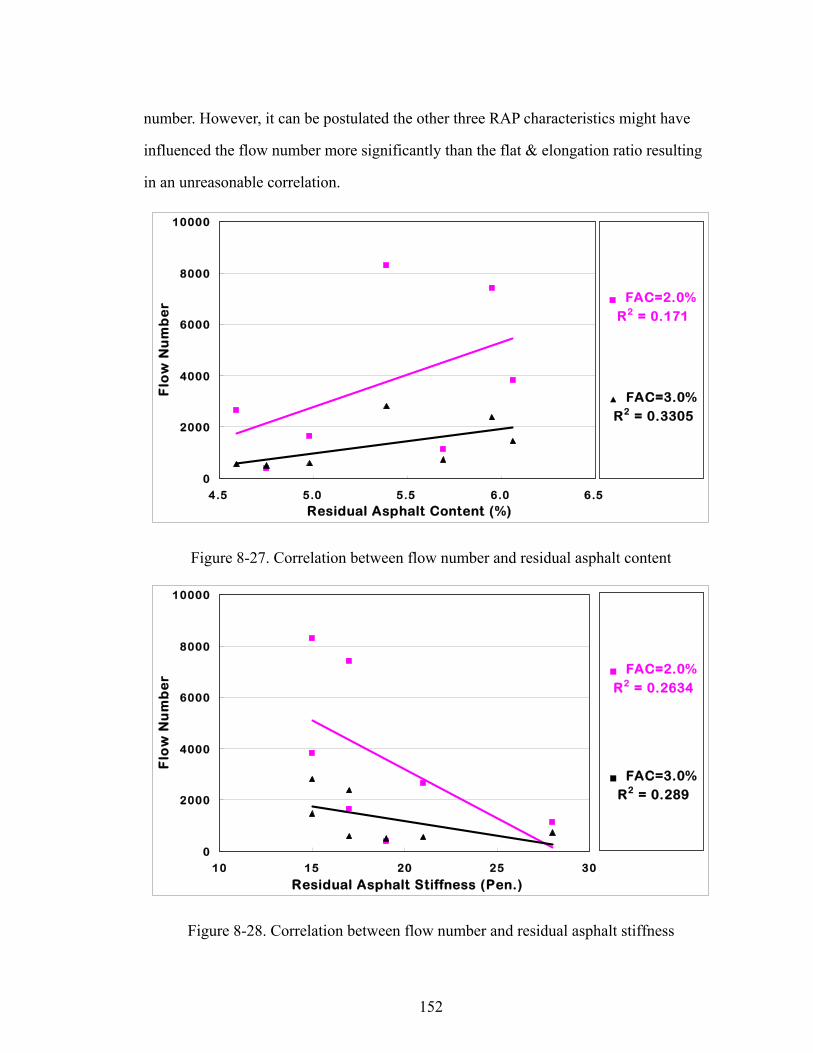
152
number. However, it can be postulated the other three RAP characteristics might have
influenced the flow number more significantly than the flat & elongation ratio resulting
in an unreasonable correlation.
▲ FAC=3.0%R2 = 0.3305
■ FAC=2.0%R2 = 0.171
0
2000
4000
6000
8000
10000
4.5 5.0 5.5 6.0 6.5
Residual Asphalt Content (%)
Flo
w N
um
be
r
Figure 8-27. Correlation between flow number and residual asphalt content
■ FAC=2.0%R2 = 0.2634
■ FAC=3.0%R2 = 0.289
0
2000
4000
6000
8000
10000
10 15 20 25 30
Residual Asphalt Stiffness (Pen.)
Flo
w N
um
be
r
Figure 8-28. Correlation between flow number and residual asphalt stiffness
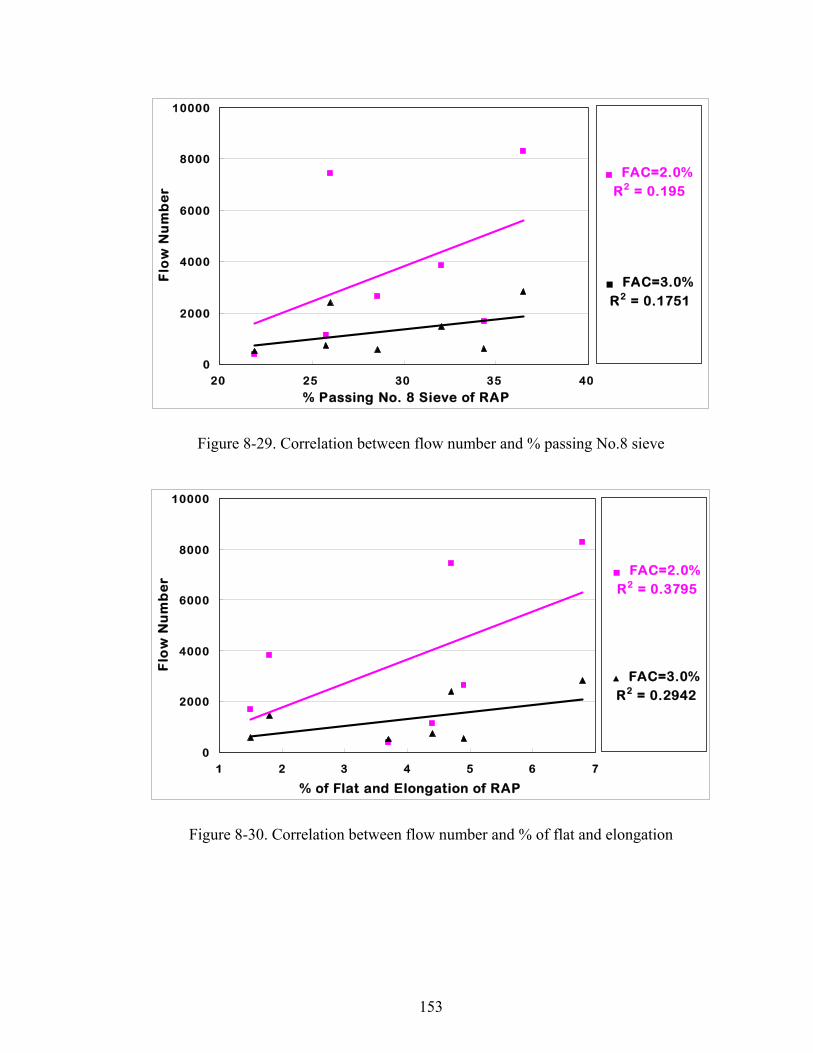
153
■ FAC=2.0%R2 = 0.195
■ FAC=3.0%R2 = 0.1751
0
2000
4000
6000
8000
10000
20 25 30 35 40
% Passing No. 8 Sieve of RAP
Flo
w N
um
be
r
Figure 8-29. Correlation between flow number and % passing No.8 sieve
■ FAC=2.0%R2 = 0.3795
▲ FAC=3.0%R2 = 0.2942
0
2000
4000
6000
8000
10000
1 2 3 4 5 6 7
% of Flat and Elongation of RAP
Flo
w N
um
be
r
Figure 8-30. Correlation between flow number and % of flat and elongation
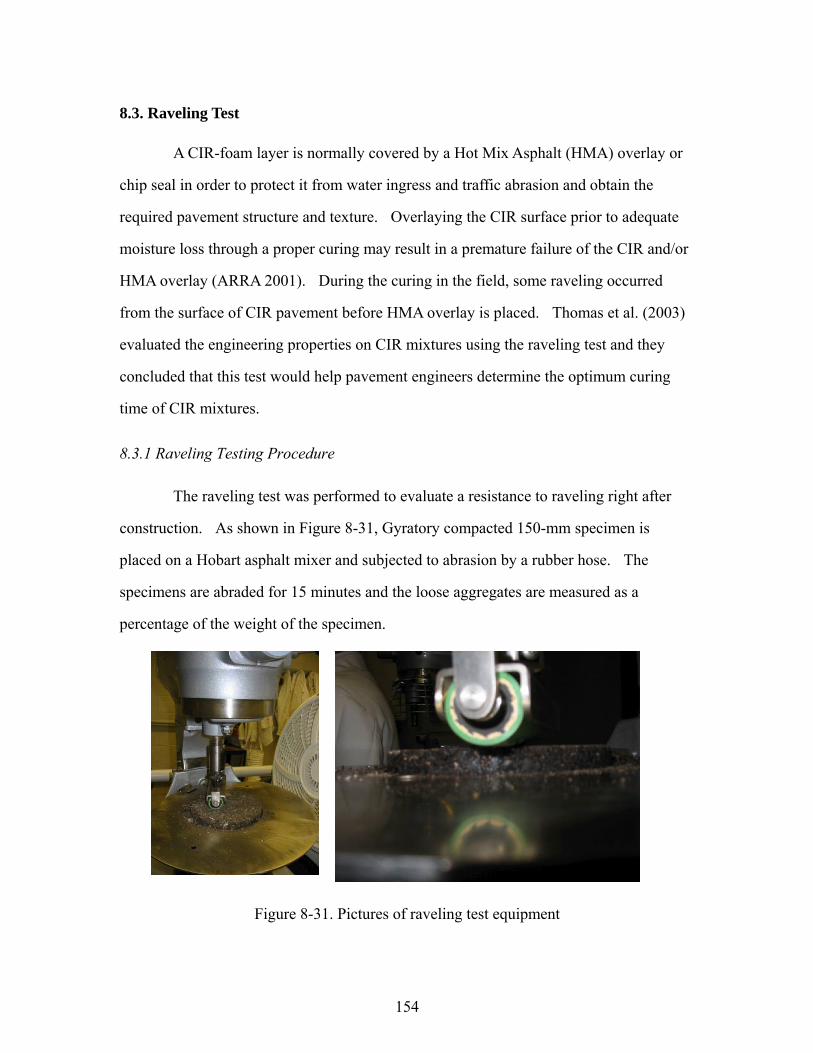
154
8.3. Raveling Test
A CIR-foam layer is normally covered by a Hot Mix Asphalt (HMA) overlay or
chip seal in order to protect it from water ingress and traffic abrasion and obtain the
required pavement structure and texture. Overlaying the CIR surface prior to adequate
moisture loss through a proper curing may result in a premature failure of the CIR and/or
HMA overlay (ARRA 2001). During the curing in the field, some raveling occurred
from the surface of CIR pavement before HMA overlay is placed. Thomas et al. (2003)
evaluated the engineering properties on CIR mixtures using the raveling test and they
concluded that this test would help pavement engineers determine the optimum curing
time of CIR mixtures.
8.3.1 Raveling Testing Procedure
The raveling test was performed to evaluate a resistance to raveling right after
construction. As shown in Figure 8-31, Gyratory compacted 150-mm specimen is
placed on a Hobart asphalt mixer and subjected to abrasion by a rubber hose. The
specimens are abraded for 15 minutes and the loose aggregates are measured as a
percentage of the weight of the specimen.
Figure 8-31. Pictures of raveling test equipment
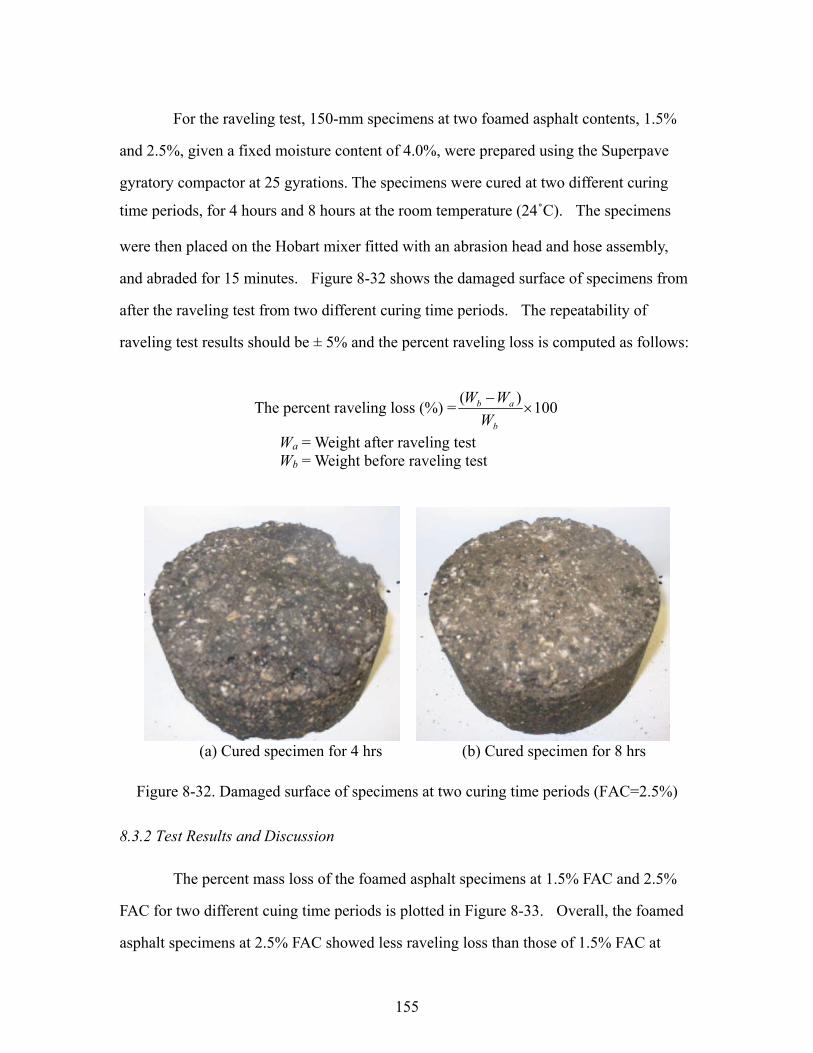
155
For the raveling test, 150-mm specimens at two foamed asphalt contents, 1.5%
and 2.5%, given a fixed moisture content of 4.0%, were prepared using the Superpave
gyratory compactor at 25 gyrations. The specimens were cured at two different curing
time periods, for 4 hours and 8 hours at the room temperature (24˚C). The specimens
were then placed on the Hobart mixer fitted with an abrasion head and hose assembly,
and abraded for 15 minutes. Figure 8-32 shows the damaged surface of specimens from
after the raveling test from two different curing time periods. The repeatability of
raveling test results should be ± 5% and the percent raveling loss is computed as follows:
The percent raveling loss (%) = 100)(×
−
b
ab
WWW
Wa = Weight after raveling test Wb = Weight before raveling test
(a) Cured specimen for 4 hrs (b) Cured specimen for 8 hrs
Figure 8-32. Damaged surface of specimens at two curing time periods (FAC=2.5%)
8.3.2 Test Results and Discussion
The percent mass loss of the foamed asphalt specimens at 1.5% FAC and 2.5%
FAC for two different cuing time periods is plotted in Figure 8-33. Overall, the foamed
asphalt specimens at 2.5% FAC showed less raveling loss than those of 1.5% FAC at
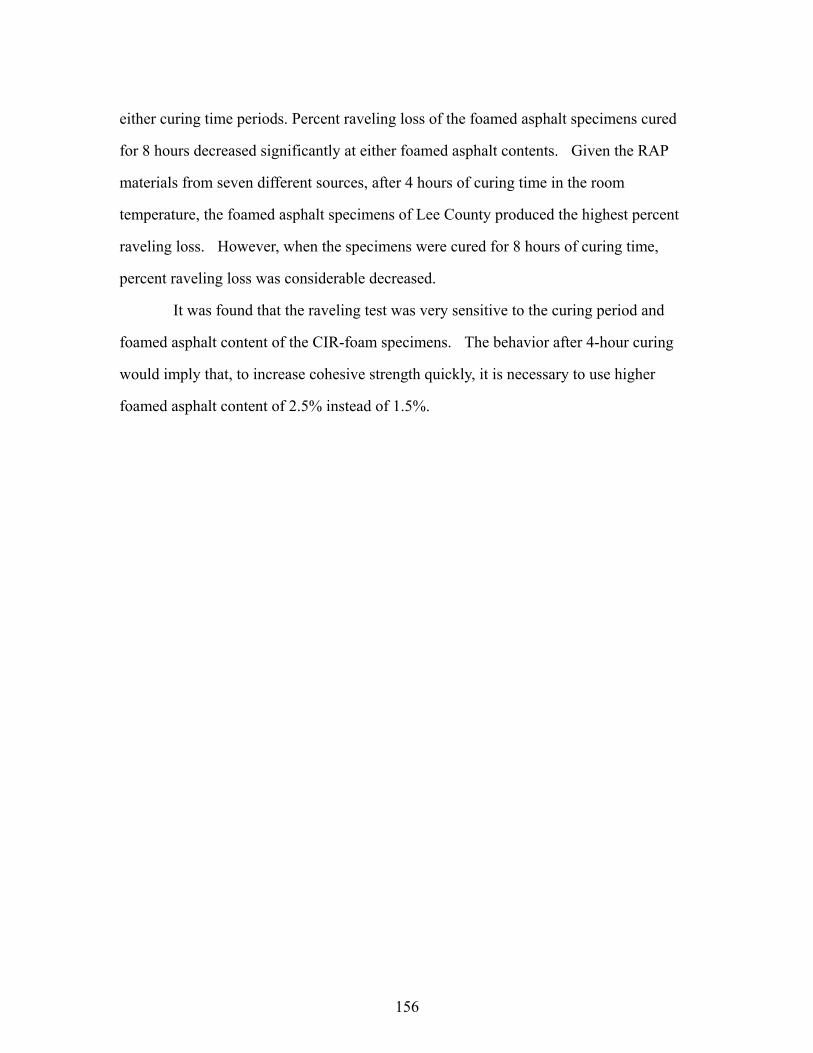
156
either curing time periods. Percent raveling loss of the foamed asphalt specimens cured
for 8 hours decreased significantly at either foamed asphalt contents. Given the RAP
materials from seven different sources, after 4 hours of curing time in the room
temperature, the foamed asphalt specimens of Lee County produced the highest percent
raveling loss. However, when the specimens were cured for 8 hours of curing time,
percent raveling loss was considerable decreased.
It was found that the raveling test was very sensitive to the curing period and
foamed asphalt content of the CIR-foam specimens. The behavior after 4-hour curing
would imply that, to increase cohesive strength quickly, it is necessary to use higher
foamed asphalt content of 2.5% instead of 1.5%.

157
1.131.00
1.161.08
1.30
1.54
1.04
0.510.65
0.510.470.57
0.52 0.45
0.0
0.2
0.4
0.6
0.8
1.0
1.2
1.4
1.6
1.8
2.0
Muscatine Webster Hardin Montgomery Bremer Lee Wapello
RAP Source (County)
% R
av
eli
ng
Lo
ss
FAC = 1.5 % - Curing for 4 hrs in the air FAC = 2.5 % - Curing for 4 hrs in the air
(a) Curing time: 4 hours
0.25 0.21
0.57
0.33
0.53 0.53
0.280.170.240.170.21 0.140.140.10
0.0
0.2
0.4
0.6
0.8
1.0
1.2
1.4
1.6
1.8
2.0
Muscatine Webster Hardin Montgomery Bremer Lee Wapello
RAP Source (County)
% R
av
eli
ng
Lo
ss
FAC = 1.5 % - Curing for 8 hrs in the air FAC = 2.5 % - Curing for 8 hrs in the air
(b) Curing time: 8 hours
Figure 8-33. Percent raveling losses of foamed asphalt specimens from seven different RAP sources
8.4 Summary and Discussion
The simple performance tests, which include dynamic modulus test, dynamic
158
creep test and raveling test, were adopted to evaluate the consistency of a new CIR-foam
mix design process to ensure reliable mixture performance over a wide range of traffic
and climatic conditions.
The dynamic modulus tests were performed on CIR-foam mixtures at six
different loading frequencies and three different test temperatures. The dynamic moduli
measured at three foamed asphalt contents were significantly different among seven RAP
sources. At 4.4°C, dynamic modulus of RAP materials from Muscatine County was the
highest, Webster County was second and Lee and Hardin Counties were the lowest. At
21.1°C, dynamic modulus of RAP materials from Webster County was the highest
followed by Muscatine County whereas Lee and Hardin Counties stayed at the lowest
level. At 37.8°C, dynamic modulus of RAP materials from Muscatine became the
lowest whereas Webster County was the highest. It can be postulated that RAP material
from Muscatine is sensitive to temperature because they were the coarsest with least
amount of residual asphalt content. Therefore, the coarse RAP materials with a small
amount of residual asphalt content may be more fatigue resistant at a low temperature but
more susceptible to rutting at a high temperature. On the other hand, fine RAP materials
with a large amount of hard residual asphalt content like Hardin County may be more
resistant to rutting at high temperature but more susceptible to fatigue cracking at low
temperature.
Since dynamic modulus of RAP materials was not significantly affected by
loading frequencies, the frequency of 25 Hz, which represents a highway speed, was
selected for further analysis. Based on the assumption that RAP materials with the high
modulus at 37.8˚C would be more resistant to rutting, CIR-foam pavements constructed
using RAP materials from Webster and Wapello Counties will have a longer service life
than others.
A master curve was constructed for a reference temperature of 20˚C for each of
seven RAP sources. A mater curve constructed for each of three different foamed
159
asphalt contents matched the measured moduli quite well. Master curves are relatively
flat compared to HMA mixtures, which supports that foamed asphalt mixtures are not as
viscoelastic as HMA. More viscoelastic behavior was observed from the foamed asphalt
mixtures with higher foamed asphalt content.
RAP materials from seven different sources were ranked by the dynamic
modulus. Overall, the rankings of RAP materials changed when the foamed asphalt was
increased from 1.0% to 3.0%, which indicates that the dynamic modulus values are
affected by both foamed asphalt contents and RAP aggregate structure. Based on the
dynamic modulus test results performed at 4.4˚C, the coarser RAP materials were more
resistant to fatigue cracking. Based on the dynamic modulus test results performed at
37.8˚C, the finer RAP materials with the harder binder with a higher amount were more
resistant to rutting.
RAP materials from Muscatine County exhibited the lowest flow number at all
foamed asphalt contents whereas those from Lee and Webster Counties obtained the
highest flow number. It is interesting to note that the lower the foamed asphalt contents,
the flow number was higher, which indicates the foamed asphalt content with 1.0% is
more resistant to rutting than 2.0% and 3.0%.
RAP materials from seven different sources were ranked by the flow number.
Overall, the rankings of RAP materials did not change when the foamed asphalt was
increased from 1.0% to 3.0%, which indicates that flow number is not affected by foamed
asphalt content but affected by the RAP aggregate structure. It was also observed that
foamed asphalt content negatively affected the rutting resistance of CIR-foam mixtures.
The finer RAP materials with the harder binder with a higher amount were more resistant
to rutting. This result is consistent with the findings based on dynamic modulus test
performed at 37.8˚C.
RAP materials from Wapello and Webster Counties would be more resistant to
both fatigue and rutting. RAP materials from Muscatine, Bremer and Montgomery
160
Counties would be more resistant to fatigue cracking but more susceptible to rutting.
RAP materials from Hardin and Lee Counties would be more resistant to rutting but
susceptible to fatigue cracking.
Based on the raveling test results, the foamed asphalt specimens at 2.5% FAC
showed less raveling loss than those of 1.5% FAC. It was found that the raveling test
was very sensitive to the curing period and foamed asphalt content of the CIR-foam
specimens. To increase cohesive strength quickly, it is necessary to use higher foamed
asphalt content of 2.5% instead of 1.5%.
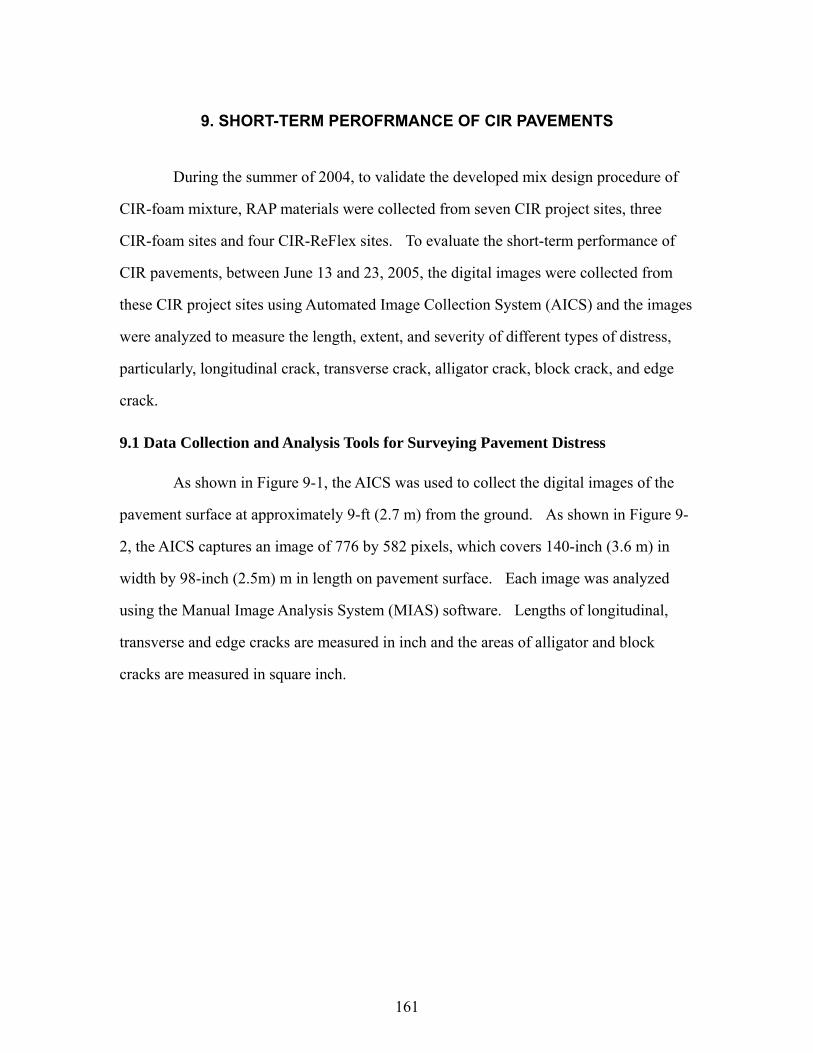
161
9. SHORT-TERM PEROFRMANCE OF CIR PAVEMENTS
During the summer of 2004, to validate the developed mix design procedure of
CIR-foam mixture, RAP materials were collected from seven CIR project sites, three
CIR-foam sites and four CIR-ReFlex sites. To evaluate the short-term performance of
CIR pavements, between June 13 and 23, 2005, the digital images were collected from
these CIR project sites using Automated Image Collection System (AICS) and the images
were analyzed to measure the length, extent, and severity of different types of distress,
particularly, longitudinal crack, transverse crack, alligator crack, block crack, and edge
crack.
9.1 Data Collection and Analysis Tools for Surveying Pavement Distress
As shown in Figure 9-1, the AICS was used to collect the digital images of the
pavement surface at approximately 9-ft (2.7 m) from the ground. As shown in Figure 9-
2, the AICS captures an image of 776 by 582 pixels, which covers 140-inch (3.6 m) in
width by 98-inch (2.5m) m in length on pavement surface. Each image was analyzed
using the Manual Image Analysis System (MIAS) software. Lengths of longitudinal,
transverse and edge cracks are measured in inch and the areas of alligator and block
cracks are measured in square inch.
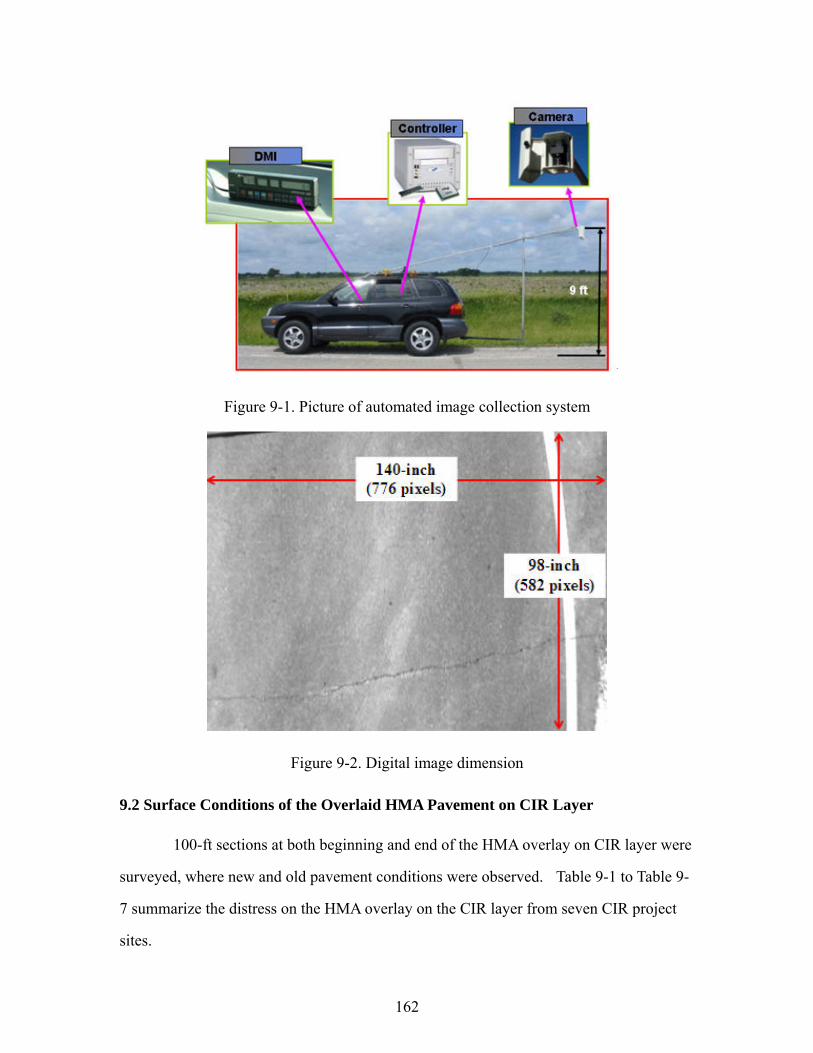
162
Figure 9-1. Picture of automated image collection system
Figure 9-2. Digital image dimension
9.2 Surface Conditions of the Overlaid HMA Pavement on CIR Layer
100-ft sections at both beginning and end of the HMA overlay on CIR layer were
surveyed, where new and old pavement conditions were observed. Table 9-1 to Table 9-
7 summarize the distress on the HMA overlay on the CIR layer from seven CIR project
sites.
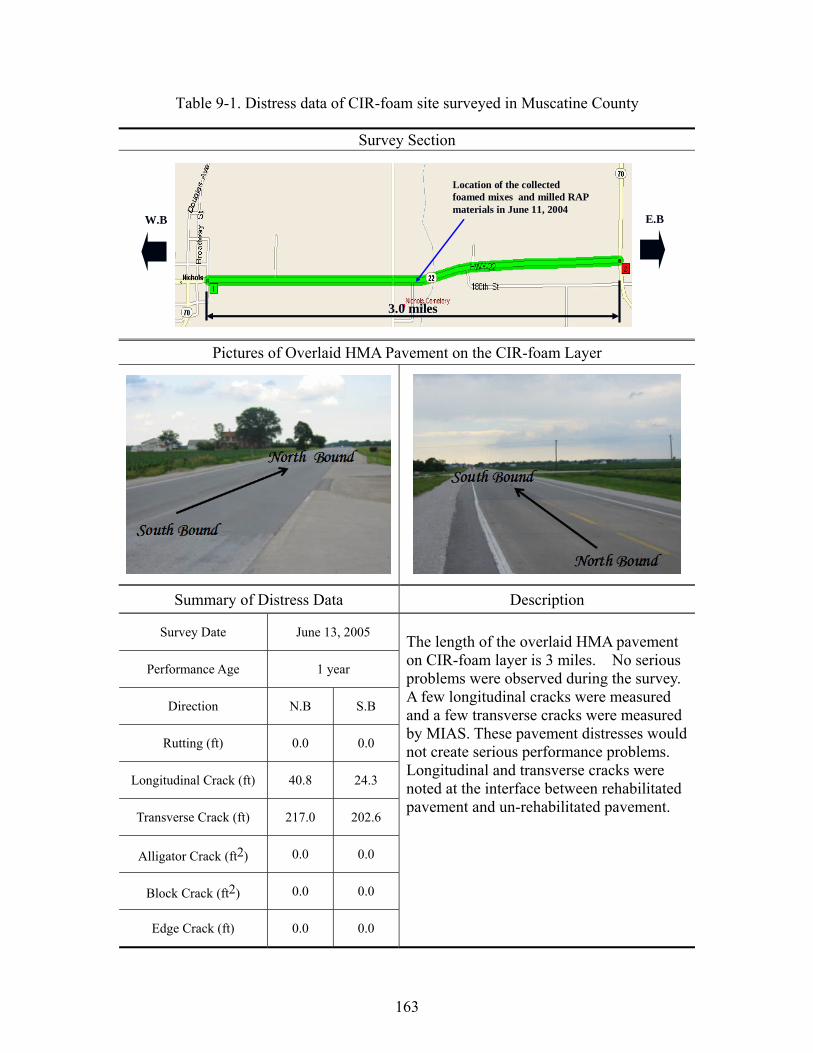
163
Table 9-1. Distress data of CIR-foam site surveyed in Muscatine County
Survey Section
W.B E.B
3.0 miles
Location of the collected foamed mixes and milled RAP materials in June 11, 2004
Pictures of Overlaid HMA Pavement on the CIR-foam Layer
Summary of Distress Data Description
Survey Date June 13, 2005
Performance Age 1 year
Direction N.B S.B
Rutting (ft) 0.0 0.0
Longitudinal Crack (ft) 40.8 24.3
Transverse Crack (ft) 217.0 202.6
Alligator Crack (ft2) 0.0 0.0
Block Crack (ft2) 0.0 0.0
Edge Crack (ft) 0.0 0.0
The length of the overlaid HMA pavement on CIR-foam layer is 3 miles. No serious problems were observed during the survey. A few longitudinal cracks were measured and a few transverse cracks were measured by MIAS. These pavement distresses would not create serious performance problems. Longitudinal and transverse cracks were noted at the interface between rehabilitated pavement and un-rehabilitated pavement.
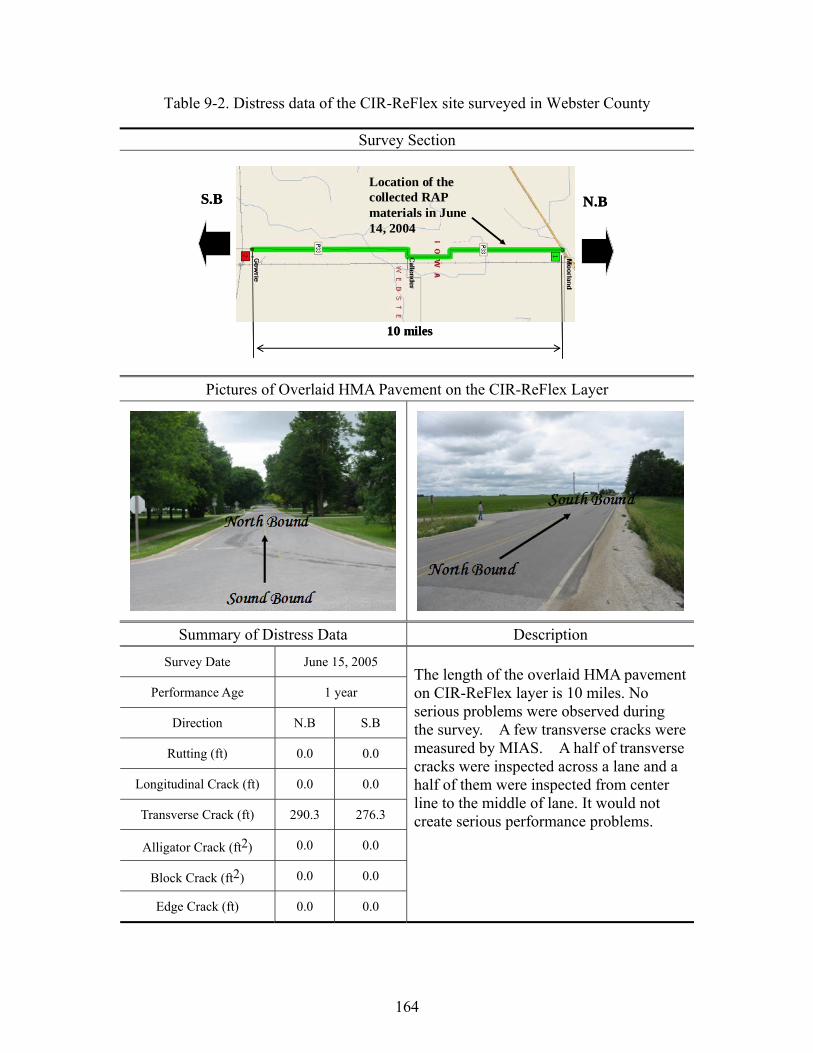
164
Table 9-2. Distress data of the CIR-ReFlex site surveyed in Webster County
Survey Section
N.BS.BLocation of the collected RAP materials in June 14, 2004
10 miles
N.BS.BLocation of the collected RAP materials in June 14, 2004
10 miles
Pictures of Overlaid HMA Pavement on the CIR-ReFlex Layer
Summary of Distress Data Description
Survey Date June 15, 2005
Performance Age 1 year
Direction N.B S.B
Rutting (ft) 0.0 0.0
Longitudinal Crack (ft) 0.0 0.0
Transverse Crack (ft) 290.3 276.3
Alligator Crack (ft2) 0.0 0.0
Block Crack (ft2) 0.0 0.0
Edge Crack (ft) 0.0 0.0
The length of the overlaid HMA pavement on CIR-ReFlex layer is 10 miles. No serious problems were observed during the survey. A few transverse cracks were measured by MIAS. A half of transverse cracks were inspected across a lane and a half of them were inspected from center line to the middle of lane. It would not create serious performance problems.
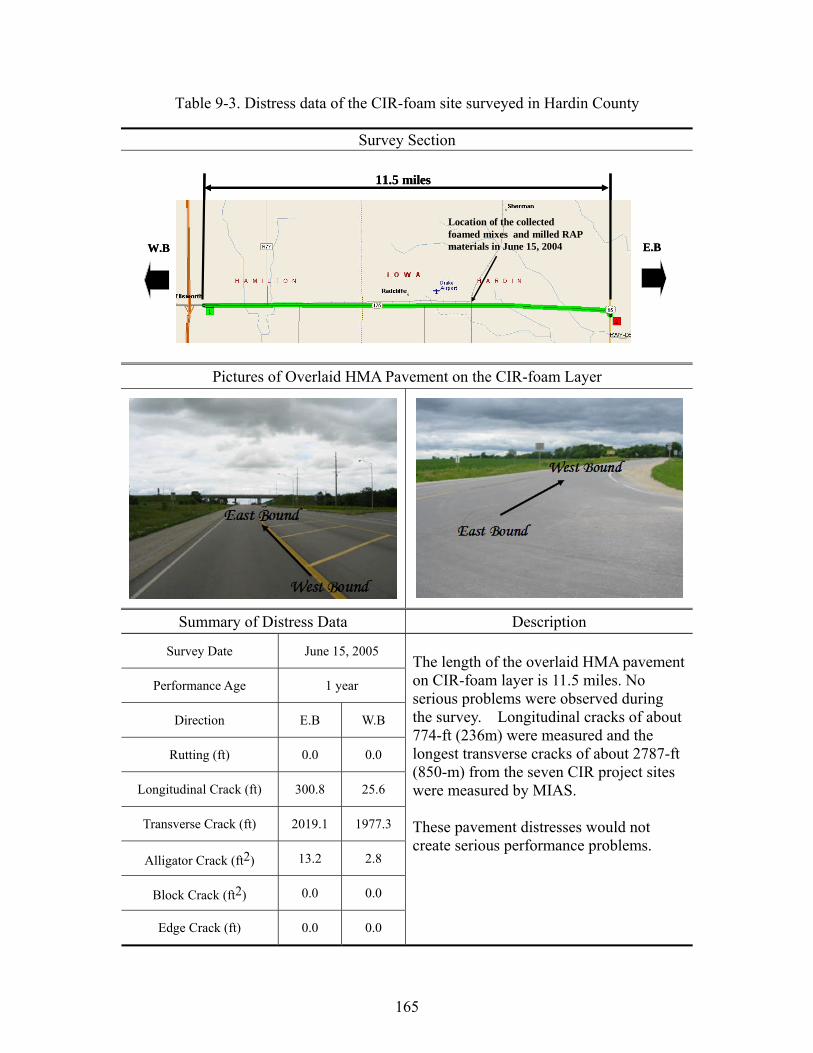
165
Table 9-3. Distress data of the CIR-foam site surveyed in Hardin County
Survey Section
W.B E.B
11.5 miles
Location of the collected foamed mixes and milled RAP materials in June 15, 2004 W.B E.B
11.5 miles
Location of the collected foamed mixes and milled RAP materials in June 15, 2004
Pictures of Overlaid HMA Pavement on the CIR-foam Layer
Summary of Distress Data Description
Survey Date June 15, 2005
Performance Age 1 year
Direction E.B W.B
Rutting (ft) 0.0 0.0
Longitudinal Crack (ft) 300.8 25.6
Transverse Crack (ft) 2019.1 1977.3
Alligator Crack (ft2) 13.2 2.8
Block Crack (ft2) 0.0 0.0
Edge Crack (ft) 0.0 0.0
The length of the overlaid HMA pavement on CIR-foam layer is 11.5 miles. No serious problems were observed during the survey. Longitudinal cracks of about 774-ft (236m) were measured and the longest transverse cracks of about 2787-ft (850-m) from the seven CIR project sites were measured by MIAS. These pavement distresses would not create serious performance problems.
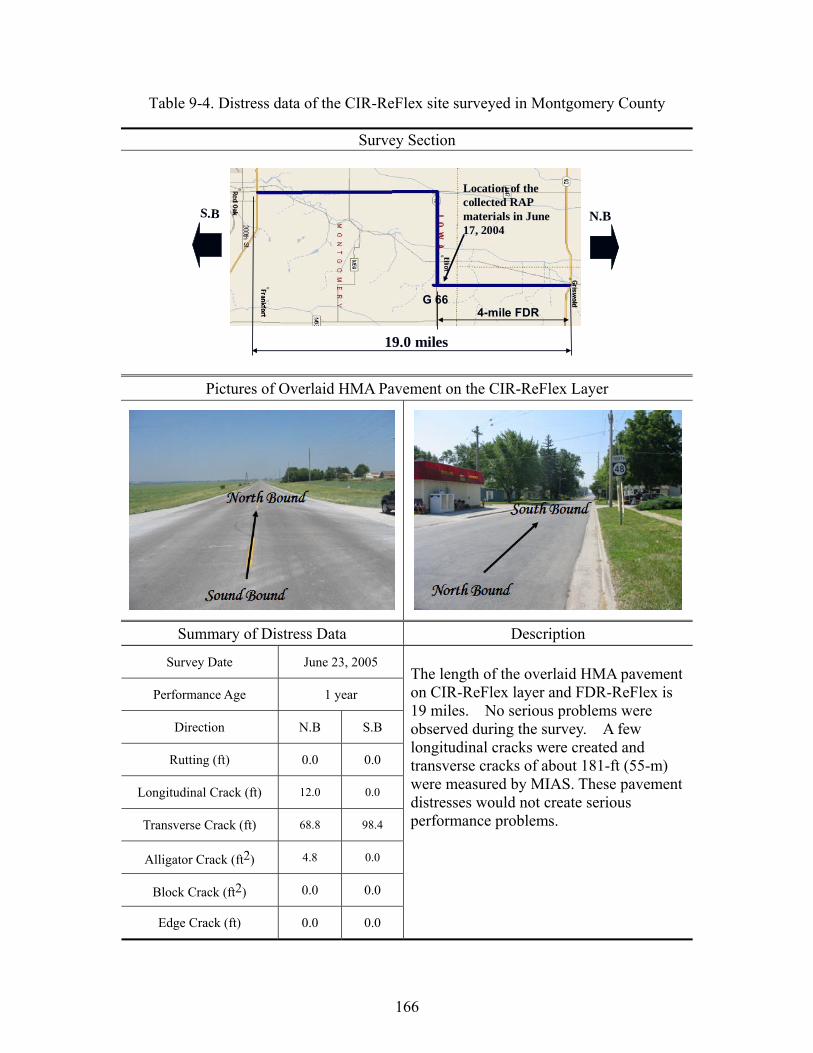
166
Table 9-4. Distress data of the CIR-ReFlex site surveyed in Montgomery County
Survey Section
N.BS.B
19.0 miles
Location of the collected RAP materials in June 17, 2004
G 664-mile FDR
Pictures of Overlaid HMA Pavement on the CIR-ReFlex Layer
Summary of Distress Data Description
Survey Date June 23, 2005
Performance Age 1 year
Direction N.B S.B
Rutting (ft) 0.0 0.0
Longitudinal Crack (ft) 12.0 0.0
Transverse Crack (ft) 68.8 98.4
Alligator Crack (ft2) 4.8 0.0
Block Crack (ft2) 0.0 0.0
Edge Crack (ft) 0.0 0.0
The length of the overlaid HMA pavement on CIR-ReFlex layer and FDR-ReFlex is 19 miles. No serious problems were observed during the survey. A few longitudinal cracks were created and transverse cracks of about 181-ft (55-m) were measured by MIAS. These pavement distresses would not create serious performance problems.
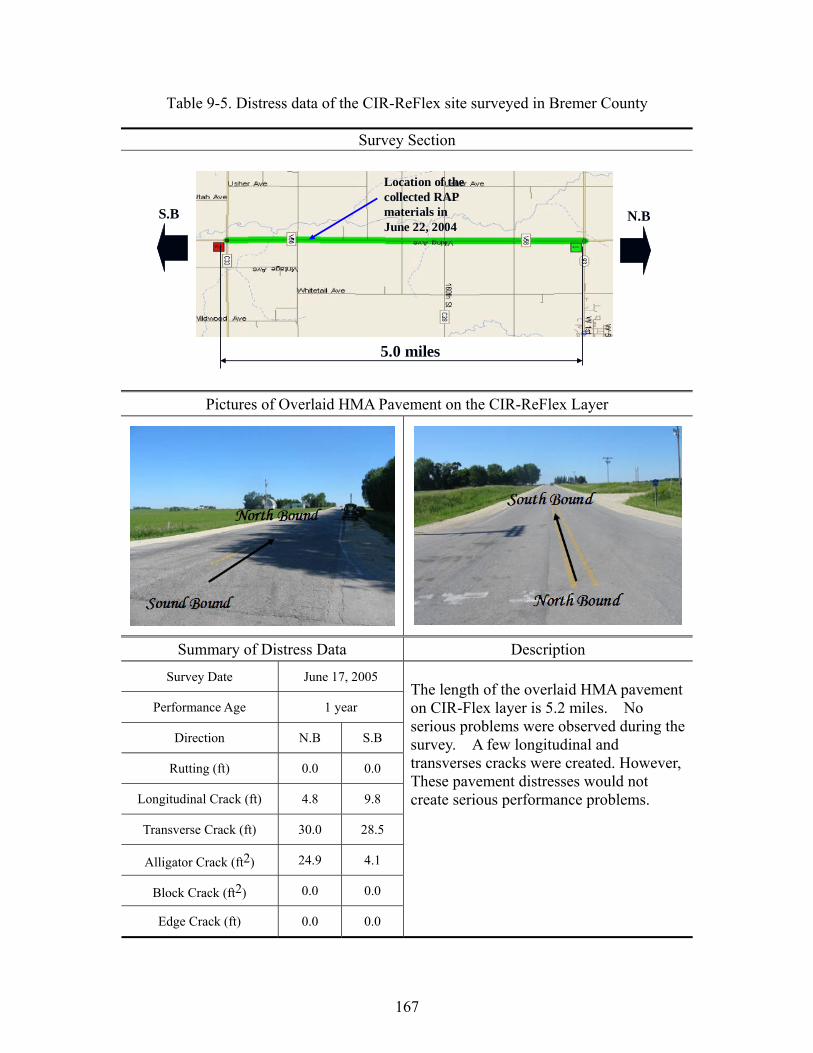
167
Table 9-5. Distress data of the CIR-ReFlex site surveyed in Bremer County
Survey Section
N.BS.B
5.0 miles
Location of the collected RAP materials in June 22, 2004
Pictures of Overlaid HMA Pavement on the CIR-ReFlex Layer
Summary of Distress Data Description
Survey Date June 17, 2005
Performance Age 1 year
Direction N.B S.B
Rutting (ft) 0.0 0.0
Longitudinal Crack (ft) 4.8 9.8
Transverse Crack (ft) 30.0 28.5
Alligator Crack (ft2) 24.9 4.1
Block Crack (ft2) 0.0 0.0
Edge Crack (ft) 0.0 0.0
The length of the overlaid HMA pavement on CIR-Flex layer is 5.2 miles. No serious problems were observed during the survey. A few longitudinal and transverses cracks were created. However, These pavement distresses would not create serious performance problems.
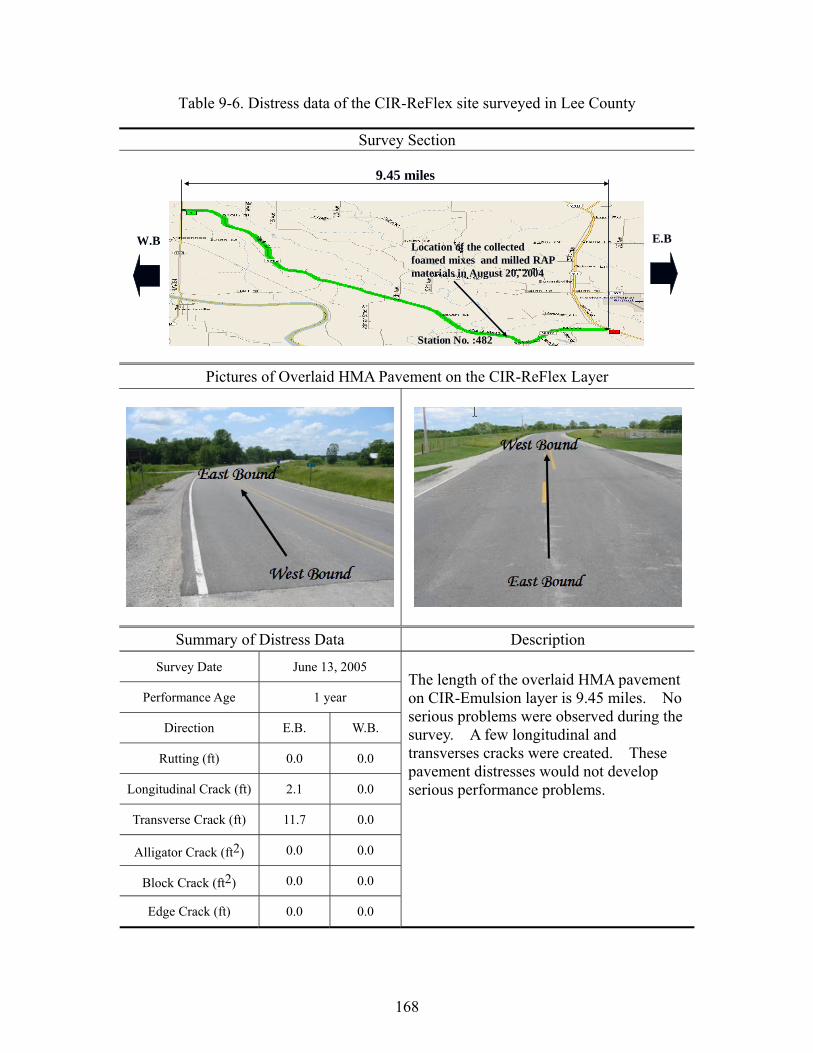
168
Table 9-6. Distress data of the CIR-ReFlex site surveyed in Lee County
Survey Section
W.B E.BLocation of the collected foamed mixes and milled RAP materials in August 20, 2004
Station No. :482
9.45 miles
Pictures of Overlaid HMA Pavement on the CIR-ReFlex Layer
Summary of Distress Data Description
Survey Date June 13, 2005
Performance Age 1 year
Direction E.B. W.B.
Rutting (ft) 0.0 0.0
Longitudinal Crack (ft) 2.1 0.0
Transverse Crack (ft) 11.7 0.0
Alligator Crack (ft2) 0.0 0.0
Block Crack (ft2) 0.0 0.0
Edge Crack (ft) 0.0 0.0
The length of the overlaid HMA pavement on CIR-Emulsion layer is 9.45 miles. No serious problems were observed during the survey. A few longitudinal and transverses cracks were created. These pavement distresses would not develop serious performance problems.
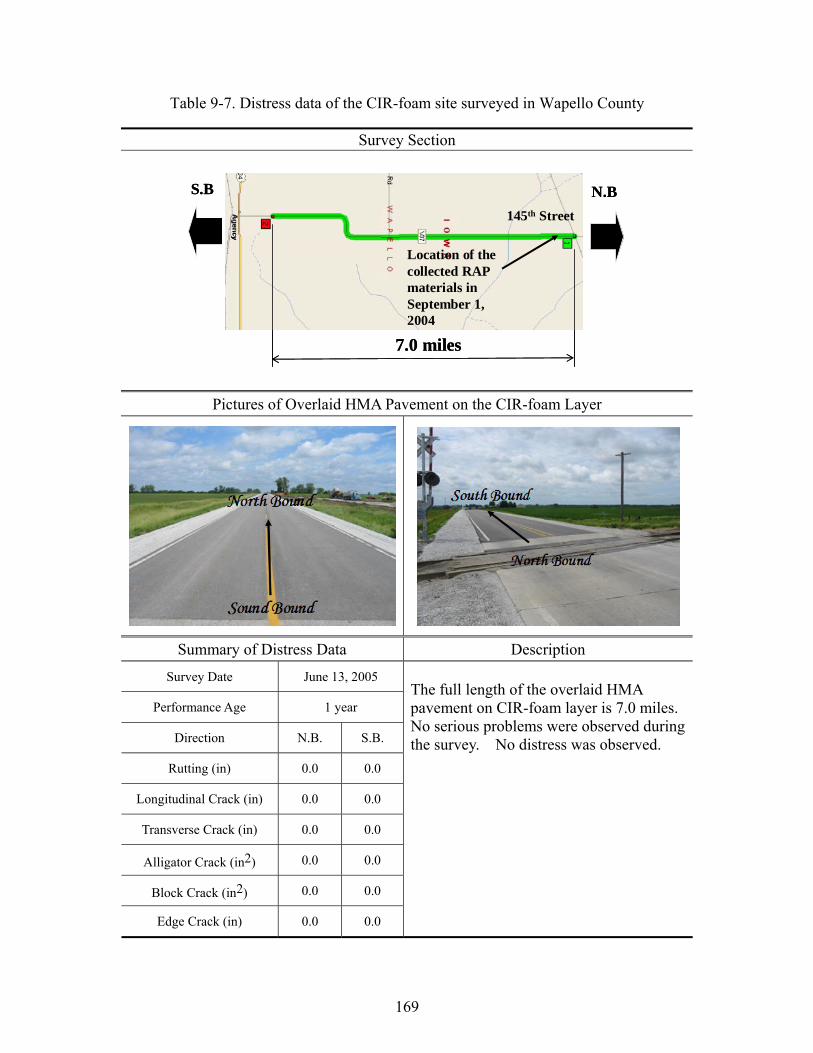
169
Table 9-7. Distress data of the CIR-foam site surveyed in Wapello County
Survey Section
N.BS.B
7.0 miles
Location of the collected RAP materials in September 1, 2004
145th Street
N.BS.B
7.0 miles
Location of the collected RAP materials in September 1, 2004
145th Street
Pictures of Overlaid HMA Pavement on the CIR-foam Layer
Summary of Distress Data Description
Survey Date June 13, 2005
Performance Age 1 year
Direction N.B. S.B.
Rutting (in) 0.0 0.0
Longitudinal Crack (in) 0.0 0.0
Transverse Crack (in) 0.0 0.0
Alligator Crack (in2) 0.0 0.0
Block Crack (in2) 0.0 0.0
Edge Crack (in) 0.0 0.0
The full length of the overlaid HMA pavement on CIR-foam layer is 7.0 miles. No serious problems were observed during the survey. No distress was observed.
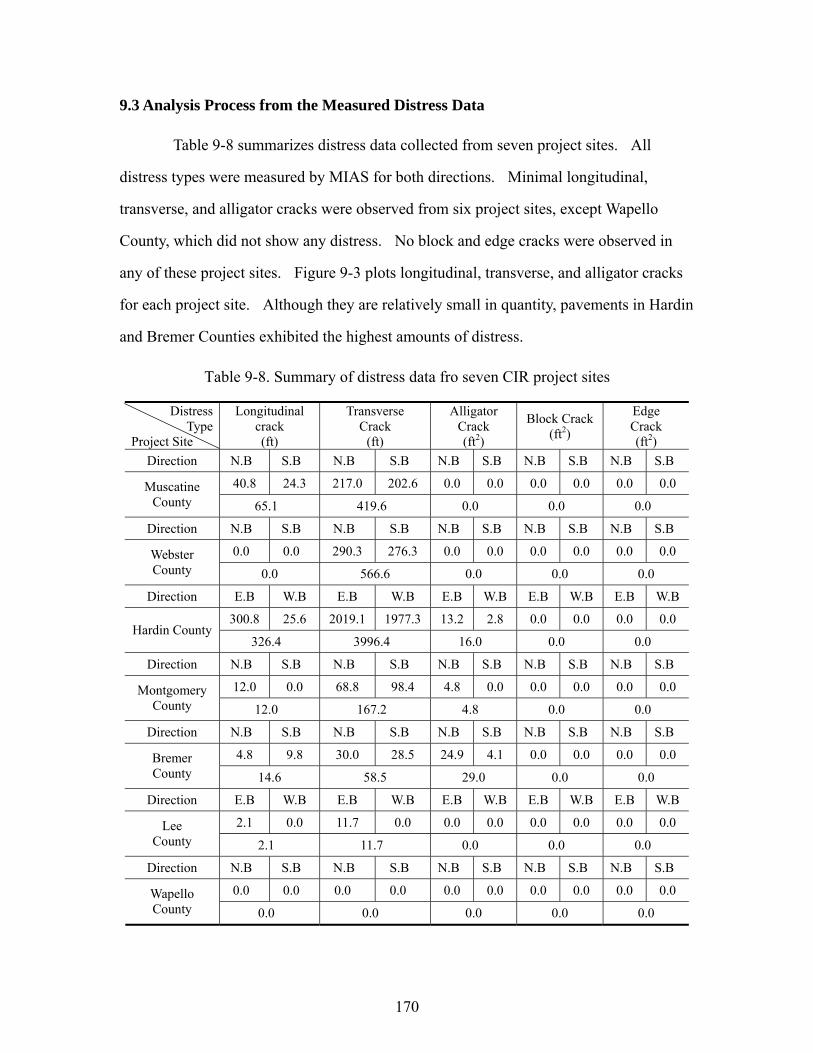
170
9.3 Analysis Process from the Measured Distress Data
Table 9-8 summarizes distress data collected from seven project sites. All
distress types were measured by MIAS for both directions. Minimal longitudinal,
transverse, and alligator cracks were observed from six project sites, except Wapello
County, which did not show any distress. No block and edge cracks were observed in
any of these project sites. Figure 9-3 plots longitudinal, transverse, and alligator cracks
for each project site. Although they are relatively small in quantity, pavements in Hardin
and Bremer Counties exhibited the highest amounts of distress.
Table 9-8. Summary of distress data fro seven CIR project sites
Distress Type
Project Site
Longitudinal crack (ft)
Transverse Crack
(ft)
Alligator Crack (ft2)
Block Crack (ft2)
Edge Crack (ft2)
Direction N.B S.B N.B S.B N.B S.B N.B S.B N.B S.B
40.8 24.3 217.0 202.6 0.0 0.0 0.0 0.0 0.0 0.0 Muscatine County 65.1 419.6 0.0 0.0 0.0
Direction N.B S.B N.B S.B N.B S.B N.B S.B N.B S.B
0.0 0.0 290.3 276.3 0.0 0.0 0.0 0.0 0.0 0.0 Webster County 0.0 566.6 0.0 0.0 0.0
Direction E.B W.B E.B W.B E.B W.B E.B W.B E.B W.B
300.8 25.6 2019.1 1977.3 13.2 2.8 0.0 0.0 0.0 0.0 Hardin County
326.4 3996.4 16.0 0.0 0.0
Direction N.B S.B N.B S.B N.B S.B N.B S.B N.B S.B
12.0 0.0 68.8 98.4 4.8 0.0 0.0 0.0 0.0 0.0 Montgomery County 12.0 167.2 4.8 0.0 0.0
Direction N.B S.B N.B S.B N.B S.B N.B S.B N.B S.B
4.8 9.8 30.0 28.5 24.9 4.1 0.0 0.0 0.0 0.0 Bremer County 14.6 58.5 29.0 0.0 0.0
Direction E.B W.B E.B W.B E.B W.B E.B W.B E.B W.B
2.1 0.0 11.7 0.0 0.0 0.0 0.0 0.0 0.0 0.0 Lee County 2.1 11.7 0.0 0.0 0.0
Direction N.B S.B N.B S.B N.B S.B N.B S.B N.B S.B
0.0 0.0 0.0 0.0 0.0 0.0 0.0 0.0 0.0 0.0 Wapello County 0.0 0.0 0.0 0.0 0.0
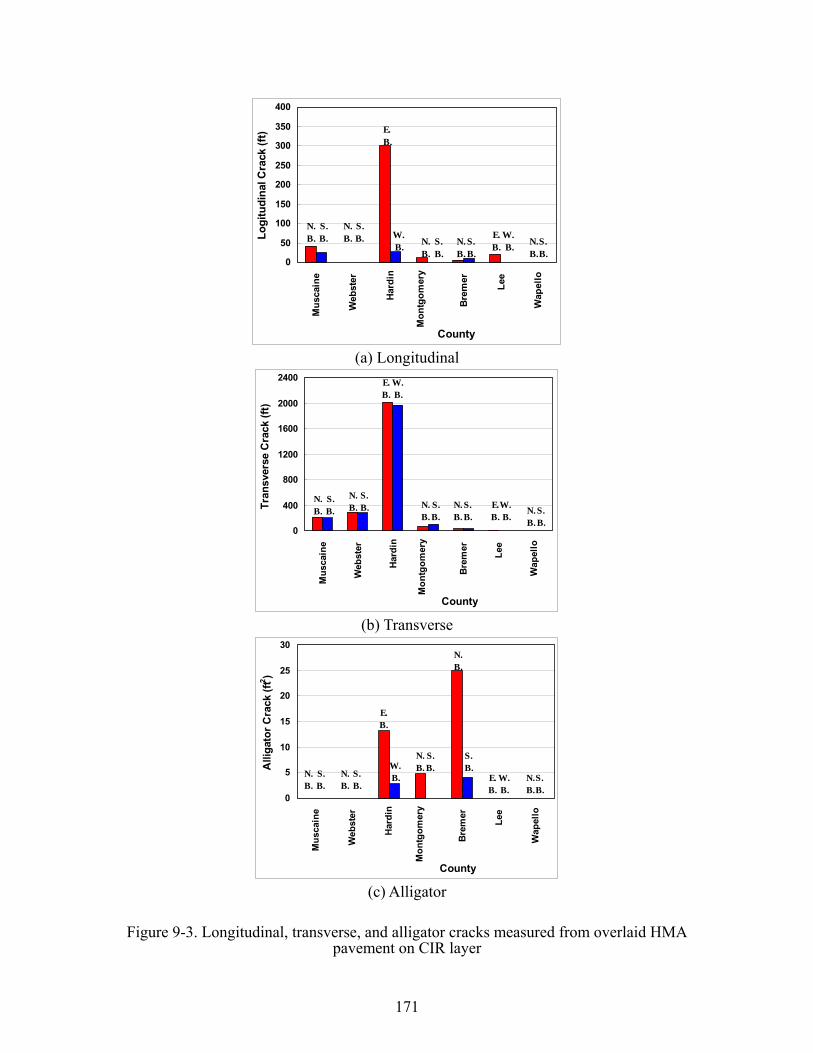
171
0
50
100
150
200
250
300
350
400
Mus
cain
e
Web
ster
Har
din
Mon
tgom
ery
Bre
mer
Lee
Wap
ello
County
Logi
tudi
nal C
rack
(ft)
N.B.
S.B.
N.B.
S.B.
E.B.
W. B. N.
B. S. B.
N. B.
S. B.
E.B.
W. B. N.
B. S. B.
(a) Longitudinal
0
400
800
1200
1600
2000
2400
Mus
cain
e
Web
ster
Hard
in
Mon
tgom
ery
Brem
er
Lee
Wap
ello
County
Tran
sver
se C
rack
(ft)
N.B.
S.B.
N.B.
S.B.
E.B.
W. B.
N.B.
S. B.
N. B.
S. B.
E.B.
W. B.
N. B.
S. B.
(b) Transverse
0
5
10
15
20
25
30
Mus
cain
e
Web
ster
Har
din
Mon
tgom
ery
Bre
mer
Lee
Wap
ello
County
Alli
gato
r Cra
ck (f
t2 )
N.B.
S.B.
N.B.
S.B.
E.B.
W. B.
N.B.
S. B.
N. B.
S. B.
E.B.
W. B.
N. B.
S. B.
(c) Alligator
Figure 9-3. Longitudinal, transverse, and alligator cracks measured from overlaid HMA pavement on CIR layer

172
In Muscatine County, as shown in Figure 9-4, a few longitudinal and transverse
cracks were observed at the interface between rehabilitated pavement and un-
rehabilitated pavement. As shown in Figure 9-5, a few longitudinal cracks were
developed along the shoulder at both right and left sides in the beginning and end points
of project sites.
Figure 9-4. Longitudinal and transverse cracks at the interface between rehabilitated pavement and un-rehabilitated pavement
Figure 9-5. Longitudinal cracks created along the shoulder of both lanes

173
In Webster County, a few transverse cracks were observed. As shown in Figure
9-6, both full and partial-lane transverse cracks were observed.
Figure 9-6 Transverse crack patterns measured from Webster County
In Hardin County, the largest amount of distress was observed. As shown in
Figure 9-7, the highest amounts of longitudinal cracks were observed along the centerline
of the pavement. As shown in Figure 9-8, a few transverse cracks were observed across
a lane. As shown in Figure 9-9, alligator cracks were noted at the interface between the
rehabilitated pavement and existing concrete bridge.
Figure 9-7. Longitudinal crack patterns measured form Hardin County
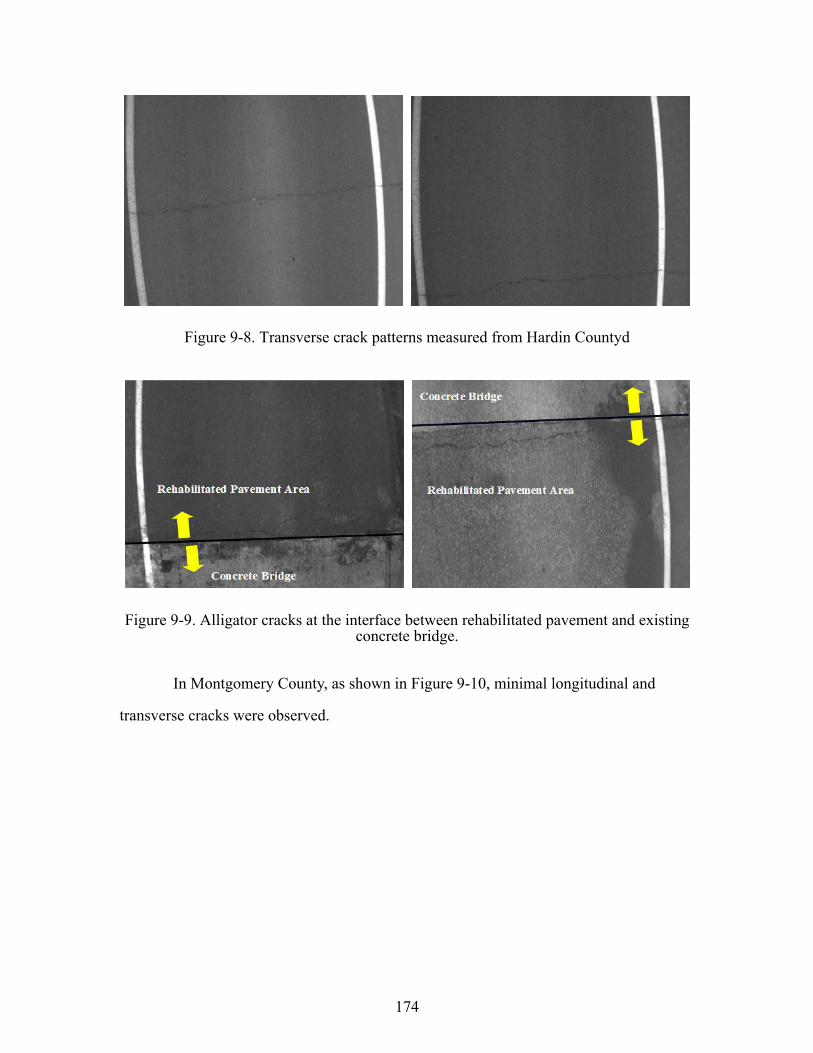
174
Figure 9-8. Transverse crack patterns measured from Hardin Countyd
Figure 9-9. Alligator cracks at the interface between rehabilitated pavement and existing concrete bridge.
In Montgomery County, as shown in Figure 9-10, minimal longitudinal and
transverse cracks were observed.
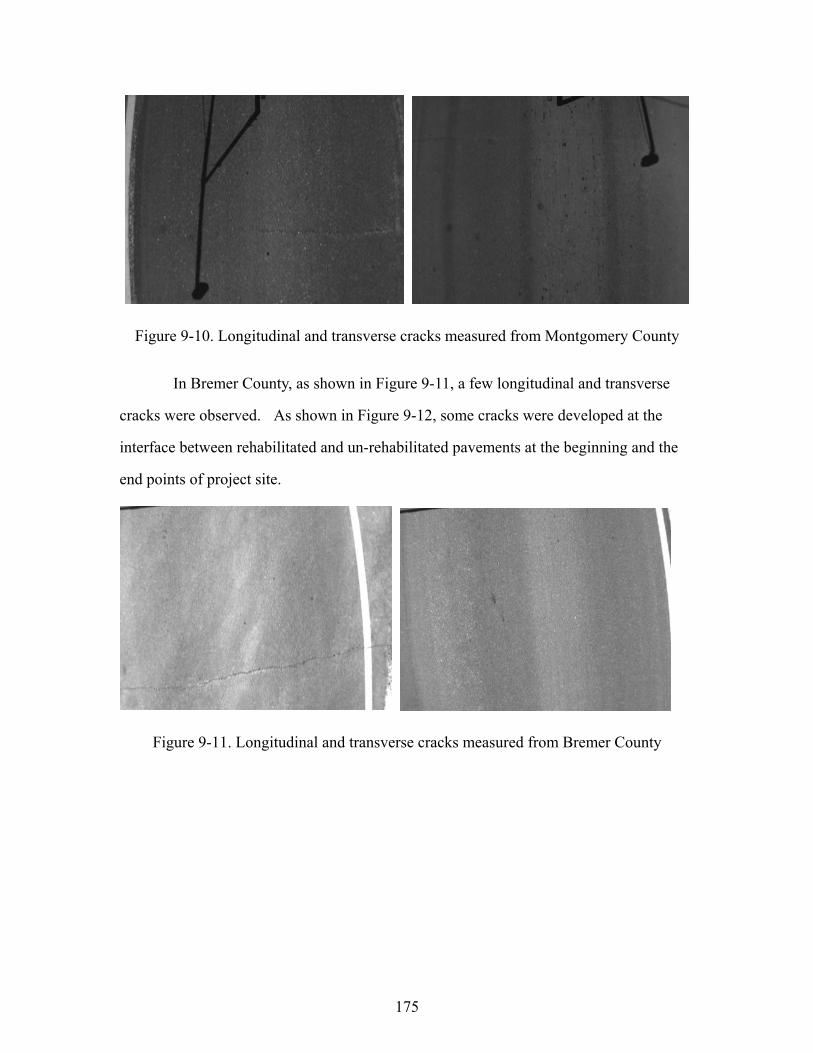
175
Figure 9-10. Longitudinal and transverse cracks measured from Montgomery County
In Bremer County, as shown in Figure 9-11, a few longitudinal and transverse
cracks were observed. As shown in Figure 9-12, some cracks were developed at the
interface between rehabilitated and un-rehabilitated pavements at the beginning and the
end points of project site.
Figure 9-11. Longitudinal and transverse cracks measured from Bremer County
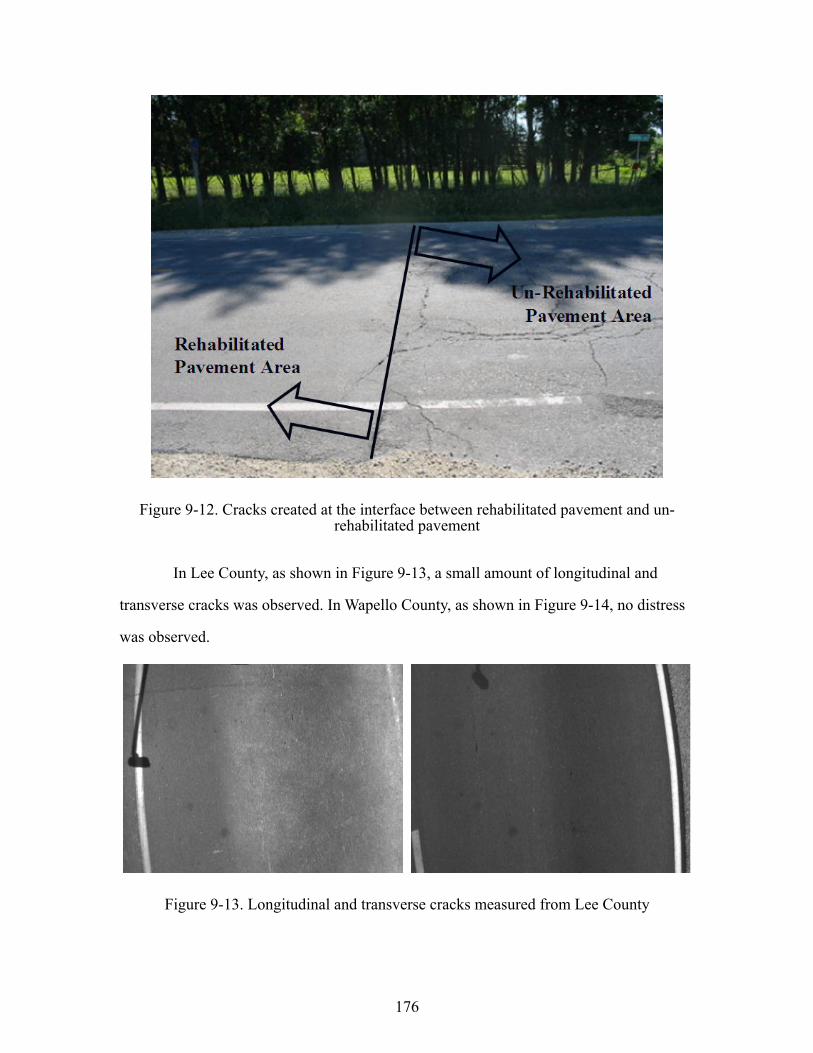
176
Figure 9-12. Cracks created at the interface between rehabilitated pavement and un-rehabilitated pavement
In Lee County, as shown in Figure 9-13, a small amount of longitudinal and
transverse cracks was observed. In Wapello County, as shown in Figure 9-14, no distress
was observed.
Figure 9-13. Longitudinal and transverse cracks measured from Lee County
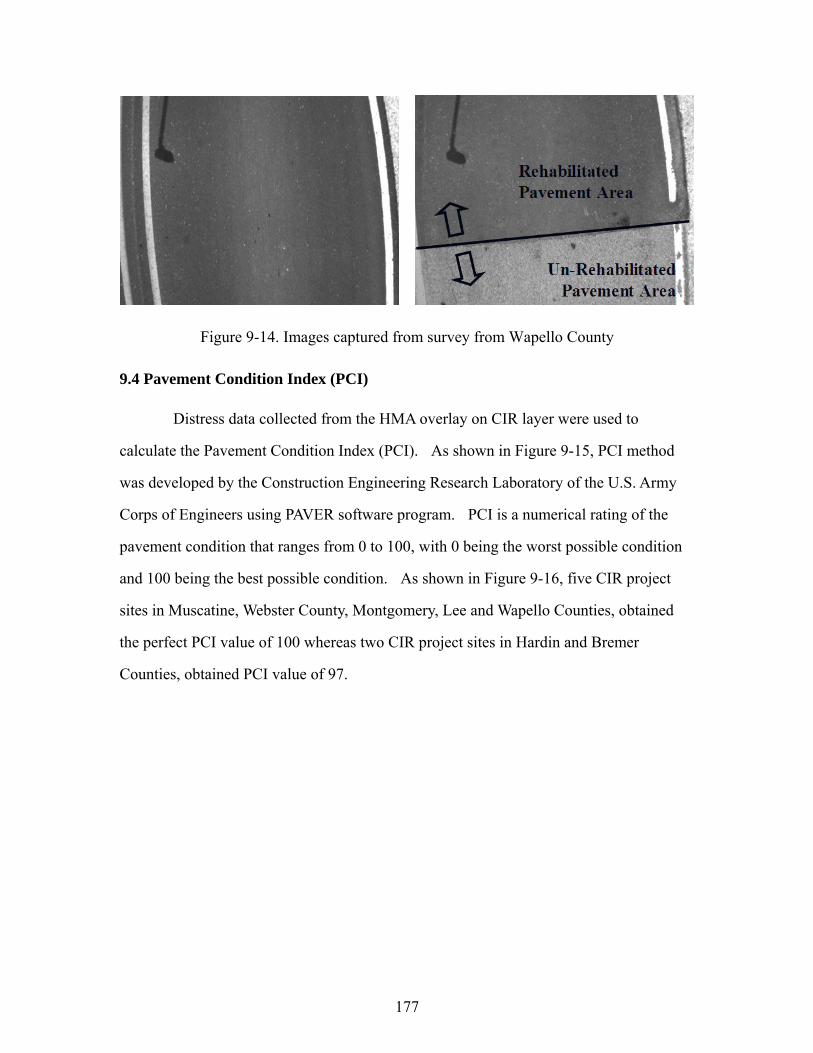
177
Figure 9-14. Images captured from survey from Wapello County
9.4 Pavement Condition Index (PCI)
Distress data collected from the HMA overlay on CIR layer were used to
calculate the Pavement Condition Index (PCI). As shown in Figure 9-15, PCI method
was developed by the Construction Engineering Research Laboratory of the U.S. Army
Corps of Engineers using PAVER software program. PCI is a numerical rating of the
pavement condition that ranges from 0 to 100, with 0 being the worst possible condition
and 100 being the best possible condition. As shown in Figure 9-16, five CIR project
sites in Muscatine, Webster County, Montgomery, Lee and Wapello Counties, obtained
the perfect PCI value of 100 whereas two CIR project sites in Hardin and Bremer
Counties, obtained PCI value of 97.
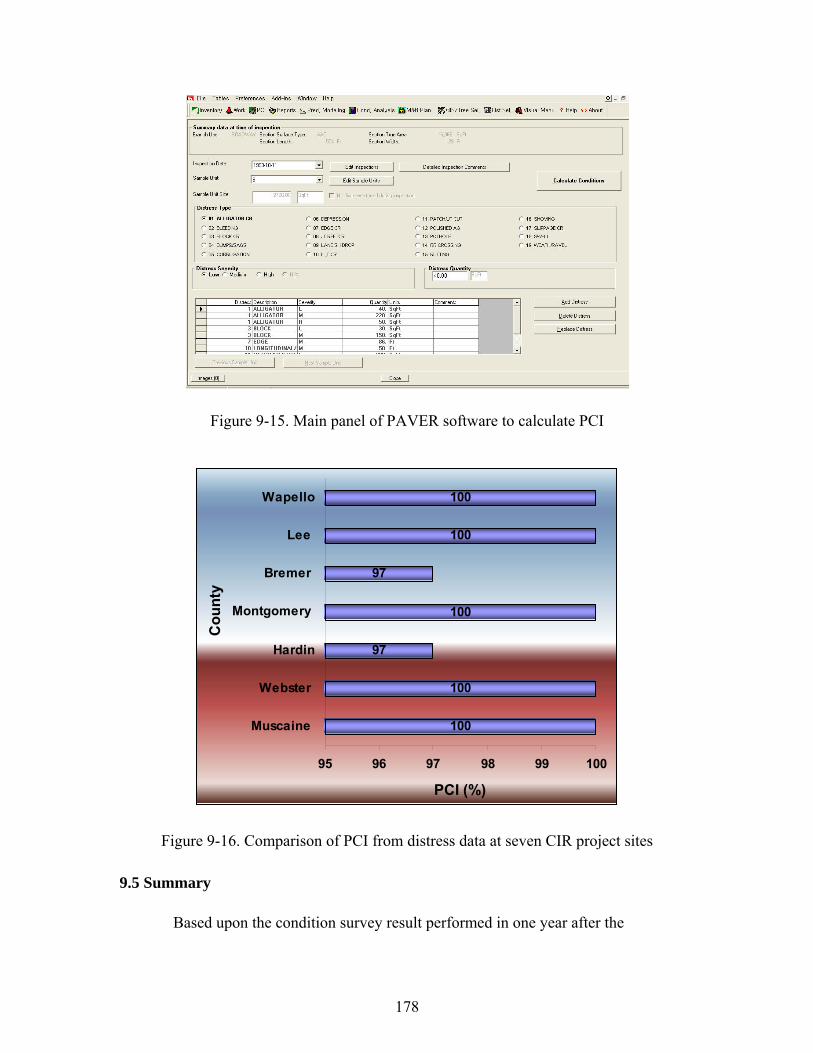
178
Figure 9-15. Main panel of PAVER software to calculate PCI
100
100
97
100
97
100
100
95 96 97 98 99 100
Muscaine
Webster
Hardin
Montgomery
Bremer
Lee
Wapello
Cou
nty
PCI (%)
Figure 9-16. Comparison of PCI from distress data at seven CIR project sites
9.5 Summary
Based upon the condition survey result performed in one year after the

179
construction, all have performed very well without any serious distress observed. The
following specific observations are offered:
(1) Longitudinal and transverse cracks are observed at the interface between
rehabilitated and un-rehabilitated pavements in Montgomery, Hardin, and
Bremer Counties.
(2) Transverse crack occurs more frequently than longitudinal crack at most
pavement sections, which is considered as the early distress type.
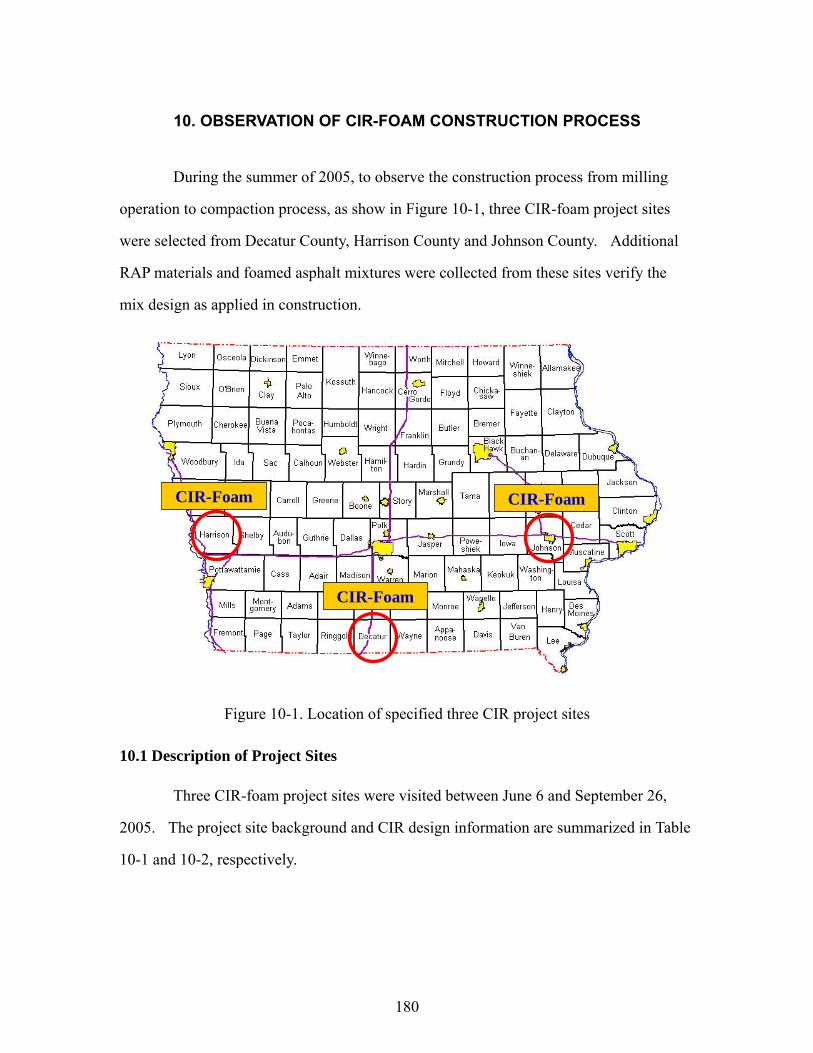
180
10. OBSERVATION OF CIR-FOAM CONSTRUCTION PROCESS
During the summer of 2005, to observe the construction process from milling
operation to compaction process, as show in Figure 10-1, three CIR-foam project sites
were selected from Decatur County, Harrison County and Johnson County. Additional
RAP materials and foamed asphalt mixtures were collected from these sites verify the
mix design as applied in construction.
CIR-Foam CIR-Foam
CIR-Foam
CIR-Foam CIR-Foam
CIR-Foam
Figure 10-1. Location of specified three CIR project sites
10.1 Description of Project Sites
Three CIR-foam project sites were visited between June 6 and September 26,
2005. The project site background and CIR design information are summarized in Table
10-1 and 10-2, respectively.
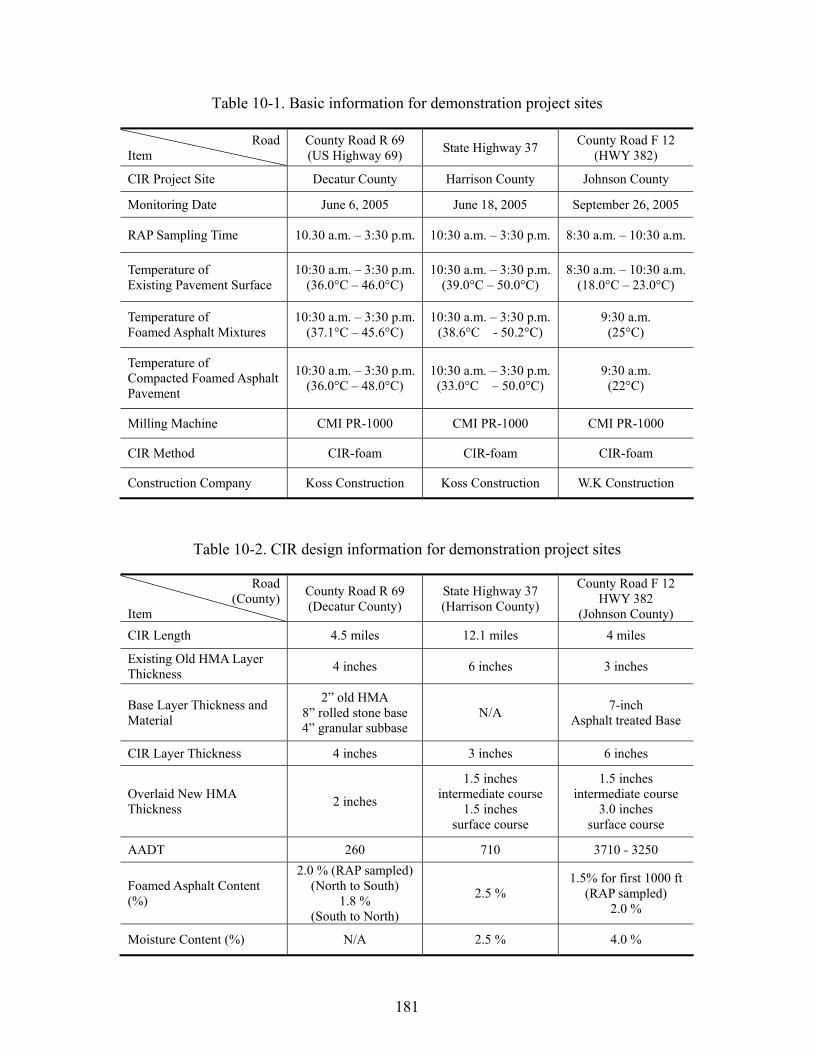
181
Table 10-1. Basic information for demonstration project sites
Road Item
County Road R 69 (US Highway 69) State Highway 37 County Road F 12
(HWY 382)
CIR Project Site Decatur County Harrison County Johnson County
Monitoring Date June 6, 2005 June 18, 2005 September 26, 2005
RAP Sampling Time 10.30 a.m. – 3:30 p.m. 10:30 a.m. – 3:30 p.m. 8:30 a.m. – 10:30 a.m.
Temperature of Existing Pavement Surface
10:30 a.m. – 3:30 p.m. (36.0°C – 46.0°C)
10:30 a.m. – 3:30 p.m. (39.0°C – 50.0°C)
8:30 a.m. – 10:30 a.m. (18.0°C – 23.0°C)
Temperature of Foamed Asphalt Mixtures
10:30 a.m. – 3:30 p.m. (37.1°C – 45.6°C)
10:30 a.m. – 3:30 p.m. (38.6°C - 50.2°C)
9:30 a.m. (25°C)
Temperature of Compacted Foamed Asphalt Pavement
10:30 a.m. – 3:30 p.m. (36.0°C – 48.0°C)
10:30 a.m. – 3:30 p.m. (33.0°C – 50.0°C)
9:30 a.m. (22°C)
Milling Machine CMI PR-1000 CMI PR-1000 CMI PR-1000
CIR Method CIR-foam CIR-foam CIR-foam
Construction Company Koss Construction Koss Construction W.K Construction
Table 10-2. CIR design information for demonstration project sites
Road (County)
Item
County Road R 69 (Decatur County)
State Highway 37 (Harrison County)
County Road F 12 HWY 382
(Johnson County) CIR Length 4.5 miles 12.1 miles 4 miles
Existing Old HMA Layer Thickness 4 inches 6 inches 3 inches
Base Layer Thickness and Material
2” old HMA 8” rolled stone base 4” granular subbase
N/A 7-inch Asphalt treated Base
CIR Layer Thickness 4 inches 3 inches 6 inches
Overlaid New HMA Thickness 2 inches
1.5 inches intermediate course
1.5 inches surface course
1.5 inches intermediate course
3.0 inches surface course
AADT 260 710 3710 - 3250
Foamed Asphalt Content (%)
2.0 % (RAP sampled) (North to South)
1.8 % (South to North)
2.5 % 1.5% for first 1000 ft
(RAP sampled) 2.0 %
Moisture Content (%) N/A 2.5 % 4.0 %
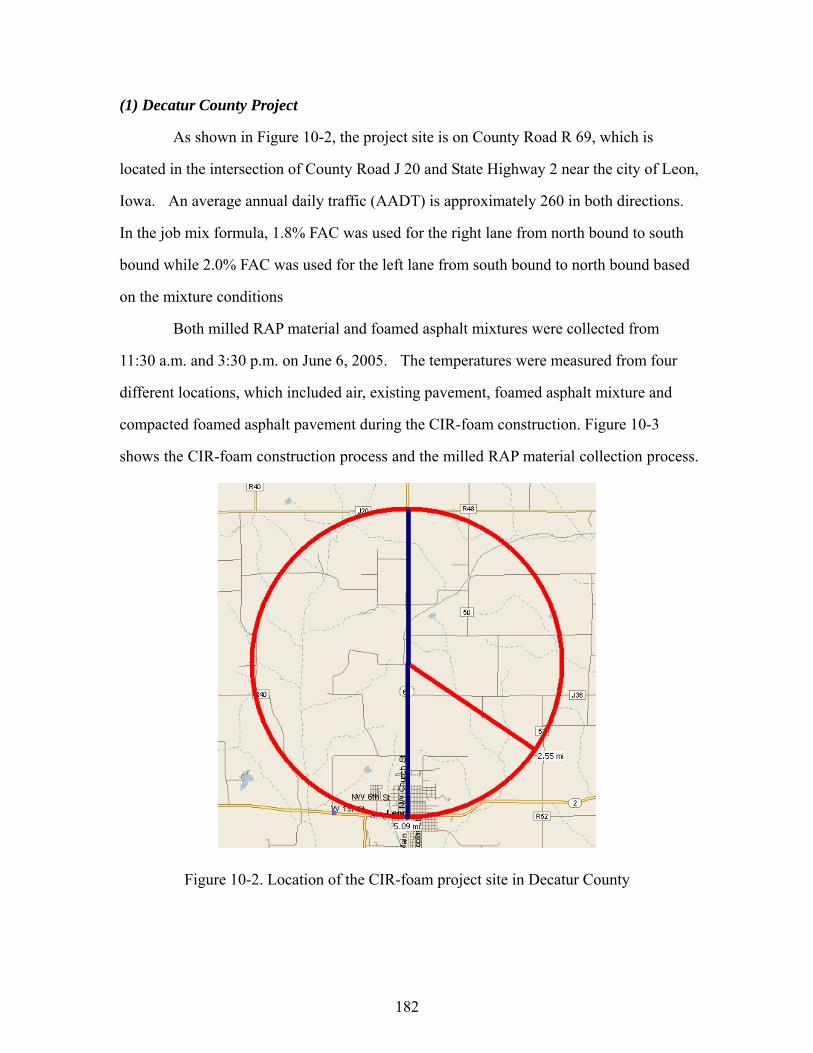
182
(1) Decatur County Project
As shown in Figure 10-2, the project site is on County Road R 69, which is
located in the intersection of County Road J 20 and State Highway 2 near the city of Leon,
Iowa. An average annual daily traffic (AADT) is approximately 260 in both directions.
In the job mix formula, 1.8% FAC was used for the right lane from north bound to south
bound while 2.0% FAC was used for the left lane from south bound to north bound based
on the mixture conditions
Both milled RAP material and foamed asphalt mixtures were collected from
11:30 a.m. and 3:30 p.m. on June 6, 2005. The temperatures were measured from four
different locations, which included air, existing pavement, foamed asphalt mixture and
compacted foamed asphalt pavement during the CIR-foam construction. Figure 10-3
shows the CIR-foam construction process and the milled RAP material collection process.
Figure 10-2. Location of the CIR-foam project site in Decatur County

183
(a) CIR-foam process (b) Collection of RAP materials
Figure 10-3. Pictures of CIR-foam job site in Decatur County
(2) Harrison County Project
As shown in Figure 10-4, the project site is on State Highway 37, which is
located near the intersection of Sate Highway 183 and State Highway 30 near the city of
Dunlap, Iowa. An average annual daily traffic (AADT) is approximately 710 in both
directions. The job mix formula specified PG 58-28 asphalt binder at 2.5%. The water
content of 2.5% was also specified to be added to the RAP materials.
Both milled RAP material and foamed asphalt mixtures were collected from
10:30 a.m. and 3:30 p.m. on June 18, 2005. The paved foamed asphalt mixtures were
collected from five different spots, which included left side, left center, center, right
center, and right side, before they were compacted in order to evaluate a uniformity of
foamed asphalt distribution across the lane and along the lane. The temperatures were
measured from four different locations, which included air, existing pavement, foamed
asphalt mixture and compacted foamed asphalt pavement during the CIR construction.
Figure 10-5 shows the CIR-foam construction process and the foamed asphalt mixture
collection process.
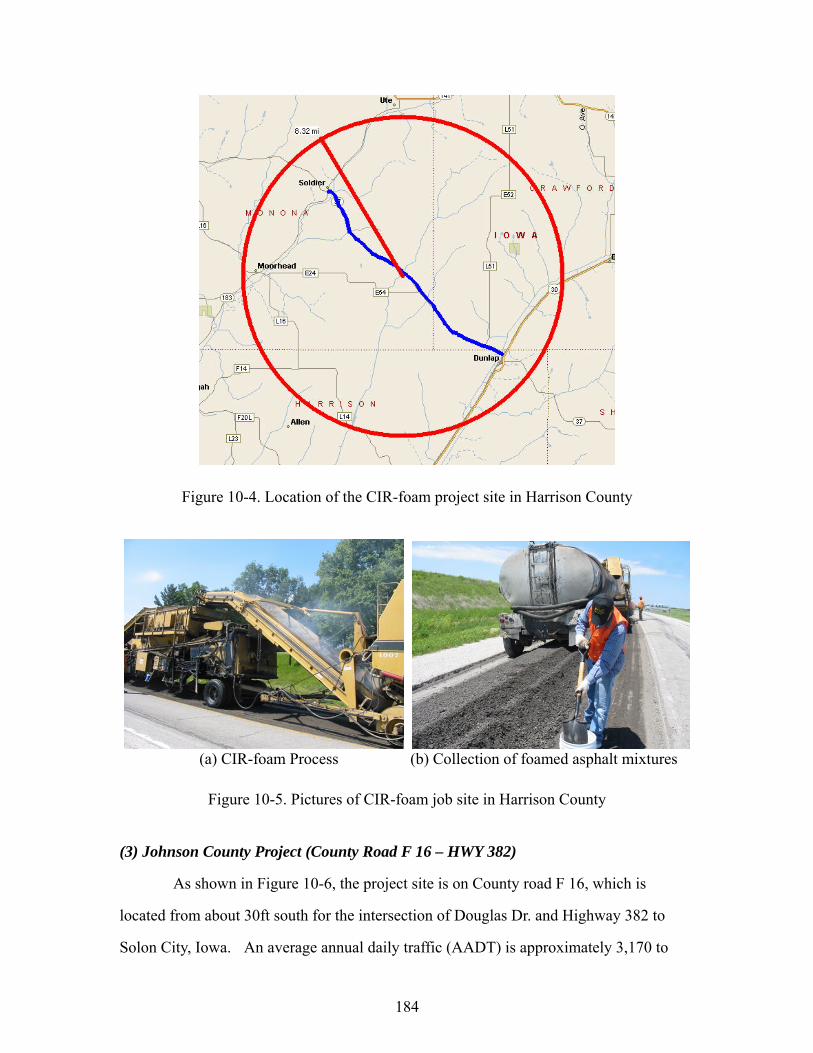
184
Figure 10-4. Location of the CIR-foam project site in Harrison County
(a) CIR-foam Process (b) Collection of foamed asphalt mixtures
Figure 10-5. Pictures of CIR-foam job site in Harrison County
(3) Johnson County Project (County Road F 16 – HWY 382)
As shown in Figure 10-6, the project site is on County road F 16, which is
located from about 30ft south for the intersection of Douglas Dr. and Highway 382 to
Solon City, Iowa. An average annual daily traffic (AADT) is approximately 3,170 to
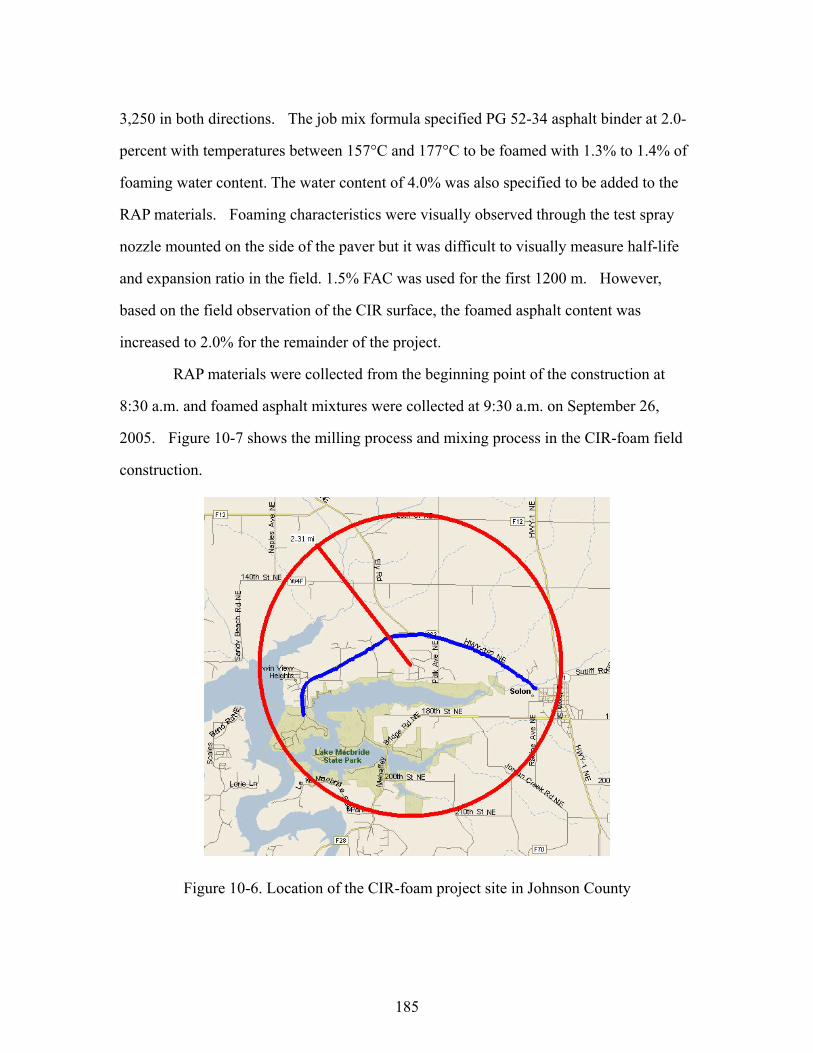
185
3,250 in both directions. The job mix formula specified PG 52-34 asphalt binder at 2.0-
percent with temperatures between 157°C and 177°C to be foamed with 1.3% to 1.4% of
foaming water content. The water content of 4.0% was also specified to be added to the
RAP materials. Foaming characteristics were visually observed through the test spray
nozzle mounted on the side of the paver but it was difficult to visually measure half-life
and expansion ratio in the field. 1.5% FAC was used for the first 1200 m. However,
based on the field observation of the CIR surface, the foamed asphalt content was
increased to 2.0% for the remainder of the project.
RAP materials were collected from the beginning point of the construction at
8:30 a.m. and foamed asphalt mixtures were collected at 9:30 a.m. on September 26,
2005. Figure 10-7 shows the milling process and mixing process in the CIR-foam field
construction.
Figure 10-6. Location of the CIR-foam project site in Johnson County
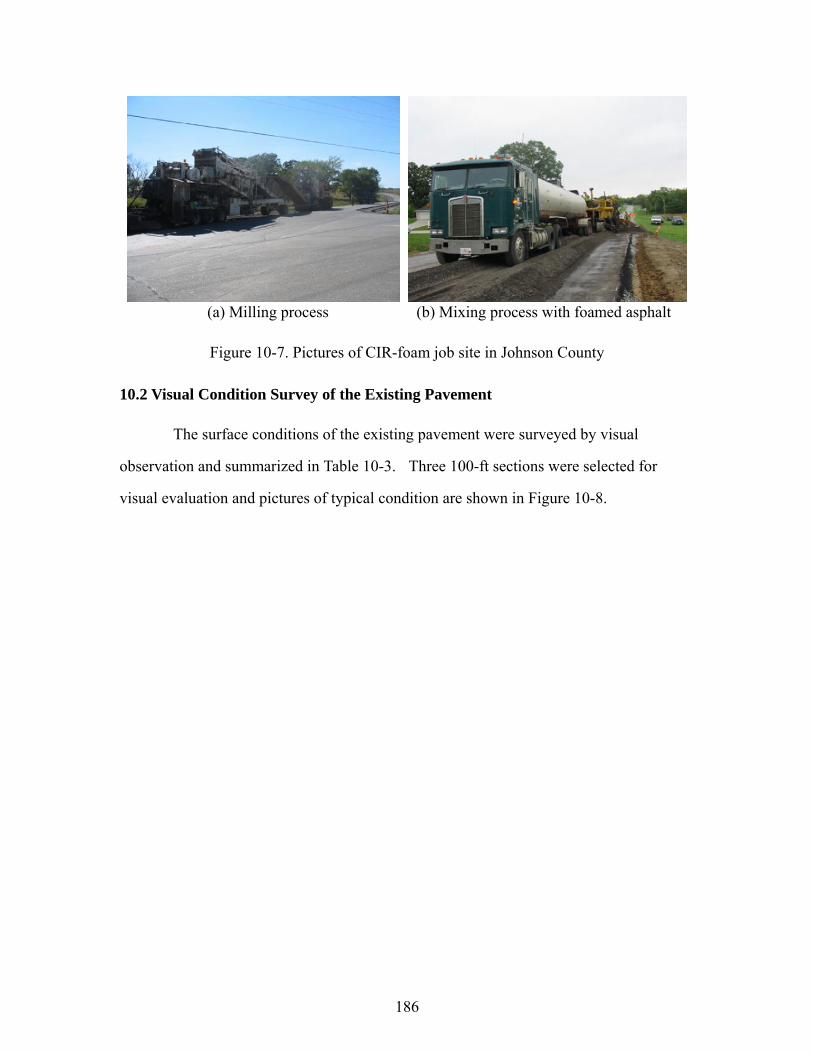
186
(a) Milling process (b) Mixing process with foamed asphalt
Figure 10-7. Pictures of CIR-foam job site in Johnson County
10.2 Visual Condition Survey of the Existing Pavement
The surface conditions of the existing pavement were surveyed by visual
observation and summarized in Table 10-3. Three 100-ft sections were selected for
visual evaluation and pictures of typical condition are shown in Figure 10-8.

187
Table 10-3. Summary of surface conditions from the existing pavement
Project Site
Distress Type Decatur County Harrison County Johnson County
Crack
Alligator Crack Yes Yes Yes
Block Crack Yes Yes Yes
Edge Crack Yes Yes Yes
Longitudinal Crack Yes Yes Yes
Transverse Crack Yes Yes Yes
Reflective Crack No No Yes
Patching /Potholes
Patch Yes Yes Yes
Potholes No Yes No
Surface Deformation
Rutting Yes Yes Yes
Shoving No No No
Surface Defects
Bleeding No No No
Polishing Aggregate Yes Yes Yes
Raveling Yes Yes Yes
Overall Condition Poor Poor Very Poor
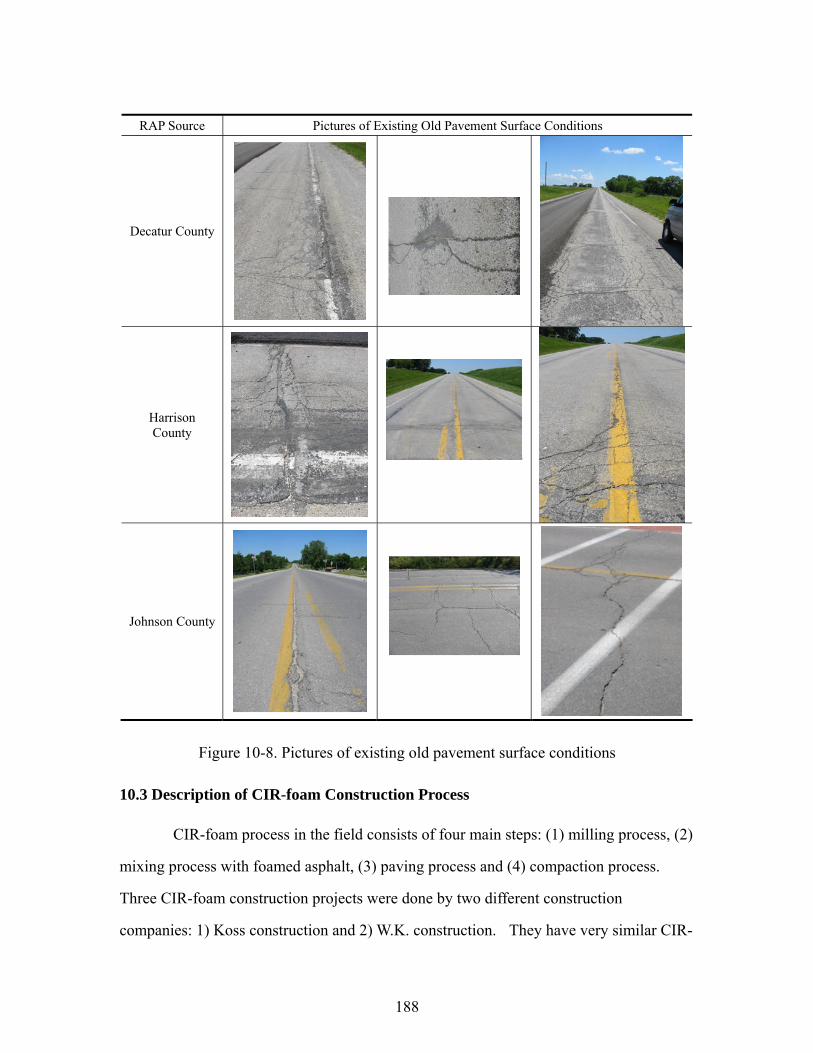
188
RAP Source Pictures of Existing Old Pavement Surface Conditions
Decatur County
Harrison County
Johnson County
Figure 10-8. Pictures of existing old pavement surface conditions
10.3 Description of CIR-foam Construction Process
CIR-foam process in the field consists of four main steps: (1) milling process, (2)
mixing process with foamed asphalt, (3) paving process and (4) compaction process.
Three CIR-foam construction projects were done by two different construction
companies: 1) Koss construction and 2) W.K. construction. They have very similar CIR-
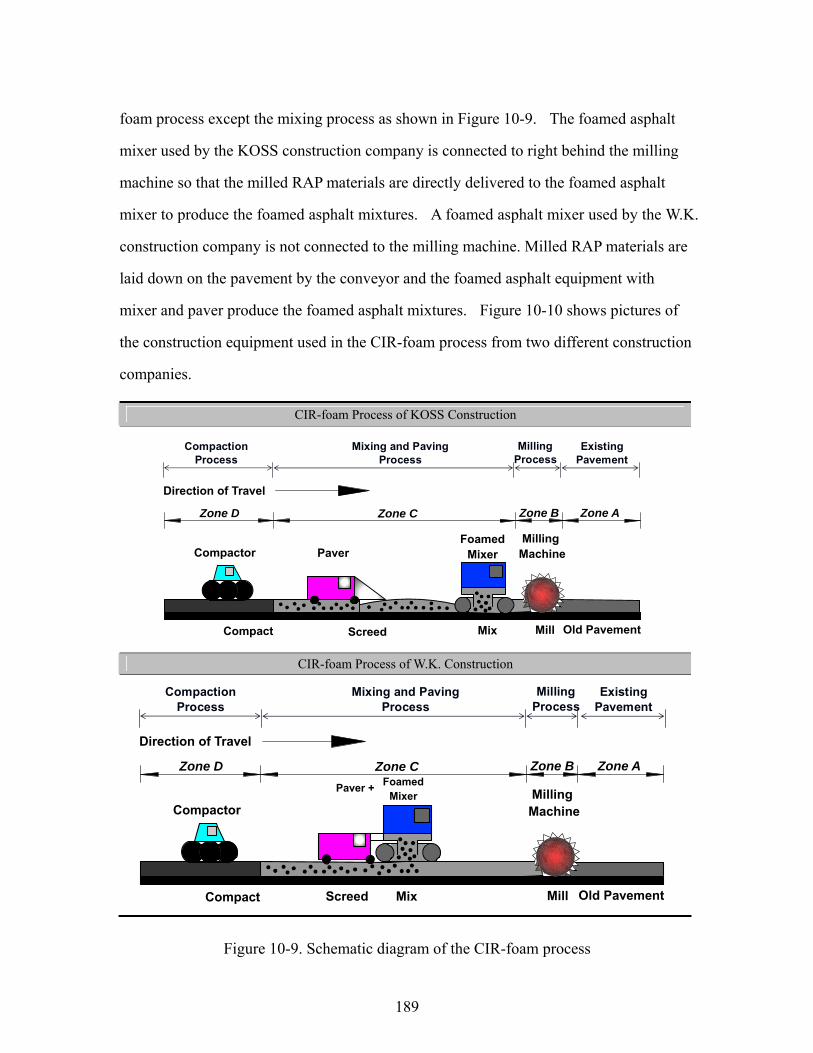
189
foam process except the mixing process as shown in Figure 10-9. The foamed asphalt
mixer used by the KOSS construction company is connected to right behind the milling
machine so that the milled RAP materials are directly delivered to the foamed asphalt
mixer to produce the foamed asphalt mixtures. A foamed asphalt mixer used by the W.K.
construction company is not connected to the milling machine. Milled RAP materials are
laid down on the pavement by the conveyor and the foamed asphalt equipment with
mixer and paver produce the foamed asphalt mixtures. Figure 10-10 shows pictures of
the construction equipment used in the CIR-foam process from two different construction
companies.
CIR-foam Process of KOSS Construction
Direction of Travel
PaverMilling
Machine
Zone D Zone C Zone B
Old PavementCompact Screed Mix Mill
Zone A
Foamed MixerCompactor
Compaction Process
Mixing and Paving Process
Milling Process
Existing Pavement
CIR-foam Process of W.K. Construction
Compaction Process
Mixing and Paving Process
Milling Process
Existing Pavement
Direction of Travel
Paver + Milling Machine
Zone D Zone C Zone B
Old PavementCompact Screed Mix Mill
Zone AFoamed
MixerCompactor
Figure 10-9. Schematic diagram of the CIR-foam process

190
KOSS Construction W.K. Construction
Water and Asphalt Binder
Tankers
Milling Machine
Foamed Mixer
Paver
Compactor
Figure 10-10. Pictures of CIR-foam construction equipment

191
10.4 Pavement Temperatures during CIR-foam Process
To monitor the variation of field temperatures during the CIR-foam process, as
shown in Figure 10-11, four different temperatures were measured: 1) air temperature, 2)
existing pavement temperature, 3) foamed asphalt mixture temperature and 4) compacted
foamed asphalt pavement temperature.
Direction of Travel
PaverMilling
Machine
Zone D Zone C Zone B
Old PavementCompact Screed Mix Mill
Zone A
Foamed MixerCompactor
Compacted Foamed Asphalt Pavement Foamed Asphalt Mixes Existing Pavement
(1)
(2)(3)(4)
Zone A: Existing Pavement, Zone B: Milling Process, Zone C: Mixing and Paving Process Zone D: Compaction Process
Figure 10-11. Locations of measured temperatures from CIR-foam process
Temperatures measured at different time periods throughout the day are
summarized in Table 10-4 and plotted in Figure 10-12. Decatur and Harrison County
projects were conducted on June 6, 2005 and June 18, 2005 in the middle of summer
whereas Johnson County project were conducted on September 28, 2005 in the beginning
of fall. All temperatures were measured in the time periods between 11:30 a.m. and 3:30
p.m. in Decatur and Harrison County projects whereas all temperatures were measured
from 8:30 a.m. and 11:30 a.m. in Johnson County project.
Air temperatures in Decatur and Harrison County projects ranged between
26.2°C and 34.2°C from 11:30 a.m. and 3:30 p.m. As shown in Figure 10-12, for
Decatur and Harrison County projects, the temperature of the existing pavements ranged
between 33.2°C and 49.2°C, the temperatures of the foamed asphalt mixtures ranged
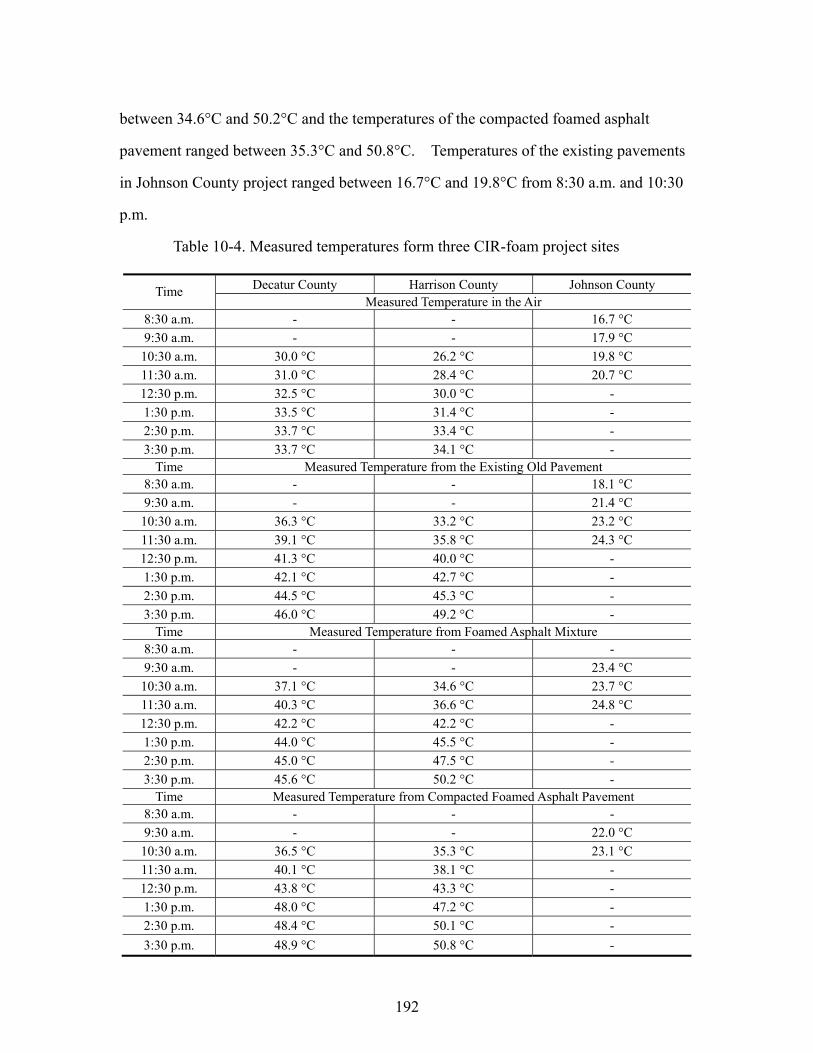
192
between 34.6°C and 50.2°C and the temperatures of the compacted foamed asphalt
pavement ranged between 35.3°C and 50.8°C. Temperatures of the existing pavements
in Johnson County project ranged between 16.7°C and 19.8°C from 8:30 a.m. and 10:30
p.m.
Table 10-4. Measured temperatures form three CIR-foam project sites
Decatur County Harrison County Johnson County Time Measured Temperature in the Air
8:30 a.m. - - 16.7 °C 9:30 a.m. - - 17.9 °C 10:30 a.m. 30.0 °C 26.2 °C 19.8 °C 11:30 a.m. 31.0 °C 28.4 °C 20.7 °C 12:30 p.m. 32.5 °C 30.0 °C - 1:30 p.m. 33.5 °C 31.4 °C - 2:30 p.m. 33.7 °C 33.4 °C - 3:30 p.m. 33.7 °C 34.1 °C -
Time Measured Temperature from the Existing Old Pavement 8:30 a.m. - - 18.1 °C 9:30 a.m. - - 21.4 °C 10:30 a.m. 36.3 °C 33.2 °C 23.2 °C 11:30 a.m. 39.1 °C 35.8 °C 24.3 °C 12:30 p.m. 41.3 °C 40.0 °C - 1:30 p.m. 42.1 °C 42.7 °C - 2:30 p.m. 44.5 °C 45.3 °C - 3:30 p.m. 46.0 °C 49.2 °C -
Time Measured Temperature from Foamed Asphalt Mixture 8:30 a.m. - - - 9:30 a.m. - - 23.4 °C 10:30 a.m. 37.1 °C 34.6 °C 23.7 °C 11:30 a.m. 40.3 °C 36.6 °C 24.8 °C 12:30 p.m. 42.2 °C 42.2 °C - 1:30 p.m. 44.0 °C 45.5 °C - 2:30 p.m. 45.0 °C 47.5 °C - 3:30 p.m. 45.6 °C 50.2 °C -
Time Measured Temperature from Compacted Foamed Asphalt Pavement 8:30 a.m. - - - 9:30 a.m. - - 22.0 °C 10:30 a.m. 36.5 °C 35.3 °C 23.1 °C 11:30 a.m. 40.1 °C 38.1 °C - 12:30 p.m. 43.8 °C 43.3 °C - 1:30 p.m. 48.0 °C 47.2 °C - 2:30 p.m. 48.4 °C 50.1 °C - 3:30 p.m. 48.9 °C 50.8 °C -
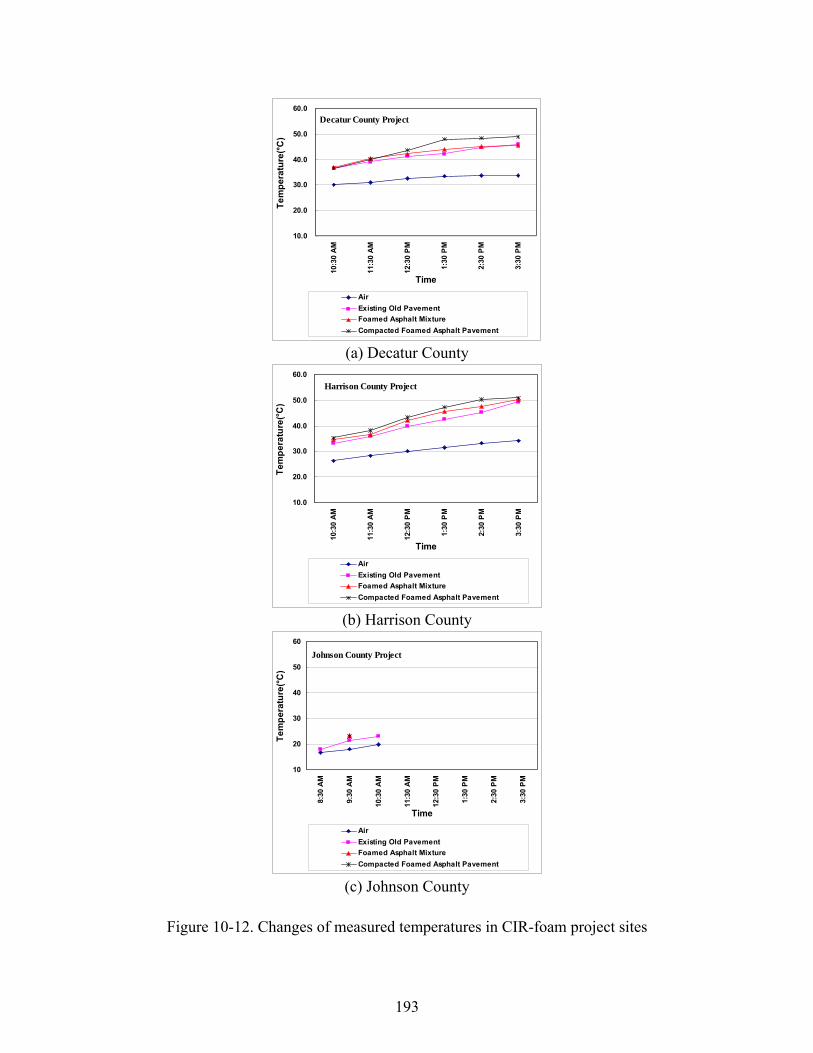
193
10.0
20.0
30.0
40.0
50.0
60.0
10:3
0 A
M
11:3
0 A
M
12:3
0 P
M
1:30
PM
2:30
PM
3:30
PM
TimeTe
mpe
ratu
re(°C
)
Air Existing Old PavementFoamed Asphalt MixtureCompacted Foamed Asphalt Pavement
Decatur County Project
(a) Decatur County
10.0
20.0
30.0
40.0
50.0
60.0
10:3
0 A
M
11:3
0 A
M
12:3
0 P
M
1:30
PM
2:30
PM
3:30
PM
Time
Tem
pera
ture
(°C)
Air Existing Old PavementFoamed Asphalt MixtureCompacted Foamed Asphalt Pavement
Harrison County Project
(b) Harrison County
10
20
30
40
50
60
8:30
AM
9:30
AM
10:3
0 A
M
11:3
0 A
M
12:3
0 P
M
1:30
PM
2:30
PM
3:30
PM
Time
Tem
pera
ture
(°C)
Air Existing Old PavementFoamed Asphalt MixtureCompacted Foamed Asphalt Pavement
Johnson County Project
(c) Johnson County
Figure 10-12. Changes of measured temperatures in CIR-foam project sites

194
10.5 Visual Observation of CIR-foam Quality
The foamed asphalt content in the field was adjusted by contractor based on the
visual field observation. The original foamed asphalt content determined for the CIR-
foam projects in Decatur and Johnson Counties were adjusted during the construction
process.
As shown in Figure 10-13, the paved foamed asphalt mixtures before compaction
did not seem to be distributed evenly across the lane such that coarser mixtures were
placed in the left side, center and right side across the lane whereas finer mixtures were
placed in the left middle and right middle.
To determine the distribution of foamed asphalt, foamed asphalt mixtures were
collected across and along the lane. The collected mixtures were tested for: 1) foamed
asphalt content using burn-off test and 2) gradation analysis from extracted RAP
aggregate.
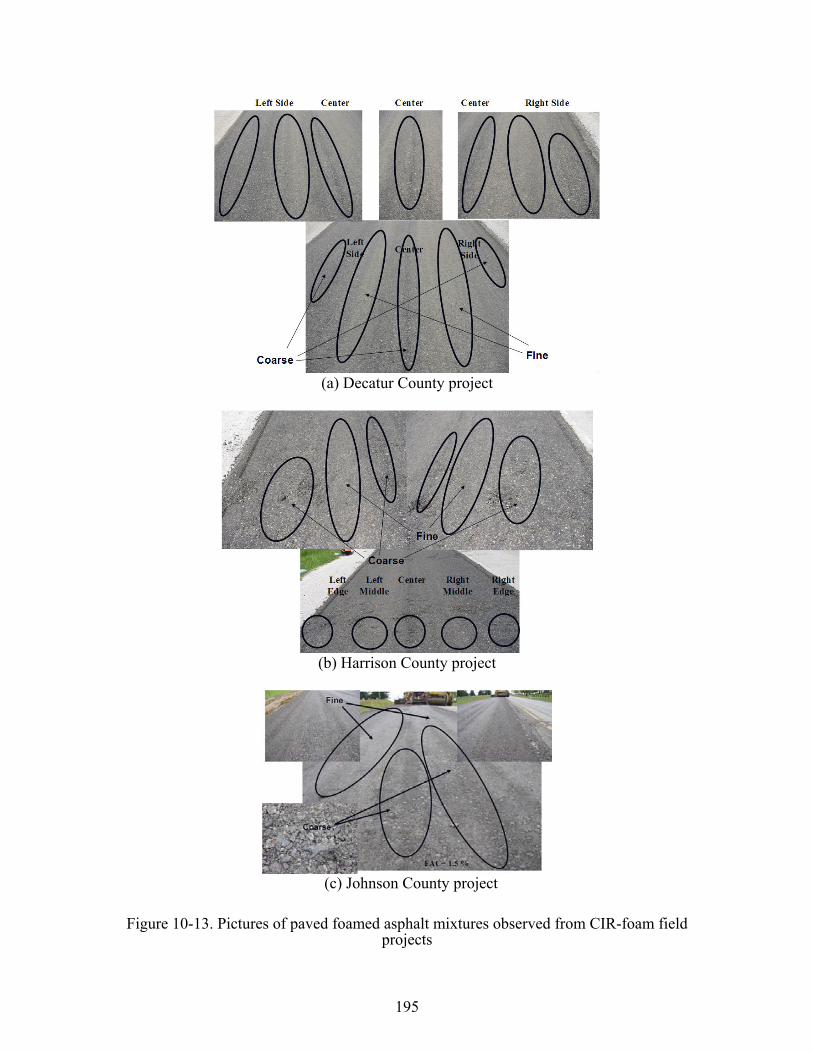
195
(a) Decatur County project
(b) Harrison County project
(c) Johnson County project
Figure 10-13. Pictures of paved foamed asphalt mixtures observed from CIR-foam field projects
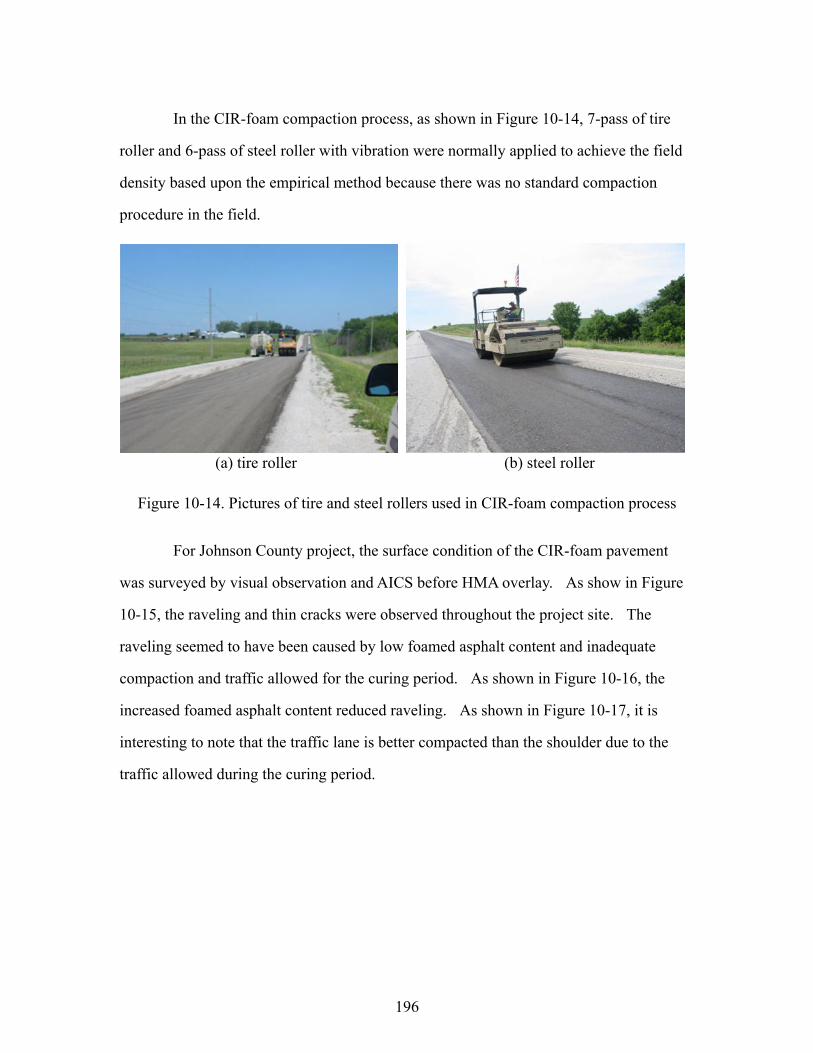
196
In the CIR-foam compaction process, as shown in Figure 10-14, 7-pass of tire
roller and 6-pass of steel roller with vibration were normally applied to achieve the field
density based upon the empirical method because there was no standard compaction
procedure in the field.
(a) tire roller (b) steel roller
Figure 10-14. Pictures of tire and steel rollers used in CIR-foam compaction process
For Johnson County project, the surface condition of the CIR-foam pavement
was surveyed by visual observation and AICS before HMA overlay. As show in Figure
10-15, the raveling and thin cracks were observed throughout the project site. The
raveling seemed to have been caused by low foamed asphalt content and inadequate
compaction and traffic allowed for the curing period. As shown in Figure 10-16, the
increased foamed asphalt content reduced raveling. As shown in Figure 10-17, it is
interesting to note that the traffic lane is better compacted than the shoulder due to the
traffic allowed during the curing period.

197
(a) Visual observation (b) Captured image from AICS
Figure 10-15. Pictures of surface problems at the rehabilitated CIR-foam pavement
Figure 10-16. Comparison of CIR-foam pavement raveling at two different FAC
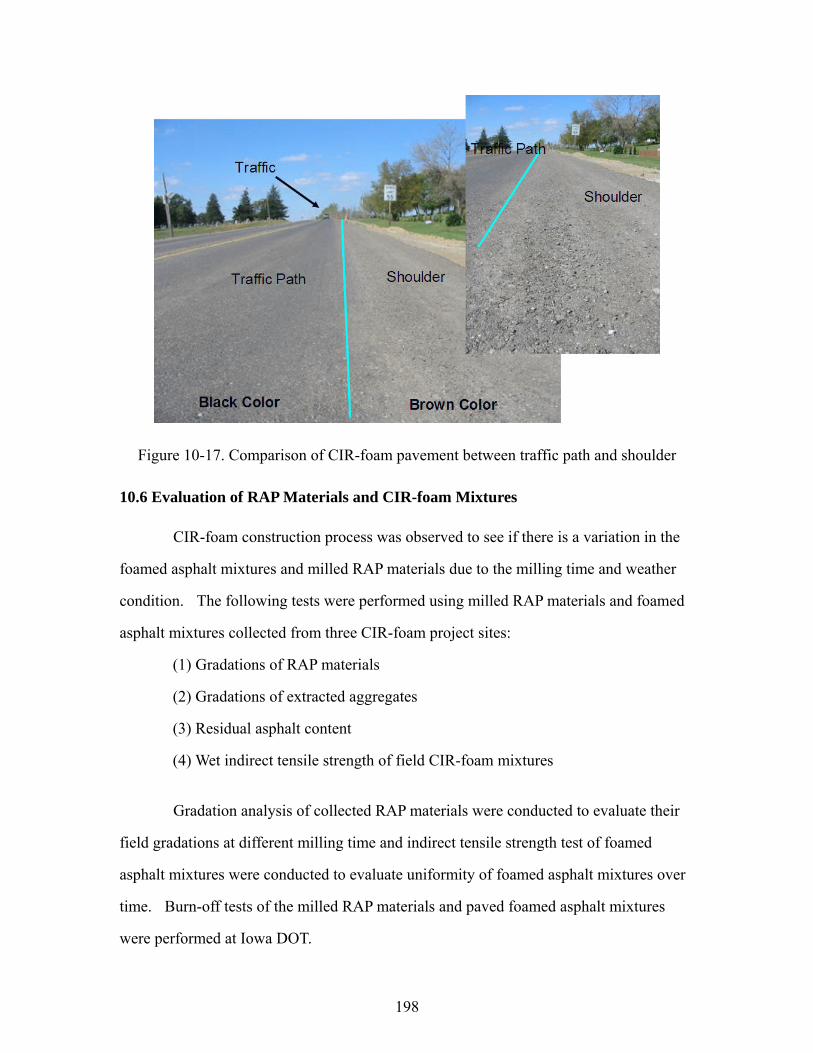
198
Figure 10-17. Comparison of CIR-foam pavement between traffic path and shoulder
10.6 Evaluation of RAP Materials and CIR-foam Mixtures
CIR-foam construction process was observed to see if there is a variation in the
foamed asphalt mixtures and milled RAP materials due to the milling time and weather
condition. The following tests were performed using milled RAP materials and foamed
asphalt mixtures collected from three CIR-foam project sites:
(1) Gradations of RAP materials
(2) Gradations of extracted aggregates
(3) Residual asphalt content
(4) Wet indirect tensile strength of field CIR-foam mixtures
Gradation analysis of collected RAP materials were conducted to evaluate their
field gradations at different milling time and indirect tensile strength test of foamed
asphalt mixtures were conducted to evaluate uniformity of foamed asphalt mixtures over
time. Burn-off tests of the milled RAP materials and paved foamed asphalt mixtures
were performed at Iowa DOT.
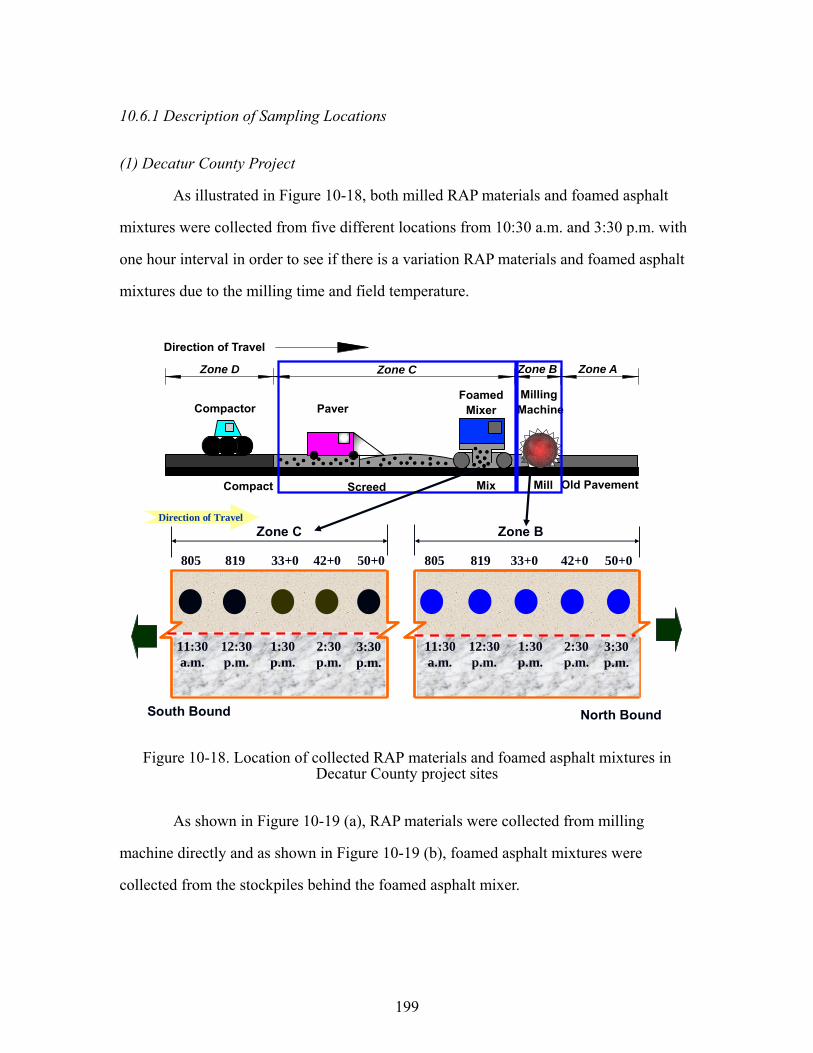
199
10.6.1 Description of Sampling Locations
(1) Decatur County Project
As illustrated in Figure 10-18, both milled RAP materials and foamed asphalt
mixtures were collected from five different locations from 10:30 a.m. and 3:30 p.m. with
one hour interval in order to see if there is a variation RAP materials and foamed asphalt
mixtures due to the milling time and field temperature.
Direction of Travel
Direction of Travel
PaverMilling
Machine
Zone D Zone C Zone B
Old PavementCompact Screed Mix Mill
Zone A
Foamed MixerCompactor
Zone C Zone B
South Bound
11:30 a.m.
North Bound
12:30 p.m.
1:30 p.m.
2:30 p.m.
3:30 p.m.
11:30 a.m.
12:30 p.m.
1:30 p.m.
2:30 p.m.
3:30 p.m.
805 819 33+0 42+0 50+0 805 819 33+0 42+0 50+0
Figure 10-18. Location of collected RAP materials and foamed asphalt mixtures in Decatur County project sites
As shown in Figure 10-19 (a), RAP materials were collected from milling
machine directly and as shown in Figure 10-19 (b), foamed asphalt mixtures were
collected from the stockpiles behind the foamed asphalt mixer.
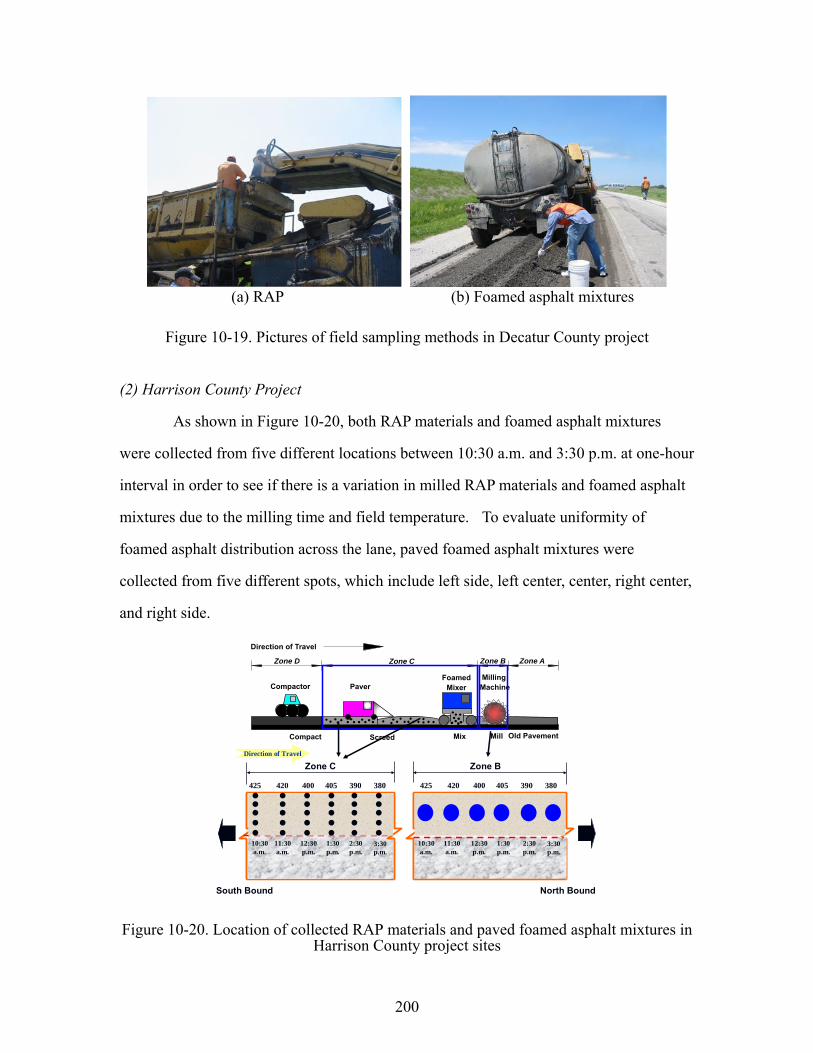
200
(a) RAP (b) Foamed asphalt mixtures
Figure 10-19. Pictures of field sampling methods in Decatur County project
(2) Harrison County Project
As shown in Figure 10-20, both RAP materials and foamed asphalt mixtures
were collected from five different locations between 10:30 a.m. and 3:30 p.m. at one-hour
interval in order to see if there is a variation in milled RAP materials and foamed asphalt
mixtures due to the milling time and field temperature. To evaluate uniformity of
foamed asphalt distribution across the lane, paved foamed asphalt mixtures were
collected from five different spots, which include left side, left center, center, right center,
and right side.
Zone C Zone B
South Bound North Bound
11:30 a.m.
12:30 p.m.
1:30 p.m.
2:30 p.m.
3:30 p.m.
425 420 400 405 390
Direction of Travel
10:30 a.m.
11:30 a.m.
12:30 p.m.
1:30 p.m.
2:30 p.m.
3:30 p.m.
10:30 a.m.
380 425 420 400 405 390 380
Direction of Travel
PaverMilling
Machine
Zone D Zone C Zone B
Old PavementCompact Screed Mix Mill
Zone A
Foamed MixerCompactor
Figure 10-20. Location of collected RAP materials and paved foamed asphalt mixtures in Harrison County project sites
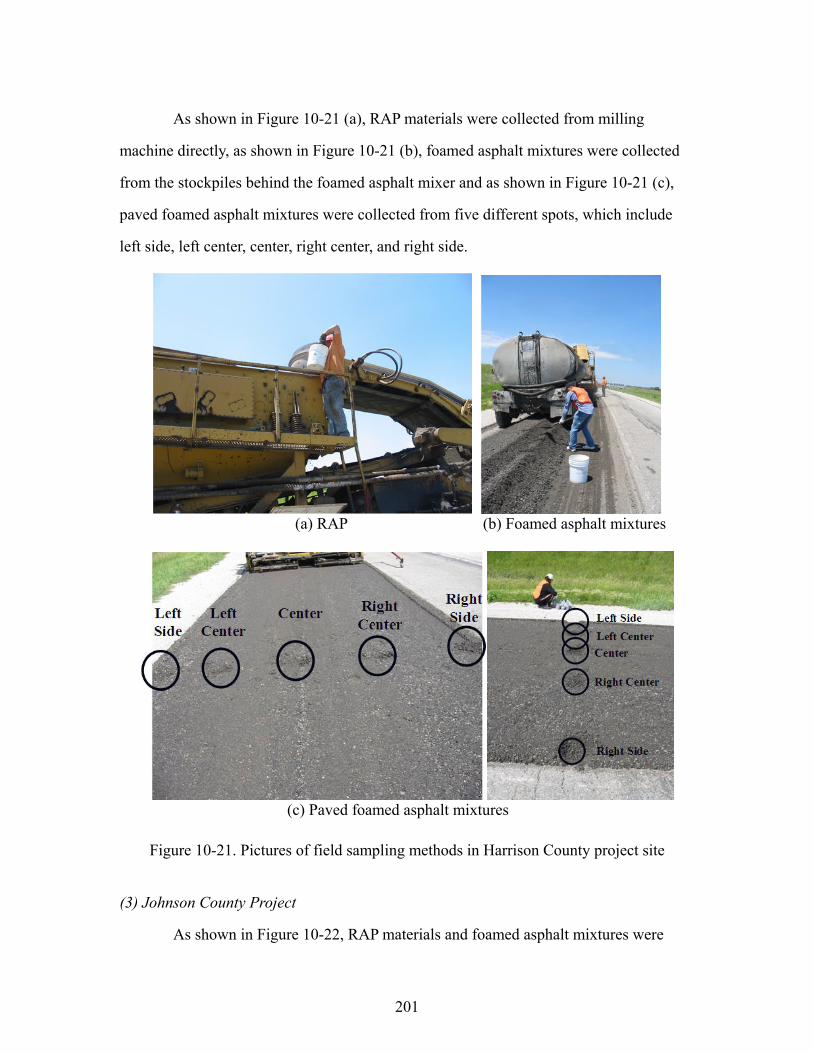
201
As shown in Figure 10-21 (a), RAP materials were collected from milling
machine directly, as shown in Figure 10-21 (b), foamed asphalt mixtures were collected
from the stockpiles behind the foamed asphalt mixer and as shown in Figure 10-21 (c),
paved foamed asphalt mixtures were collected from five different spots, which include
left side, left center, center, right center, and right side.
(a) RAP (b) Foamed asphalt mixtures
(c) Paved foamed asphalt mixtures
Figure 10-21. Pictures of field sampling methods in Harrison County project site
(3) Johnson County Project
As shown in Figure 10-22, RAP materials and foamed asphalt mixtures were
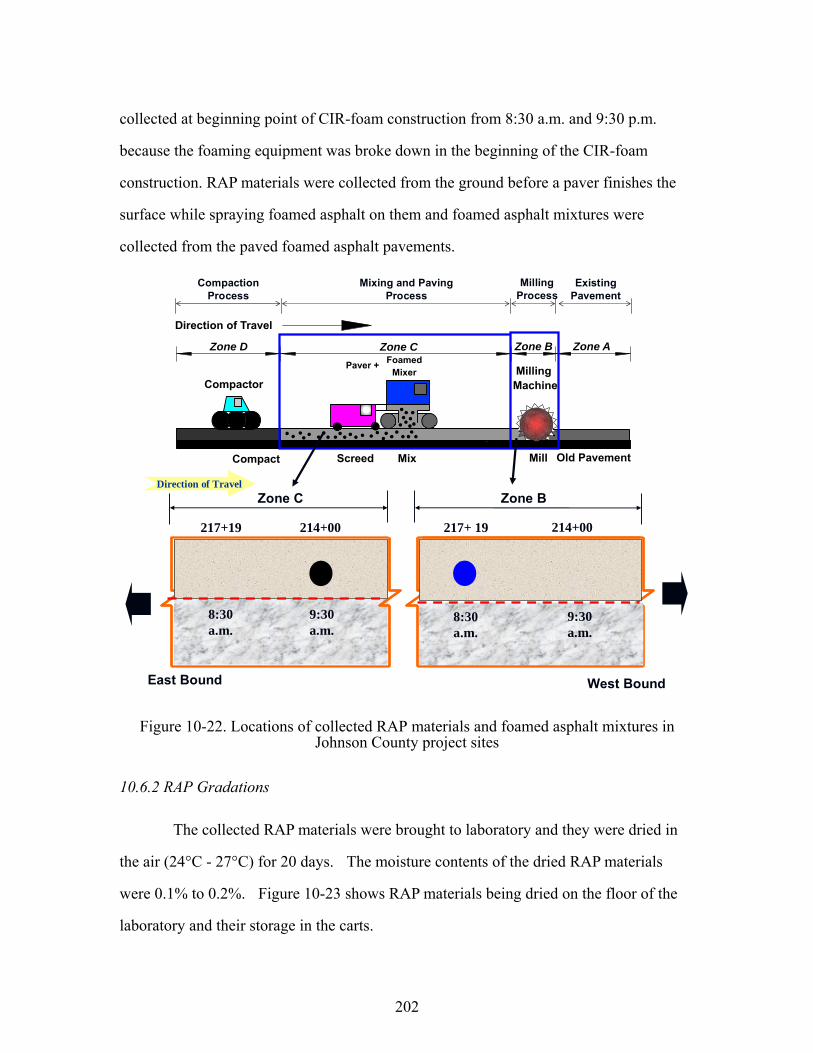
202
collected at beginning point of CIR-foam construction from 8:30 a.m. and 9:30 p.m.
because the foaming equipment was broke down in the beginning of the CIR-foam
construction. RAP materials were collected from the ground before a paver finishes the
surface while spraying foamed asphalt on them and foamed asphalt mixtures were
collected from the paved foamed asphalt pavements.
Compaction Process
Mixing and Paving Process
Milling Process
Existing Pavement
Direction of Travel
Paver + Milling Machine
Zone D Zone C Zone B
Old PavementCompact Screed Mix Mill
Zone AFoamed
MixerCompactor
Zone C Zone B
East Bound
8:30 a.m.
West Bound
9:30 a.m.
8:30 a.m.
9:30 a.m.
217+19 214+00 217+ 19
Direction of Travel
214+00
Figure 10-22. Locations of collected RAP materials and foamed asphalt mixtures in Johnson County project sites
10.6.2 RAP Gradations
The collected RAP materials were brought to laboratory and they were dried in
the air (24°C - 27°C) for 20 days. The moisture contents of the dried RAP materials
were 0.1% to 0.2%. Figure 10-23 shows RAP materials being dried on the floor of the
laboratory and their storage in the carts.
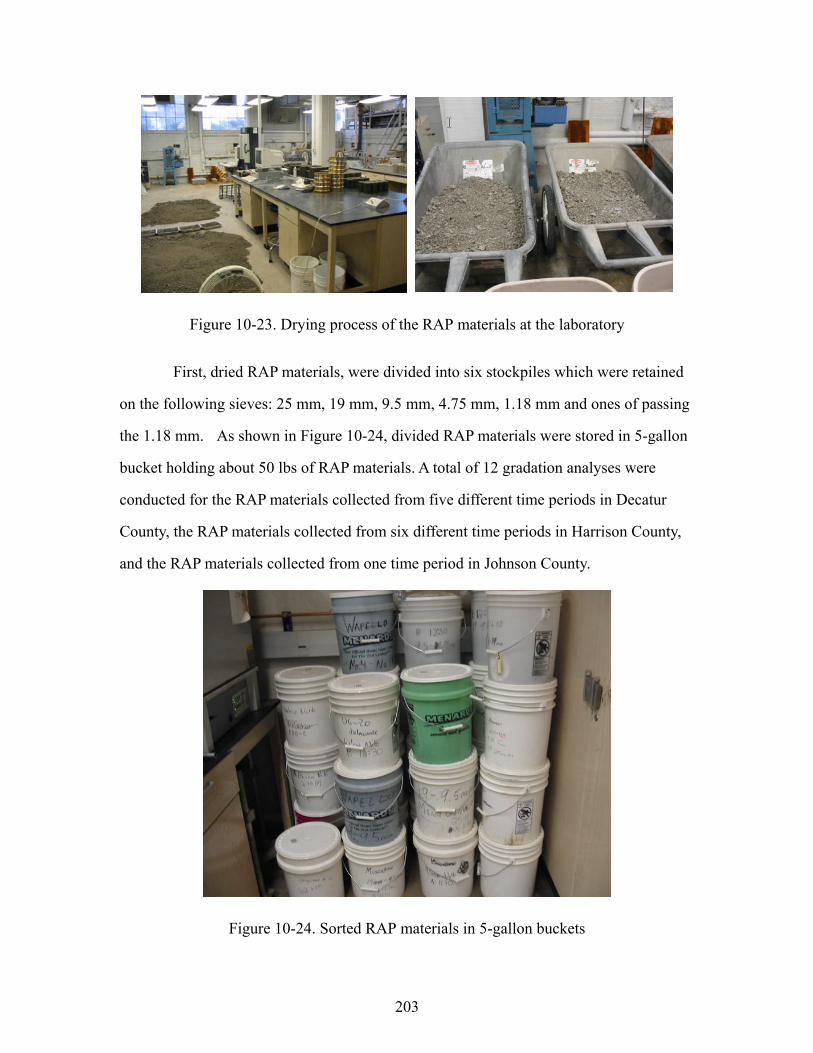
203
Figure 10-23. Drying process of the RAP materials at the laboratory
First, dried RAP materials, were divided into six stockpiles which were retained
on the following sieves: 25 mm, 19 mm, 9.5 mm, 4.75 mm, 1.18 mm and ones of passing
the 1.18 mm. As shown in Figure 10-24, divided RAP materials were stored in 5-gallon
bucket holding about 50 lbs of RAP materials. A total of 12 gradation analyses were
conducted for the RAP materials collected from five different time periods in Decatur
County, the RAP materials collected from six different time periods in Harrison County,
and the RAP materials collected from one time period in Johnson County.
Figure 10-24. Sorted RAP materials in 5-gallon buckets

204
The sorted RAP materials from three different sources were weighed and their
relative proportions were computed as shown in Table 10-5, Table 10-6 and Table 10-7.
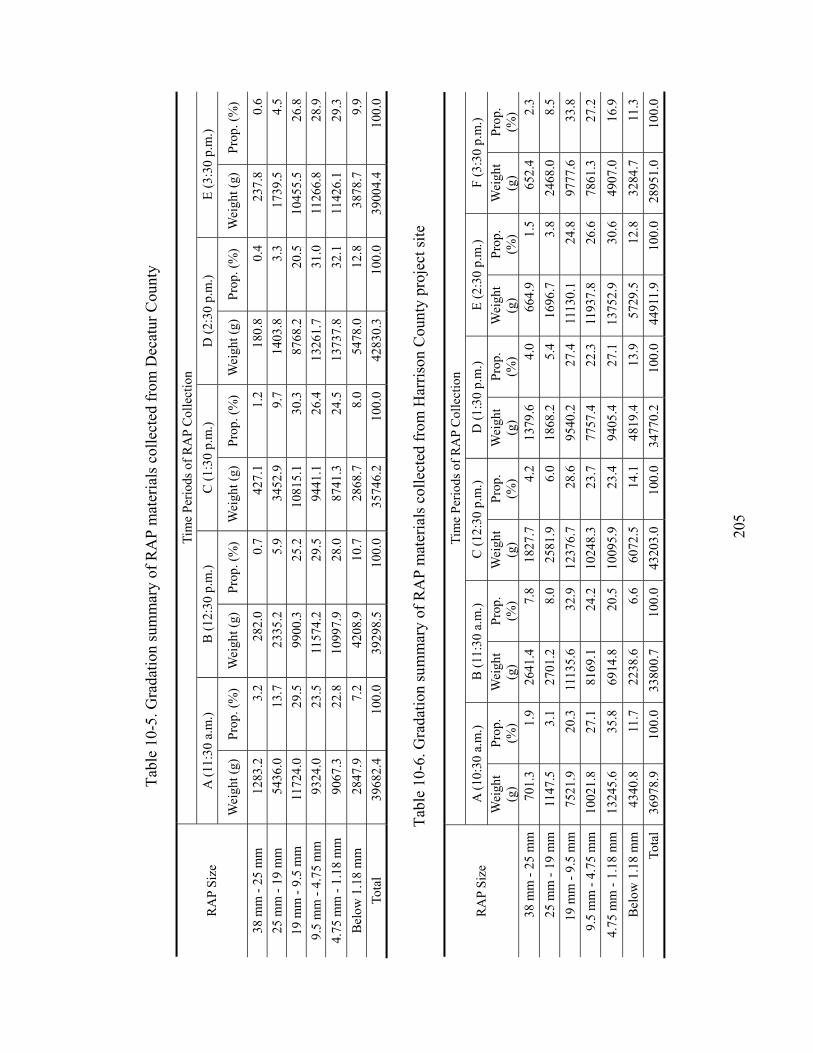
20
5
Tabl
e 10
-5. G
rada
tion
sum
mar
y of
RA
P m
ater
ials
col
lect
ed fr
om D
ecat
ur C
ount
y
Tim
e Pe
riods
of R
AP
Col
lect
ion
A (1
1:30
a.m
.) B
(12:
30 p
.m.)
C (1
:30
p.m
.) D
(2:3
0 p.
m.)
E (3
:30
p.m
.) R
AP
Size
W
eigh
t (g)
Pr
op. (
%)
Wei
ght (
g)
Prop
. (%
) W
eigh
t (g)
Pr
op. (
%)
Wei
ght (
g)
Prop
. (%
) W
eigh
t (g)
Pr
op. (
%)
38 m
m -
25 m
m
1283
.2
3.2
282.
0 0.
7 42
7.1
1.2
180.
8 0.
4 23
7.8
0.6
25 m
m -
19 m
m
5436
.0
13.7
23
35.2
5.
9 34
52.9
9.
7 14
03.8
3.
3 17
39.5
4.
5 19
mm
- 9.
5 m
m
1172
4.0
29.5
99
00.3
25
.2
1081
5.1
30.3
87
68.2
20
.5
1045
5.5
26.8
9.
5 m
m -
4.75
mm
93
24.0
23
.5
1157
4.2
29.5
94
41.1
26
.4
1326
1.7
31.0
11
266.
8 28
.9
4.75
mm
- 1.
18 m
m
9067
.3
22.8
10
997.
9 28
.0
8741
.3
24.5
13
737.
8 32
.1
1142
6.1
29.3
B
elow
1.1
8 m
m
2847
.9
7.2
4208
.9
10.7
28
68.7
8.
0 54
78.0
12
.8
3878
.7
9.9
Tota
l 39
682.
4 10
0.0
3929
8.5
100.
0 35
746.
2 10
0.0
4283
0.3
100.
0 39
004.
4 10
0.0
Tabl
e 10
-6. G
rada
tion
sum
mar
y of
RA
P m
ater
ials
col
lect
ed fr
om H
arris
on C
ount
y pr
ojec
t site
Tim
e Pe
riods
of R
AP
Col
lect
ion
A (1
0:30
a.m
.) B
(11:
30 a
.m.)
C (1
2:30
p.m
.) D
(1:3
0 p.
m.)
E (2
:30
p.m
.) F
(3:3
0 p.
m.)
RA
P Si
ze
Wei
ght
(g)
Prop
. (%
) W
eigh
t (g
) Pr
op.
(%)
Wei
ght
(g)
Prop
. (%
) W
eigh
t (g
) Pr
op.
(%)
Wei
ght
(g)
Prop
. (%
) W
eigh
t (g
) Pr
op.
(%)
38 m
m -
25 m
m
701.
3 1.
9 26
41.4
7.
8 18
27.7
4.
2 13
79.6
4.
0 66
4.9
1.5
652.
4 2.
3 25
mm
- 19
mm
11
47.5
3.
1 27
01.2
8.
0 25
81.9
6.
0 18
68.2
5.
4 16
96.7
3.
8 24
68.0
8.
5 19
mm
- 9.
5 m
m
7521
.9
20.3
11
135.
6 32
.9
1237
6.7
28.6
95
40.2
27
.4
1113
0.1
24.8
97
77.6
33
.8
9.5
mm
- 4.
75 m
m
1002
1.8
27.1
81
69.1
24
.2
1024
8.3
23.7
77
57.4
22
.3
1193
7.8
26.6
78
61.3
27
.2
4.75
mm
- 1.
18 m
m
1324
5.6
35.8
69
14.8
20
.5
1009
5.9
23.4
94
05.4
27
.1
1375
2.9
30.6
49
07.0
16
.9
Bel
ow 1
.18
mm
43
40.8
11
.7
2238
.6
6.6
6072
.5
14.1
48
19.4
13
.9
5729
.5
12.8
32
84.7
11
.3
Tota
l 36
978.
9 10
0.0
3380
0.7
100.
0 43
203.
0 10
0.0
3477
0.2
100.
0 44
911.
9 10
0.0
2895
1.0
100.
0
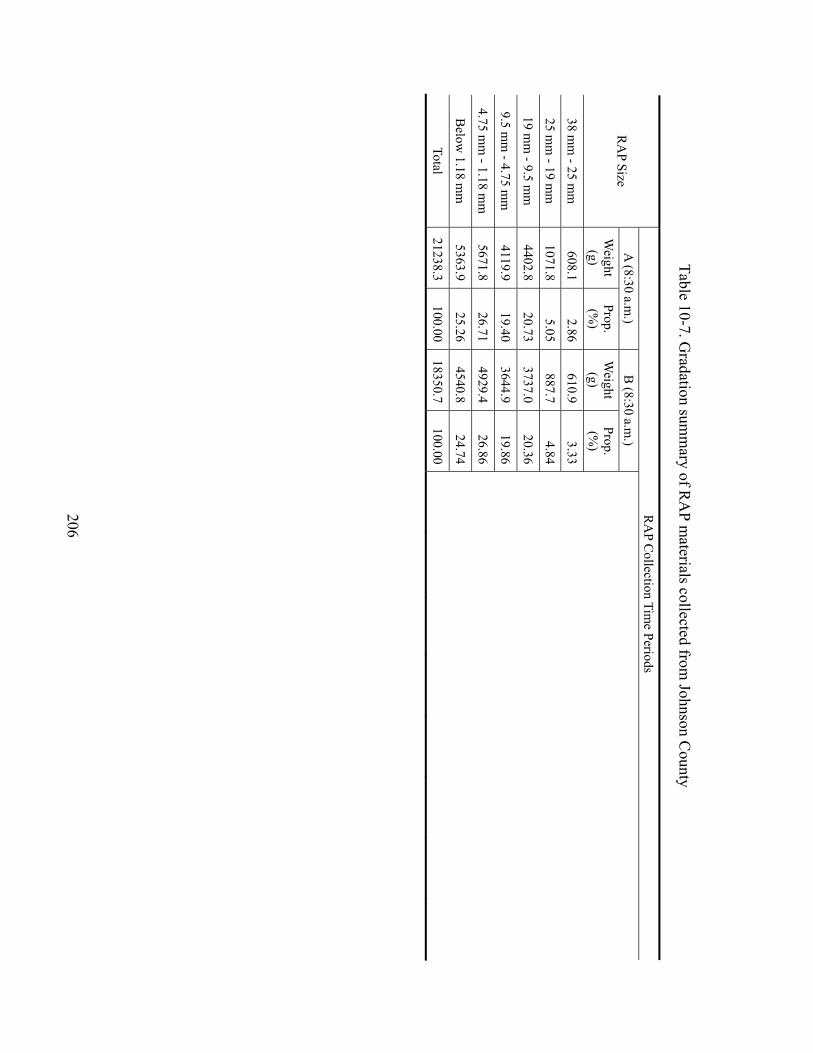
206
Table 10-7. Gradation sum
mary of R
AP m
aterials collected from Johnson C
ounty
RA
P Collection Tim
e Periods A
(8:30 a.m.)
B (8:30 a.m
.)
R
AP Size
Weight (g)
Prop. (%
) W
eight (g)
Prop. (%
)
38 mm
- 25 mm
608.1
2.86 610.9
3.33
25 m
m - 19 m
m
1071.8 5.05
887.7 4.84
19 mm
- 9.5 mm
4402.8
20.73 3737.0
20.36
9.5 m
m - 4.75 m
m
4119.9 19.40
3644.9 19.86
4.75 mm
- 1.18 mm
5671.8
26.71 4929.4
26.86
B
elow 1.18 m
m
5363.9 25.26
4540.8 24.74
Total 21238.3
100.00 18350.7
100.00
207
After discarding RAP materials bigger than 25 mm, gradations are summarized
in Table 10-8, Table 10-9 and Table 10-10 and plotted on a 0.45 power chart in Figure 10-
25, Figure 10-26 and Figure 10-27.
For Decatur County project, as shown in Table 10-8 and Figure 10-25, RAP
materials can be considered from dense to coarse with a very small amount of fine RAP
materials passing 0.075 mm sieve. All RAP materials passed 38.1mm sieve and less
than 1.0% was retained on the 25mm sieve except RAP materials collected at 11:30 a.m.
and 1:30 p.m. RAP materials collected at 11:30 a.m. can be considered the most coarse
and those collected from 1:30 p.m. as coarse. RAP materials collected at 2:30 p.m. can be
considered the most dense and those collected from 12:30 p.m. and 3:30 p.m. as dense.
There seems to be a significant variation among RAP materials collected at different
times, which could have been affected by pavement temperatures.
For Harrison County project, , as shown in Table 10-9 and Figure 10-26, RAP
materials can be considered from dense to coarse with a very small amount of fine RAP
materials passing 0.075 mm sieve. All RAP materials passed 38.1mm sieve and 1.5% to
7.8% of RAP materials were retained on the 25mm sieve. RAP materials collected at
11:30 a.m. can be considered the most coarse, those collected from 3:30 p.m. as coarse,
and those collected from 10:30 p.m., 12:30 p.m., 1:30 p.m., and 2:30 p.m. as dense. There
seems to be a significant variation among RAP materials collected at different times but
the gradation did not correlate well with the pavement temperatures.
For Johnson County project, as shown in Table 10-10 and Figure 10-27, RAP
materials can be considered fine with a small amount of fine RAP materials passing 0.075
mm sieve. All RAP materials passed 38.1mm sieve and 3.0% of RAP materials were
retained on the 25mm sieve. RAP materials can be considered the most fine compared to
RAP materials from the other two project sites. As shown in Figure 10-27, the two sets
of RAP materials collected at the same time show consistency in their gradations.
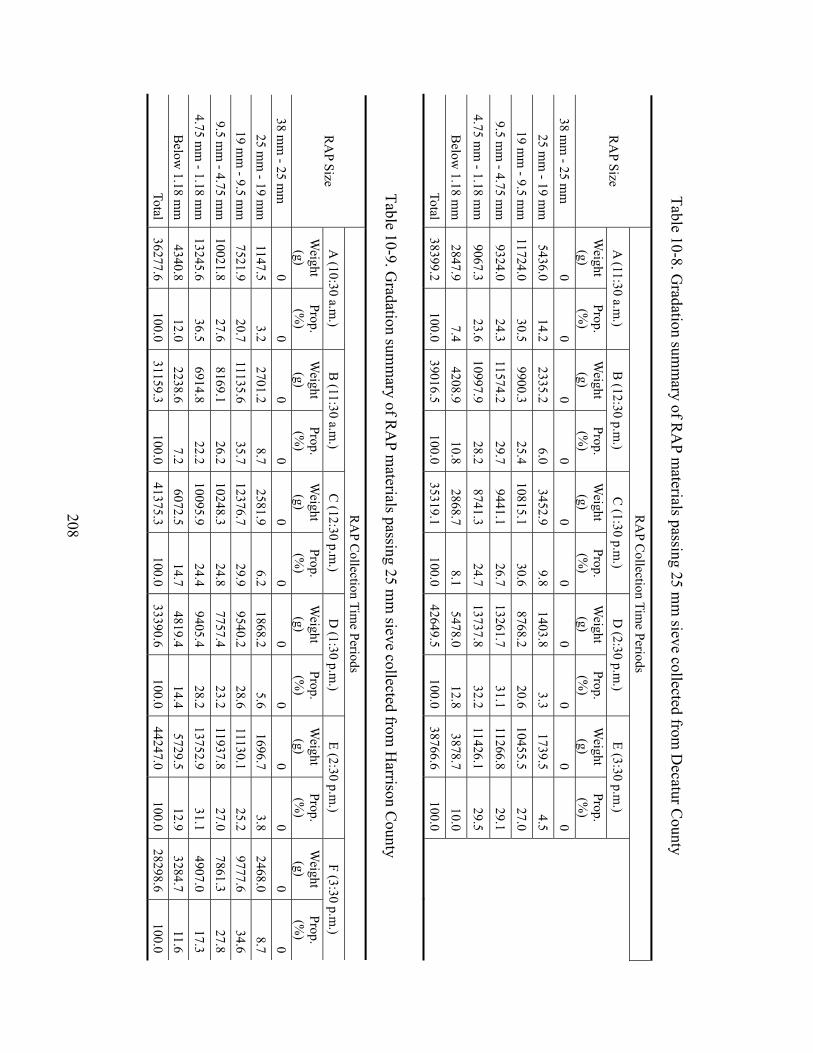
208
Table 10-8. Gradation sum
mary of R
AP m
aterials passing 25 mm
sieve collected from D
ecatur County
RA
P Collection Tim
e Periods
A (11:30 a.m
.) B
(12:30 p.m.)
C (1:30 p.m
.) D
(2:30 p.m.)
E (3:30 p.m.)
RA
P Size W
eight (g)
Prop. (%
) W
eight (g)
Prop. (%
) W
eight (g)
Prop. (%
) W
eight (g)
Prop. (%
) W
eight (g)
Prop. (%
)
38 mm
- 25 mm
0
0 0
0 0
0 0
0 0
0
25 m
m - 19 m
m
5436.0 14.2
2335.2 6.0
3452.9 9.8
1403.8 3.3
1739.5 4.5
19 mm
- 9.5 mm
11724.0
30.5 9900.3
25.4 10815.1
30.6 8768.2
20.6 10455.5
27.0
9.5 m
m - 4.75 m
m
9324.0 24.3
11574.2 29.7
9441.1 26.7
13261.7 31.1
11266.8 29.1
4.75 mm
- 1.18 mm
9067.3
23.6 10997.9
28.2 8741.3
24.7 13737.8
32.2 11426.1
29.5
Below
1.18 mm
2847.9
7.4 4208.9
10.8 2868.7
8.1 5478.0
12.8 3878.7
10.0
Total
38399.2 100.0
39016.5 100.0
35319.1 100.0
42649.5 100.0
38766.6 100.0
Table 10-9. Gradation sum
mary of R
AP m
aterials passing 25 mm
sieve collected from H
arrison County
RA
P Collection Tim
e Periods A
(10:30 a.m.)
B (11:30 a.m
.) C
(12:30 p.m.)
D (1:30 p.m
.) E (2:30 p.m
.) F (3:30 p.m
.) R
AP Size
Weight (g)
Prop. (%
) W
eight (g)
Prop. (%
) W
eight (g)
Prop. (%
) W
eight (g)
Prop. (%
) W
eight (g)
Prop. (%
) W
eight (g)
Prop. (%
) 38 m
m - 25 m
m
0 0
0 0
0 0
0 0
0 0
0 0
25 mm
- 19 mm
1147.5
3.2 2701.2
8.7 2581.9
6.2 1868.2
5.6 1696.7
3.8 2468.0
8.7 19 m
m - 9.5 m
m
7521.9 20.7
11135.6 35.7
12376.7 29.9
9540.2 28.6
11130.1 25.2
9777.6 34.6
9.5 mm
- 4.75 mm
10021.8
27.6 8169.1
26.2 10248.3
24.8 7757.4
23.2 11937.8
27.0 7861.3
27.8 4.75 m
m - 1.18 m
m
13245.6 36.5
6914.8 22.2
10095.9 24.4
9405.4 28.2
13752.9 31.1
4907.0 17.3
Below
1.18 mm
4340.8
12.0 2238.6
7.2 6072.5
14.7 4819.4
14.4 5729.5
12.9 3284.7
11.6 Total
36277.6 100.0
31159.3 100.0
41375.3 100.0
33390.6 100.0
44247.0 100.0
28298.6 100.0
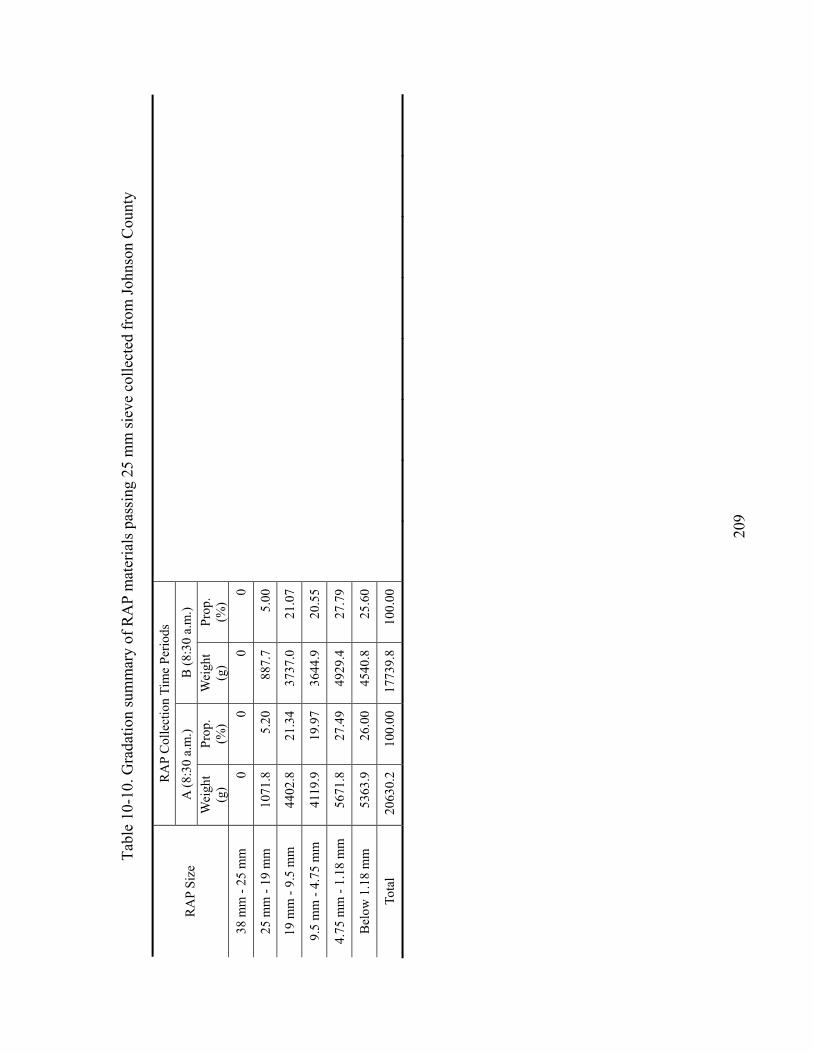
20
9
Tabl
e 10
-10.
Gra
datio
n su
mm
ary
of R
AP
mat
eria
ls p
assi
ng 2
5 m
m si
eve
colle
cted
from
John
son
Cou
nty
RA
P C
olle
ctio
n Ti
me
Perio
ds
A
(8:3
0 a.
m.)
B (8
:30
a.m
.)
R
AP
Size
W
eigh
t (g
) Pr
op.
(%)
Wei
ght
(g)
Prop
. (%
)
38 m
m -
25 m
m
0 0
0 0
25 m
m -
19 m
m
1071
.8
5.20
88
7.7
5.00
19
mm
- 9.
5 m
m
4402
.8
21.3
4 37
37.0
21
.07
9.5
mm
- 4.
75 m
m
4119
.9
19.9
7 36
44.9
20
.55
4.75
mm
- 1.
18 m
m
5671
.8
27.4
9 49
29.4
27
.79
Bel
ow 1
.18
mm
53
63.9
26
.00
4540
.8
25.6
0
To
tal
2063
0.2
100.
00
1773
9.8
100.
00
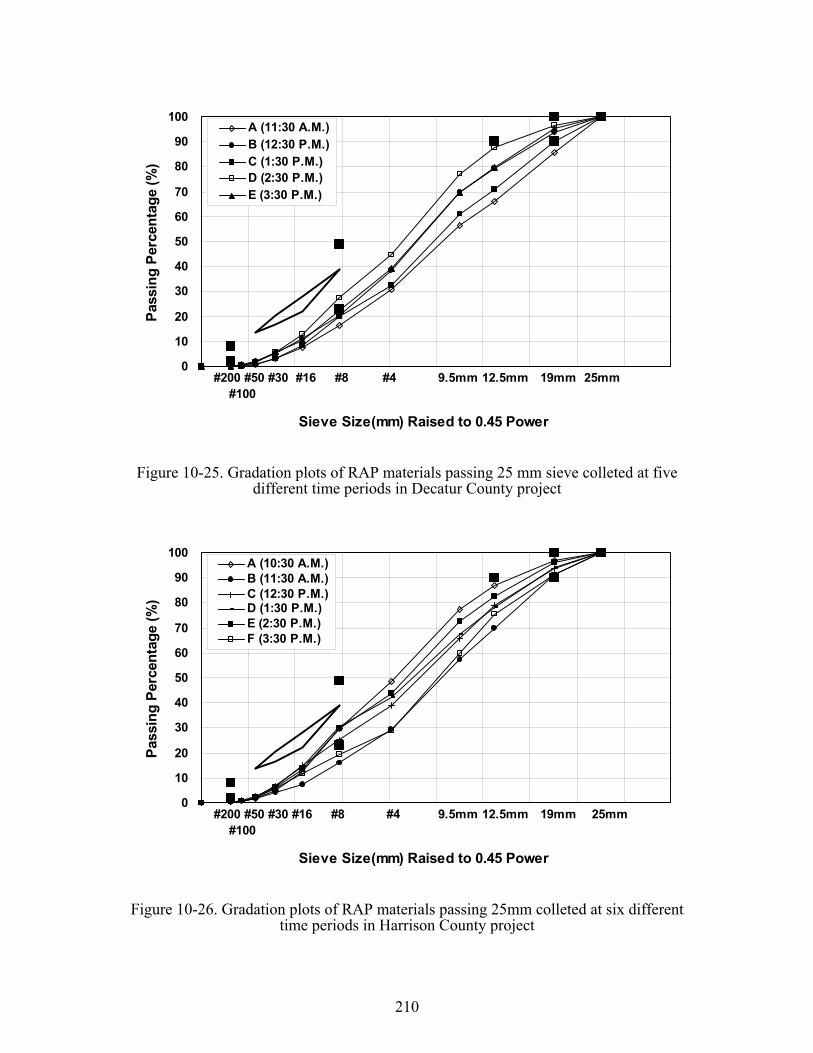
210
0
10
20
30
40
50
60
70
80
90
100
Sieve Size(mm) Raised to 0.45 Power
Pass
ing
Perc
enta
ge (%
)A (11:30 A.M.)B (12:30 P.M.)C (1:30 P.M.)D (2:30 P.M.)E (3:30 P.M.)
#200 #50 #30 #16 #8 #4 9.5mm 12.5mm 19mm 25mm#100
Figure 10-25. Gradation plots of RAP materials passing 25 mm sieve colleted at five different time periods in Decatur County project
0
10
20
30
40
50
60
70
80
90
100
Sieve Size(mm) Raised to 0.45 Power
Pass
ing
Perc
enta
ge (%
)
A (10:30 A.M.)B (11:30 A.M.)C (12:30 P.M.)D (1:30 P.M.)E (2:30 P.M.)F (3:30 P.M.)
#200 #50 #30 #16 #8 #4 9.5mm 12.5mm 19mm 25mm#100
Figure 10-26. Gradation plots of RAP materials passing 25mm colleted at six different time periods in Harrison County project
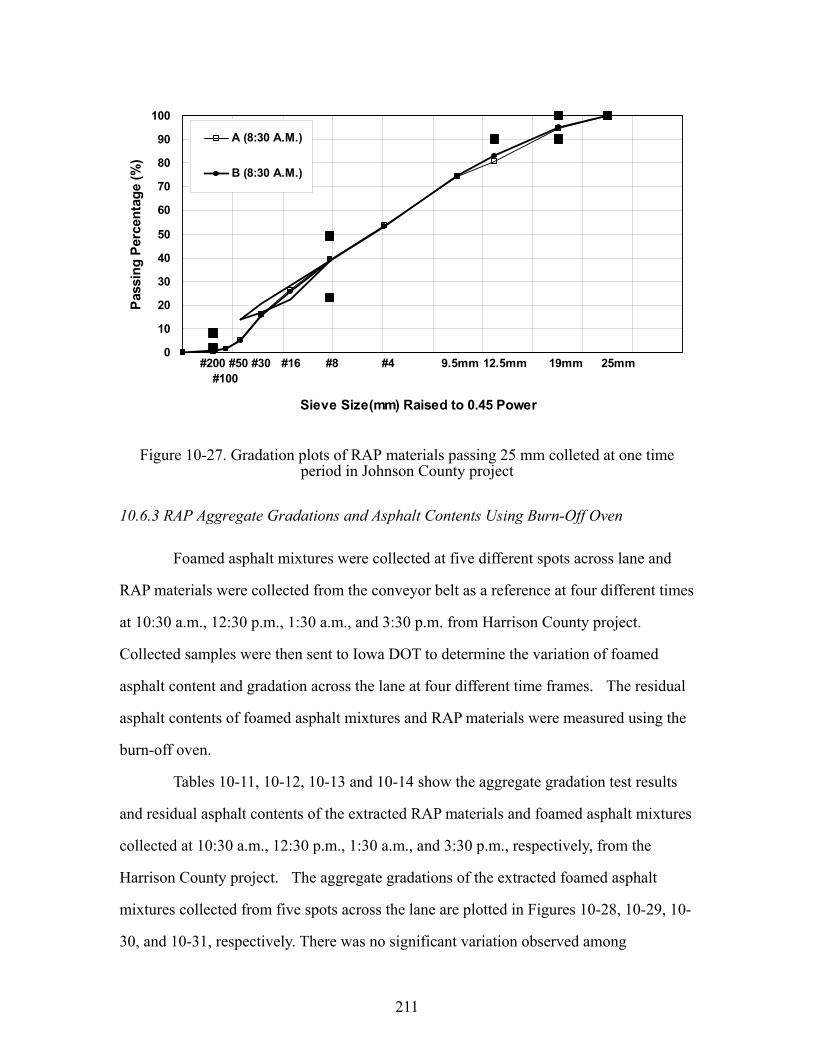
211
0
10
20
30
40
50
60
70
80
90
100
Sieve Size(mm) Raised to 0.45 Power
Pass
ing
Perc
enta
ge (%
)A (8:30 A.M.)
B (8:30 A.M.)
#200 #50 #30 #16 #8 #4 9.5mm 12.5mm 19mm 25mm#100
Figure 10-27. Gradation plots of RAP materials passing 25 mm colleted at one time period in Johnson County project
10.6.3 RAP Aggregate Gradations and Asphalt Contents Using Burn-Off Oven
Foamed asphalt mixtures were collected at five different spots across lane and
RAP materials were collected from the conveyor belt as a reference at four different times
at 10:30 a.m., 12:30 p.m., 1:30 a.m., and 3:30 p.m. from Harrison County project.
Collected samples were then sent to Iowa DOT to determine the variation of foamed
asphalt content and gradation across the lane at four different time frames. The residual
asphalt contents of foamed asphalt mixtures and RAP materials were measured using the
burn-off oven.
Tables 10-11, 10-12, 10-13 and 10-14 show the aggregate gradation test results
and residual asphalt contents of the extracted RAP materials and foamed asphalt mixtures
collected at 10:30 a.m., 12:30 p.m., 1:30 a.m., and 3:30 p.m., respectively, from the
Harrison County project. The aggregate gradations of the extracted foamed asphalt
mixtures collected from five spots across the lane are plotted in Figures 10-28, 10-29, 10-
30, and 10-31, respectively. There was no significant variation observed among
212
gradations depending on the locations across the lane and different milling times during
the day.
As shown in Figure 10-32, the residual asphalt contents of the foamed asphalt
mixtures varied across the lane and different time frames. Particularly, at 12:30 p.m., the
residual asphalt content from the foamed asphalt mixtures collected from the left-hand
side of the lane was much less than that of center and right-hand side of the lane. As can
be seen in Figure 10-33, the foamed asphalt contents are computed by subtracting the
residual asphalt content from RAP materials form that of the foamed asphalt mixture and
they are plotted against the locations across the lane. This plot confirms that the
variations in the residual asphalt contents of the foamed asphalt mixtures were caused by
the variations in foamed asphalt sprayed during the CIR-foam construction process.
Overall, the applied foamed asphalt contents ranged from 2.64% to 2.94%, which is
consistently higher than 2.5% originally specified by Iowa DOT.
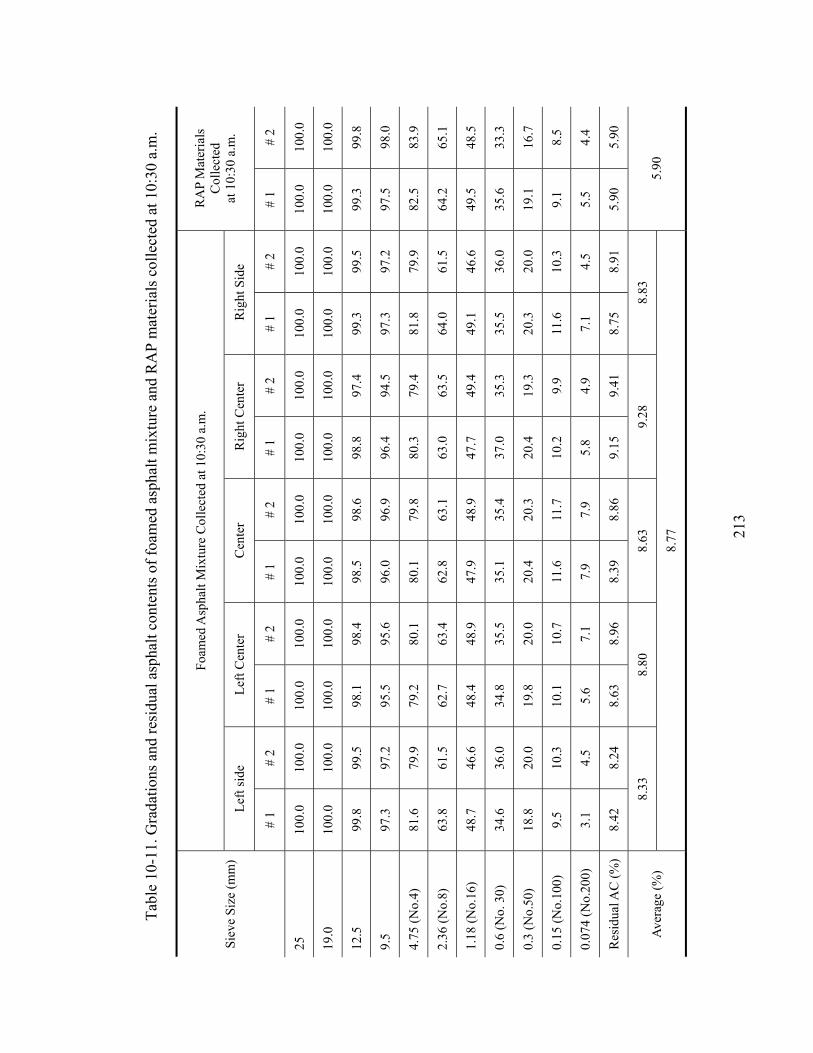
21
3
Tabl
e 10
-11.
Gra
datio
ns a
nd re
sidu
al a
spha
lt co
nten
ts o
f foa
med
asp
halt
mix
ture
and
RA
P m
ater
ials
col
lect
ed a
t 10:
30 a
.m.
Foam
ed A
spha
lt M
ixtu
re C
olle
cted
at 1
0:30
a.m
.
Left
side
Le
ft C
ente
r C
ente
r R
ight
Cen
ter
Rig
ht S
ide
RA
P M
ater
ials
C
olle
cted
at
10:
30 a
.m.
Siev
e Si
ze (m
m)
# 1
# 2
# 1
# 2
# 1
# 2
# 1
# 2
# 1
# 2
# 1
# 2
25
100.
0 10
0.0
100.
0 10
0.0
100.
0 10
0.0
100.
0 10
0.0
100.
0 10
0.0
100.
0 10
0.0
19.0
10
0.0
100.
0 10
0.0
100.
0 10
0.0
100.
0 10
0.0
100.
0 10
0.0
100.
0 10
0.0
100.
0
12.5
99
.8
99.5
98
.1
98.4
98
.5
98.6
98
.8
97.4
99
.3
99.5
99
.3
99.8
9.5
97.3
97
.2
95.5
95
.6
96.0
96
.9
96.4
94
.5
97.3
97
.2
97.5
98
.0
4.75
(No.
4)
81.6
79
.9
79.2
80
.1
80.1
79
.8
80.3
79
.4
81.8
79
.9
82.5
83
.9
2.36
(No.
8)
63.8
61
.5
62.7
63
.4
62.8
63
.1
63.0
63
.5
64.0
61
.5
64.2
65
.1
1.18
(No.
16)
48.7
46
.6
48.4
48
.9
47.9
48
.9
47.7
49
.4
49.1
46
.6
49.5
48
.5
0.6
(No.
30)
34
.6
36.0
34
.8
35.5
35
.1
35.4
37
.0
35.3
35
.5
36.0
35
.6
33.3
0.3
(No.
50)
18.8
20
.0
19.8
20
.0
20.4
20
.3
20.4
19
.3
20.3
20
.0
19.1
16
.7
0.15
(No.
100)
9.
5 10
.3
10.1
10
.7
11.6
11
.7
10.2
9.
9 11
.6
10.3
9.
1 8.
5
0.07
4 (N
o.20
0)
3.1
4.5
5.6
7.1
7.9
7.9
5.8
4.9
7.1
4.5
5.5
4.4
Res
idua
l AC
(%)
8.42
8.
24
8.63
8.
96
8.39
8.
86
9.15
9.
41
8.75
8.
91
5.90
5.
90
8.33
8.
80
8.63
9.
28
8.83
Av
erag
e (%
) 8.
77
5.90
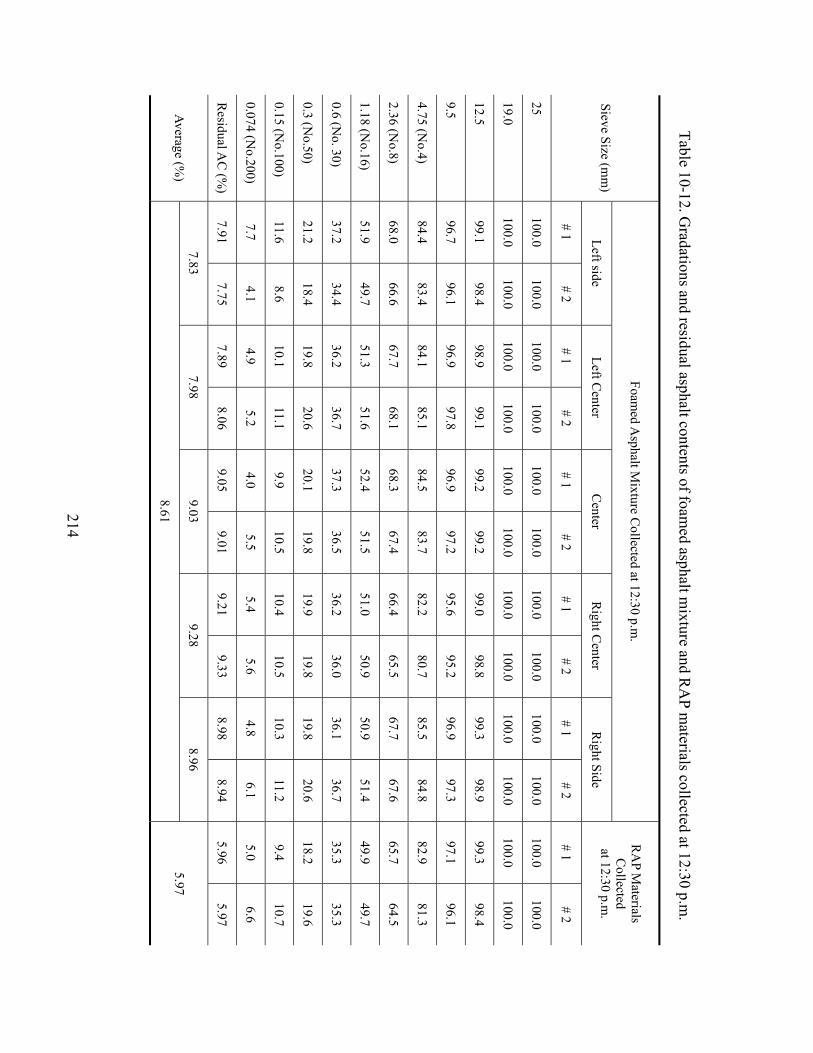
214
Table 10-12. Gradations and residual asphalt contents of foam
ed asphalt mixture and R
AP m
aterials collected at 12:30 p.m.
Foamed A
sphalt Mixture C
ollected at 12:30 p.m.
Left side Left C
enter C
enter R
ight Center
Right Side
RA
P Materials
Collected
at 12:30 p.m.
Sieve Size (mm
)
# 1 # 2
# 1 # 2
# 1 # 2
# 1 # 2
# 1 # 2
# 1 # 2
25 100.0
100.0 100.0
100.0 100.0
100.0 100.0
100.0 100.0
100.0 100.0
100.0
19.0 100.0
100.0 100.0
100.0 100.0
100.0 100.0
100.0 100.0
100.0 100.0
100.0
12.5 99.1
98.4 98.9
99.1 99.2
99.2 99.0
98.8 99.3
98.9 99.3
98.4
9.5 96.7
96.1 96.9
97.8 96.9
97.2 95.6
95.2 96.9
97.3 97.1
96.1
4.75 (No.4)
84.4 83.4
84.1 85.1
84.5 83.7
82.2 80.7
85.5 84.8
82.9 81.3
2.36 (No.8)
68.0 66.6
67.7 68.1
68.3 67.4
66.4 65.5
67.7 67.6
65.7 64.5
1.18 (No.16)
51.9 49.7
51.3 51.6
52.4 51.5
51.0 50.9
50.9 51.4
49.9 49.7
0.6 (No. 30)
37.2 34.4
36.2 36.7
37.3 36.5
36.2 36.0
36.1 36.7
35.3 35.3
0.3 (No.50)
21.2 18.4
19.8 20.6
20.1 19.8
19.9 19.8
19.8 20.6
18.2 19.6
0.15 (No.100)
11.6 8.6
10.1 11.1
9.9 10.5
10.4 10.5
10.3 11.2
9.4 10.7
0.074 (No.200)
7.7 4.1
4.9 5.2
4.0 5.5
5.4 5.6
4.8 6.1
5.0 6.6
Residual A
C (%
) 7.91
7.75 7.89
8.06 9.05
9.01 9.21
9.33 8.98
8.94 5.96
5.97
7.83 7.98
9.03 9.28
8.96 Average (%
) 8.61
5.97
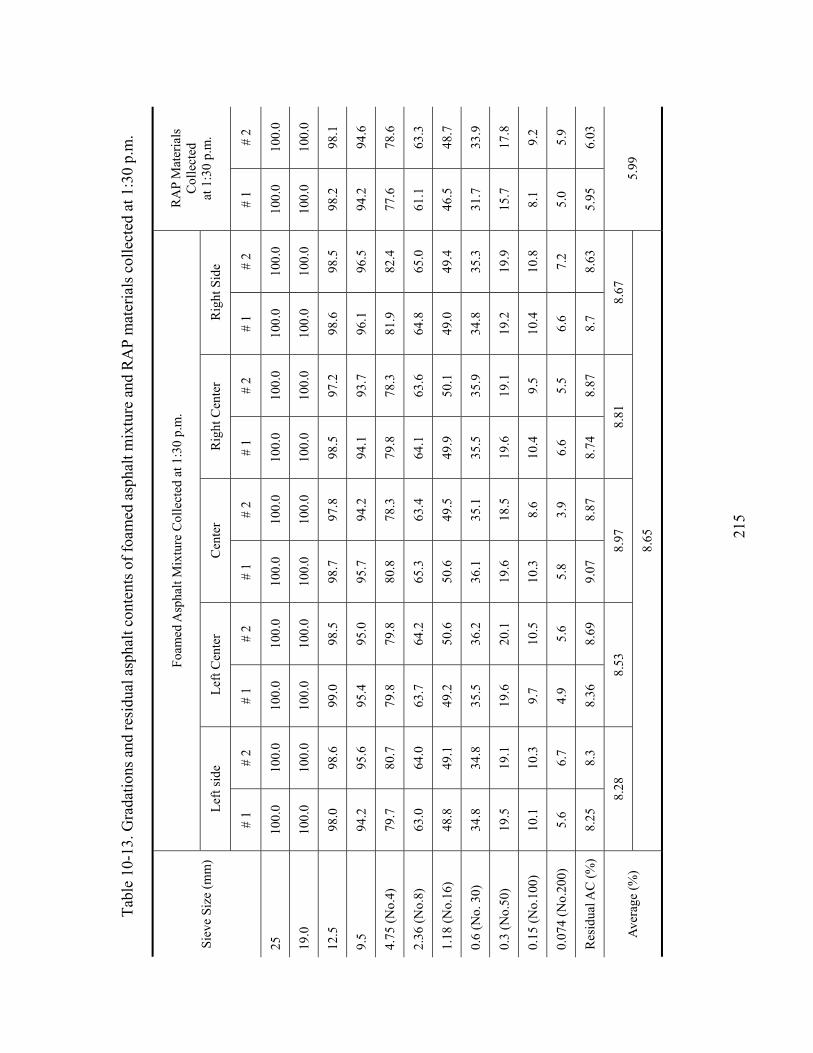
21
5
Tabl
e 10
-13.
Gra
datio
ns a
nd re
sidu
al a
spha
lt co
nten
ts o
f foa
med
asp
halt
mix
ture
and
RA
P m
ater
ials
col
lect
ed a
t 1:3
0 p.
m.
Foam
ed A
spha
lt M
ixtu
re C
olle
cted
at 1
:30
p.m
.
Left
side
Le
ft C
ente
r C
ente
r R
ight
Cen
ter
Rig
ht S
ide
RA
P M
ater
ials
C
olle
cted
at
1:3
0 p.
m.
Siev
e Si
ze (m
m)
# 1
# 2
# 1
# 2
# 1
# 2
# 1
# 2
# 1
# 2
# 1
# 2
25
100.
0 10
0.0
100.
0 10
0.0
100.
0 10
0.0
100.
0 10
0.0
100.
0 10
0.0
100.
0 10
0.0
19.0
10
0.0
100.
0 10
0.0
100.
0 10
0.0
100.
0 10
0.0
100.
0 10
0.0
100.
0 10
0.0
100.
0
12.5
98
.0
98.6
99
.0
98.5
98
.7
97.8
98
.5
97.2
98
.6
98.5
98
.2
98.1
9.5
94.2
95
.6
95.4
95
.0
95.7
94
.2
94.1
93
.7
96.1
96
.5
94.2
94
.6
4.75
(No.
4)
79.7
80
.7
79.8
79
.8
80.8
78
.3
79.8
78
.3
81.9
82
.4
77.6
78
.6
2.36
(No.
8)
63.0
64
.0
63.7
64
.2
65.3
63
.4
64.1
63
.6
64.8
65
.0
61.1
63
.3
1.18
(No.
16)
48.8
49
.1
49.2
50
.6
50.6
49
.5
49.9
50
.1
49.0
49
.4
46.5
48
.7
0.6
(No.
30)
34
.8
34.8
35
.5
36.2
36
.1
35.1
35
.5
35.9
34
.8
35.3
31
.7
33.9
0.3
(No.
50)
19.5
19
.1
19.6
20
.1
19.6
18
.5
19.6
19
.1
19.2
19
.9
15.7
17
.8
0.15
(No.
100)
10
.1
10.3
9.
7 10
.5
10.3
8.
6 10
.4
9.5
10.4
10
.8
8.1
9.2
0.07
4 (N
o.20
0)
5.6
6.7
4.9
5.6
5.8
3.9
6.6
5.5
6.6
7.2
5.0
5.9
Res
idua
l AC
(%)
8.25
8.
3 8.
36
8.69
9.
07
8.87
8.
74
8.87
8.
7 8.
63
5.95
6.
03
8.28
8.
53
8.97
8.
81
8.67
Av
erag
e (%
) 8.
65
5.99
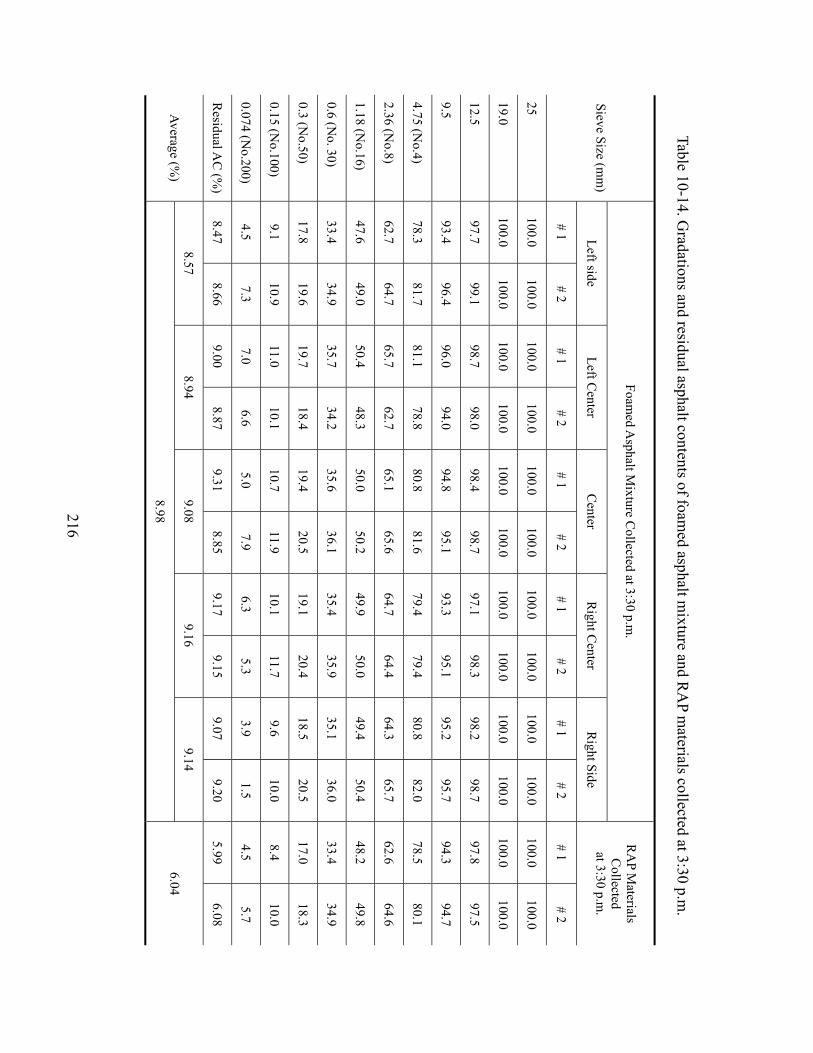
216
Table 10-14. Gradations and residual asphalt contents of foam
ed asphalt mixture and R
AP m
aterials collected at 3:30 p.m.
Foamed A
sphalt Mixture C
ollected at 3:30 p.m.
Left side Left C
enter C
enter R
ight Center
Right Side
RA
P Materials
Collected
at 3:30 p.m.
Sieve Size (mm
)
# 1 # 2
# 1 # 2
# 1 # 2
# 1 # 2
# 1 # 2
# 1 # 2
25 100.0
100.0 100.0
100.0 100.0
100.0 100.0
100.0 100.0
100.0 100.0
100.0
19.0 100.0
100.0 100.0
100.0 100.0
100.0 100.0
100.0 100.0
100.0 100.0
100.0
12.5 97.7
99.1 98.7
98.0 98.4
98.7 97.1
98.3 98.2
98.7 97.8
97.5
9.5 93.4
96.4 96.0
94.0 94.8
95.1 93.3
95.1 95.2
95.7 94.3
94.7
4.75 (No.4)
78.3 81.7
81.1 78.8
80.8 81.6
79.4 79.4
80.8 82.0
78.5 80.1
2.36 (No.8)
62.7 64.7
65.7 62.7
65.1 65.6
64.7 64.4
64.3 65.7
62.6 64.6
1.18 (No.16)
47.6 49.0
50.4 48.3
50.0 50.2
49.9 50.0
49.4 50.4
48.2 49.8
0.6 (No. 30)
33.4 34.9
35.7 34.2
35.6 36.1
35.4 35.9
35.1 36.0
33.4 34.9
0.3 (No.50)
17.8 19.6
19.7 18.4
19.4 20.5
19.1 20.4
18.5 20.5
17.0 18.3
0.15 (No.100)
9.1 10.9
11.0 10.1
10.7 11.9
10.1 11.7
9.6 10.0
8.4 10.0
0.074 (No.200)
4.5 7.3
7.0 6.6
5.0 7.9
6.3 5.3
3.9 1.5
4.5 5.7
Residual A
C (%
) 8.47
8.66 9.00
8.87 9.31
8.85 9.17
9.15 9.07
9.20 5.99
6.08
8.57 8.94
9.08 9.16
9.14 Average (%
) 8.98
6.04
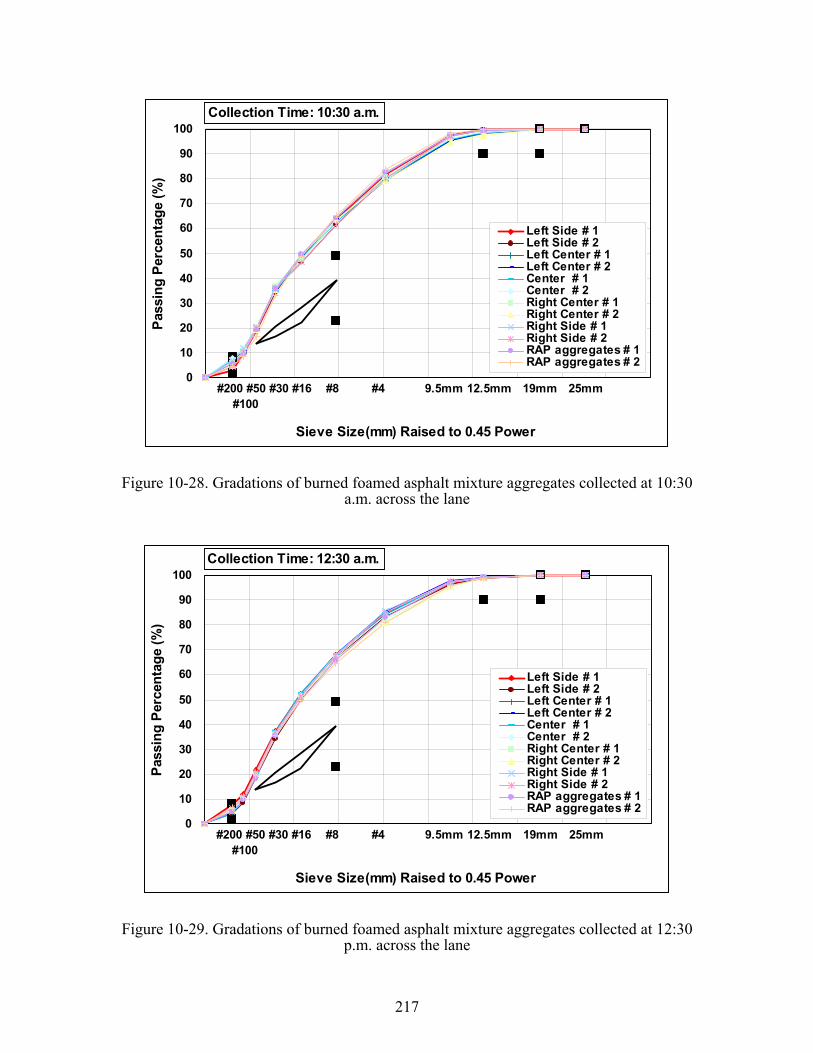
217
0
10
20
30
40
50
60
70
80
90
100
Sieve Size(mm) Raised to 0.45 Power
Pass
ing
Perc
enta
ge (%
)
Left Side # 1Left Side # 2Left Center # 1Left Center # 2Center # 1Center # 2Right Center # 1Right Center # 2Right Side # 1Right Side # 2RAP aggregates # 1RAP aggregates # 2
#200 #50 #30 #16 #8 #4 9.5mm 12.5mm 19mm 25mm#100
Collection Time: 10:30 a.m.
Figure 10-28. Gradations of burned foamed asphalt mixture aggregates collected at 10:30 a.m. across the lane
0
10
20
30
40
50
60
70
80
90
100
Sieve Size(mm) Raised to 0.45 Power
Pass
ing
Perc
enta
ge (%
)
Left Side # 1Left Side # 2Left Center # 1Left Center # 2Center # 1Center # 2Right Center # 1Right Center # 2Right Side # 1Right Side # 2RAP aggregates # 1RAP aggregates # 2
#200 #50 #30 #16 #8 #4 9.5mm 12.5mm 19mm 25mm#100
Collection Time: 12:30 a.m.
Figure 10-29. Gradations of burned foamed asphalt mixture aggregates collected at 12:30 p.m. across the lane
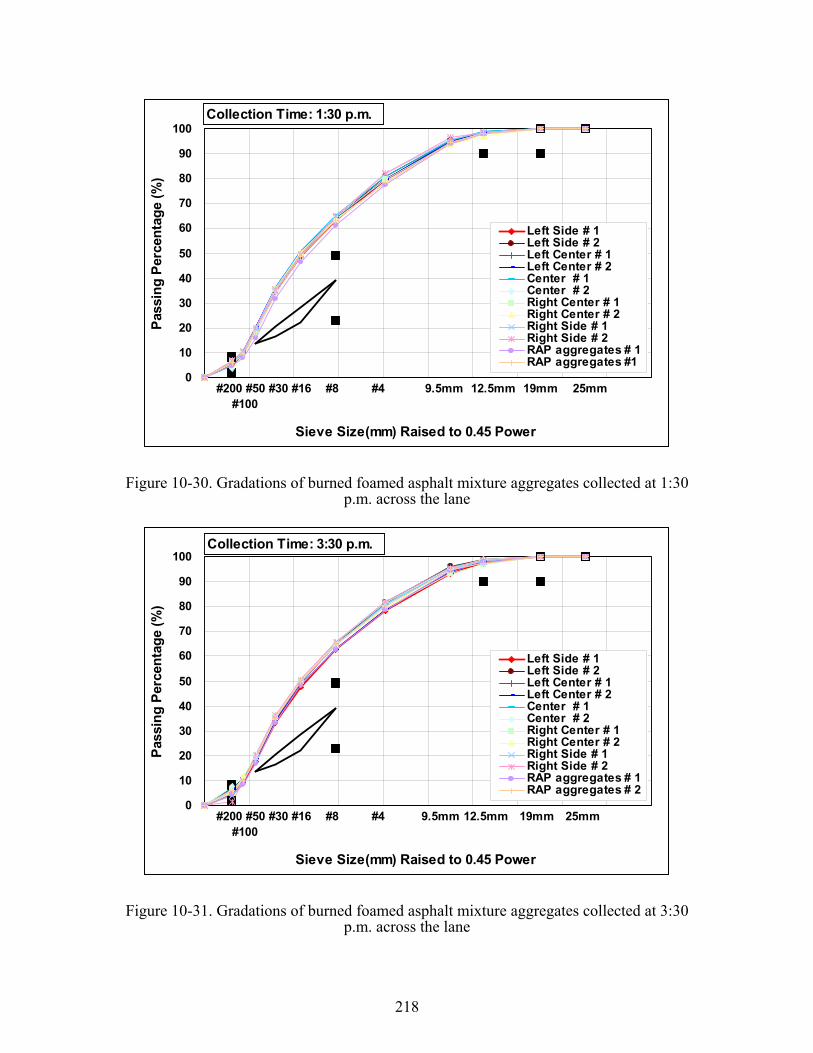
218
0
10
20
30
40
50
60
70
80
90
100
Sieve Size(mm) Raised to 0.45 Power
Pass
ing
Perc
enta
ge (%
)
Left Side # 1Left Side # 2Left Center # 1Left Center # 2Center # 1Center # 2Right Center # 1Right Center # 2Right Side # 1Right Side # 2RAP aggregates # 1RAP aggregates #1
#200 #50 #30 #16 #8 #4 9.5mm 12.5mm 19mm 25mm#100
Collection Time: 1:30 p.m.
Figure 10-30. Gradations of burned foamed asphalt mixture aggregates collected at 1:30 p.m. across the lane
0
10
20
30
40
50
60
70
80
90
100
Sieve Size(mm) Raised to 0.45 Power
Pass
ing
Perc
enta
ge (%
)
Left Side # 1Left Side # 2Left Center # 1Left Center # 2Center # 1Center # 2Right Center # 1Right Center # 2Right Side # 1Right Side # 2RAP aggregates # 1RAP aggregates # 2
#200 #50 #30 #16 #8 #4 9.5mm 12.5mm 19mm 25mm#100
Collection Time: 3:30 p.m.
Figure 10-31. Gradations of burned foamed asphalt mixture aggregates collected at 3:30 p.m. across the lane
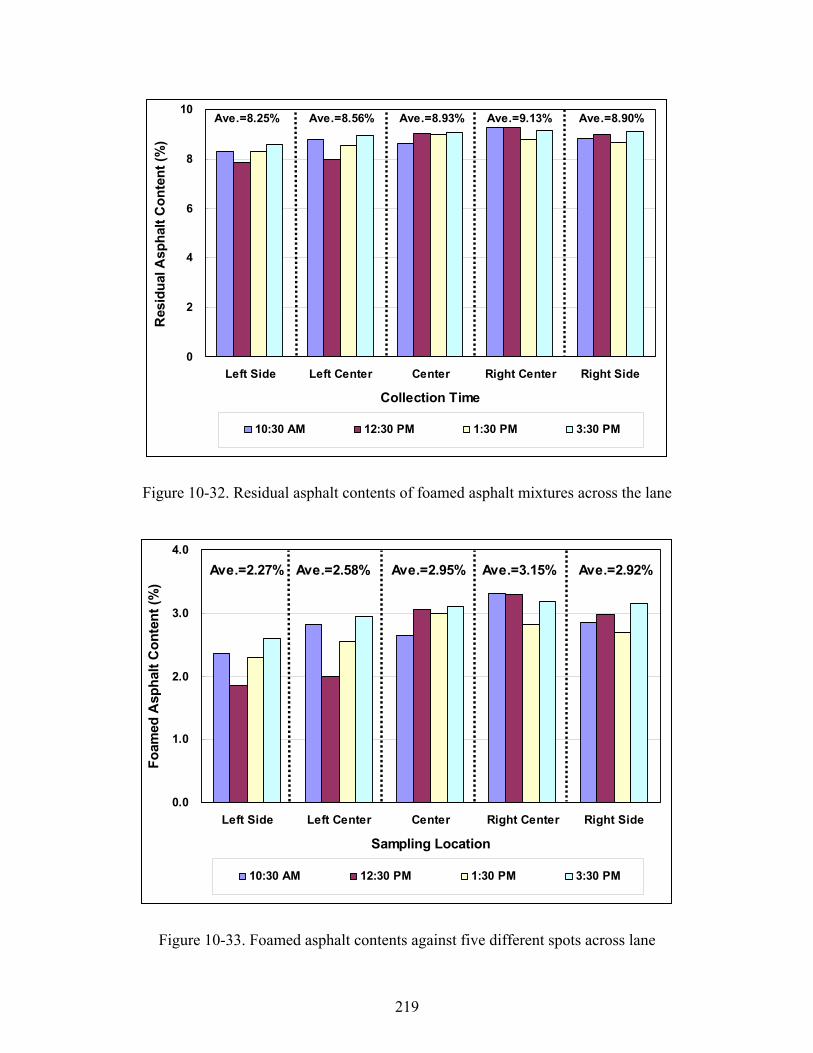
219
0
2
4
6
8
10
Left Side Left Center Center Right Center Right Side
Collection Time
Res
idua
l Asp
halt
Con
tent
(%)
10:30 AM 12:30 PM 1:30 PM 3:30 PM
Ave.=8.25% Ave.=8.56% Ave.=8.93% Ave.=9.13% Ave.=8.90%
Figure 10-32. Residual asphalt contents of foamed asphalt mixtures across the lane
0.0
1.0
2.0
3.0
4.0
Left Side Left Center Center Right Center Right Side
Sampling Location
Foam
ed A
spha
lt C
onte
nt (%
)
10:30 AM 12:30 PM 1:30 PM 3:30 PM
Ave.=2.27% Ave.=2.58% Ave.=2.95% Ave.=3.15% Ave.=2.92%
Figure 10-33. Foamed asphalt contents against five different spots across lane

220
10.6.4 Evaluation of CIR-foam Mixtures
As summarized in Table 10-15, the foamed asphalt mixtures from three different
Counties were compacted at 30 gyrations and were cured at 40°C oven for three days and
at 60°C oven for two days. The cured specimens were placed in 25˚C water bath for a
total of 1.5 hours, 30 minutes without vacuum, 30 minutes with 20-mm Hg vacuum, and
30 minutes without vacuum. Saturated specimens were tested to determine their “wet”
indirect tensile strengths. Bulk specific gravities (Gmb) of the foamed asphalt mixtures
were estimated by measuring volume of the compacted specimens. The maximum
specific gravities were measured at each of collection time.
Table 10-15. Number of specimens for evaluation of field foamed asphalt mixtures
Decatur County
Collection Time Curing
Temperature
Testing
Condition 11:30 a.m. 12:30 a.m. 1:30 p.m. 2:30 p.m. 3:30 p.m.
40 °C Wet 3 3 3 3 3
60 °C Wet 3 3 3 3 3
Harrison County
Collection Time Curing
Temperature
Testing
Condition 10:30 a.m.
11:30 a.m.
12:30 a.m.
1:30 p.m.
2:30 p.m.
3:30 p.m.
40 °C Wet 2 2 2 2 2 2
60 °C Wet 2 2 2 2 2 2
Johnson County
Collection Time Curing
Temperature
Testing
Condition 9:30 a.m.
40 °C Wet 3
60 °C Wet 3
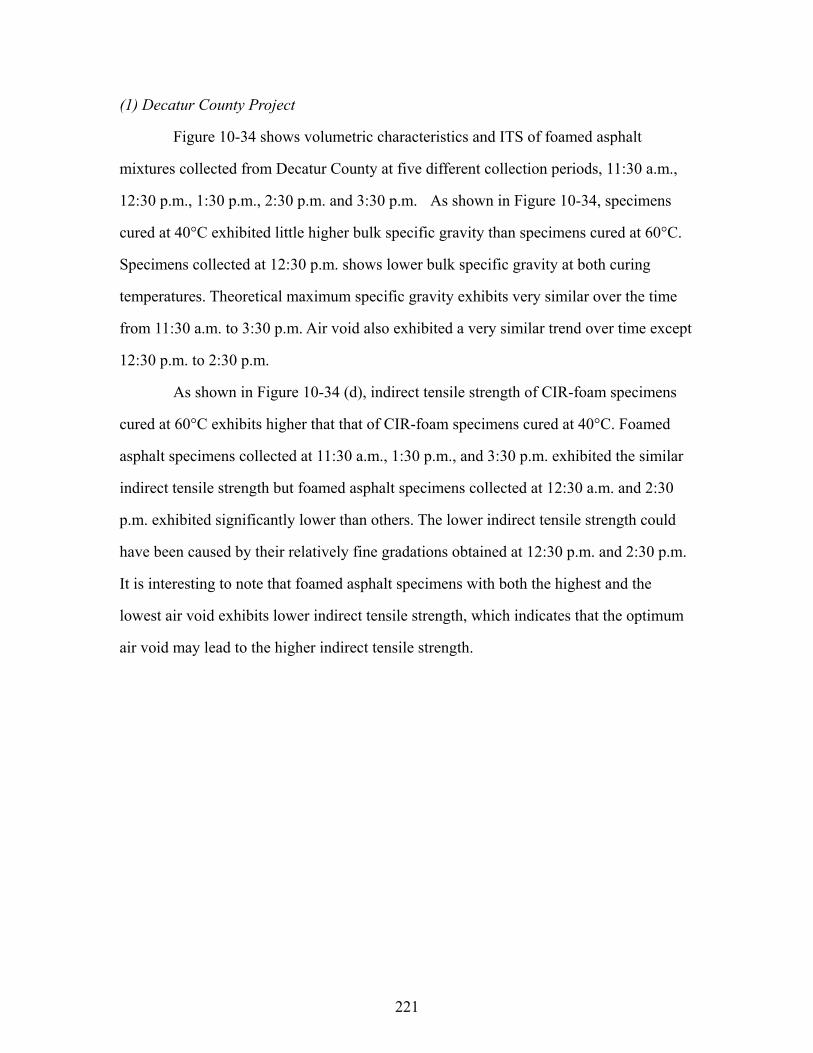
221
(1) Decatur County Project
Figure 10-34 shows volumetric characteristics and ITS of foamed asphalt
mixtures collected from Decatur County at five different collection periods, 11:30 a.m.,
12:30 p.m., 1:30 p.m., 2:30 p.m. and 3:30 p.m. As shown in Figure 10-34, specimens
cured at 40°C exhibited little higher bulk specific gravity than specimens cured at 60°C.
Specimens collected at 12:30 p.m. shows lower bulk specific gravity at both curing
temperatures. Theoretical maximum specific gravity exhibits very similar over the time
from 11:30 a.m. to 3:30 p.m. Air void also exhibited a very similar trend over time except
12:30 p.m. to 2:30 p.m.
As shown in Figure 10-34 (d), indirect tensile strength of CIR-foam specimens
cured at 60°C exhibits higher that that of CIR-foam specimens cured at 40°C. Foamed
asphalt specimens collected at 11:30 a.m., 1:30 p.m., and 3:30 p.m. exhibited the similar
indirect tensile strength but foamed asphalt specimens collected at 12:30 a.m. and 2:30
p.m. exhibited significantly lower than others. The lower indirect tensile strength could
have been caused by their relatively fine gradations obtained at 12:30 p.m. and 2:30 p.m.
It is interesting to note that foamed asphalt specimens with both the highest and the
lowest air void exhibits lower indirect tensile strength, which indicates that the optimum
air void may lead to the higher indirect tensile strength.
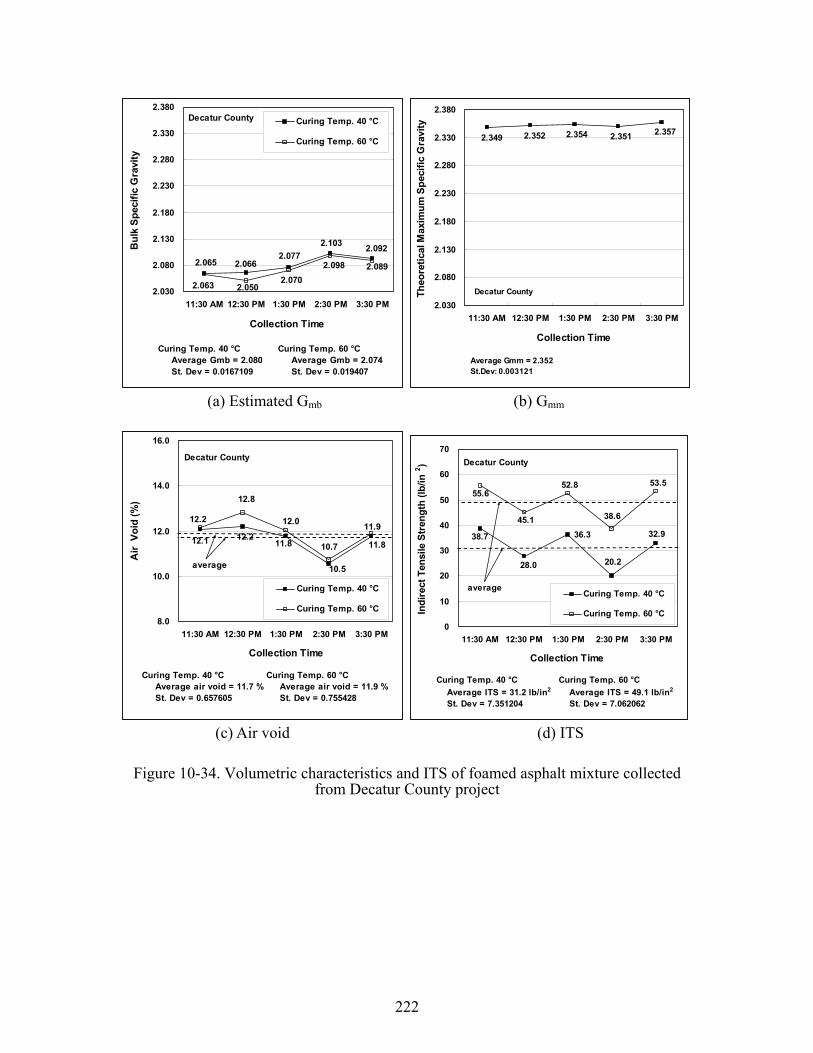
222
2.065 2.0662.077
2.103 2.092
2.063 2.0502.070
2.098 2.089
2.030
2.080
2.130
2.180
2.230
2.280
2.330
2.380
11:30 AM 12:30 PM 1:30 PM 2:30 PM 3:30 PM
Collection Time
Bul
k Sp
ecifi
c G
ravi
tyCuring Temp. 40 °C
Curing Temp. 60 °C
Decatur County
Curing Temp. 40 °C Average Gmb = 2.080 St. Dev = 0.0167109
Curing Temp. 60 °C Average Gmb = 2.074 St. Dev = 0.019407
2.3512.349 2.3542.352 2.357
2.030
2.080
2.130
2.180
2.230
2.280
2.330
2.380
11:30 AM 12:30 PM 1:30 PM 2:30 PM 3:30 PM
Collection Time
Theo
retic
al M
axim
um S
peci
fic G
ravi
ty
Decatur County
Average Gmm = 2.352St.Dev: 0.003121
(a) Estimated Gmb (b) Gmm
11.8
10.5
11.812.212.1
12.2
10.7
11.912.0
12.8
8.0
10.0
12.0
14.0
16.0
11:30 AM 12:30 PM 1:30 PM 2:30 PM 3:30 PM
Collection Time
Air
Voi
d (%
)
Curing Temp. 40 °C
Curing Temp. 60 °C
Decatur County
Curing Temp. 40 °C Average air void = 11.7 % St. Dev = 0.657605
Curing Temp. 60 °C Average air void = 11.9 % St. Dev = 0.755428
average
36.3 32.9
20.228.0
38.7
53.5
38.6
52.8
45.1
55.6
0
10
20
30
40
50
60
70
11:30 AM 12:30 PM 1:30 PM 2:30 PM 3:30 PM
Collection Time
Indi
rect
Ten
sile
Str
engt
h (lb
/in2 )
Curing Temp. 40 °C
Curing Temp. 60 °C
Decatur County
Curing Temp. 40 °C Average ITS = 31.2 lb/in2
St. Dev = 7.351204
Curing Temp. 60 °C Average ITS = 49.1 lb/in2
St. Dev = 7.062062
average
(c) Air void (d) ITS
Figure 10-34. Volumetric characteristics and ITS of foamed asphalt mixture collected from Decatur County project

223
(2) Harrison County Project
Figure 10-35 shows volumetric characteristics and ITS of foamed asphalt
mixtures collected from the Harrison County project at six different collection periods,
10:30 a.m., 11:30 a.m., 12:30 p.m., 1:30 p.m., 2:30 p.m. and 3:30 p.m. As shown in
Figure 10-35, specimens cured at 40°C exhibited little higher bulk specific gravity than
those cured at 60°C. The specimens collected at 11:30 a.m. shows lower bulk specific
gravity at both curing temperatures because RAP gradation collected at 11:30 a.m.
exhibited the most coarse gradation. Theoretical maximum specific gravity exhibited very
similar over time from 10:30 a.m. to 3:30 p.m. Air void were also very consistent over
time except 11:30 a.m.
As shown in Figure 10-35 (d), indirect tensile strength of CIR-foam specimens
cured at 60°C exhibited higher that that of CIR-foam specimens cured at 40°C. Foamed
asphalt specimens collected at 11:30 a.m. exhibited the lowest indirect tensile strength at
both curing temperatures. It is interesting to note that the gradation at 11:30 a.m. was the
coarsest.
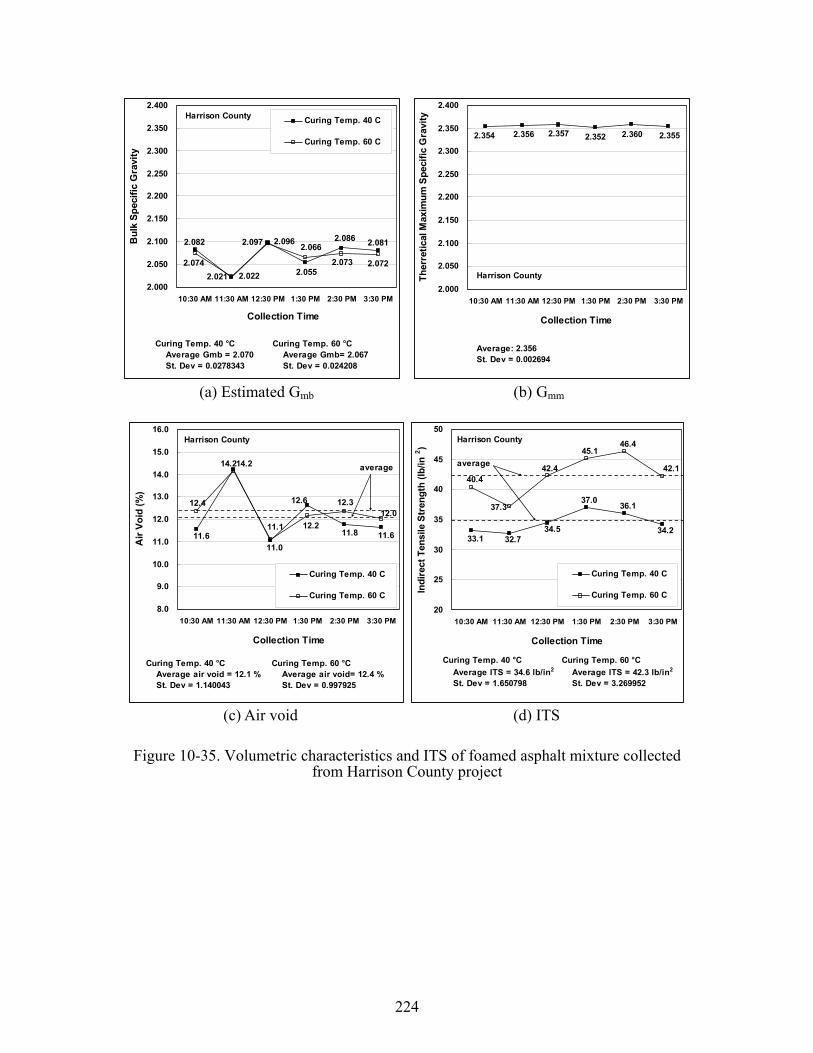
224
2.082
2.021
2.097
2.055
2.086 2.081
2.074
2.096
2.022
2.066
2.073 2.072
2.000
2.050
2.100
2.150
2.200
2.250
2.300
2.350
2.400
10:30 AM 11:30 AM 12:30 PM 1:30 PM 2:30 PM 3:30 PM
Collection Time
Bul
k Sp
ecifi
c G
ravi
tyCuring Temp. 40 C
Curing Temp. 60 C
Curing Temp. 40 °C Average Gmb = 2.070 St. Dev = 0.0278343
Curing Temp. 60 °C Average Gmb= 2.067 St. Dev = 0.024208
Harrison County
2.354 2.356 2.357 2.352 2.360 2.355
2.000
2.050
2.100
2.150
2.200
2.250
2.300
2.350
2.400
10:30 AM 11:30 AM 12:30 PM 1:30 PM 2:30 PM 3:30 PM
Collection Time
Ther
retic
al M
axim
um S
peci
fic G
ravi
ty
Harrison County
Average: 2.356St. Dev = 0.002694
(a) Estimated Gmb (b) Gmm
11.6
14.2
11.0
12.6
11.8 11.6
12.4
14.2
11.1 12.2
12.312.0
8.0
9.0
10.0
11.0
12.0
13.0
14.0
15.0
16.0
10:30 AM 11:30 AM 12:30 PM 1:30 PM 2:30 PM 3:30 PM
Collection Time
Air
Void
(%)
Curing Temp. 40 C
Curing Temp. 60 C
Curing Temp. 40 °C Average air void = 12.1 % St. Dev = 1.140043
Curing Temp. 60 °C Average air void= 12.4 % St. Dev = 0.997925
average
Harrison County
34.2
36.137.0
34.532.733.1
42.1
46.445.1
42.4
37.3
40.4
20
25
30
35
40
45
50
10:30 AM 11:30 AM 12:30 PM 1:30 PM 2:30 PM 3:30 PM
Collection Time
Indi
rect
Ten
sile
Str
engt
h (lb
/in2 )
Curing Temp. 40 C
Curing Temp. 60 C
Curing Temp. 40 °C Average ITS = 34.6 lb/in2
St. Dev = 1.650798
Curing Temp. 60 °C Average ITS = 42.3 lb/in2
St. Dev = 3.269952
average
Harrison County
(c) Air void (d) ITS
Figure 10-35. Volumetric characteristics and ITS of foamed asphalt mixture collected from Harrison County project
225
(3) Johnson County Project
Table 10-16 shows volumetric characteristics and ITS of foamed asphalt
mixtures collected from the Johnson County project collected at 9:30 a.m. The specimens
cured at 40°C and 60°C exhibited the similar bulk specific gravity and air void. Indirect
tensile strength of CIR-foam specimens cured at 60°C exhibited higher that that of CIR-
CIR-foam specimens cured at 40°C.
Table 10-16. Volumetric characteristics and ITS of foamed asphalt mixtures collected in the Johnson County project
Curing Condition : 40°C for 3days
Collection Time Bulk Specific Gravity
Theoretical Maximum Specific Gravity Air Void (%) ITS
(lb/in2)
9:30 a.m. 2.072 2.388 13.2 24.0
Curing Condition : 60°C for 2days
Collection Time Bulk Specific Gravity
Theoretical Maximum Specific Gravity Air Void (%) ITS
(lb/in2)
9:30 a.m. 2.074 2.388 13.2 40.9
Figure 10-36 shows volumetric characteristics and ITS of foamed asphalt
mixtures collected from three CIR-foam project sites. The RAP materials from the
Johnson County exhibited the highest maximum specific gravity mainly due to its low
foamed asphalt content. The low foamed asphalt content lead to the high air voids due to
its lack of compatibility. As a result, the indirect tensile strength was the lowest among
them.
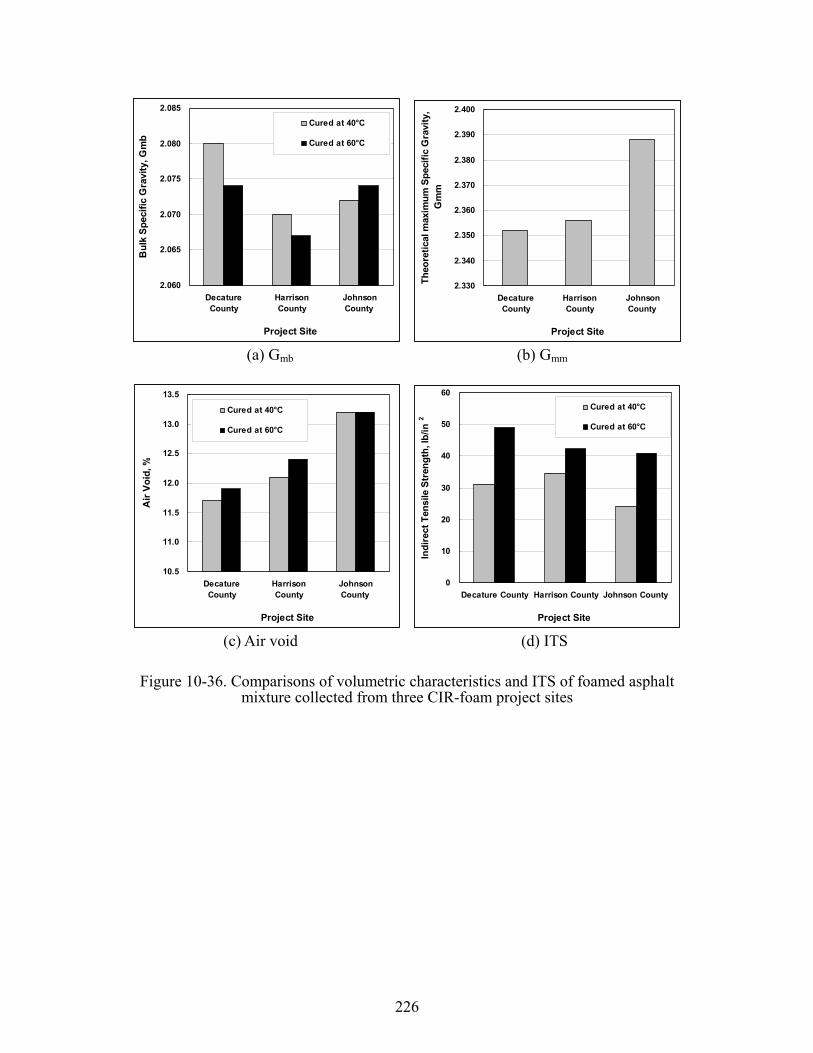
226
2.060
2.065
2.070
2.075
2.080
2.085
DecatureCounty
HarrisonCounty
JohnsonCounty
Project Site
Bul
k Sp
ecifi
c G
ravi
ty, G
mb
Cured at 40°C
Cured at 60°C
2.330
2.340
2.350
2.360
2.370
2.380
2.390
2.400
DecatureCounty
HarrisonCounty
JohnsonCounty
Project Site
Theo
retic
al m
axim
um S
peci
fic G
ravi
ty,
Gm
m
(a) Gmb (b) Gmm
10.5
11.0
11.5
12.0
12.5
13.0
13.5
DecatureCounty
HarrisonCounty
JohnsonCounty
Project Site
Air
Void
, %
Cured at 40°C
Cured at 60°C
0
10
20
30
40
50
60
Decature County Harrison County Johnson County
Project Site
Indi
rect
Ten
sile
Str
engt
h, lb
/in2
Cured at 40°C
Cured at 60°C
(c) Air void (d) ITS
Figure 10-36. Comparisons of volumetric characteristics and ITS of foamed asphalt mixture collected from three CIR-foam project sites
227
11. CONCLUSIONS AND RECOMMENDATIONS
Asphalt pavement recycling has grown dramatically over the last few years as the
preferred way to rehabilitate existing asphalt pavements. Rehabilitation of existing
asphalt pavements has employed different techniques; one of them, Cold In-place
Recycling with foamed asphalt (CIR-foam), has been effectively applied in Iowa.
However, the current CIR-foam practice utilizes a generic recipe specification without a
mix design, where a contractor is given latitude to adjust the proportions of the foamed
asphalt content to achieve a specified level of density. Therefore, this study was
conducted to develop a new laboratory mix design process for CIR-foam in consideration
of its predicted field performance.
First, the findings, conclusions, and recommendations obtained from phase I
study are summarized. The developed mix design procedure was then validated using
different sources of RAP materials. The simple performance tests, which include dynamic
modulus test, dynamic creep test and raveling test, were conducted to evaluate the
consistency of a new CIR-foam mix design process to ensure reliable mixture
performance over a wide range of traffic and climatic conditions. Pavement surface
conditions of seven CIR projects were evaluated after one year since construction, where
the RAP materials had been collected in the summer of 2004. Finally, the CIR-foam
construction processes from milling to compaction were observed.
Conclusions
Based on the extensive laboratory experiments the following conclusions are
derived:
1. Gyratory compactor produces the more consistent CIR-foam laboratory specimen
than Marshall hammer.

228
2. Indirect tensile strength of gyratory compacted specimens is higher than that of
Marshall hammer compacted specimens
3. Indirect tensile strength of the mixtures cured in the oven at 60 ˚C for 2 days is
significantly higher than that of mixtures cured in the oven at 40 ˚C for 3 days.
4. Dynamic modulus of CIR-foam is affected by a combination of the RAP sources
and foamed asphalt contents.
5. The coarse RAP materials with a small amount of residual asphalt content may
be more resistant to fatigue cracking but less resistant to rutting.
6. CIR-foam is not as sensitive to temperature or loading frequency as HMA.
7. Based on the dynamic creep tests performed at 40˚C, CIR-foam with 1.0%
foamed asphalt is more resistant to rutting than CIR-foam with 2.0% or 3.0%.
8. Based on the dynamic creep tests performed at 40C, RAP aggregate structure has
a predominant impact on its resistant to rutting.
9. Based on the dynamic creep test results performed at 40˚C and dynamic modulus
test performed at 37.8˚C, the finer RAP materials with the more and harder
residual asphalt were more resistant to rutting.
10. CIR-foam specimens with 2.5% foamed asphalt content are more resistant to
raveling than ones with 1.5%.
11. There is a significant variation in distribution of foamed asphalt across the lane
during the CIR-foam construction, which could affect its field performance. Recommendations
Based on the extensive laboratory experiments and the field evaluations, the
following recommendations are made:
1. 30 gyrations are recommended for producing the equivalent laboratory
specimens produced by 75-blow Marshall hammer.

229
2. Laboratory specimens should be cured in the oven at 60°C for 2 days.
3. To determine the optimum foamed asphalt content, indirect tensile strength test
should be performed on vacuum saturated specimen.
4. Gyratory compacted specimens should be placed in 25˚C water for 20 minutes,
vacuumed saturated at 20 mm Hg for 30 minutes and left under water for
additional 30 minutes without vacuum.
5. The optimum foamed asphalt content should be increased from 1.5% to 2.5% if
the penetration index of the residual asphalt from RAP materials increases from
28 to 15.
6. The proposed mix design procedure should be implemented to assure the
optimum performance of CIR-foam pavements in the field. Future Studies
1. CIR-foam pavements should be constructed following the new mix design
process and their long-term field performance should be monitored and verified
against the laboratory performance test results.
2. New mix design and laboratory simple performance tests should be performed on
the CIR-foam mixtures using stiffer asphalt binder grade, i.e., PG 58-28 or 64-22.
3. Static creep test should be evaluated for a possible addition to the performance
test protocol.
4. New mix design and laboratory performance tests should be evaluated for CIR-
emulsion mixtures.
5. To better simulate the field performance as a base, performance tests should be
performed on both CIR-foam and CIR-emulsion specimens with a horizontal
confined pressure.
6. A comprehensive database of mix design, dynamic modulus, flow number and

230
raveling for both CIR-foam and CIR-emulsion should be developed to allow for
an input to the Mechanistic-Empirical Pavement Design Guide (MEPDG).

231
REFERENCES AASHTO-AGC-ARTBA Joint Committee Task Force 38. (1999). “Report on Cold
Recycling of Asphalt Pavements”. Washington, DC: AASHTO. Asphalt Recycling and Reclamation Association (ARRA). (2001). Basic Asphalt
Recycling Manual. AASHTO (2001). “Bulk Specific Gravity of Compacted Bituminous Mixtures Using
Saturated Surface-Dry Specimens.” AASHTO T 166. AASHTO, (2003). “Determining Dynamic Modulus of Hot-Mix Asphalt Concrete
Mixtures.” AASHTO TP-62-03. ASTM (2005). “Standard Test Method for Flat Particles, Elongated Particles, or Flat and
Elongated Particles in Coarse Aggregate.” ASTM D 4791. Brennen, M., M. Tia, A. Altschaeffl, and L. E. Wood. (1970).“Laboratory Investigation of
the Use of Foamed Asphalt for Recycled Bituminous Pavements.” Washington, DC: TRB, National Research Council, pp. 80-87.
Bonaquist, R. F., Christensen, D. W. and Stump, W. (2003). “Simple Performance Tester for Superpave Mix Design Development and Evaluations.” Transportation Research Record, NCHRP Report 513.
Brown, E. R., Cooley, A., Prowell, B. amd Powell, B. (2004) “Evaluation of Rutting Performance at the 2000 NCAT Test Track.” Journal of the Association of Asphalt Pavement Technologist, Volume 73.
Brown, E. R., Powell, B., West, R. and Timm, David. (2005) “NCAT Test Track Findings.” National Center for Asphalt Technology.
Birgisson, B., Roque, R., Kim, J. and Pham, L. V. (2004) “The Use of Complex Modulus to Characterize the Performance of Asphalt Mixtures and Pavements in Florida.” Final Report, 4910-4501-784-12, Florida Department of Transportation.
Clyne, T. R., Li, X., Marasteanu, M. O. and Engene, K. (2003) “Dynamic Modulus and Resilient Modulus of Mn/DOT Asphalt Mixtures.” Minnesota Department of Transportation, MN/RC-2003-09.
Ekingen, E. R. (2004). “Determining Gradation and Creep Effects in Mixtures Using the Complex Modulus Test.” Thesis of Mater Degree, University of Florida.
EI-Basyoung, M. M, Witczck, M., Kaloush, K. (2005) “Development of the Permanent Deformation Models for the 2002 Design Guide.” CD-ROM of TRB 84th Annual Meeting, Washington. D.C.
Guide for Mechanical-Empirical Design of New and Rehabilitated Pavement Structures. NCHRP Project 1-37A, www.trb.org/mepdg/. Accessed July 15, 2006..
Kaloush, K.E., Witczak, M.W. and Quintus, H.V. (2002) “Pursuit of the Simple Performance Test for Asphalt Mixture Rutting,” Journal of the Association of Asphalt Paving Technologists, Vol.71, pp.783-810.
Kim Y. and Lee, H. (2006). “Development of Mix Design Procedure for Cold In-Place Recycling with Foamed Asphalt” The Journal of Materials in Civil Engineering, ASCE, Vol. 18, No1, ISSN 0899-1561, pp 116-124.
Lee, H., and Kim Y. (2003). “Development of a Mix Design Process for Cold In-Place Rehabilitation using Foamed Asphalt”, Iowa Department of Transportation, Iowa Highway research board, Final report.
Lee. K.W., T. E. Brayton, and J. Harrington. (2003). “New Mix-Design Procedure of
232
Cold In-Place Recycling for Pavement Rehabilitation.” Washington, DC: CD-ROM of TRB 82th Annual Meeting.
Lundy, J. R., Sandoval-Gil, J., Brickman, A. and Patterson, B. (2005) “Asphalt Mix Characterization Using Dynamic Modulus and APA Testing” Final Report, FHWA-OR-RD-06-09, Oregon Department of Transportation and Federal Highway Administration.
Mohammad, L. N., Wu, Z., Obulareddy, S., Cooper, S. and Abadie, C. (2006). “Permanent Deformation Analysis of HMA Mixtures Using Simple Performance Tests and The 2002 Mechanistic-Empirical Pavement Design Software.” CD-ROM of TRB 85th Annual Meeting, Washington. D.C.
Nataatmadja, A. (2001). “Some Characteristics of Foamed Bitumen Mixes.” Transportation Research Record 1767. Washington, DC: TRB, National Research Council, pp. 120-125.
Pan, T., Tutumluer, E. and Carpenter, S. H., (2006). “Effect of Coarse Aggregate Morphology on Pavement Deformation Behavior of Hot Mix Asphalt.” Journal of Transportation Engineering, ASCE, Vol. 132, No. 7, pp580-589.
Salomon, A., and D.E. Newcomb. (2001). “Cold In-Place Recycling Literature Review and Preliminary Mixture Design Procedure.” Minnesota Department of Transportation, MN/RC-2000-21.
Stephen A. C. (2002). “Determination of N design for CIR mixtures using the Superpave Gyratory Compactor”. University of Kansas Center for Research.
Thomas, T., and Kadrmas, A. (2003). “Performance-Related Tests and Specifications for Cold In-Place Recycling: Lab and Field Experience”. CD-ROM of TRB 82th Annual Meeting, Washington. D. C.
Williams, M. L., Landel, R. F. and Ferry, J. D. (1955). “The Temperature Dependence of Relaxation Mechanism in Amorphous Polymers and other Glass Forming Liquids.” Journal of the American Chemical Society, Vol. 77, pp 3701-3706.
Witczak, M. W., Kaloush, K., Pellinen, T., El-Basyouny, M. and Von Quintus, H. (2002). ‘‘Simple performance test for superpave mix design.’’ NCHRP Rep. No. 465, Transportation Research Board, National Research Council, National Academy Press, Washington D.C.
233
GLOSSARY OF ACRONYMS AADT: Average annual daily traffic CIR: Cold in-place recycling CIR-foam: Cold in-place recycling using foamed asphalt CIR-ReFlex: Cold in-place recycling using ReFlex Emulsion CIR-Emulsion: Cold in-place recycling using Emulsion FAC: Foamed asphalt content Gmb: Bulk specific gravity Gmm: Theoretical maximum specific gravity HMA: Hot mix asphalt ITS: Indirect tensile strength MC: Moisture content PG: Performance grade SPT: Simple performance test RAP: Reclaimed asphalt pavement