
Validation of LIRIC aerosol concentration retrievals...
13
Validation of LIRIC aerosol concentration retrievals using airborne measurements during a biomass burning episode over Athens Panagiotis Kokkalis a, ⁎, Vassilis Amiridis a , James D. Allan b,c , Alexandros Papayannis d , Stavros Solomos a , Ioannis Binietoglou a,l , Aikaterini Bougiatioti e,d,f , Alexandra Tsekeri a , Athanasios Nenes e,g,h,i , Philip D. Rosenberg j , Franco Marenco k , Eleni Marinou a,m , Jeni Vasilescu l , Doina Nicolae l , Hugh Coe b , Asan Bacak b , Anatoli Chaikovsky n a Institute for Astronomy, Astrophysics, Space Application and Remote Sensing, National Observatory of Athens, Greece b School of Earth, Atmospheric and Environmental Sciences, The University of Manchester, Manchester, UK c National Centre for Atmospheric Science, The University of Manchester, Manchester, UK d National Technical University of Athens, Zografou, Greece e School of Earth and Atmospheric Sciences, Georgia Institute of Technology, Atlanta, GA, USA f ECPL, Department of Chemistry, University of Crete, Voutes, 71003 Heraklion, Greece g School of Chemical & Biomolecular Engineering, Georgia Institute of Technology, Atlanta, GA, USA h Institute of Chemical Engineering Sciences (ICE-HT), FORTH, Patras, Greece i IERSD, National Observatory of Athens, P. Penteli, 15236 Athens, Greece j School of Earth and Environment, University of Leeds, Leeds, UK k Satellite Applications, Met Office, Exeter, UK l National Institute of R&D for Optoelectronics, Magurele, Romania m Department of Physics, Aristotle, University of Thessaloniki, Thessaloniki, Greece n Institute of Physics of the National Academy of Science of Belarus, Minsk, Belarus abstract article info Article history: Received 13 June 2016 Received in revised form 2 September 2016 Accepted 6 September 2016 Available online 9 September 2016 In this paper we validate the Lidar-Radiometer Inversion Code (LIRIC) retrievals of the aerosol concentration in the fine mode, using the airborne aerosol chemical composition dataset obtained over the Greater Athens Area (GAA) in Greece, during the ACEMED campaign. The study focuses on the 2nd of September 2011, when a long-range transported smoke layer was observed in the free troposphere over Greece, in the height range from 2 to 3 km. CIMEL sun-photometric measurements revealed high AOD (~0.4 at 532 nm) and Ångström ex- ponent values (~ 1.7 at 440/870 nm), in agreement with coincident ground-based lidar observations. Airborne chemical composition measurements performed over the GAA, revealed increased CO volume concentration (~ 110 ppbv), with 57% sulphate dominance in the PM 1 fraction. For this case, we compare LIRIC retrievals of the aerosol concentration in the fine mode with the airborne Aerosol Mass Spectrometer (AMS) and Passive Cavity Aerosol Spectrometer Probe (PCASP) measurements. Our analysis shows that the remote sensing retrievals are in a good agreement with the measured airborne in-situ data from 2 to 4 km. The discrepancies observed be- tween LIRIC and airborne measurements at the lower troposphere (below 2 km), could be explained by the spa- tial and temporal variability of the aerosol load within the area where the airborne data were averaged along with the different time windows of the retrievals. © 2016 Published by Elsevier B.V. Keywords: Lidar Inversion Airborne measurements 1. Introduction According to the report of the Intergovernmental Panel on Climate Change (IPCC; Myhre et al., 2013), anthropogenic aerosols result into a net cooling globally through their interaction with radiation and clouds, by an amount that remains difficult to quantify accurately and which could be comparable in magnitude to the net warming effect of greenhouse gases. Moreover, according to the World Health Organiza- tion (WHO), there is a significant linkage between suspended particles and human's mortality (WHO, 2006). Aerosol effects are determined, among others, by particle's size, their chemical composition, and num- ber concentration. To understand how atmospheric particles are affect- ing the Earth's climate, the scientific community has established and operates global networks equipped with active and passive remote Atmospheric Research 183 (2017) 255–267 ⁎ Corresponding author at: National Observatory of Athens, Institute for Astronomy, Astrophysics, Space Applications & Remote Sensing, I.Metaxa and Vas. Paulou str., GR- 15236 Penteli, Greece. E-mail address: [email protected] (P. Kokkalis). URL: http://apcg.space.noa.gr (P. Kokkalis). http://dx.doi.org/10.1016/j.atmosres.2016.09.007 0169-8095/© 2016 Published by Elsevier B.V. Contents lists available at ScienceDirect Atmospheric Research journal homepage: www.elsevier.com/locate/atmosres
Transcript of Validation of LIRIC aerosol concentration retrievals...
Atmospheric Research 183 (2017) 255–267
Contents lists available at ScienceDirect
Atmospheric Research
j ourna l homepage: www.e lsev ie r .com/ locate /atmosres
Validation of LIRIC aerosol concentration retrievals using airbornemeasurements during a biomass burning episode over Athens
Panagiotis Kokkalis a,⁎, Vassilis Amiridis a, James D. Allan b,c, Alexandros Papayannis d, Stavros Solomos a,Ioannis Binietoglou a,l, Aikaterini Bougiatioti e,d,f, Alexandra Tsekeri a, Athanasios Nenes e,g,h,i,Philip D. Rosenberg j, Franco Marenco k, Eleni Marinou a,m, Jeni Vasilescu l, Doina Nicolae l, Hugh Coe b,Asan Bacak b, Anatoli Chaikovsky n
a Institute for Astronomy, Astrophysics, Space Application and Remote Sensing, National Observatory of Athens, Greeceb School of Earth, Atmospheric and Environmental Sciences, The University of Manchester, Manchester, UKc National Centre for Atmospheric Science, The University of Manchester, Manchester, UKd National Technical University of Athens, Zografou, Greecee School of Earth and Atmospheric Sciences, Georgia Institute of Technology, Atlanta, GA, USAf ECPL, Department of Chemistry, University of Crete, Voutes, 71003 Heraklion, Greeceg School of Chemical & Biomolecular Engineering, Georgia Institute of Technology, Atlanta, GA, USAh Institute of Chemical Engineering Sciences (ICE-HT), FORTH, Patras, Greecei IERSD, National Observatory of Athens, P. Penteli, 15236 Athens, Greecej School of Earth and Environment, University of Leeds, Leeds, UKk Satellite Applications, Met Office, Exeter, UKl National Institute of R&D for Optoelectronics, Magurele, Romaniam Department of Physics, Aristotle, University of Thessaloniki, Thessaloniki, Greecen Institute of Physics of the National Academy of Science of Belarus, Minsk, Belarus
⁎ Corresponding author at: National Observatory of AAstrophysics, Space Applications & Remote Sensing, I.M15236 Penteli, Greece.
E-mail address: [email protected] (P. Kokkalis).URL: http://apcg.space.noa.gr (P. Kokkalis).
http://dx.doi.org/10.1016/j.atmosres.2016.09.0070169-8095/© 2016 Published by Elsevier B.V.
a b s t r a c t
a r t i c l e i n f oArticle history:Received 13 June 2016Received in revised form 2 September 2016Accepted 6 September 2016Available online 9 September 2016
In this paper we validate the Lidar-Radiometer Inversion Code (LIRIC) retrievals of the aerosol concentration inthe fine mode, using the airborne aerosol chemical composition dataset obtained over the Greater Athens Area(GAA) in Greece, during the ACEMED campaign. The study focuses on the 2nd of September 2011, when along-range transported smoke layer was observed in the free troposphere over Greece, in the height rangefrom 2 to 3 km. CIMEL sun-photometric measurements revealed high AOD (~0.4 at 532 nm) and Ångström ex-ponent values (~ 1.7 at 440/870 nm), in agreement with coincident ground-based lidar observations. Airbornechemical composition measurements performed over the GAA, revealed increased CO volume concentration (~110 ppbv), with 57% sulphate dominance in the PM1 fraction. For this case, we compare LIRIC retrievals of theaerosol concentration in the fine mode with the airborne Aerosol Mass Spectrometer (AMS) and Passive CavityAerosol Spectrometer Probe (PCASP) measurements. Our analysis shows that the remote sensing retrievals arein a good agreement with the measured airborne in-situ data from 2 to 4 km. The discrepancies observed be-tween LIRIC and airborne measurements at the lower troposphere (below 2 km), could be explained by the spa-tial and temporal variability of the aerosol load within the area where the airborne data were averaged alongwith the different time windows of the retrievals.
© 2016 Published by Elsevier B.V.
Keywords:LidarInversionAirborne measurements
1. Introduction
According to the report of the Intergovernmental Panel on ClimateChange (IPCC; Myhre et al., 2013), anthropogenic aerosols result into
thens, Institute for Astronomy,etaxa and Vas. Paulou str., GR-
a net cooling globally through their interaction with radiation andclouds, by an amount that remains difficult to quantify accurately andwhich could be comparable in magnitude to the net warming effect ofgreenhouse gases. Moreover, according to the World Health Organiza-tion (WHO), there is a significant linkage between suspended particlesand human's mortality (WHO, 2006). Aerosol effects are determined,among others, by particle's size, their chemical composition, and num-ber concentration. To understand how atmospheric particles are affect-ing the Earth's climate, the scientific community has established andoperates global networks equipped with active and passive remote
256 P. Kokkalis et al. / Atmospheric Research 183 (2017) 255–267
sensing instrumentation. More precisely, the AErosol RObotic NETwork(AERONET) provides almost real-time columnar aerosol optical andmi-crophysical properties, based on the operation of N400 sun-sky radiom-eters distributed worldwide (Holben et al., 1998). Several aerosol lidarnetworks are used for aerosol/cloud research includingwell establishedinfrastructures and networks like: the European Aerosol Research LidarNetwork (EARLINET; Pappalardo et al., 2014), theMicro Pulse LidarNet-work (MPLNET; Welton and Campbell, 2002) and the Asian Dust andaerosol lidar observation network (AD-Net; Sugimoto et al., 2014).
Depending on the capabilities of each system and the employedtechniques, lidar measurements are used to retrieve the vertical distri-bution of (a) the aerosol backscatter coefficient (βaer), (e.g. Fernald etal., 1972; Klett, 1981); (b) the aerosol extinction coefficient (aaer),(Ansmann et al., 1990; Ansmann et al., 1992) and (c) the particle lineardepolarization ratio δaer (e.g. Cairo et al., 1999; Sassen, 2005;Freudenthaler et al., 2009). The aerosol backscatter and extinction coef-ficients can be retrieved from the backscatter, Raman (Ansmann et al.,1992; Whiteman et al., 1992; Whiteman, 2003), or High Spectral Reso-lution Lidar (HSRL) technique (e.g. Eloranta, 2005). The selected tech-nique defines also the accuracy of the retrieved aerosol products.Many studies have demonstrated that the spectral information of theaforementioned aerosol optical properties, makes feasible the provisionof accurate retrievals in the fine mode, regarding aerosol microphysicalparameters namely: aerosol size distribution, aerosol effective radius,number and volume concentration (Müller et al., 1999; Veselovskii etal., 2002; Veselovskii et al., 2010). In case that the aerosol extinction co-efficient is provided by Raman technique, the microphysical retrievalsare typically limited to night-time measurements since their accuracydepends on the error of the optical parameters provided as initialinputs.
During the last years, there are increased efforts to retrieve aerosolconcentration profiles also during day-time. For example, the polariza-tion lidar photometer networking (POLIPHON) technique is capable ofretrieving the concentration profiles of dust and non-dust particlesusing single wavelength backscatter and depolarization coefficientlidar profiles (Ansmann et al., 2011; Ansmann et al., 2012). In this tech-nique, AERONET microphysical retrievals are used to provide columnarvolume-to-AOD values needed to convert the optical properties to con-centration. On a continuation effort, Mamouri and Ansmann (2014),have expanded the technique to separating the contribution of fineand coarse dust modes, based on laboratory measurements of fine andcoarse dust depolarization ratios.
In the framework of Aerosols, Clouds, and Trace gases Research In-frastructure (ACTRIS), two algorithms have been developed for retriev-ing concentration profiles from the synergy of lidar and sun-photometricmeasurements. TheGeneralized Aerosol Retrieval fromRa-diometer and Lidar Combined (GARRLiC; Lopatin et al., 2013) inversionalgorithm retrieves vertical profiles of both fine and coarse aerosol con-centrations aswell as the size distribution and complex refractive indexfor each mode. Based on similar approach, the LIdar-Radiometer Inver-sion Code (LIRIC; Chaikovsky et al., 2016) considers that the fine andcoarse particle intensive properties are constant with height, takenequal to the column-integrated values provided by AERONET, withonly their concentration varying along the atmospheric column. LIRIC,GARRLiC and POLIPHON techniques have been used by manyEARLINET-AERONET stations, during large and medium scale dustevents over the European continent, for evaluating dust model perfor-mance in terms of dust layer geometrical properties (height range andcentre of mass) as well as dust load (particle concentrations) (e.g.Binietoglou et al., 2015; Granados-Muñoz et al., 2016a, 2016b). For acase study of Saharan dust outbreak over Athens, Greece, Tsekeri et al.(2013), found a satisfactory agreement between LIRIC output and dustconcentration profiles, simulated by the regional dust model BSC-DREAM8b (Pérez et al., 2006a; Pérez et al., 2006b; Basart et al., 2012).Furthermore, comparisons of LIRIC output, with dispersion models ofother aerosol types than dust (e.g. volcanic dust), like Lagrangian
dispersion model FLEXPART (Stohl et al., 1998; Stohl et al., 2005),showed a Pearson's coefficient (R) varying from 0.69 to 0.84 (Kokkaliset al., 2013). Moreover, Wagner et al. (2013), inter-compared LIRICand POLIPHON concentration profiles, by applying both techniques ontwo case studies of irregularly shaped particles in the atmosphere (i.e.one Sahara dust outbreak and one volcanic dust event). The comparisonbetween the two techniques revealed acceptable agreement, howeverthe potential of LIRIC to retrieve optical properties, namely particlebackscatter coefficient, lidar ratio and Ångström exponent, was foundto demonstrate systematic deviations compared to correspondingmea-surements obtained with a Raman lidar. In addition, Papayannis et al.(2014) showed that the relative difference between LIRIC andPOLIPHON mass concentration retrievals, is in the range of ±20% forthe case of coarse non-spherical particles.
Furthermore, LIRIC retrievals of volume concentration have beencompared with aircraft in-situ measurements, by Granados-Muñoz etal. (2016a) during a Saharan dust episode over Granada, Spain. Thecase study of coarsemode (dust), non-spherical particles, is introducinglimitations regarding, the potential of in-situ instrumentation to mea-sure size distribution in the size range above 3 μm (diameter). Thus,during their study, they combined: in-situ depolarization measure-ments from Cloud and Aerosol Spectrometer with Polarization detec-tion (CAS-POL; Baumgardner et al., 2001), operating at the size range0.6–50 μm (diameter), and a Passive Cavity Aerosol Spectrometer(PCASP 100×; Rosenberg et al., 2012; Cai et al., 2013)measuring aerosolsize distribution in 0.1–3 μm diameter range. Correcting the retrievedsize distributions, for refractive index assumptions, they demonstratedvolume concentration discrepancies b20 μm3 cm−3 (0.02 ppbv) andthey attributed them to CAS-POL overestimation due to the asphericityof dust particles and to the possible underestimation of LIRIC, despitethe fact that the derived size distributions from CAS-POL and lidar,were found to be in a good agreement.
In this study, we validate the volume concentration retrieved byLIRIC, with independent in-situ measurements of chemical composi-tion, for a case of predominant fine mode particles in the atmosphere,over the Greater Athens Area (GAA; Saronic Gulf, Evoikos Gulf and Ae-gean), Greece. To our knowledge, this is the first time that fine modeLIRIC retrievals are validated against airborne. The case of fine modeparticles is favourable for comparing remote sensing and in-situ obser-vations since in this case there are fewer limitations on the instrumentalside for the in-situmeasurementswhile for remote sensing part theMiescattering simulations are applicable since the particles are mainlyspherical. In Section 2 we present the instrumentation and methodolo-gy used. Section 3 presents a brief description of ACEMED campaignalong with the case study used for the evaluation of the LIRIC finemode aerosol concertation retrieval. Our analysis contains, a thoroughcharacterization of the aerosol load monitored over the GAA, in termsof their optical properties and chemical composition. In the secondpart of Section 3 we compare the retrieved concentrations with the in-dependent in-situ airborne measurements. Finally, our conclusions aregiven in Section 4.
2. Instrumentation and method
2.1. Backscatter-depolarization lidar
At the National Technical University of Athens (NTUA, 37.97° N,23.79° E, elevation: 212 m) a six-wavelength Raman-backscatter lidarsystem (EOLE) operates since February 2000, as a member of theEARLINET network (Bösenberg et al., 2003; Pappalardo et al., 2014).The emission unit is based on an Nd:YAG laser, emitting high energylaser pulses at 355, 532 and 1064 nm with a repetition rate of 10 Hz.The respective emitted energies per pulse are of the order of 240, 300and 260 mJ. A Galilean type beam expander (×3) is mounted, just be-fore the emission of the laser beam in the atmosphere, for reducingthe laser beam divergence and increasing the beam diameter, almost
257P. Kokkalis et al. / Atmospheric Research 183 (2017) 255–267
with the same efficiency for all the emitted wavelengths. The optical re-ceiver is based on a Cassegrainian telescope with 600 mm focal lengthand clear aperture diameter 300 mm, directly coupled with an opticalfiber, to the wavelength separation unit, detecting finally signals at355, 387, 407, 532, 607 and 1064 nm.
During day time operation, the system is capable to provide aerosolbackscatter profiles (βaer) at 355, 532 and 1064 nm, based on the stan-dard backscatter lidar technique and employing the Klett inversionmethod (Klett, 1981). The technique assumes, the existence of an aero-sol-free region (e.g. upper troposphere), and a linear relationship be-tween aerosol backscatter and extinction coefficient, the so called lidarratio (Saer), constant in the laser-telescope path. A variety of studies per-formed in the framework of EARLINET, revealed a wide range for thelidar ratios, covering values from 20 to 100 sr (Ackermann, 1998;Mattis et al., 2004; Amiridis et al., 2005; Müller et al., 2007;Papayannis et al., 2008; Amiridis et al., 2009; Groß et al., 2011; Großet al., 2013; Groß et al., 2015; Giannakaki et al., 2015). In elastic back-scatter lidar technique, the assumption of a constant lidar ratio valuethroughout the laser sounding range, is the most critical for solvingthe lidar equation, while the overall uncertainty, including both statisti-cal and systematic errors, on the retrieved βaervalues, is of the order of20–30% (Bösenberg et al., 1997; Comerón et al., 2004; Rocadenboschet al., 2010).
Next to EOLE system, a depolarization lidar system (AIAS), was alsooperating continuously during September 2011. AIAS is capable to de-tect both the parallel- and perpendicular- components of thebackscattered light at 532 nm, with respect to the linear polarizationplane of the initially emitted laser beam. The emission unit of AIAS isbased on a Nd:YAG laser, emitting short laser pulses at 532 nmwith en-ergy of the order of 95 mJ per pulse. The backscattered light is collectedby a Dall-Kirkham/Cassegrainian telescope with 1000 mm focal lengthand 200 mm clear aperture diameter, and guided to a PolarizationBeam Splitter Cube (PBSC) where the two polarization componentsare separated and directed to the corresponding detectors (Sassen,2005). The calibrated ratio of these two components is known as vol-ume depolarization ratio, and the key for deriving accurate particle lin-ear depolarization measurements (δaer) lies in obtaining a reliablecalibration of the lidar system. Various calibration methods exist inthe literature (e.g. Biele et al., 2000; Reichardt et al., 2003; Alvarez etal., 2006), however the ±45° calibration technique (Freudenthaler etal., 2009), has been employed in our case.
Both lidar systems are affected by the overlap height and below thisregion are not capable to provide trustworthy aerosol products. Thegeometrical specification of EOLE systemmakes feasible the full overlapof the laser beamwith the receiver field of view to be reached at heights700–900mabove ground (Kokkalis et al., 2012). Regarding the depolar-ization lidar AIAS, the measured volume depolarization ratio is reliableto about 50 m above ground since overlap effects widely cancel outdue to the signal ratios needed for the calculation of the depolarizationratio. However, in this study the data are analysed for heights above850 m. Below that height we set the measured aerosol related physicalquantities to height-independent values.
2.2. CIMEL sun-sky radiometer
In this study, the reported columnar aerosol optical properties, havebeen retrieved by a CIMEL sun-sky radiometer (Holben et al., 1998),located on the roof of the Research Center for Atmospheric Physicsand Climatology of the Academy of Athens (37.99° N, 23.78° E, eleva-tion: 130m). The radiometric station is in the city centre, approximately10 km away from the coastal line and 1.6 km North from the lidar sta-tion. The instrument is part of NASA's global sun photometric networkAERONET, and is capable to perform automaticmeasurements of the di-rect solar irradiance at the common wavelengths of 340, 380, 440, 500,675, 870, 940 and1020nmand diffuse sky radiance at 440, 675, 870 and1020 nm, respectively. Those measurements are further used to
provide, both optical and microphysical aerosol optical properties inthe atmospheric column (Dubovik and King, 2000; Dubovik et al.,2006). The CIMEL data used in this study, are the cloud screened andquality assured level 2.0 data products, providing information regardingthe columnar aerosol optical depth (AOD), fine and coarse mode frac-tions of AOD at 500 nm, the particle volume size distribution in thesize range of 0.05 to 15 μm in terms of particle radius, and the Ångströmexponent. The separation of fine and coarse, size distribution is done byfinding theminimum concentration values in the particle's radius range0.194–0.576 μm. The AOD uncertainty is b±0.02 for UV wavelengthsand b±0.01 for wavelengths longer than 440 nm (Eck et al., 1999).The uncertainty of the aerosol size distribution retrieved by the sky ra-diance measurements is based on the calibration uncertainty of eachwavelength, assumed to be b±5%.
2.3. Lidar-sun-photometric inversion algorithm (LIRIC)
The LIRIC algorithm has been developed by the Belarusian Instituteof Physics in Minsk, in collaboration with the French Laboratoired'Optique Atmosphérique in Lille. LIRIC combines the elasticallybackscattered lidar signals at 355, 532 and 1064 nm, along with the ra-diometric measurements from CIMEL, and is capable of retrieving thefine (Cf(z)) and coarse mode particle volume concentration profiles(Cc (z)) (Chaikovsky et al., 2016), in parts per billion volume (ppbv).In case that depolarizationmeasurements are available, LIRIC algorithmis capable to provide also the concentration profiles of coarse sphericaland coarse spheroid modes. However, in the present study this capabil-ity has not been examined, since an older version of the LIRIC code hasbeen used. The threshold value for defining fine and coarsemode parti-cles in terms of their size, is obtained from the columnar volume sizedistribution retrieved by AERONET inversion algorithms. Thus, in thecase of LIRIC,finemodeparticles,may assume to beparticleswith radiusapproximately b0.5 μm. Finally, the retrieval is based on a maximum-likelihood estimation of the concentration profiles so that the lidar sig-nals are reproduced within their measurement uncertainty and the in-tegral of the retrieved aerosol concentrations matches the totalvolume concentration of the fine and coarse modes, derived from sun-photometric measurements.
LIRIC's retrieval uncertainty, depends both on the regularization pa-rameters defined by the operator, as well as on the uncertainty of theinput data. More precisely, for various atmospheric conditions, lidargeometrical characteristics, and LIRIC's regularization parameters, theuncertainties in the retrieved aerosol parameterswere found to bemax-imum 30%, for cases of complex aerosol structures, however takingvalues below 10%, during cases of homogeneous aerosol mixing andsimple aerosol structures (Granados-Muñoz et al., 2014). Uncertaintiesdue to the regularization parameters were found to be below 2%. Over-all, according to Chaikovsky et al. (2016), the retrieved volume concen-tration profiles may be provided with a standard deviation in the range5–20% of the maximum aerosol layer concentration, with the concen-tration uncertainty to be significant only for cases of low concentrationvalues. In the studied case, we considered that the retrieved concentra-tion profiles are provided with an overall uncertainty of 20%.
2.4. In-situ airborne aerosol instrumentation
The size-resolved chemical composition and mass concentration,have been measured with an Aerodyne time-of-flight Aerosol MassSpectrometer (TOF-AMS; Allan et al., 2003; Canagaratna et al., 2007;Morgan et al., 2010). The AMS is capable to measure the fine modeparticle's mass concentration (M), of the following chemical com-pounds: sulphates (SO4), nitrates (NO3), ammonium (NH4), chloride(Cl) and organic matter (OM). Particle's aerodynamic diameter, are re-lated to their physical diameters, ranging usually between 0.1 and1 μm. The initially reported mass concentrations, are measured in
258 P. Kokkalis et al. / Atmospheric Research 183 (2017) 255–267
micrograms per standard cubic meter (μg Sm−3), at standard tempera-ture-pressure conditions (T=273.15 oK and P=1013.25 hPa).
Volume concentration of gaseous pollutants, have been also mea-sured during the flights, using the following gas analysers: Aero-Laser(AL) 5002 VUV Fast Fluorescence analyser, for carbon monoxide (CO)measurements, and a Thermo-Electron (TE) 49C UV photometricanalyser, for ozone (O3) measurements.
The size-resolved particle's number density has beenmeasuredwitha Passive Cavity Aerosol Spectrometer Probe (PCASP). The instrument iscapable to measure particle's number size distribution, over the diame-ter range of 0.1 to 3 μm, in 30 size bins. The principle of operation ofPCASP is based on the scattering of a laser light from suspended parti-cles. The scattered radiation over an angular range of 35°–120° (primaryangle) and 60°–145° (secondary angle), is collected by a parabolic mir-ror and is focused onto a photodetector, producing an electronic pulse.The pulse height for each particle is linearly related to a particle'scross section and therefore nonlinearly related to the particle's diame-ter. The number of pulses counted per second is proportional to the con-centration. However, since scattering cross section depends amongother parameters also on particle's shape and refractive index, a correc-tion regarding refractive index have to be applied. Thus, for deriving cal-ibrated particle's number density distributions we followed theprocedure demonstrated by Rosenberg et al. (2012), and applied alsoby Tsekeri et al. (2016), for ACEMED campaign dataset.
Finally, temperature sensors (Rosemount/Goodrich) and hygrome-ters (Lyman-alpha) mounted on the aircraft, are capable to providemeasurements of temperature and relative humidity. The overall cali-bration uncertainties of the temperature measurements are of theorder ±0.3 °K.
2.5. Modelling
Source-receptor relationships between the measurement areas andthe potential emission sources, are investigated with the use of the par-ticle dispersionmodel FLEXPART-WRF (Stohl et al., 2005; Brioude et al.,2013). The model is driven byWRF_ARW (Skamarock et al., 2008) me-teorological fields at a resolution of 12 × 12 km over the area of interest.A two-way nested 3 × 3 km grid over the greater Athens area is also en-abled for the description of the local sea breeze flow during the experi-mental period. Initial and boundary conditions for WRF are from theNational Center for Environmental Prediction (NCEP) final analysis(FNL) dataset at 1° × 1° resolution. The sea surface temperature (SST)is from the NCEP 1° × 1° analysis and a total of 10.000 tracer particlesare assumed for each release in FLEXPART simulations. Backward trajec-tories and emission sensitivity studies during the sampling period indi-cate the possible sources for the aerosol layers, detected both by in-situand remote sensing instruments.
3. Results from ACEMED campaign and discussion
During the period from 1st to 9th of September 2011, the EuropeanFleet for Airborne Research (EUFAR) supported airbornemeasurementsover a wide domain over Greece by deploying the FAAM-BAe146research aircraft. Two flights, one on the 2nd and one on the 9th ofSeptember were performed in the framework of the ACEMED experi-mental campaign, in order to retrieve detailed information about thephysical and chemical aerosol properties, along the flight track of theCALIPSO satellite. ACEMED campaign, supported the collection of qual-ity assured and coordinated ground-based, airborne in-situ and space-borne measurements, to generate representative case studies that willbe further used to study the aerosol type classification scheme, appliedon CALIPSO dataset.
This study is focused on the 2nd of September flight (FAAM flight IDnumber B638), where the research aircraft took-off from Chania (CreteIsland), covering areas from Southern Greece to Athens, at variousheights. The flight duration was approximately 4 ½ hours (~ 08:00–
12:30 UTC), and the aircraft flight track is depicted in Fig. 1-a with theblack dashed line. The green circle, of 220 km radius in Fig. 1-a, isdepicting the GAA used for the spatial and temporal averaging of theon-board in-situ measurements. The GAA, is further zoomed in Fig. 1-b, presenting also the locations of the ground based instrumentation(i.e. stations of sun-sky radiometer and lidar), alongwith the B638 flighttrack. Unfortunately, the flight of 9th of September, was performed dur-ing night time, and thus cannot be used for the validation of LIRIC. Addi-tional information regarding ACEMED and concurrent campaigns(Aegean-Game and CarbonExp) may be found in Bezantakos et al.(2013), Tombrou et al. (2015) and Tsekeri et al. (2016).
During the entire ACEMED campaign period, high values of finemode AOD were observed by the CIMEL sun-sky radiometer. The finemode fraction of columnar AOD at 500 nm was N89%, reaching thehighest values of 91% and 93% (Fig. 2), on 2nd and 3rd of September2011, respectively.Moreover, large Ångström exponent valueswere ob-served during this 8-day period, varying from 1.30 to 1.60 (Fig. 2). Thesimilarity in optical properties observed with AERONET are indicativeof the presence of a consistent aerosol type over Greece, during the en-tire campaign period, especially between, 2nd-3rd and 7th–9th ofSeptember.
3.1. Case study description
For the 2nd of September 2011 (case study examined here), wepresent in Fig. 3, the temporal variability of the columnar aerosol opticalproperties from AERONET. The Ångström exponent varied from 1.77 to1.90with amean value of 1.84±0.02,while theAOD at 340 and 500 nmincreased during morning and noon and remained constant during af-ternoon hours,withmean values of 0.82±0.01 and 0.44±0.01 respec-tively (Fig. 3). The same pattern of the AOD is followed also by thecolumnar water vapor (in cm) as depicted by AERONET. An increaseof the columnar water vapor is observed from around 07:00 UTC to14:00 UTC varying from ~2.00 to 2.80 cm, demonstrating the high tem-poral variability of water content over the atmosphere (Fig. 3). More-over, the volume size distribution retrievals from the photometricdata indicate the presence of rather fine mode particles in the atmo-spheric column (Fig. 4). The dominance of fine mode particles ishighlighted by the bi-modal size distribution with separation radiusranging from 0.44 um at 13:30 UTC to 0.57 um at 14:20 and 15:52 UTC.
Both backscatter and depolarization lidar systems (EOLE and AIAS)were operating during that day from 09:58 to 17:32 UTC. In Fig. 5-awe present the spatio-temporal evolution of the backscattered signalobtained by EOLE at 1064 nm, visualizing the evolution of a distinctaerosol layer extending from2 up to ~3.5 kmover the station. Cloud for-mation is also found at 3 km during 11:00–13:00 UTC. In Fig. 5-b thevertical profiles of relative humidity and potential temperature aredemonstrated as obtained by radiosonde data on 2nd of September(11:22 UTC). The launching area is located at a coastal station around15 km south-west of the lidar station. The transport of moister marineair due to the initiation of a sea breeze circulation results in RH increasereaching up to 60% at the layer 2–3 km. As seen also by theWRF modelresults in Fig. 5-c, the sea breeze flowpenetrates the Attica basin and re-sults in SSW surfacewinds exceeding 7m s−1 at 11:00 UTC. Mechanicalelevation of thesemarine airmasses along the AtticaMountains leads inthe formation of the shallow orographic clouds that are found by thelidar measurements. This is also shown in Fig. 5-d for the area ofNTUA lidar station where the model predicts RH values up to 100% atthe layer 2–3 km during the period 12:00–16:00 UTC. Condensation isalso evident in themodel and the formation of awarmphase orographiccloud with a maximummixing ratio of 0.15 g kg−1 is shown in Fig. 5-daround 11:00–13:00 UTC in accordance with the lidar observations.
In order to avoid the contamination of our retrievals with the pres-ence of low altitude scattered clouds, developed at the top of thatlayer from 11:30 to ~13:00 UTC, we focused our analysis in the timewindow 13:00–15:00 UTC, indicated with a grey rectangle overlaid in
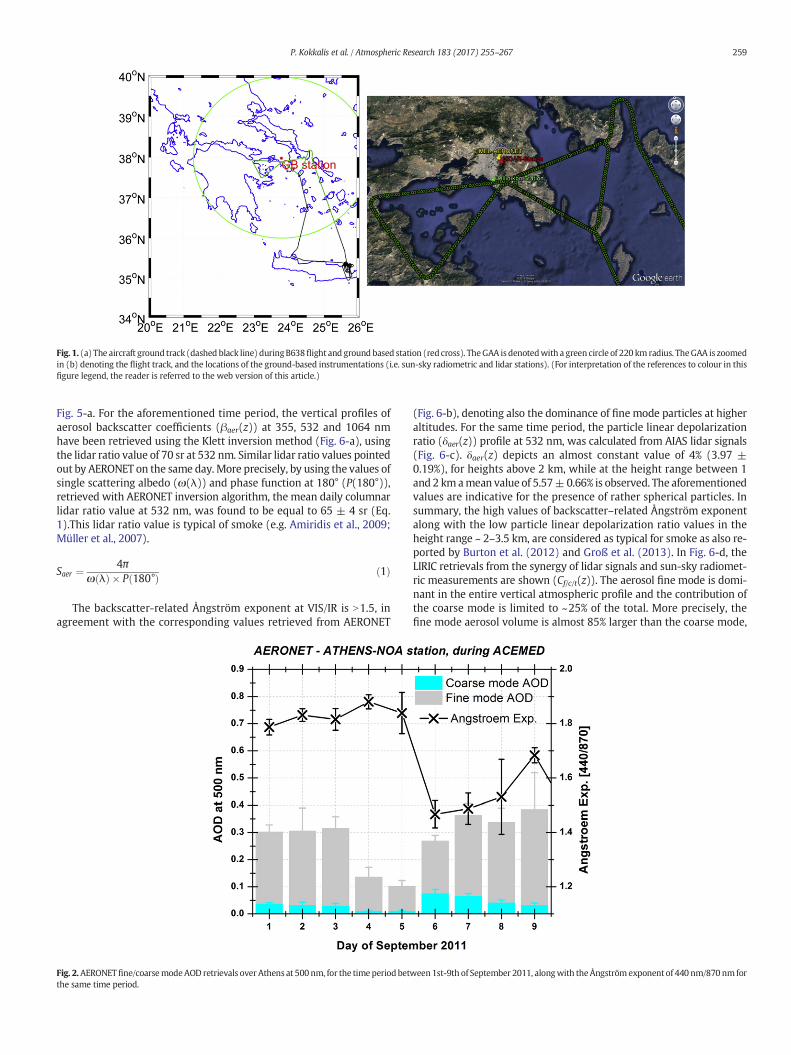
Fig. 1. (a) The aircraft ground track (dashed black line) duringB638flight and ground based station (red cross). TheGAA is denotedwith a green circle of 220 km radius. TheGAA is zoomedin (b) denoting the flight track, and the locations of the ground-based instrumentations (i.e. sun-sky radiometric and lidar stations). (For interpretation of the references to colour in thisfigure legend, the reader is referred to the web version of this article.)
259P. Kokkalis et al. / Atmospheric Research 183 (2017) 255–267
Fig. 5-a. For the aforementioned time period, the vertical profiles ofaerosol backscatter coefficients (βaer(z)) at 355, 532 and 1064 nmhave been retrieved using the Klett inversion method (Fig. 6-a), usingthe lidar ratio value of 70 sr at 532 nm. Similar lidar ratio values pointedout by AERONET on the same day. More precisely, by using the values ofsingle scattering albedo (ω(λ)) and phase function at 180° (P(180°)),retrieved with AERONET inversion algorithm, the mean daily columnarlidar ratio value at 532 nm, was found to be equal to 65 ± 4 sr (Eq.1).This lidar ratio value is typical of smoke (e.g. Amiridis et al., 2009;Müller et al., 2007).
Saer ¼ 4πω λð Þ � P 180°ð Þ ð1Þ
The backscatter-related Ångström exponent at VIS/IR is N1.5, inagreement with the corresponding values retrieved from AERONET
Fig. 2.AERONETfine/coarsemodeAOD retrievals over Athens at 500 nm, for the timeperiod betthe same time period.
(Fig. 6-b), denoting also the dominance of finemode particles at higheraltitudes. For the same time period, the particle linear depolarizationratio (δaer(z)) profile at 532 nm, was calculated from AIAS lidar signals(Fig. 6-c). δaer(z) depicts an almost constant value of 4% (3.97 ±0.19%), for heights above 2 km, while at the height range between 1and 2 kmamean value of 5.57±0.66% is observed. The aforementionedvalues are indicative for the presence of rather spherical particles. Insummary, the high values of backscatter–related Ångström exponentalong with the low particle linear depolarization ratio values in theheight range ~ 2–3.5 km, are considered as typical for smoke as also re-ported by Burton et al. (2012) and Groß et al. (2013). In Fig. 6-d, theLIRIC retrievals from the synergy of lidar signals and sun-sky radiomet-ric measurements are shown (Cf/c/t(z)). The aerosol fine mode is domi-nant in the entire vertical atmospheric profile and the contribution ofthe coarse mode is limited to ~25% of the total. More precisely, thefine mode aerosol volume is almost 85% larger than the coarse mode,
ween1st-9th of September 2011, alongwith theÅngströmexponent of 440 nm/870 nmfor
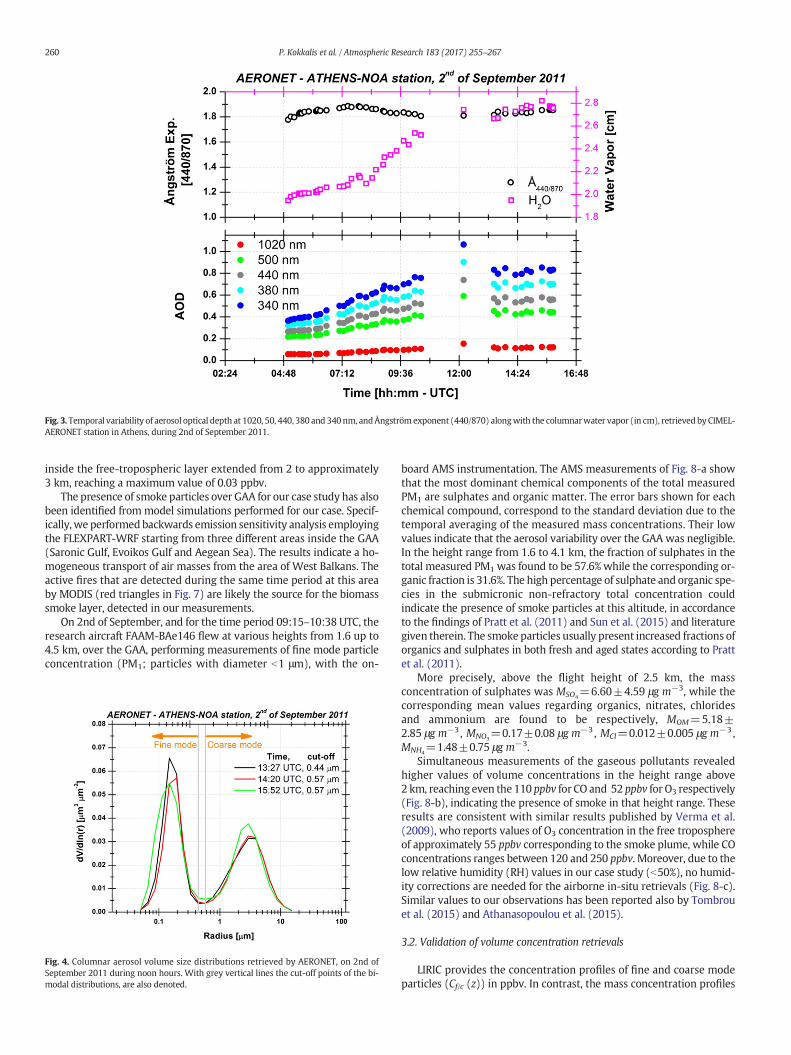
Fig. 3. Temporal variability of aerosol optical depth at 1020, 50, 440, 380 and 340nm, andÅngströmexponent (440/870) alongwith the columnarwater vapor (in cm), retrievedbyCIMEL-AERONET station in Athens, during 2nd of September 2011.
260 P. Kokkalis et al. / Atmospheric Research 183 (2017) 255–267
inside the free-tropospheric layer extended from 2 to approximately3 km, reaching a maximum value of 0.03 ppbv.
The presence of smoke particles over GAA for our case study has alsobeen identified frommodel simulations performed for our case. Specif-ically, we performedbackwards emission sensitivity analysis employingthe FLEXPART-WRF starting from three different areas inside the GAA(Saronic Gulf, Evoikos Gulf and Aegean Sea). The results indicate a ho-mogeneous transport of air masses from the area of West Balkans. Theactive fires that are detected during the same time period at this areaby MODIS (red triangles in Fig. 7) are likely the source for the biomasssmoke layer, detected in our measurements.
On 2nd of September, and for the time period 09:15–10:38 UTC, theresearch aircraft FAAM-BAe146 flew at various heights from 1.6 up to4.5 km, over the GAA, performing measurements of fine mode particleconcentration (PM1; particles with diameter b1 μm), with the on-
Fig. 4. Columnar aerosol volume size distributions retrieved by AERONET, on 2nd ofSeptember 2011 during noon hours. With grey vertical lines the cut-off points of the bi-modal distributions, are also denoted.
board AMS instrumentation. The AMS measurements of Fig. 8-a showthat the most dominant chemical components of the total measuredPM1 are sulphates and organic matter. The error bars shown for eachchemical compound, correspond to the standard deviation due to thetemporal averaging of the measured mass concentrations. Their lowvalues indicate that the aerosol variability over the GAA was negligible.In the height range from 1.6 to 4.1 km, the fraction of sulphates in thetotal measured PM1 was found to be 57.6% while the corresponding or-ganic fraction is 31.6%. The high percentage of sulphate and organic spe-cies in the submicronic non-refractory total concentration couldindicate the presence of smoke particles at this altitude, in accordanceto the findings of Pratt et al. (2011) and Sun et al. (2015) and literaturegiven therein. The smoke particles usually present increased fractions oforganics and sulphates in both fresh and aged states according to Prattet al. (2011).
More precisely, above the flight height of 2.5 km, the massconcentration of sulphates was MSO4
=6.60±4.59 μg m−3, while thecorresponding mean values regarding organics, nitrates, chloridesand ammonium are found to be respectively, MOM=5.18±2.85 μg m−3 , MNO3
=0.17±0.08 μg m−3 , MCl=0.012±0.005 μg m−3 ,MNH4
=1.48±0.75 μg m−3.Simultaneous measurements of the gaseous pollutants revealed
higher values of volume concentrations in the height range above2 km, reaching even the 110 ppbv for CO and 52 ppbv for O3 respectively(Fig. 8-b), indicating the presence of smoke in that height range. Theseresults are consistent with similar results published by Verma et al.(2009), who reports values of O3 concentration in the free troposphereof approximately 55 ppbv corresponding to the smoke plume, while COconcentrations ranges between 120 and 250 ppbv. Moreover, due to thelow relative humidity (RH) values in our case study (b50%), no humid-ity corrections are needed for the airborne in-situ retrievals (Fig. 8-c).Similar values to our observations has been reported also by Tombrouet al. (2015) and Athanasopoulou et al. (2015).
3.2. Validation of volume concentration retrievals
LIRIC provides the concentration profiles of fine and coarse modeparticles (Cf/c (z)) in ppbv. In contrast, the mass concentration profiles
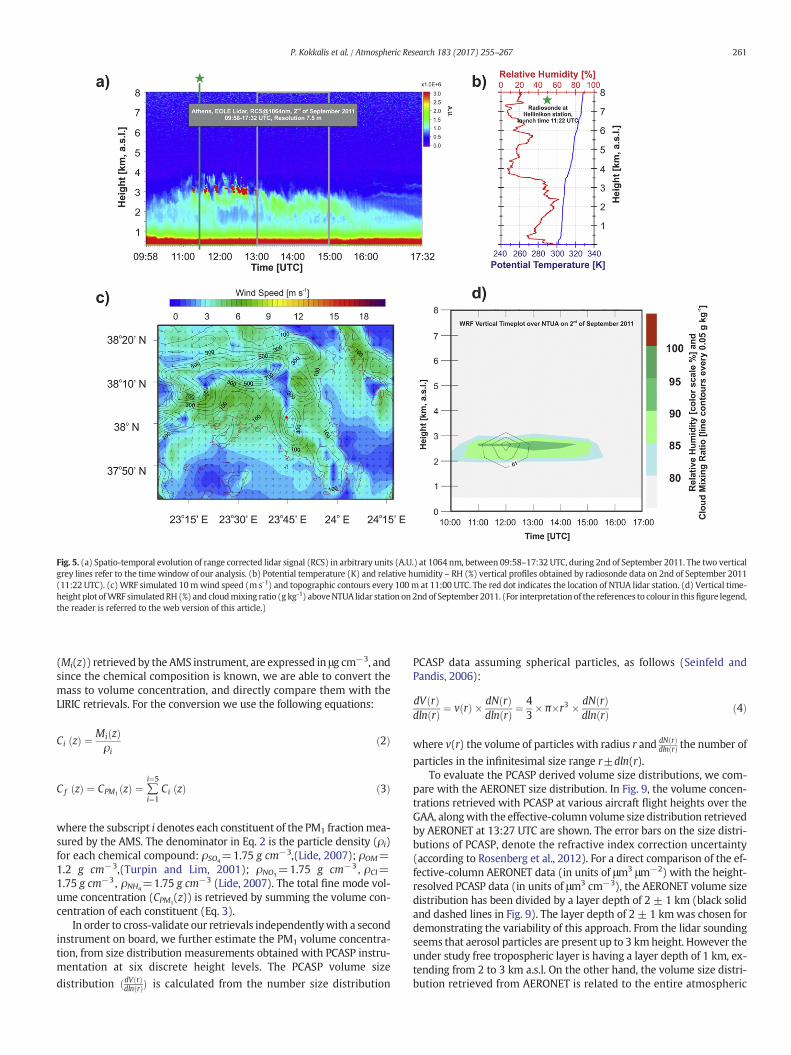
Fig. 5. (a) Spatio-temporal evolution of range corrected lidar signal (RCS) in arbitrary units (A.U.) at 1064 nm, between 09:58–17:32 UTC, during 2nd of September 2011. The two verticalgrey lines refer to the time window of our analysis. (b) Potential temperature (K) and relative humidity – RH (%) vertical profiles obtained by radiosonde data on 2nd of September 2011(11:22 UTC). (c)WRF simulated 10mwind speed (m s-1) and topographic contours every 100m at 11:00 UTC. The red dot indicates the location of NTUA lidar station. (d) Vertical time-height plot ofWRF simulatedRH (%) and cloudmixing ratio (g kg-1) aboveNTUA lidar station on 2nd of September 2011. (For interpretation of the references to colour in thisfigure legend,the reader is referred to the web version of this article.)
261P. Kokkalis et al. / Atmospheric Research 183 (2017) 255–267
(Mi(z)) retrieved by the AMS instrument, are expressed in μg cm−3, andsince the chemical composition is known, we are able to convert themass to volume concentration, and directly compare them with theLIRIC retrievals. For the conversion we use the following equations:
Ci zð Þ ¼ Mi zð Þρi
ð2Þ
C f zð Þ ¼ CPM1 zð Þ ¼ ∑i¼5
i¼1Ci zð Þ ð3Þ
where the subscript i denotes each constituent of the PM1 fractionmea-sured by the AMS. The denominator in Eq. 2 is the particle density (ρi)for each chemical compound: ρSO4
=1.75 g cm−3,(Lide, 2007); ρOM=1.2 g cm−3,(Turpin and Lim, 2001); ρNO3
=1.75 g cm−3 , ρCl=1.75 g cm−3 , ρNH4
=1.75 g cm−3 (Lide, 2007). The total fine mode vol-ume concentration (CPM1
(z)) is retrieved by summing the volume con-centration of each constituent (Eq. 3).
In order to cross-validate our retrievals independentlywith a secondinstrument on board, we further estimate the PM1 volume concentra-tion, from size distribution measurements obtained with PCASP instru-mentation at six discrete height levels. The PCASP volume size
distribution ðdVðrÞdlnðrÞÞ is calculated from the number size distribution
PCASP data assuming spherical particles, as follows (Seinfeld andPandis, 2006):
dV rð Þdln rð Þ ¼ v rð Þ � dN rð Þ
dln rð Þ ¼43� π�r3 � dN rð Þ
dln rð Þ ð4Þ
where v(r) the volume of particles with radius r and dNðrÞdlnðrÞ the number of
particles in the infinitesimal size range r±dln(r).To evaluate the PCASP derived volume size distributions, we com-
pare with the AERONET size distribution. In Fig. 9, the volume concen-trations retrieved with PCASP at various aircraft flight heights over theGAA, alongwith the effective-columnvolume size distribution retrievedby AERONET at 13:27 UTC are shown. The error bars on the size distri-butions of PCASP, denote the refractive index correction uncertainty(according to Rosenberg et al., 2012). For a direct comparison of the ef-fective-column AERONET data (in units of μm3 μm−2) with the height-resolved PCASP data (in units of μm3 cm−3), the AERONET volume sizedistribution has been divided by a layer depth of 2 ± 1 km (black solidand dashed lines in Fig. 9). The layer depth of 2 ± 1 kmwas chosen fordemonstrating the variability of this approach. From the lidar soundingseems that aerosol particles are present up to 3 kmheight. However theunder study free tropospheric layer is having a layer depth of 1 km, ex-tending from 2 to 3 km a.s.l. On the other hand, the volume size distri-bution retrieved from AERONET is related to the entire atmospheric

Fig. 6. From left to right vertical profiles of: (a) the aerosol backscatter coefficient at 355, 532 and 1064 nm (Mm−1 sr−1), (b) the backscatter related Ångström exponent, (c) the particledepolarization ratio at 532 nm (%), retrieved from backscatter and depolarization lidar measurements and (d) volume concentration (ppbv) of fine/coarse aerosol mode, retrieved fromLIRIC, on 2nd of September 2011 (12:59–14:59 UTC).
262 P. Kokkalis et al. / Atmospheric Research 183 (2017) 255–267
column, in contrast to the size distributions retrieved from PCASPmea-surements at various height bins. It is observed that in the height rangeof 2–3 km, the volume concentration of fine mode particles is predom-inant over the corresponding coarse mode, as also observed in LIRIC re-trievals. Moreover, a good correlation of the two distributions is foundin the fine mode range of the retrievals. The cut-off radius of finemode has been estimated by AERONET at 0.439 μm, with almost 7% dif-ference from the in-situ observations performed with PCASP(0.472 μm). Additionally, the fine mode width (FWHM) of the size dis-tribution measured by PCASP was found to vary from 0.143 μm (at
Fig. 7. Emission sensitivity (log) in s m3 kg−1 for 3 days FLEXPART-WRF backwards calculationabove Saronic Gulf, Evoikos Gulf and Aegean Sea (GAA). The red triangles indicate the location oreferences to colour in this figure legend, the reader is referred to the web version of this artic
2.92 km) to 0.168 μm (at 3.25 km). The corresponding value retrievedfrom AERONET columnar measurements was found to be 8.5 to 27.5%lower (0.132 μm). Regarding themodal radius of thefinemodedistribu-tions, PCASP measurements revealed the value of 0.133 μm whileAERONET columnar observations showed a modal radius at 0.148 μm.
Following the aforementioned methodology, we present in Fig. 10the volume concentrations acquired with the airborne in-situ instru-ments (CPM1
(z) in ppbv; red circles AMS; black circles PCASP) alongwith the volume concentration, of fine aerosol mode (Cf(z) in ppbv),as derived from the LIRIC algorithm (blue line). Integrating the volume
starting at 2nd of September 2011–14:00 UTC. The arrival (receptor) layers are at 2–3 kmf active fires as detected byMODIS during the simulation period. (For interpretation of thele.)
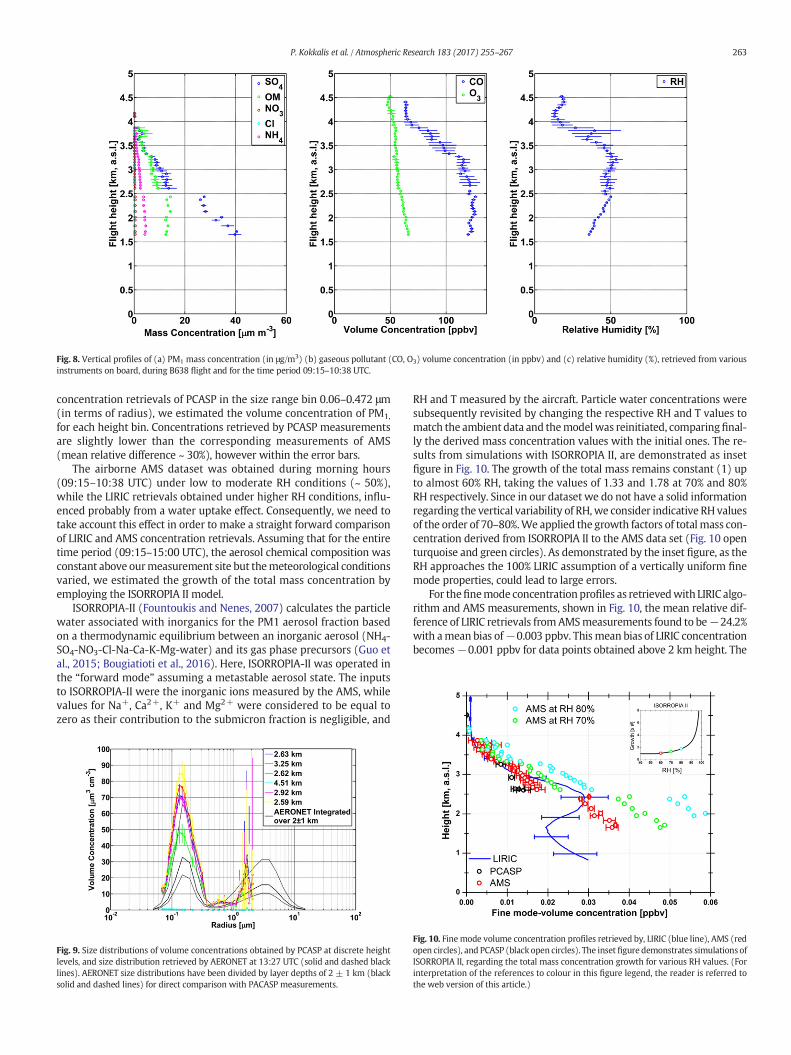
Fig. 8. Vertical profiles of (a) PM1 mass concentration (in μg/m3) (b) gaseous pollutant (CO, O3) volume concentration (in ppbv) and (c) relative humidity (%), retrieved from variousinstruments on board, during B638 flight and for the time period 09:15–10:38 UTC.
263P. Kokkalis et al. / Atmospheric Research 183 (2017) 255–267
concentration retrievals of PCASP in the size range bin 0.06–0.472 μm(in terms of radius), we estimated the volume concentration of PM1,
for each height bin. Concentrations retrieved by PCASP measurementsare slightly lower than the corresponding measurements of AMS(mean relative difference ~ 30%), however within the error bars.
The airborne AMS dataset was obtained during morning hours(09:15–10:38 UTC) under low to moderate RH conditions (~ 50%),while the LIRIC retrievals obtained under higher RH conditions, influ-enced probably from a water uptake effect. Consequently, we need totake account this effect in order to make a straight forward comparisonof LIRIC and AMS concentration retrievals. Assuming that for the entiretime period (09:15–15:00 UTC), the aerosol chemical composition wasconstant above ourmeasurement site but themeteorological conditionsvaried, we estimated the growth of the total mass concentration byemploying the ISORROPIA II model.
ISORROPIA-II (Fountoukis and Nenes, 2007) calculates the particlewater associated with inorganics for the PM1 aerosol fraction basedon a thermodynamic equilibrium between an inorganic aerosol (NH4-SO4-NO3-Cl-Na-Ca-K-Mg-water) and its gas phase precursors (Guo etal., 2015; Bougiatioti et al., 2016). Here, ISORROPIA-II was operated inthe “forward mode” assuming a metastable aerosol state. The inputsto ISORROPIA-II were the inorganic ions measured by the AMS, whilevalues for Na+, Ca2+, K+ and Mg2+ were considered to be equal tozero as their contribution to the submicron fraction is negligible, and
Fig. 9. Size distributions of volume concentrations obtained by PCASP at discrete heightlevels, and size distribution retrieved by AERONET at 13:27 UTC (solid and dashed blacklines). AERONET size distributions have been divided by layer depths of 2 ± 1 km (blacksolid and dashed lines) for direct comparison with PACASP measurements.
RH and T measured by the aircraft. Particle water concentrations weresubsequently revisited by changing the respective RH and T values tomatch the ambient data and themodelwas reinitiated, comparingfinal-ly the derived mass concentration values with the initial ones. The re-sults from simulations with ISORROPIA II, are demonstrated as insetfigure in Fig. 10. The growth of the total mass remains constant (1) upto almost 60% RH, taking the values of 1.33 and 1.78 at 70% and 80%RH respectively. Since in our dataset we do not have a solid informationregarding the vertical variability of RH,we consider indicative RHvaluesof the order of 70–80%.We applied the growth factors of totalmass con-centration derived from ISORROPIA II to the AMS data set (Fig. 10 openturquoise and green circles). As demonstrated by the inset figure, as theRH approaches the 100% LIRIC assumption of a vertically uniform finemode properties, could lead to large errors.
For thefinemode concentration profiles as retrievedwith LIRIC algo-rithm and AMS measurements, shown in Fig. 10, the mean relative dif-ference of LIRIC retrievals fromAMSmeasurements found to be−24.2%with amean bias of−0.003 ppbv. Thismean bias of LIRIC concentrationbecomes−0.001 ppbv for data points obtained above 2 km height. The
Fig. 10. Finemode volume concentration profiles retrieved by, LIRIC (blue line), AMS (redopen circles), and PCASP (black open circles). The inset figure demonstrates simulations ofISORROPIA II, regarding the total mass concentration growth for various RH values. (Forinterpretation of the references to colour in this figure legend, the reader is referred tothe web version of this article.)
264 P. Kokkalis et al. / Atmospheric Research 183 (2017) 255–267
RMSE value found to be 0.006 with mean fractional bias andmean frac-tional error of the order of −0.136 and 0.315 respectively.
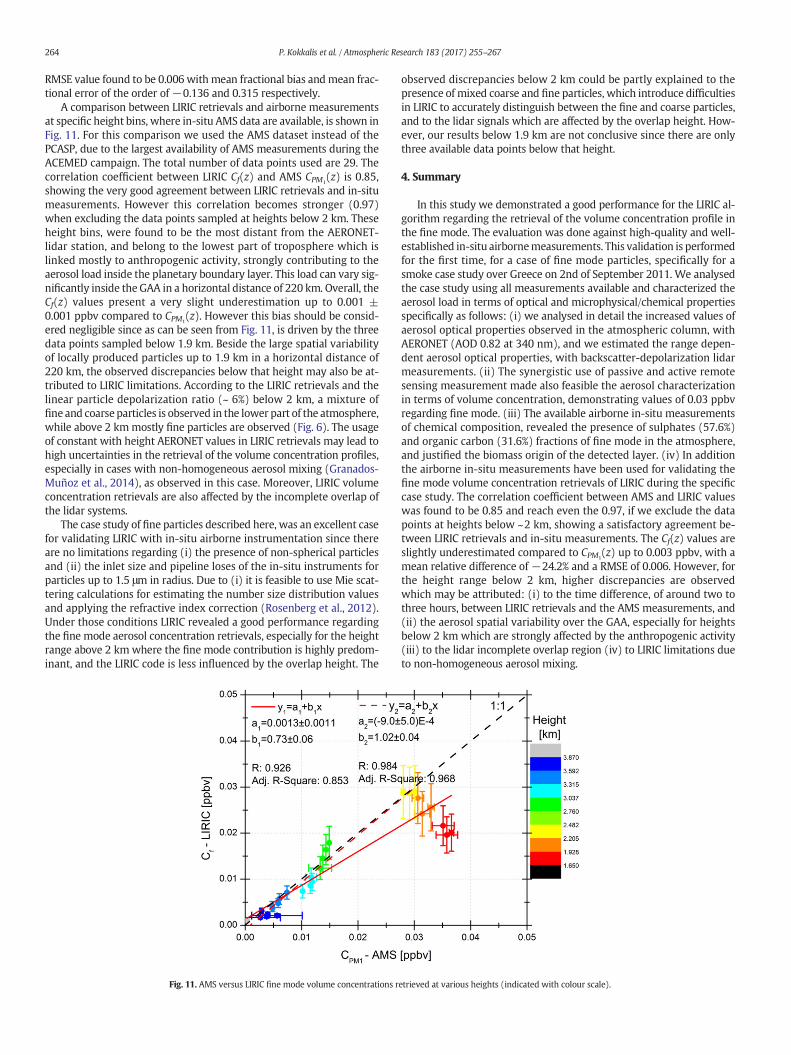
A comparison between LIRIC retrievals and airborne measurementsat specific height bins, where in-situ AMS data are available, is shown inFig. 11. For this comparison we used the AMS dataset instead of thePCASP, due to the largest availability of AMS measurements during theACEMED campaign. The total number of data points used are 29. Thecorrelation coefficient between LIRIC Cf(z) and AMS CPM1
(z) is 0.85,showing the very good agreement between LIRIC retrievals and in-situmeasurements. However this correlation becomes stronger (0.97)when excluding the data points sampled at heights below 2 km. Theseheight bins, were found to be the most distant from the AERONET-lidar station, and belong to the lowest part of troposphere which islinked mostly to anthropogenic activity, strongly contributing to theaerosol load inside the planetary boundary layer. This load can vary sig-nificantly inside the GAA in a horizontal distance of 220 km. Overall, theCf(z) values present a very slight underestimation up to 0.001 ±0.001 ppbv compared to CPM1
(z). However this bias should be consid-ered negligible since as can be seen from Fig. 11, is driven by the threedata points sampled below 1.9 km. Beside the large spatial variabilityof locally produced particles up to 1.9 km in a horizontal distance of220 km, the observed discrepancies below that height may also be at-tributed to LIRIC limitations. According to the LIRIC retrievals and thelinear particle depolarization ratio (~ 6%) below 2 km, a mixture offine and coarse particles is observed in the lower part of the atmosphere,while above 2 kmmostly fine particles are observed (Fig. 6). The usageof constant with height AERONET values in LIRIC retrievals may lead tohigh uncertainties in the retrieval of the volume concentration profiles,especially in cases with non-homogeneous aerosol mixing (Granados-Muñoz et al., 2014), as observed in this case. Moreover, LIRIC volumeconcentration retrievals are also affected by the incomplete overlap ofthe lidar systems.
The case study of fine particles described here, was an excellent casefor validating LIRIC with in-situ airborne instrumentation since thereare no limitations regarding (i) the presence of non-spherical particlesand (ii) the inlet size and pipeline loses of the in-situ instruments forparticles up to 1.5 μm in radius. Due to (i) it is feasible to use Mie scat-tering calculations for estimating the number size distribution valuesand applying the refractive index correction (Rosenberg et al., 2012).Under those conditions LIRIC revealed a good performance regardingthe fine mode aerosol concentration retrievals, especially for the heightrange above 2 km where the fine mode contribution is highly predom-inant, and the LIRIC code is less influenced by the overlap height. The
Fig. 11. AMS versus LIRIC fine mode volume concentrations r
observed discrepancies below 2 km could be partly explained to thepresence of mixed coarse and fine particles, which introduce difficultiesin LIRIC to accurately distinguish between the fine and coarse particles,and to the lidar signals which are affected by the overlap height. How-ever, our results below 1.9 km are not conclusive since there are onlythree available data points below that height.
4. Summary
In this study we demonstrated a good performance for the LIRIC al-gorithm regarding the retrieval of the volume concentration profile inthe fine mode. The evaluation was done against high-quality and well-established in-situ airbornemeasurements. This validation is performedfor the first time, for a case of fine mode particles, specifically for asmoke case study over Greece on 2nd of September 2011. We analysedthe case study using all measurements available and characterized theaerosol load in terms of optical and microphysical/chemical propertiesspecifically as follows: (i) we analysed in detail the increased values ofaerosol optical properties observed in the atmospheric column, withAERONET (AOD 0.82 at 340 nm), and we estimated the range depen-dent aerosol optical properties, with backscatter-depolarization lidarmeasurements. (ii) The synergistic use of passive and active remotesensing measurement made also feasible the aerosol characterizationin terms of volume concentration, demonstrating values of 0.03 ppbvregarding fine mode. (iii) The available airborne in-situ measurementsof chemical composition, revealed the presence of sulphates (57.6%)and organic carbon (31.6%) fractions of fine mode in the atmosphere,and justified the biomass origin of the detected layer. (iv) In additionthe airborne in-situ measurements have been used for validating thefine mode volume concentration retrievals of LIRIC during the specificcase study. The correlation coefficient between AMS and LIRIC valueswas found to be 0.85 and reach even the 0.97, if we exclude the datapoints at heights below ~2 km, showing a satisfactory agreement be-tween LIRIC retrievals and in-situ measurements. The Cf(z) values areslightly underestimated compared to CPM1
(z) up to 0.003 ppbv, with amean relative difference of −24.2% and a RMSE of 0.006. However, forthe height range below 2 km, higher discrepancies are observedwhich may be attributed: (i) to the time difference, of around two tothree hours, between LIRIC retrievals and the AMS measurements, and(ii) the aerosol spatial variability over the GAA, especially for heightsbelow 2 km which are strongly affected by the anthropogenic activity(iii) to the lidar incomplete overlap region (iv) to LIRIC limitations dueto non-homogeneous aerosol mixing.
etrieved at various heights (indicated with colour scale).
265P. Kokkalis et al. / Atmospheric Research 183 (2017) 255–267
Acknowledgment
The research leading to these results has received funding from theEuropean Union Seventh Framework Programme ACTRIS-1 (grantagreement no. 262254), and the European Union's Horizon 2020 Re-search and Innovation Programme ACTRIS-2 (grant agreement no.654109). Airborne data was obtained using the BAe-146-301 Atmo-spheric Research Aircraft (ARA) flown by Directflight Ltd. and managedby the Facility for Airborne Atmospheric Measurements (FAAM), whichis a joint entity of the Natural Environment Research Council (NERC)and theMet Office. Flight hours, has been founded by EUFAR: EuropeanFacility for Airborne Research in Environmental and Geo-sciences. Theauthors would like to acknowledge also the funding from EuropeanUnion Union's Horizon 2020 Programme ECARS (grant agreement no.692014).
References
Ackermann, J., 1998. The extinction-to-backscatter ratio of tropospheric aerosol: a numer-ical study. J. Atmos. Ocean. Technol. 15 (4), 1043–1050.
Allan, J.D., Jimenez, J.L., Williams, P.I., Alfarra, M.R., Bower, K.N., Jayne, J.T., Coe, H.,Worsnop, D.R., 2003. Quantitative sampling using an aerodyne aerosol mass spec-trometer 1. Techniques of data interpretation and error analysis. J. Geophys. Res.Atmos. 108 (D3), 4090–4100. http://dx.doi.org/10.1029/2002JD002358.
Alvarez, J.M., Vaughan, M.A., Hostetler, C.A., Hunt, W.H., Winker, D.M., 2006. Calibrationtechnique for polarization-sensitive lidars. J. Atmos. Ocean. Technol. 23 (5), 683–699.
Amiridis, V., Balis, D.S., Kazadzis, S., Bais, A., Giannakaki, E., Papayannis, A., Zerefos, C.,2005. Four-year aerosol observations with a Raman lidar at Thessaloniki, Greece, inthe framework of European Aerosol Research Lidar Network (EARLINET).J. Geophys. Res. 110 (D21). http://dx.doi.org/10.1029/2005JD006190.
Amiridis, V., Balis, D.S., Giannakaki, E., Stohl, A., Kazadzis, S., Koukouli, M.E., Zanis, P., 2009.Optical characteristics of biomass burning aerosols over Southeastern Europe deter-mined from UV-Raman lidar measurements. Atmos. Chem. Phys. 9 (7), 2431–2440.http://dx.doi.org/10.5194/acp-9-2431-2009.
Ansmann, A., Riebesell, M., Weitkamp, C., 1990. Measurement of atmospheric aerosol ex-tinction profiles with a Raman lidar. Opt. Lett. 15 (13), 746. http://dx.doi.org/10.1364/OL.15.000746.
Ansmann, A., Wandinger, U., Riebesell, M., Weitkamp, C., Michaelis, W., 1992. Indepen-dent measurement of extinction and backscatter profiles in cirrus clouds by using acombined Raman elastic-backscatter lidar. Appl. Opt. 31 (33), 7113. http://dx.doi.org/10.1364/AO.31.007113.
Ansmann, A., Tesche, M., Seifert, P., Groß, S., Freudenthaler, V., Apituley, A., Wilson, K.M.,Serikov, I., Linné, H., Heinold, B., Hiebsch, A., Schnell, F., Schmidt, J., Mattis, I.,Wandinger, U., Wiegner, M., 2011. Ash and fine-mode particle mass profiles fromEARLINET-AERONET observations over central Europe after the eruptions of theEyjafjallajökull volcano in 2010. J. Geophys. Res. Atmos. 116 (D20), D00U02. http://dx.doi.org/10.1029/2010JD015567.
Ansmann, A., Seifert, P., Tesche, M., Wandinger, U., 2012. Profiling of fine and coarse particlemass: case studies of Saharan dust and Eyjafjallajökull/Grimsvötn volcanic plumes.Atmos. Chem. Phys. 12 (20), 9399–9415. http://dx.doi.org/10.5194/acp-12-9399-2012.
Athanasopoulou, E., Protonotariou, A.P., Bossioli, E., Dandou, A., Tombrou, M., Allan, J.D.,Coe, H., Mihalopoulos, N., Kalogiros, J., Bacak, A., Sciare, J., Biskos, G., 2015. Aerosolchemistry above an extended archipelago of the eastern Mediterranean basin duringstrong northernwinds. Atmos. Chem. Phys. 15 (14), 8401–8421. http://dx.doi.org/10.5194/acp-15-8401-2015.
Basart, S., Pérez, C., Nickovic, S., Cuevas, E., Baldasano, J.M., 2012. Development and eval-uation of the BSC-DREAM8b dust regional model over Northern Africa, the Mediter-ranean and the Middle East. Tellus B 64 [online] Available from http://www.tellusb.net/index.php/tellusb/article/view/18539 Accessed 16 May 2016.
Baumgardner, D., Newton, R., Jonsson, H., Dawson, W., O'Connor, D., 2001. The Cloud,Aerosol and Precipitation Spectrometer: A New Instrument for CloudInvestigations[online] Available from http://calhoun.nps.edu/handle/10945/46132Accessed 16 May 2016 .
Bezantakos, S., Barmpounis, K., Giamarelou, M., Bossioli, E., Tombrou, M., Mihalopoulos,N., Eleftheriadis, K., Kalogiros, J., Allan, J.D., Bacak, A., Percival, C.J., Coe, H., Biskos, G.,2013. Chemical composition and hygroscopic properties of aerosol particles overthe Aegean Sea. Atmos. Chem. Phys. 13 (22), 11595–11608. http://dx.doi.org/10.5194/acp-13-11595-2013.
Biele, J., Beyerle, G., Baumgarten, G., 2000. Polarization lidar: correction of instrumentaleffects. Opt. Express 7 (12), 427–435.
Binietoglou, I., Basart, S., Alados-Arboledas, L., Amiridis, V., Argyrouli, A., Baars, H.,Baldasano, J.M., Balis, D., Belegante, L., Bravo-Aranda, J.A., Burlizzi, P., Carrasco, V.,Chaikovsky, A., Comerón, A., D'Amico, G., Filioglou, M., Granados-Muñoz, M.J.,Guerrero-Rascado, J.L., Ilic, L., Kokkalis, P., Maurizi, A., Mona, L., Monti, F., Muñoz-Porcar, C., Nicolae, D., Papayannis, A., Pappalardo, G., Pejanovic, G., Pereira, S.N.,Perrone, M.R., Pietruczuk, A., Posyniak, M., Rocadenbosch, F., Rodríguez-Gómez, A.,Sicard, M., Siomos, N., Szkop, A., Terradellas, E., Tsekeri, A., Vukovic, A., Wandinger,U., Wagner, J., 2015. A methodology for investigating dust model performanceusing synergistic EARLINET/AERONET dust concentration retrievals. AtmosphericMeas. Tech. 8 (9), 3577–3600. http://dx.doi.org/10.5194/amt-8-3577-2015.
Bösenberg, J., Brassington, D.J., Simon, P.C., 1997. Instrument Development for Atmo-spheric Research and Monitoring. Springer Berlin Heidelberg, Berlin, Heidelberg.
Bösenberg, J., Matthias, V., Amodeo, A., Amoiridis, V., Ansmann, A., Baldasano, J.M., Balin, I.,Balis, D., Böckmann, D., Boselli, A., Carlsson, G., Chaikovsky, A., Chourdakis, G.,Comerón, A., Tomasi, F., Eixmann, R., Freudenthaler, V., Giehl, H., Grigorov, I.,Hågård, A., Iarlori, M., Kirsche, A., Kolarov, G., Komguem, L., Kreipl, S., Kumpf, W.,Larchevêque, G., Linné, H., Matthey, R., Mattis, I., Mekler, A., Mironova, I., Mitev, V.,Mona, L., Müller, D., Music, S., Nickovic, S., Pandolfi, M., Papayannis, A., Pappalardo,G., Pelon, H., Pérez, C., Perrone, R.M., Persson, R., Resendes, D.P., Rizi, V.,Rocadenbosch, F., Rodrigues, J.A., Sauvage, L., Schneidenbach, L., Schumacher, R.,Shcherbakov, V., Simeonov, V., Sobolewski, P., Spinelli, N., Stachlewska, I., Stoyanov,D., Trickl, T., Tsaknakis, G., Vaughan, G., Wandinger, U., Wang, X., Wiegner, M.,Zavrtanik, M., Zerefos, C., 2003. EARLINET: A European Aerosol Research Lidar Net-work to Establish an Aerosol Climatology. MPI Report 348. Max-Planck-Institut fürMeteorologie.
Bougiatioti, A., Nikolaou, P., Stavroulas, I., Kouvarakis, G., Weber, R., Nenes, A., Kanakidou,M., Mihalopoulos, N., 2016. Particle water and pH in the eastern Mediterranean:source variability and implications for nutrient availability. Atmos. Chem. Phys. 16(7), 4579–4591.
Brioude, J., Arnold, D., Stohl, A., Cassiani, M., Morton, D., Seibert, P., Angevine, W., Evan, S.,Dingwell, A., Fast, J.D., Easter, R.C., Pisso, I., Burkhart, J., Wotawa, G., 2013. The La-grangian particle dispersion model FLEXPART-WRF version 3.1. Geosci. Model Dev.6 (6), 1889–1904. http://dx.doi.org/10.5194/gmd-6-1889-2013.
Burton, S.P., Ferrare, R.A., Hostetler, C.A., Hair, J.W., Rogers, R.R., Obland, M.D., Butler, C.F.,Cook, A.L., Harper, D.B., Froyd, K.D., 2012. Aerosol classification using airborne highspectral resolution Lidar measurements – methodology and examples. AtmosphericMeas. Tech. 5 (1), 73–98. http://dx.doi.org/10.5194/amt-5-73-2012.
Cai, Y., Snider, J.R., Wechsler, P., 2013. Calibration of the passive cavity aerosol spectrom-eter probe for airborne determination of the size distribution. Atmospheric Meas.Tech. 6 (9), 2349–2358. http://dx.doi.org/10.5194/amt-6-2349-2013.
Cairo, F., Di Donfrancesco, G., Adriani, A., Pulvirenti, L., Fierli, F., 1999. Comparison of var-ious linear depolarization parameters measured by lidar. Appl. Opt. 38 (21),4425–4432.
Canagaratna, M.R., Jayne, J.T., Jimenez, J.L., Allan, J.D., Alfarra, M.R., Zhang, Q., Onasch, T.B.,Drewnick, F., Coe, H., Middlebrook, A., Delia, A., Williams, L.R., Trimborn, A.M.,Northway, M.J., DeCarlo, P.F., Kolb, C.E., Davidovits, P., Worsnop, D.R., 2007. Chemicaland microphysical characterization of ambient aerosols with the aerodyne aerosolmass spectrometer. Mass Spectrom. Rev. 26 (2), 185–222. http://dx.doi.org/10.1002/mas.20115.
Chaikovsky, A., Dubovik, O., Holben, B., Bril, A., Goloub, P., Tanré, D., Pappalardo, G.,Wandinger, U., Chaikovskaya, L., Denisov, S., Grudo, J., Lopatin, A., Karol, Y.,Lapyonok, T., Amiridis, V., Ansmann, A., Apituley, A., Allados-Arboledas, L.,Binietoglou, I., Boselli, A., D'Amico, G., Freudenthaler, V., Giles, D., Granados-Muñoz,M.J., Kokkalis, P., Nicolae, D., Oshchepkov, S., Papayannis, A., Perrone, M.R.,Pietruczuk, A., Rocadenbosch, F., Sicard, M., Slutsker, I., Talianu, C., De Tomasi, F.,Tsekeri, A., Wagner, J., Wang, X., 2016. Lidar-Radiometer Inversion Code (LIRIC) forthe retrieval of vertical aerosol properties from combined lidar/radiometer data: de-velopment and distribution in EARLINET. Atmospheric Meas. Tech. 9 (3), 1181–1205.http://dx.doi.org/10.5194/amt-9-1181-2016.
Comerón, A., Rocadenbosch, F., López, M.A., Rodríguez, A., Muñoz, C., García-Vizcaíno, D.,Sicard, M., 2004. Effects of noise on lidar data inversion with the backward algorithm.Appl. Opt. 43 (12), 2572–2577.
Dubovik, O., King, M.D., 2000. A flexible inversion algorithm for retrieval of aerosol opticalproperties from sun and sky radiance measurements. J. Geophys. Res. 105 (20) (673–20).
Dubovik, O., Sinyuk, A., Lapyonok, T., Holben, B.N., Mishchenko, M., Yang, P., Eck, T.F.,Volten, H., Muñoz, O., Veihelmann, B., van der Zande, W.J., Leon, J.-F., Sorokin, M.,Slutsker, I., 2006. Application of spheroid models to account for aerosol particlenonsphericity in remote sensing of desert dust. J. Geophys. Res. Atmos. 111 (D11),D11208. http://dx.doi.org/10.1029/2005JD006619.
Eck, T.F., Holben, B.N., Reid, J.S., Dubovik, O., Smirnov, A., O'Neill, N.T., Slutsker, I., Kinne, S.,1999. Wavelength dependence of the optical depth of biomass burning, urban, anddesert dust aerosols. J. Geophys. Res. Atmos. 104 (D24), 31333–31349. http://dx.doi.org/10.1029/1999JD900923.
Eloranta, E.E., 2005. High spectral resolution lidar. In: Weitkamp, D.C. (Ed.), Lidar. Spring-er, New York , pp. 143–163 [online] Available from http://link.springer.com/chapter/10.1007/0-387-25101-4_5 Accessed 31 August 2016.
Fernald, F.G., Herman, B.M., Reagan, J.A., 1972. Determination of Aerosol Height Distribu-tion by Lidar. J. Appl. Meteorol. 11, 482–489.
Fountoukis, C., Nenes, A., 2007. ISORROPIA II: a computationally efficient thermodynamicequilibrium model for K+ −Ca2+ −Mg2+ −NH4+ −Na+ −SO 4
2- - NO3- - Cl- -H2O
aerosols. Atmos. Chem. Phys. 7 (17), 4639–4659.Freudenthaler, V., Esselborn, M., Wiegner, M., Heese, B., Tesche, M., Ansmann, A., Müller,
D., Althausen, D., Wirth, M., Fix, A., Ehret, G., Knippertz, P., Toledano, C., Gasteiger, J.,Garhammer, M., Seefeldner, M., 2009. Depolarization ratio profiling at several wave-lengths in pure Saharan dust during SAMUM 2006. Tellus B 61 (1), 165–179. http://dx.doi.org/10.1111/j.1600-0889.2008.00396.x.
Giannakaki, E., Pfüller, A., Korhonen, K., Mielonen, T., Laakso, L., Vakkari, V., Baars, H.,Engelmann, R., Beukes, J.P., Van Zyl, P.G., Josipovic, M., Tiitta, P., Chiloane, K., Piketh,S., Lihavainen, H., Lehtinen, K.E.J., Komppula, M., 2015. One year of Raman lidar obser-vations of free-tropospheric aerosol layers over South Africa. Atmos. Chem. Phys. 15(10), 5429–5442. http://dx.doi.org/10.5194/acp-15-5429-2015.
Granados-Muñoz, M.J., Guerrero-Rascado, J.L., Bravo-Aranda, J.A., Navas-Guzmán, F.,Valenzuela, A., Lyamani, H., Chaikovsky, A., Wandinger, U., Ansmann, A., Dubovik,O., Grudo, J.O., Alados-Arboledas, L., 2014. Retrieving aerosol microphysical proper-ties by Lidar-Radiometer Inversion Code (LIRIC) for different aerosol types:
266 P. Kokkalis et al. / Atmospheric Research 183 (2017) 255–267
microphysical properties by LIRIC. J. Geophys. Res. Atmos. 119 (8), 4836–4858. http://dx.doi.org/10.1002/2013JD021116.
Granados-Muñoz, M.J., Bravo-Aranda, J.A., Baumgardner, D., Guerrero-Rascado, J.L., Pérez-Ramírez, D., Navas-Guzmán, F., Veselovskii, I., Lyamani, H., Valenzuela, A., Olmo, F.J.,Titos, G., Andrey, J., Chaikovsky, A., Dubovik, O., Gil-Ojeda, M., Alados-Arboledas, L.,2016a. A comparative study of aerosol microphysical properties retrieved fromground-based remote sensing and aircraft in situ measurements during a Saharandust event. Atmospheric Meas. Tech. 9 (3), 1113–1133. http://dx.doi.org/10.5194/amt-9-1113-2016.
Granados-Muñoz, M.J., Navas-Guzmán, F., Guerrero-Rascado, J.L., Bravo-Aranda, J.A.,Binietoglou, I., Pereira, S.N., Basart, S., Baldasano, J.M., Belegante, L., Chaikovsky, A.,Comerón, A., D'Amico, G., Dubovik, O., Ilic, L., Kokkalis, P., Muñoz-Porcar, C.,Nickovic, S., Nicolae, D., Olmo, F.J., Papayannis, A., Pappalardo, G., Rodríguez, A.,Schepanski, K., Sicard, M., Vukovic, A., Wandinger, U., Dulac, F., Alados-Arboledas, L.,2016b. Profiling of aerosol microphysical properties at several EARLINET/AERONETsites during the July 2012 ChArMEx/EMEP campaign. Atmos. Chem. Phys. 16 (11),7043–7066. http://dx.doi.org/10.5194/acp-16-7043-2016.
Groß, S., Tesche, M., Freudenthaler, V., Toledano, C., Wiegner, M., Ansmann, A., Althausen,D., Seefeldner, M., 2011. Characterization of Saharan dust, marine aerosols and mix-tures of biomass-burning aerosols and dust by means of multi-wavelength depolari-zation and Raman lidar measurements during SAMUM 2. Tellus B 63 (4). http://dx.doi.org/10.3402/tellusb.v63i4.16369.
Groß, S., Esselborn, M., Weinzierl, B., Wirth, M., Fix, A., Petzold, A., 2013. Aerosol classifi-cation by airborne high spectral resolution lidar observations. Atmos. Chem. Phys. 13(5), 2487–2505. http://dx.doi.org/10.5194/acp-13-2487-2013.
Groß, S., Freudenthaler, V., Schepanski, K., Toledano, C., Schäfler, A., Ansmann, A.,Weinzierl, B., 2015. Optical properties of long-range transported Saharan dust overBarbados as measured by dual-wavelength depolarization Raman lidar measure-ments. Atmos. Chem. Phys. 15 (19), 11067–11080. http://dx.doi.org/10.5194/acp-15-11067-2015.
Guo, H., Xu, L., Bougiatioti, A., Cerully, K.M., Capps, S.L., Hite Jr., J.R., Carlton, A.G., Lee, S.H.,Bergin, M.H., Ng, N.L., et al., 2015. Fine-particle water and pH in the southeasternUnited States. Atmos. Chem. Phys. 15 (9), 5211–5228.
Holben, B.N., Eck, T.F., Slutsker, I., Tanré, D., Buis, J.P., Setzer, A., Vermote, E., Reagan, J.A.,Kaufman, Y.J., Nakajima, T., Lavenu, F., Jankowiak, I., Smirnov, A., 1998. AERONET—Afederated instrument network and data archive for aerosol characterization. RemoteSens. Environ. 66 (1), 1–16. http://dx.doi.org/10.1016/S0034-4257(98)00031-5.
Klett, J.D., 1981. Stable analytical inversion solution for processing lidar returns. Appl. Opt.20 (2), 211. http://dx.doi.org/10.1364/AO.20.000211.
Kokkalis, P., Papayannis, A., Mamouri, R.E., Tsaknakis, G., Amiridis, V., 2012. The EOLELidar System of the National Technical University of Athens. Reviewed and RevisedPapers Presented at the 26th International Laser Radar Conference, pp. 25–29.
Kokkalis, P., Papayannis, A., Amiridis, V., Mamouri, R.E., Veselovskii, I., Kolgotin, A.,Tsaknakis, G., Kristiansen, N.I., Stohl, A., Mona, L., 2013. Optical, microphysical, massand geometrical properties of aged volcanic particles observed over Athens, Greece,during the Eyjafjallajökull eruption in April 2010 through synergy of Raman lidarand sunphotometer measurements. Atmos. Chem. Phys. 13 (18), 9303–9320.http://dx.doi.org/10.5194/acp-13-9303-2013.
Lide, D.R., 2007. CRC Handbook of Chemistry and Physics. 88th Edition. CRC Press [online]Available from https://www.crcpress.com/CRC-Handbook-of-Chemistry-and-Physics-88th-Edition/Lide/p/book/9780849304880 Accessed 16 May 2016.
Lopatin, A., Dubovik, O., Chaikovsky, A., Goloub, P., Lapyonok, T., Tanré, D., Litvinov, P.,2013. Enhancement of aerosol characterization using synergy of lidar and sun-pho-tometer coincident observations: the GARRLiC algorithm. Atmospheric Meas. Tech.6 (8), 2065–2088. http://dx.doi.org/10.5194/amt-6-2065-2013.
Mamouri, R.E., Ansmann, A., 2014. Fine and coarse dust separation with polarization lidar.Atmospheric Meas. Tech. 7 (11), 3717–3735. http://dx.doi.org/10.5194/amt-7-3717-2014.
Mattis, I., Ansmann, A., Müller, D., Wandinger, U., Althausen, D., 2004. Multiyear aerosolobservations with dual-wavelength Raman lidar in the framework of EARLINET: mul-tiyear aerosol profiling in Europe. J. Geophys. Res. Atmos. 109 (D13). http://dx.doi.org/10.1029/2004JD004600 n/a-n/a.
Morgan, W.T., Allan, J.D., Bower, K.N., Highwood, E.J., Liu, D., McMeeking, G.R., Northway,M.J., Williams, P.I., Krejci, R., Coe, H., 2010. Airborne measurements of the spatial dis-tribution of aerosol chemical composition across Europe and evolution of the organicfraction. Atmos. Chem. Phys. 10 (8), 4065–4083. http://dx.doi.org/10.5194/acp-10-4065-2010.
Müller, D., Wandinger, U., Ansmann, A., 1999. Microphysical particle parameters from ex-tinction and backscatter lidar data by inversionwith regularization: theory. Appl. Opt.38 (12), 2346. http://dx.doi.org/10.1364/AO.38.002346.
Müller, D., Ansmann, A., Mattis, I., Tesche, M., Wandinger, U., Althausen, D., Pisani, G.,2007. Aerosol-type-dependent lidar ratios observed with Raman lidar. J. Geophys.Res. 112 (D16). http://dx.doi.org/10.1029/2006JD008292.
Myhre, G., Shindell, D., Bréon, F.-M., Collins, W., Fuglestvedt, J., Huang, J., Koch, D.,Lamarque, J.-F., Lee, D., Mendoza, B., Nakajima, T., Robock, A., Stephens, G.,Takemura, T., Zhang, H., 2013. In: Stocker, T.F., Qin, D., Plattner, G.-K., Tignor, M.,Allen, S.K., Boschung, J., Nauels, A., Xia, Y., Bex, V., Midgley, P.M. (Eds.), Anthropogenicand Natural Radiative Forcing, in Climate Change 2013: The Physical Science Basis.Contribution of Working Group I to the Fifth Assessment Report of the Intergovern-mental Panel on Climate Change. Cambridge University Press, Cambridge, UnitedKingdom and New York, NY, USA , pp. 659–740 [online] Available from www.climatechange2013.org.
Papayannis, A., Amiridis, V., Mona, L., Tsaknakis, G., Balis, D., Bösenberg, J.,Chaikovski, A., De Tomasi, F., Grigorov, I., Mattis, I., Mitev, V., Müller, D.,Nickovic, S., Pérez, C., Pietruczuk, A., Pisani, G., Ravetta, F., Rizi, V., Sicard, M.,Trickl, T., Wiegner, M., Gerding, M., Mamouri, R.E., D'Amico, G., Pappalardo, G.,
2008. Systematic lidar observations of Saharan dust over Europe in the frameof EARLINET (2000−2002). J. Geophys. Res. Atmos. 113 (D10), D10204. http://dx.doi.org/10.1029/2007JD009028.
Papayannis, A., Nicolae, D., Kokkalis, P., Binietoglou, I., Talianu, C., Belegante, L., Tsaknakis,G., Cazacu, M.M., Vetres, I., Ilic, L., 2014. Optical, size and mass properties of mixedtype aerosols in Greece and Romania as observed by synergy of lidar andsunphotometers in combination with model simulations: a case study. Sci. Total En-viron. 500–501, 277–294. http://dx.doi.org/10.1016/j.scitotenv.2014.08.101.
Pappalardo, G., Amodeo, A., Apituley, A., Comeron, A., Freudenthaler, V., Linné, H.,Ansmann, A., Bösenberg, J., D'Amico, G., Mattis, I., Mona, L., Wandinger, U., Amiridis,V., Alados-Arboledas, L., Nicolae, D., Wiegner, M., 2014. EARLINET: towards an ad-vanced sustainable European aerosol lidar network. Atmos Meas Tech 7 (8),2389–2409. http://dx.doi.org/10.5194/amt-7-2389-2014.
Pérez, C., Nickovic, S., Baldasano, J.M., Sicard, M., Rocadenbosch, F., Cachorro, V.E., 2006a. Along Saharan dust event over the western Mediterranean: Lidar, sun photometer ob-servations, and regional dust modeling. J. Geophys. Res. 111 (D15). http://dx.doi.org/10.1029/2005JD006579.
Pérez, C., Nickovic, S., Pejanovic, G., Baldasano, J.M., Özsoy, E., 2006b. Interactive dust-ra-diation modeling: a step to improve weather forecasts. J. Geophys. Res. 111 (D16).http://dx.doi.org/10.1029/2005JD006717.
Pratt, K.A., Murphy, S.M., Subramanian, R., DeMott, P.J., Kok, G.L., Campos, T., Rogers, D.C.,Prenni, A.J., Heymsfield, A.J., Seinfeld, J.H., Prather, K.A., 2011. Flight-based chemicalcharacterization of biomass burning aerosols within two prescribed burn smokeplumes. Atmos. Chem. Phys. 11 (24), 12549–12565. http://dx.doi.org/10.5194/acp-11-12549-2011.
Reichardt, J., Baumgart, R., McGee, T.J., 2003. Three-signal method for accurate measure-ments of depolarization ratio with lidar. Appl. Opt. 42 (24), 4909. http://dx.doi.org/10.1364/AO.42.004909.
Rocadenbosch, F., Reba, M.N.M., Sicard, M., Comerón, A., 2010. Practical analytical back-scatter error bars for elastic one-component lidar inversion algorithm. Appl. Opt. 49(17), 3380–3393.
Rosenberg, P.D., Dean, A.R., Williams, P.I., Dorsey, J.R., Minikin, A., Pickering, M.A., Petzold,A., 2012. Particle sizing calibration with refractive index correction for light scatteringoptical particle counters and impacts upon PCASP and CDP data collected during thefennec campaign. Atmos Meas Tech 5 (5), 1147–1163. http://dx.doi.org/10.5194/amt-5-1147-2012.
Sassen, K., 2005. Polarization in lidar. In: Weitkamp, D.C. (Ed.), Lidar. Springer, New York ,pp. 19–42 [online] Available from http://link.springer.com/chapter/10.1007/0-387-25101-4_2 Accessed 29 March 2016.
Seinfeld, J.H., Pandis, S.N., 2006. Atmospheric Chemistry and Physics, a Wiley-Inter Sci-ence Publication. John Wiley & Sons Inc, New York.
Skamarock, W.C., Klemp, J.B., Dudhia, J., Gill, D.O., Barker, D.M., Duda, M.G., Huang, X.-Y.,Wang, W., Powers, J.G., 2008. A Description of the Advanced Research WRF Version3. NCAR Technical Note 475.
Stohl, A., Hittenberger, M., Wotawa, G., 1998. Validation of the Lagrangian particle disper-sion model FLEXPART against large-scale tracer experiment data. Atmos. Environ. 32(24), 4245–4264.
Stohl, A., Forster, C., Frank, A., Seibert, P., Wotawa, G., 2005. Technical note: the Lagrangianparticle dispersion model FLEXPART version 6.2, Atmos. Chem. Phys. 5 (9),2461–2474. http://dx.doi.org/10.5194/acp-5-2461-2005.
Sugimoto, N., Nishizawa, T., Shimizu, A., Matsui, I., Jin, Y., 2014. Characterization of Aero-sols in East Asia with the Asian Dust and Aerosol Lidar Observation Network (AD-Net). vol. 9262 p. 92620K–92620K–9.
Sun, Y.L., Wang, Z.F., Du, W., Zhang, Q., Wang, Q.Q., Fu, P.Q., Pan, X.L., Li, J., Jayne, J.,Worsnop, D.R., 2015. Long-term real-time measurements of aerosol particle compo-sition in Beijing, China: seasonal variations, meteorological effects, and source analy-sis. Atmos. Chem. Phys. 15 (17), 10149–10165. http://dx.doi.org/10.5194/acp-15-10149-2015.
Tombrou, M., Bossioli, E., Kalogiros, J., Allan, J.D., Bacak, A., Biskos, G., Coe, H., Dandou, A.,Kouvarakis, G., Mihalopoulos, N., Percival, C.J., Protonotariou, A.P., Szabó-Takács, B.,2015. Physical and chemical processes of air masses in the Aegean Sea during Ete-sians: Aegean-GAME airborne campaign. Sci. Total Environ. 506–507, 201–216.http://dx.doi.org/10.1016/j.scitotenv.2014.10.098.
Tsekeri, A., Amiridis, V., Kokkalis, P., Basart, S., Chaikovsky, A., Dubovik, O., Mamouri, R.E.,Papayannis, A., Baldasano, J.M., 2013. Application of a synergetic lidar andsunphotometer algorithm for the characterization of a dust event over Athens,Greece. Br. J. Environ. Clim. Change 3 (4), 531.
Tsekeri, A., Amiridis, V., Marenco, F., Nenes, A., Marinou, E., Solomos, S., Rosenberg, P.,Trembath, J., Nott, G.J., Allan, J., Le Breton, M., Bacak, A., Coe, H., Percival, C.,Mihalopoulos, N., 2016. Profiling aerosol optical, microphysical and hygroscopicproperties in ambient conditions by combining in-situ and remote sensing. Atmo-spheric Meas. Tech. Discuss. 1–61. http://dx.doi.org/10.5194/amt-2016-193.
Turpin, B.J., Lim, H.-J., 2001. Species contributions to PM2.5 mass concentrations:revisiting common assumptions for estimating organic mass. Aerosol Sci. Technol.35 (1), 602–610. http://dx.doi.org/10.1080/02786820119445.
Verma, S., Worden, J., Pierce, B., Jones, D.B.A., Al-Saadi, J., Boersma, F., Bowman, K.,Eldering, A., Fisher, B., Jourdain, L., Kulawik, S., Worden, H., 2009. Ozone productionin boreal fire smoke plumes using observations from the tropospheric emission spec-trometer and the ozone monitoring instrument. J. Geophys. Res. 114 (D2). http://dx.doi.org/10.1029/2008JD010108.
Veselovskii, I., Kolgotin, A., Griaznov, V., Müller, D., Wandinger, U., Whiteman, D.N., 2002.Inversion with regularization for the retrieval of tropospheric aerosol parametersfrom multiwavelength lidar sounding. Appl. Opt. 41 (18), 3685. http://dx.doi.org/10.1364/AO.41.003685.
Veselovskii, I., Dubovik, O., Kolgotin, A., Lapyonok, T., Di Girolamo, P., Summa, D.,Whiteman, D.N., Mishchenko, M., Tanré, D., 2010. Application of randomly oriented

267P. Kokkalis et al. / Atmospheric Research 183 (2017) 255–267
spheroids for retrieval of dust particle parameters from multiwavelength lidar mea-surements. J. Geophys. Res. Atmos. 115 (D21), D21203. http://dx.doi.org/10.1029/2010JD014139.
Wagner, J., Ansmann, A., Wandinger, U., Seifert, P., Schwarz, A., Tesche, M., Chaikovsky, A.,Dubovik, O., 2013. Evaluation of the Lidar/radiometer inversion code (LIRIC) to deter-mine microphysical properties of volcanic and desert dust. Atmospheric Meas. Tech.6 (7), 1707–1724. http://dx.doi.org/10.5194/amt-6-1707-2013.
Welton, E.J., Campbell, J.R., 2002. Micropulse lidar signals: uncertainty analysis. J. Atmos.Ocean. Technol. 19 (12), 2089–2094.
Whiteman, D.N., 2003. Examination of the traditional Raman lidar technique II evaluatingthe ratios for water vapor and aerosols. Appl. Opt. 42 (15), 2593. http://dx.doi.org/10.1364/AO.42.002593.
Whiteman, D.N., Melfi, S.H., Ferrare, R.A., 1992. Raman lidar system for the measurementof water vapor and aerosols in the Earth's atmosphere. Appl. Opt. 31 (16), 3068.http://dx.doi.org/10.1364/AO.31.003068.
World Health Organization, 2006. Air quality guidelines: global update 2005: particulatematter, ozone, nitrogen dioxide, and sulfur dioxide. World Health Organization,Copenhagen, Denmark.