Fine Tune your Attitude Positive Attitude Vs Negative Attitude.

Asia-Pacific Forum on Science Learning and Teaching, 17(2), Article 4, p.1 (Dec., 2016)
Sook Fui CHIN and Hooi Lian LIM Validation of an adapted instrument to measure students’ attitude towards science
Validation of an adapted instrument to measure students’ attitude towards science
Sook Fui CHIN and Hooi Lian LIM
School of Educational Studies Universiti Sains Malaysia, Penang, MALAYSIA
E-mail: [email protected] and [email protected]
Received 25 Feb., 2016 Revised 22 Dec., 2016
Contents
• Abstract • Introduction
o Significant of the study o Literature Review o Theoretical Framework o Previous Studies
• Research Methodology o Research Design, Location, Population and Sampling o Research Instrument
• Results o Demographic Data o Psychometric Properties of ATST o Person-Item Distribution
• Discussion • Conclusion
o Implications of the Study o Future Study
• References
Copyright (C) 2016 EdUHK APFSLT. Volume 17, Issue 2, Article 4 (Dec., 2016). All Rights Reserved.
Asia-Pacific Forum on Science Learning and Teaching, 17(2), Article 4, p.2 (Dec., 2016)
Sook Fui CHIN and Hooi Lian LIM Validation of an adapted instrument to measure students’ attitude towards science
Abstract
Attitude towards science (ATS) is a major concern in science education. Although many ATS instruments have been developed, they are based on different cultural systems and having some limitations. This study aims to validate an instrument for measuring students’ ATS in Malaysia context. The instrument was adapted from Test of Science-Related Attitude, TOSRA (Fraser, 1981) and Attitude towards Science Measure, ATSM based on theoretical and research underpinnings. A total of 749 secondary school students responded to the instrument. Rasch analyses were performed to examine the psychometric properties of the instrument, including fit statistics, point-biserial correlations, person-item reliability and separation, and rating scale diagnosis. Data analysis indicated that the instrument exhibited satisfactory validity and reliability. This shows that it demonstrates sufficient evidences of psychometric properties and has the potential to be utilized as a diagnostic tool in assessing students’ ATS.
Keywords: attitude towards science; science education; Rasch analyses; psychometric properties
Introduction
Science education is an area of national interest in many countries all around the world. One of the major concerns in science education is attitude towards science (ATS). It is because ATS plays an important role in determining students’ science achievement (Osborne, Simon, & Collin, 2003; Simpson & Oliver 1990; Zhang & Cambell, 2010). Therefore, many studies have been carried out to measure students’ ATS. Meanwhile, various ATS instruments have been developed based on different thereotical and cultural systems. However, there are two major limitations: (a) the concept of attitude is not well articulated and (b) the ATS measures often have poor psychometric quality (Munby, 1997; Francis & Greer, 1999; Kind, Jones, & Barmby, 2007; Reid, 2006). There has been a lack of clarity over the last few decades about “attitude” and “ATS” (Kind, Jones & Barmby, 2007; Osborne, Simon, & Collins, 2003). According to Wang and Berlin (2010), many definitions of ATS have been defined in variety ways. This is an problematic issue as poorly defined ATS makes what is being measured is ambiguous. Subsequently, this reduce the construct validity of the instrument, the degree to which instrument is able to measure
Copyright (C) 2016 EdUHK APFSLT. Volume 17, Issue 2, Article 4 (Dec., 2016). All Rights Reserved.
Asia-Pacific Forum on Science Learning and Teaching, 17(2), Article 4, p.3 (Dec., 2016)
Sook Fui CHIN and Hooi Lian LIM Validation of an adapted instrument to measure students’ attitude towards science
constructs accurately (Gay, Mills, & Airasian, 2009). A good instrument should exhibit sufficient evidence of validity and reliability. ATS instrument with poor psychometric properties yields invalid information.
On the other hand, existing ATS instruments are developed based on different cultural systems and mainly involved students from western countries. Due to the different cultural systems, it is problematic to implement those ATS instruments directly in Malaysia, a country in Asian region (Pell & Manganye, 2007). To date, there appear to be no ATS instrument with sufficient psychometric properties that are appropriate to be used in the context of Malaysia. Therefore, it is important to have a valid instrument to measure students’ ATS that is relevance to the science education system in Malaysia. Thus, this study aims to validate an ATS instrument in the context of Malaysia.
Significant of the study
The findings of this study would bear significant implication to provide a valid and reliable ATS measure. As ATS is the cornerstone of science learning, it is important that valid and reliable instruments are available for revealing students’ ATS. A valid and reliable ATS measure provides valuable information about what actually students think and feel about science. This might help educators to pinpoint the attributes that contribute to the decreasing of the number of students studying in science. In turn, it might improve students’ ATS, increase their engagement in science related learning activities and their science achievement.
Literature Review
Attitude towards Science (ATS) Attitude is a unique concept which has different domains (Zhang & Campbell, 2010) In general, it is defined based on three components: (a) cognitive, affective, and behavioral (Reid, 2006). These three components are closely linked together (Kind, Jones, & Barmby, 2007). For example, a person has the knowledge about science (cognitive), he/she has feeling about science (affective). This feeling triggers him/her to take some actions regarding science (behavioral). However, some researchers have argued that these three components should be assessed independently and attitude should be viewed as the basis for evaluative judgments (Ajzen, 2001; Crano & Prislin, 2006). When a person has the attitude towards something, he/she judges it with his/her feelings, such as good or bad, happy or unhappy. The one he/she judges is often called the attitude object (Crano & Prislin,
Copyright (C) 2016 EdUHK APFSLT. Volume 17, Issue 2, Article 4 (Dec., 2016). All Rights Reserved.

Asia-Pacific Forum on Science Learning and Teaching, 17(2), Article 4, p.4 (Dec., 2016)
Sook Fui CHIN and Hooi Lian LIM Validation of an adapted instrument to measure students’ attitude towards science
2006). On the other word, when he/she is asked about his/her attitude towards an object, he/she is actually asked to judge the object.
However, it is very hard to separate and distinguish affective and cognitive domains (George, 2000; Kind, Jones, & Barmby, 2007). This is because affective component is always linked to cognitive component which is the belief that a person holds (Klopfer, 1971). Hence, Kind, Jones, and Barmby (2007) had defined attitude as “the feelings that a person has about an object, based on his/her beliefs about the object” (p. 873). Meanwhile, according to Sax (1997), attitude is a preference for groups, institutions or objects. It is a tendency to think, feel or act towards objects in people surrounding, that can be positive or negative (Oluwatelure & Oloruntegbe, 2010; Salta & Tzougraki, 2004). In science education, ATS could refer science as an object. Thus, ATS could be defined as a person’s preference and belief about science that affect his/her tendency of thinking, feelings, and action towards science. In line with the previous studies, in this study, attitude is defined as “the tendency of thinking, feelings, and actions that a person has about science, based on his/her belief and preference about science that can be positive or negative.”
Klopfer (1971) had made notable contribution in ATS related studies. He had categorized a ATS classification which consists of six subcategories:
(a) The manifestation of favorable ATS and scientist. (b) The acceptance of scientific enquiry as a way of thought. (c) The adoption of scientific attitudes. (d) The enjoyment of science learning experiences. (e) The development of interests in science and science-related activities. (f) The development of an interest in pursuing a career in science or
science-related work.
Although this classification does not pretend to be a complete taxonomy of the affective domain, it would be desirable to have such taxonomy as it concerns students’s learning in science (Klopfer, 1971). Based on Klopfer’s classification, Fraser (1981) had developed a a Test of Science-Related Attitude (TOSRA), which consists of seven constructs, as shown in Table 1.
Copyright (C) 2016 EdUHK APFSLT. Volume 17, Issue 2, Article 4 (Dec., 2016). All Rights Reserved.

Asia-Pacific Forum on Science Learning and Teaching, 17(2), Article 4, p.5 (Dec., 2016)
Sook Fui CHIN and Hooi Lian LIM Validation of an adapted instrument to measure students’ attitude towards science
Table 1. Constructs of TOSRA based on Klopfer’s Classification Scale Name Klopfer’s Classification (1971)
Social Implications of Science (S) H.1: Manifestation of favorable attitude towards science and scientists.
Normality of Scientist (N)
Attitude to Scientific Inquiry (I) H.2: Acceptance of scientific inquiry as a way of thought.
Adoption of Scientific Attitude (A) H.3: Adoption of “scientific attitude”.
Enjoyment of Science Lessons (E) H.4: Enjoyment of science learning experiences.
Leisure Interest in Science (L) H.5: Development of interest in science and science-related activities.
Career Interest in Science (C) H.6: Development of interest in pursuing a career in science.
On the other hand, Osborne, Simon, and Collins (2003) proposed several ATS dimensions: the perception of the science teacher; anxiety toward science; the value of science; self-esteem at science; motivation towards science, enjoyment of science; attitudes of peers and friends towards science; attitudes of parents towards science; the nature of the classroom environment; achievement in science; and fear of failure on course. Besides, Kind, Jones, and Barmby (2007) had categorized ATS into seven constructs, as shown in Table 2.
Table 2. ATS Framework by Kind, Jones, and Barmby (2007)
Construct Scope
(1) Learning science in school ATS learning activities inside the classroom
(2) Practical work in science ATS learning activities inside the practical classroom
(3) Science outside of school ATS learning activities outside the classroom
(4) Importance of science Belief in value of science in a wider social context
(5) Self-concept in science Self-concept which based on beliefs about one’s own ability to master school science
(6) Future participation in science Attitude towards involving more with science in the future career
(7) Combined interest in science Combination of (1) learning science in school, (3) science outside of school, and (6) future participation in science.
Copyright (C) 2016 EdUHK APFSLT. Volume 17, Issue 2, Article 4 (Dec., 2016). All Rights Reserved.

Asia-Pacific Forum on Science Learning and Teaching, 17(2), Article 4, p.6 (Dec., 2016)
Sook Fui CHIN and Hooi Lian LIM Validation of an adapted instrument to measure students’ attitude towards science
Theoretical Framework
The theoretical framework of this study begins with Krathwohl’s taxonomy that encompasses behaviors characterized by feelings and emotions (Hopkins, 1998; Sax, 1997). Krathwohl’s taxonomy has been published by Krathwohl, Benjamin Bloom, and Bertram Masia in 1964 (Sax, 1997). According to Hopkins (1998), Krathwohl’s taxonomy is a useful general framework that is helpful in organizing assessment of affective educational objectives. Affective domain encompasses those behaviors characterized by feelings, emotions, or value that might be positive or negative (Sax, 1997). Affective domain measures students’ attitudes, values, interests, and feelings (Popham, 2000). Five levels in Krathwohl’s taxonomy are: (1) Receiving , (2) Responding, (3) Valuing, (4) Organization, and (5) Characterization by a value (Lynch et al., 2009; Olubor & Ogonor, 2007).
Receiving is the lowest level in Krathwohl’s taxonomy. This level is concerning about students’ sensitivity to a particular phenomenon and stimulus (Popham, 2000). As supported by Pang and Lajium (2008), it is a level when student is willing to receive or attend to the existence of certain phenomena and stimuli. This level is divided into three subdivisions that indicate different levels of attending, which are awareness, willingness to receive, and controlled or selected attention (Hopkins, 1998). Awareness, the lowest subdivision under receiving, presumes minimum consciousness or knowledge (Hopkins, 1998). For example, a student has consciousness about the advantages of science. The second subdivision is willingness to receive. It means that instead of simply being aware of the object, willing to tolerate and does not avoid (Pang & Lajium, 2008). If a student is willing to attend science-related activities, or at least not to avoid actively it, the student has achieved the level of willingness to receive. If the student expresses a preference of science-related activity, it indicates that he has achieved the level of controlled or selected attention.
Responding is a level in which the student is not only willing to receive, but is actively attending or participating (King, 1971; Olubor & Ogonor, 2007). He does more than merely receiving or attending to a stimulus. For example, a student is actively engaging in a science class activity. Three subdivisions indicate different levels of responding: acquiescence in responding, willingness to respond, and satisfaction in response (Lynch et al., 2009). Acquiescence in responding indicates obedience and compliance (Sax, 1997). A student participates in an activity because of requirement, if choices are given, he might select other alternatives. For example,
Copyright (C) 2016 EdUHK APFSLT. Volume 17, Issue 2, Article 4 (Dec., 2016). All Rights Reserved.

Asia-Pacific Forum on Science Learning and Teaching, 17(2), Article 4, p.7 (Dec., 2016)
Sook Fui CHIN and Hooi Lian LIM Validation of an adapted instrument to measure students’ attitude towards science
a student joins a science activity because his teacher requires him to do so. If the student responds voluntarily without force, he has achieved the second subdivision, willingness to respond (Pang & Lajium, 2008). He engages in an activity not because of requirement, instead it is because of his own interest. For example, a student does extra science exercises that are not required by his/her teacher. If the student is not only does extra science exercises but he/she enjoys in it, he/she has achieved the third subdivision, which is satisfaction in response. This is the highest subdivision in level of responding (Hopkins, 1998).
Valuing refers to the attachment of value to a particular object, phenomenon or activity (Savickiene, 2010). In this level, a student is not just participating actively as in the level of responding, but he/she recognizes the values and knows the meaning of the activity which he is involved in. The student not only accepts the value but shows commitment to comply with it. There are three subdivisions of valuing: acceptance of a value, preference for a value, and commitment (Hopkins, 1998). Acceptance of a value indicates ability to set value for a particular object, phenomenon, attitude, and others (Pang & Lajium, 2008). At this subdivision, a student only has a tentative commitment towards some values that they consider as important. For example, a student joins science-related activity when possible because he/she thinks that practical work could improve his/her knowledge of science. The second subdivision, preference for a value indicates higher degree of commitment than in the first subdivision, but not as strong as moral pledge (Sax, 1997). A student who achieves this level is willing to devote greater time and effort to pursue his/her values than those who just merely achieves the first subdivision. For example, a student may volunteer his/her time to offer help in the laboratory. If the student is very convinced that his/her value is correct, he/she is loyal to it and he/she will not only pursue his/her values but also driven to do so, the student has achieved the third subdivision, commitment (Pang & Lajium, 2008).
The fourth level is organization. In this level, the student is able to organize values into system, know the interrelationships among values and able to establish the dominant value and pervasive value (King, 1971). This is supported by Boyd, Dooley, and Felton (2006) that student demonstrates internalization of a value system. Two subdivisions in this level: conceptualization of a value and organization of a value system (Lynch et al., 2009). Conceptualization of a value indicates the ability to form abstract concept for particular value (Sax, 1997). This enables a student to see how the value relates to those he/she already holds or to new ones that he/she is coming to hold. Organization of a value system indicates ability to group
Copyright (C) 2016 EdUHK APFSLT. Volume 17, Issue 2, Article 4 (Dec., 2016). All Rights Reserved.
Asia-Pacific Forum on Science Learning and Teaching, 17(2), Article 4, p.8 (Dec., 2016)
Sook Fui CHIN and Hooi Lian LIM Validation of an adapted instrument to measure students’ attitude towards science
values and form a system (Pang & Lajium, 2008). For example, a student is able to form his/her philosophy of experiment practicing after he/she considers the strength and weakness of values.
The last level is the highest level in Krathwohl’s taxonomy, which is characterization by a value. In this level, student shows internally consistent system of values that controls his/her behaviour and it is unchangeable (Pang & Lajium, 2008). Internalization has taken place in the student’s value hierarchy (Popham, 2000). He/she is not only having an organized value system as in level of organization, but he/she has consistent philosophy. Two subdivisions in this level: generalized set and characterization (Lynch et al., 2009). Generalized set means a student is ready to generalize his values into new problems/situation (Sax, 1997). At this subdivision, the major concern is student’s mode of approach to a problem. If the student acts in accordance with his/her philosophy strictly and the philosophy had become internally consistent (unchangeable), he/she has achieved characterization, the second subdivision in the level of characterization by a value (Pang & Lajium, 2008). According to Sax, only few individuals have reached this level, such as Mahatma Gandhi and Jesus Christ. Individuals who have reached this level are recognized as being complete persons; behave in accordance with their ideals and beliefs.
Students probably cannot be expected to advance much beyond the level of responding and valuing in Krathwohl’s Taxonomy based on any given experience in school (Sax, 1997). For the level of organization, it is hard for the teacher to help students clarify their own value systems in limited school hours. Level of characterization by a value is a long-term objective of education. It is very difficult to assess students at higher levels of the affective domain (Boyd, Dooley, & Felton, 2006). Thus, in this study, only the first three levels in Krathwohl’s Taxonomy are taken into account in assessing students’ ATS.
Based on the Krathwohl’s Taxonomy, Klopfer (1971) had presented a classification of scheme for the affective domain which is relative to science education, namely Klopfer’s Classification. This forms the second element of the theoretical framework in this study. Klopfer (1971) had pointed out that this classification does not pretend as a complete taxonomy as Krathwohl’s taxonomy, but wide ranges of meaning are implied when the term “attitude” is used in science educational circles. Thus, more precise terminology of attitude taxonomy should be substituted in discussions of students’ ATS. According to Fraser (1981), Klopfer’s Classification is a
Copyright (C) 2016 EdUHK APFSLT. Volume 17, Issue 2, Article 4 (Dec., 2016). All Rights Reserved.
Asia-Pacific Forum on Science Learning and Teaching, 17(2), Article 4, p.9 (Dec., 2016)
Sook Fui CHIN and Hooi Lian LIM Validation of an adapted instrument to measure students’ attitude towards science
comprehensive classification scheme for science education to solve multiple meanings attached to the term of “attitude to science.”
There are six subcategories in Klopfer’s classification. The first subcategory, H.1 Manifestation of favorable attitude towards science and scientists indicates behaviors which manifest favorable attitude towards science and scientist. Meanwhile, H.4 Enjoyment of science learning experiences indicates satisfaction of students in the process of science learning. These two subcategories match with the responding level in Krathwohl’s taxonomy as explained before that student is not only willing to receive, but is actively attending.
The second and third subcategories, H.2 Acceptance of scientific inquiry as a way of thought and H.3 Adoption of scientific attitude match the third level in Krathwohl’s taxonomy, which is valuing. According to Klopfer (1971), H.2 Acceptance of scientific inquiry as a way of thought concerns about students’ acceptance of scientific inquiry as a way of thought. It is matching with one of the key characteristics in the valuing, which is acceptance of a value. Furthermore, H.3 Adoption of scientific attitude indicates that a student has adopted any of the behaviors called scientific attitudes. It means that the student knows that his value is correct and shows commitment as described in third level in Krathwohl’s taxonomy, valuing.
H.5 Development of interest in science and science-related activities and H.6 Development of interest in pursuing a career in science match the first level in Krathwohl’s taxonomy, which is receiving. In the receiving level, student is willing to attend / expresses a preference in science-related activities (Pang & Lajium, 2008). For a student to have willingness in joining science-related activities, he/she must has interest in it. In other words, if he/she has interest in science-related activities, he/she will not refuse to join but willing to attend it. Therefore, interest and receiving (willingness to attend) are closely linked with each others.
Based on Krathwohl’s taxonomy, Fraser (1981) developed seven distinct scales of ATS: (1) Social implications of science, (2) Normality of scientists, (3) Attitude to scientific inquiry, (4) Adoption of scientific attitudes, (5) Enjoyment of science lessons, (6) Leisure interest in science, and (7) Career interest in science. This forms the third element of the framework. On the other hand, Kind, Jones, and Barmby (2007) had developed seven ATS constructs that are similar to Fraser. This forms the fourth element of the framework. The seven constructs are: (1) Learning science in
Copyright (C) 2016 EdUHK APFSLT. Volume 17, Issue 2, Article 4 (Dec., 2016). All Rights Reserved.
Asia-Pacific Forum on Science Learning and Teaching, 17(2), Article 4, p.10 (Dec., 2016)
Sook Fui CHIN and Hooi Lian LIM Validation of an adapted instrument to measure students’ attitude towards science
school, (2) Practical work in science, (3) Science outside of school, (4) Importance of science, (5) Self-concept in science, (6) Future participation in science, and (7) Combined interest in science. First three constructs aimed to measure pupil’s ATS learning activities in three different contexts: inside the classroom, practical, and outside the classroom. The fourth construct aimed to measure pupils’ belief in value of science in a wider social context. The fifth construct aimed to measure pupil’s self-concept which is based on beliefs about one’s own ability to master school science. The sixth construct is future participation, which is students’ attitude towards involving more with science in the future career. The last construct is the combination of constructs (1) Learning science in school, (3) Science outside of school, and (6) Future participation in science.
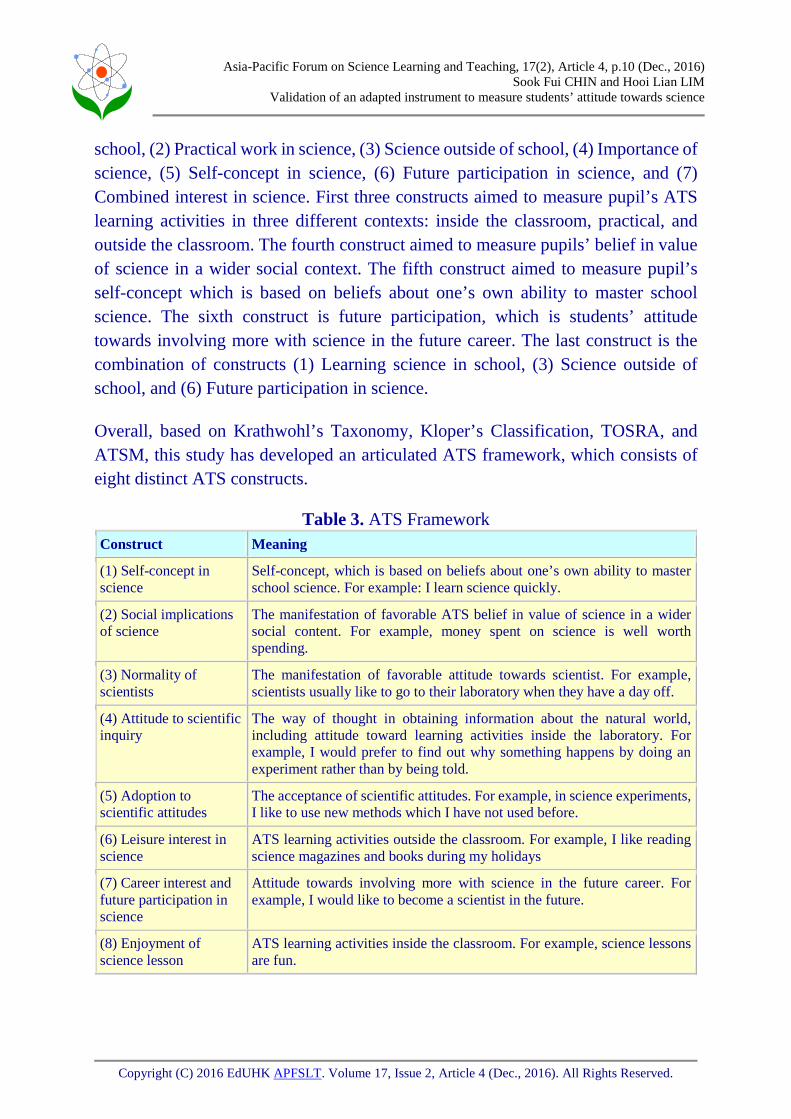
Overall, based on Krathwohl’s Taxonomy, Kloper’s Classification, TOSRA, and ATSM, this study has developed an articulated ATS framework, which consists of eight distinct ATS constructs.
Table 3. ATS Framework Construct Meaning
(1) Self-concept in science
Self-concept, which is based on beliefs about one’s own ability to master school science. For example: I learn science quickly.
(2) Social implications of science
The manifestation of favorable ATS belief in value of science in a wider social content. For example, money spent on science is well worth spending.
(3) Normality of scientists
The manifestation of favorable attitude towards scientist. For example, scientists usually like to go to their laboratory when they have a day off.
(4) Attitude to scientific inquiry
The way of thought in obtaining information about the natural world, including attitude toward learning activities inside the laboratory. For example, I would prefer to find out why something happens by doing an experiment rather than by being told.
(5) Adoption to scientific attitudes
The acceptance of scientific attitudes. For example, in science experiments, I like to use new methods which I have not used before.
(6) Leisure interest in science
ATS learning activities outside the classroom. For example, I like reading science magazines and books during my holidays
(7) Career interest and future participation in science
Attitude towards involving more with science in the future career. For example, I would like to become a scientist in the future.
(8) Enjoyment of science lesson
ATS learning activities inside the classroom. For example, science lessons are fun.
Copyright (C) 2016 EdUHK APFSLT. Volume 17, Issue 2, Article 4 (Dec., 2016). All Rights Reserved.

Asia-Pacific Forum on Science Learning and Teaching, 17(2), Article 4, p.11 (Dec., 2016)
Sook Fui CHIN and Hooi Lian LIM Validation of an adapted instrument to measure students’ attitude towards science
Previous Studies
George (2000) found that students’ ATS is generally decline over the middle school and high school years. Furthermore, there were strong positive correlations between students’ ATS and attitude about the utility of science. Cokadar and Kulce (2008) reported the similar findings. They found that pupils’ ATS was at a medium level. They also found that pupils’ ATS is significantly different based on the schools they attended and enjoyment in science classes. This is supported by Oliver and Venville (2011) that students who generally had positive ATS, most of them select science as one of their favorite subject. This shows that pupils who love and enjoy science classes have more positive ATS.
Besides types of schools and enjoyment in science classess, gender has been one of the factors that is related to students’ ATS. Francis and Greer (1999), and George (2000) found that male students have more positive ATS than females students. However, their attitudes dropped faster than girls. This is not in line with the study by Kind, Jones, and Barmby (2008) that the decline in ATS was more pronounced for female students than male students. In addition to the ATS level, gender also plays a role in science courses selection. Farenga and Joyce (1998) found that ATS was an important predictors for the amount of science courses selection for girls but not for boy. In addition, Hassan (2008) found that male students achieved higher scores in motivation, enjoyment of science, and self-concept of ability whereas female students showed higher scores for lack of anxiety.
Other than gender, there are other factors affecting students’ ATS. Siegel and Ranney (2003) found that it is possible to enhance students’ attitudes about the relevance of science by using innovative and issue-based activities. It is parallel with the study by Chen and Howard (2010) that there were positive changes in students’ attitudes and perceptions towards scientists after simulation (innovative instructional activities) was implemented.
Meanwhile, Hong (2010) found that that collaborative science intervention provides students opportunities to gain realistic views about the world and increase their interest in science.
Parental involvement is another factor that can affect students’ attitude and performance in science. Oluwatelure and Oloruntegbe (2010) found that students could achieve greater academic progress in science subject if parental involvement is high. Besides, Hong and Lin (2011) found that that elementary school and academic
Copyright (C) 2016 EdUHK APFSLT. Volume 17, Issue 2, Article 4 (Dec., 2016). All Rights Reserved.
Asia-Pacific Forum on Science Learning and Teaching, 17(2), Article 4, p.12 (Dec., 2016)
Sook Fui CHIN and Hooi Lian LIM Validation of an adapted instrument to measure students’ attitude towards science
high school students had significantly higher total scores on interest of science than students from vocational school. In general, there are many factors that contributing to students’ ATS, such as gender, instructional activities, collaborative science intervention, parental involvement and types of school.
Research Methodology
Research Design, Location, Population and Sampling
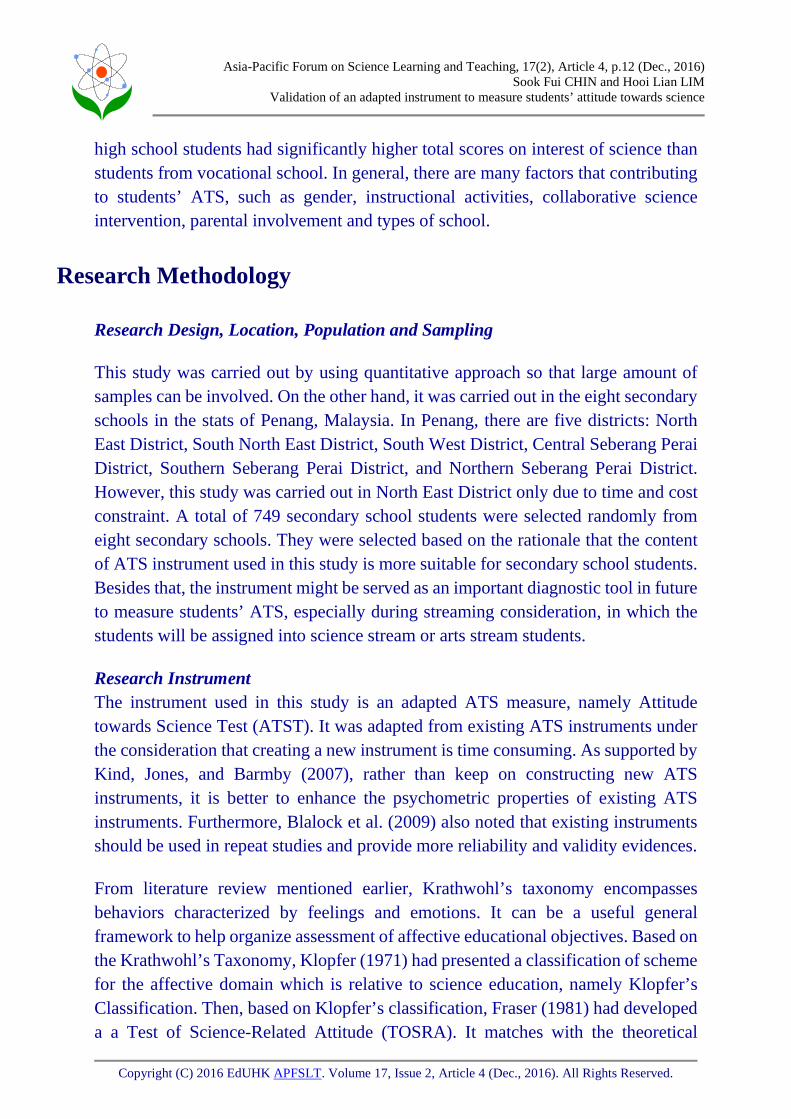
This study was carried out by using quantitative approach so that large amount of samples can be involved. On the other hand, it was carried out in the eight secondary schools in the stats of Penang, Malaysia. In Penang, there are five districts: North East District, South North East District, South West District, Central Seberang Perai District, Southern Seberang Perai District, and Northern Seberang Perai District. However, this study was carried out in North East District only due to time and cost constraint. A total of 749 secondary school students were selected randomly from eight secondary schools. They were selected based on the rationale that the content of ATS instrument used in this study is more suitable for secondary school students. Besides that, the instrument might be served as an important diagnostic tool in future to measure students’ ATS, especially during streaming consideration, in which the students will be assigned into science stream or arts stream students.
Research Instrument The instrument used in this study is an adapted ATS measure, namely Attitude towards Science Test (ATST). It was adapted from existing ATS instruments under the consideration that creating a new instrument is time consuming. As supported by Kind, Jones, and Barmby (2007), rather than keep on constructing new ATS instruments, it is better to enhance the psychometric properties of existing ATS instruments. Furthermore, Blalock et al. (2009) also noted that existing instruments should be used in repeat studies and provide more reliability and validity evidences.
From literature review mentioned earlier, Krathwohl’s taxonomy encompasses behaviors characterized by feelings and emotions. It can be a useful general framework to help organize assessment of affective educational objectives. Based on the Krathwohl’s Taxonomy, Klopfer (1971) had presented a classification of scheme for the affective domain which is relative to science education, namely Klopfer’s Classification. Then, based on Klopfer’s classification, Fraser (1981) had developed a a Test of Science-Related Attitude (TOSRA). It matches with the theoretical
Copyright (C) 2016 EdUHK APFSLT. Volume 17, Issue 2, Article 4 (Dec., 2016). All Rights Reserved.

Asia-Pacific Forum on Science Learning and Teaching, 17(2), Article 4, p.13 (Dec., 2016)
Sook Fui CHIN and Hooi Lian LIM Validation of an adapted instrument to measure students’ attitude towards science
framework underlies this study. It is one of the most widely used instruments in assessing ATS (Zhang & Campbell, 2010). Furthermore, it was designed to measure secondary school students’ ATS; and for the use of teachers, curriculum evaluators, and researchers. On the other hand, it is highly reliable (Fraser, 1981; Tegtmeier, 2009). Hence, researcher decided to adapt TOSRA in this study.
Although TOSRA is suitable to be used in this study, it was developed more than three decades ago. Recently, Kind, Jones, and Barmby (2007) had developed an Attitude towards Science Measure (ATSM) to measure students’ ATS. They had emphasized several important guidelines when developing ATSM, which are:
a) Clear descriptions of constructs, which are going to be measure. b) Clear justification that ATS constructs are closely related. c) Demonstrate reliability by confirming the internal consistency of the construct and unidimensionality. d) Demonstrate validity with the use of psychometric techniques.
Upon the considering of appropriateness, theoretical framework, relevancy and psychometric properties, researcher had decided to adapt and combine TOSRA (Fraser, 1981) and ATSM (Kind, Jones, & Barmby, 2007). The adapted ATS measure is named as Attitude towards Science Test (ATST).
Table 4. Name and Classification of Constructs in ATST
Construct in ATST Klopfer’s Classification (1971)
1. Self-concept in science 2. Social implications of science 3. Normality of scientists
a. The manifestation of favorable attitude towards science and scientist
4. Attitude to scientific inquiry b. The acceptance of scientific enquiry as a way of thought
5. Adoption of Scientific Attitudes c. The adoption of scientific attitudes
6. Enjoyment of Science Lesson d. The enjoyment of science learning experiences
7. Leisure interest in science e. The development of interests in science and science-related activities
8. Career interest and future participation in science
f. The development of an interest in pursuing a career in science or science-related work
Modifications were made to ensure that the ATST is suitable to be used in secondary schools in Malaysia. One of the modifications is that the ATST was adapted from
Copyright (C) 2016 EdUHK APFSLT. Volume 17, Issue 2, Article 4 (Dec., 2016). All Rights Reserved.
Asia-Pacific Forum on Science Learning and Teaching, 17(2), Article 4, p.14 (Dec., 2016)
Sook Fui CHIN and Hooi Lian LIM Validation of an adapted instrument to measure students’ attitude towards science
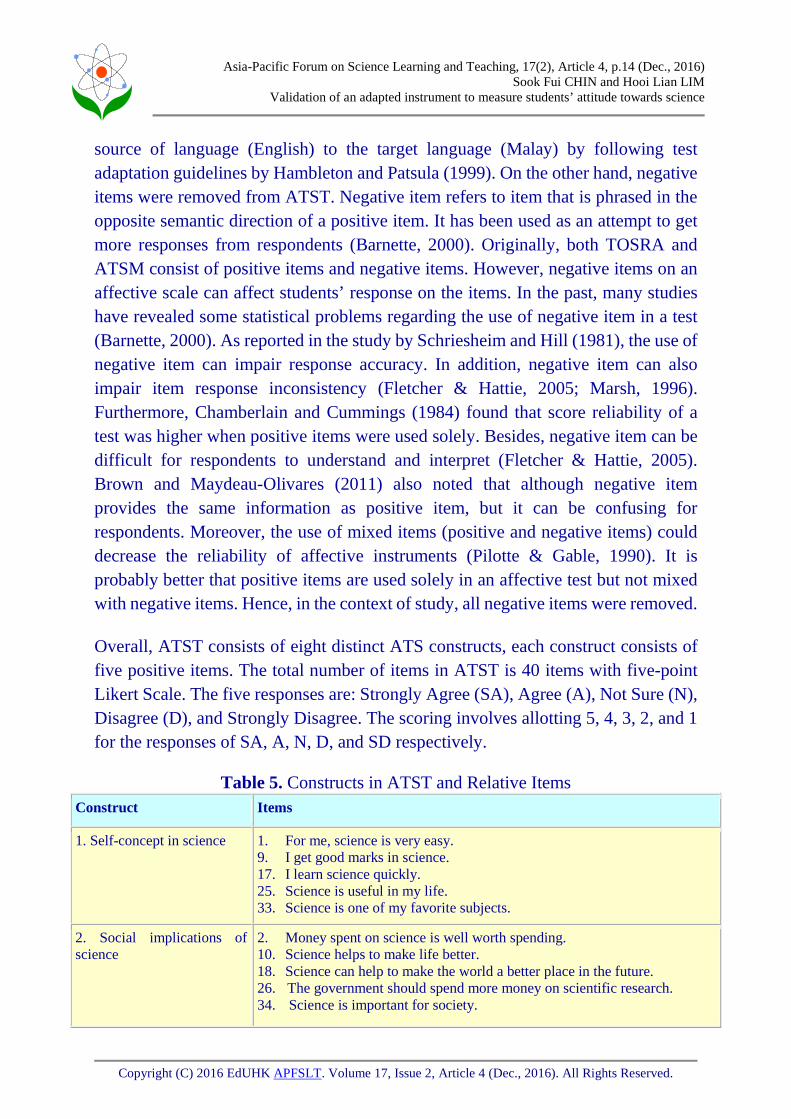
source of language (English) to the target language (Malay) by following test adaptation guidelines by Hambleton and Patsula (1999). On the other hand, negative items were removed from ATST. Negative item refers to item that is phrased in the opposite semantic direction of a positive item. It has been used as an attempt to get more responses from respondents (Barnette, 2000). Originally, both TOSRA and ATSM consist of positive items and negative items. However, negative items on an affective scale can affect students’ response on the items. In the past, many studies have revealed some statistical problems regarding the use of negative item in a test (Barnette, 2000). As reported in the study by Schriesheim and Hill (1981), the use of negative item can impair response accuracy. In addition, negative item can also impair item response inconsistency (Fletcher & Hattie, 2005; Marsh, 1996). Furthermore, Chamberlain and Cummings (1984) found that score reliability of a test was higher when positive items were used solely. Besides, negative item can be difficult for respondents to understand and interpret (Fletcher & Hattie, 2005). Brown and Maydeau-Olivares (2011) also noted that although negative item provides the same information as positive item, but it can be confusing for respondents. Moreover, the use of mixed items (positive and negative items) could decrease the reliability of affective instruments (Pilotte & Gable, 1990). It is probably better that positive items are used solely in an affective test but not mixed with negative items. Hence, in the context of study, all negative items were removed.
Overall, ATST consists of eight distinct ATS constructs, each construct consists of five positive items. The total number of items in ATST is 40 items with five-point Likert Scale. The five responses are: Strongly Agree (SA), Agree (A), Not Sure (N), Disagree (D), and Strongly Disagree. The scoring involves allotting 5, 4, 3, 2, and 1 for the responses of SA, A, N, D, and SD respectively.
Table 5. Constructs in ATST and Relative Items Construct Items
1. Self-concept in science 1. For me, science is very easy. 9. I get good marks in science. 17. I learn science quickly. 25. Science is useful in my life. 33. Science is one of my favorite subjects.
2. Social implications of science
2. Money spent on science is well worth spending. 10. Science helps to make life better. 18. Science can help to make the world a better place in the future. 26. The government should spend more money on scientific research. 34. Science is important for society.
Copyright (C) 2016 EdUHK APFSLT. Volume 17, Issue 2, Article 4 (Dec., 2016). All Rights Reserved.
Asia-Pacific Forum on Science Learning and Teaching, 17(2), Article 4, p.15 (Dec., 2016)
Sook Fui CHIN and Hooi Lian LIM Validation of an adapted instrument to measure students’ attitude towards science
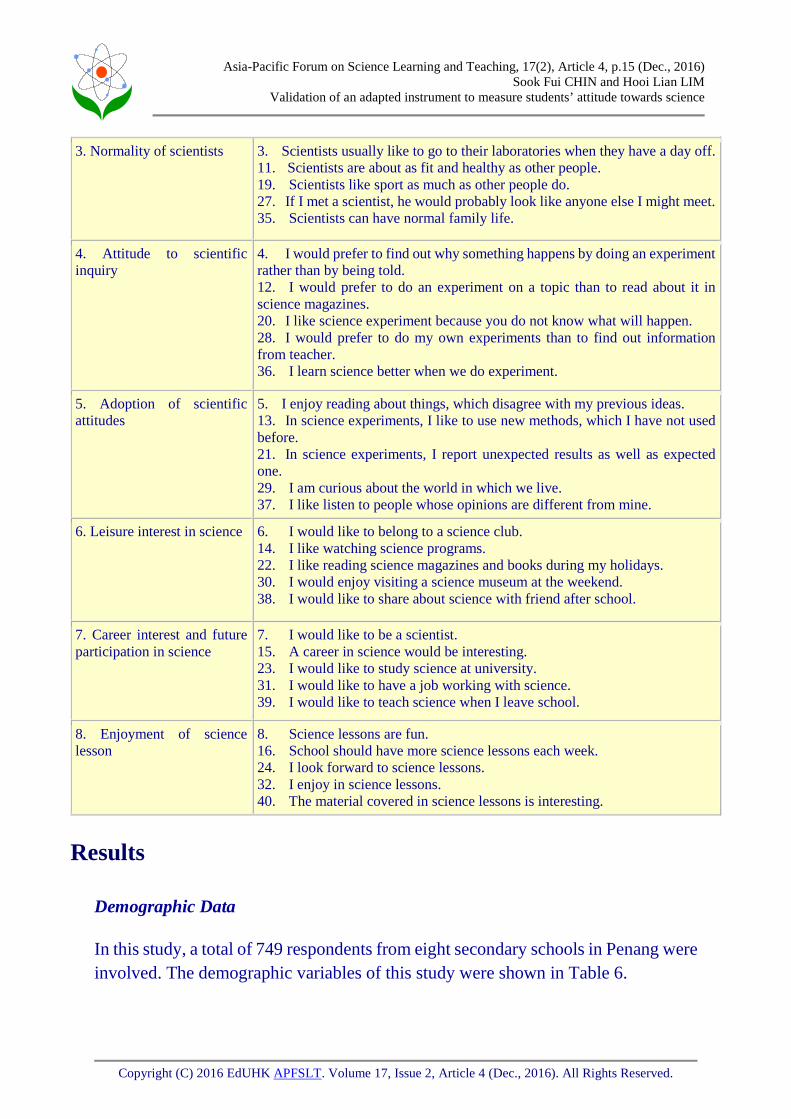
3. Normality of scientists 3. Scientists usually like to go to their laboratories when they have a day off. 11. Scientists are about as fit and healthy as other people. 19. Scientists like sport as much as other people do. 27. If I met a scientist, he would probably look like anyone else I might meet. 35. Scientists can have normal family life.
4. Attitude to scientific inquiry
4. I would prefer to find out why something happens by doing an experiment rather than by being told. 12. I would prefer to do an experiment on a topic than to read about it in science magazines. 20. I like science experiment because you do not know what will happen. 28. I would prefer to do my own experiments than to find out information from teacher. 36. I learn science better when we do experiment.
5. Adoption of scientific attitudes
5. I enjoy reading about things, which disagree with my previous ideas. 13. In science experiments, I like to use new methods, which I have not used before. 21. In science experiments, I report unexpected results as well as expected one. 29. I am curious about the world in which we live. 37. I like listen to people whose opinions are different from mine.
6. Leisure interest in science 6. I would like to belong to a science club. 14. I like watching science programs. 22. I like reading science magazines and books during my holidays. 30. I would enjoy visiting a science museum at the weekend. 38. I would like to share about science with friend after school.
7. Career interest and future participation in science
7. I would like to be a scientist. 15. A career in science would be interesting. 23. I would like to study science at university. 31. I would like to have a job working with science. 39. I would like to teach science when I leave school.
8. Enjoyment of science lesson
8. Science lessons are fun. 16. School should have more science lessons each week. 24. I look forward to science lessons. 32. I enjoy in science lessons. 40. The material covered in science lessons is interesting.
Results
Demographic Data
In this study, a total of 749 respondents from eight secondary schools in Penang were involved. The demographic variables of this study were shown in Table 6.
Copyright (C) 2016 EdUHK APFSLT. Volume 17, Issue 2, Article 4 (Dec., 2016). All Rights Reserved.
Asia-Pacific Forum on Science Learning and Teaching, 17(2), Article 4, p.16 (Dec., 2016)
Sook Fui CHIN and Hooi Lian LIM Validation of an adapted instrument to measure students’ attitude towards science
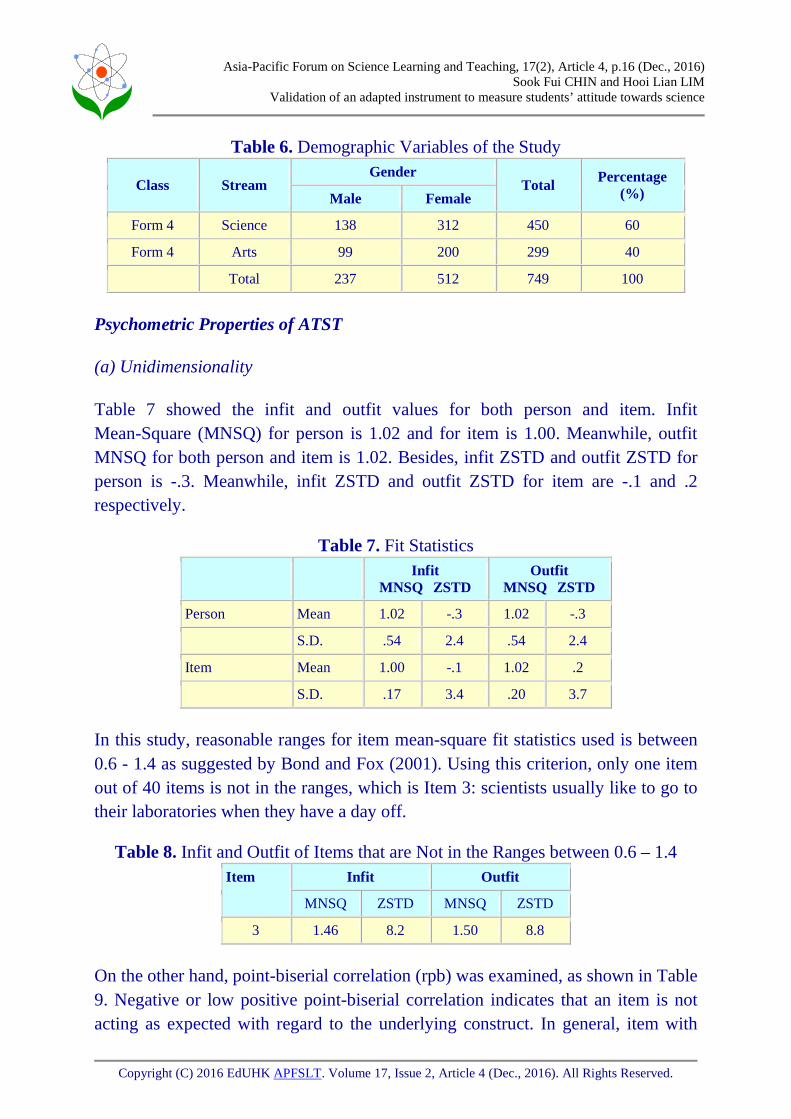
Table 6. Demographic Variables of the Study
Class Stream Gender
Total Percentage (%) Male Female
Form 4 Science 138 312 450 60
Form 4 Arts 99 200 299 40
Total 237 512 749 100
Psychometric Properties of ATST
(a) Unidimensionality
Table 7 showed the infit and outfit values for both person and item. Infit Mean-Square (MNSQ) for person is 1.02 and for item is 1.00. Meanwhile, outfit MNSQ for both person and item is 1.02. Besides, infit ZSTD and outfit ZSTD for person is -.3. Meanwhile, infit ZSTD and outfit ZSTD for item are -.1 and .2 respectively.
Table 7. Fit Statistics Infit
MNSQ ZSTD Outfit
MNSQ ZSTD
Person Mean 1.02 -.3 1.02 -.3
S.D. .54 2.4 .54 2.4
Item Mean 1.00 -.1 1.02 .2
S.D. .17 3.4 .20 3.7
In this study, reasonable ranges for item mean-square fit statistics used is between 0.6 - 1.4 as suggested by Bond and Fox (2001). Using this criterion, only one item out of 40 items is not in the ranges, which is Item 3: scientists usually like to go to their laboratories when they have a day off.
Table 8. Infit and Outfit of Items that are Not in the Ranges between 0.6 – 1.4 Item Infit Outfit
MNSQ ZSTD MNSQ ZSTD
3 1.46 8.2 1.50 8.8
On the other hand, point-biserial correlation (rpb) was examined, as shown in Table 9. Negative or low positive point-biserial correlation indicates that an item is not acting as expected with regard to the underlying construct. In general, item with
Copyright (C) 2016 EdUHK APFSLT. Volume 17, Issue 2, Article 4 (Dec., 2016). All Rights Reserved.

Asia-Pacific Forum on Science Learning and Teaching, 17(2), Article 4, p.17 (Dec., 2016)
Sook Fui CHIN and Hooi Lian LIM Validation of an adapted instrument to measure students’ attitude towards science
point-biserial correlation, rpb > .20 is acceptable whereas rpb < 0.15 should be examined for further action. Results of this study showed that point-biserial correlations for all the 40 items are ranging from .40 to .70 (McCormack et al., 2006). This indicates that all items are acting as expected with regard to the underlying construct but not a multidimensional factor structure (Schumacker & Smith, 2007).
Table 9. Point-Biserial Correlations Item Measure Model
S.E. PT-Measure Item Measure Model
S.E. PT-Measure
Cor. Ex. Cor. Ex.
1 .79 .04 .47 .53 21 .20 .04 .47 .53
2 .10 .04 .52 .53 22 .74 .04 .57 .57
3 .46 .04 .30 .55 23 .16 .04 .67 .56
4 -.23 .04 .50 .53 24 -.20 .04 .66 .53
5 -.12 .04 .42 .53 25 -.65 .04 .60 .49
6 .32 .04 .66 .56 26 -.25 .04 .55 .53
7 .41 .04 .62 .57 27 .02 .04 .42 .53
8 -.17 .04 .65 .52 28 .40 .04 .47 .56
9 .83 .04 .46 .53 29 -.75 .04 .47 .48
10 -.50 .04 .51 .50 30 -.26 .04 .45 .53
11 .03 .04 .45 .54 31 -.11 .04 .65 .55
12 -.18 .04 .48 .53 32 -.23 .04 .70 .52
13 .08 .04 .42 .56 33 .00 .04 .67 .54
14 .04 .04 .59 .55 34 -.75 .04 .51 .48
15 -.44 .04 .62 .51 35 -.31 .04 .40 .52
16 .37 .04 .61 .57 36 -.25 .04 .58 .52
17 .71 .04 .56 .54 37 -.09 .04 .49 .53
18 -.73 .04 .49 .48 38 .15 .04 .57 .54
19 .47 .04 .41 .55 39 .69 .04 .54 .58
20 -.37 .04 .48 .52 40 -.39 .04 .66 .52
(b) Person-Item Reliability and Separation
Figure 1 shows the summary statistics of person measures. As seen in the figure, person reliability = .93 and standard deviation of person mean = .03. This indicates that the respondents involved in this study are highly reliable. In addition, person separation value (3.67) indicated that approximately four distinct groups can be
Copyright (C) 2016 EdUHK APFSLT. Volume 17, Issue 2, Article 4 (Dec., 2016). All Rights Reserved.

Asia-Pacific Forum on Science Learning and Teaching, 17(2), Article 4, p.18 (Dec., 2016)
Sook Fui CHIN and Hooi Lian LIM Validation of an adapted instrument to measure students’ attitude towards science
identified in the data. In addition, the Cronbach Alpha (KR-20) of person raw score reliability = .94 indicates internal consistency.
Figure 1. Summary of 749 Measured Persons
On the other hand, Figure 2 shows the summary of 40 measured items. From the figure, and item reliability = .99 and standard deviation of item mean = .07. This indicates all the 40 items in ATS measure used in this study is highly reliable and near to the perfect score of 1.00. Meanwhile, the separation value for item is 9.93 with reliability .99. This suggests that the items can be grouped into ten levels of difficulty and the items are highly reliable (near to perfect score = 1.00).
Figure 2. Summary of 40 Measured Items
Copyright (C) 2016 EdUHK APFSLT. Volume 17, Issue 2, Article 4 (Dec., 2016). All Rights Reserved.
Asia-Pacific Forum on Science Learning and Teaching, 17(2), Article 4, p.19 (Dec., 2016)
Sook Fui CHIN and Hooi Lian LIM Validation of an adapted instrument to measure students’ attitude towards science
Person-Item Distribution
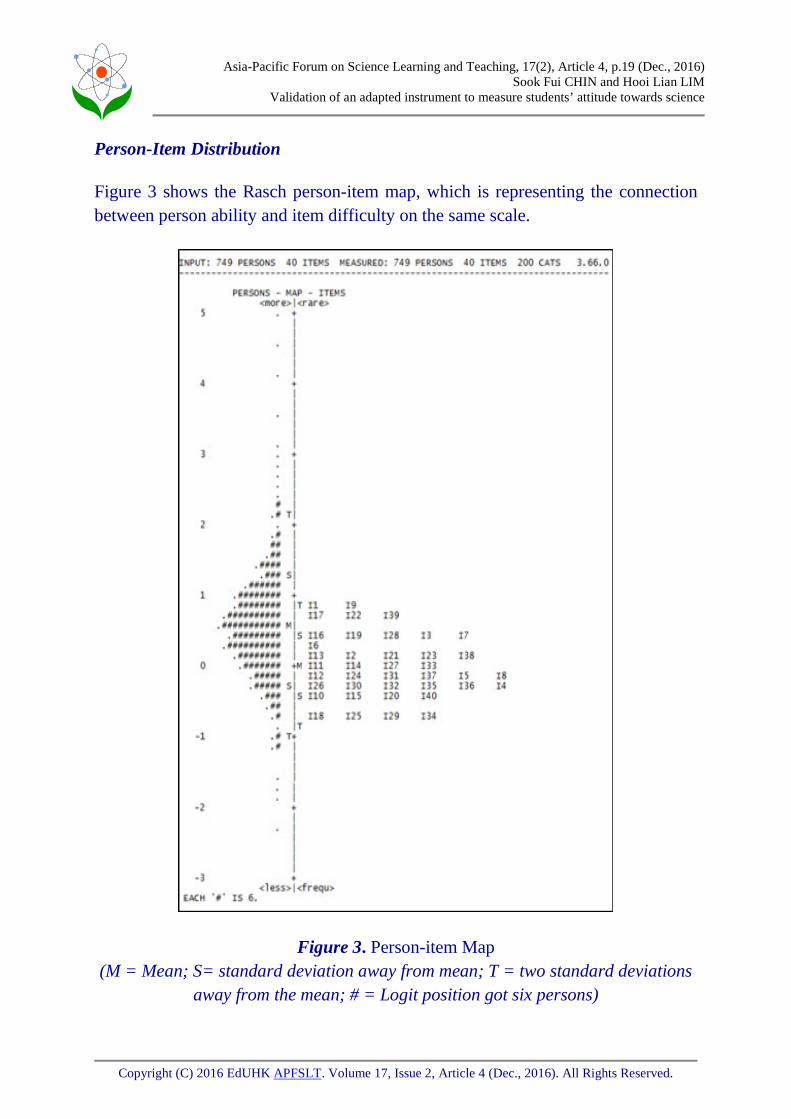
Figure 3 shows the Rasch person-item map, which is representing the connection between person ability and item difficulty on the same scale.
Figure 3. Person-item Map (M = Mean; S= standard deviation away from mean; T = two standard deviations
away from the mean; # = Logit position got six persons)
Copyright (C) 2016 EdUHK APFSLT. Volume 17, Issue 2, Article 4 (Dec., 2016). All Rights Reserved.

Asia-Pacific Forum on Science Learning and Teaching, 17(2), Article 4, p.20 (Dec., 2016)
Sook Fui CHIN and Hooi Lian LIM Validation of an adapted instrument to measure students’ attitude towards science
From Figure 3, the distributions of the items and person are normally distributed, indicating that the scale is appropriate for the participants (Alquraan, Alshraideh, & Bsharah, 2008). The mean measure of item is .00 logits and for person is .57 logits. Bottom items are the items that are easily endorsed and the top items are difficult to be endorsed. The person’s ability distribution is higher than the item difficulty distribution. This suggests that on average, respondents are more likely to agree to the items. However, items cover a range of -.75 to .83 logits and persons cover a range of -2.31 to 6.46 logits. In the other words, not all items can cover the range of trait measured (Green & Frantom, 2002).
(c) Rating Scale Diagnostics
Table 10 shows output for five-category rating scale. The average measure of category 1 is -.03, meaning that the average agreeability estimate for persons answering 1 across any item is -.03 logits. Average measures function as expected as they increase monotonically across the rating scale (from -.03 to 1.66) (Lamoureux et al., 2008).
Table 10. Category Frequencies and Average Measure Category Label Observed Count % Average Measure
1 62 8 -.03
2 189 25 .28
3 286 38 .49
4 179 24 1.00
5 32 4 1.66
*Item difficulty measure of .79 added to measures.
On the other hand, Figure 4 shows the probability curve of the five-point Likert Scale used in this study. Each category has a distinct peak which represent that each category is the most probable category for some part of the continuum. In conclusion, the rating scale used in this study is suitable.
Copyright (C) 2016 EdUHK APFSLT. Volume 17, Issue 2, Article 4 (Dec., 2016). All Rights Reserved.

Asia-Pacific Forum on Science Learning and Teaching, 17(2), Article 4, p.21 (Dec., 2016)
Sook Fui CHIN and Hooi Lian LIM Validation of an adapted instrument to measure students’ attitude towards science
Figure 4. Probability Curve
Discussion
Psychometric properties of ATST were examined by using Rasch analyses. Prior to the interpretation of the results obtained by using Rasch analyses, it is important to check the unidimensionality of the scale to ensure that data collected fits the model reasonably (Green & Denver, 2002). Previous studies show that there is misconception that internal consistency implies unidimensionality (Garner, 1995; Kind, Jones & Barmby, 2007). However, internally consistency does not represent unidimensionality. Since all items in a unidimensional scale measure a same construct, thus they will be internally consistent. However, an internal consistent scale might consist of more than one factor. Therefore, internal consistency does not imply unidimensionality. According to Kind, Jones, and Barmby (2007), a good instrument should be internally consistent and unidimensional. Thus, instead of internal consistency, it is important to examine the unidimensionality of ATST.
Based on findings, Cronbach’s alpha = .94 showed the internal consistency of ATST. In addition, fit statistics was used to show how well the raw data fit the Rasch model (Wu & Chang, 2008). Infit and outfit MNSQ for person and item are expected to be 1.00. Based on the findings in this study, infit MNSQ for person is 1.02 and for item
Copyright (C) 2016 EdUHK APFSLT. Volume 17, Issue 2, Article 4 (Dec., 2016). All Rights Reserved.

Asia-Pacific Forum on Science Learning and Teaching, 17(2), Article 4, p.22 (Dec., 2016)
Sook Fui CHIN and Hooi Lian LIM Validation of an adapted instrument to measure students’ attitude towards science
is 1.00. Meanwhile, outfit MNSQ for both person and item is 1.02. Besides, the mean standardized (ZSTD) for infit and outfit are expected to be 0.0. The findings of this study showed that infit ZSTD and outfit ZSTD for person is -.3; for item are -.1 and .2 respectively. On the other hand, point-biserial correlations for all items are positive, ranging from .40 to .70. This indicates that the item-level scoring accord with the underlying constructs. These mentioned points provide sufficient evidences of unidimensionality.
After the unidimensionality was established, item fit statistics was used to further evaluate item-level model fit. Only one item out of 40 items is not in the reasonable ranges, which is Item 3: scientists usually like to go to their laboratories when they have a day off. However, the deviation is small (infit MNSQ = 1.46; Outfit MNSQ = 1.50). In most of the previous studies, misfit items were eliminated from the item pool. For instance, in the study by Clements, Sarama, and Liu (2008), 37 items that either showed poor fit and poor correlation with the scale were eliminated. Similarly, Wu and Chang (2008) excluded two misfit items in their study.
However, in real life, no item fits Rasch Model perfectly. Unidimensionality is merely a statistical assumption. In addition, Choe (2010) had pointed out that instead of ability that is measured, it is entirely possible that other non-intended factors intervene in the testing procedures. Besides, fit statistics show “relative” fit but not “absolute fit” (Wu & Adams, 2007). A misfit item in one test may fit well with items in another test. Hence, instead of setting rules for accepting or eliminating an item from an item pool, fit statistics should be served as an indicator for detecting problematic items. It is supported by Wu and Adams (2007) that:
The fit statistics should not be used blindly to reject items, particularly those that “over-fit”, as you may remove the best items in your test because the rest of the items are not as “good” as these items (p. 85).
Hence, fit statistics should be used to demonstrate sufficient evidences of unidimensionality but not to set a cut off point for item selections. Bradley & Sampson (2006) showed the same standpoint with Wu and Adams (2007). They had constructed a Mathematics Quality Survey and examined its psychometric properties by using Rasch analysis. Only one item fell outside the reasonable range. However, the item was not removed from the scale, but the related results were interpreted with caution. In addition, Wilson (2005) pointed out researcher should make judgment whether to delete or keep an item that is flagged as misfit under Rasch model. After
Copyright (C) 2016 EdUHK APFSLT. Volume 17, Issue 2, Article 4 (Dec., 2016). All Rights Reserved.

Asia-Pacific Forum on Science Learning and Teaching, 17(2), Article 4, p.23 (Dec., 2016)
Sook Fui CHIN and Hooi Lian LIM Validation of an adapted instrument to measure students’ attitude towards science
considering the aforementioned points, sufficient evidences of the unidimensionality of ATST, and small deviation of infit and outfit value, Item 3 is not removed from the item pool.
After the appraisal of data fits the model, psychometric properties of ATST were analyzed and interpreted by using Rasch Model. Based on the findings, person reliability and item reliability are very high. High person reliability indicates the replicability of person ordering we could expect is another parallel test of items measuring the same trait is given to the same group of respondents. Meanwhile, item reliability indicates the replicability of item ordering we could expect if the test is given another group of respondents.
Next, person-item distribution was examined by using person-item map (Figure 3). It is very important to ensure that an instrument is able to detect the full variability in a population. As supported by Alquraan, Alshraideh, and Bsharah (2010), an instrument should be able to assess individual at both high levels and low levels of wisdom. The findings showed that not all items could cover the range of trait measured. Theoretically, items that have locations less than -.75 and more than .83 should be added. This could extend the range of the trait measured. However, only approximately one fifths of the students lie above and few students lie below the ability estimates that the items can measure. Furthermore, no noticeable gap in item difficulties among the items and the distributions of items and persons were normally distributed. Moreover, ATST is not a high-stake test for selective purposes. Therefore, it is still acceptable that ATST could not cover to range of trait measured for approximately one fifths of the students that endorse items in ATST easily.
The psychometric properties of rating scale used in ATST were examined too. In ATST, five-point Likert’s scale, which is one of the most common attitude scales in social science researches was used (Adelson & McCoach, 2010). Rating scale has great influence on the quality of data obtained (Bond & Fox, 2001). Although Likert’s scale has been used widely all around the world, one of the major problem in using Likert’s scale is the undetermined optimal number of response categories (Adelson & McCoach, 2010; Preston & Colman, 2000). Based on findings, average measures function and probability curve show that the five-point Likert Scale is a suitable scale for ATST. In conclusion, Rasch analyses provide strong indications that the ATST used in this study is having sufficient evidences of psychometric properties.
Copyright (C) 2016 EdUHK APFSLT. Volume 17, Issue 2, Article 4 (Dec., 2016). All Rights Reserved.
Asia-Pacific Forum on Science Learning and Teaching, 17(2), Article 4, p.24 (Dec., 2016)
Sook Fui CHIN and Hooi Lian LIM Validation of an adapted instrument to measure students’ attitude towards science
Conclusion
By using Rasch model, the findings of this study showed that the adapted ATST demonstrates sufficient evidences of psychometric properties. Thus, it has the potential to be a diagnostic tool in assessing students’ ATS in the future.
Implications of the Study
This section would discuss the practical implication after the findings discovered. The findings of this study have a number of important implications for future practice. First, in this study, the adapted ATS measure, ATST demonstrated sufficient evidence of psychometric properties in the context of Malaysia. It has the potential to be used to retrieve Malaysian secondary school students’ ATS validly. However, the purpose of the ATST used in this study is not for selection purpose, especially for high-stake test purpose. Without denying the importance of cognitive aspect in tracking, this study intends to put ATST in the position of diagnostic test to retrive students’ ATS but not a selective test to determine a student’s stream. It can be a useful tool for schools and teachers in gaining valuable information. They might use the ATST to investigate the level of ATS of their students and pinpoint attributes that contribute to the decreasing of students’ ATS. In turn, elevate students’ ATS and improve their science achievement.
Besides, although ATS is not new in science education, there is a lack of clarification about what is being measured. In this study, an ATS framework was articulated based on theories and previous study. Findings of this study showed that there are strong correlation between the eight ATS constructs, supporting the relevancy and accuracy of the framework. Hence, this framework has the potential to serve to advance the knowledge of ATS and provide a framework for ATS research in the future.
Future Study
This research has thrown up many questions in need of further investigation. First, due to the time constraint, various aspects of psychometric properties of the ATST used in this study were examined, except the predictive validity, worth for future investigation. Besides, the researcher did not investigate the problematic items in further, such as misfit item as this is beyond the scope of the present study. Therefore,
Copyright (C) 2016 EdUHK APFSLT. Volume 17, Issue 2, Article 4 (Dec., 2016). All Rights Reserved.

Asia-Pacific Forum on Science Learning and Teaching, 17(2), Article 4, p.25 (Dec., 2016)
Sook Fui CHIN and Hooi Lian LIM Validation of an adapted instrument to measure students’ attitude towards science
further investigation into misfit items to enhance the psychometric properties of ATST is recommended.
On the other hand, some extraneous variables that could have influenced the result might have been excluded in this study. They might be socio economic status, family background, culture, mother tongue, and type of school. Since Malaysia is a country which is rich in different cultures and languages, it would be interesting to assess the effect of various demographic factors in future research to get more precise and representative results.
In addition, result of this study might not represent the whole country of Malaysia. As this research was carried out in the state of Penang, Malaysia, generalization of the findings on other states is limited. More information on different states in Malaysia would help us to establish a greater degree of accuracy on this matter and make comparison study possible.
References
Adelson, J. L., & McCoach, D. B. (2010). Measuring the mathematical attitudes of elementary students: the effects of a 4-point or 5-point Likert-type scale. Educational and Psychological Measurement, 70(5), 796-807.
Ajzen, I. (2001). Nature and operation of attitudes. Annual Review of Psychology, 52, 27–58. Alquraan, M., Alshraideh, M., & Bsharah, M. (2010). Psychometric properties and differential
item functioning (DIF) analyses of Jordanian version of Self-Assessed Wisdom Scale (SAWS-Jo). International Journal of Applied Educational Studies, 9(1), 52-66.
Barnette, J. J. (2000). Effects of stem and Likert response option reversals on survey negatively worded stems. Educational and Psychological Measurement, 60(3), 361-370
Blalock, C. L., Lichtenstein, M. J., Owen, S., Pruski, L., Marshall, C., & Toepperwein, M. (2009). In pursuit of validity: a comprehensive review of science attitude instruments 1935-2005. International Journal of Science Education, 961-977.
Bond, T. G., & Fox, C. M. (2001). Applying the Rasch Model: Fundamental Measurement in the Human Sciences. Mahwah, NJ: Lawrence Erlbaum Associates Publishers.
Boyd, B. L., Dooley, K. E., & Felton, S. (2006). Measuring learning in the affective domain using reflective writing about a virtual international agriculture experience. Journal of Agricultural Education, 47(3), 24-32.
Bradley, K., & Sampson, S. R. (2006). Appying the Rasch rating scale model to gain insights into students' conceptualisation of quality mathematics instruction. Mathematics Education Research Journal, 18(2), 11-26.
Brown, A., & Maydeau-Olivares, A. (2011). Item response modeling of forced-choice questionnaires. Educational and Psychological Measurement, 71(3), 460–502.
Chamberlain, V. M., & Cummings, M. N. (1984). Development of an instructor/course evaluation instrument. College Student Journal, 246-250.
Copyright (C) 2016 EdUHK APFSLT. Volume 17, Issue 2, Article 4 (Dec., 2016). All Rights Reserved.

Asia-Pacific Forum on Science Learning and Teaching, 17(2), Article 4, p.26 (Dec., 2016)
Sook Fui CHIN and Hooi Lian LIM Validation of an adapted instrument to measure students’ attitude towards science
Chen, C. H., & Howard, B. (2010). Effect of live simulation on middle school students’
attitudes and learning toward science. Educational Technology & Society, 13(1), 133-139.
Choe, M. (2010). Rasch analysis of a nationwide English placement test in Korea. English Teaching, 65(2), 3-23.
Clements, D. H., Sarama, J. H., & Liu, X. H. (2008). Development of a measure of early mathematics achievement using the Rasch model: the research-based early maths assessment. Educational Psychology, 28(4), 457-482.
Cokadar, H., & Kulce, C. (2008). Pupils' attitude towards science: A case of Turkey. World Applied Science Journal, 3(1), 102-109.
Coll, R. K., Dalgety, J., & Salter, D. (2002). The development of the chemistry attitudes and experiences questionnaire (CAEQ). Chemistry Education: Research and Practice in Europe, 3(1), 19-32.
Crano, W. D., & Prislin, R. (2006). Attitudes and persuation. Annual Review of Psychology, 57, 345-374.
Farenga, S. J., & Joyce, B. A. (1998). Science-related attitudes and science course selection: A study of high-ability boys and girls. Roeper Review, 20(4), 247-251.
Fletcher, R., & Hattie, J. (2005). Gender differences in physical self-concept: a multidimensional differential item functioning analysis. Educational and Psychological Measurement, 65(4), 657-667.
Francis, L. J., & Greer, J. E. (1999). Measuring attitude towards science among secondary school students: the affective domain. Research in Science & Technological Education, 17(2), 219-226
Fraser, B. J. (1981). Test of Science-Related Attiudes Handbook (TOSRA). Melbourne: Australia: The Australian Council for Educational Research.
Gay, L. R., Mills, G. E., & Airasian, P. (2009). Educational Research: Competencies for Analysis and Applications (9th ed.). United States of America: Pearson Education International.
George, R. (2000). Measuring change in students’ attitudes towards science over time: an application of latent variable growth modeling. Journal of Science Education and Technology, 9(3), 217-225.
Green, K. E., & Frantom, C. G. (2002). Survery development and validation with the Rasch Model. International Conference on Questionnaire Development, Evaluation, and Testing. Charleson, SC.
Hambleton, R. K., & Patsula, L. (1999). Adapting tests for use in multiple languages and cultures. Social Indicators Research, 45(1-3), 153-172.
Hassan, G. (2008). Attitudes toward science among Australian tertiary and secondary school students. Research in Science & Technological Education, 26(2), 129-147.
Hopkins, K. D. (1998). Educational and Psychological Measurement and Evaluation (8th ed.). United States of America: Allyn & Bacon.
Kind, P. M., Jones, K., & Barmby, P. (2007). Developing attitudes towards science measures. International Journal of Science Education, 29(7), 871-893.
Kind, P. M., Jones, K., & Barmby, P. (2008). Examining changing attitudes in secondary school science. International Journal of Science Education, 30(8), 1075-1093.
King, L. P. (1971). The Relationship of Affective Changes to Cognitive Skills Development. Retrieved from http://www.eric.ed.gov
Klopfer, L. E. (1971). Evaluation of Learning in Science. In B. Bloom, J. T. Hastingsa, & Madaus G. F. (Eds), Handbook on Summative and Formative Evaluation of Student Learning. New York: McGraw-Hill.
Copyright (C) 2016 EdUHK APFSLT. Volume 17, Issue 2, Article 4 (Dec., 2016). All Rights Reserved.

Asia-Pacific Forum on Science Learning and Teaching, 17(2), Article 4, p.27 (Dec., 2016)
Sook Fui CHIN and Hooi Lian LIM Validation of an adapted instrument to measure students’ attitude towards science
Lamoureux, E., Pesudovs, K., Pallant, J. F., Rees, G., Hassell, J. B., & Caudle, L. E. (2008). An
evaluation of the 10-item vision core measure 1 (VCM1) scale (the core module of the vision-related quality of Likert scale) using Rasch analysis. Ophthalmic Epidemiology , 15(July-August), 224-233.
Lynch, D. R., Russell, J. S., Evans, J. C., & Sutterer, K. G. (2009). Beyond the cognitive: the affective domain, values, and the achievement of the vision. Journal of Professional Issues in Engineering Education & Practice, 135(1), 47-56.
Marsh, H. W. (1996). Positive and negative self-esteem: a substantively meaningful distinction or artifactors. Journal of Personality and Social Psychology, 70, 810-819.
McCormack, G. R., Masse, L. C., Bulsara, M. K., Pikora, T. J., & Giles-Corti, B. (2006). Constructing indices representing supportiveness of the physical environment for walking using the Rasch measurement model. International Journal of Behavioural Nutrition and Physical Activity, 3(44), 1-13.
Munby, H. (1997). Issues of validity in science attitude measurement. Journal of Research in Science Teaching, 34(4), 337-341.
Oliver, M., & Venville, G. (2011). An exploratory case study of Olympiad students' attitudes towards and passion for science. International Journal of Science Education, First published on: 21 April 2011 (iFirst).
Olubor, R. O., & Ogonor, B. O. (2007). Instructional activities of staff personnel in the effective domain in selected secondary schools in Southern Nigeria. International Education Journal, 8(1), 82-88.
Oluwatelure, T. A., & Oloruntegbe, K. O. (2010). Review: effects of parental involvement on students’ attitude and performance in science. Journal of Microbiology Research, 4(1), 1-9.
Osborne, J., Simon, S., & Collins, S. (2003). Attitudes towards science: a review of the literature and its implications. International Journal of Science Education, 25(9), 1049-1079.
Pang, V., & Lajium, D. (2008). Penilaian Dalam Pendidikan. Sabah: Universiti Malaysia Sabah.
Pell, A. W., & Manganye, H. T. (2007). South African primary ahildren's attitudes to science. Evaluation & Research in Education, 20(3), 121-143.
Pilotte, W. J., & Gable, R. K. (1990). The impact of positive and negative item stems on the validity of a computer anxiety scale. Educational and Psychological Measurement, 50(3), 603-610.
Popham, W. J. (2000). Modern Educational Measurement (3rd ed.). United States of America: Allyn & Bacon.
Preston, C. C., & Colman, A. M. (2000). Optimal number of response categories in rating scales: reliability, validity, discriminating power, and respondent preferences. Acta Psychologica, 104, 1-15.
Reid, N. (2006). Thoughts on attitude measurement. Research in Science & Technological Education, 24(1), 3-27.
Salta, K., & Tzougraki, C. (2004). Attitudes towards chemistry among 11th grade students in high schools in greece. Science Education, 88, 535-547.
Savickiene, I. (2010). Conception of learning outcomes in the Bloom's taxonomy affective domain. Quality of Higher Education, 7, 37-57.
Sax, G. (1997). Principles of Educational and Psychological Measurement and Evaluation. United States of America: Wadsworth Publishing Company.
Copyright (C) 2016 EdUHK APFSLT. Volume 17, Issue 2, Article 4 (Dec., 2016). All Rights Reserved.

Asia-Pacific Forum on Science Learning and Teaching, 17(2), Article 4, p.28 (Dec., 2016)
Sook Fui CHIN and Hooi Lian LIM Validation of an adapted instrument to measure students’ attitude towards science
Schriesheim, C. A., & Hill, K. D. (1981). Controlling acquiescence response bias by item
reversals: the effect on questionnaire validity. Educational and Psychological Measurement, 41, 1101-1114.
Schumacker, R. E., & Smith, E. V. (2007). Reliability: A Rasch perspective. Educational and Psychological Measurement , 67(3), 394-409.
Siegel, M. A., & Ranney, M. A. (2003). Developing the changes in attitude about the relevance science questionnaire and assessing two high school science classes. Journal of Research in Science Teaching, 40(8), 757-775.
Simpson, R. D., & Oliver, J. S. (1990). A summary of major influences on attitude toward and achievement in science among adolescent students. Science Education, 74(1), 1-18.
Subramaniam, P. R., & Silverman, S. (2000). Validation of scores from an instrument assessing student attitude toward physical education. Measurement in Physical Education and Exercise Science, 4(1), 29-43.
Tegtmeier, T. (2009). Sciece-related Attitudes of Urban Middle School Students. Unpublished Master Dissertation, California State University.
Wang, T.-L., & Berlin, D. (2010). Construction and Validation of an Instrument to Measure Taiwanese Elementray Students’ Attitudes towards Their Science Class. International Journal of Science Education, 32(18), 2413 – 2428
Wilson, M. (2005). Constructing Measures: An Item Response Modeling Approach. Mahwah, NJ: Lawrence Erlbaum Associates.
Wu, M., & Adams, R. (2007). Applying the Rasch model to Psycho-Social Measurement: A Practical Approach. Melbourne: Educational Measurement Solutions.
Wu, P. C., & Chang, L. (2008). Psychometric properties of the Chinese version of the Beck Depression Inventory-II using the Rasch model. Measurement and Evaluation in Counselling and Development, 41, 13-31.
Zhang, D., & Campbell, T. (2010). The psychometric evaluation of a three-dimension elementary science attitude survey. Journal of Science Teacher Education, Advance online publication.
Copyright (C) 2016 EdUHK APFSLT. Volume 17, Issue 2, Article 4 (Dec., 2016). All Rights Reserved.


![20091207 [Adapted] Its Attitude And Not Resources](https://static.fdocuments.in/doc/165x107/553821d84a79591b688b470a/20091207-adapted-its-attitude-and-not-resources.jpg)
