Validation and Enforcement Standards Thresholds · Validations Needed ... •Sampling of 10-20% of...
19
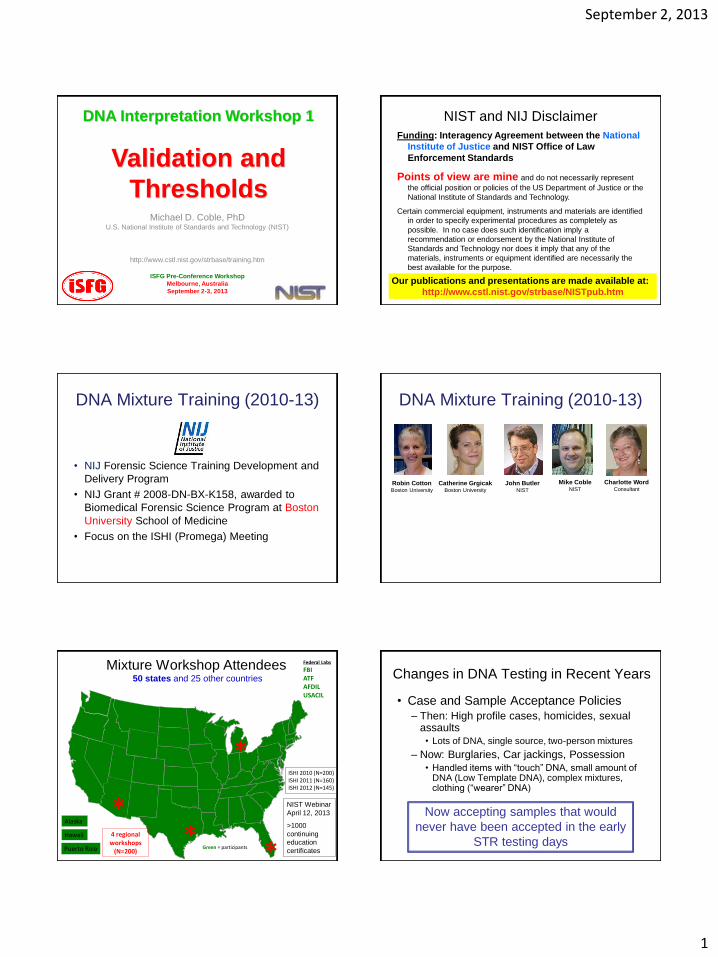
September 2, 2013 1 DNA Interpretation Workshop 1 Validation and Thresholds Michael D. Coble, PhD U.S. National Institute of Standards and Technology (NIST) http://www.cstl.nist.gov/strbase/training.htm ISFG Pre-Conference Workshop Melbourne, Australia September 2-3, 2013 NIST and NIJ Disclaimer Funding: Interagency Agreement between the National Institute of Justice and NIST Office of Law Enforcement Standards Points of view are mine and do not necessarily represent the official position or policies of the US Department of Justice or the National Institute of Standards and Technology. Certain commercial equipment, instruments and materials are identified in order to specify experimental procedures as completely as possible. In no case does such identification imply a recommendation or endorsement by the National Institute of Standards and Technology nor does it imply that any of the materials, instruments or equipment identified are necessarily the best available for the purpose. Our publications and presentations are made available at: http://www.cstl.nist.gov/strbase/NISTpub.htm DNA Mixture Training (2010-13) • NIJ Forensic Science Training Development and Delivery Program • NIJ Grant # 2008-DN-BX-K158, awarded to Biomedical Forensic Science Program at Boston University School of Medicine • Focus on the ISHI (Promega) Meeting DNA Mixture Training (2010-13) John Butler NIST Mike Coble NIST Robin Cotton Boston University Catherine Grgicak Boston University Charlotte Word Consultant Alaska Hawaii Mixture Workshop Attendees 50 states and 25 other countries Green = participants ISHI 2010 (N=200) ISHI 2011 (N=160) ISHI 2012 (N=145) Federal Labs FBI ATF AFDIL USACIL * * * * 4 regional workshops (N=200) Puerto Rico NIST Webinar April 12, 2013 >1000 continuing education certificates Changes in DNA Testing in Recent Years • Case and Sample Acceptance Policies – Then: High profile cases, homicides, sexual assaults • Lots of DNA, single source, two-person mixtures – Now: Burglaries, Car jackings, Possession • Handled items with “touch” DNA, small amount of DNA (Low Template DNA), complex mixtures, clothing (“wearer” DNA) Now accepting samples that would never have been accepted in the early STR testing days
Transcript of Validation and Enforcement Standards Thresholds · Validations Needed ... •Sampling of 10-20% of...
September 2, 2013
1
DNA Interpretation Workshop 1
Validation and
Thresholds Michael D. Coble, PhD
U.S. National Institute of Standards and Technology (NIST)
http://www.cstl.nist.gov/strbase/training.htm
ISFG Pre-Conference Workshop
Melbourne, Australia
September 2-3, 2013
NIST and NIJ Disclaimer
Funding: Interagency Agreement between the National
Institute of Justice and NIST Office of Law
Enforcement Standards
Points of view are mine and do not necessarily represent
the official position or policies of the US Department of Justice or the
National Institute of Standards and Technology.
Certain commercial equipment, instruments and materials are identified
in order to specify experimental procedures as completely as
possible. In no case does such identification imply a
recommendation or endorsement by the National Institute of
Standards and Technology nor does it imply that any of the
materials, instruments or equipment identified are necessarily the
best available for the purpose.
Our publications and presentations are made available at:
http://www.cstl.nist.gov/strbase/NISTpub.htm
DNA Mixture Training (2010-13)
• NIJ Forensic Science Training Development and
Delivery Program
• NIJ Grant # 2008-DN-BX-K158, awarded to
Biomedical Forensic Science Program at Boston
University School of Medicine
• Focus on the ISHI (Promega) Meeting
DNA Mixture Training (2010-13)
John Butler NIST
Mike Coble NIST
Robin Cotton Boston University
Catherine Grgicak Boston University
Charlotte Word Consultant
Alaska
Hawaii
Mixture Workshop Attendees 50 states and 25 other countries
Green = participants
ISHI 2010 (N=200) ISHI 2011 (N=160) ISHI 2012 (N=145)
Federal Labs
FBI ATF AFDIL USACIL
* *
*
* 4 regional workshops
(N=200) Puerto Rico
NIST Webinar
April 12, 2013
>1000
continuing
education
certificates
Changes in DNA Testing in Recent Years
• Case and Sample Acceptance Policies
– Then: High profile cases, homicides, sexual assaults
• Lots of DNA, single source, two-person mixtures
– Now: Burglaries, Car jackings, Possession
• Handled items with “touch” DNA, small amount of DNA (Low Template DNA), complex mixtures, clothing (“wearer” DNA)
Now accepting samples that would
never have been accepted in the early
STR testing days
September 2, 2013
2
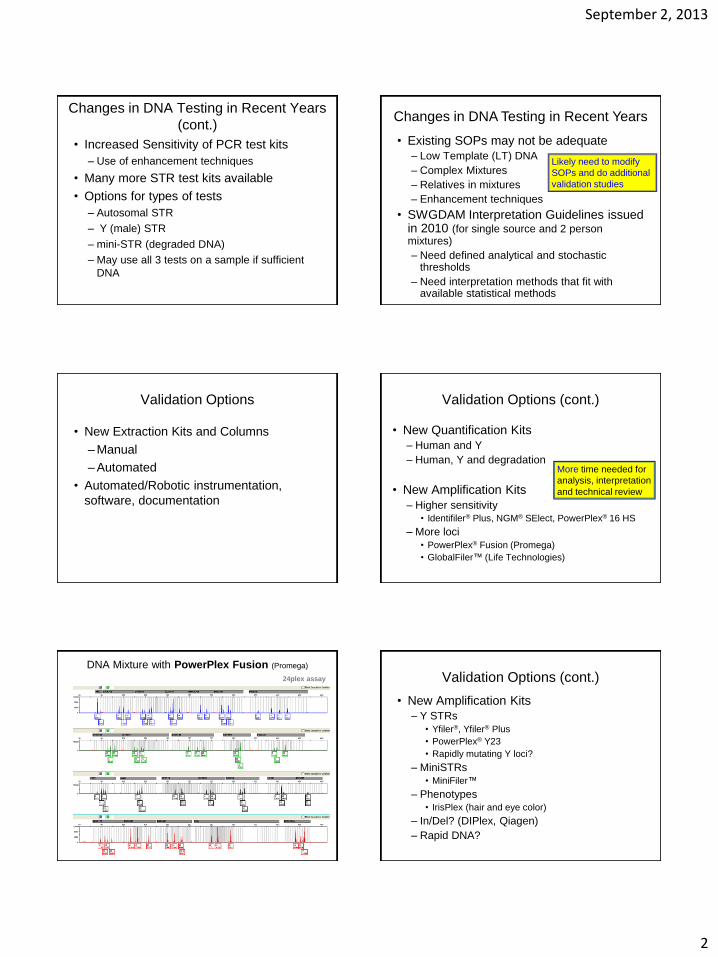
• Increased Sensitivity of PCR test kits
– Use of enhancement techniques
• Many more STR test kits available
• Options for types of tests
– Autosomal STR
– Y (male) STR
– mini-STR (degraded DNA)
– May use all 3 tests on a sample if sufficient
DNA
Changes in DNA Testing in Recent Years
(cont.) • Existing SOPs may not be adequate
– Low Template (LT) DNA
– Complex Mixtures
– Relatives in mixtures
– Enhancement techniques
• SWGDAM Interpretation Guidelines issued in 2010 (for single source and 2 person mixtures)
– Need defined analytical and stochastic thresholds
– Need interpretation methods that fit with available statistical methods
Changes in DNA Testing in Recent Years
Likely need to modify
SOPs and do additional
validation studies
Validation Options
• New Extraction Kits and Columns
– Manual
– Automated
• Automated/Robotic instrumentation,
software, documentation
Validation Options (cont.)
• New Quantification Kits
– Human and Y
– Human, Y and degradation
• New Amplification Kits
– Higher sensitivity • Identifiler® Plus, NGM® SElect, PowerPlex® 16 HS
– More loci
• PowerPlex® Fusion (Promega)
• GlobalFiler™ (Life Technologies)
More time needed for
analysis, interpretation
and technical review
DNA Mixture with PowerPlex Fusion (Promega)
24plex assay Validation Options (cont.)
• New Amplification Kits
– Y STRs
• Yfiler®, Yfiler® Plus
• PowerPlex® Y23
• Rapidly mutating Y loci?
– MiniSTRs
• MiniFiler™
– Phenotypes • IrisPlex (hair and eye color)
– In/Del? (DIPlex, Qiagen)
– Rapid DNA?
September 2, 2013
3
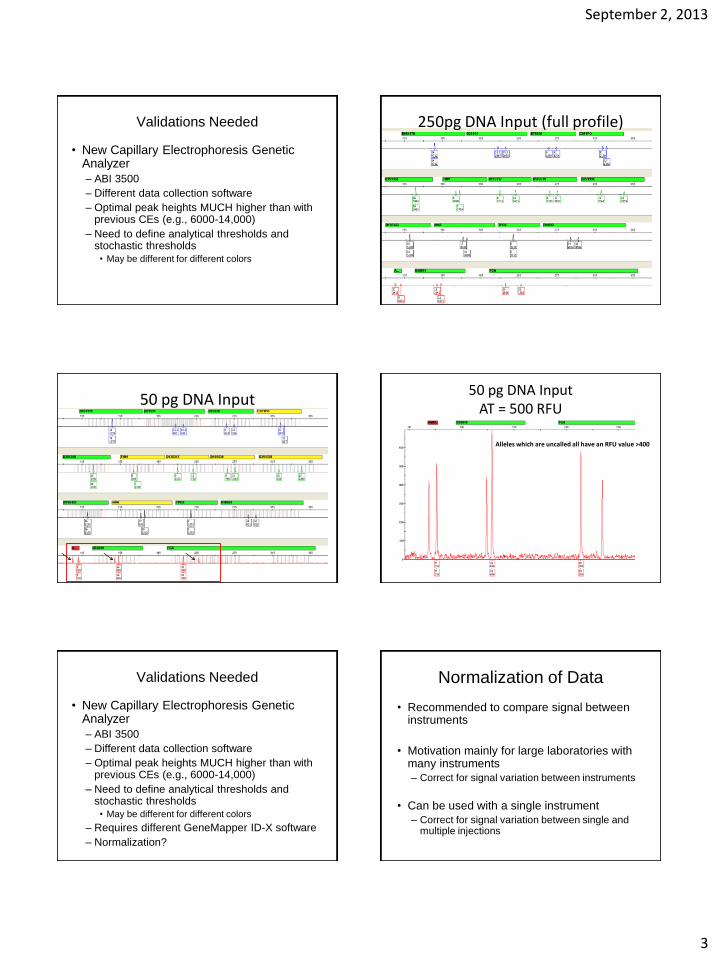
Validations Needed
• New Capillary Electrophoresis Genetic Analyzer
– ABI 3500
– Different data collection software
– Optimal peak heights MUCH higher than with previous CEs (e.g., 6000-14,000)
– Need to define analytical thresholds and stochastic thresholds
• May be different for different colors
250pg DNA Input (full profile)
50 pg DNA Input 50 pg DNA Input
AT = 500 RFU
Alleles which are uncalled all have an RFU value >400
Validations Needed
• New Capillary Electrophoresis Genetic Analyzer
– ABI 3500
– Different data collection software
– Optimal peak heights MUCH higher than with previous CEs (e.g., 6000-14,000)
– Need to define analytical thresholds and stochastic thresholds
• May be different for different colors
– Requires different GeneMapper ID-X software
– Normalization?
Normalization of Data
• Recommended to compare signal between instruments
• Motivation mainly for large laboratories with many instruments
– Correct for signal variation between instruments
• Can be used with a single instrument
– Correct for signal variation between single and multiple injections

September 2, 2013
4
Normalization Definitions
• Normalization Target (NT)
– Requires the use of LIZ 600 v2.0 size standard
– Average peak heights of 11 peaks within LIZ 600
v2.0 selected for peak height consistency across
lots
– Applied within data collection software prior to
running samples
Normalization Definitions
• Normalization Factor (NF)
– Adjustment needed for individual samples to
reach the Normalization Target value
– Full signal adjustment (baseline, peaks, artifacts,
etc)
• Either increase or decrease signal
Normalization Example
Without
Normalization
NF=1.959
Signal increases
almost by a factor of 2
NF= 0.596
Signal decreases
by almost half
With
Normalization
Theoretical Normalization Target: 2000 RFU
LIZ 600 v2.0
Peak Height
Average:
1021 RFU
LIZ 600 v2.0
Peak Height
Average:
3192 RFU
Validations – More Data Needed
• Sensitivity Studies
– Better understanding of Low Template (LT)
DNA and Stochastic Effects
• Single dilution series NOT adequate
– Aid in establishing one or more analytical
thresholds and stochastic thresholds
• Low amount of DNA vs. high amounts of DNA
• Mixture Studies
– Complex mixtures, if accepting and
interpreting samples with >2 contributors
Validations – More Data Needed
• Enhancement Techniques for LT DNA
– Decreased amplification volume
– Increased amplification cycles
– Increased injection time or voltage
– Increased product in sample prep for CE
– Post-amplification clean-up
• Must do validation studies for ALL
conditions with all kits
Validations Options
• Casework vs. Databasing
– Direct amplification kits (no extraction or
quantification)
– Small amounts of DNA vs. higher amounts
– Mixtures vs. single source
• Interpretation for database entry vs. case
work interpretation
– How different are they?

September 2, 2013
5
Validations need to include:
Evaluation of all aspects of testing procedures
1) Technology performance (kits, instruments)
2) Assessment of data with known contributor(s)
Limitations of each aspect of the test system
3) Development of SOPs that reflect validation
done, including interpretation guidelines
Testing of samples from known individuals that
reflect casework acceptance policies
1) Low Template DNA
2) Complex Mixtures
New Validation Studies
• Technical leader will need lots of help and
time to conduct and evaluate appropriate
studies
• Multiple samples will need to be tested
• May need additional training or assistance
to evaluate data (statistics)
• Interpretation SOPs will be much longer
and more complicated and detailed
Considerations
• Review samples received and test results
– Successes vs. inconclusives
• Review case acceptance policies
– Limit sample number
– Limit samples with low likelihood of results
• What tests are really needed?
– What does your lab need to validate vs.
outsource? (e.g., Y STRs, MiniFiler)
Considerations
• Implement a plan for evaluation of reported cases when interpretation SOPs change
– Minor or significant change in SOP leading to minor or significant change in interpretation?
– Change in conclusions (e.g., inclusion to inconclusive or exclusion – most likely)
– Possible options: • Sampling of 10-20% of cases form plan
• Re-review when discovery requested and/or when requested to testify
• When additional testing being done in a case
Elements of DNA Mixture Interpretation
Practice (training & experience)
Principles (theory)
Protocols (validation)
ISFG Recommendations
SWGDAM Guidelines
Your Laboratory SOPs
Training within Your Laboratory
Consistency across analysts
Periodic training will aid accuracy and efficiency within your laboratory.
Common Perceptions of Validation
Lots of
experiments
are required
Significant time is required to perform studies
The goal is not to
experience every
possible scenario during validation…
“You cannot mimic
casework because every
case is different.”
Effort
Time
September 2, 2013
6
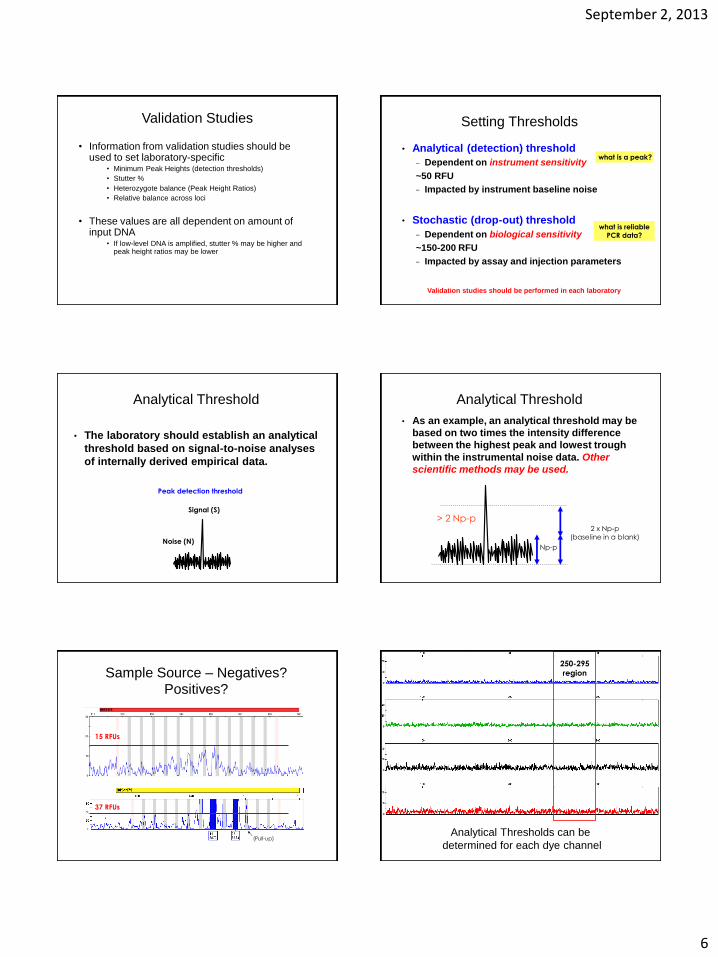
Validation Studies
• Information from validation studies should be used to set laboratory-specific
• Minimum Peak Heights (detection thresholds)
• Stutter %
• Heterozygote balance (Peak Height Ratios)
• Relative balance across loci
• These values are all dependent on amount of input DNA
• If low-level DNA is amplified, stutter % may be higher and peak height ratios may be lower
Setting Thresholds
• Analytical (detection) threshold
− Dependent on instrument sensitivity
~50 RFU
− Impacted by instrument baseline noise
• Stochastic (drop-out) threshold
− Dependent on biological sensitivity
~150-200 RFU
− Impacted by assay and injection parameters
Validation studies should be performed in each laboratory
what is a peak?
what is reliable
PCR data?
Analytical Threshold
• The laboratory should establish an analytical
threshold based on signal-to-noise analyses
of internally derived empirical data.
Peak detection threshold
Noise (N)
Signal (S)
• As an example, an analytical threshold may be
based on two times the intensity difference
between the highest peak and lowest trough
within the instrumental noise data. Other
scientific methods may be used.
2 x Np-p
(baseline in a blank)
> 2 Np-p
Np-p
Analytical Threshold
(Pull-up)
15 RFUs
37 RFUs
Sample Source – Negatives? Positives?
Analytical Thresholds can be
determined for each dye channel
250-295
region
September 2, 2013
7
How to set an analytical threshold (AT)?
Some Examples…
SWGDAM: Two times the intensity difference between the highest peak and lowest trough (as an example).
Three times the highest peak.
Gilder et al. (2007): Determined LOD by examining Pos, Neg, RB from 150 cases.
Gilder et al. (2007)
LOD = 29 RFUs
Figure 2
10:1 mixture
Gilder et al. (2007) How to set an analytical threshold (AT)? Some Examples…
SWGDAM: Two times the intensity difference between the highest peak and lowest trough (as an example).
Three times the highest peak.
Gilder et al. (2007): Determined LOD by examining Pos, Neg, RB from 150 cases.
Catherine Grgicak (Boston U.) presentation at the 2010 ISHI (Promega) mixture workshop. (http://www.cstl.nist.gov/biotech/strbase/mixture.htm)
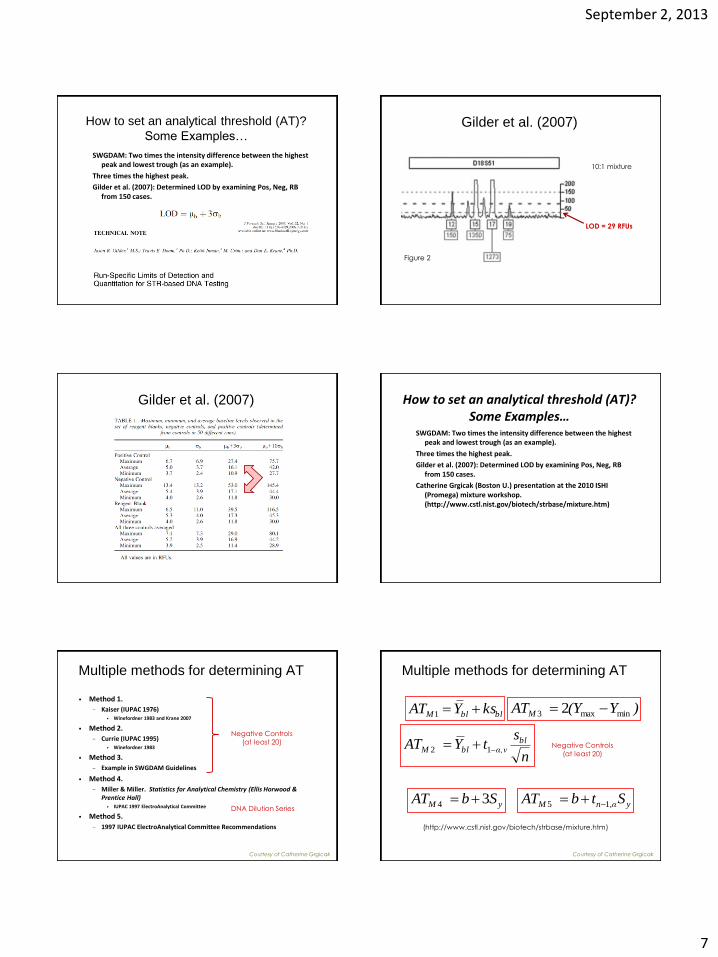
Multiple methods for determining AT
• Method 1.
− Kaiser (IUPAC 1976) • Winefordner 1983 and Krane 2007
• Method 2.
− Currie (IUPAC 1995) • Winefordner 1983
• Method 3.
− Example in SWGDAM Guidelines
• Method 4.
− Miller & Miller. Statistics for Analytical Chemistry (Ellis Horwood & Prentice Hall)
• IUPAC 1997 ElectroAnalytical Committee
• Method 5.
− 1997 IUPAC ElectroAnalytical Committee Recommendations
Negative Controls
(at least 20)
Courtesy of Catherine Grgicak
DNA Dilution Series
Negative Controls
(at least 20)
Courtesy of Catherine Grgicak
blblM ksYAT 1
n
stY AT bl
α,νblM 12
)Y(Y ATM minmax3 2
yM Sb AT 34 y,αnM Stb AT 15
(http://www.cstl.nist.gov/biotech/strbase/mixture.htm)
Multiple methods for determining AT

September 2, 2013
8
Method Origin Analytical Threshold for green 5s injection
example
1 Negatives 7
2 Negatives 4
3 Negatives 20
4 DNA Series 31
5 DNA Series 39
Courtesy of Catherine Grgicak
Multiple methods for determining AT
• The Analytical Threshold is the “floor” of the
EPG. Peaks below the AT by definition should
not be trusted!
AT
What about peaks below the AT?
Stochastic Thresholds
Some thoughts…
Conference Held in Rome in April 2012 h
ttp://w
ww
.oic
.it/
Fore
nsic
Gen
etics/im
ma
gin
i/im
g-h
om
e.jpg
http://www.oic.it/ForensicGenetics/scientific-programme.php
Peter Gill
University of Oslo, Norway
• “If you are going to have a threshold, at least try
to associate it with a level of risk. You can have
a threshold any where you like, but the lower the
[stochastic] threshold, the greater the risk is of
wrongful designation [of genotypes]. The higher
the threshold, the more likely you will have an
inconclusive result.”
Disk 1, 2:05:00 Rome meeting, April 27-28, 2012: The hidden side of DNA profiles: artifacts, errors and uncertain evidence
David Balding
• “In ideal analysis, we would never use
thresholds, but in practice they are useful. I don’t
think we have sophisticated enough models in
many situations to understand all of the details
of the data. Thresholds provide a
simplification. That is reasonable as long as
they are backed up by calibration evidence.”
Disk 1, 2:02:00 Rome meeting, April 27-28, 2012: The hidden side of DNA profiles: artifacts, errors and uncertain evidence
September 2, 2013
9
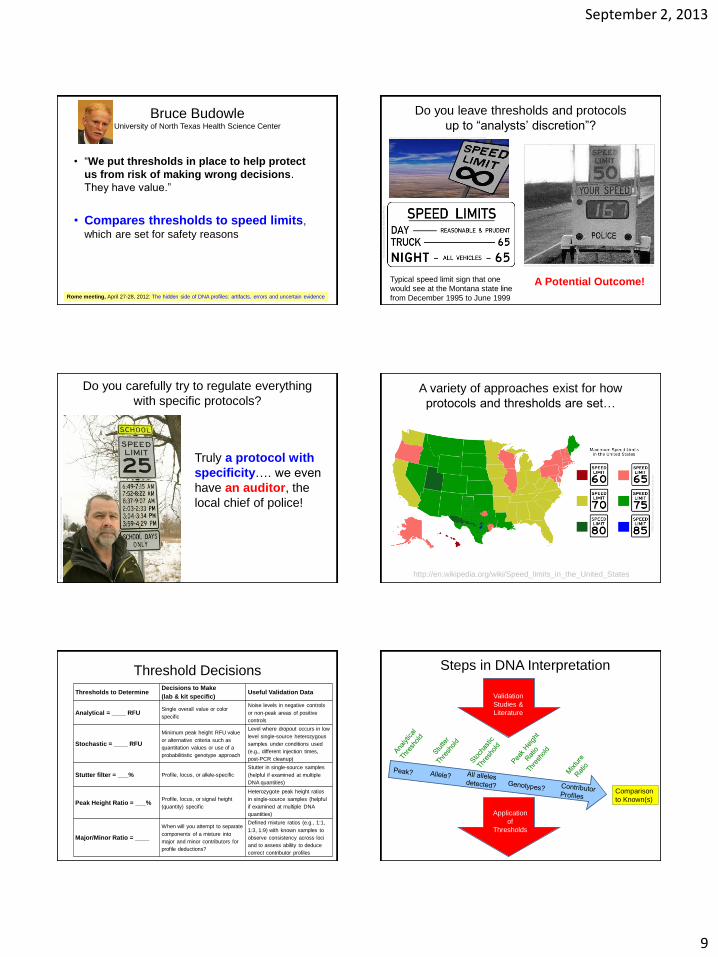
Bruce Budowle University of North Texas Health Science Center
• “We put thresholds in place to help protect
us from risk of making wrong decisions.
They have value.”
• Compares thresholds to speed limits,
which are set for safety reasons
Disk 2, 47:00 Rome meeting, April 27-28, 2012: The hidden side of DNA profiles: artifacts, errors and uncertain evidence
Do you leave thresholds and protocols
up to “analysts’ discretion”?
Typical speed limit sign that one
would see at the Montana state line
from December 1995 to June 1999
http://e
n.w
ikip
edia
.org
/wik
i/File
:MO
NT
AN
A-P
R.s
vg
http://1.bp.blogspot.com/-5gagI4xZbT0/TdvMBGODBZI/AAAAAAAAJYo/Pj9MRqANvvs/s400/speed-limit-change-sign-537.jpg
A Potential Outcome!
http://korsgaardscommentary.blogspot.com/2011/10/its-time-to-put-brakes-on-speed-limit.html
Do you carefully try to regulate everything
with specific protocols?
htt
p:/
/ww
w.lo
str
epublic
.us/a
rchiv
es/c
ate
gory
/moneta
ry-p
olic
y/priva
tized-r
oads
Truly a protocol with
specificity…. we even
have an auditor, the
local chief of police!
A variety of approaches exist for how
protocols and thresholds are set…
htt
p:/
/en.w
ikip
edia
.org
/wik
i/File
:US
_speed_lim
its.s
vg
http://en.wikipedia.org/wiki/Speed_limits_in_the_United_States
Threshold Decisions
Thresholds to Determine Decisions to Make
(lab & kit specific) Useful Validation Data
Analytical = ____ RFU Single overall value or color
specific
Noise levels in negative controls
or non-peak areas of positive
controls
Stochastic = ____ RFU
Minimum peak height RFU value
or alternative criteria such as
quantitation values or use of a
probabilitistic genotype approach
Level where dropout occurs in low
level single-source heterozygous
samples under conditions used
(e.g., different injection times,
post-PCR cleanup)
Stutter filter = ___% Profile, locus, or allele-specific
Stutter in single-source samples
(helpful if examined at multiple
DNA quantities)
Peak Height Ratio = ___% Profile, locus, or signal height
(quantity) specific
Heterozygote peak height ratios
in single-source samples (helpful
if examined at multiple DNA
quantities)
Major/Minor Ratio = ____
When will you attempt to separate
components of a mixture into
major and minor contributors for
profile deductions?
Defined mixture ratios (e.g., 1:1,
1:3, 1:9) with known samples to
observe consistency across loci
and to assess ability to deduce
correct contributor profiles
Comparison
to Known(s)
Validation
Studies &
Literature
Application
of
Thresholds
Steps in DNA Interpretation
September 2, 2013
10
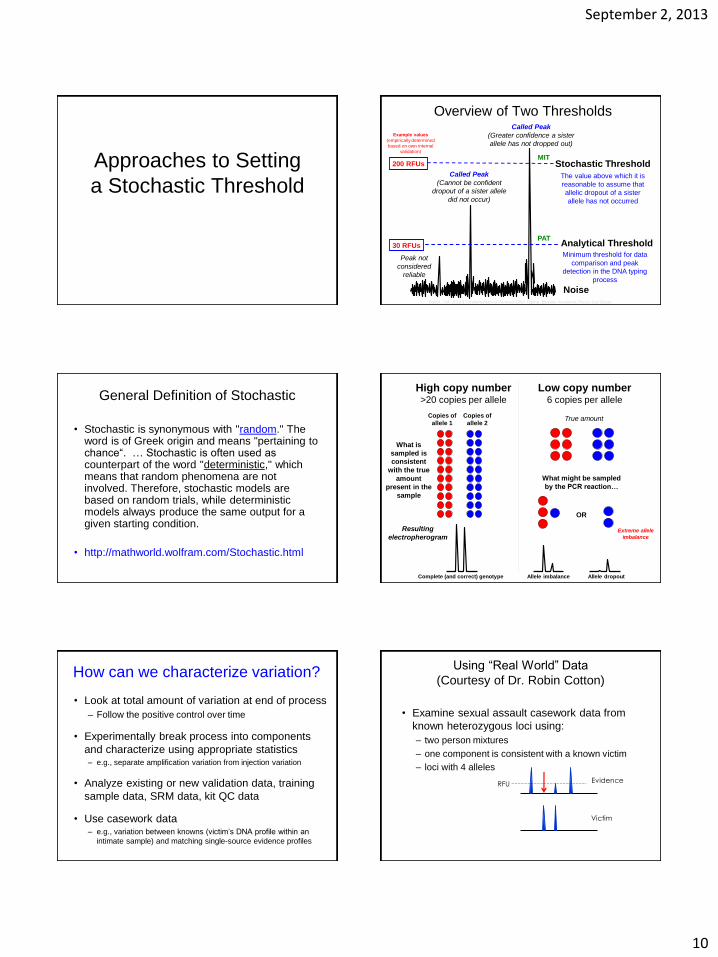
Approaches to Setting
a Stochastic Threshold
30 RFUs
200 RFUs
Analytical Threshold
Stochastic Threshold
Noise
Called Peak
(Cannot be confident
dropout of a sister allele
did not occur)
Called Peak
(Greater confidence a sister
allele has not dropped out)
Peak not
considered
reliable
Example values
(empirically determined
based on own internal
validation)
Minimum threshold for data
comparison and peak
detection in the DNA typing
process
The value above which it is
reasonable to assume that
allelic dropout of a sister
allele has not occurred
Overview of Two Thresholds
Butler, J.M. (2010) Fundamentals of Forensic DNA Typing. Elsevier Academic Press: San Diego.
PAT
MIT
General Definition of Stochastic
• Stochastic is synonymous with "random." The word is of Greek origin and means "pertaining to chance“. … Stochastic is often used as counterpart of the word "deterministic," which means that random phenomena are not involved. Therefore, stochastic models are based on random trials, while deterministic models always produce the same output for a given starting condition.
• http://mathworld.wolfram.com/Stochastic.html
True amount
What might be sampled
by the PCR reaction…
High copy number >20 copies per allele
Low copy number 6 copies per allele
Resulting
electropherogram
OR
Copies of
allele 1
Copies of
allele 2
Allele imbalance Allele dropout
Extreme allele
imbalance
Complete (and correct) genotype
What is
sampled is
consistent
with the true
amount
present in the
sample
How can we characterize variation?
• Look at total amount of variation at end of process
– Follow the positive control over time
• Experimentally break process into components
and characterize using appropriate statistics – e.g., separate amplification variation from injection variation
• Analyze existing or new validation data, training
sample data, SRM data, kit QC data
• Use casework data – e.g., variation between knowns (victim’s DNA profile within an
intimate sample) and matching single-source evidence profiles
Using “Real World” Data
(Courtesy of Dr. Robin Cotton)
• Examine sexual assault casework data from
known heterozygous loci using:
– two person mixtures
– one component is consistent with a known victim
– loci with 4 alleles
Evidence
Victim
RFU

September 2, 2013
11
Problem with Stochastic Effects
• Allele drop-out is an extension of the
amplification disparity that is observed when
heterozygous peaks heights are unequal
– Occurs in single-source samples and mixtures
– Analyst is unable to distinguish complete allele drop-
out in a true heterozygote from a homozygous state
Slight Moderate
Extreme No detectable
amplification
Allele
drop-out
What is Allele Drop Out?
• Scientifically
– Failure to detect an allele within a sample or failure
to amplify an allele during PCR. From SWGDAM
Guidelines, 2010
– Note that: Failure to detect ≠ failure to amplify
• Operationally
– Setting a threshold(s) or creating a process, based on
validation data and information in the literature, which
allows assessment of the likelihood of drop-out of an
allele or a locus.
Stochastic Effects
and Stochastic Threshold
SWGDAM 2010 Interpretation Guidelines glossary:
• Stochastic effects: the observation of intra-locus peak imbalance and/or allele drop-out resulting from random, disproportionate amplification of alleles in low-quantity template samples
• Stochastic threshold: the peak height value above which it is reasonable to assume that, at a given locus, allelic dropout of a sister allele has not occurred
http://www.fbi.gov/about-us/lab/codis/swgdam-interpretation-guidelines
Important Principle: With many casework
sample, we cannot avoid stochastic effects
and allele or locus drop-out.
Why ? We do not know the number of
contributors to a sample or the true
contributor ratio in a mixture!
Sample Mixture Ratio Impacts Amount of
DNA Available for PCR Amplification
Amount of DNA ~ # of cells from
major component
~ # of cells from
minor component
1 ng 107 36
0.5 ng 53 18
0.25 ng 27 9
0.125 ng 12 4
0.063 ng 7 2
Assume sample is a 3:1 mixture of two sources:
Stochastic effects expected with PCR amplification from <20 cells
Setting Stochastic Thresholds
(some examples)

September 2, 2013
12
Setting Stochastic Thresholds (NIST)
• Multiple samples, replicates, and
concentrations are ideal to get a feel for how
the system is working
– We used 3 fully heterozygous samples with 10
replicates at 2 ng, 1 ng, 800 pg, 500 pg, 400 pg,
300 pg, 200 pg, 100 pg, 30 pg, & 10 pg
Sample Selection
Description CSF1PO D3S1358 D5S818 D7S820 D8S1179 D13S317 D16S539 D18S51 D21S11 FGA TH01 TPOX vWA Penta D Penta E D2 D19
Genomic 8
10, 12 15, 18 12, 13 9, 10 12,14 9, 13 9, 11 15,18 30,31 24, 28 7, 8 8,12 15,17 8, 9 5,10 22,22 12.2,15
9947A 10, 12 14, 15 11, 11 10, 11 13,13 11, 11 11, 12 15,19 30,30 23, 24 8, 9.3 8,8 17,18 12,12 12,13 19,23 14,15
9947A – 5/13 loci are homozygous
Setting Stochastic Thresholds
• Multiple samples, replicates, and concentrations are ideal to get a feel for how the system is working
– We used 3 fully heterozygous samples with 10 replicates at 2 ng, 1 ng, 800 pg, 500 pg, 400 pg, 300 pg, 200 pg, 100 pg, 30 pg, & 10 pg
• Stochastic thresholds are not perfect or “cut and dry” – Can vary between loci and dye channels
Setting Stochastic Thresholds
PT84411
D
8
S
1
1
7
9
D
2
1
S
1
1
D
7
S
8
2
0
C
S
F
1
P
O
D
3
S
1
3
5
8
T
H
0
1
D
1
3
S
3
1
7
D
1
6
S
5
3
9
D
2
S
1
3
3
8
D
1
9
S
4
3
3
v
W
A
T
P
O
X
D
1
8
S
5
1
A
M
E
L
D
5
S
8
1
8
F
G
A
0.01 ng
0.03 ng
0.1 ng
Identifiler, 28 cycles
3130xl, 10 sec @ 3kV inj
Slide courtesy of Becky Hill (NIST)
Both alleles are present
One allele has dropped out
Locus drop out
Setting Stochastic Thresholds
Identifiler, 28 cycles
3130xl, 10 sec @ 3kV inj
Slide courtesy of Becky Hill (NIST)
57 274
114 119 242 142
149 122 185
152
0.03 ng 92 52 76 166 76 75 88 95
89 140 73 133
61 71 51 84 91 74
82
156
51 95 114
Highest peak height of “false homozygote” = 274 RFU
Allelic drop-out is prevalent at 30 – 50 pg DNA
Setting Stochastic Thresholds
• Stochastic threshold – point at
which data is considered reliable
• “Level of risk”: the higher you
go, the less risk you have of
calling a false homozygote - but
you start to lose more data for
statistics
Drop-out
200 RFU
*False homozygote if the stochastic threshold is above set at 200 RFU.
Slide courtesy of Becky Hill (NIST)
September 2, 2013
13
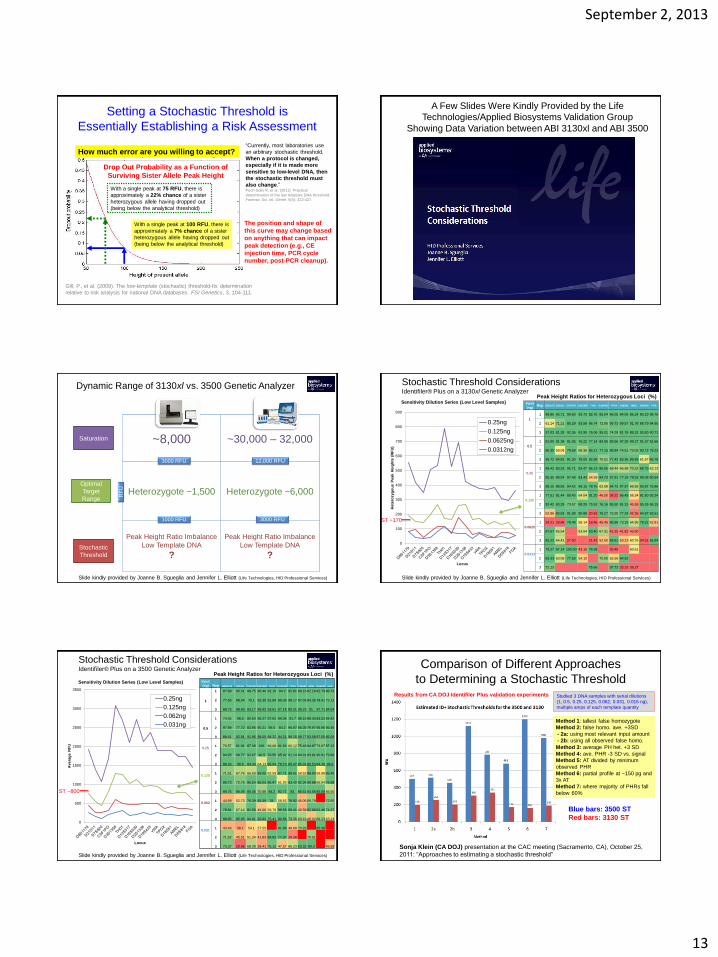
Drop Out Probability as a Function of
Surviving Sister Allele Peak Height
Setting a Stochastic Threshold is
Essentially Establishing a Risk Assessment
Gill, P., et al. (2009). The low-template (stochastic) threshold-Its determination
relative to risk analysis for national DNA databases. FSI Genetics, 3, 104-111.
With a single peak at 100 RFU, there is
approximately a 7% chance of a sister
heterozygous allele having dropped out
(being below the analytical threshold)
With a single peak at 75 RFU, there is
approximately a 22% chance of a sister
heterozygous allele having dropped out
(being below the analytical threshold)
The position and shape of
this curve may change based
on anything that can impact
peak detection (e.g., CE
injection time, PCR cycle
number, post-PCR cleanup).
“Currently, most laboratories use
an arbitrary stochastic threshold.
When a protocol is changed,
especially if it is made more
sensitive to low-level DNA, then
the stochastic threshold must
also change.” Puch-Solis R, et al. (2011). Practical
determination of the low template DNA threshold.
Forensic Sci. Int. Genet. 5(5): 422-427.
How much error are you willing to accept?
A Few Slides Were Kindly Provided by the Life
Technologies/Applied Biosystems Validation Group
Showing Data Variation between ABI 3130xl and ABI 3500
Saturation
Optimal
Target
Range
Stochastic
Threshold
~8,000 ~30,000 – 32,000
Heterozygote ~1,500 Heterozygote ~6,000
Peak Height Ratio Imbalance
Low Template DNA
?
Peak Height Ratio Imbalance
Low Template DNA
?
3000 RFU 12,000 RFU
1000 RFU 3000 RFU
Dynamic Range of 3130xl vs. 3500 Genetic Analyzer
RF
U
Slide kindly provided by Joanne B. Sgueglia and Jennifer L. Elliott (Life Technologies, HID Professional Services)
0
100
200
300
400
500
600
700
800
900
Hete
rozyg
ou
s P
eak H
eig
hts
(R
FU
)
Locus
Sensitivity Dilution Series (Low Level Samples)
0.25ng
0.125ng
0.0625ng
0.0312ng
Stochastic Threshold Considerations Identifiler® Plus on a 3130xl Genetic Analyzer
Input
(ng) Rep D8S1179 D21S11 CSF1PO D3S1358 TH01 D19S433 TPOX D18S51 AMEL D5S818 FGA
1
1 98.85 93.71 99.60 93.73 82.76 95.04 86.05 84.05 85.24 85.19 98.76
2 61.14 71.21 85.29 83.58 96.74 72.95 99.73 99.57 91.78 88.79 84.95
3 97.03 81.28 92.36 81.99 76.06 95.01 74.28 81.76 89.32 93.80 90.71
0.5
1 81.09 91.38 91.06 76.22 77.14 80.95 89.56 97.39 99.27 91.67 81.66
2 86.35 59.08 79.69 68.36 86.11 77.15 88.84 74.51 73.03 90.72 79.23
3 96.72 94.82 81.30 78.05 92.68 70.51 77.42 83.36 89.69 61.67 86.78
0.25
1 89.43 83.33 95.71 82.47 86.13 86.05 68.44 66.98 70.23 88.75 63.13
2 85.35 98.04 97.48 83.43 54.59 84.73 97.91 77.19 78.53 98.08 80.54
3 98.15 88.83 94.42 99.15 78.76 63.98 84.73 97.67 66.99 93.87 75.86
0.125
1 77.51 81.44 80.40 64.04 91.20 46.50 38.22 86.49 56.34 81.60 93.24
2 92.42 80.29 73.57 88.29 75.52 76.16 85.50 81.31 45.58 95.26 96.15
3 52.86 93.63 91.88 90.88 20.63 76.27 73.20 77.24 42.36 94.87 83.51
0.0625
1 34.21 29.88 78.48 58.14 18.46 45.45 86.96 73.33 64.96 79.22 52.81
2 87.67 65.54 63.64 93.40 67.31 41.25 41.82 43.90
3 85.22 64.41 27.00 21.43 52.50 88.61 53.23 60.76 34.51 86.84
0.0312
1 79.27 97.14 100.00 43.10 78.38 30.49 60.61
2 83.33 63.08 77.59 54.10 70.00 55.56 84.62
3 72.13 75.66 97.73 33.33 36.27
Peak Height Ratios for Heterozygous Loci (%)
ST ~170
Slide kindly provided by Joanne B. Sgueglia and Jennifer L. Elliott (Life Technologies, HID Professional Services)
0
500
1000
1500
2000
2500
3000
3500
Avera
ge R
FU
Locus
Sensitivity Dilution Series (Low Level Samples)
0.25ng
0.125ng
0.062ng
0.031ng
Stochastic Threshold Considerations Identifiler® Plus on a 3500 Genetic Analyzer
ST ~800
Input
(ng) Rep D8S1179 D21S11 CSF1PO D3S1358 TH01 D19S433 TPOX D18S51 AMEL D5S818 FGA
1
1 87.89 95.31 98.75 90.46 92.16 84.2 95.81 89.16 92.19 92.79 86.73
2 77.56 88.04 76.1 82.39 91.69 96.39 98.17 97.03 94.35 79.41 75.13
3 88.75 98.69 93.17 89.93 93.61 97.18 89.31 96.23 91. 97.71 84.64
0.5
1 74.55 98.5 80.54 96.27 97.62 99.34 91.7 88.19 98.43 83.52 84.42
2 97.99 77.72 83.95 90.21 96.5 84.2 96.97 86.39 79.97 96.96 95.46
3 88.41 92.91 91.95 98.05 84.22 94.21 98.15 99.77 93.08 97.05 85.06
0.25
1 70.57 81.91 87.39 100. 69.09 91.63 66.12 75.48 94.87 73.67 87.13
2 84.95 98.77 93.67 90.5 79.55 85.92 91.14 94.91 83.81 90.91 79.88
3 88.26 98.5 84.34 64.13 85.54 78.73 85.47 85.31 86.53 84.39 98.5
0.125
1 71.51 67.76 66.59 89.05 62.59 87.71 88.61 58.62 88.92 59.88 95.45
2 88.73 72.76 95.54 85.03 86.97 61.93 83.42 92.34 89.88 66.04 76.98
3 88.75 86.05 80.45 70.58 84.2 92.71 93. 86.51 84.56 85.08 66.56
0.062
1 44.99 52.73 76.39 83.39 78. 58.92 78.92 45.06 69.79 72.55
2 78.81 67.14 81.56 49.06 59.76 99.59 89.41 42.59 92.66 81.46 74.27
3 88.85 85.95 94.61 93.93 75.41 80.86 73.35 69.19 48.02 69.23 63.24
0.031
1 43.43 38.1 54.1 57.55 91.86 48.68 70.92 85.38
2 71.52 45.51 51.34 41.83 88.83 77.37 29.38 70.51
3 73.37 20.86 68.39 39.41 75.12 47.57 66.23 83.33 80.3 45.58
Slide kindly provided by Joanne B. Sgueglia and Jennifer L. Elliott (Life Technologies, HID Professional Services)
Peak Height Ratios for Heterozygous Loci (%)
Comparison of Different Approaches
to Determining a Stochastic Threshold
Sonja Klein (CA DOJ) presentation at the CAC meeting (Sacramento, CA), October 25,
2011: “Approaches to estimating a stochastic threshold”
Results from CA DOJ Identifiler Plus validation experiments
Method 1: tallest false homozygote
Method 2: false homo. ave. +3SD
- 2a: using most relevant input amount
- 2b: using all observed false homo.
Method 3: average PH het. +3 SD
Method 4: ave. PHR -3 SD vs. signal
Method 5: AT divided by minimum
observed PHR
Method 6: partial profile at ~150 pg and
3x AT
Method 7: where majority of PHRs fall
below 60%
Blue bars: 3500 ST
Red bars: 3130 ST
Studied 3 DNA samples with serial dilutions
(1, 0.5, 0.25, 0.125, 0.062, 0.031, 0.016 ng),
multiple amps of each template quantity
September 2, 2013
14
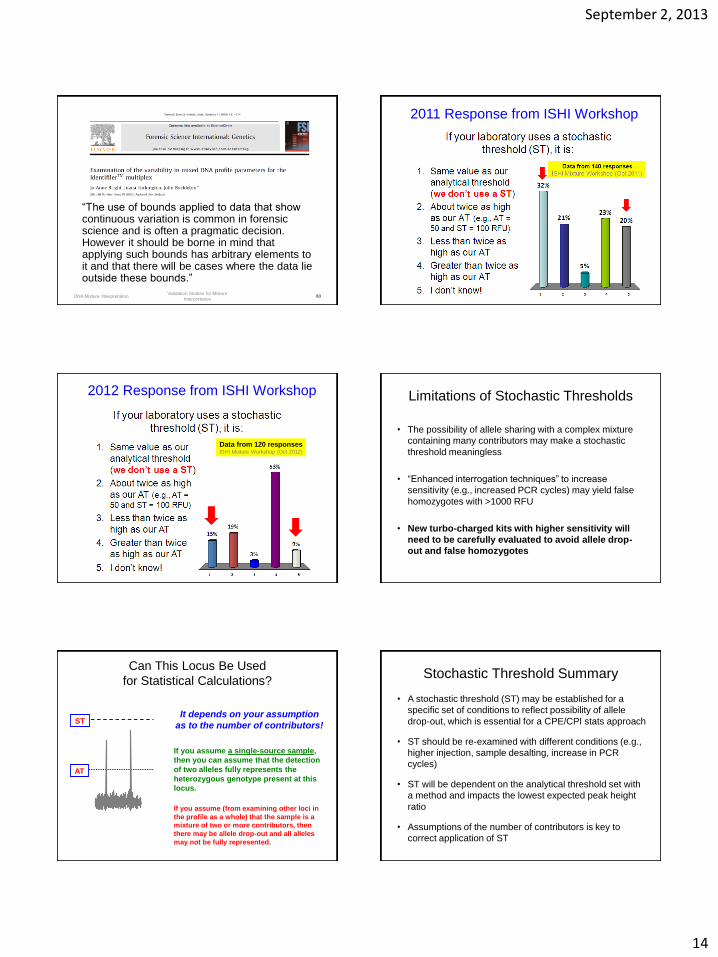
“The use of bounds applied to data that show continuous variation is common in forensic science and is often a pragmatic decision. However it should be borne in mind that applying such bounds has arbitrary elements to it and that there will be cases where the data lie outside these bounds.”
DNA Mixture Interpretation Validation Studies for Mixture
Interpretation 80
2011 Response from ISHI Workshop
2012 Response from ISHI Workshop
Data from 120 responses ISHI Mixture Workshop (Oct 2012)
Limitations of Stochastic Thresholds
• The possibility of allele sharing with a complex mixture
containing many contributors may make a stochastic
threshold meaningless
• “Enhanced interrogation techniques” to increase
sensitivity (e.g., increased PCR cycles) may yield false
homozygotes with >1000 RFU
• New turbo-charged kits with higher sensitivity will
need to be carefully evaluated to avoid allele drop-
out and false homozygotes
Can This Locus Be Used
for Statistical Calculations?
AT
ST It depends on your assumption
as to the number of contributors!
If you assume a single-source sample,
then you can assume that the detection
of two alleles fully represents the
heterozygous genotype present at this
locus.
If you assume (from examining other loci in
the profile as a whole) that the sample is a
mixture of two or more contributors, then
there may be allele drop-out and all alleles
may not be fully represented.
Stochastic Threshold Summary
• A stochastic threshold (ST) may be established for a
specific set of conditions to reflect possibility of allele
drop-out, which is essential for a CPE/CPI stats approach
• ST should be re-examined with different conditions (e.g.,
higher injection, sample desalting, increase in PCR
cycles)
• ST will be dependent on the analytical threshold set with
a method and impacts the lowest expected peak height
ratio
• Assumptions of the number of contributors is key to
correct application of ST

September 2, 2013
15
Stutter Thresholds
Review of the Literature
Many labs just use a flat 15%
Allele-Specific Stutter %
Identifiler User Manual
Developing Stutter Filter Values
• Samples – Ideally at least 5 observations of
each stutter product per locus from relevant
populations (e.g. longer repeats in FGA alleles
are observed mostly among African Americans).
• Use typical DNA input quantities (0.5 – 2.0ng),
but may want to assess stutter at lower levels
(e.g. <150pg). Excessive DNA (5-10ng) can
skew your average percentages.
Repeat Length
% S
tutt
er Tetra
Penta
Tetra w/ LTDNA
3 SD
2 SD
Stutter Trends D3S1358 – TCTA[TCTG]N[TCTA]N

September 2, 2013
16
18 17
16
15
14
% S
tutte
r
Allele Size, bp
TH01 - [AATG]N
% S
tutte
r
Allele Size, bp
[AATG]6ATG[AATG]3
[AATG]6
[AATG]7
[AATG]8
[AATG]9
9.3
“LUS”
Longest
Uninterrupted
Stretch
A good predictor
for stutter ratio
Brookes C, Bright J-A, Harbison S, Buckleton J. Characterising stutter in forensic
STR multiplexes. Forensic Science International: Genetics. 2012;6(1):58-63.
Interpretation of Potential Stutter Peaks in a
Mixed Sample
• For mixtures in which minor contributors are
determined to be present, a peak in stutter
position (generally n-4) may be determined to be
1) a stutter peak, 2) an allelic peak, or 3)
indistinguishable as being either an allelic or
stutter peak.
ISFG Recommendation #6 Example
Likely a AA
Possibly AB
(homozygote)
(heterozygote)
Could also be AC, AD, AA, or A,? (dropout)
Stutter effects
• In case of doubt a suspicious peak in the
position of a stutter band has to be
considered as a true allele and part of the DNA
profile, and should be included into the
biostatistical interpretation.
Slide from Peter Schneider
(presented at EDNAP meeting in Krakow in April 2007)
September 2, 2013
17
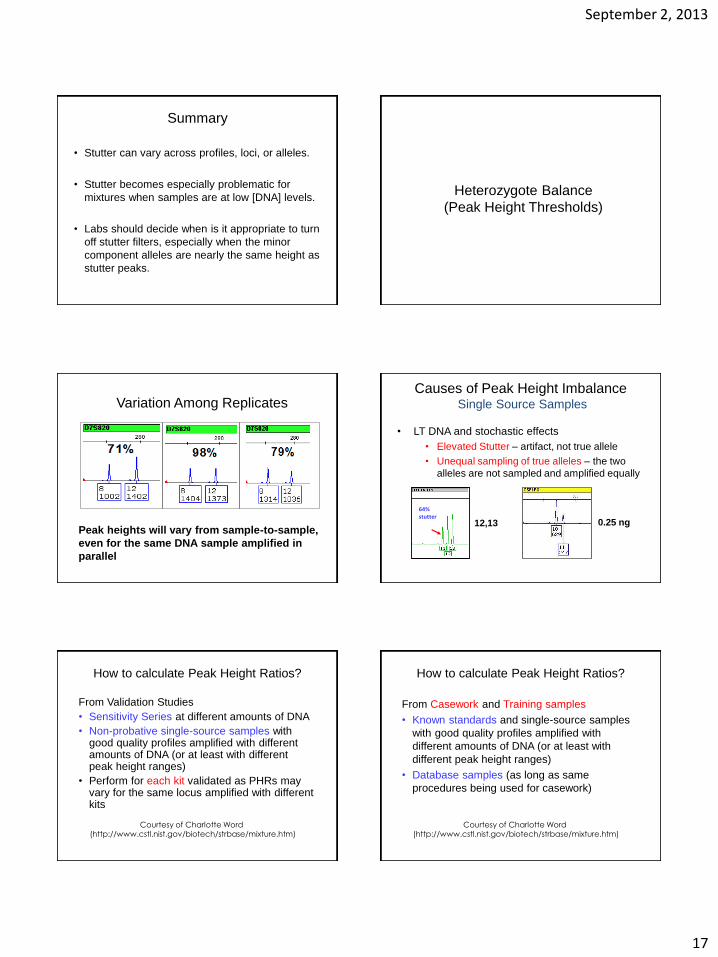
Summary
• Stutter can vary across profiles, loci, or alleles.
• Stutter becomes especially problematic for
mixtures when samples are at low [DNA] levels.
• Labs should decide when is it appropriate to turn
off stutter filters, especially when the minor
component alleles are nearly the same height as
stutter peaks.
Heterozygote Balance
(Peak Height Thresholds)
Variation Among Replicates
Peak heights will vary from sample-to-sample,
even for the same DNA sample amplified in
parallel
Causes of Peak Height Imbalance Single Source Samples
• LT DNA and stochastic effects
• Elevated Stutter – artifact, not true allele
• Unequal sampling of true alleles – the two
alleles are not sampled and amplified equally
0.25 ng
64% stutter
12,13
How to calculate Peak Height Ratios?
From Validation Studies
• Sensitivity Series at different amounts of DNA
• Non-probative single-source samples with good quality profiles amplified with different amounts of DNA (or at least with different peak height ranges)
• Perform for each kit validated as PHRs may vary for the same locus amplified with different kits
Courtesy of Charlotte Word
(http://www.cstl.nist.gov/biotech/strbase/mixture.htm)
How to calculate Peak Height Ratios?
From Casework and Training samples
• Known standards and single-source samples
with good quality profiles amplified with
different amounts of DNA (or at least with
different peak height ranges)
• Database samples (as long as same
procedures being used for casework)
Courtesy of Charlotte Word (http://www.cstl.nist.gov/biotech/strbase/mixture.htm)

September 2, 2013
18
How to calculate Peak Height Ratios?
• Use a sufficient number and variety of samples
to get representative data from each locus,
especially for loci with a wide range of alleles
and HMW markers (e.g., FGA, D18).
Courtesy of Charlotte Word (http://www.cstl.nist.gov/biotech/strbase/mixture.htm)
Two Approaches to Determine Hb
h =
(most common)
1036
1314 = 79%
ɸ = peak height
Kelly H, Bright J-A, Curran J, Buckleton J. Modelling heterozygote balance in
forensic DNA profiles. Forensic Science International: Genetics. 2012; 6: 729-734.
Two Approaches to Determine Hb
h = HMW = High MW
LMW = Low MW
1314
1036 = 1.268
Kelly H, Bright J-A, Curran J, Buckleton J. Modelling heterozygote balance in
forensic DNA profiles. Forensic Science International: Genetics. 2012; 6: 729-734.
Advantages of the HMW/LMW method
• Preserves information
900 1000
h =
900 1000
= 0.90 = 0.90
h =
= 0.90 = 1.11
900 1000 900 1000
Provides “positional” information
Hb Data
Kelly H, Bright J-A, Curran J, Buckleton J. Modelling heterozygote balance in
forensic DNA profiles. Forensic Science International: Genetics. 2012; 6: 729-734.
On average, the HMW allele
is smaller than the LMW allele
Validation Studies - Revisited
• Some have critiqued that validation studies
based on single-source pristine DNA samples
are being used to develop SOPs for casework
mixtures.
• This issue was addressed by Bright et al. (2012).

September 2, 2013
19
Focus on Hb and mixture ratio
Pristine
0.6
1.66 ss Casework
Mixed Pristine Mixed Casework
Summary
• Validation studies are necessary to establish
thresholds for mixture interpretation.
• In addition to testing only single source samples,
mixtures should also be a part of the validation
study.
• Bright et al. (2012) did not observe a difference
between the use of pristine and casework
samples for Hb and mixture ratio parameters.
Acknowledgements
• Becky Hill, Erica Butts, Peter Vallone, Dave
Duewer and John Butler (NIST)
• Catherine Grgicak and Robin Cotton (Boston U.)
• Charlotte Word (Charlotte Word Consulting)
•Joanne Sgueglia and Jennifer Elliott (Life Tech)