Validation and application of an LC-MS/MS method for … · ORIGINAL PAPER Validation and...
12
ORIGINAL PAPER Validation and application of an LC-MS/MS method for the simultaneous quantification of 13 pharmaceuticals in seawater Klaas Wille & Herlinde Noppe & Karolien Verheyden & Julie Vanden Bussche & Eric De Wulf & Peter Van Caeter & Colin R. Janssen & Hubert F. De Brabander & Lynn Vanhaecke Received: 8 January 2010 / Revised: 24 March 2010 / Accepted: 29 March 2010 # Springer-Verlag 2010 Abstract Knowledge of the presence of micropollutants such as pharmaceuticals, in coastal areas, is very limited; therefore, the main objective of this study was to optimize and validate a new analytical method for the quantitative analysis of 13 multiclass pharmaceuticals in seawater. Target compounds included antibiotics, non-steroidal anti- inflammatory drugs, β-blockers, lipid regulators and one psychiatric drug. A combination of solid-phase extraction and liquid chromatography coupled with multiple mass spectrometry enabled their detection at the low nanogram per litre level. The limits of quantification varied between 1 and 50 ng L -1 , for most components the linearities were more than 0.99 and the recoveries obtained in seawater (95–108%) were satisfactory. This method was applied to seawater and estuarine water samples collected in the Belgian coastal zone, to assess the prevalence of common pharmaceuticals in this marine environment. Seven phar- maceuticals, including compounds of which the presence in marine environments had not been reported earlier, were detected, with salicylic acid and carbamazepine being the most abundant, in concentrations up to 855 ng L -1 . Keywords Pharmaceuticals . Liquid chromatography–tandem mass spectrometry . Validation . Marine environment . Persistence Introduction Pharmaceuticals are the active ingredients of medicinal products used in human and veterinary medicine and include approximately 3,000 different compounds with a large variation in chemical structure, function and behav- iour [1, 2]. In Belgium, the consumption of reimbursed pharmaceuticals available at the pharmacy level ranges between 0.001 and 6 tons per year depending on the individual pharmaceutical (Table 1)[3] (H. Beyers, person- al communication). Pharmaceuticals for human use are excreted—either in their native form or as metabolites— and discharged into the sewer system [4, 5]. Via sewage, pharmaceuticals reach the wastewater treatment plant (WWTP), where most pharmaceuticals are, according to current literature, not completely removed [6, 7]. As a result of WWTP effluents, land application of sewage sludge, improper disposal and manufacturing processes, pharma- ceuticals are introduced into natural aquatic systems [8, 9]. These different pathways may result in a continuous release of pharmaceuticals into the aquatic environment. Conse- quently, there is growing public and scientific concern regarding the occurrence and potential effects of pharma- ceuticals in the aquatic environment. K. Wille : H. Noppe : K. Verheyden : J. Vanden Bussche : H. F. De Brabander : L. Vanhaecke (*) Faculty of Veterinary Medicine, Research group of Veterinary public Health and Zoonoses, Laboratory of Chemical Analysis, Ghent University, Salisburylaan 133, 9820 Merelbeke, Belgium e-mail: [email protected] E. De Wulf : P. Van Caeter Laboratory for Analysis of Organic Micropollutants, Flemish Environment Agency (FEA), Krijgslaan 281-S2, 9000 Ghent, Belgium C. R. Janssen Faculty of Bioscience Engineering, Laboratory of Environmental Toxicology and Aquatic Ecology, Ghent University, J. Plateaustraat 22, 9000 Ghent, Belgium Anal Bioanal Chem DOI 10.1007/s00216-010-3702-z
Transcript of Validation and application of an LC-MS/MS method for … · ORIGINAL PAPER Validation and...
ORIGINAL PAPER
Validation and application of an LC-MS/MS methodfor the simultaneous quantification of 13 pharmaceuticalsin seawater
Klaas Wille & Herlinde Noppe & Karolien Verheyden &
Julie Vanden Bussche & Eric De Wulf & Peter Van Caeter &
Colin R. Janssen & Hubert F. De Brabander & Lynn Vanhaecke
Received: 8 January 2010 /Revised: 24 March 2010 /Accepted: 29 March 2010# Springer-Verlag 2010
Abstract Knowledge of the presence of micropollutantssuch as pharmaceuticals, in coastal areas, is very limited;therefore, the main objective of this study was to optimizeand validate a new analytical method for the quantitativeanalysis of 13 multiclass pharmaceuticals in seawater.Target compounds included antibiotics, non-steroidal anti-inflammatory drugs, β-blockers, lipid regulators and onepsychiatric drug. A combination of solid-phase extractionand liquid chromatography coupled with multiple massspectrometry enabled their detection at the low nanogramper litre level. The limits of quantification varied between 1and 50 ng L-1, for most components the linearities weremore than 0.99 and the recoveries obtained in seawater(95–108%) were satisfactory. This method was applied toseawater and estuarine water samples collected in theBelgian coastal zone, to assess the prevalence of commonpharmaceuticals in this marine environment. Seven phar-
maceuticals, including compounds of which the presence inmarine environments had not been reported earlier, weredetected, with salicylic acid and carbamazepine being themost abundant, in concentrations up to 855 ng L-1.
Keywords Pharmaceuticals . Liquid chromatography–tandemmass spectrometry . Validation .Marine environment .
Persistence
Introduction
Pharmaceuticals are the active ingredients of medicinalproducts used in human and veterinary medicine andinclude approximately 3,000 different compounds with alarge variation in chemical structure, function and behav-iour [1, 2]. In Belgium, the consumption of reimbursedpharmaceuticals available at the pharmacy level rangesbetween 0.001 and 6 tons per year depending on theindividual pharmaceutical (Table 1) [3] (H. Beyers, person-al communication). Pharmaceuticals for human use areexcreted—either in their native form or as metabolites—and discharged into the sewer system [4, 5]. Via sewage,pharmaceuticals reach the wastewater treatment plant(WWTP), where most pharmaceuticals are, according tocurrent literature, not completely removed [6, 7]. As a resultof WWTP effluents, land application of sewage sludge,improper disposal and manufacturing processes, pharma-ceuticals are introduced into natural aquatic systems [8, 9].These different pathways may result in a continuous releaseof pharmaceuticals into the aquatic environment. Conse-quently, there is growing public and scientific concernregarding the occurrence and potential effects of pharma-ceuticals in the aquatic environment.
K. Wille :H. Noppe :K. Verheyden : J. Vanden Bussche :H. F. De Brabander : L. Vanhaecke (*)Faculty of Veterinary Medicine, Research group of Veterinarypublic Health and Zoonoses, Laboratory of Chemical Analysis,Ghent University,Salisburylaan 133,9820 Merelbeke, Belgiume-mail: [email protected]
E. De Wulf : P. Van CaeterLaboratory for Analysis of Organic Micropollutants,Flemish Environment Agency (FEA),Krijgslaan 281-S2,9000 Ghent, Belgium
C. R. JanssenFaculty of Bioscience Engineering, Laboratory of EnvironmentalToxicology and Aquatic Ecology, Ghent University,J. Plateaustraat 22,9000 Ghent, Belgium
Anal Bioanal ChemDOI 10.1007/s00216-010-3702-z
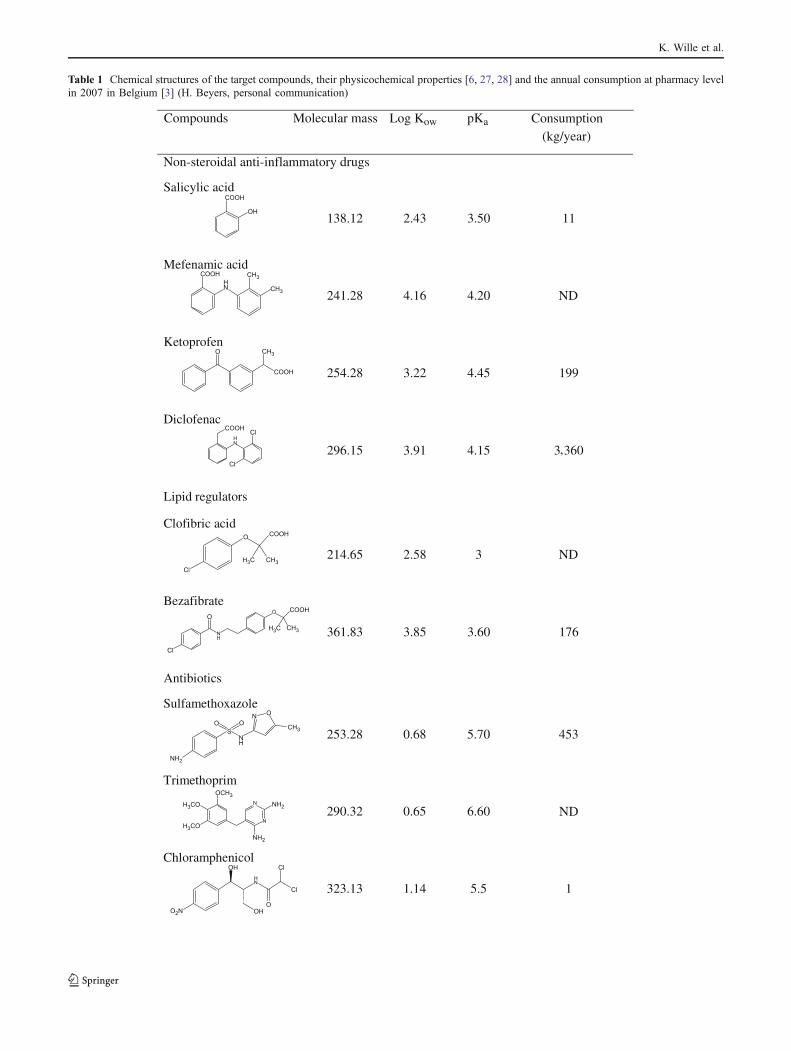
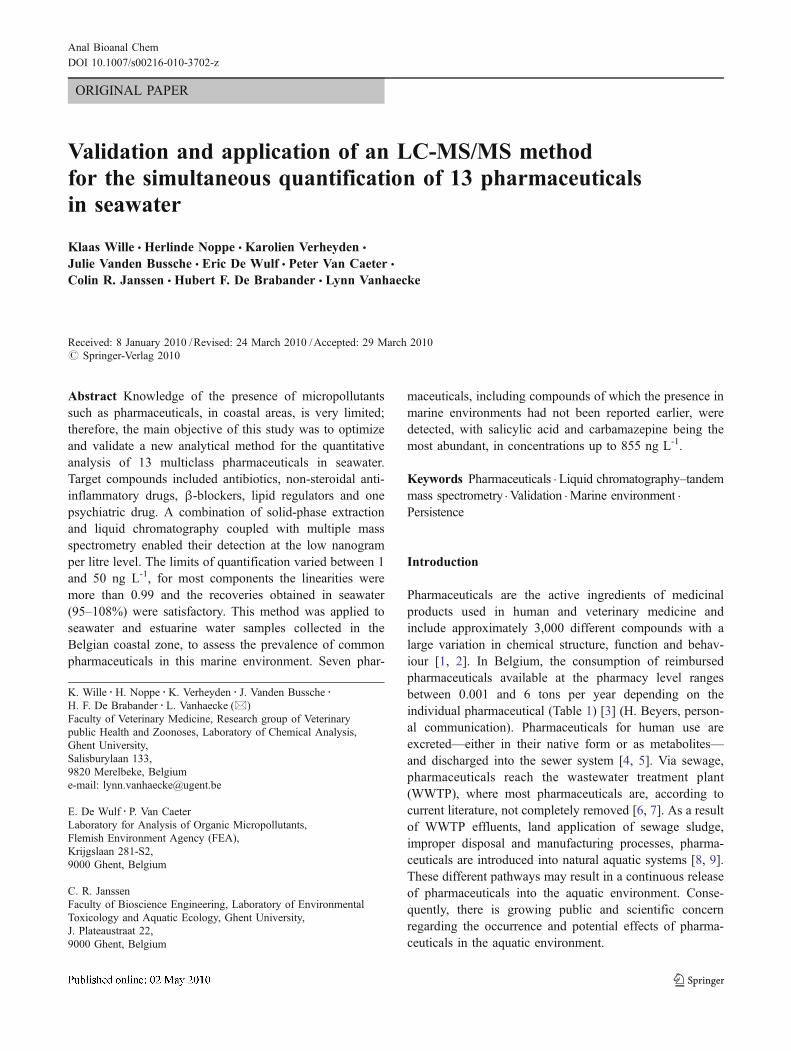
Table 1 Chemical structures of the target compounds, their physicochemical properties [6, 27, 28] and the annual consumption at pharmacy levelin 2007 in Belgium [3] (H. Beyers, personal communication)
Compounds Molecular mass Log Kow pKa Consumption(kg/year)
Non-steroidal anti-inflammatory drugs
ND
ND
ND
K. Wille et al.
As pharmaceuticals are designed to exert specific effectsat low doses and to resist metabolic degradation, theirpossible biological activity in aquatic organisms and theirpersistence cannot be excluded [4, 5]. Moreover, thecontinuous environmental input of these compounds, andresulting mixtures, may induce unnoticed adverse effects onaquatic and terrestrial organisms [10, 11]. Although severalstudies have reported standard ecotoxicity data for pharma-ceuticals [8, 12, 13], in general their environmentalsignificance, pertaining to environmental effects, is largelyunknown [14]. However, a preliminary risk assessmentdatabase for common pharmaceuticals with a focus onmarine and estuarine environments is nowadays available toprovide information on pharmaceutical threats to theenvironment [6].
Regulatory guidance to assess the presence of pharma-ceuticals in the aquatic environment is still lacking. TheWater Framework Directive (2000/60/EC) [15] and itsdaughter directive (2008/105/EC) [16] lay down environ-mental quality standards for a list of priority substances, butpharmaceuticals are not included. Furthermore, the OSPARlists of chemicals of priority action and of substances ofpossible concern include, respectively, two and 19 pharma-ceuticals [17]. However, these listed pharmaceuticals areused in fairly small quantities and their occurrence in theenvironment is limited [9]. Currently, no guidance isestablished for widely used and widespread occurringpharmaceuticals such as carbamazepine and diclofenac.
Nevertheless, in recent years, numerous monitoringstudies have demonstrated the occurrence of pharmaceut-icals in aquatic systems. They have been detected inWWTP influents and effluents and in freshwater systemsin the nanogram per litre up to the microgram per litrerange [18–21]. More rarely, pharmaceuticals have beendetected in drinking water [22, 23] and groundwatersamples [21, 24], mostly in the nanogram per litre rangeand occasionally at microgram per litre levels. In contrast tothe extensive literature describing the occurrence andpersistence of pharmaceuticals in freshwater systems, littleattention has been paid to their prevalence and quantifica-tion in marine ecosystems [25, 26].
Therefore, the main objective of this study was todevelop a quantitative analytical method for pharmaceut-icals in seawater. On the basis of data on the current use inBelgium (Table 1), 13 environmentally relevant pharma-ceuticals were selected from five different therapeuticclasses. These included four antibiotics (sulfamethoxazole,ofloxacin, trimethoprim and chloramphenicol), four non-steroidal anti-inflammatory drugs (NSAIDs) (mefenamicacid, diclofenac, salicylic acid, and ketoprofen), two β-blockers (propranolol and atenolol), two lipid regulators(bezafibrate and clofibric acid) and one psychiatric drug(carbamazepine). The chemical structures of the pharma-ceuticals considered in this study and their physicochemicalproperties are presented in Table 1 [6, 27, 28]. Secondly, anextensive validation study was carried out to demonstrate
ND
Blockers
Table 1 (continued)
ND no data
Validation and application of an LC-MS/MS method for the simultaneous quantification of 13 pharmaceuticals in seawater
the applicability of this analytical approach. To this end, themethod developed was applied to marine water samplestaken from the North Sea and the Scheldt estuary. In thisway, the presence of pharmaceuticals in the Belgian marineenvironment and their transfer to estuarine and marineecosystems was examined. This study is part of the INRAMproject (http://www.vliz.be/projects/inram), a 4-year projectthat aims to use an integrated approach to assess the risks ofmicropollutants in the Belgian coastal zone.
Experimental
Study area and sampling
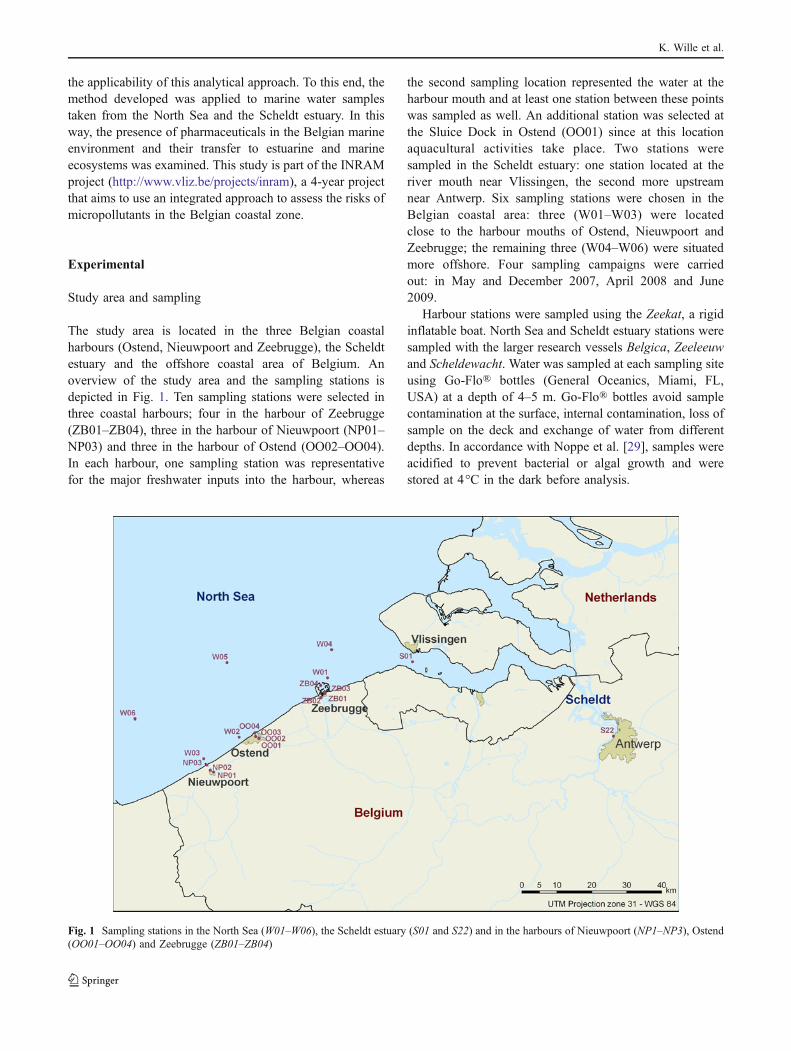
The study area is located in the three Belgian coastalharbours (Ostend, Nieuwpoort and Zeebrugge), the Scheldtestuary and the offshore coastal area of Belgium. Anoverview of the study area and the sampling stations isdepicted in Fig. 1. Ten sampling stations were selected inthree coastal harbours; four in the harbour of Zeebrugge(ZB01–ZB04), three in the harbour of Nieuwpoort (NP01–NP03) and three in the harbour of Ostend (OO02–OO04).In each harbour, one sampling station was representativefor the major freshwater inputs into the harbour, whereas
the second sampling location represented the water at theharbour mouth and at least one station between these pointswas sampled as well. An additional station was selected atthe Sluice Dock in Ostend (OO01) since at this locationaquacultural activities take place. Two stations weresampled in the Scheldt estuary: one station located at theriver mouth near Vlissingen, the second more upstreamnear Antwerp. Six sampling stations were chosen in theBelgian coastal area: three (W01–W03) were locatedclose to the harbour mouths of Ostend, Nieuwpoort andZeebrugge; the remaining three (W04–W06) were situatedmore offshore. Four sampling campaigns were carriedout: in May and December 2007, April 2008 and June2009.
Harbour stations were sampled using the Zeekat, a rigidinflatable boat. North Sea and Scheldt estuary stations weresampled with the larger research vessels Belgica, Zeeleeuwand Scheldewacht. Water was sampled at each sampling siteusing Go-Flo® bottles (General Oceanics, Miami, FL,USA) at a depth of 4–5 m. Go-Flo® bottles avoid samplecontamination at the surface, internal contamination, loss ofsample on the deck and exchange of water from differentdepths. In accordance with Noppe et al. [29], samples wereacidified to prevent bacterial or algal growth and werestored at 4°C in the dark before analysis.
Fig. 1 Sampling stations in the North Sea (W01–W06), the Scheldt estuary (S01 and S22) and in the harbours of Nieuwpoort (NP1–NP3), Ostend(OO01–OO04) and Zeebrugge (ZB01–ZB04)
K. Wille et al.
Reagents and chemicals
Ketoprofen (purity 99.0%), mefenamic acid (purity betterthan 99.0%), carbamazepine (purity better than 99.0%),diclofenac (purity better than 99.0%), bezafibrate (purity98.0% or better), salicylic acid (purity better than 99.0%),clofibric acid (purity 97.0%), atenolol (purity 98.0% orbetter), trimethoprim (purity 98.0% or better), chloram-phenicol (purity 99.0% or better), and sulfamethoxazole(purity 99.0%) were purchased from Sigma-Aldrich (St.Louis, MO, USA). Ofloxacin (purity better than 99.0%)was obtained from ICN Biomedicals (Aurora, OH, USA)and propranolol (purity better than 99.0%) was purchasedfrom Eurogenerics (Brussels, Belgium). The syntheticisobutcar 61 [4-3(isobutylamino-2-hydroxypropoxy)-carbazole] was found to be a very suitable internal standardfor this application as it corrected sufficiently for anymatrix effects in the sample preparation and mass spec-trometry (MS).
Acetone, methanol and formic acid were of analyticalgrade and were purchased from VWR (Merck, Darmstadt,Germany). High performance liquid chromatography (HPLC)-grade acetonitrile and water were obtained fromVWR (Merck,Darmstadt, Germany) and Acros Organics (Fairlawn, NJ,USA), respectively. Primary stock solutions of all individualanalytes were prepared in ethanol at a concentration of1 ng μL-1. Working standard mixture solutions were preparedby appropriate dilution of the stock solutions in ethanol. Allsolutions were stored at -20°C in the dark.
Extraction and clean-up
The extraction technique developed is based on the methodof Gómez et al. [30] and Nebot et al. [31]. Prior toextraction, the pH of the water samples was adjusted to 7±0.5 using solutions of HCl (1 M) and NaOH (1 M).Seawater samples of 1 L were filtered through a Whatmanfilter paper (GF/C diameter 47 mm, particle retention1.2 μm, Merck, Darmstadt, Germany) to avoid cloggingof the sorbent. The filters were washed with 2 mL methanolto prevent loss of the compounds of interest. The methanolextract was collected and added to the filtered sample. Priorto extraction, the internal standard isobutcar 61 was addedto every sample at a final concentration of 50 ng L-1.Subsequently, solid-phase extraction (SPE) was carried outusing Chromabond HR-X cartridges (3 mL, 200 mg,Macherey-Nagel, Düren, Germany). The cartridges werepreconditioned with 5 mL methanol and 5 mL Milli-Qwater. After they had been loaded with 1 L of the filteredsample pooled with the methanol from the filter washing,the cartridges were rinsed twice with 5 mL Milli-Q water.Subsequently, the cartridges were dried under a vacuum for30 min. Elution was performed using 5 mL acetone and 2×
5 mL methanol. Next, the extracts were dried usingnitrogen and the residues were reconstituted in 300 μLacetonitrile/0.02 M formic acid (50/50) before transfer toiquid chromatography (LC)–MS vials.
Chromatographic instrumentation
Analysis was carried out using HPLC. The apparatuscomprised an 1100 series quaternary gradient pump andautosampler (Hewlett Packard, Palo Alto, CA, USA). Chro-matographic separation was achieved using a Nucleodur® C18
Isis HPLC column (5-μm particle size, 250 mm×4.0 mm,Macherey-Nagel, Düren, Germany). The void volume of thesystem was 2.5 mL. A filter (porosity 2 μm, 4 mm; Alltech,Waukegan, IL, USA) and a precolumn (Nucleodur® C18 Isis,Macherey-Nagel, Düren, Germany) were used to preventrapid deterioration of the analytical column. The mobilephase consisted of a mixture of 0.02 M formic acid (solventA) in water and acetonitrile (solvent B). A linear gradient of0.3 mL min-1 was used starting with a mixture of 60%solvent A and 40% solvent B for 5 min. The acetonitrilepercentage was increased linearly from 40 to 100% in20 min. Twenty microlitres was injected onto the LC-MSn
system. Analytes were detected with an LCQ DECA ion trapmass spectrometer equipped with an electrospray ionization(ESI) interface (Thermo Finnigan, San Jose, CA, USA)using the optimized MS parameters described in “Resultsand discussion”. The optimal ionization source workingparameters were as follows: sheath gas flow rate, 80 arbitraryunits (a.u.); auxiliary gas, 20 a.u.; capillary temperature 350°C; capillary voltage, -14 V; and tube lens offset, 20 V.Chromatograms and spectra were recorded and processedusing Xcalibur® 2.0 (Thermo Finnigan, San Jose, CA, USA).
Validation of the method
For environmental sample analysis, rigorous validationprocedures are usually not well defined. Similar to reportedstudies on pharmaceuticals in water [11, 20, 32], wevalidated the method developed according to CommissionDecision 2002/657/EC [33] concerning the determinationof analytes in products of animal origin. Also SANCO/825/00 revision 7 [34] was used as a guideline for the validationof this new analytical method. In general, validationincludes the evaluation of linearity, specificity, selectivity,recovery, matrix effects and the determination of the limitof quantification (LOQ). Because the method was particu-larly aimed at examining marine waters, seawater was usedto validate the method. On the basis of preliminary results,blank seawater samples contained low levels of some of thetarget analytes. The calibration curves were corrected forthese concentrations. In addition, none of the pharmaceut-icals were detected in reagents or Milli-Q water.
Validation and application of an LC-MS/MS method for the simultaneous quantification of 13 pharmaceuticals in seawater
Quality assurance
Before and after analysis of a series of samples, a standardmixture (1 ng on column) of the target pharmaceuticals wasinjected to check the instrument parameters of the LC-ESI-MSn system. Quality control of the method was performedby analysis of a blank sample, together with a linearcalibration curve constructed using 1 L seawater samplesspiked with standard solutions at seven concentrationsbetween 1 and 1,000 ng L-1. This was performed for everyseries of samples. These calibration curves were used forquantification.
Results and discussion
Method development
Extraction of the target pharmaceuticals
Irrespective of the log Kow and pKa values of the substancesstudied (Table 1), an extraction procedure aiming at therecovery of all target analytes in an efficient and repeatablemanner was developed. To obtain a concentrated extractsuitable for analysis, extraction of pharmaceuticals in wateris generally executed using SPE [20, 27, 31, 35]. SPEincludes the extraction of the analytes by means of a solidsorbent and is usually performed off-line. Preliminaryexperiments were performed to evaluate the extractionefficacy of different types of SPE sorbents: OASIS HLB(3 mL, 60 mg, Waters, Milford, MA, USA), Strata-x (33 μmpolymeric reversed phase, 6 mL, 200 mg, Phenomenex,USA), Bakerbond Speedisk extraction disk (H2O-phobicand H2O-philic, J.T. Baker, Deventer, The Netherlands)and Chromabond HR-X (3 mL, 200 mg, Macherey-Nagel, Düren, Germany) cartridges. Of all the cartridges,Chromabond® HR-X exhibited the best performance insimultaneously retaining all the analytes at a pH of 7.Indeed, Zhang and Zhou [36] demonstrated similar extrac-tion recoveries at pH 4.2 and at pH 10.3; therefore, a pH of7.0 was selected for the water samples to obtain an analyticalcompromise for the best retention for all analytes. The SPEprocedure using Chromabond HR-X cartridges was thereforeoptimized. In the final extraction protocol, prior to elution,the SPE cartridges were rinsed twice with 5 mL of Milli-Qwater. In marine analytical chemistry an additional advantageof the washing step is the removal of remaining sea salt fromthe cartridge. Higher recovery rates were achieved byincluding this washing step (data not shown). Optimalelution of the pharmaceuticals was achieved using acetonefollowed by methanol. The most optimal elution solvent wasselected on the basis of analytical characteristics such aspeak area, resolution and signal-to-noise ratio.
Detection
Owing to the limited volatility of the pharmaceuticals, LCwas the preferred chromatographic technique used in thisstudy to achieve separation of the target analytes. Goodchromatographic separation of the compounds underinvestigation was achieved using a C18 Isis reversed-phaseLC column as the stationary phase. The retention mecha-nism of this column is based on steric and hydrophobicinteractions and resulted in the optimized separation of allanalytes. A mixture of acetonitrile and 0.1% formic acid inwater proved superior as opposed to other solvent modifierssuch as ammonium acetate.
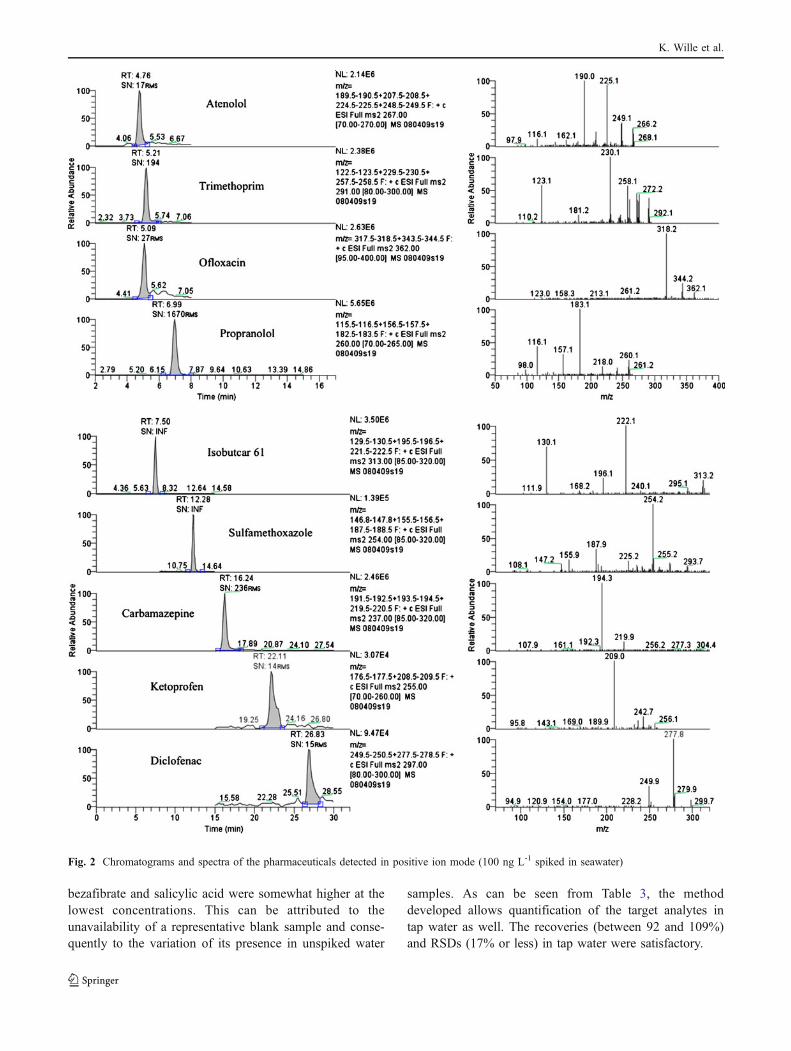
Mass spectra were obtained using direct infusion of eachstandard in the mobile phase. The following operationalparameters of the MS detector were optimized: MS ionmode, collision energy (eV), isolation width (m/z) andactivation Q. ESI was used as the ionization source in bothnegative and positive ion mode by injecting the final extracttwice. Detection of the negative precursor ion [M-H]- wasperformed for chloramphenicol, salicylic acid, bezafibrate,clofibric acid and mefenamic acid, whereas detection of thepositive precursor ion [M + H]+ was performed for the othercompounds of interest. Precursor and product ions andcollision energies are presented in Table 2. The isolationwidth was set at 2.0m/z, except for chloramphenicol,clofibric acid and diclofenac (3.0m/z). For the activation Q,the default value of 0.25 was used, except for salicylic acid(0.35). MSn was performed for all precursor ions andallowed reliable confirmation of the target analytes. Figures 2and 3 show the chromatograms and spectra obtained for thepharmaceuticals detected in positive and negative ionizationmode, respectively (100 ng L-1 spiked in seawater).
Validation study
Identification/selectivity
Identification and confirmation of the compounds wasperformed according to the procedure prescribed byCommission Decision 2002/657/EC [33]. Compounds wereidentified on the basis of their relative retention time, whichis the ratio of the retention time of the analyte to that of theinternal standard. In addition, the ion ratios of the precursorand product ions in the spectrum obtained upon chromato-graphic analysis were taken into account when the peak inthe chromatogram had a signal-to-noise ratio of at least 3:1.Commission Decision 2002/657/EC [33] also describes asystem of identification points. Detection of precursor andproduct ions yields, respectively, one and 1.5 identificationpoints. To obtain a minimum of four identification points,MS3 fragmentation was required for salicylic acid, bezafi-brate and mefenamic acid.
K. Wille et al.
Specificity
The specificity of our method was evaluated through theanalysis of seawater samples spiked with each com-pound separately and of seawater samples spiked witha mixture of all compounds at a concentration of100 ng L-1. The specificity of the analytical approachwas confirmed since no interferences were demonstratedby using LC-MSn as described “Experimental”. No othersignificant peaks with a signal-to-noise ratio of 3 or morewere observed at the specific retention times of the targetpharmaceuticals, indicating a high specificity of theanalytical method.
Linearity and limit of quantification
Linearity was evaluated by seven-point calibration curves(six replicates) in seawater. Seawater samples (1 L) werespiked with a standard mixture obtaining concentrationsof 1; 5; 10; 50; 100; 500 and 1,000 ng L-1 of thedifferent pharmaceuticals. The mean correlation coeffi-cients (n=6) of the calibration curves were 0.99 or higherfor the target analytes, indicating good linearity in theconcentration range 1–1,000 ng L-1 (Table 3). This is inaccordance with the correlation coefficients reported in theliterature for the same pharmaceuticals in freshwater [20,30]. Despite the high salinity of our sample matrix, thelinearity of the analytical method in seawater was notaffected. To demonstrate the flexibility of our analyticalprocedure, besides seawater, calibration curves were alsoconstructed in tap water. Correlation coefficients of 0.99or higher were found for all compounds.
LOQs were determined using spiked matrix samples andwere defined as the lowest detectable concentrations of thecalibration curves with a signal-to-noise ratio of at least 10
[21, 27, 30, 31]. The LOQs obtained for the targetcompounds (Table 3) varied between 1 and 50 ng L-1 inseawater and were the same in tap water (chromatogramsand spectra not shown). These LOQs are consideredacceptable and are comparable to previously reported LOQsfor the same pharmaceuticals. Indeed, similar LOQs(between 1 and 20 ng L-1) were reported for bezafibrate,clofibric acid, sulfamethoxazole, carbamazepine, proprano-lol, chloramphenicol and thrimethoprim [32, 37]. Gómez etal. [30] reported comparable LOQs for atenolol anddiclofenac.
Recovery and precision
Because no certified reference material was available,recoveries and intermediate precision (samples were mea-sured on different days) were determined using seawatersamples spiked with known amounts of the analytes (sixreplicates of seven concentrations: 1, 5, 10, 50, 100, 500and 1,000 ng L-1). The intermediate precision of the methodwas determined by calculating the relative standard devia-tion (RSD). Table 3 summarizes the recovery and precisionresults. According to SANCO/825/00 revision 7 [34],typically a recovery within the range 70–110% and arepeatability of RSD≤20% are required. The mean recov-eries (in the 95–108% range) were satisfactory for all thetarget pharmaceuticals. Zhang and Zhou [36] described theincreasing extraction efficiency in SPE of carbamazepine,sulfamethoxazole, propranolol and diclofenac owing to theincreasing salt concentration. Taking this into account, wecan explain the recovery rates of 100% or more of ninepharmaceuticals in this study. Except for bezafibrate andsalicylic acid (RSDs of 27%), the analytical method wassufficiently precise for quantitative analysis of the pharma-ceuticals (RSDs between 16 and 20%). The RSDs of
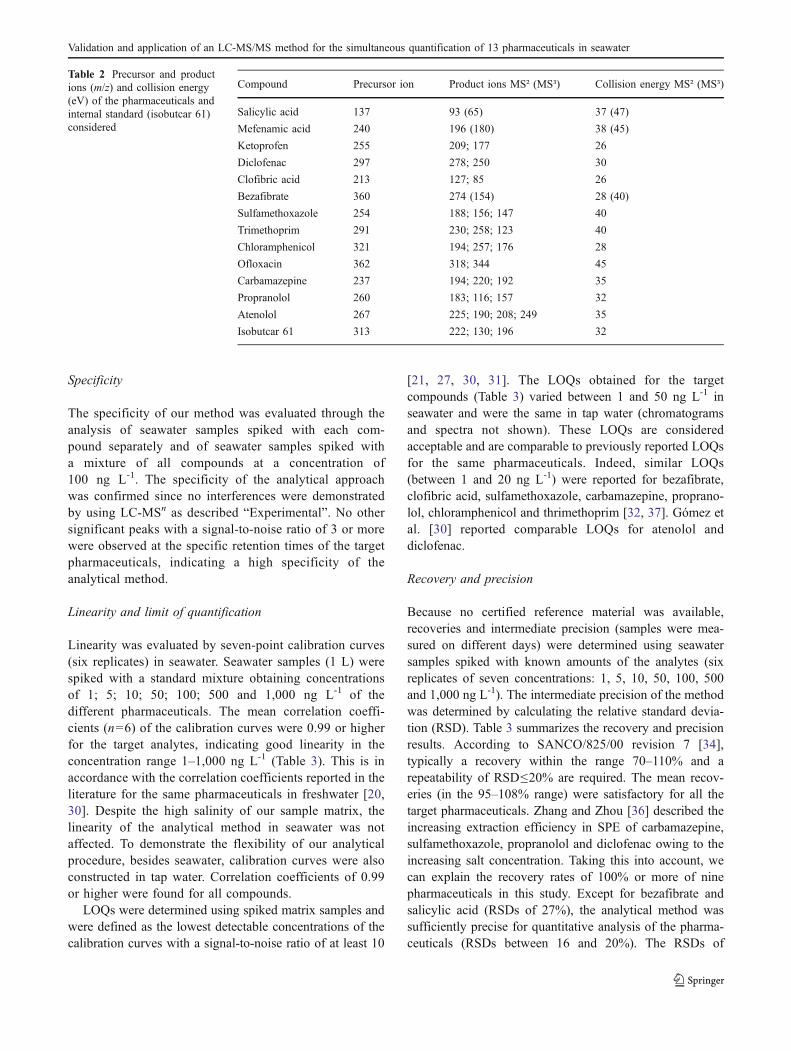
Compound Precursor ion Product ions MS² (MS³) Collision energy MS² (MS³)
Salicylic acid 137 93 (65) 37 (47)
Mefenamic acid 240 196 (180) 38 (45)
Ketoprofen 255 209; 177 26
Diclofenac 297 278; 250 30
Clofibric acid 213 127; 85 26
Bezafibrate 360 274 (154) 28 (40)
Sulfamethoxazole 254 188; 156; 147 40
Trimethoprim 291 230; 258; 123 40
Chloramphenicol 321 194; 257; 176 28
Ofloxacin 362 318; 344 45
Carbamazepine 237 194; 220; 192 35
Propranolol 260 183; 116; 157 32
Atenolol 267 225; 190; 208; 249 35
Isobutcar 61 313 222; 130; 196 32
Table 2 Precursor and productions (m/z) and collision energy(eV) of the pharmaceuticals andinternal standard (isobutcar 61)considered
Validation and application of an LC-MS/MS method for the simultaneous quantification of 13 pharmaceuticals in seawater
bezafibrate and salicylic acid were somewhat higher at thelowest concentrations. This can be attributed to theunavailability of a representative blank sample and conse-quently to the variation of its presence in unspiked water
samples. As can be seen from Table 3, the methoddeveloped allows quantification of the target analytes intap water as well. The recoveries (between 92 and 109%)and RSDs (17% or less) in tap water were satisfactory.
Fig. 2 Chromatograms and spectra of the pharmaceuticals detected in positive ion mode (100 ng L-1 spiked in seawater)
K. Wille et al.
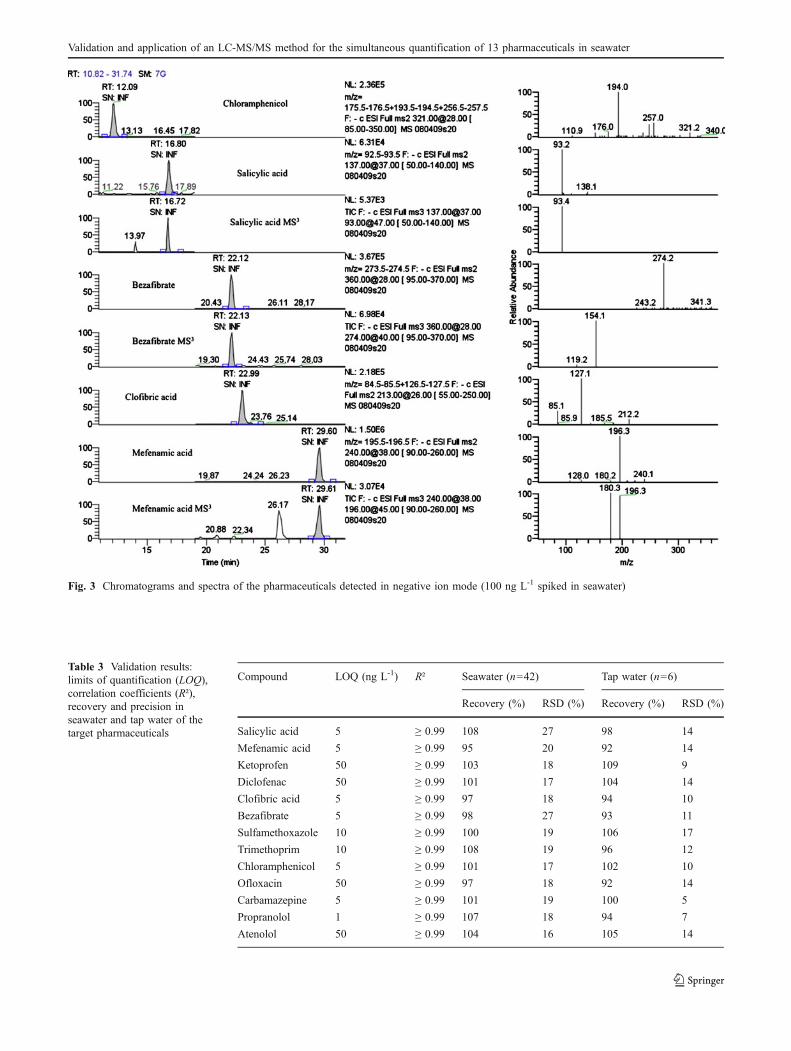
Fig. 3 Chromatograms and spectra of the pharmaceuticals detected in negative ion mode (100 ng L-1 spiked in seawater)
Compound LOQ (ng L-1) R² Seawater (n=42) Tap water (n=6)
Recovery (%) RSD (%) Recovery (%) RSD (%)
Salicylic acid 5 ≥ 0.99 108 27 98 14
Mefenamic acid 5 ≥ 0.99 95 20 92 14
Ketoprofen 50 ≥ 0.99 103 18 109 9
Diclofenac 50 ≥ 0.99 101 17 104 14
Clofibric acid 5 ≥ 0.99 97 18 94 10
Bezafibrate 5 ≥ 0.99 98 27 93 11
Sulfamethoxazole 10 ≥ 0.99 100 19 106 17
Trimethoprim 10 ≥ 0.99 108 19 96 12
Chloramphenicol 5 ≥ 0.99 101 17 102 10
Ofloxacin 50 ≥ 0.99 97 18 92 14
Carbamazepine 5 ≥ 0.99 101 19 100 5
Propranolol 1 ≥ 0.99 107 18 94 7
Atenolol 50 ≥ 0.99 104 16 105 14
Table 3 Validation results:limits of quantification (LOQ),correlation coefficients (R²),recovery and precision inseawater and tap water of thetarget pharmaceuticals
Validation and application of an LC-MS/MS method for the simultaneous quantification of 13 pharmaceuticals in seawater
Matrix effects
Since the ESI part of the mass spectrometer may be subjectto signal suppression or enhancement due to coextractedmatrix constituents [10], the validation study included theevaluation of matrix effects. Concerning the analysis ofseawater samples, these matrix constituents include mainlyparticulate components, sea salt and other impurities.Despite the thorough optimization of our sample prepara-tion protocol to avoid matrix effects, these were stillobserved following our analytical procedure. Therefore,the matrix effects were studied by comparing the calibrationcurves for the different compounds, in seawater and in tapwater. In addition, standard mixtures in mobile phasecontaining concentrations equal to the spiked matrix sampleconcentrations were brought onto column. A signalenhancement was observed in seawater for several analytes(ofloxacin, propranolol, chloramphenicol, salicylic acid,bezafibrate, clofibric acid). On the other hand, ionsuppression effects due to matrix constituents were alsoobserved for a number of analytes (atenolol, trimethoprim,sulfamethoxazole and mefenamic acid). The influence of thematrix was negligible for carbamazepine, diclofenac andketoprofen. No significant variations inmatrix effects betweenthe different samples were observed. The proper correction formatrix effects implies the use of one (labelled) internalstandard per analyte. However, the commercial availabilityof reference standards is rather low, and according to theliterature satisfactory results can be obtained using only one ortwo internal standards to correct for all compounds [11].Therefore, with every series of samples, calibration curveswere prepared in the sample matrix to minimize the matrixeffect on the quantification of the analytes.
Application to North Sea samples
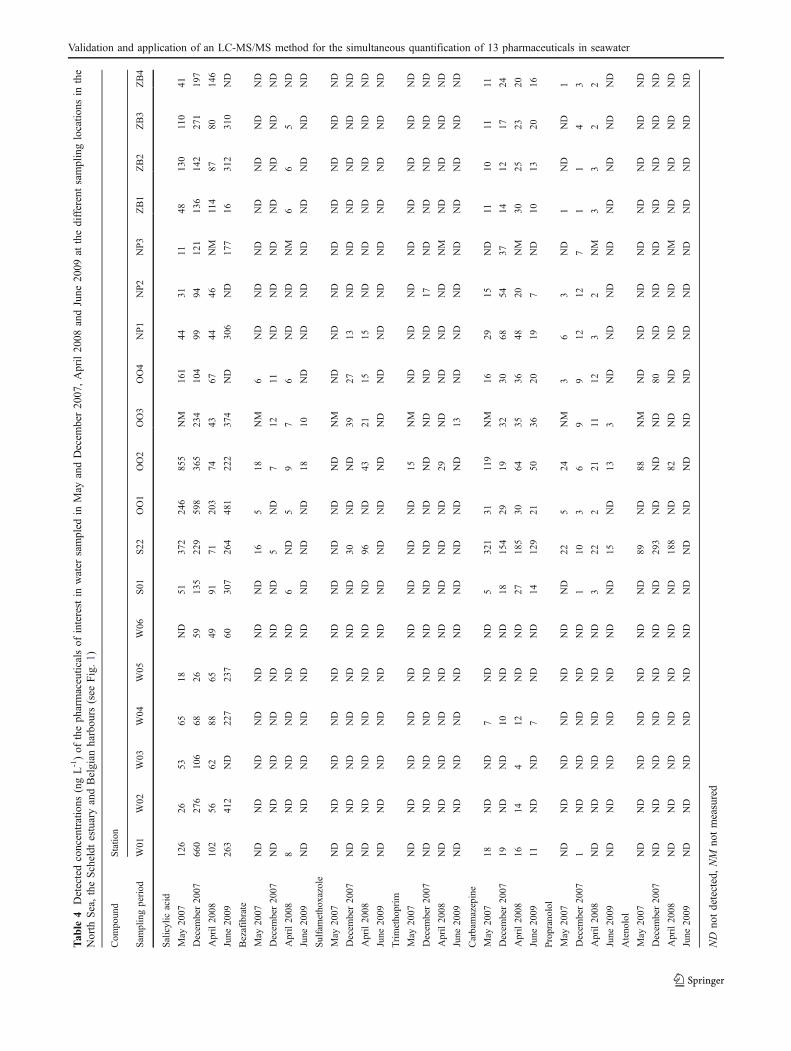
The method developed was applied to water samplescollected during the INRAM project (see “Study area andsampling”). Six offshore samples, 11 harbour samplesand two samples from the Scheldt estuary were collectedand analysed. This was repeated four times: in May andDecember 2007, April 2008 and June 2009. As can bededuced from Table 4, seven different pharmaceuticalswere detected. The other pharmaceuticals were not detectedat any of the sampling stations. Sulfamethoxazole andtrimethoprim were found up to concentrations of 96 and29 ng L-1, respectively. Other antibiotics could not bedetected. The widely used NSAID salicylic acid wasdetected very often. Salicylic acid, the deacylated, moreactive form of acetylsalicylic acid, was detected in morethan 90% of all samples at a concentration up to 855 ng L-1.The β-blocker propranolol was found in half of the samplesat levels up to 24 ng L-1, whereas atenolol was detected
only six times up to 293 ng L-1. Bezafibrate was detected atconcentrations below 18 ng L-1 and residues of thepsychiatric drug carbamazepine were frequently found atlevels up to 321 ng L-1. Salicylic acid and carbamazepinemay be considered as the most relevant compounds for theNorth Sea and Scheldt estuary since they were detectedmost often and at the highest concentrations.
Many studies have reported the presence of pharmaceut-icals in rivers and in influents and effluents of WWTPs[18–20, 35]. The concentrations observed depend on thetherapeutic class. The presence of antibiotics in surfacewater is generally reported in the low nanogram per litreconcentration range, whereas several NSAIDs reach micro-gram per litre levels. The levels of salicylic acid measuredin our study are within the same order of magnitude asthose reported in the literature for freshwater samples.Detected concentrations of β-blockers and lipid regulatorsin the Belgian coastal zone are rather low in comparisonwith concentrations detected in surface water [18, 38]. Onthe other hand, carbamazepine occurs at high levels and isdetected very often. This can be explained by its lowremoval efficiency in WWTPs [21, 37]. With regard tomarine waters, Buser et al. [39] and Weigel et al. [25, 40]reported the presence of clofibric acid and carbamazepinein the North Sea at concentrations of approximately 1 and2 ng L-1, respectively. More recent, Togola and Budzinski[41] reported higher concentrations for carbamazepine,diclofenac and ketoprofen in the Mediterranean Sea.However, in general, monitoring data for pharmaceuticalsin the marine environment are rather sparse. This mayreflect the absence of a method to extract and identifymulticlass pharmaceuticals in marine systems [40]. In thisstudy, a novel multiclass analytical method for pharma-ceuticals was developed that clearly showed the ubiquitouscharacter of several pharmaceutical compounds in seawaterand as a result in the marine environment as well. Thesefindings will assist to further research within the INRAMproject, in which risk assessments of the pharmaceuticalsdetected for the marine environment will be performed.
The concentrations of some pharmaceuticals underinvestigation show large temporal variations. However,except for salicylic acid at W01 and W02, the same generalpicture of lower concentrations in the North Sea (W01–W06) in comparison with the harbours and the Scheldtestuary could be noticed. We suggested that, owing to bothdilution and degradation, there is little transport from theScheldt estuary and the harbours to the open sea. Alsoprevious studies on oestrogens, nonyl phenol ethoxylates,and polychlorinated biphenyls reported the limited transportfrom the Scheldt estuary to the North Sea [42–44]. Atsampling locations OO02 and S22, target pharmaceuticalswere detected most frequently and at the highest concen-trations. OO02 is situated at the mouth of the river Noord-
K. Wille et al.
Tab
le4
Detectedconcentrations
(ngL-1)of
theph
armaceuticalsof
interestin
water
sampled
inMay
andDecem
ber20
07,April20
08andJune
2009
atthedifferentsamplinglocatio
nsin
the
North
Sea,theScheldt
estuaryandBelgian
harbou
rs(see
Fig.1)
Com
pound
Statio
n
Sam
plingperiod
W01
W02
W03
W04
W05
W06
S01
S22
OO1
OO2
OO3
OO4
NP1
NP2
NP3
ZB1
ZB2
ZB3
ZB4
Salicylic
acid
May
2007
126
2653
6518
ND
51372
246
855
NM
161
4431
1148
130
110
41
Decem
ber2007
660
276
106
6826
59135
229
598
365
234
104
9994
121
136
142
271
197
April2008
102
5662
8865
4991
71203
7443
6744
46NM
114
8780
146
June
2009
263
412
ND
227
237
60307
264
481
222
374
ND
306
ND
177
16312
310
ND
Bezafibrate
May
2007
ND
ND
ND
ND
ND
ND
ND
165
18NM
6ND
ND
ND
ND
ND
ND
ND
Decem
ber2007
ND
ND
ND
ND
ND
ND
ND
5ND
712
11ND
ND
ND
ND
ND
ND
ND
April2008
8ND
ND
ND
ND
ND
6ND
59
76
ND
ND
NM
66
5ND
June
2009
ND
ND
ND
ND
ND
ND
ND
ND
ND
1810
ND
ND
ND
ND
ND
ND
ND
ND
Sulfamethoxazole
May
2007
ND
ND
ND
ND
ND
ND
ND
ND
ND
ND
NM
ND
ND
ND
ND
ND
ND
ND
ND
Decem
ber2007
ND
ND
ND
ND
ND
ND
ND
30ND
ND
3927
13ND
ND
ND
ND
ND
ND
April2008
ND
ND
ND
ND
ND
ND
ND
96ND
4321
1515
ND
ND
ND
ND
ND
ND
June
2009
ND
ND
ND
ND
ND
ND
ND
ND
ND
ND
ND
ND
ND
ND
ND
ND
ND
ND
ND
Trimethoprim
May
2007
ND
ND
ND
ND
ND
ND
ND
ND
ND
15NM
ND
ND
ND
ND
ND
ND
ND
ND
Decem
ber2007
ND
ND
ND
ND
ND
ND
ND
ND
ND
ND
ND
ND
ND
17ND
ND
ND
ND
ND
April2008
ND
ND
ND
ND
ND
ND
ND
ND
ND
29ND
ND
ND
ND
NM
ND
ND
ND
ND
June
2009
ND
ND
ND
ND
ND
ND
ND
ND
ND
ND
13ND
ND
ND
ND
ND
ND
ND
ND
Carbamazepine
May
2007
18ND
ND
7ND
ND
5321
31119
NM
1629
15ND
1110
1111
Decem
ber2007
19ND
ND
10ND
ND
18154
2919
3230
6854
3714
1217
24
April2008
1614
412
ND
ND
27185
3064
3536
4820
NM
3025
2320
June
2009
11ND
ND
7ND
ND
14129
2150
3620
197
ND
1013
2016
Propranolol
May
2007
ND
ND
ND
ND
ND
ND
ND
225
24NM
36
3ND
1ND
ND
1
Decem
ber2007
1ND
ND
ND
ND
ND
110
36
99
1212
71
14
3
April2008
ND
ND
ND
ND
ND
ND
322
221
1112
32
NM
33
22
June
2009
ND
ND
ND
ND
ND
ND
ND
15ND
133
ND
ND
ND
ND
ND
ND
ND
ND
Atenolol
May
2007
ND
ND
ND
ND
ND
ND
ND
89ND
88NM
ND
ND
ND
ND
ND
ND
ND
ND
Decem
ber2007
ND
ND
ND
ND
ND
ND
ND
293
ND
ND
ND
80ND
ND
ND
ND
ND
ND
ND
April2008
ND
ND
ND
ND
ND
ND
ND
188
ND
82ND
ND
ND
ND
NM
ND
ND
ND
ND
June
2009
ND
ND
ND
ND
ND
ND
ND
ND
ND
ND
ND
ND
ND
ND
ND
ND
ND
ND
ND
ND
notdetected,NM
notmeasured
Validation and application of an LC-MS/MS method for the simultaneous quantification of 13 pharmaceuticals in seawater
Ede and the canal Bruges-Ostend in the harbour of Ostend(in the middle of the Belgian coastal zone), whereas S22 islocated in the Scheldt estuary in Antwerp. Several WWTPsare located close to OO02 and in Flanders the effluents ofmore than 65 WWTPs are discharged into the Scheldtestuary. Furthermore, the WWTPs with the largest capacityare located near the Scheldt estuary: Deurne, Ghent andAntwerp (approximately 200,000 inhabitant equivalent)(Aquafin, personal communication). It may be concludedthat both locations receive major inputs of contaminatedindustrial and domestic wastewater, probably resulting inthe increased presence of the target pharmaceuticals.
Conclusion
In this study, an analytical method for the quantification ofimportant pharmaceuticals in seawater was developed andoptimized. A combination of SPE and LC-MSn enabledthe detection and quantification of multiclass pharmaceut-icals of widely differing chemical structures in seawater atthe low nanogram per litre level. The method wasvalidated according to the laboratory quality assurancecriteria developed in accordance with Commission Deci-sion 2002/657/EC and SANCO/825/00 revision 7 [33,34]. Application of the procedure to North Sea andScheldt estuary samples confirmed the occurrence of sevenpharmaceuticals in the marine environment up to the lowmicrogram per litre level. Frequently detected compoundswere salicylic acid, carbamazepine and propranolol. Twoantibiotics were detected occasionally: sulfamethoxazoleand thrimethoprim. Little transport of pharmaceuticalscould be observed from the Scheldt estuary and theharbours to the open sea. In general, it may be concludedthat the results of this 2-year monitoring study are quitenovel and may provide relevant insights into the field ofpharmaceutical analysis in the marine environment.
References
1. Ternes TA (2001) Trends Anal Chem 20:419–4342. Jones OAH, Voulvoulis N, Lester JN (2004) Crit Rev Toxicol
34:335–3503. NIHDI, Farmanet (2007) National Institute for Health and
Disability Insurance, Farmanet 2007. http://riziv.fgov.be/drug/nl/statistics-scientific-information/index.htm
4. Halling-Sorensen B, Nielsen SN, Lanzky PF, Ingerslev F, HoltenLützhoft HC, Jorgensen SE (1998) Chemosphere 36:357–394
5. Fent K, Weston AA, Caminada D (2006) Aquat Toxicol 76:122–159
6. Cooper ER, Siewicki TC, Philips K (2008) Sci Total Environ398:26–33
7. Christensen AM, Markussen B, Baun A, Halling-Sorensen B(2009) Chemosphere 77:351–358
8. Hernando MD, Mezcua M, Fernández-Alba AR, Barceló D(2006) Talanta 69:334–342
9. Roberts PH, Bersuder P (2006) J Chromatogr A 1134:143–15010. Petrovic M, Hernando MD, Diaz-Cruz MS, Barceló D (2005) J
Chromatogr A 1067:1–1411. Pozo OJ, Guerrero C, Sancho JV, Ibanez M, Pitarch E,
Hogendoorn E, Hernandez F (2005) J Chromatogr A 1103:83–9312. Schwab BW, Hayes EP, Fiori JM, Mastrocco FJ, Roden NM,
Cragin D, Meyerhoff RD, D’Aco VJ, Anderson PD (2005) RegulToxicol Pharmacol 42:296–312
13. Kostich MS, Lazorchak JM (2008) Sci Total Environ 389:329–33914. Carlsson C, Johansson A-K, Alvan G, Bergman K, Kühler T
(2006) Sci Total Environ 364:67–8715. Commission E (2000) Off J Eur Communities L 327:1–7216. Commission E (2008) Off J Eur Union L 348:84–9717. OSPAR (2009) List of chemicals of priority action and the list of
substances of possible concern. http://www.ospar.org. Accessed 1Dec 2009
18. Bendz D, Paxéus NA, Ginn TR, Loge FJ (2005) J Hazard Mater122:195–204
19. Lindqvist N, Tuhkanen T, Kronberg L (2005) Water Res 39:2219–2228
20. Gros M, Petrovic M, Barceló D (2009) Anal Chem 81:898–91221. Grujic S, Vasiljevic T, Lausevic M (2009) J Chromatogr A
1216:4989–500022. Zuccato E, Calamari D, Natangelo M, Fanelli R (2000) Lancet
355:1789–179023. Benotti MJ, Trenholm RA, Vanderford BJ, Holady JC, Stanford
BD, Snyder SA (2009) Environ Sci Technol 43:597–60324. Sacher F, Lange FT, Brauch H-J, Blankenhorn I (2001) J
Chromatogr A 938:199–21025. Weigel S, Kuhlmann J, Hühnerfuss H (2002) Sci Total Environ
295:131–14126. Bueno MJM, Hernando MD, Agüera A, Fernández-Alba AR
(2009) Talanta 77:1518–152727. Bones J, Thomas K, Nesterenko PN, Paull B (2006) Talanta
70:1117–112828. Tolls J (2001) Environ Sci Technol 35:3397–340629. Noppe H, De Wasch K, Poelmans S, Van Hoof N, Verslycke T,
Janssen CR, De Brabander HF (2005) Anal Bioanal Chem 383:91–9830. Gómez MJ, Petrovic M, Fernández-Alba AR, Barceló D (2006) J
Chromatogr A 1114:224–23331. Nebot C, Gibb SW, Boyd KG (2007) Anal Chim Acta 598:87–9432. Stolker AAM, Niesing W, Hogendoorn EA, Versteegh JFM, Fuchs
R, Brinkman UAT (2004) Anal Bioanal Chem 378:955–96333. Commission E (2002) Off J Eur Communities L 221:8–3634. European Commission (2004) SANCO/825/00 revision 7. Guid-
ance document on residue analytical methods. European Com-mission, Directorate General Health and Consumer Protection
35. Madureira TV, Barreiro JC, Rocha MJ, Cass QB, Tiritan ME(2009) J Chromatogr A 1216:7033–7042
36. Zhang ZL, Zhou JL (2007) J Chromatogr A 1154:205–21337. Gros M, Petrovic M, Barceló D (2006) Talanta 70:678–69038. Ternes TA (1998) Water Res 32:3245–326039. Buser HR, Muller MD, Theobald N (1998) Environ Sci Technol
32:188–19240. Weigel S, Bester K, Hühnerfuss H (2001) J Chromatogr A
912:151–16141. Togola A, Budzinski H (2008) J Chromatogr A 1177:150–15842. Vuksanovic V, De Smedt F, Van Meerbeeck S (1996) J Hydrol
174:1–1843. Jonkers N, Laane RWPM, De Graaf C, de Voogt P (2005) Estuar
Coast Shelf Sci 62:141–16044. Noppe H, Verslycke T, De Wulf E, Verheyden K, Monteyne E,
Van Caeter P, Janssen CR, De Brabander HF (2006) EcotoxicolEnviron Saf 66:1–8
K. Wille et al.