Validating the Use of AP® Exam Scores for College Course Placement
84
VALIDITY Validating the Use of AP ® Exam Scores for College Course Placement By Brian F. Patterson and Maureen Ewing RESEARCH REPORT 2013-2 VALIDITY
-
Upload
doannguyet -
Category
Documents
-
view
219 -
download
0
Transcript of Validating the Use of AP® Exam Scores for College Course Placement
VALIDITY
Validating the Use of AP® Exam Scores for College Course PlacementBy Brian F. Patterson and Maureen Ewing
REsEaRch REPoRt 2013-2
VALIDITY
VALIDITY
Brian F. Patterson is an assistant research scientist in the College Board’s Research department.
Maureen Ewing is a senior director in the College Board’s Research department.
Acknowledgments
We would like to acknowledge Priyank Patel’s assistance in the review of introductory credit and placement–granting policy data and Mylene Remigio’s thoughtful review of the data and analyses. We also appreciate Michael Chajewski’s perspective on the validation of propensity score models. This manuscript also benefited from the helpful feedback of Ben Kelcey, and we are grateful for his contributions.
About the College Board
The College Board is a mission-driven not-for-profit organization that connects students to college success and opportunity. Founded in 1900, the College Board was created to expand access to higher education. Today, the membership association is made up of over 6,000 of the world’s leading educational institutions and is dedicated to promoting excellence and equity in education. Each year, the College Board helps more than seven million students prepare for a successful transition to college through programs and services in college readiness and college success — including the SAT® and the Advanced Placement Program®. The organization also serves the education community through research and advocacy on behalf of students, educators and schools. For further information, visit www.collegeboard.org.
© 2013 The College Board. College Board, Advanced Placement Program, AP, SAT and the acorn logo are registered trademarks of the College Board. ACES, Admitted Class Evaluation Service, AP Potential, AP Potential and SAT Subject Tests are trademarks owned by the College Board. PSAT/NMSQT is a registered trademark of the College Board and National Merit Scholarship Corporation. All other products and services may be trademarks of their respective owners. Visit the College Board on the Web: www.collegeboard.org.
For more information on College Board research and data, visit research.collegeboard.org.
ContentsExecutive Summary ................................................................................................ 5
Introduction ............................................................................................................. 6
Method ..................................................................................................................... 9
Sample .............................................................................................................. 9
Measures .........................................................................................................10
Analyses ..........................................................................................................11
Results .....................................................................................................................16
Selection of AP® Exams for Presentation .....................................................16
Subsequent Mathematics Course Performance ..........................................18
Subsequent Natural Science Course Performance .....................................22
Subsequent Social Science and History Course Performance ...................28
Summary of Subsequent Course Performance Analyses ...........................38
Discussion ...............................................................................................................39
Limitations and Directions for Future Research .........................................41
Conclusions .............................................................................................................41
References ...............................................................................................................42
Appendix .................................................................................................................45

Tables
Table 1. Summary of Colleges’ AP Introductory Credit- and Placement-Granting Policies ....12
Table 2. Summary of Institutional Characteristics ......................................................................13
Table 3. Summary of Sample Sizes Before Matching..................................................................17
Table 4. Summary Statistics for AP Calculus AB and Non-AP Students, Before and After Matching ............................................................................................................19
Table 5. Summary Statistics for AP Calculus BC and Non-AP Students, Before and After Matching ............................................................................................................21
Table 6. Summary Statistics for AP Biology and Non-AP Students, Before and After Matching ............................................................................................................23
Table 7. Summary Statistics for AP Chemistry and Non-AP Students, Before and After Matching ............................................................................................................25
Table 8. Summary Statistics for AP Physics C: Mechanics and Non-AP Students, Before and After Matching ............................................................................................................27
Table 9. Summary Statistics for AP Microeconomics and Non-AP Students, Before and After Matching ............................................................................................................29
Table 10. Summary Statistics for AP Macroeconomics and Non-AP Students, Before and After Matching ............................................................................................................31
Table 11. Summary Statistics for AP Psychology and Non-AP Students, Before and After Matching ............................................................................................................33
Table 12. Summary Statistics for AP U.S. Government and Politics and Non-AP Students, Before and After Matching ....................................................................35
Table 13. Summary Statistics for AP U.S. History and Non-AP Students, Before and After Matching ............................................................................................................37
Table 14. Summary Statistics for AP and Non-AP Students on Subsequent Course Grades, After Matching ....................................................................................................39

Table A1. Student Characteristics of Propensity Score Model Sample.....................................45
Table A2. Academic Characteristics of Propensity Score Model Sample.................................46
Table A3. AP Exam Participation Rates : Overall and Extreme High School Proportions and Test of Heterogeneity .............................................................................................................47
Table A4. Propensity Score Model for AP Calculus AB Exam Participation.............................48
Table A5. Propensity Score Model for AP Calculus BC Exam Participation .............................50
Table A6. Propensity Score Model for AP Computer Science A Exam Participation ..............52
Table A7. Propensity Score Model for AP Biology Exam Participation .....................................54
Table A8. Propensity Score Model for AP Chemistry Exam Participation ................................56
Table A9. Propensity Score Model for AP Physics B Exam Participation .................................58
Table A10. Propensity Score Model for AP Physics C: Mechanics Exam Participation ..........60
Table A11. Propensity Score Model for AP Microeconomics Exam Participation ...................62
Table A12. Propensity Score Model for AP Macroeconomics Exam Participation ..................64
Table A13. Propensity Score Model for AP Psychology Exam Participation ............................66
Table A14. Propensity Score Model for AP U.S. Government and Politics Exam Participation .........................................................................................................................68
Table A15. Propensity Score Model for AP U.S. History Exam Participation ...........................70
Table A16. Propensity Score Model for AP English Language and Comp. Exam Participation .........................................................................................................................72
Table A17. Propensity Score Model for AP English Literature and Comp. Exam Participation .........................................................................................................................74
Table A18. Propensity Score Model for AP Spanish Language Exam Participation ................76
Figures
Figure 1. Standardized differences for AP Calculus AB and non-AP students ........................18
Figure 2. Standardized differences for AP Calculus BC and non-AP students ........................20
Figure 3. Standardized differences for AP Biology and non-AP students ................................22
Figure 4. Standardized differences for AP Chemistry and non-AP students ...........................24
Figure 5. Standardized differences for AP Physics C: Mechanics and non-AP students .......26
Figure 6. Standardized differences for AP Microeconomics and non-AP students.................28
Figure 7. Standardized differences for AP Macroeconomics and non-AP students ................30
Figure 8. Standardized differences for AP Psychology and non-AP students ..........................32
Figure 9. Standardized differences for AP U.S. Government and Politics and non-AP students .............................................................................................................................34
Figure 10. Standardized differences for AP U.S. History and non-AP students .......................36
Figure 11. Mean subsequent course grades for AP and non-AP students, after matching ....38
5College Board Research Reports
AP Exam Validity for Placement
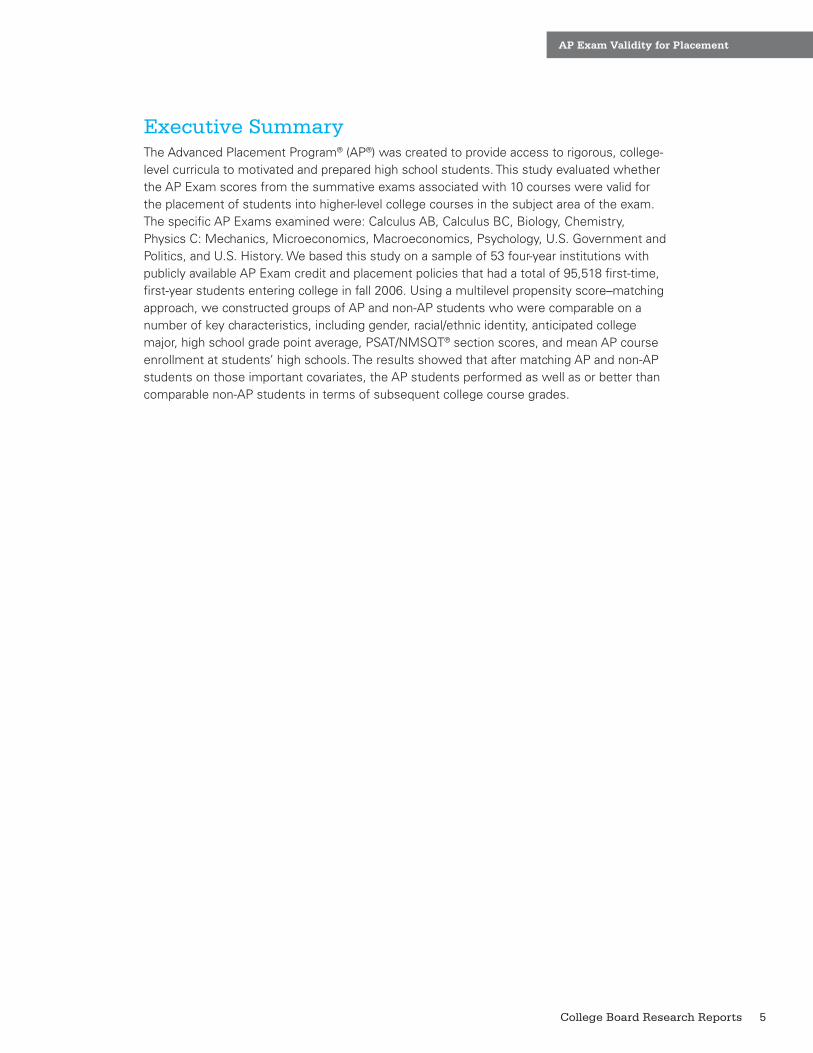
Executive Summary The Advanced Placement Program® (AP®) was created to provide access to rigorous, college-level curricula to motivated and prepared high school students. This study evaluated whether the AP Exam scores from the summative exams associated with 10 courses were valid for the placement of students into higher-level college courses in the subject area of the exam. The specific AP Exams examined were: Calculus AB, Calculus BC, Biology, Chemistry, Physics C: Mechanics, Microeconomics, Macroeconomics, Psychology, U.S. Government and Politics, and U.S. History. We based this study on a sample of 53 four-year institutions with publicly available AP Exam credit and placement policies that had a total of 95,518 first-time, first-year students entering college in fall 2006. Using a multilevel propensity score–matching approach, we constructed groups of AP and non-AP students who were comparable on a number of key characteristics, including gender, racial/ethnic identity, anticipated college major, high school grade point average, PSAT/NMSQT® section scores, and mean AP course enrollment at students’ high schools. The results showed that after matching AP and non-AP students on those important covariates, the AP students performed as well as or better than comparable non-AP students in terms of subsequent college course grades.
6 College Board Research Reports
AP Exam Validity for Placement
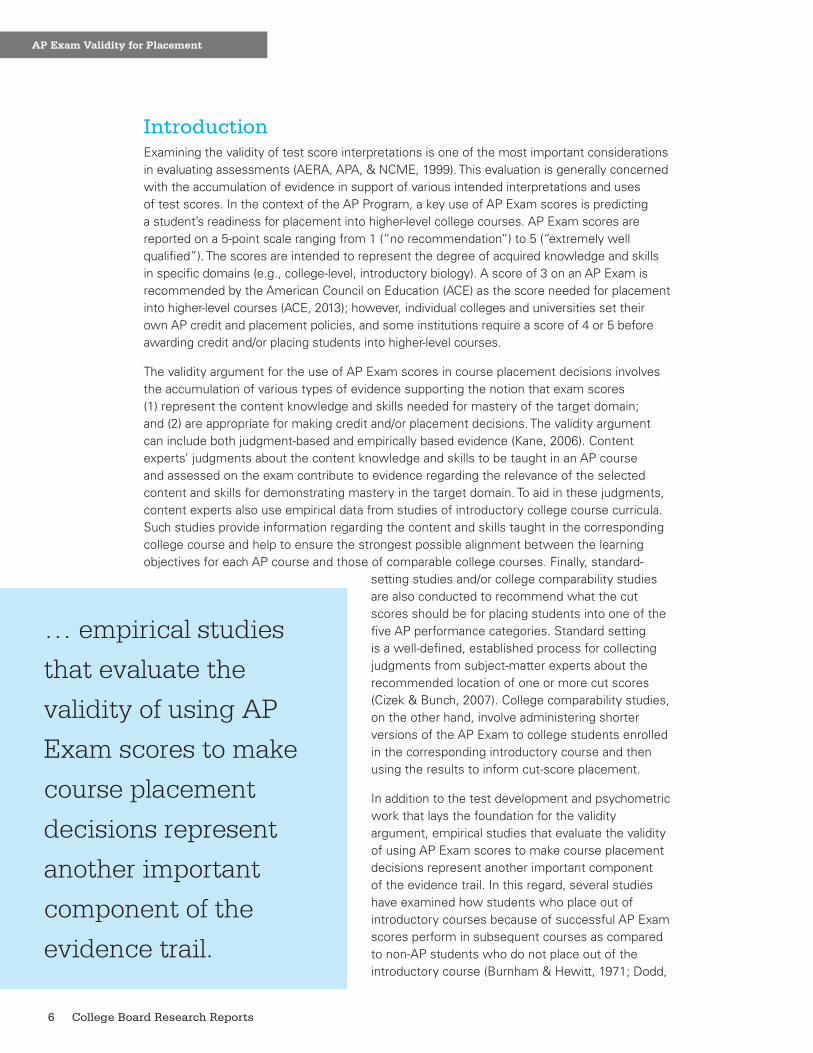
IntroductionExamining the validity of test score interpretations is one of the most important considerations in evaluating assessments (AERA, APA, & NCME, 1999). This evaluation is generally concerned with the accumulation of evidence in support of various intended interpretations and uses of test scores. In the context of the AP Program, a key use of AP Exam scores is predicting a student’s readiness for placement into higher-level college courses. AP Exam scores are reported on a 5-point scale ranging from 1 (“no recommendation”) to 5 (“extremely well qualified”). The scores are intended to represent the degree of acquired knowledge and skills in specific domains (e.g., college-level, introductory biology). A score of 3 on an AP Exam is recommended by the American Council on Education (ACE) as the score needed for placement into higher-level courses (ACE, 2013); however, individual colleges and universities set their own AP credit and placement policies, and some institutions require a score of 4 or 5 before awarding credit and/or placing students into higher-level courses.
The validity argument for the use of AP Exam scores in course placement decisions involves the accumulation of various types of evidence supporting the notion that exam scores (1) represent the content knowledge and skills needed for mastery of the target domain; and (2) are appropriate for making credit and/or placement decisions. The validity argument can include both judgment-based and empirically based evidence (Kane, 2006). Content experts’ judgments about the content knowledge and skills to be taught in an AP course and assessed on the exam contribute to evidence regarding the relevance of the selected content and skills for demonstrating mastery in the target domain. To aid in these judgments, content experts also use empirical data from studies of introductory college course curricula. Such studies provide information regarding the content and skills taught in the corresponding college course and help to ensure the strongest possible alignment between the learning objectives for each AP course and those of comparable college courses. Finally, standard-
setting studies and/or college comparability studies are also conducted to recommend what the cut scores should be for placing students into one of the five AP performance categories. Standard setting is a well-defined, established process for collecting judgments from subject-matter experts about the recommended location of one or more cut scores (Cizek & Bunch, 2007). College comparability studies, on the other hand, involve administering shorter versions of the AP Exam to college students enrolled in the corresponding introductory course and then using the results to inform cut-score placement.
In addition to the test development and psychometric work that lays the foundation for the validity argument, empirical studies that evaluate the validity of using AP Exam scores to make course placement decisions represent another important component of the evidence trail. In this regard, several studies have examined how students who place out of introductory courses because of successful AP Exam scores perform in subsequent courses as compared to non-AP students who do not place out of the introductory course (Burnham & Hewitt, 1971; Dodd,
… empirical studies
that evaluate the
validity of using AP
Exam scores to make
course placement
decisions represent
another important
component of the
evidence trail.

7College Board Research Reports
AP Exam Validity for Placement
Fitzpatrick, De Ayala, & Jennings, 2002; Keng & Dodd, 2008; Morgan & Crone, 1993; Morgan & Klaric, 2007; Morgan & Ramist, 1998).
As described next, placement validity studies to date vary in terms of the number of AP Exams investigated, the number of postsecondary institutions included, the design of the study, and whether other characteristics that may account for differences in subsequent course performance between AP and non-AP groups are considered. These characteristics are typically referred to as control variables or covariates. The use of covariates enables researchers to rule out alternative explanations for group differences that more traditional validity evidence, which relies primarily on correlations between test scores and outcomes of interest, may not be able to do.
Morgan and Ramist (1998) conducted the first study of this kind that was extensive both in terms of the number of exams (25) and the number of institutions (21) included in the analysis. The outcomes analyzed in the study included second-level subsequent course grades (for all subjects except world languages), as well as third-level, fourth-level, and fifth-level course grades for subjects in which placement beyond the second-level course was common, including world language, math, and science subject areas. Of the 22 AP Exams in which performance in second-level courses was analyzed, results showed that students who earned a 5 on the AP Exam earned higher grades in second-level courses, on average, than students who took the introductory course. Similarly, students who earned a 4 on the relevant AP Exam earned higher second-level course grades, on average, in all but four cases (Art History, French Literature, Music Theory, and Macroeconomics). Finally, students who earned a 3 on the relevant AP Exam earned higher second-level course grades, on average, in all but eight cases (Art History, Biology, Comparative Government and Politics, European History, Microeconomics, Music Theory, Spanish Literature, and Studio Art: General).
Performance in third-, fourth-, and fifth-level courses was also analyzed for the AP world language and culture exams (French Language and Culture, German Language and Culture, and Spanish Language and Culture). The results showed that students with AP Exam scores of 3, 4, or 5 who placed out of the lower-level course received, on average, higher grades in the third-level and fourth-level courses compared to non-AP students who took the lower-level course. The same was true for fifth-level world language courses, with the exception of German Language, in which only students who earned a 5 on the AP Exam outperformed the comparison group. Performance in third-level math and science courses was also compared for AP and non-AP students. Findings indicated that students with exam scores of 3, 4, or 5 received, on average, higher grades in all third-level math and science courses compared to non-AP students who took the lower-level course. Exceptions included Physics B and Computer Science A — in which only students earning a 5 on the exam outperformed the comparison group — and Biology — in which only students earning a 4 or a 5 outperformed the comparison group. It is important to note that Morgan and Ramist’s (1998) analyses were purely descriptive. In other words, no tests of statistical significance or effect size estimation were conducted; neither were covariates controlled for in the analyses.
A follow-up study using data from 27 colleges and universities extended this work by comparing the subsequent performance of AP and non-AP Exam takers after controlling for the general academic achievement of the students in the study using SAT® scores (Morgan & Klaric, 2007). Results showed that students who scored a 3 or higher earned the same or better subsequent course grades than non-AP Exam takers of similar academic ability in nine of 10 AP subjects included in the analysis; the exception was AP Macroeconomics.
Local studies using data from one university or university system have also been conducted to evaluate AP placement policies. For example, Burnham and Hewitt (1971) compared the

8 College Board Research Reports
AP Exam Validity for Placement
subsequent course performance of AP Exam takers to non-AP Exam takers in English, French, and calculus subsequent courses, which all had sufficiently large sample sizes for reporting results. SAT scores and scores on what they called the CEEB aptitude and achievement tests (the predecessors to the SAT and the SAT Subject Tests™, respectively) were used as covariates to match freshman AP Exam takers who did not take any introductory courses to sophomore non-AP Exam takers who did take an introductory course. Results showed that AP English and AP French examinees earned mean subsequent course grades that were within one point on a 100-point grade scale of the course grades earned by the non-AP group. AP Calculus examinees, however, slightly outperformed comparable non-AP examinees by about five points on the 100-point grade scale.
More recently, similar work was conducted by researchers at the University of Texas at Austin, a large, diverse postsecondary institution that receives many AP score reports each year (Dodd, Fitzpatrick, De Ayala, & Jennings, 2002; Keng & Dodd, 2008). Keng and Dodd’s (2008) work was a replication and extension of Dodd et al. (2002) and compared the performance of students who received AP credit in 10 high volume subjects to non-AP students on a number of college outcomes. Students were matched in terms of high school rank and college admission test scores. Of the 10 AP subjects included in the study, there were four AP subjects (Biology, Calculus AB, Calculus BC, and English Language and Composition) for which specific sequent courses were identified by the corresponding college department. For these subjects, results showed that AP credit students generally performed the same (i.e., with no statistically significant difference) or better in the sequent course, on average, than non-AP students despite the fact that AP students did not take the introductory course on their college campus. While this research serves the important purpose of evaluating AP credit and placement policies at a particular institution, the results may not generalize to other institutions. The College Board encourages institutions to empirically evaluate their own AP credit and placement policies. To do so, institutions may use a free service offered by the College Board called the Admitted Class Evaluation Service™ (ACES™), whereby institutions submit the necessary data (e.g., grades in subsequent courses) in exchange for a report that compares the performance of AP and non-AP students in the relevant courses (College Board, 2013).
Aside from sequent course performance, another measure of subsequent course performance that may be more easily attainable is subject-area GPA. In some subjects, for example, there is no single proscribed sequent course, depending on the discipline and the scope and sequence of course work at a particular institution (e.g., psychology, history, human geography). When subject-area GPA was included as an outcome by Keng and Dodd (2008), results showed that AP credit students earned the same or higher subject-area GPAs throughout their college experience compared to non-AP students across all of the AP subjects included in the study. Using data from 110 postsecondary institutions, Patterson, Packman, and Kobrin (2011) found that first-year subject-area GPA also increased as average AP Exam score in that subject area increased, even after controlling for gender, racial/ethnic identity, socioeconomic status, and prior academic ability. Note that Patterson et al. (2011) did not take into account whether the AP students earned credit or advanced placement, and both studies used subject-area GPA, which included grades from a variety of different courses in the subject area.
The purpose of this study is to continue the line of research that has investigated the validity of AP Exam scores for course placement. Validation research is an ongoing activity, and despite the existing accumulation of evidence as described previously, additional evidence must be collected and evaluated on a periodic basis to support desired claims. The practice of granting introductory course credit or advanced placement implies that to a certain extent colleges and universities view specified levels of AP Exam performance as mastery of the knowledge and skills taught in introductory college courses. As such, it follows that students meeting the institution-specified
9College Board Research Reports
AP Exam Validity for Placement
level of AP Exam performance and placing out of introductory course(s) should be contrasted with those students who did not take the AP Exam but who did take the introductory course(s). Such a contrast enabled a comparison of students having been exposed to similar introductory college-level course work on the basis of actual performance in the first subsequent college course. Note that other groups — such as AP Exam takers who earned sufficiently high scores for introductory course credit or advanced placement yet chose to take an introductory course or non-AP Exam takers who took a subsequent course with no prior introductory course — were not considered in this study, as they would not directly address the issue of placement validity.
To take into account preexisting differences among AP and non-AP groups and that students self-select into AP, we used propensity scores to match the AP and non-AP groups on several variables on which AP and non-AP students have been observed to differ. Any differences detected by a naive comparison of the AP and comparison groups without matching may have been obscured by the differences on those several important variables. Through propensity score matching, the comparison group was constructed to be more similar to the AP group, thereby reducing the effect of alternative explanations for any difference between AP and comparison group performance in subsequent courses. In particular, there have historically been differences in AP Exam-taking across gender and racial/ethnic identities (College Board, 2007), so those two demographic measures were considered. AP Spanish Language Exam participation was posited to vary with students’ English language learner (ELL) status, so that covariate was also considered. More importantly, we anticipated that prior academic achievement measures such as PSAT/NMSQT scores and high school grade point average (HSGPA) would be related to AP Exam participation. Finally, two covariates not previously considered were students’ academic interests and opportunity for AP Exam participation, both of which are considered herein.
MethodSample
The sample used for this study included 53 of the 66 four-year colleges and universities that provided first- and second-year course-taking data to the College Board in connection with the effort to validate the changes to the SAT that were introduced in March 2005. Institutions submitted data to the Admitted Class Evaluation Service (ACES), at which point the student-level transcript data were matched to the College Board’s data. In order to defray the costs associated with building the data files, the colleges were offered a nominal stipend. For more information on the institutions — including a list of participating colleges and universities — see Mattern and Patterson (2011). Of the original 66 institutions, 13 were removed from analyses because we could not locate official AP credit- or advanced-placement-granting policies (more details on the identification of credit- and placement-granting policies follows). As a result, 95,518 possible
To take into account
preexisting differences
among AP and non-AP
groups and that
students self-select into
AP, we used propensity
scores to match the AP
and non-AP groups on
several variables.
10 College Board Research Reports
AP Exam Validity for Placement
students who entered one of the 53 institutions as first-time, first-year students in fall 2006 for whom course-taking data were available were thus eligible for inclusion in the analyses. After conditioning on students having taken the PSAT/NMSQT and all other required variables (i.e., performing listwise deletion or complete case analysis), there were 72,902 students who could have been included in the analysis of subsequent course data for each AP Exam.
We used a number of criteria to select which of the 35 AP Exams administered during this cohort of students’ high school careers to analyze. Of those 35, the following three exams were not considered, as they were due to be discontinued: Computer Science AB, French Literature, and Latin Literature. The first criterion was to limit our sample to only those AP Exams for which we had access to AP credit and placement policies that specifically indicated the introductory courses for which AP course credit or advanced placement was offered to students entering this particular set of colleges in fall 2006. Because, for example, our sample of colleges tended not to have established, well-specified policies for the credit or advanced placement granting for some exams, we excluded them from our preliminary sample of exams. This requirement eliminated four exams: Studio Art: Drawing, Studio Art: 2-D Design, Studio Art: 3-D Design, and Italian Language and Culture, the latter of which was only introduced in 2006. In addition to requiring that policies were available, we also required that there were at least 100 students each in the AP and non-AP student groups, in order to detect meaningful differences between the AP and non-AP groups (i.e., standardized differences of 0.50 with a power of .80 and a significance level of .01; Cohen, 1992). This led to our exclusion of the following 13 AP Exams: Art History, Environmental Science, European History, French Language and Culture, Human Geography, German Language and Culture, Comparative Government and Politics, Latin: Vergil, Music Theory, Physics C: Electricity and Magnetism, Spanish Literature, Statistics, and World History. The remaining 15 AP Exams were considered for further analysis: Calculus AB, Calculus BC, Computer Science A, Biology, Chemistry, Physics B, Physics C: Mechanics, Microeconomics, Macroeconomics, Psychology, U.S. Government and Politics, U.S. History, English Language and Composition, English Literature and Composition, and Spanish Language.
Measures
AP Exam scores. To simplify language, for each exam, we refer to students who took the relevant AP Exam as “AP students” and those who did not take the exam as “non-AP students.” As mentioned previously, AP Exam scores range from 1 to 5 (1: no recommendation; 2: possibly qualified; 3: qualified; 4: well qualified; and 5: extremely well qualified); a higher score indicates greater mastery of the knowledge and skills tested on the AP Exam.
College course taking and grades. The participating colleges provided all student course-taking records, including the course label (e.g., ENGL 101); name (e.g., Freshman Composition); grade (e.g., 3.67); credits earned (e.g., 3.0); and the term (i.e., semester, trimester, quarter; e.g., second semester) and year (i.e., first or second) in which the course was taken. Course grade scales were fairly consistent across institutions and generally ranged from 0.00 to 4.00, but two colleges granted course grades up to 4.30.
Student characteristics. Self-reported gender and racial/ethnic identity from both the PSAT/NMSQT and AP Exam registration processes were included in the estimation of propensity scores and in subsequent analyses to control for demographic differences across students. The most recently provided of these demographics were combined from across these two questionnaires to ensure more complete and up-to-date data. For the AP Spanish Language Exam analyses, we also considered students’ self-reported best-spoken language, provided at the time of PSAT/NMSQT registration.

11College Board Research Reports
AP Exam Validity for Placement
Overall academic preparedness. We used students’ PSAT/NMSQT scores to control for academic ability prior to exposure to the Advanced Placement Program. The PSAT/NMSQT consists of three sections: critical reading, mathematics, and writing, which are each reported on a 20- to 80-point scale. In order to prevent contamination of AP effects, we used students’ most recent PSAT/NMSQT score before each student took his or her first AP Exam. Because the PSAT/NMSQT is administered in October and AP Exams are administered in May, we considered a PSAT/NMSQT score taken in the same academic year as “before” AP exposure, as students would only have been exposed to roughly six weeks of content. In addition to PSAT/NMSQT scores, a student’s self-reported high school GPA (HSGPA) was also available from that student’s PSAT/NMSQT registration and put on a 0- to 4.33-point scale for subsequent analysis.
Academic interests. Because we anticipated that the choice to participate in a given AP Exam would be related to students’ academic interests, we endeavored to control for those interests. In particular, we used students’ self-reported college major category in which they were most interested, at the time of PSAT/NMSQT registration. We did not necessarily anticipate that this indicator — collected during students’ sophomore or junior year of high school — would reliably predict the undergraduate major that students chose, but rather expected that such interest would align with the more contemporary choice of high school course work.
High school characteristics. The College Board surveys Advanced Placement site (i.e., school or district) coordinators to ascertain the number of students enrolled in each AP course offered at each high school. The data from the 2004-05 and 2005-06 academic years — which corresponded to our students’ junior and senior years in high school — were averaged, and missing data on the surveys were presumed to indicate that enrollment in the particular AP Exam was zero. This average enrollment for each AP course was used to inform the opportunities that students may or may not have had to participate in each AP. This variable and a high school identifying variable were included in the propensity score models, as we expected AP participation rates to vary with students’ opportunity to enroll and other unmeasured high school level variables.
Analyses
The first step in creating the AP and non-AP groups was to identify the introductory courses for which AP students could earn credit or advanced placement, with the second step being to identify the subsequent courses that were taken after the introductory course(s). More specifically, the AP group was made up of AP students with qualifying exam scores who did not take the corresponding introductory course in college but who did take a subsequent course in the subject area of the exam; the non-AP group was made up of students who took both the introductory course and a subsequent course in the subject area of the exam. Thus we need both the list of introductory and subsequent courses for each AP Exam.
Identification of introductory course equivalents. Our two main sources for identifying introductory courses and determining AP credit or advanced placement policies were (1) the results from a 2008 College Board survey of postsecondary institutions; and (2) a review of course catalogs and college websites. Of the 66 institutions that provided data to the College Board, there were 53 with an introductory course policy available for at least one AP Exam. For the College Board survey, respondents were asked to report the minimum AP score needed on each AP Exam for students to receive credit, advanced placement, or both, as well as the name and course code of the introductory course(s) out of which students could place, given the required minimum score. Course codes provided by institutions were validated by
12 College Board Research Reports
AP Exam Validity for Placement
manually comparing courses from the survey responses with the data file that was the main source of data. There were slight differences, say, if a respondent designated “English 201” as the introductory course, when “ENGL 201” was what actually appeared in the data, and it is possible that survey respondents may have specified a course that simply was not taken by any students in our sample.
Table 1.Summary of Colleges’ AP Introductory Credit- and Placement-Granting Policies
Colleges Granting Credit/Placement for an AP Exam Score of at Least…Total
CollegesAP Exam 1 2 3 4 5
Calculus AB 0 1 33 17 0 51
Calculus BC 2 1 39 9 0 51
Computer Science A 0 0 18 21 2 41
Biology 0 0 19 18 5 42
Chemistry 0 0 23 21 3 47
Physics B 0 0 18 18 1 37
Physics: C: Mechanics 0 0 16 19 1 36
Microeconomics 0 0 24 18 1 43
Macroeconomics 0 0 25 16 1 42
Psychology 0 0 22 20 2 44
United States Government and Politics
0 0 21 21 2 44
United States History 0 0 18 24 0 42
English Language and Composition
0 0 19 21 0 40
English Literature and Composition
0 0 16 21 1 38
Spanish Language 0 0 28 11 1 40
Note: Minimum AP Exam scores for which either (a) credit for was granted for at least one course; or (b) examinees may have placed out of at least one course.
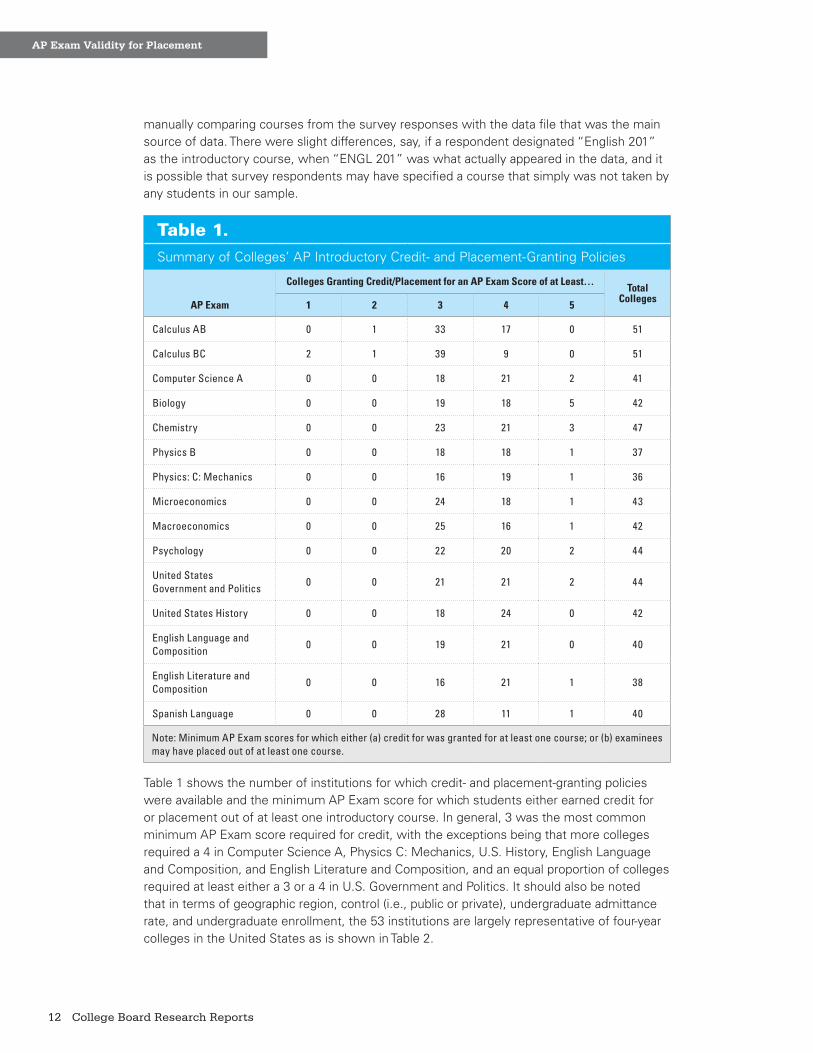
Table 1 shows the number of institutions for which credit- and placement-granting policies were available and the minimum AP Exam score for which students either earned credit for or placement out of at least one introductory course. In general, 3 was the most common minimum AP Exam score required for credit, with the exceptions being that more colleges required a 4 in Computer Science A, Physics C: Mechanics, U.S. History, English Language and Composition, and English Literature and Composition, and an equal proportion of colleges required at least either a 3 or a 4 in U.S. Government and Politics. It should also be noted that in terms of geographic region, control (i.e., public or private), undergraduate admittance rate, and undergraduate enrollment, the 53 institutions are largely representative of four-year colleges in the United States as is shown in Table 2.

13College Board Research Reports
AP Exam Validity for Placement
Table 2.Summary of Institutional Characteristics
Institutional Characteristic %
U.S. Region Midwest 13.2
Mid-Atlantic 15.1
New England 15.1
South 15.1
Southwest 13.2
West 28.3
Control Public 43.4
Private 56.6
AdmittanceRate
Under 50% 18.9
50% to 75% 56.6
Over 75% 24.5
Undergraduate Enrollment Small 15.1
Medium 39.6
Large 22.6
Very large 22.6
Note: Percentages may not sum to 100 because of rounding. Undergraduate enrollment was categorized as follows: small = 750 to 1,999; medium = 2,000 to 7,499; large = 7,500 to 14,999; and very large = 15,000 or more.
We also reviewed individual course catalogs to identify any courses that were considered equivalent to those for which credit or advanced placement would be granted on the basis of AP Exam scores. For example, a college may have indicated that a student who earned a score of 4 on the AP Calculus AB Exam would be granted credit for the first semester of calculus and analytic geometry (Math 120). That same college may offer other first-semester calculus courses, such as Calculus 1 for business (Math 110), Calculus 1 for social science majors (Math 115), etc., which all cover the first semester of single-variable calculus. Indeed, the college’s course catalog may even state that credit may be granted for only one of Math 110, Math 115, and Math 120. In some cases, a college may offer honors sections of courses that are otherwise identical to the course for which credit or advanced placement is granted. In such cases, we added the equivalent courses (e.g., Math 110 and Math 115) to the list of official introductory courses (e.g., Math 120) for the selection of both the AP and non-AP groups.
Identification of subsequent courses. Because students may have taken one of a subset of possible introductory courses that could have been followed by one of many possible subsequent courses, we took an empirical approach to the identification of subsequent courses. We first generated a list of possible subsequent courses for each AP Exam by determining the range of subsequent courses taken by AP students who placed out of all introductory courses and non-AP students who took at least one introductory course. Then we limited these courses to those that appeared in the college department — or in some cases other, related departments — for which students could earn credit or advanced placement and checked to make sure that both AP and non-AP students also enrolled in the course. After that, we reviewed the description of any course
14 College Board Research Reports
AP Exam Validity for Placement
whose title did not clearly imply that it should follow naturally from the introductory course(s). In particular, we wanted to ensure that it truly was a subsequent course and not, for example, a course that might be considered equivalent to the introductory course for which students could be exempted or something altogether different, such as a statistics course when we were analyzing AP Calculus AB.
There were a few AP Exams for which we broadened the scope of the list of possible subsequent courses. For AP Biology, we included courses in anatomy, physiology, and animal science because some institutions offer these courses through separate departments, while others offer them through the biology department. When reviewing AP Chemistry subsequent courses, we also looked at the department of engineering to get at chemical engineering courses. For the two AP Physics Exams that we analyzed — Physics B and Physics C: Mechanics — we considered subsequent courses offered in the department of engineering to get at relevant mechanical, civil, and electrical engineering courses. In looking at possible subsequent courses for AP Computer Science A, we included the department of engineering to get at computer and possibly electrical engineering courses. Finally, after reviewing course-taking patterns, it became apparent that some institutions may have offered subsequent courses to the AP Exams in English — English Language and Composition, and English Literature and Composition — through departments of writing, composition, rhetoric, and comparative literature, so they too were included as candidates for empirical subsequent courses.
Selection of student sample. Course-level sample restrictions differed slightly for AP and non-AP students. Because our main comparison group was non-AP students who took at least one introductory course and who went on to complete a subsequent course in the AP Exam subject area, we only considered subsequent courses that non-AP students took in the first term after the latest introductory course. We did not require that the subsequent course be taken immediately after the last introductory course, but rather that it occur in some later term. For AP students, we limited the sample of subsequent courses to those that students took in the earliest term. Again, this was not necessarily the very first term the student was enrolled at the institution but rather the earliest term in which subsequent courses for the relevant AP Exam were taken. In the uncommon case in which multiple subsequent courses were taken in the same term, the course that was taken for the highest credit and whose course label and name appeared first when sorted was analyzed. In other words, for the same term, a three-credit course would be selected over a one-credit course, and among courses worth equal numbers of credits, History 101, for example, would be selected over History 304.
Propensity score–matched comparisons. Comparing mean subsequent course performance between all AP and all non-AP students would invite readers to infer that the observed differences in
The goal of propensity
score matching was
to identify students
who took the same
subsequent course and
who we anticipated
were about as likely
to have taken the AP
Exam, while in truth
one took the AP Exam
and the other did not.
15College Board Research Reports
AP Exam Validity for Placement
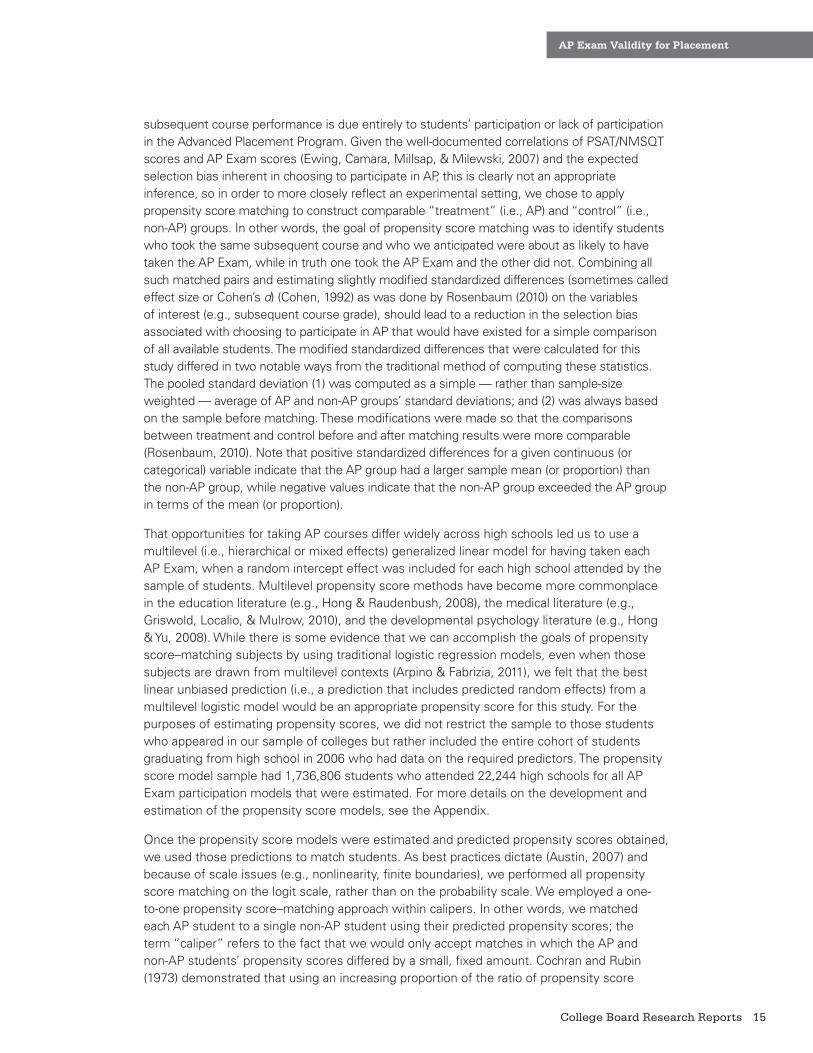
subsequent course performance is due entirely to students’ participation or lack of participation in the Advanced Placement Program. Given the well-documented correlations of PSAT/NMSQT scores and AP Exam scores (Ewing, Camara, Millsap, & Milewski, 2007) and the expected selection bias inherent in choosing to participate in AP, this is clearly not an appropriate inference, so in order to more closely reflect an experimental setting, we chose to apply propensity score matching to construct comparable “treatment” (i.e., AP) and “control” (i.e., non-AP) groups. In other words, the goal of propensity score matching was to identify students who took the same subsequent course and who we anticipated were about as likely to have taken the AP Exam, while in truth one took the AP Exam and the other did not. Combining all such matched pairs and estimating slightly modified standardized differences (sometimes called effect size or Cohen’s d) (Cohen, 1992) as was done by Rosenbaum (2010) on the variables of interest (e.g., subsequent course grade), should lead to a reduction in the selection bias associated with choosing to participate in AP that would have existed for a simple comparison of all available students. The modified standardized differences that were calculated for this study differed in two notable ways from the traditional method of computing these statistics. The pooled standard deviation (1) was computed as a simple — rather than sample-size weighted — average of AP and non-AP groups’ standard deviations; and (2) was always based on the sample before matching. These modifications were made so that the comparisons between treatment and control before and after matching results were more comparable (Rosenbaum, 2010). Note that positive standardized differences for a given continuous (or categorical) variable indicate that the AP group had a larger sample mean (or proportion) than the non-AP group, while negative values indicate that the non-AP group exceeded the AP group in terms of the mean (or proportion).
That opportunities for taking AP courses differ widely across high schools led us to use a multilevel (i.e., hierarchical or mixed effects) generalized linear model for having taken each AP Exam, when a random intercept effect was included for each high school attended by the sample of students. Multilevel propensity score methods have become more commonplace in the education literature (e.g., Hong & Raudenbush, 2008), the medical literature (e.g., Griswold, Localio, & Mulrow, 2010), and the developmental psychology literature (e.g., Hong & Yu, 2008). While there is some evidence that we can accomplish the goals of propensity score–matching subjects by using traditional logistic regression models, even when those subjects are drawn from multilevel contexts (Arpino & Fabrizia, 2011), we felt that the best linear unbiased prediction (i.e., a prediction that includes predicted random effects) from a multilevel logistic model would be an appropriate propensity score for this study. For the purposes of estimating propensity scores, we did not restrict the sample to those students who appeared in our sample of colleges but rather included the entire cohort of students graduating from high school in 2006 who had data on the required predictors. The propensity score model sample had 1,736,806 students who attended 22,244 high schools for all AP Exam participation models that were estimated. For more details on the development and estimation of the propensity score models, see the Appendix.
Once the propensity score models were estimated and predicted propensity scores obtained, we used those predictions to match students. As best practices dictate (Austin, 2007) and because of scale issues (e.g., nonlinearity, finite boundaries), we performed all propensity score matching on the logit scale, rather than on the probability scale. We employed a one-to-one propensity score–matching approach within calipers. In other words, we matched each AP student to a single non-AP student using their predicted propensity scores; the term “caliper” refers to the fact that we would only accept matches in which the AP and non-AP students’ propensity scores differed by a small, fixed amount. Cochran and Rubin (1973) demonstrated that using an increasing proportion of the ratio of propensity score

16 College Board Research Reports
AP Exam Validity for Placement
variance between treatment and control units to construct calipers led to a reduction in the magnitude of bias in the estimate of the treatment effect. In other words, as the caliper size was reduced, so too was the expected bias of the treatment effect in the resulting matched sample. Recently, Austin (2009) performed Monte Carlo studies and reported that a caliper of 0.2 or 0.6 times the pooled standard deviation of the propensity score led to acceptable matched results, and as such, we selected the more conservative caliper size of 0.2 times the sample standard deviation of the propensity score.
Because the colleges in our sample varied in their credit- and placement-granting policies, we placed an additional restriction on the propensity score–matching procedure. Those varied credit- and placement-granting policies naturally led to differences in the subsequent courses that would follow from the courses for which successful AP Exam takers were granted credit or advanced placement. This possible heterogeneity in the content coverage and level of difficulty among subsequent courses led us to restrict matched pairs of AP and non-AP students to those who completed the same subsequent course in college. In other words, matched pairs of AP and non-AP students must have taken the same subsequent course in order for a meaningful comparison of subsequent course performance to be made. In particular, we conditioned on students (a) having been included in the propensity score–model sample described previously; and (b) falling into either the AP group, in which they (1) took the AP Exam; (2) earned a sufficiently high score to be granted college credit or advanced placement; and (3) placed out of the introductory course; or the non-AP group, in which they (1) did not take the AP Exam; and (2) took at least one introductory course before the subsequent course. Students in other groups — such as those non-AP students who placed out of the introductory course for some unobserved reason or AP students who earned a sufficient score for credit but who instead took the introductory course anyway — were beyond the scope of this study and, hence, were excluded.
ResultsSelection of AP Exams for Presentation
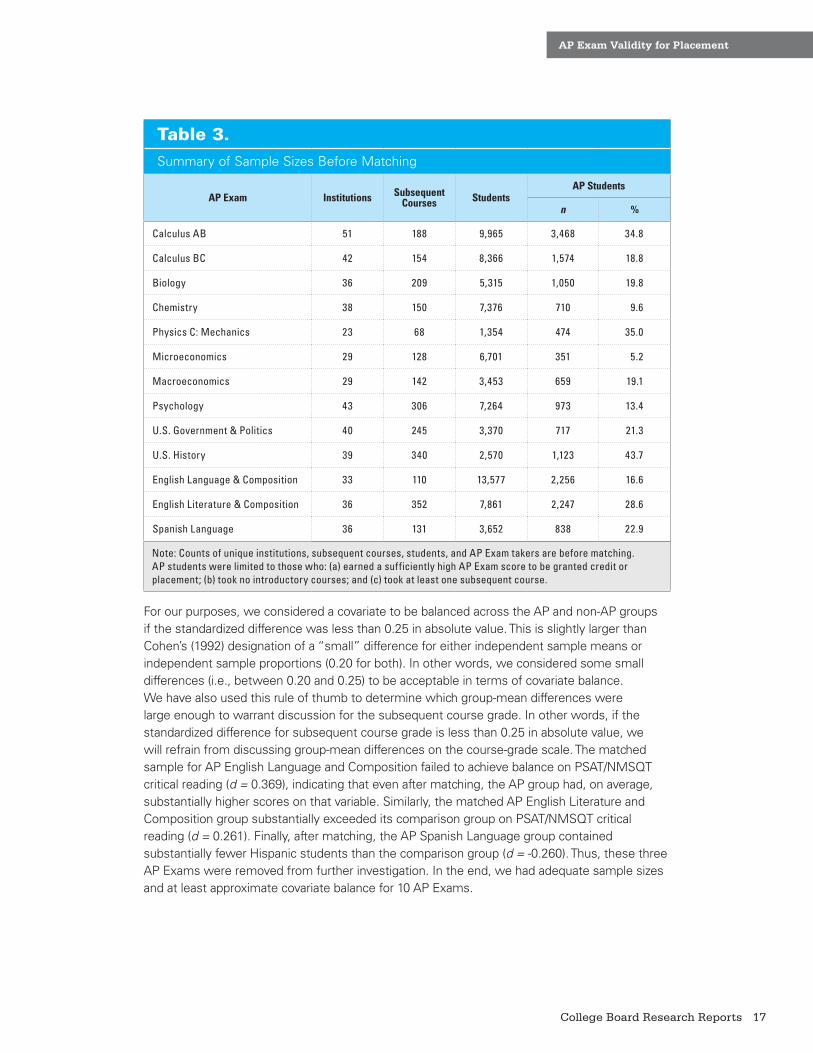
Beginning with the 15 possible AP Exams that we considered in this study, we estimated the propensity score models (for more information on the propensity score models, see the Appendix), applied the matching algorithm, and reviewed the results. For two exams — Computer Science A and Physics B — the matched samples were too small to report on, with only 41 and 65 matched pairs, respectively. To put those sample sizes into context, for testing covariate mean and proportion differences, they were too small to detect standardized differences of 0.50 with a power of .80 and a significance level of .01 (Cohen, 1992). Table 3 shows the sample sizes of the remaining 13 exams that all had adequate sample sizes — with at least 200 matched pairs for each one. Sample size alone is not sufficient to ensure that the matched samples are balanced, so that must be considered for the covariates of interest across the 13 remaining AP Exams.
17College Board Research Reports
AP Exam Validity for Placement
Table 3.Summary of Sample Sizes Before Matching
AP Exam Institutions Subsequent Courses Students
AP Students
n %
Calculus AB 51 188 9,965 3,468 34.8
Calculus BC 42 154 8,366 1,574 18.8
Biology 36 209 5,315 1,050 19.8
Chemistry 38 150 7,376 710 9.6
Physics C: Mechanics 23 68 1,354 474 35.0
Microeconomics 29 128 6,701 351 5.2
Macroeconomics 29 142 3,453 659 19.1
Psychology 43 306 7,264 973 13.4
U.S. Government & Politics 40 245 3,370 717 21.3
U.S. History 39 340 2,570 1,123 43.7
English Language & Composition 33 110 13,577 2,256 16.6
English Literature & Composition 36 352 7,861 2,247 28.6
Spanish Language 36 131 3,652 838 22.9
Note: Counts of unique institutions, subsequent courses, students, and AP Exam takers are before matching. AP students were limited to those who: (a) earned a sufficiently high AP Exam score to be granted credit or placement; (b) took no introductory courses; and (c) took at least one subsequent course.
For our purposes, we considered a covariate to be balanced across the AP and non-AP groups if the standardized difference was less than 0.25 in absolute value. This is slightly larger than Cohen’s (1992) designation of a “small” difference for either independent sample means or independent sample proportions (0.20 for both). In other words, we considered some small differences (i.e., between 0.20 and 0.25) to be acceptable in terms of covariate balance. We have also used this rule of thumb to determine which group-mean differences were large enough to warrant discussion for the subsequent course grade. In other words, if the standardized difference for subsequent course grade is less than 0.25 in absolute value, we will refrain from discussing group-mean differences on the course-grade scale. The matched sample for AP English Language and Composition failed to achieve balance on PSAT/NMSQT critical reading (d = 0.369), indicating that even after matching, the AP group had, on average, substantially higher scores on that variable. Similarly, the matched AP English Literature and Composition group substantially exceeded its comparison group on PSAT/NMSQT critical reading (d = 0.261). Finally, after matching, the AP Spanish Language group contained substantially fewer Hispanic students than the comparison group (d = -0.260). Thus, these three AP Exams were removed from further investigation. In the end, we had adequate sample sizes and at least approximate covariate balance for 10 AP Exams.

18 College Board Research Reports
AP Exam Validity for Placement
Subsequent Mathematics Course Performance
Figure 1.Standardized differences for AP Calculus AB and non-AP students.
-0.25
0.00
0.25
0.50
0.75
1.00
1.25
1.50
Stan
dard
ized
Diff
eren
ce (d
)
Before Matching
After Matching
Prop.Score
HSGPA P/N CR P/N M P/N W Female Black Hispanic CourseGrade
Note: P/N = PSAT/NMSQT; CR = critical reading; M = mathematics; and W = writing. Positive values favor the AP group, while negative values favor the comparison group. Before matching, AP Calculus AB and non-AP group sizes were 3,468 and 6,497, respectively. After matching, both group sizes were reduced to 1,733 each across 104 subsequent courses at 45 colleges and universities.
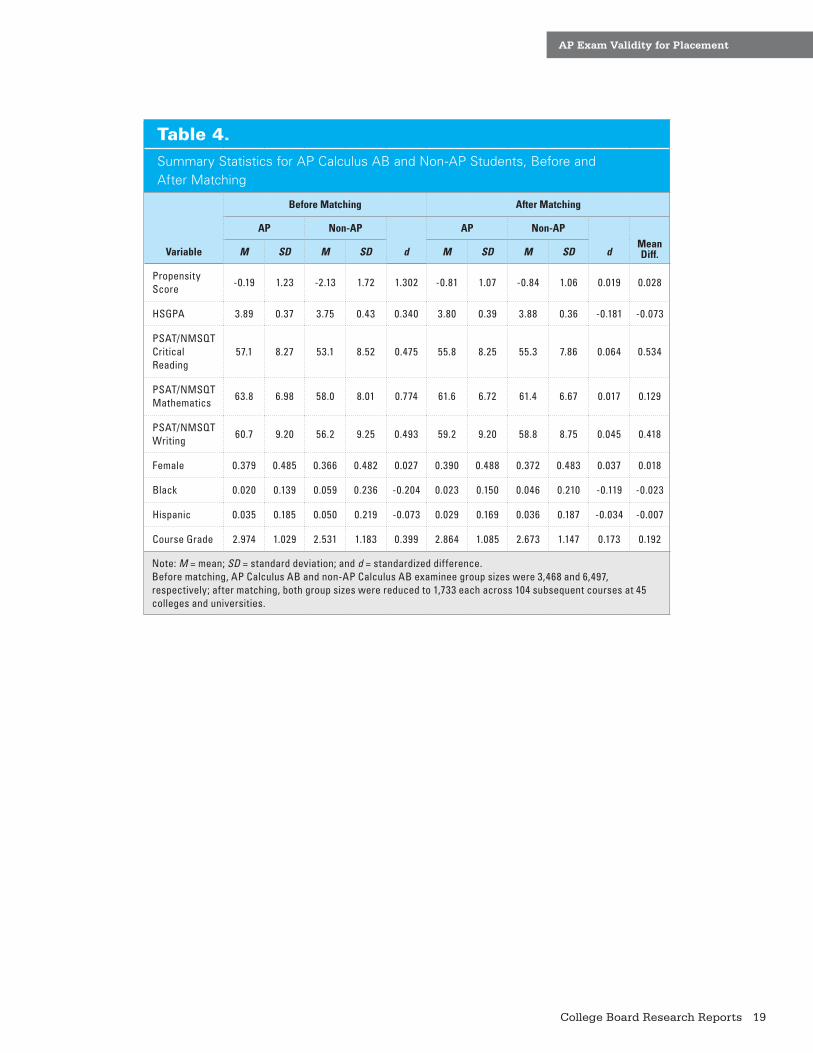
Calculus AB. Before matching, the sample of AP Calculus AB subsequent course takers contained 3,468 AP students and 6,497 non-AP students. Figure 1 graphically demonstrates the reduction in absolute magnitude of standardized differences on the covariates from the unmatched to the propensity score–matched sample comparisons. The AP and non-AP groups differed substantially on the four academic characteristics of interest — namely, high school GPA (HSGPA; d = 0.340) and the PSAT/NMSQT critical reading (d = 0.475), mathematics (d = 0.774), and writing sections (d = 0.493) — with standardized differences of greater than 0.25 for each covariate, indicating substantially different means. After applying the propensity score–matching method described, we were left with 1,733 students each in the AP and non-AP groups, and the standardized differences for the matched groups did not exceed our rule of thumb of 0.25 in absolute value. In other words, the AP and non-AP groups were balanced (i.e., comparable) on HSGPA and the PSAT/NMSQT critical reading, mathematics, and writing sections and in terms of the proportion of female, black, and Hispanic students. After matching, the standardized difference for subsequent course grade was 0.173, indicating comparable performance between the AP Calculus AB and non-AP groups who were matched within 104 subsequent courses offered at 45 colleges and universities. Table 4 shows more detail in terms of the summary statistics that went into the estimation of the standardized differences, both before and after matching.
19College Board Research Reports
AP Exam Validity for Placement
Table 4.Summary Statistics for AP Calculus AB and Non-AP Students, Before and After Matching
Variable
Before Matching After Matching
AP Non-AP
d
AP Non-AP
dMean Diff.M SD M SD M SD M SD
Propensity Score
-0.19 1.23 -2.13 1.72 1.302 -0.81 1.07 -0.84 1.06 0.019 0.028
HSGPA 3.89 0.37 3.75 0.43 0.340 3.80 0.39 3.88 0.36 -0.181 -0.073
PSAT/NMSQT Critical Reading
57.1 8.27 53.1 8.52 0.475 55.8 8.25 55.3 7.86 0.064 0.534
PSAT/NMSQT Mathematics
63.8 6.98 58.0 8.01 0.774 61.6 6.72 61.4 6.67 0.017 0.129
PSAT/NMSQT Writing
60.7 9.20 56.2 9.25 0.493 59.2 9.20 58.8 8.75 0.045 0.418
Female 0.379 0.485 0.366 0.482 0.027 0.390 0.488 0.372 0.483 0.037 0.018
Black 0.020 0.139 0.059 0.236 -0.204 0.023 0.150 0.046 0.210 -0.119 -0.023
Hispanic 0.035 0.185 0.050 0.219 -0.073 0.029 0.169 0.036 0.187 -0.034 -0.007
Course Grade 2.974 1.029 2.531 1.183 0.399 2.864 1.085 2.673 1.147 0.173 0.192
Note: M = mean; SD = standard deviation; and d = standardized difference.Before matching, AP Calculus AB and non-AP Calculus AB examinee group sizes were 3,468 and 6,497, respectively; after matching, both group sizes were reduced to 1,733 each across 104 subsequent courses at 45 colleges and universities.

20 College Board Research Reports
AP Exam Validity for Placement
Figure 2.Standardized differences for AP Calculus BC and non-AP students.
-0.25
0.00
0.25
0.50
0.75
1.00
1.25
1.50
1.75
2.00
2.25
Before Matching
After Matching
Prop.Score
HSGPA P/N CR P/N M P/N W Female Black Hispanic CourseGrade
Note: P/N = PSAT/NMSQT; CR = critical reading; M = mathematics; and W = writing. Positive values favor the AP group, while negative values favor the comparison group. Before matching, AP Calculus BC and non-AP group sizes were 1,574 and 6,792, respectively. After matching, both group sizes were reduced to 750 each across 69 subsequent courses at 39 colleges and universities.
Calculus BC. Before matching students, there were 1,574 AP Calculus BC students and 6,792 students who did not take the exam in AP Calculus BC. Figure 2 shows that the unmatched AP Calculus BC group substantially outperformed the non-AP group in terms of PSAT/NMSQT mathematics (d = 1.001), critical reading (d = 0.624), and writing (d = 0.561) — see also Table 5. Once the AP group was matched to comparable non-AP students for Calculus BC, the 750 matched pairs of students did not differ substantially (|d| ≤ 0.117) on any of the covariates of interest. By the same rule of thumb used to determine approximate balance on the covariates (i.e., d < 0.250), the matched samples did not substantially differ in terms of subsequent course performance (d = 0.218). In other words, AP Calculus BC students were expected to have performed similarly in 69 subsequent courses at 39 colleges and universities to their matched, non-AP student sample in terms of course grade. As Figure 2 presents the results of the propensity score–matching procedure graphically, Table 5 presents them numerically and in greater detail.

21College Board Research Reports
AP Exam Validity for Placement
Table 5.Summary Statistics for AP Calculus BC and Non-AP Students, Before and After Matching
Variable
Before Matching After Matching
AP Non-AP
d
AP Non-AP
dMean Diff.M SD M SD M SD M SD
Propensity Score
-0.13 1.64 -4.70 2.71 2.041 -1.06 1.35 -1.12 1.31 0.026 0.059
HSGPA 3.91 0.34 3.84 0.39 0.206 3.83 0.36 3.87 0.34 -0.101 -0.037
PSAT/NMSQT Critical Reading
59.5 8.33 54.4 8.26 0.624 57.7 8.13 57.4 7.89 0.045 0.372
PSAT/NMSQT Mathematics
67.4 6.93 60.1 7.62 1.001 64.5 6.58 65.3 6.42 -0.108 -0.785
PSAT/NMSQT Writing
62.8 9.06 57.7 9.18 0.561 61.1 9.05 60.9 8.90 0.023 0.208
Female 0.301 0.458 0.338 0.473 -0.082 0.345 0.475 0.291 0.454 0.117 0.055
Black 0.017 0.127 0.055 0.228 -0.209 0.024 0.153 0.040 0.196 -0.087 -0.016
Hispanic 0.029 0.168 0.046 0.209 -0.088 0.031 0.172 0.035 0.183 -0.021 -0.004
Course Grade
3.130 0.996 2.745 1.108 0.365 2.977 1.048 2.748 1.084 0.218 0.229
Note: M = mean; SD = standard deviation; and d = standardized difference. Before matching, AP Calculus BC and non-AP Calculus BC examinee group sizes were 1,574 and 6,792, respectively; after matching, both group sizes were reduced to 750 each across 69 subsequent courses at 39 colleges and universities.

22 College Board Research Reports
AP Exam Validity for Placement
Subsequent Natural Science Course Performance
Figure 3.Standardized differences for AP Biology and non-AP students.
-0.25
0.00
0.25
0.50
0.75
1.00
1.25
1.50
1.75
Stan
dard
ized
Diff
eren
ce (d
)
Before Matching
After Matching
Prop.Score
HSGPA P/N CR P/N M P/N W Female Black Hispanic CourseGrade
Note: P/N = PSAT/NMSQT; CR = critical reading; M = mathematics; and W = writing. Positive values favor the AP group, while negative values favor the comparison group. Before matching, AP Biology and non-AP group sizes were 1,050 and 4,265, respectively; after matching, both group sizes were reduced to 464 each across 76 subsequent courses at 32 colleges and universities.
Biology. As Figure 3 shows, the samples of subsequent course takers who were in the AP Biology group (n = 1,050) differed substantially from the non-AP Biology group (n = 4,265) on HSGPA (d = 0.340) and PSAT/NMSQT critical reading (d = 0.700), mathematics (d = 0.717), and writing (d = 0.674). Propensity score matching yielded 464 matched pairs of AP Biology and non-AP Biology students for comparison and after matching, there were no substantial differences on HSGPA, PSAT/NMSQT sections, or on demographic variables. It is worth noting that under the more conservative 0.20 cutoff for balance as measured by standardized differences there were slightly fewer female AP students than matched non-AP Biology students (d = -0.205). However, because we have no theoretical basis for expecting that female students who are otherwise similar on the remaining covariates would perform differently from male students, we considered this acceptable. The propensity score–matching procedure reduced bias in mean subsequent course grade, reducing the standardized difference to 0.153, which is below our criterion level for substantial differences. In terms of the subsequent course grade, Table 6 shows that AP Biology students tended to perform similarly to matched, non-AP Biology students in the 76 subsequent biology courses at 32 institutions represented by our sample.

23College Board Research Reports
AP Exam Validity for Placement
Table 6.Summary Statistics for AP Biology and Non-AP Students, Before and After Matching
Variable
Before Matching After Matching
AP Non-AP
d
AP Non-AP
dMean Diff.M SD M SD M SD M SD
Propensity Score
-0.71 1.27 -3.31 2.01 1.544 -1.20 1.14 -1.22 1.14 0.009 0.014
HSGPA 3.91 0.36 3.78 0.44 0.340 3.85 0.37 3.92 0.37 -0.163 -0.065
PSAT/NMSQT Critical Reading
58.1 8.02 52.3 8.51 0.700 57.1 8.06 55.6 7.97 0.188 1.558
PSAT/NMSQT Mathematics
61.2 7.74 55.2 8.78 0.717 60.4 7.87 59.2 8.12 0.137 1.131
PSAT/NMSQT Writing
62.0 9.01 55.8 9.36 0.674 61.0 8.99 59.2 9.44 0.200 1.838
Female 0.598 0.490 0.651 0.477 -0.110 0.575 0.494 0.675 0.469 -0.205 -0.099
Black 0.022 0.146 0.064 0.245 -0.210 0.017 0.130 0.052 0.221 -0.171 -0.034
Hispanic 0.020 0.140 0.064 0.244 -0.219 0.024 0.152 0.032 0.177 -0.043 -0.009
Course Grade
3.158 0.820 2.836 0.988 0.355 3.130 0.848 2.991 0.919 0.153 0.139
Note: M = mean; SD = standard deviation; and d = standardized difference. Before matching, AP Biology and non-AP Biology examinee group sizes were 1,050 and 4,265, respectively; after matching, both group sizes were reduced to 464 each across 76 subsequent courses at 32 colleges and universities.
24 College Board Research Reports
AP Exam Validity for Placement
Figure 4.Standardized differences for AP Chemistry and non-AP students.
-0.50
-0.25
0.00
0.25
0.50
0.75
1.00
1.25
1.50
1.75St
anda
rdiz
ed D
iffer
ence
(d)
Before Matching
After Matching
Prop.Score
HSGPA P/N CR P/N M P/N W Female Black Hispanic CourseGrade
Note: P/N = PSAT/NMSQT; CR = critical reading; M = mathematics; and W = writing. Positive values favor the AP group, while negative values favor the comparison group. Before matching, AP Chemistry and non-AP group sizes were 710 and 6,666, respectively. After matching, both group sizes were reduced to 431 each across 57 subsequent courses at 33 colleges and universities.
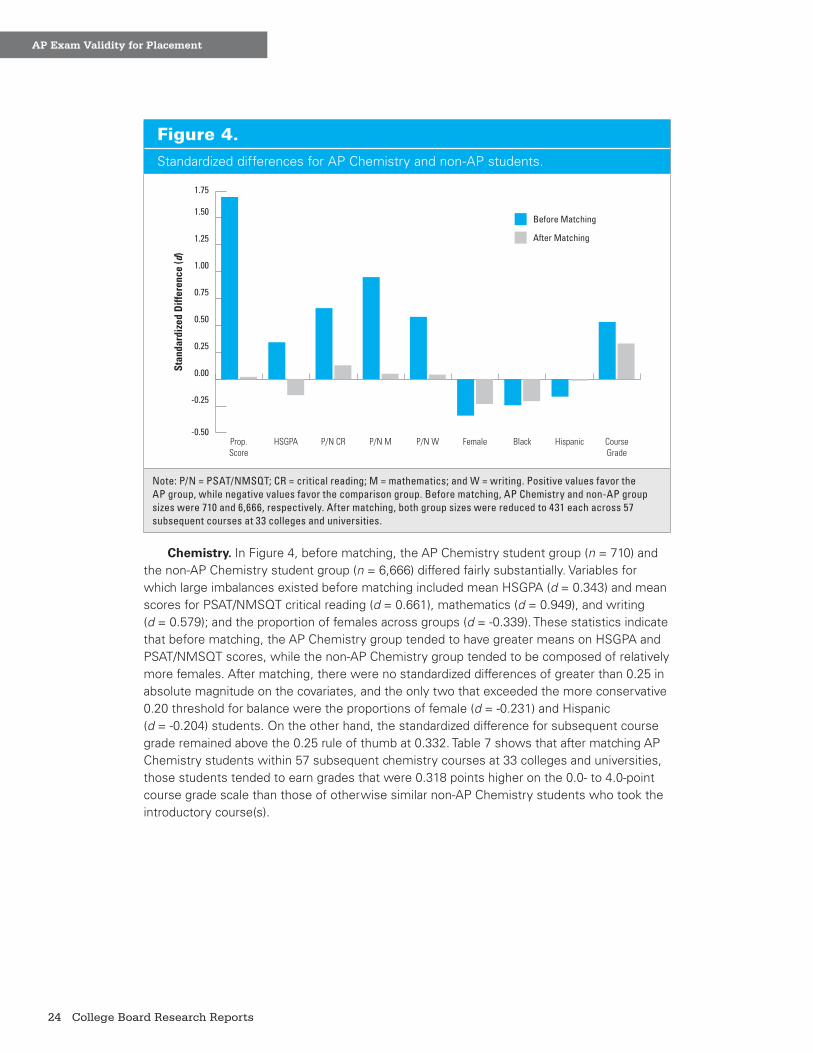
Chemistry. In Figure 4, before matching, the AP Chemistry student group (n = 710) and the non-AP Chemistry student group (n = 6,666) differed fairly substantially. Variables for which large imbalances existed before matching included mean HSGPA (d = 0.343) and mean scores for PSAT/NMSQT critical reading (d = 0.661), mathematics (d = 0.949), and writing (d = 0.579); and the proportion of females across groups (d = -0.339). These statistics indicate that before matching, the AP Chemistry group tended to have greater means on HSGPA and PSAT/NMSQT scores, while the non-AP Chemistry group tended to be composed of relatively more females. After matching, there were no standardized differences of greater than 0.25 in absolute magnitude on the covariates, and the only two that exceeded the more conservative 0.20 threshold for balance were the proportions of female (d = -0.231) and Hispanic (d = -0.204) students. On the other hand, the standardized difference for subsequent course grade remained above the 0.25 rule of thumb at 0.332. Table 7 shows that after matching AP Chemistry students within 57 subsequent chemistry courses at 33 colleges and universities, those students tended to earn grades that were 0.318 points higher on the 0.0- to 4.0-point course grade scale than those of otherwise similar non-AP Chemistry students who took the introductory course(s).

25College Board Research Reports
AP Exam Validity for Placement
Table 7.Summary Statistics for AP Chemistry and Non-AP Students, Before and After Matching
Variable
Before Matching After Matching
AP Non-AP
d
AP Non-AP
dMean Diff.M SD M SD M SD M SD
Propensity Score
-0.60 1.31 -3.53 2.07 1.694 -1.01 1.17 -1.04 1.15 0.021 0.036
HSGPA 3.98 0.34 3.85 0.40 0.343 3.93 0.35 3.99 0.32 -0.148 -0.055
PSAT/NMSQT Critical Reading
58.9 7.96 53.5 8.41 0.661 58.3 7.91 57.2 8.24 0.129 1.058
PSAT/NMSQT Mathematics
65.2 7.73 57.6 8.20 0.949 63.5 7.36 63.1 7.46 0.051 0.408
PSAT/NMSQT Writing
62.3 9.26 56.9 9.33 0.579 61.0 9.13 60.6 9.16 0.042 0.394
Female 0.389 0.487 0.556 0.497 -0.339 0.394 0.489 0.508 0.500 -0.231 -0.114
Black 0.013 0.112 0.057 0.232 -0.243 0.012 0.107 0.049 0.215 -0.204 -0.037
Hispanic 0.020 0.139 0.049 0.216 -0.162 0.023 0.151 0.026 0.158 -0.013 -0.002
Course Grade
3.147 0.887 2.637 1.026 0.532 3.108 0.928 2.790 0.992 0.332 0.318
Note: M = mean; SD = standard deviation; and d = standardized difference. Before matching, AP Chemistry and non-AP Chemistry examinee group sizes were 710 and 6,666, respectively; after matching, both group sizes were reduced to 431 each across 57 subsequent courses at 33 colleges and universities.
26 College Board Research Reports
AP Exam Validity for Placement
Figure 5.Standardized differences for AP Physics C: Mechanics and non-AP students.
-0.50
-0.25
0.00
0.25
0.50
0.75
1.00
1.25
1.50
1.75
2.00
2.25
2.50St
anda
rdiz
ed D
iffer
ence
(d)
Before Matching
After Matching
Prop.Score
HSGPA P/N CR P/N M P/N W Female Black Hispanic CourseGrade
Note: P/N = PSAT/NMSQT; CR = critical reading; M = mathematics; and W = writing. Positive values favor the AP group, while negative values favor the comparison group. Before matching, AP Physics C: Mechanics and non-AP group sizes were 410 and 5,389, respectively. After matching, both group sizes were reduced to 265 each across 46 subsequent courses at 19 colleges and universities.
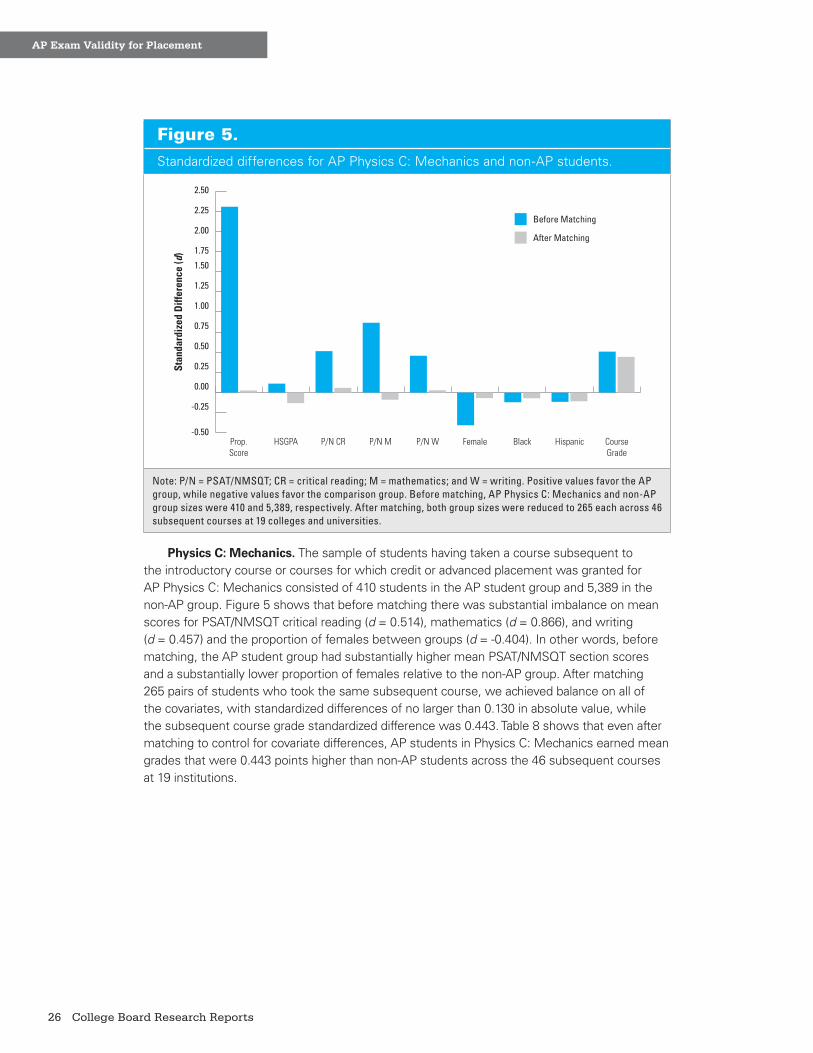
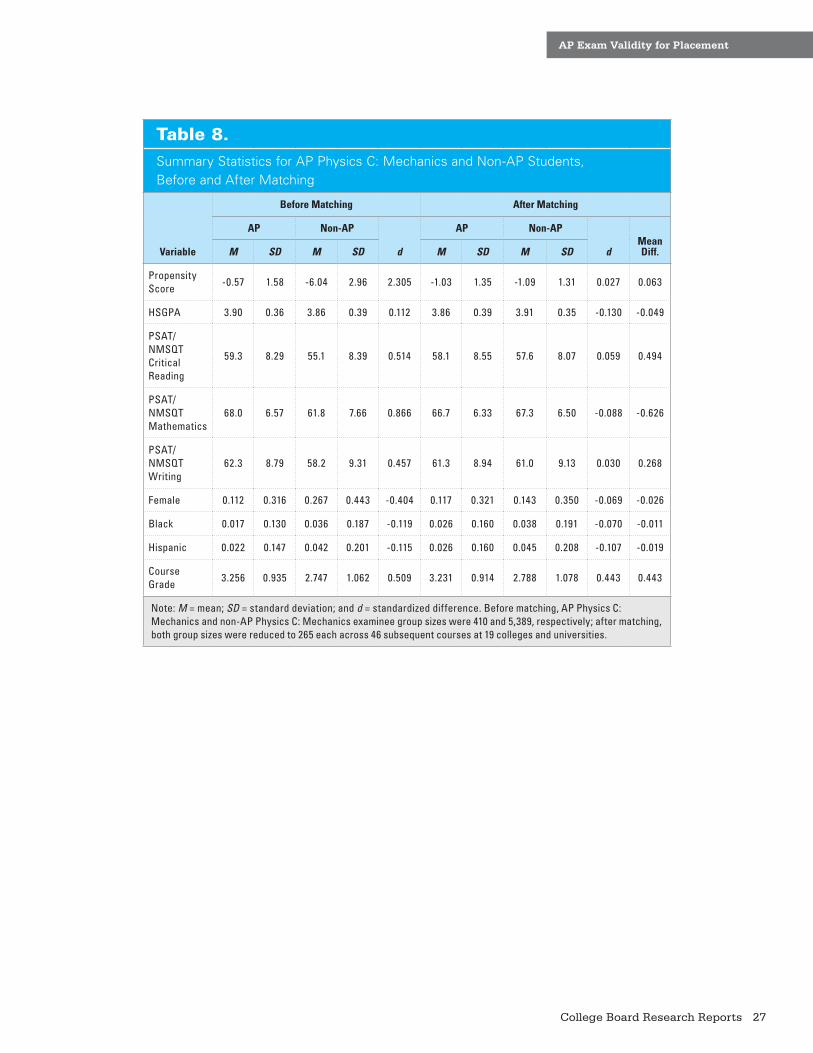
Physics C: Mechanics. The sample of students having taken a course subsequent to the introductory course or courses for which credit or advanced placement was granted for AP Physics C: Mechanics consisted of 410 students in the AP student group and 5,389 in the non-AP group. Figure 5 shows that before matching there was substantial imbalance on mean scores for PSAT/NMSQT critical reading (d = 0.514), mathematics (d = 0.866), and writing (d = 0.457) and the proportion of females between groups (d = -0.404). In other words, before matching, the AP student group had substantially higher mean PSAT/NMSQT section scores and a substantially lower proportion of females relative to the non-AP group. After matching 265 pairs of students who took the same subsequent course, we achieved balance on all of the covariates, with standardized differences of no larger than 0.130 in absolute value, while the subsequent course grade standardized difference was 0.443. Table 8 shows that even after matching to control for covariate differences, AP students in Physics C: Mechanics earned mean grades that were 0.443 points higher than non-AP students across the 46 subsequent courses at 19 institutions.
27College Board Research Reports
AP Exam Validity for Placement
Table 8.Summary Statistics for AP Physics C: Mechanics and Non-AP Students, Before and After Matching
Variable
Before Matching After Matching
AP Non-AP
d
AP Non-AP
dMean Diff.M SD M SD M SD M SD
Propensity Score
-0.57 1.58 -6.04 2.96 2.305 -1.03 1.35 -1.09 1.31 0.027 0.063
HSGPA 3.90 0.36 3.86 0.39 0.112 3.86 0.39 3.91 0.35 -0.130 -0.049
PSAT/NMSQT Critical Reading
59.3 8.29 55.1 8.39 0.514 58.1 8.55 57.6 8.07 0.059 0.494
PSAT/NMSQT Mathematics
68.0 6.57 61.8 7.66 0.866 66.7 6.33 67.3 6.50 -0.088 -0.626
PSAT/NMSQT Writing
62.3 8.79 58.2 9.31 0.457 61.3 8.94 61.0 9.13 0.030 0.268
Female 0.112 0.316 0.267 0.443 -0.404 0.117 0.321 0.143 0.350 -0.069 -0.026
Black 0.017 0.130 0.036 0.187 -0.119 0.026 0.160 0.038 0.191 -0.070 -0.011
Hispanic 0.022 0.147 0.042 0.201 -0.115 0.026 0.160 0.045 0.208 -0.107 -0.019
Course Grade
3.256 0.935 2.747 1.062 0.509 3.231 0.914 2.788 1.078 0.443 0.443
Note: M = mean; SD = standard deviation; and d = standardized difference. Before matching, AP Physics C: Mechanics and non-AP Physics C: Mechanics examinee group sizes were 410 and 5,389, respectively; after matching, both group sizes were reduced to 265 each across 46 subsequent courses at 19 colleges and universities.
28 College Board Research Reports
AP Exam Validity for Placement
Subsequent Social Science and History Course Performance
Figure 6.Standardized differences for AP Microeconomics and non-AP students.
-0.25
0.00
0.25
0.50
0.75
1.00
1.25
1.501.75
2.00
2.25
2.50
2.75
3.00
Stan
dard
ized
Diff
eren
ce (d
)
Before Matching
After Matching
Prop.Score
HSGPA P/N CR P/N M P/N W Female Black Hispanic CourseGrade
Note: P/N = PSAT/NMSQT; CR = critical reading; M = mathematics; and W = writing. Positive values favor the AP group, while negative values favor the comparison group. Before matching, AP Microeconomics and non-AP group sizes were 351 and 6,350, respectively. After matching, both group sizes were reduced to 202 each across 40 subsequent courses at 23 colleges and universities.
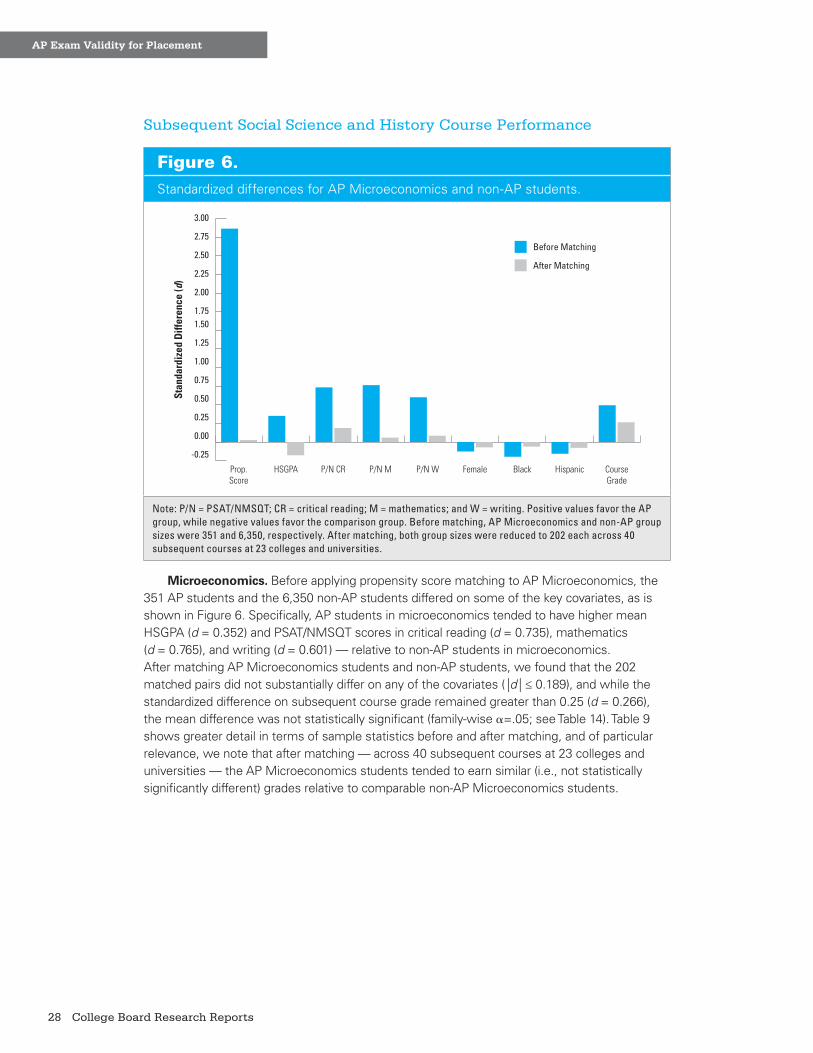
Microeconomics. Before applying propensity score matching to AP Microeconomics, the 351 AP students and the 6,350 non-AP students differed on some of the key covariates, as is shown in Figure 6. Specifically, AP students in microeconomics tended to have higher mean HSGPA (d = 0.352) and PSAT/NMSQT scores in critical reading (d = 0.735), mathematics (d = 0.765), and writing (d = 0.601) — relative to non-AP students in microeconomics. After matching AP Microeconomics students and non-AP students, we found that the 202 matched pairs did not substantially differ on any of the covariates (|d| ≤ 0.189), and while the standardized difference on subsequent course grade remained greater than 0.25 (d = 0.266), the mean difference was not statistically significant (family-wise α=.05; see Table 14). Table 9 shows greater detail in terms of sample statistics before and after matching, and of particular relevance, we note that after matching — across 40 subsequent courses at 23 colleges and universities — the AP Microeconomics students tended to earn similar (i.e., not statistically significantly different) grades relative to comparable non-AP Microeconomics students.

29College Board Research Reports
AP Exam Validity for Placement
Table 9.Summary Statistics for AP Microeconomics and Non-AP Students, Before and After Matching
Variable
Before Matching After Matching
AP Non-AP
d
AP Non-AP
dMean Diff.M SD M SD M SD M SD
Propensity Score
-0.67 1.44 -7.45 3.02 2.866 -1.16 1.13 -1.23 1.11 0.028 0.066
HSGPA 3.87 0.39 3.73 0.43 0.352 3.84 0.41 3.91 0.34 -0.177 -0.073
PSAT/NMSQT Critical Reading
59.1 8.08 53.0 8.45 0.735 58.0 7.32 56.4 8.32 0.189 1.559
PSAT/NMSQT Mathematics
63.4 7.50 57.3 8.36 0.765 62.4 7.48 61.9 7.84 0.059 0.470
PSAT/NMSQT Writing
61.9 8.68 56.5 9.25 0.601 60.9 8.87 60.2 8.91 0.084 0.752
Female 0.356 0.479 0.419 0.493 -0.128 0.391 0.488 0.426 0.494 -0.071 -0.035
Black 0.011 0.106 0.043 0.204 -0.197 0.015 0.121 0.025 0.155 -0.061 -0.010
Hispanic 0.023 0.149 0.053 0.224 -0.158 0.030 0.170 0.045 0.206 -0.078 -0.015
Course Grade
3.391 0.752 2.980 0.906 0.494 3.406 0.759 3.185 0.823 0.266 0.221
Note: M = mean; SD = standard deviation; and d = standardized difference. Before matching, AP Microeconomics and non-AP Microeconomics examinee group sizes were 351 and 6,350, respectively; after matching, both group sizes were reduced to 202 each across 40 subsequent courses at 23 colleges and universities.
30 College Board Research Reports
AP Exam Validity for Placement
Figure 7.Standardized differences for AP Macroeconomics and non-AP students.
-0.25
0.00
0.25
0.50
0.75
1.00
1.25
1.50
1.75
2.00
2.25
2.50
2.75St
anda
rdiz
ed D
iffer
ence
(d)
Before Matching
After Matching
Prop.Score
HSGPA P/N CR P/N M P/N W Female Black Hispanic CourseGrade
Note: P/N = PSAT/NMSQT; CR = critical reading; M = mathematics; and W = writing. Positive values favor the AP group, while negative values favor the comparison group. Before matching, AP Macroeconomics and non-AP group sizes were 659 and 2,794, respectively. After matching, both group sizes were reduced to 226 each across 43 subsequent courses at 21 colleges and universities.
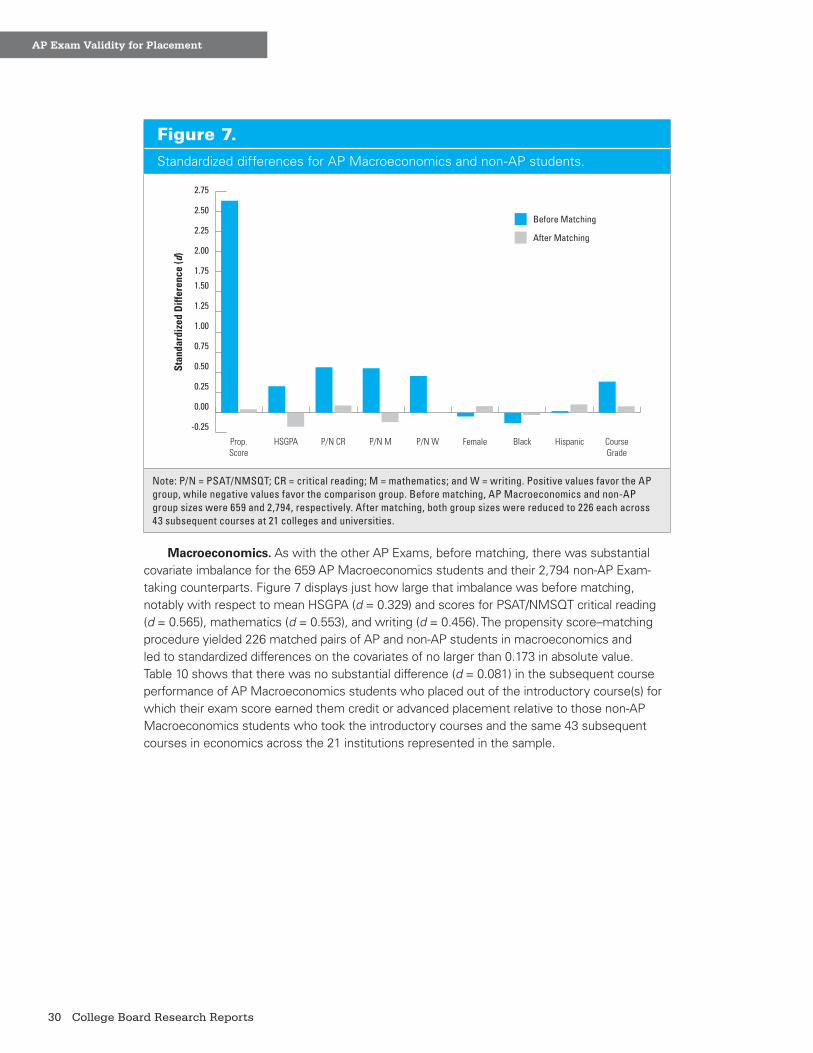
Macroeconomics. As with the other AP Exams, before matching, there was substantial covariate imbalance for the 659 AP Macroeconomics students and their 2,794 non-AP Exam-taking counterparts. Figure 7 displays just how large that imbalance was before matching, notably with respect to mean HSGPA (d = 0.329) and scores for PSAT/NMSQT critical reading (d = 0.565), mathematics (d = 0.553), and writing (d = 0.456). The propensity score–matching procedure yielded 226 matched pairs of AP and non-AP students in macroeconomics and led to standardized differences on the covariates of no larger than 0.173 in absolute value. Table 10 shows that there was no substantial difference (d = 0.081) in the subsequent course performance of AP Macroeconomics students who placed out of the introductory course(s) for which their exam score earned them credit or advanced placement relative to those non-AP Macroeconomics students who took the introductory courses and the same 43 subsequent courses in economics across the 21 institutions represented in the sample.

31College Board Research Reports
AP Exam Validity for Placement
Table 10.Summary Statistics for AP Macroeconomics and Non-AP Students, Before and After Matching
Variable
Before Matching After Matching
AP Non-AP
d
AP Non-AP
dMean Diff.M SD M SD M SD M SD
Propensity Score
-0.43 1.22 -6.69 3.14 2.629 -1.12 1.14 -1.23 1.13 0.044 0.105
HSGPA 3.87 0.36 3.75 0.43 0.329 3.75 0.38 3.82 0.36 -0.173 -0.068
PSAT/NMSQT Critical Reading
58.7 8.33 53.9 8.52 0.565 57.1 7.45 56.3 7.16 0.090 0.757
PSAT/NMSQT Mathematics
63.0 8.12 58.4 8.59 0.553 60.6 8.07 61.6 8.27 -0.116 -0.969
PSAT/NMSQT Writing
61.7 8.99 57.5 9.42 0.456 60.3 9.10 60.4 9.04 -0.002 -0.022
Female 0.366 0.482 0.388 0.487 -0.046 0.381 0.486 0.341 0.474 0.082 0.040
Black 0.018 0.134 0.039 0.194 -0.127 0.027 0.161 0.031 0.173 -0.027 -0.004
Hispanic 0.049 0.215 0.044 0.206 0.020 0.049 0.215 0.027 0.161 0.105 0.022
Course Grade
3.313 0.761 3.001 0.853 0.387 3.242 0.757 3.176 0.784 0.081 0.066
Note: M = mean; SD = standard deviation; and d = standardized difference. Before matching, AP Macroeconomics and non-AP Macroeconomics examinee group sizes were 659 and 2,794, respectively; after matching, both group sizes were reduced to 226 each across 43 subsequent courses at 21 colleges and universities.

32 College Board Research Reports
AP Exam Validity for Placement
Figure 8.Standardized differences for AP Psychology and non-AP students.
-0.25
0.00
0.25
0.50
0.75
1.00
1.25
1.50
1.75
2.00
2.25
2.50
2.75St
anda
rdiz
ed D
iffer
ence
(d)
Before Matching
After Matching
Prop.Score
HSGPA P/N CR P/N M P/N W Female Black Hispanic CourseGrade
Note: P/N = PSAT/NMSQT; CR = critical reading; M = mathematics; and W = writing. values favor the AP group, while negative values favor the comparison group. Before matching, AP Macroeconomics and non-AP group sizes were 659 and 2,794, respectively. After matching, both group sizes were reduced to 226 each across 43 subsequent courses at 21 colleges and universities.
Psychology. Before matching, there were 973 AP Psychology and 6,291 non-AP Psychology students, and Figure 8 shows that there was substantial covariate imbalance on mean HSGPA (d = 0.262) and scores for PSAT/NMSQT critical reading (d = 0.636), mathematics (d = 0.608), and writing (d = 0.551). We achieved adequate balance on all covariates (|d| ≤ 0.202) after propensity score matching 480 AP Psychology students to 480 comparable non-AP students. The proportion of female students was the only variable for which we did not meet the stricter 0.20 threshold for covariate balance in terms of standardized differences, and at –0.202, it fails to meet that level of balance. AP Psychology students performed similarly (d = 0.208) to matched, non-AP Psychology students in 124 subsequent psychology courses at 38 different colleges and universities, as is shown in Table 11.

33College Board Research Reports
AP Exam Validity for Placement
Table 11.Summary Statistics for AP Psychology and Non-AP Students, Before and After Matching.
Variable
Before Matching After Matching
AP Non-AP
d
AP Non-AP
dMean Diff.M SD M SD M SD M SD
Propensity Score
-0.75 1.11 -6.19 2.66 2.665 -1.22 1.00 -1.30 1.00 0.036 0.074
HSGPA 3.75 0.41 3.64 0.48 0.262 3.73 0.44 3.75 0.40 -0.045 -0.020
PSAT/NMSQT Critical Reading
57.3 8.15 51.9 8.66 0.636 56.8 8.86 55.6 7.93 0.141 1.188
PSAT/NMSQT Mathematics
58.3 7.99 53.0 9.12 0.608 57.9 8.40 57.1 8.32 0.097 0.831
PSAT/NMSQT Writing
60.7 8.79 55.6 9.68 0.551 59.9 9.34 59.6 8.93 0.029 0.265
Female 0.716 0.451 0.743 0.437 -0.060 0.677 0.468 0.767 0.423 -0.202 -0.090
Black 0.040 0.196 0.064 0.245 -0.109 0.046 0.209 0.056 0.230 -0.047 -0.010
Hispanic 0.047 0.212 0.060 0.237 -0.055 0.056 0.230 0.048 0.214 0.037 0.008
Course Grade
3.360 0.783 3.037 0.935 0.375 3.379 0.789 3.200 0.838 0.208 0.179
Note: M = mean; SD = standard deviation; and d = standardized difference. Before matching, AP Psychology and non-AP Psychology examinee group sizes were 973 and 6,291, respectively; after matching, both group sizes were reduced to 480 each across 124 subsequent courses at 38 colleges and universities.

34 College Board Research Reports
AP Exam Validity for Placement
Figure 9.Standardized differences for AP U.S. Government and Politics and non-AP students.
-0.25
0.00
0.25
0.50
0.75
1.00
1.25
1.50
1.75St
anda
rdiz
ed D
iffer
ence
(d)
Before Matching
After Matching
Prop.Score
HSGPA P/N CR P/N M P/N W Female Black Hispanic CourseGrade
Note: P/N = PSAT/NMSQT; CR = critical reading; M = mathematics; and W = writing. Positive values favor the AP group, while negative values favor the comparison group. Before matching, AP U.S. Government and Politics and non-AP group sizes were 717 and 2,653, respectively. After matching, both group sizes were reduced to 245 each across 64 subsequent courses at 28 colleges and universities.
U.S. Government and Politics. The sample of 717 AP students in U.S. Government and Politics had substantially greater means before matching for some of the covariates of interest, relative to the 2,653 non-AP students who took the same subsequent courses in government and politics. In particular, before matching, Figure 9 shows that the standardized differences favored the AP student group, with values of 0.291 for HSGPA, and of 0.804, 0.470, and 0.537 for PSAT/NMSQT critical reading, mathematics, and writing, respectively. Upon successfully matching 245 AP students in U.S. Government and Politics to non-AP students with similar estimated propensity scores, the standardized differences for all of the relevant covariates were reduced to no greater than 0.196 in absolute value. Even after achieving covariate balance, Table 12 shows that across 64 subsequent courses taught at 28 institutions, AP U.S. Government and Politics students had higher subsequent course grade means (d = 0.413) than non-AP students, which corresponded to a difference of 0.358 on the GPA scale.

35College Board Research Reports
AP Exam Validity for Placement
Table 12.Summary Statistics for AP U.S. Government and Politics and Non-AP Students, Before and After Matching
Variable
Before Matching After Matching
AP Non-AP
d
AP Non-AP
dMean Diff.M SD M SD M SD M SD
Propensity Score
-0.61 1.24 -4.01 2.64 1.647 -1.19 1.08 -1.24 1.06 0.023 0.046
HSGPA 3.80 0.41 3.67 0.47 0.291 3.73 0.46 3.73 0.42 0.000 0.000
PSAT/NMSQT Critical Reading
59.4 7.67 52.9 8.56 0.804 57.4 7.35 56.1 7.71 0.161 1.306
PSAT/NMSQT Mathematics
58.5 7.91 54.6 8.67 0.470 57.3 7.56 57.2 8.40 0.008 0.069
PSAT/NMSQT Writing
61.2 8.82 56.3 9.53 0.537 59.4 8.43 60.1 8.75 -0.084 -0.776
Female 0.466 0.499 0.502 0.500 -0.073 0.420 0.494 0.518 0.500 -0.196 -0.098
Black 0.031 0.172 0.052 0.221 -0.106 0.037 0.188 0.029 0.167 0.041 0.008
Hispanic 0.042 0.200 0.103 0.304 -0.239 0.057 0.232 0.102 0.303 -0.174 -0.045
Course Grade
3.384 0.703 2.849 1.003 0.619 3.359 0.777 3.002 0.916 0.413 0.358
Note: M = mean; SD = standard deviation; and d = standardized difference. Before matching, AP U.S. Government and Politics and non-AP U.S. Government and Politics examinee group sizes were 717 and 2,653, respectively; after matching, both group sizes were reduced to 245 each across 64 subsequent courses at 28 colleges and universities.

36 College Board Research Reports
AP Exam Validity for Placement
Figure 10.Standardized differences for AP U.S. History and non-AP students.
-0.25
0.00
0.25
0.50
0.75
1.00
1.25
1.50
1.75St
anda
rdiz
ed D
iffer
ence
(d)
Before Matching
After Matching
Prop.Score
HSGPA P/N CR P/N M P/N W Female Black Hispanic CourseGrade
Note: P/N = PSAT/NMSQT; CR = critical reading; M = mathematics; and W = writing. Positive values favor the AP group, while negative values favor the comparison group. Before matching, AP U.S. History and non-AP group sizes were 1,123 and 1,447, respectively. After matching, both group sizes were reduced to 234 each across 111 subsequent courses at 30 colleges and universities.
U.S. History. Figure 10 shows the disparity — before matching — between AP U.S. History students and non-AP students in terms of the covariates of interest. Specifically, the 1,123 AP students tended to have higher mean HSGPA (d = 0.672) and scores for PSAT/NMSQT critical reading (d = 1.216), mathematics (d = 0.747), and writing (d = 0.969) than did the 1,447 non-AP students. We propensity-score matched AP to non-AP students in U.S. History and achieved covariate balance between the 234 students in each group, with no standardized differences greater than 0.186 in absolute magnitude. Table 13 shows that after achieving balance on the covariates of interest, while AP U.S. History students appeared to earn substantially higher subsequent course grades (d = 0.262), the mean course grade was not statistically significantly different from the matched non-AP group across 111 different subsequent courses at 30 different colleges and universities (family-wise α = .05; see Table 14).

37College Board Research Reports
AP Exam Validity for Placement
Table 13.Summary Statistics for AP U.S. History and Non-AP Students, Before and After Matching
Variable
Before Matching After Matching
AP Non-AP
d
AP Non-AP
dMean Diff.M SD M SD M SD M SD
Propensity Score
-0.07 1.28 -2.79 2.03 1.598 -0.99 1.09 -1.01 1.08 0.009 0.015
HSGPA 3.79 0.41 3.49 0.49 0.672 3.64 0.45 3.70 0.40 -0.131 -0.060
PSAT/NMSQT Critical Reading
59.9 7.68 50.2 8.19 1.216 56.3 7.08 54.8 6.78 0.186 1.479
PSAT/NMSQT Mathematics
58.0 8.02 51.9 8.37 0.747 55.1 7.44 55.9 7.61 -0.107 -0.876
PSAT/NMSQT Writing
61.8 8.70 53.2 9.03 0.969 58.6 8.69 58.1 8.28 0.055 0.487
Female 0.494 0.500 0.475 0.499 0.039 0.479 0.500 0.513 0.500 -0.068 -0.034
Black 0.016 0.126 0.048 0.215 -0.184 0.026 0.158 0.026 0.158 0.000 0.000
Hispanic 0.034 0.181 0.048 0.213 -0.070 0.043 0.202 0.026 0.158 0.087 0.017
Course Grade
3.399 0.693 2.935 0.945 0.559 3.297 0.774 3.080 0.836 0.262 0.217
Note: M = mean; SD = standard deviation; and d = standardized difference. Before matching, AP U.S. History and non-AP U.S. History examinee group sizes were 1,123 and 1,447, respectively; after matching, both group sizes were reduced to 234 each across 111 subsequent courses at 30 colleges and universities.

38 College Board Research Reports
AP Exam Validity for Placement
Summary of Subsequent Course Performance Analyses
Figure 11.Mean subsequent course grades for AP and non-AP students, after matching.
2.25
2.50
2.75
3.00
3.25
3.50
3.75
Mea
n Su
bseq
uent
Cou
rse
Gra
de
AP
Non- AP
CalculusAB
CalculusBC
Biology Chemistry PhysicsC: Mech.
Micro-econ.
Macro-econ.
Psychol-ogy
U.S. Gov't.and Pol.
U.S.History
Note: Error bars represent the 95% confidence limits, Bonferroni-adjusted for the 20 estimated confidence intervals. For sample sizes, means, confidence limits, and standard deviations for the subsequent course grade, refer to Table 14. For information on the balance of the covariates of interest, before and after matching, refer to Tables 1 through 10.
Figure 11 and Table 14 present a summary of subsequent course performance after matching for all 10 AP Exams under consideration. In half of the AP Exams analyzed, the matched sample of AP students did not perform significantly (family-wise α = .05) differently from the comparison group; those exams were Biology, Microeconomics, Macroeconomics, Psychology, and U.S. History, in which the confidence intervals for AP and non-AP students (adjusted for multiple comparisons via the conservative Bonferroni procedure) overlapped. In other words, the AP students performed at the same level, on average, as the non-AP students. For Calculus AB and Calculus BC, despite the statistically significant difference in subsequent course grade means, they failed to meet the threshold of practical significance (i.e., d < 0.25), so we would conclude that the AP and matched non-AP examinees performed similarly in terms of subsequent course grade. For the remaining three AP Exams — Chemistry, Physics C: Mechanics, and U.S. Government and Politics — the AP group outperformed the non-AP comparison group by both a statistically and practically significant margin. It should be noted that the AP Exams for which AP students outperformed non-AP students when using statistical significance to judge the difference are in a few cases inconsistent with the results when using standardized differences. We would argue that in cases of such discrepancy, that more emphasis be placed on the standardized difference results, as they are more meaningful for college course placement decision purposes.
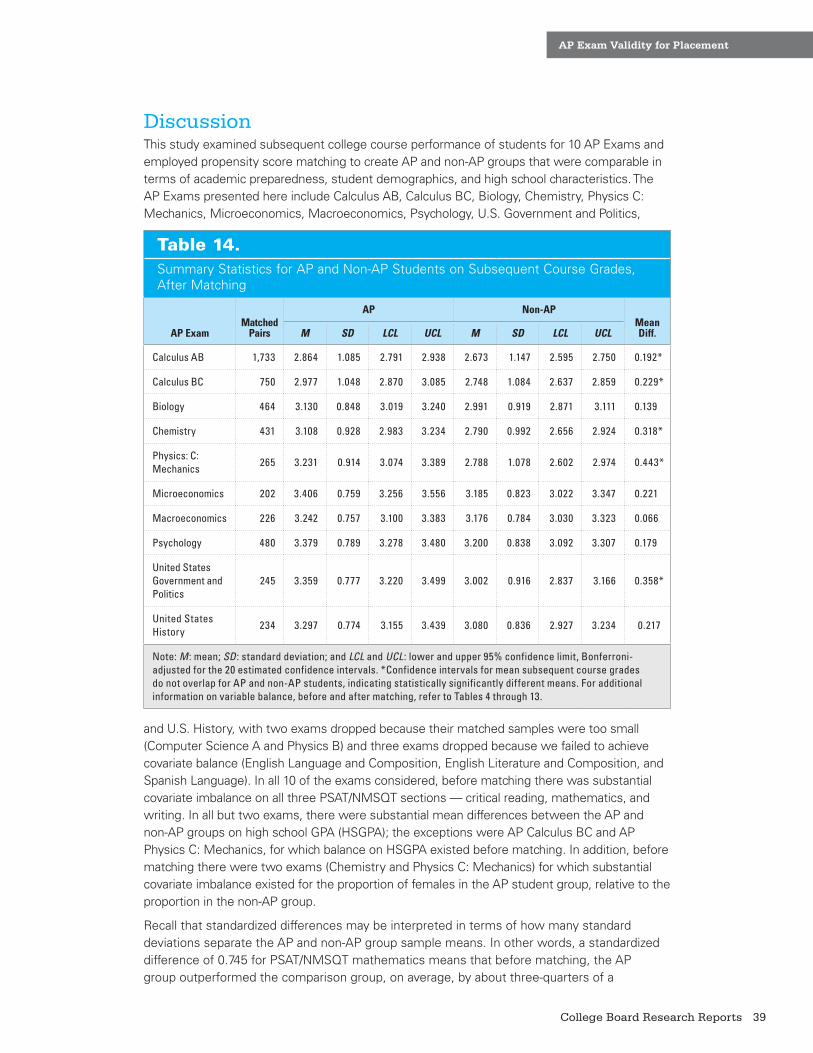
39College Board Research Reports
AP Exam Validity for Placement
DiscussionThis study examined subsequent college course performance of students for 10 AP Exams and employed propensity score matching to create AP and non-AP groups that were comparable in terms of academic preparedness, student demographics, and high school characteristics. The AP Exams presented here include Calculus AB, Calculus BC, Biology, Chemistry, Physics C: Mechanics, Microeconomics, Macroeconomics, Psychology, U.S. Government and Politics,
Table 14.Summary Statistics for AP and Non-AP Students on Subsequent Course Grades, After Matching
AP ExamMatched
Pairs
AP Non-APMean Diff.M SD LCL UCL M SD LCL UCL
Calculus AB 1,733 2.864 1.085 2.791 2.938 2.673 1.147 2.595 2.750 0.192*
Calculus BC 750 2.977 1.048 2.870 3.085 2.748 1.084 2.637 2.859 0.229*
Biology 464 3.130 0.848 3.019 3.240 2.991 0.919 2.871 3.111 0.139
Chemistry 431 3.108 0.928 2.983 3.234 2.790 0.992 2.656 2.924 0.318*
Physics: C: Mechanics
265 3.231 0.914 3.074 3.389 2.788 1.078 2.602 2.974 0.443*
Microeconomics 202 3.406 0.759 3.256 3.556 3.185 0.823 3.022 3.347 0.221
Macroeconomics 226 3.242 0.757 3.100 3.383 3.176 0.784 3.030 3.323 0.066
Psychology 480 3.379 0.789 3.278 3.480 3.200 0.838 3.092 3.307 0.179
United States Government and Politics
245 3.359 0.777 3.220 3.499 3.002 0.916 2.837 3.166 0.358*
United States History
234 3.297 0.774 3.155 3.439 3.080 0.836 2.927 3.234 0.217
Note: M : mean; SD : standard deviation; and LCL and UCL : lower and upper 95% confidence limit, Bonferroni-adjusted for the 20 estimated confidence intervals. *Confidence intervals for mean subsequent course grades do not overlap for AP and non-AP students, indicating statistically significantly different means. For additional information on variable balance, before and after matching, refer to Tables 4 through 13.
and U.S. History, with two exams dropped because their matched samples were too small (Computer Science A and Physics B) and three exams dropped because we failed to achieve covariate balance (English Language and Composition, English Literature and Composition, and Spanish Language). In all 10 of the exams considered, before matching there was substantial covariate imbalance on all three PSAT/NMSQT sections — critical reading, mathematics, and writing. In all but two exams, there were substantial mean differences between the AP and non-AP groups on high school GPA (HSGPA); the exceptions were AP Calculus BC and AP Physics C: Mechanics, for which balance on HSGPA existed before matching. In addition, before matching there were two exams (Chemistry and Physics C: Mechanics) for which substantial covariate imbalance existed for the proportion of females in the AP student group, relative to the proportion in the non-AP group.
Recall that standardized differences may be interpreted in terms of how many standard deviations separate the AP and non-AP group sample means. In other words, a standardized difference of 0.745 for PSAT/NMSQT mathematics means that before matching, the AP group outperformed the comparison group, on average, by about three-quarters of a

40 College Board Research Reports
AP Exam Validity for Placement
standard deviation on the original scale. Because we formulated the standardized differences as the mean (or proportion) difference of AP minus the comparison group, a negative standardized difference means that the comparison group was actually higher on the variable in question.
Had we simply compared the AP and comparison groups before matching, we could not have ruled out the possibility that any results were driven by the fact that the AP group tended to have higher PSAT/NMSQT scores, tended to have higher HSGPA in most cases, and/or that gender differences in the composition of the samples drove the results for two cases. Propensity score matching, however, ensured that the AP and comparison groups were comparable on those covariates that were available and judged to be important enough to control for in our analyses. Averaging across AP Exams, this procedure led to a reduction in the HSGPA standardized difference of 0.325 before matching to –0.125 in the matched sample. It also led to reductions in standardized differences for PSAT/NMSQT section scores of
0.693 before matching to 0.125 after matching for critical reading, 0.745 before matching to –0.005 after matching for mathematics, and 0.588 before matching to 0.042 after matching for writing. We also achieved better balance on the demographic indicators, reducing standardized differences of proportions from –0.118 before matching to -0.081 after matching for the female students, –0.171 before matching to –0.079 after matching for the black students, and –0.116 before matching to –0.023 after matching for the Hispanic students.
Having established that the matched samples for all 10 AP Exams were balanced with respect to the covariates of interest, we will now consider the outcome variable of interest: subsequent course performance. Mean standardized differences for the exams after matching ranged from 0.081 (for Macroeconomics) to 0.443 (for Physics C: Mechanics), with an average of 0.308. Using the rule of thumb that any standardized differences of at least 0.25 in absolute value indicate meaningful differences in terms of subsequent course performance and also checking for statistical significance, the results showed that for three of the matched samples, AP students outperformed the matched non-AP students; those samples were for Chemistry, Physics C: Mechanics, and U.S. Government and Politics. In the remaining subjects — Calculus AB, Calculus BC, Biology, Microeconomics, Macroeconomics, Psychology, and U.S. History — there was no substantial difference on the standardized difference of subsequent course grades, indicating that AP and non-AP students performed comparably. In summary, considering statistical and practical significance, for most subjects examined, the AP students performed as well as comparable non-AP students who had taken some introductory course or courses in college. In the remaining exams, the AP students outperformed students who did not take the AP Exam and did take introductory course(s) but were otherwise similar. In other words, in no exam that we studied did the AP students underperform their comparable non-AP college classmates who took at least one introductory course.
Mean standardized
differences for the
exams after matching
ranged from 0.081 (for
Macroeconomics) to
0.443 (for Physics C:
Mechanics), with an
average of 0.308.
41College Board Research Reports
AP Exam Validity for Placement
Limitations and Directions for Future Research
Despite the many strengths of the analyses presented herein, we must note a few shortcomings. First, the data on which we based the propensity score models were limited in that there was neither a variable indicating high school course taking nor any potential proxy for socioeconomic status. Thus, despite having controlled for important demographic and academic characteristics, we cannot rule out the possibility that either differential high school course-taking patterns or differences in students’ socioeconomic status could explain some portion of the difference between AP and non-AP students in terms of subsequent course performance.
It should also be noted that students may place out of introductory college courses through other mechanisms. These include succeeding on other national assessments, passing institution-specific placement tests, and transferring credits from other institutions. The scope of the data and this study, however, was limited to the Advanced Placement Program, but it is possible that the members of the non-AP groups in this study had been exposed to other advanced course work in high school, such as honors, dual enrollment, or International Baccalaureate course work. It is expected that such exposure would lead to a more capable non-AP group, on average, than no such exposure, and therefore any comparison of AP and non-AP group differences would be conservative. In other words, the effect of AP would be estimated to be smaller because some members of the non-AP group were exposed to other advanced course work.
We also note that for certain interrelated exams, we opted for a parsimonious presentation that was consistent with the treatment of other exams. For example, the AP Exams in Calculus AB and Calculus BC are naturally related, and we did not, for example, account for the fact that many of the AP Calculus BC students may have taken AP Calculus AB prior and, therefore, have benefited from exposure to content that is common across these two courses. We expect that the extent to which these dependencies affected our results was minimal because, for example, it is also possible that students matched to AP Calculus BC takers who we called non-AP students may have taken either the AP Calculus AB course or exam or both. When considering AP Microeconomics and Macroeconomics, we also note the additional complication of some colleges and universities requiring both exams in order for credit or advanced placement to be granted.
As for future research, a number of areas bear consideration. First, similar research ought to be done with the goal of including more AP Exams for which credit- and placement-granting policies are available and samples are sufficiently large. Second, while this work controlled for important student subgroups such as gender and racial/ethnic identity, this study estimated only the overall mean difference between AP and non-AP students. The next step would be to estimate the mean subsequent course grade differences for particular subgroups. For example, one could compare female AP students to female non-AP students, do the same for males, and determine whether the effect of AP Exam taking varies for males and females.
ConclusionsThe AP Program was created to provide access to rigorous, college-level curricula to motivated and prepared high school students. This study evaluated whether the AP Exam scores from the summative exams associated with 10 courses were valid for the placement of students into higher-level college courses in the subject area of the exam. Results showed that after matching AP and non-AP students on important covariates, the AP students performed as well as or better than the non-AP students in terms of subsequent college course grades.

42 College Board Research Reports
AP Exam Validity for Placement
ReferencesAkaike, H. (1974). A new look at the statistical model identification. IEEE Transactions on
Automatic Control, 19 (6), 716–723. doi:10.1109/TAC.1974.1100705
ACE. (2013). The national guide to college credit for workforce training: College Board Advanced Placement® (AP) examinations. American Council on Education, Washington, DC. Retrieved February 11, 2013, from http://www2.acenet.edu/credit/?fuseaction=browse.getOrganizationDetail&FICE=300271
American Educational Research Association (AERA), American Psychological Association (APA), & National Council on Measurement in Education (NCME). (1999). Standards for educational and psychological testing. Washington, DC: AERA, APA, and NCME.
Arpino, B., & Fabrizia, M. (2011). The specification of the propensity score in multilevel observational studies. Computational Statistics and Data Analysis, 55(4), 1770–1780. doi:10.1016/j.csda.2010.11.008
Austin, P. C. (2007). A critical appraisal of propensity-score matching in the medical literature between 1996 and 2003. Statistics in Medicine, 27, 2037–2049. doi:10.1002/sim.3150
Austin, P. C. (2009). Some methods of propensity-score matching had superior performance to others: Results of an empirical investigation and Monte Carlo simulations. Biometrical Journal, 51(1), 171–184. doi:10.1002/bimj.200810488
Burnham, P. S., & Hewitt, B. A. (1971). Advanced Placement scores: Their predictive validity. Educational and Psychological Measurement, 31, 939–945. doi:10.1177/001316447103100417
Casserly, P. L. (1986). Advanced Placement revisited (College Board Research Rep. No. 86-6). New York: The College Board. Retrieved February 11, 2013, from http://research.collegeboard.org/rr1986-6.pdf
Cizek, G. J., & Bunch, M. B. (2007). Standard setting: A guide to establishing and evaluating performance standards on tests. Thousand Oaks, CA: Sage Publications Ltd.
Cochran, W. G., & Rubin, D. B. (1973). Controlling bias in observational studies: A review. Sankhyã: The Indian Journal of Statistics, Series A, 35, 417–446.
Cohen, J. (1992). A power primer. Psychological Bulletin, 112(1), 155–159. doi:10.1037/0033-2909.112.1.155
College Board. (2007). Advanced Placement report to the nation. New York: The College Board. Retrieved February 11, 2013, from www.collegeboard.com/prod_downloads/about/news_info/ap/2007/2007_ap-report-nation.pdf
College Board. (2013). Admitted Class Evaluation Service. Retrieved February 11, 2013, from http://research.collegeboard.org/services/aces
Commenges, D., & Jaqmin, H. (1994). The intraclass correlation coefficient: Distribution-free definition and test. Biometrics, 50(2), 517–526. doi: 10.2307/2533395
Dodd, B. G., Fitzpatrick, S. J., De Ayala, R. J., & Jennings, J. A. (2002). An investigation of the validity of AP grades of 3 and a comparison of AP and non-AP student groups (College Board Research Rep. No. 2002-9). New York: The College Board. Retrieved February 11, 2013, from http://research.collegeboard.org/rr2002-9.pdf
Ewing, M., Camara, W. J., Millsap, R. E., & Milewski, G. B. (2007). Updating AP Potential™ expectancy tables involving PSAT/NMSQT® writing (College Board Research Note No. 35). New York: The College Board. Retrieved February 11, 2013, from http://research.collegeboard.org/rn2007-35.pdf

43College Board Research Reports
AP Exam Validity for Placement
Griswold, M. E., Localio, A. R., & Mulrow, C. (2010). Propensity score adjustment with multilevel data: Setting your sites on decreasing selection bias. Annals of Internal Medicine, 152(6), 393–395.
Hargrove, L., Godin, D., & Dodd, B. G. (2008). College outcomes comparisons by AP and non-AP high school experiences (College Board Research Rep. No. 2008-3). New York: The College Board. Retrieved February 11, 2013, from http://research.collegeboard.org/rr2008-3.pdf
Hong, G., & Raudenbush, S. W. (2008). Causal inference for time-varying instructional treatments. Journal of Educational and Behavioral Statistics, 33(3), 333–362. doi: 10.3102/1076998607307355
Hong, G., & Yu, B. (2008). Effects of kindergarten retention on children’s social-emotional development: An application of propensity score method to multivariate, multilevel data. Developmental Psychology, 44(2), 407–421. doi:10.1037/0012-1649.44.2.407
Kane, M. T. (2006). Validation. In R. L. Brennan (Ed.) Educational Measurement (Fourth Edition). Santa Barbara, CA: Praeger Publishing. 17–64.
Keng, L., & Dodd, B. G. (2008). A comparison of college performances of AP and non-AP student groups in 10 subject areas (College Board Research Rep. No. 2008-7). New York: The College Board. Retrieved February 11, 2013, from http://research.collegeboard.org/rr2008-7.pdf
Mattern, K. D., & Patterson, B. F. (2011). Validity of the SAT for predicting second-year grades: 2006 SAT validity sample (College Board Statistical Rep. No. 2011-1). New York: The College Board. Retrieved February 11, 2013, from http://research.collegeboard.org/sr2011-1.pdf
Morgan, R., & Crone, C. (1993). Advanced Placement examinees at the University of California: An investigation of the freshman year courses and grades of examinees in biology, calculus AB, and chemistry (Unpublished ETS Statistical Rep. No. 93-210). Princeton, NJ: Educational Testing Service.
Morgan, R., & Klaric, J. (2007). AP students in college: An analysis of five-year academic careers (College Board Research Rep. No. 2007-4). New York: The College Board. Retrieved February 11, 2013, from http://research.collegeboard.org/rr2007-4.pdf
Morgan, R., & Ramist, L. (1998). Advanced Placement students in college: An investigation of course grades at 21 colleges (Unpublished ETS Statistical Rep. No. 98-13). Princeton, NJ: Educational Testing Service.
Patterson, B. F., Packman, S., & Kobrin, J. L. (2011). Advanced Placement exam-taking and performance: Relationships with first-year subject area college grades (College Board Research Rep. No. 2011-4). New York: The College Board. Retrieved February 11, 2013, from http://research.collegeboard.org/rr2011-4.pdf
Raudenbush, S. W., & Bryk, A. S. (2002). Hierarchical Linear Models Applications and Data Analysis Methods (Advanced Quantitative Techniques in the Social Sciences Series, Second Edition). Thousand Oaks, CA: Sage Publications, Inc.
Rosenbaum, P. R. (2010). Design of observational studies. (Springer Series in Statistics). New York: Springer. doi:10.1007/978-1-4419-1213-8
Rosenbaum P. R., & Rubin D. B. (1983). The central role of the propensity score in observational studies for causal effects. Biometrika, 70, 41–55. doi:10.1093/biomet/70.1.41

44 College Board Research Reports
AP Exam Validity for Placement
Willingham, W. W., & Morris, M. (1986). Four years later: A longitudinal study of Advanced Placement students in college (College Board Research Rep. No. 86-2). New York: The College Board. Retrieved November 29, 2012, from http://research.collegeboard.org/rr1986-2.pdf
Wilcox, E. T. (1962). Seven years of advanced placement. The College Board Review, 48, 29–34.

45College Board Research Reports
Appendix
AppendixPropensity Score Models
Table A1. Student Characteristics of Propensity Score Model Sample
Student Characteristic n %
Gender
Female 937,793 54.0
Male 799,013 46.0
Racial/Ethnic Identity
American Indian or Alaska Native 13,071 0.753
Asian, Asian American, or Pacific Islander 114,687 6.60
Black or African American 241,814 13.9
Hispanic, Latino, or Latin American 209,528 12.1
White 1,091,763 62.9
Not Reported 10,045 0.578
Other 55,898 3.22
Best Spoken Language
English Only 1,271,817 73.2
English and Another Language 129,588 7.46
Another Language 36,422 2.10
Not Reported 298,979 17.2
Anticipated College Major Category
Undecided and Not Reported 313,488 18.0
Health Sciences and Services 279,214 16.1
The Arts 164,263 9.46
Business and Management 150,485 8.66
Social and Behavioral Sciences and History 146,852 8.46
Engineering 137,554 7.92
Education 79,306 4.57
Biological and Life Sciences 71,985 4.14
Architecture and Design 60,985 3.51
Communications 50,925 2.93
Public Administration and Services 43,007 2.48
Computer and Information Sciences 40,710 2.34
Home Economics 22,896 1.32
Agriculture and Natural Resources 21,607 1.24
Language and Literature 21,154 1.22
Physical Sciences 19,974 1.15
Mathematics and Statistics 14,732 0.848
Foreign and Classical Languages 11,288 0.650
Philosophy, Religion, and Theology 9,653 0.556
Area and Interdisciplinary Studies 6,404 0.369
Other 70,324 4.05
Note: Sample included 1,736,806 students who attended 22,244 high schools.
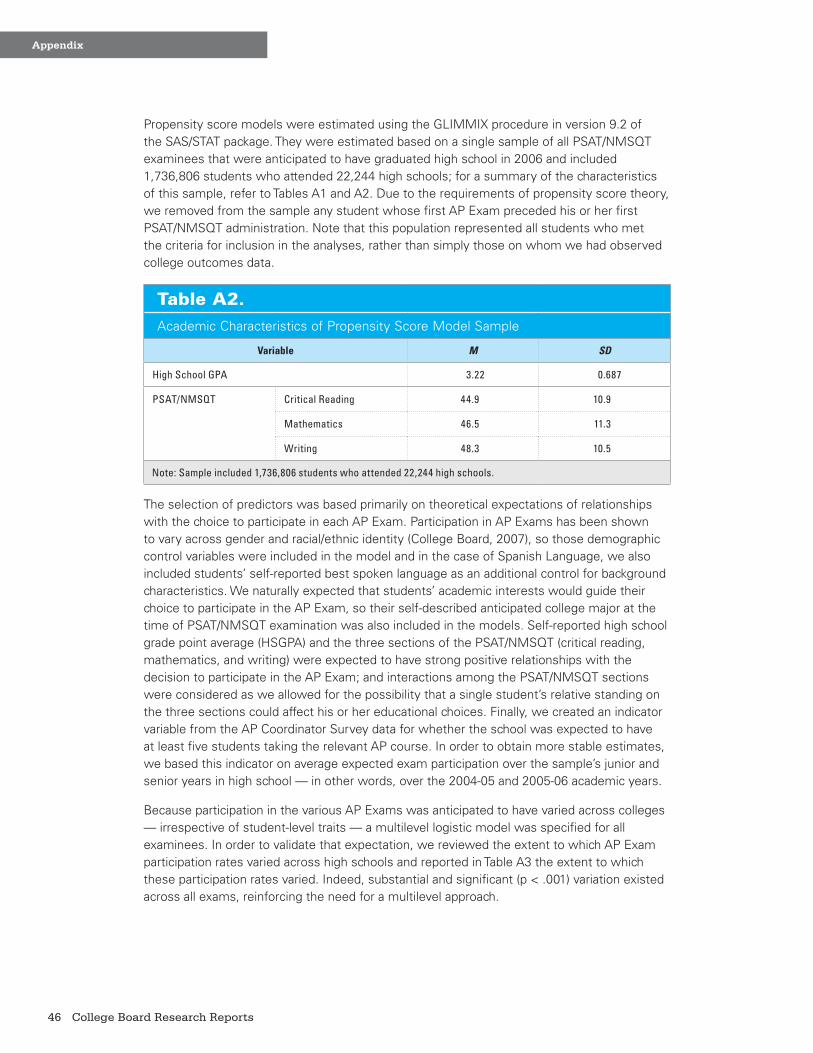
46 College Board Research Reports
Appendix
Propensity score models were estimated using the GLIMMIX procedure in version 9.2 of the SAS/STAT package. They were estimated based on a single sample of all PSAT/NMSQT examinees that were anticipated to have graduated high school in 2006 and included 1,736,806 students who attended 22,244 high schools; for a summary of the characteristics of this sample, refer to Tables A1 and A2. Due to the requirements of propensity score theory, we removed from the sample any student whose first AP Exam preceded his or her first PSAT/NMSQT administration. Note that this population represented all students who met the criteria for inclusion in the analyses, rather than simply those on whom we had observed college outcomes data.
Table A2.Academic Characteristics of Propensity Score Model Sample
Variable M SD
High School GPA 3.22 0.687
PSAT/NMSQT Critical Reading 44.9 10.9
Mathematics 46.5 11.3
Writing 48.3 10.5
Note: Sample included 1,736,806 students who attended 22,244 high schools.
The selection of predictors was based primarily on theoretical expectations of relationships with the choice to participate in each AP Exam. Participation in AP Exams has been shown to vary across gender and racial/ethnic identity (College Board, 2007), so those demographic control variables were included in the model and in the case of Spanish Language, we also included students’ self-reported best spoken language as an additional control for background characteristics. We naturally expected that students’ academic interests would guide their choice to participate in the AP Exam, so their self-described anticipated college major at the time of PSAT/NMSQT examination was also included in the models. Self-reported high school grade point average (HSGPA) and the three sections of the PSAT/NMSQT (critical reading, mathematics, and writing) were expected to have strong positive relationships with the decision to participate in the AP Exam; and interactions among the PSAT/NMSQT sections were considered as we allowed for the possibility that a single student’s relative standing on the three sections could affect his or her educational choices. Finally, we created an indicator variable from the AP Coordinator Survey data for whether the school was expected to have at least five students taking the relevant AP course. In order to obtain more stable estimates, we based this indicator on average expected exam participation over the sample’s junior and senior years in high school — in other words, over the 2004-05 and 2005-06 academic years.
Because participation in the various AP Exams was anticipated to have varied across colleges — irrespective of student-level traits — a multilevel logistic model was specified for all examinees. In order to validate that expectation, we reviewed the extent to which AP Exam participation rates varied across high schools and reported in Table A3 the extent to which these participation rates varied. Indeed, substantial and significant (p < .001) variation existed across all exams, reinforcing the need for a multilevel approach.

47College Board Research Reports
Appendix
Table A3. AP Exam Participation Rates: Overall and Extreme High School Proportions and Test of Heterogeneity
AP Exam
High School Proportion Percentiles
Overall 90th 95th 99th Z-Het*
Calculus AB .0885 .2031 .2791 .4737 920.0
Calculus BC .0264 .0417 .0895 .2061 1,273.6
Computer Science A .0062 .0000 .0175 .0634 656.8
Biology .0558 .1351 .2075 .3985 941.4
Chemistry .0367 .0842 .1351 .2832 768.3
Physics B .0222 .0388 .0859 .2104 1,127.6
Physics C: Mechanics .0112 .0052 .0365 .1233 831.6
Microeconomics .0142 .0000 .0260 .1762 2,191.3
Macroeconomics .0235 .0042 .0615 .2285 2,405.2
Psychology .0428 .0548 .1468 .3528 2,644.6
U.S. Government and Politics .0639 .1364 .2250 .4325 2,049.1
U.S. History .1296 .2857 .3870 .6248 1,453.8
English Language and Composition
.1051 .2632 .3789 .6561 2,112.9
English Literature and Composition
.1281 .3077 .4167 .7143 1,213.5
Spanish Language .0364 .0698 .1195 .2667 996.9
Note: Sample included 1,736,806 students who attended 22,244 high schools. *Test of heterogeneity of proportions proposed by Commenges and Jacqmin (1994) whose statistic follows a standard normal distribution under the null hypothesis of homogeneous proportions.
Each of the 15 propensity score models were built using a combination of the Akaike Information Criterion (Akaike, 1974) and receiver operating characteristic (ROC) curves. The former method took an information theoretic approach to model building and tended to lead to the building of larger models, while the ROC curve approach aimed to balance classification accuracy and sensitivity and tended to produce smaller models. A total of eight models were estimated for each of the 15 subjects and included a variety of theoretically-motivated sets of interaction terms and enough consistency existed across subjects that the same predictors and interactions were included in all propensity score models, except for the addition of the best spoken language variable for the AP Spanish Language exam participation model. The final model parameter estimates, information criteria and classification accuracy and consistency are presented in Tables A4 through A18.

48 College Board Research Reports
Appendix
Table A4. Propensity Score Model for AP Calculus AB Exam Participation
Variable Value/Group Est. p
Fixed Parameter Estimates
Intercept -6.147 < 0.001
Gender Female -0.001 0.891
Racial /EthnicIdentity
American Indian or Alaska Native -0.224 < 0.001
Asian, Asian American, or Pacific Islander 0.485 < 0.001
Black or African American 0.167 < 0.001
Hispanic, Latino, or Latin American 0.168 < 0.001
Not Reported -1.710 < 0.001
Other 0.052 0.007
AnticipatedCollegeMajor
Agriculture and Natural Resources -0.430 < 0.001
Architecture and Design 0.154 < 0.001
Area and Interdisciplinary Studies -0.094 0.022
The Arts -0.485 < 0.001
Biological and Life Sciences 0.158 < 0.001
Business and Management -0.031 0.024
Communications -0.416 < 0.001
Computer and Information Sciences 0.238 < 0.001
Education -0.326 < 0.001
Engineering 0.472 < 0.001
Foreign and Classical Languages -0.234 < 0.001
Health Sciences and Services 0.119 < 0.001
Home Economics -0.440 < 0.001
Language and Literature -0.458 < 0.001
Mathematics and Statistics 0.629 < 0.001
Other -0.315 < 0.001
Philosophy, Religion, and Theology -0.356 < 0.001
Physical Sciences 0.373 < 0.001
Public Administration and Services -0.418 < 0.001
Social and Behavioral Sciences and History -0.204 < 0.001

49College Board Research Reports
Appendix
Variable Value/Group Est. p
Fixed Parameter Estimates
Indicator {Mean AP Calculus AB Course Enrollment ≥ 5} 2.283 < 0.001
High School GPA a 1.567 < 0.001
PSAT/NMSQT Critical Reading a, b 0.118 < 0.001
PSAT/NMSQT Mathematics a, b 1.402 < 0.001
PSAT/NMSQT Writing a, b 0.211 < 0.001
P/N Crit. Read. a, b x P/N Math. a, b -0.128 < 0.001
P/N Crit. Read. a, b x P/N Writing a, b 0.005 0.192
P/N Math. a, b x P/N Writing a, b -0.137 < 0.001
Random Variance Parameter Estimate (Standard Error)
Intercept High School 2.694 (0.049)
Summary of Classification
Classification Accuracy (Precision) 92.4% (63.6%)
Note: The reference group was white males whose anticipated college major was undecided. Estimated based on 1,736,806 students from 22,244 high schools. a Variable was grand-mean centered. b Variable was divided by 10.
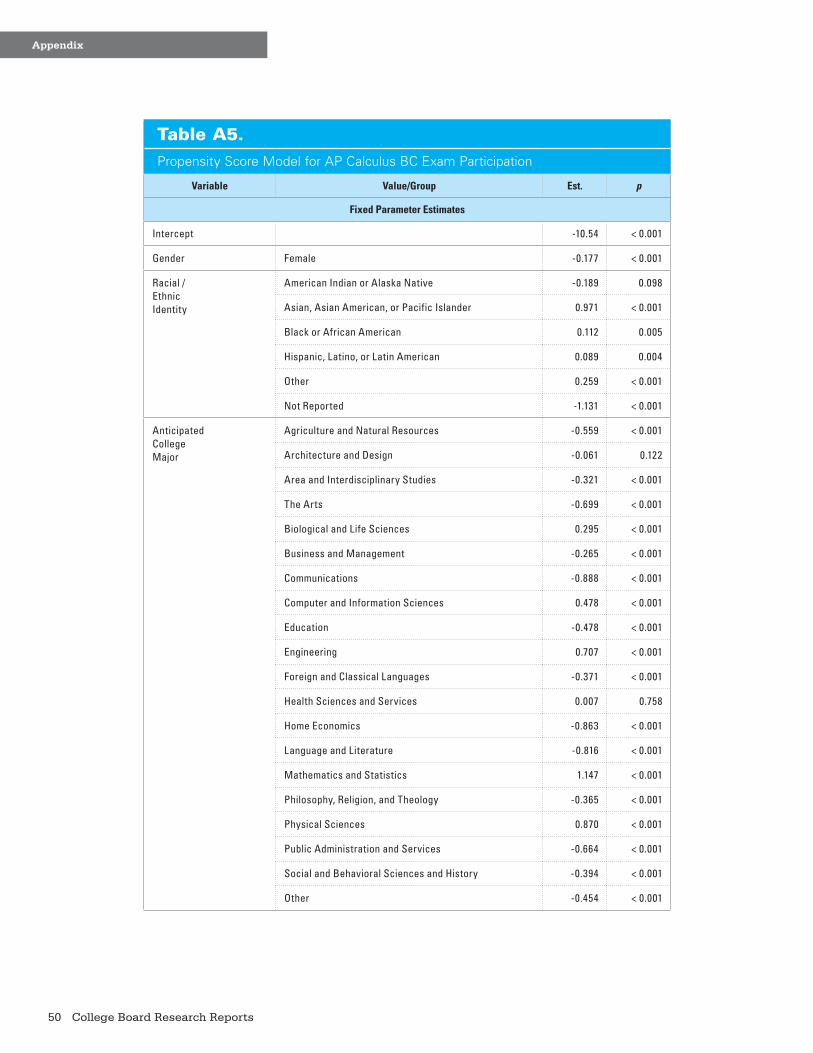
50 College Board Research Reports
Appendix
Table A5. Propensity Score Model for AP Calculus BC Exam Participation
Variable Value/Group Est. p
Fixed Parameter Estimates
Intercept -10.54 < 0.001
Gender Female -0.177 < 0.001
Racial /EthnicIdentity
American Indian or Alaska Native -0.189 0.098
Asian, Asian American, or Pacific Islander 0.971 < 0.001
Black or African American 0.112 0.005
Hispanic, Latino, or Latin American 0.089 0.004
Other 0.259 < 0.001
Not Reported -1.131 < 0.001
AnticipatedCollegeMajor
Agriculture and Natural Resources -0.559 < 0.001
Architecture and Design -0.061 0.122
Area and Interdisciplinary Studies -0.321 < 0.001
The Arts -0.699 < 0.001
Biological and Life Sciences 0.295 < 0.001
Business and Management -0.265 < 0.001
Communications -0.888 < 0.001
Computer and Information Sciences 0.478 < 0.001
Education -0.478 < 0.001
Engineering 0.707 < 0.001
Foreign and Classical Languages -0.371 < 0.001
Health Sciences and Services 0.007 0.758
Home Economics -0.863 < 0.001
Language and Literature -0.816 < 0.001
Mathematics and Statistics 1.147 < 0.001
Philosophy, Religion, and Theology -0.365 < 0.001
Physical Sciences 0.870 < 0.001
Public Administration and Services -0.664 < 0.001
Social and Behavioral Sciences and History -0.394 < 0.001
Other -0.454 < 0.001
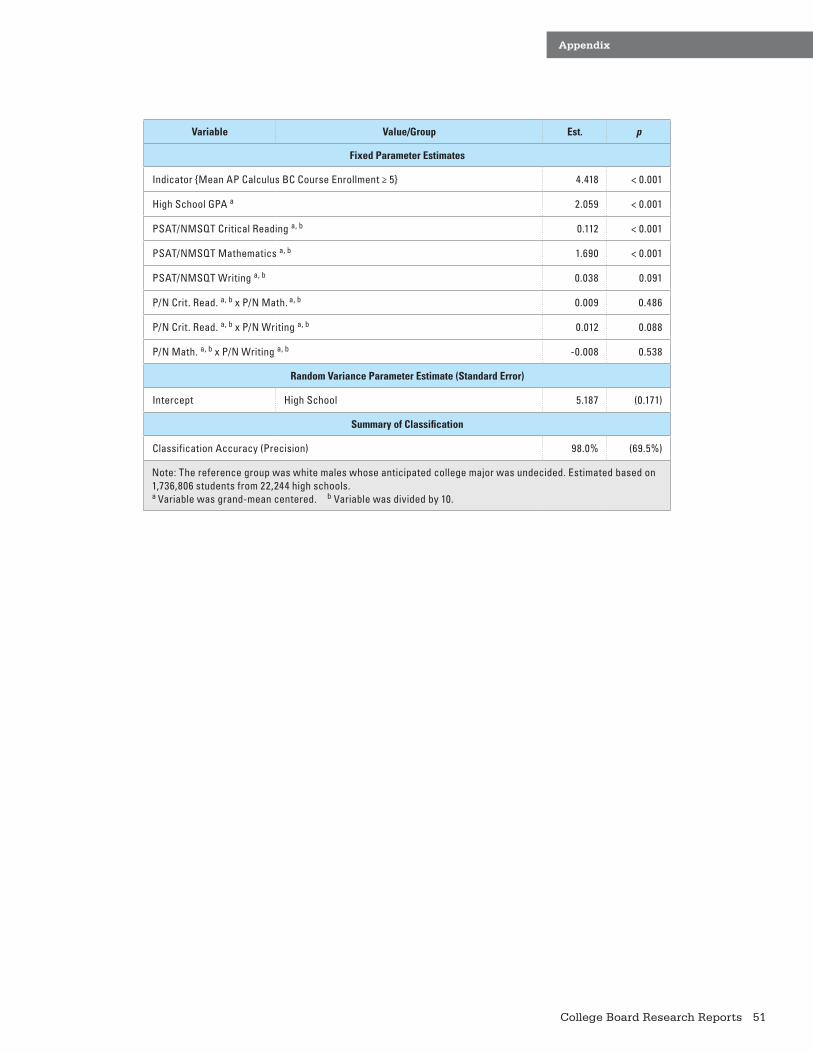
51College Board Research Reports
Appendix
Variable Value/Group Est. p
Fixed Parameter Estimates
Indicator {Mean AP Calculus BC Course Enrollment ≥ 5} 4.418 < 0.001
High School GPA a 2.059 < 0.001
PSAT/NMSQT Critical Reading a, b 0.112 < 0.001
PSAT/NMSQT Mathematics a, b 1.690 < 0.001
PSAT/NMSQT Writing a, b 0.038 0.091
P/N Crit. Read. a, b x P/N Math. a, b 0.009 0.486
P/N Crit. Read. a, b x P/N Writing a, b 0.012 0.088
P/N Math. a, b x P/N Writing a, b -0.008 0.538
Random Variance Parameter Estimate (Standard Error)
Intercept High School 5.187 (0.171)
Summary of Classification
Classification Accuracy (Precision) 98.0% (69.5%)
Note: The reference group was white males whose anticipated college major was undecided. Estimated based on 1,736,806 students from 22,244 high schools. a Variable was grand-mean centered. b Variable was divided by 10.

52 College Board Research Reports
Appendix
Table A6.Propensity Score Model for AP Computer Science A Exam Participation
Variable Value / Group Est. p
Fixed Parameter Estimates
Intercept -9.512 < 0.001
Gender Female -1.158 < 0.001
Racial /EthnicIdentity
American Indian or Alaska Native -0.095 0.590
Asian, Asian American, or Pacific Islander 0.679 < 0.001
Black or African American -0.058 0.316
Hispanic, Latino, or Latin American -0.053 0.276
Not Reported -1.672 0.004
Other 0.186 0.002
AnticipatedCollegeMajor
Agriculture and Natural Resources -1.064 < 0.001
Architecture and Design -0.496 < 0.001
Area and Interdisciplinary Studies -0.617 < 0.001
The Arts -0.405 < 0.001
Biological and Life Sciences -0.021 0.702
Business and Management -0.244 < 0.001
Communications -0.942 < 0.001
Computer and Information Sciences 2.521 < 0.001
Education -1.047 < 0.001
Engineering 0.803 < 0.001
Foreign and Classical Languages -0.125 0.409
Health Sciences and Services -0.432 < 0.001
Home Economics -1.173 < 0.001
Language and Literature -0.623 < 0.001
Mathematics and Statistics 0.584 < 0.001
Philosophy, Religion, and Theology -0.592 < 0.001
Physical Sciences 0.620 < 0.001
Public Administration and Services -0.698 < 0.001
Social and Behavioral Sciences and History -0.463 < 0.001
Other 0.020 0.827
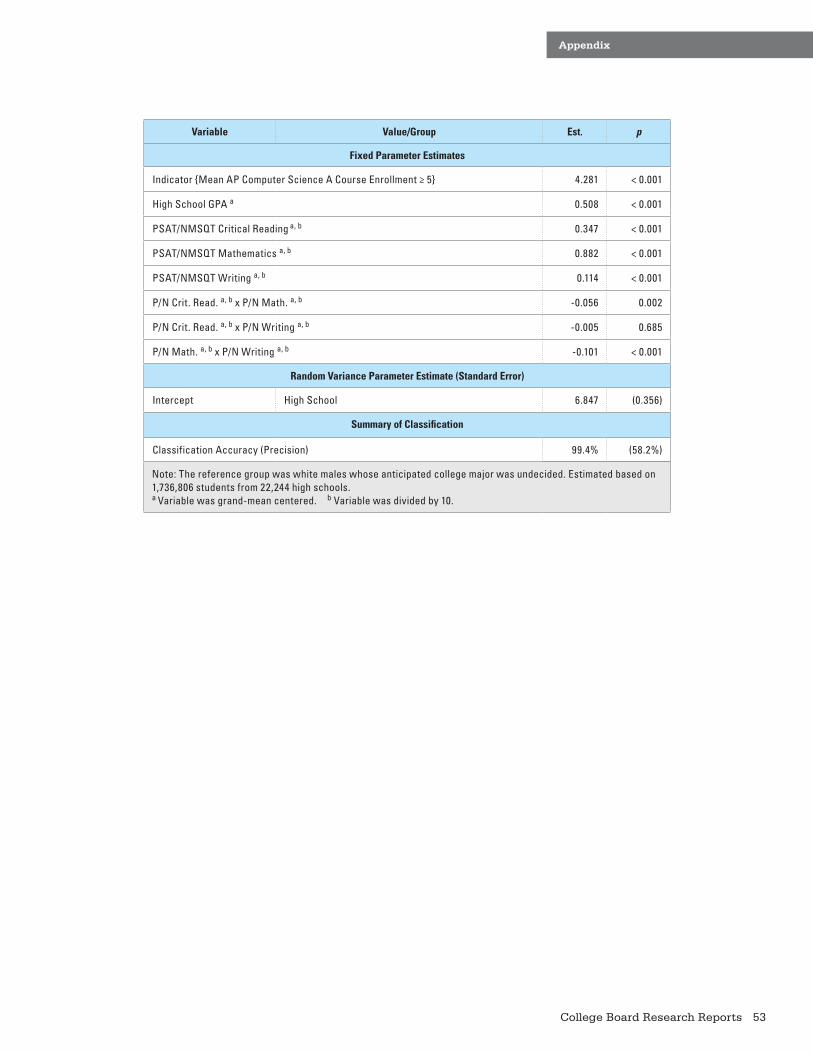
53College Board Research Reports
Appendix
Variable Value/Group Est. p
Fixed Parameter Estimates
Indicator {Mean AP Computer Science A Course Enrollment ≥ 5} 4.281 < 0.001
High School GPA a 0.508 < 0.001
PSAT/NMSQT Critical Reading a, b 0.347 < 0.001
PSAT/NMSQT Mathematics a, b 0.882 < 0.001
PSAT/NMSQT Writing a, b 0.114 < 0.001
P/N Crit. Read. a, b x P/N Math. a, b -0.056 0.002
P/N Crit. Read. a, b x P/N Writing a, b -0.005 0.685
P/N Math. a, b x P/N Writing a, b -0.101 < 0.001
Random Variance Parameter Estimate (Standard Error)
Intercept High School 6.847 (0.356)
Summary of Classification
Classification Accuracy (Precision) 99.4% (58.2%)
Note: The reference group was white males whose anticipated college major was undecided. Estimated based on 1,736,806 students from 22,244 high schools. a Variable was grand-mean centered. b Variable was divided by 10.
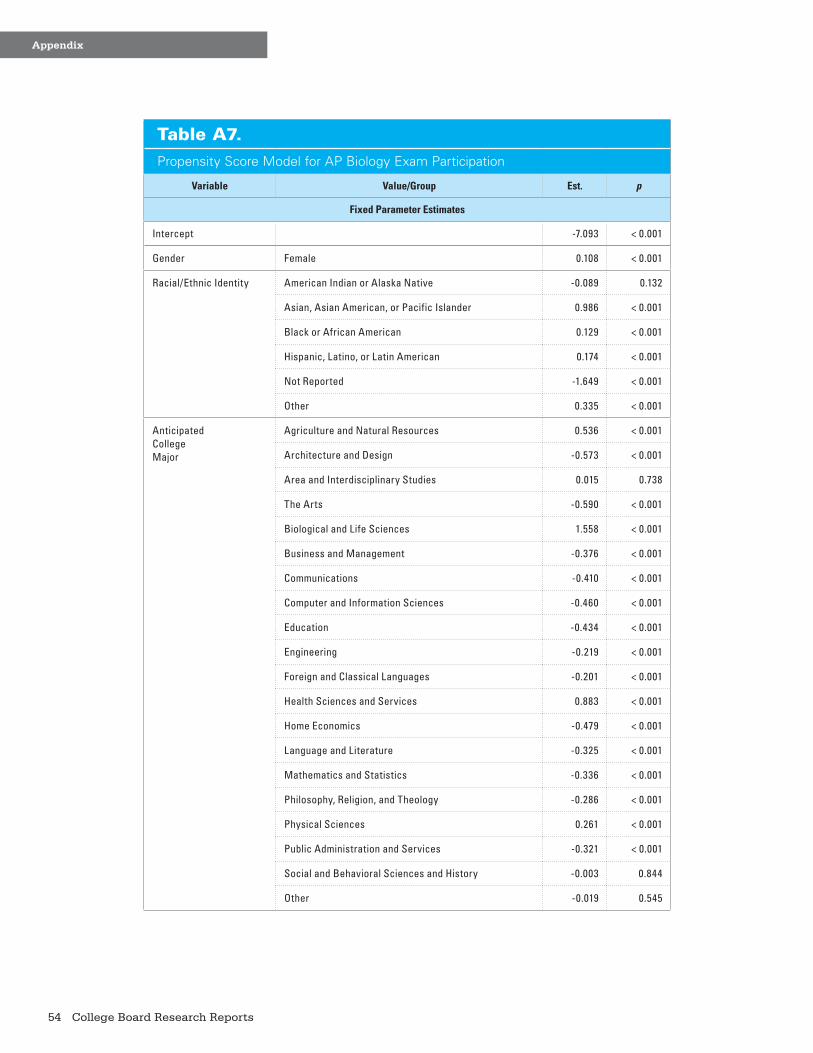
54 College Board Research Reports
Appendix
Table A7.Propensity Score Model for AP Biology Exam Participation
Variable Value/Group Est. p
Fixed Parameter Estimates
Intercept -7.093 < 0.001
Gender Female 0.108 < 0.001
Racial/Ethnic Identity
American Indian or Alaska Native -0.089 0.132
Asian, Asian American, or Pacific Islander 0.986 < 0.001
Black or African American 0.129 < 0.001
Hispanic, Latino, or Latin American 0.174 < 0.001
Not Reported -1.649 < 0.001
Other 0.335 < 0.001
AnticipatedCollegeMajor
Agriculture and Natural Resources 0.536 < 0.001
Architecture and Design -0.573 < 0.001
Area and Interdisciplinary Studies 0.015 0.738
The Arts -0.590 < 0.001
Biological and Life Sciences 1.558 < 0.001
Business and Management -0.376 < 0.001
Communications -0.410 < 0.001
Computer and Information Sciences -0.460 < 0.001
Education -0.434 < 0.001
Engineering -0.219 < 0.001
Foreign and Classical Languages -0.201 < 0.001
Health Sciences and Services 0.883 < 0.001
Home Economics -0.479 < 0.001
Language and Literature -0.325 < 0.001
Mathematics and Statistics -0.336 < 0.001
Philosophy, Religion, and Theology -0.286 < 0.001
Physical Sciences 0.261 < 0.001
Public Administration and Services -0.321 < 0.001
Social and Behavioral Sciences and History -0.003 0.844
Other -0.019 0.545

55College Board Research Reports
Appendix
Variable Value / Group Est. p
Fixed Parameter Estimates
Indicator {Mean AP Biology Course Enrollment ≥ 5} 3.209 < 0.001
High School GPA a 1.243 < 0.001
PSAT/NMSQT Critical Reading a, b 0.474 < 0.001
PSAT/NMSQT Mathematics a, b 0.463 < 0.001
PSAT/NMSQT Writing a, b 0.264 < 0.001
P/N Crit. Read. a, b x P/N Math. a, b -0.036 < 0.001
P/N Crit. Read. a, b x P/N Writing a, b -0.062 < 0.001
P/N Math. a, b x P/N Writing a, b -0.079 < 0.001
Random Variance Parameter Estimate (Standard Error)
Intercept High School 3.208 (0.068)
Summary of Classification
Classification Accuracy (Precision) 94.9% (63.6%)
Note: The reference group was white males whose anticipated college major was undecided. Estimated based on 1,736,806 students from 22,244 high schools. a Variable was grand-mean centered. b Variable was divided by 10.

56 College Board Research Reports
Appendix
Table A8.Propensity Score Model for AP Chemistry Exam Participation
Variable Value / Group Est. p
Fixed Parameter Estimates
Intercept -7.922 < 0.001
Gender Female -0.132 < 0.001
Racial/Ethnic Identity
American Indian or Alaska Native -0.002 0.983
Asian, Asian American, or Pacific Islander 0.993 < 0.001
Black or African American 0.252 < 0.001
Hispanic, Latino, or Latin American 0.195 < 0.001
Not Reported -1.250 < 0.001
Other 0.342 < 0.001
AnticipatedCollegeMajor
Agriculture and Natural Resources -0.082 0.231
Architecture and Design -0.310 < 0.001
Area and Interdisciplinary Studies -0.235 < 0.001
The Arts -0.637 < 0.001
Biological and Life Sciences 0.809 < 0.001
Business and Management -0.352 < 0.001
Communications -0.832 < 0.001
Computer and Information Sciences 0.089 0.006
Education -0.495 < 0.001
Engineering 0.624 < 0.001
Foreign and Classical Languages -0.265 < 0.001
Health Sciences and Services 0.601 < 0.001
Home Economics -0.561 < 0.001
Language and Literature -0.593 < 0.001
Mathematics and Statistics 0.370 < 0.001
Philosophy, Religion, and Theology -0.285 < 0.001
Physical Sciences 1.550 < 0.001
Public Administration and Services -0.328 < 0.001
Social and Behavioral Sciences and History -0.218 < 0.001
Other -0.084 0.047
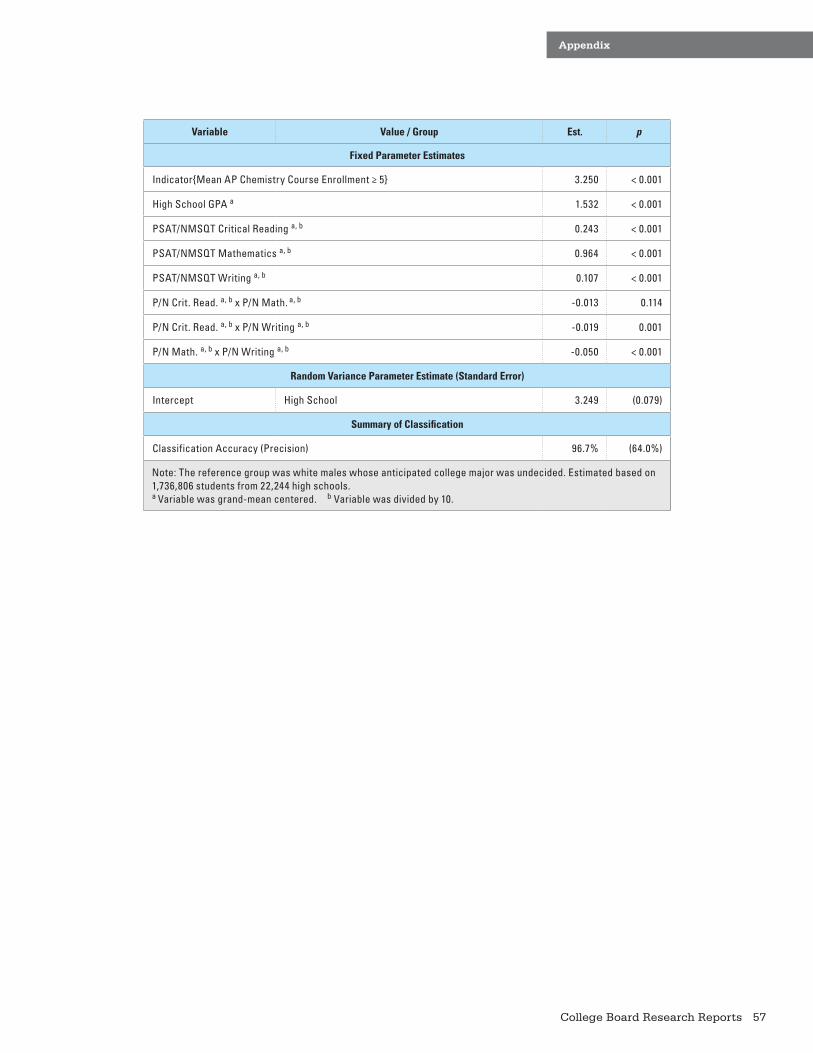
57College Board Research Reports
Appendix
Variable Value / Group Est. p
Fixed Parameter Estimates
Indicator{Mean AP Chemistry Course Enrollment ≥ 5} 3.250 < 0.001
High School GPA a 1.532 < 0.001
PSAT/NMSQT Critical Reading a, b 0.243 < 0.001
PSAT/NMSQT Mathematics a, b 0.964 < 0.001
PSAT/NMSQT Writing a, b 0.107 < 0.001
P/N Crit. Read. a, b x P/N Math. a, b -0.013 0.114
P/N Crit. Read. a, b x P/N Writing a, b -0.019 0.001
P/N Math. a, b x P/N Writing a, b -0.050 < 0.001
Random Variance Parameter Estimate (Standard Error)
Intercept High School 3.249 (0.079)
Summary of Classification
Classification Accuracy (Precision) 96.7% (64.0%)
Note: The reference group was white males whose anticipated college major was undecided. Estimated based on 1,736,806 students from 22,244 high schools. a Variable was grand-mean centered. b Variable was divided by 10.

58 College Board Research Reports
Appendix
Table A9.Propensity Score Model for AP Physics B Exam Participation
Variable Value / Group Est. p
Fixed Parameter Estimates
Intercept -9.874 < 0.001
Gender Female -0.573 < 0.001
Racial/Ethnic Identity
American Indian or Alaska Native -0.057 0.558
Asian, Asian American, or Pacific Islander 0.648 < 0.001
Black or African American 0.006 0.873
Hispanic, Latino, or Latin American 0.158 < 0.001
Not Reported -1.421 < 0.001
Other 0.206 < 0.001
AnticipatedCollegeMajor
Agriculture and Natural Resources -0.383 < 0.001
Architecture and Design 0.344 < 0.001
Area and Interdisciplinary Studies -0.205 0.009
The Arts -0.527 < 0.001
Biological and Life Sciences 0.215 < 0.001
Business and Management -0.299 < 0.001
Communications -0.726 < 0.001
Computer and Information Sciences 0.494 < 0.001
Education -0.520 < 0.001
Engineering 0.976 < 0.001
Foreign and Classical Languages -0.408 < 0.001
Health Sciences and Services 0.066 0.003
Home Economics -0.912 < 0.001
Language and Literature -0.526 < 0.001
Mathematics and Statistics 0.510 < 0.001
Philosophy, Religion, and Theology -0.046 0.560
Physical Sciences 1.159 < 0.001
Public Administration and Services -0.559 < 0.001
Social and Behavioral Sciences and History -0.272 < 0.001
Other -0.157 0.003

59College Board Research Reports
Appendix
Variable Value / Group Est. p
Fixed Parameter Estimates
Indicator {Mean AP Physics B Course Enrollment ≥ 5} 4.713 < 0.001
High School GPA a 1.337 < 0.001
PSAT/NMSQT Critical Reading a, b 0.263 < 0.001
PSAT/NMSQT Mathematics a, b 1.157 < 0.001
PSAT/NMSQT Writing a, b 0.101 < 0.001
P/N Crit. Read. a, b x P/N Math. a, b -0.052 < 0.001
P/N Crit. Read. a, b x P/N Writing a, b 0.007 0.355
P/N Math. a, b x P/N Writing a, b -0.071 < 0.001
Random Variance Parameter Estimate (Standard Error)
Intercept High School 8.184 (0.273)
Summary of Classification
Classification Accuracy (Precision) 98.0% (63.6%)
Note: The reference group was white males whose anticipated college major was undecided. Estimated based on 1,736,806 students from 22,244 high schools. a Variable was grand-mean centered. b Variable was divided by 10.

60 College Board Research Reports
Appendix
Table A10.Propensity Score Model for AP Physics C: Mechanics Exam Participation
Variable Value / Group Est. p
Fixed Parameter Estimates
Intercept -11.38 < 0.001
Gender Female -0.838 < 0.001
Racial/Ethnic Identity
American Indian or Alaska Native -0.032 0.828
Asian, Asian American, or Pacific Islander 0.691 < 0.001
Black or African American 0.013 0.819
Hispanic, Latino, or Latin American 0.113 0.009
Not Reported -0.269 0.352
Other 0.332 < 0.001
AnticipatedCollegeMajor
Agriculture and Natural Resources -0.678 < 0.001
Architecture and Design 0.298 < 0.001
Area and Interdisciplinary Studies -0.566 < 0.001
The Arts -0.701 < 0.001
Biological and Life Sciences 0.109 0.007
Business and Management -0.435 < 0.001
Communications -1.167 < 0.001
Computer and Information Sciences 0.684 < 0.001
Education -0.882 < 0.001
Engineering 1.222 < 0.001
Foreign and Classical Languages -0.416 < 0.001
Health Sciences and Services -0.278 < 0.001
Home Economics -0.684 < 0.001
Language and Literature -0.836 < 0.001
Mathematics and Statistics 0.861 < 0.001
Philosophy, Religion, and Theology -0.352 0.004
Physical Sciences 1.392 < 0.001
Public Administration and Services -0.674 < 0.001
Social and Behavioral Sciences and History -0.565 < 0.001
Other -0.269 0.004
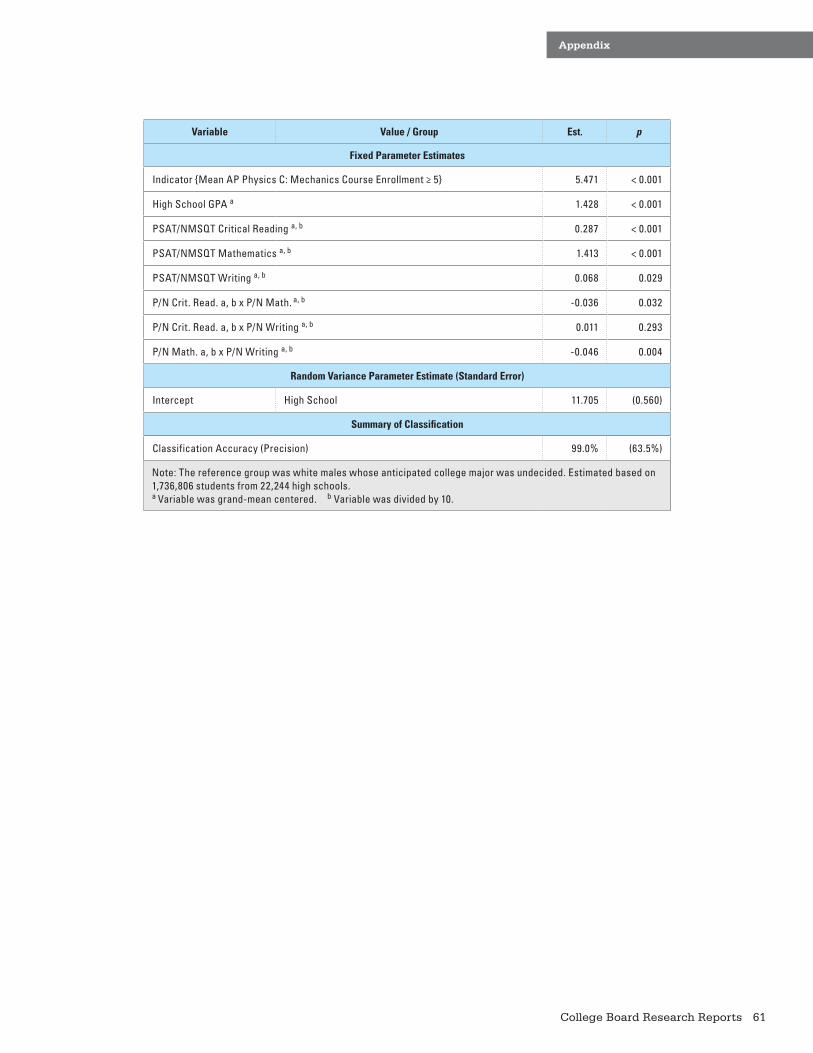
61College Board Research Reports
Appendix
Variable Value / Group Est. p
Fixed Parameter Estimates
Indicator {Mean AP Physics C: Mechanics Course Enrollment ≥ 5} 5.471 < 0.001
High School GPA a 1.428 < 0.001
PSAT/NMSQT Critical Reading a, b 0.287 < 0.001
PSAT/NMSQT Mathematics a, b 1.413 < 0.001
PSAT/NMSQT Writing a, b 0.068 0.029
P/N Crit. Read. a, b x P/N Math. a, b -0.036 0.032
P/N Crit. Read. a, b x P/N Writing a, b 0.011 0.293
P/N Math. a, b x P/N Writing a, b -0.046 0.004
Random Variance Parameter Estimate (Standard Error)
Intercept High School 11.705 (0.560)
Summary of Classification
Classification Accuracy (Precision) 99.0% (63.5%)
Note: The reference group was white males whose anticipated college major was undecided. Estimated based on 1,736,806 students from 22,244 high schools. a Variable was grand-mean centered. b Variable was divided by 10.

62 College Board Research Reports
Appendix
Table A11.Propensity Score Model for AP Microeconomics Exam Participation
Variable Value / Group Est. p
Fixed Parameter Estimates
Intercept -10.86 < 0.001
Gender Female -0.476 < 0.001
Racial/Ethnic Identity
American Indian or Alaska Native -0.114 0.365
Asian, Asian American, or Pacific Islander 0.733 < 0.001
Black or African American 0.036 0.364
Hispanic, Latino, or Latin American 0.052 0.116
Not Reported -2.284 < 0.001
Other 0.176 < 0.001
AnticipatedCollegeMajor
Agriculture and Natural Resources -0.320 0.006
Architecture and Design -0.185 < 0.001
Area and Interdisciplinary Studies 0.336 < 0.001
The Arts -0.453 < 0.001
Biological and Life Sciences -0.115 0.003
Business and Management 0.721 < 0.001
Communications -0.003 0.945
Computer and Information Sciences -0.092 0.087
Education -0.341 < 0.001
Engineering 0.040 0.198
Foreign and Classical Languages -0.085 0.357
Health Sciences and Services -0.043 0.126
Home Economics -0.050 0.595
Language and Literature -0.275 < 0.001
Mathematics and Statistics 0.119 0.093
Philosophy, Religion, and Theology <0.001 0.996
Physical Sciences 0.063 0.292
Public Administration and Services -0.137 0.070
Social and Behavioral Sciences and History 0.342 < 0.001
Other -0.372 < 0.001

63College Board Research Reports
Appendix
Variable Value / Group Est. p
Fixed Parameter Estimates
Indicator {Mean AP Microeconomics Course Enrollment ≥ 5} 6.140 < 0.001
High School GPA a 1.188 < 0.001
PSAT/NMSQT Critical Reading a, b 0.517 < 0.001
PSAT/NMSQT Mathematics a, b 0.596 < 0.001
PSAT/NMSQT Writing a, b 0.232 < 0.001
P/N Crit. Read. a, b x P/N Math. a, b -0.020 0.130
P/N Crit. Read. a, b x P/N Writing a, b -0.105 < 0.001
P/N Math. a, b x P/N Writing a, b -0.053 < 0.001
Random Variance Parameter Estimate (Standard Error)
Intercept High School 12.053 (0.598)
Summary of Classification
Classification Accuracy (Precision) 98.7% (62.1%)
Note: The reference group was white males whose anticipated college major was undecided. Estimated based on 1,736,806 students from 22,244 high schools. a Variable was grand-mean centered. b Variable was divided by 10.

64 College Board Research Reports
Appendix
Table A12.Propensity Score Model for AP Macroeconomics Exam Participation
Variable Value / Group Est. p
Fixed Parameter Estimates
Intercept -10.56 < 0.001
Gender Female -0.377 < 0.001
Racial/Ethnic Identity
American Indian or Alaska Native -0.051 0.581
Asian, Asian American, or Pacific Islander 0.713 < 0.001
Black or African American -0.024 0.439
Hispanic, Latino, or Latin American 0.095 < 0.001
Not Reported -2.043 < 0.001
Other 0.128 < 0.001
AnticipatedCollegeMajor
Agriculture and Natural Resources -0.293 < 0.001
Architecture and Design -0.141 < 0.001
Area and Interdisciplinary Studies 0.259 < 0.001
The Arts -0.350 < 0.001
Biological and Life Sciences -0.051 0.098
Business and Management 0.580 < 0.001
Communications 0.087 0.019
Computer and Information Sciences -0.048 0.253
Education -0.218 < 0.001
Engineering 0.075 0.003
Foreign and Classical Languages -0.032 0.667
Health Sciences and Services -0.007 0.734
Home Economics -0.098 0.163
Language and Literature -0.207 < 0.001
Mathematics and Statistics 0.188 < 0.001
Philosophy, Religion, and Theology 0.041 0.582
Physical Sciences 0.123 0.011
Public Administration and Services -0.125 0.024
Social and Behavioral Sciences and History 0.359 < 0.001
Other -0.230 < 0.001
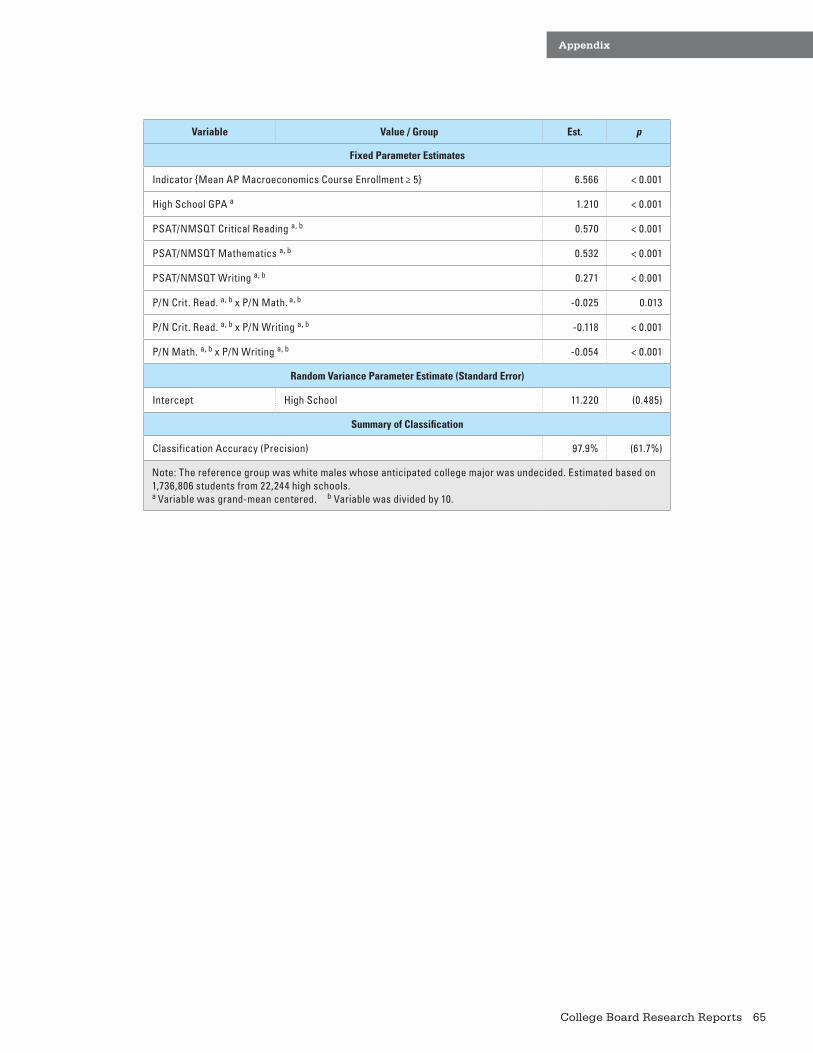
65College Board Research Reports
Appendix
Variable Value / Group Est. p
Fixed Parameter Estimates
Indicator {Mean AP Macroeconomics Course Enrollment ≥ 5} 6.566 < 0.001
High School GPA a 1.210 < 0.001
PSAT/NMSQT Critical Reading a, b 0.570 < 0.001
PSAT/NMSQT Mathematics a, b 0.532 < 0.001
PSAT/NMSQT Writing a, b 0.271 < 0.001
P/N Crit. Read. a, b x P/N Math. a, b -0.025 0.013
P/N Crit. Read. a, b x P/N Writing a, b -0.118 < 0.001
P/N Math. a, b x P/N Writing a, b -0.054 < 0.001
Random Variance Parameter Estimate (Standard Error)
Intercept High School 11.220 (0.485)
Summary of Classification
Classification Accuracy (Precision) 97.9% (61.7%)
Note: The reference group was white males whose anticipated college major was undecided. Estimated based on 1,736,806 students from 22,244 high schools. a Variable was grand-mean centered. b Variable was divided by 10.

66 College Board Research Reports
Appendix
Table A13.Propensity Score Model for AP Psychology Exam Participation
Variable Value / Group Est. p
Fixed Parameter Estimates
Intercept -8.830 < 0.001
Gender Female 0.477 < 0.001
Racial/Ethnic Identity
American Indian or Alaska Native -0.225 0.001
Asian, Asian American, or Pacific Islander 0.446 < 0.001
Black or African American -0.138 < 0.001
Hispanic, Latino, or Latin American 0.014 0.450
Not Reported -2.234 < 0.001
Other 0.114 < 0.001
AnticipatedCollegeMajor
Agriculture and Natural Resources -0.585 < 0.001
Architecture and Design -0.361 < 0.001
Area and Interdisciplinary Studies 0.113 0.042
The Arts -0.278 < 0.001
Biological and Life Sciences -0.036 0.108
Business and Management -0.099 < 0.001
Communications 0.111 < 0.001
Computer and Information Sciences -0.500 < 0.001
Education 0.122 < 0.001
Engineering -0.405 < 0.001
Foreign and Classical Languages -0.199 < 0.001
Health Sciences and Services 0.119 < 0.001
Home Economics -0.304 < 0.001
Language and Literature 0.112 0.001
Mathematics and Statistics -0.370 < 0.001
Philosophy, Religion, and Theology 0.365 < 0.001
Physical Sciences -0.234 < 0.001
Public Administration and Services 0.041 0.248
Social and Behavioral Sciences and History 0.741 < 0.001
Other -0.291 < 0.001

67College Board Research Reports
Appendix
Variable Value / Group Est. p
Fixed Parameter Estimates
Indicator {Mean AP Psychology Course Enrollment ≥ 5} 5.836 < 0.001
High School GPA a 0.725 < 0.001
PSAT/NMSQT Critical Reading a, b 0.478 < 0.001
PSAT/NMSQT Mathematics a, b 0.277 < 0.001
PSAT/NMSQT Writing a, b 0.327 < 0.001
P/N Crit. Read. a, b x P/N Math. a, b -0.087 < 0.001
P/N Crit. Read. a, b x P/N Writing a, b -0.126 < 0.001
P/N Math. a, b x P/N Writing a, b -0.075 < 0.001
Random Variance Parameter Estimate (Standard Error)
Intercept High School 5.795 (0.200)
Summary of Classification
Classification Accuracy (Precision) 95.9% (57.6%)
Note: The reference group was white males whose anticipated college major was undecided. Estimated based on 1,736,806 students from 22,244 high schools. a Variable was grand-mean centered. b Variable was divided by 10.

68 College Board Research Reports
Appendix
Table A14.Propensity Score Model for AP U.S. Government and Politics Exam Participation
Variable Value / Group Est. p
Fixed Parameter Estimates
Intercept -8.218 < 0.001
Gender Female -0.220 < 0.001
Racial/Ethnic Identity
American Indian or Alaska Native -0.172 0.002
Asian, Asian American, or Pacific Islander 0.401 < 0.001
Black or African American -0.050 0.005
Hispanic, Latino, or Latin American 0.065 < 0.001
Not Reported -1.968 < 0.001
Other 0.158 < 0.001
AnticipatedCollegeMajor
Agriculture and Natural Resources -0.351 < 0.001
Architecture and Design -0.140 < 0.001
Area and Interdisciplinary Studies 0.905 < 0.001
The Arts -0.197 < 0.001
Biological and Life Sciences 0.056 0.004
Business and Management 0.121 < 0.001
Communications 0.356 < 0.001
Computer and Information Sciences -0.140 < 0.001
Education -0.038 0.105
Engineering -0.017 0.302
Foreign and Classical Languages 0.085 0.054
Health Sciences and Services 0.016 0.250
Home Economics -0.251 < 0.001
Language and Literature 0.204 < 0.001
Mathematics and Statistics -0.088 0.027
Philosophy, Religion, and Theology 0.263 < 0.001
Physical Sciences 0.149 < 0.001
Public Administration and Services 0.036 0.254
Social and Behavioral Sciences and History 0.664 < 0.001
Other -0.236 < 0.001

69College Board Research Reports
Appendix
Variable Value / Group Est. p
Fixed Parameter Estimates
Indicator {Mean AP U.S. Government and Politics Course Enrollment ≥ 5} 5.069 < 0.001
High School GPA a 1.234 < 0.001
PSAT/NMSQT Critical Reading a, b 0.676 < 0.001
PSAT/NMSQT Mathematics a, b 0.279 < 0.001
PSAT/NMSQT Writing a, b 0.318 < 0.001
P/N Crit. Read. a, b x P/N Math. a, b -0.046 < 0.001
P/N Crit. Read. a, b x P/N Writing a, b -0.071 < 0.001
P/N Math. a, b x P/N Writing a, b -0.085 < 0.001
Random Variance Parameter Estimate (Standard Error)
Intercept High School 5.811 (0.146)
Summary of Classification
Classification Accuracy (Precision) 94.5% (64.7%)
Note: The reference group was white males whose anticipated college major was undecided. Estimated based on 1,736,806 students from 22,244 high schools. a Variable was grand-mean centered. b Variable was divided by 10.

70 College Board Research Reports
Appendix
Table A15.Propensity Score Model for AP U.S. History Exam Participation
Variable Value / Group Est. p
Fixed Parameter Estimates
Intercept -6.383 < 0.001
Gender Female -0.112 < 0.001
Racial/Ethnic Identity
American Indian or Alaska Native -0.134 < 0.001
Asian, Asian American, or Pacific Islander 0.579 < 0.001
Black or African American -0.056 < 0.001
Hispanic, Latino, or Latin American 0.057 < 0.001
Not Reported -2.031 < 0.001
Other 0.177 < 0.001
AnticipatedCollegeMajor
Agriculture and Natural Resources -0.234 < 0.001
Architecture and Design -0.087 < 0.001
Area and Interdisciplinary Studies 0.874 < 0.001
The Arts -0.153 < 0.001
Biological and Life Sciences 0.139 < 0.001
Business and Management 0.053 < 0.001
Communications 0.280 < 0.001
Computer and Information Sciences -0.259 < 0.001
Education -0.054 0.001
Engineering 0.031 0.012
Foreign and Classical Languages 0.220 < 0.001
Health Sciences and Services 0.078 < 0.001
Home Economics -0.226 < 0.001
Language and Literature 0.314 < 0.001
Mathematics and Statistics -0.090 0.002
Philosophy, Religion, and Theology 0.226 < 0.001
Physical Sciences 0.153 < 0.001
Public Administration and Services -0.062 0.008
Social and Behavioral Sciences and History 0.506 < 0.001
Other -0.259 < 0.001
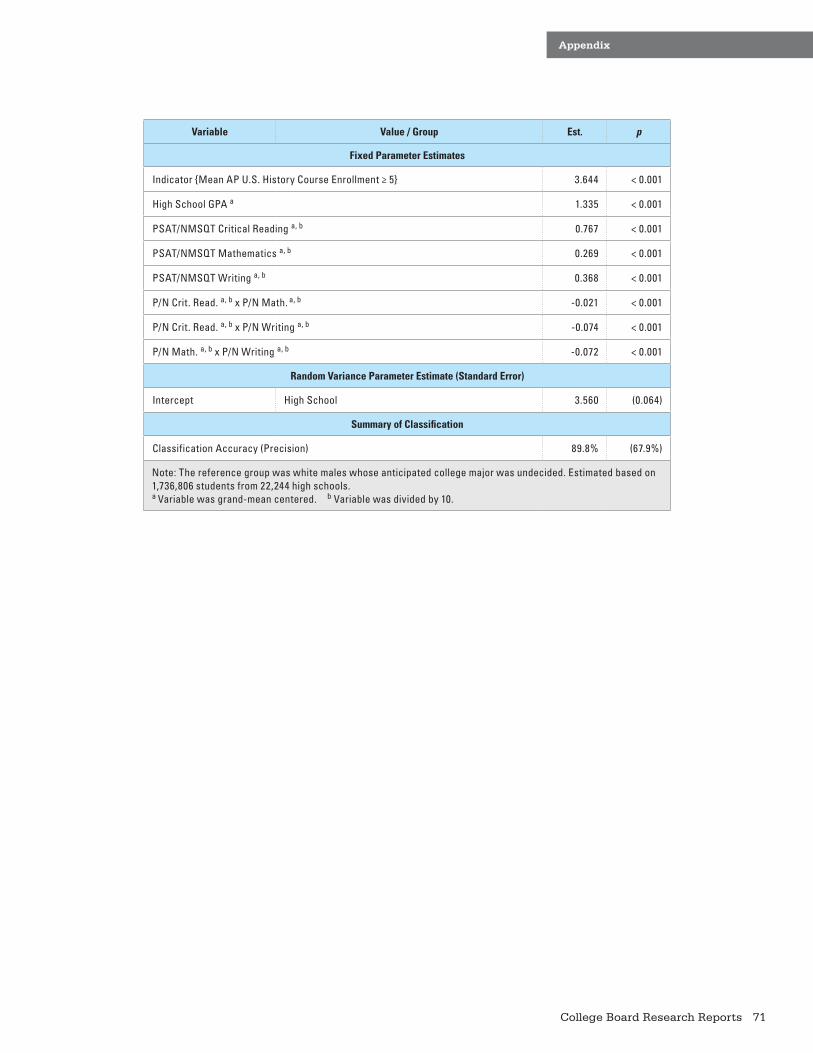
71College Board Research Reports
Appendix
Variable Value / Group Est. p
Fixed Parameter Estimates
Indicator {Mean AP U.S. History Course Enrollment ≥ 5} 3.644 < 0.001
High School GPA a 1.335 < 0.001
PSAT/NMSQT Critical Reading a, b 0.767 < 0.001
PSAT/NMSQT Mathematics a, b 0.269 < 0.001
PSAT/NMSQT Writing a, b 0.368 < 0.001
P/N Crit. Read. a, b x P/N Math. a, b -0.021 < 0.001
P/N Crit. Read. a, b x P/N Writing a, b -0.074 < 0.001
P/N Math. a, b x P/N Writing a, b -0.072 < 0.001
Random Variance Parameter Estimate (Standard Error)
Intercept High School 3.560 (0.064)
Summary of Classification
Classification Accuracy (Precision) 89.8% (67.9%)
Note: The reference group was white males whose anticipated college major was undecided. Estimated based on 1,736,806 students from 22,244 high schools. a Variable was grand-mean centered. b Variable was divided by 10.

72 College Board Research Reports
Appendix
Table A16.Propensity Score Model for AP English Language and Comp. Exam Participation
Variable Value / Group Est. p
Fixed Parameter Estimates
Intercept -8.508 < 0.001
Gender Female 0.448 < 0.001
Racial/Ethnic Identity
American Indian or Alaska Native -0.107 0.015
Asian, Asian American, or Pacific Islander 0.511 < 0.001
Black or African American -0.004 0.810
Hispanic, Latino, or Latin American 0.044 < 0.001
Not Reported -2.009 < 0.001
Other 0.224 < 0.001
AnticipatedCollegeMajor
Agriculture and Natural Resources -0.290 < 0.001
Architecture and Design -0.066 0.001
Area and Interdisciplinary Studies 0.653 < 0.001
The Arts 0.061 < 0.001
Biological and Life Sciences 0.162 < 0.001
Business and Management 0.041 0.005
Communications 0.516 < 0.001
Computer and Information Sciences -0.214 < 0.001
Education -0.023 0.239
Engineering -0.049 < 0.001
Foreign and Classical Languages 0.159 < 0.001
Health Sciences and Services 0.103 < 0.001
Home Economics -0.140 < 0.001
Language and Literature 0.855 < 0.001
Mathematics and Statistics -0.168 < 0.001
Philosophy, Religion, and Theology 0.291 < 0.001
Physical Sciences 0.095 < 0.001
Public Administration and Services -0.138 < 0.001
Social and Behavioral Sciences and History 0.329 < 0.001
Other -0.242 < 0.001
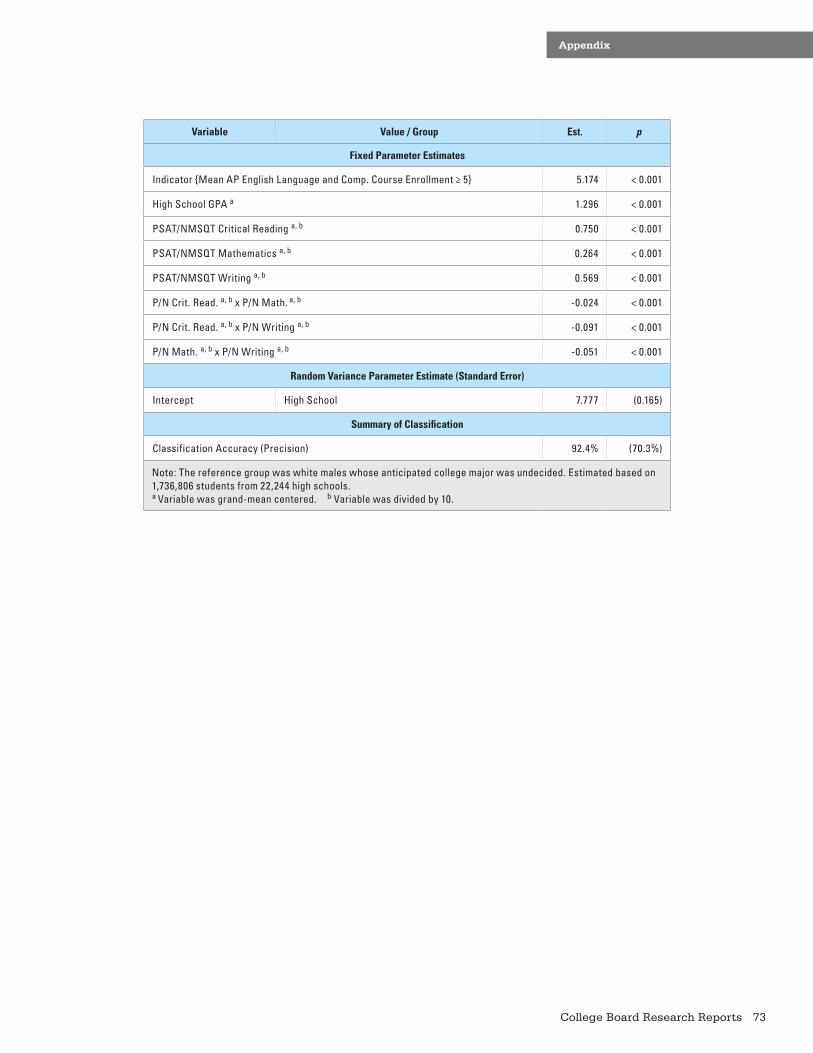
73College Board Research Reports
Appendix
Variable Value / Group Est. p
Fixed Parameter Estimates
Indicator {Mean AP English Language and Comp. Course Enrollment ≥ 5} 5.174 < 0.001
High School GPA a 1.296 < 0.001
PSAT/NMSQT Critical Reading a, b 0.750 < 0.001
PSAT/NMSQT Mathematics a, b 0.264 < 0.001
PSAT/NMSQT Writing a, b 0.569 < 0.001
P/N Crit. Read. a, b x P/N Math. a, b -0.024 < 0.001
P/N Crit. Read. a, b x P/N Writing a, b -0.091 < 0.001
P/N Math. a, b x P/N Writing a, b -0.051 < 0.001
Random Variance Parameter Estimate (Standard Error)
Intercept High School 7.777 (0.165)
Summary of Classification
Classification Accuracy (Precision) 92.4% (70.3%)
Note: The reference group was white males whose anticipated college major was undecided. Estimated based on 1,736,806 students from 22,244 high schools. a Variable was grand-mean centered. b Variable was divided by 10.

74 College Board Research Reports
Appendix
Table A17.Propensity Score Model for AP English Literature and Comp. Exam Participation
Variable Value / Group Est. p
Fixed Parameter Estimates
Intercept -6.481 < 0.001
Gender Female 0.420 < 0.001
Racial/Ethnic Identity
American Indian or Alaska Native -0.188 < 0.001
Asian, Asian American, or Pacific Islander 0.478 < 0.001
Black or African American 0.097 < 0.001
Hispanic, Latino, or Latin American 0.102 < 0.001
Not Reported -2.000 < 0.001
Other 0.194 < 0.001
AnticipatedCollegeMajor
Agriculture and Natural Resources -0.319 < 0.001
Architecture and Design -0.059 0.001
Area and Interdisciplinary Studies 0.617 < 0.001
The Arts 0.141 < 0.001
Biological and Life Sciences 0.121 < 0.001
Business and Management -0.078 < 0.001
Communications 0.467 < 0.001
Computer and Information Sciences -0.216 < 0.001
Education -0.035 0.034
Engineering -0.112 < 0.001
Foreign and Classical Languages 0.217 < 0.001
Health Sciences and Services 0.013 0.193
Home Economics -0.201 < 0.001
Language and Literature 0.884 < 0.001
Mathematics and Statistics -0.155 < 0.001
Philosophy, Religion, and Theology 0.313 < 0.001
Physical Sciences 0.088 < 0.001
Public Administration and Services -0.174 < 0.001
Social and Behavioral Sciences and History 0.335 < 0.001
Other -0.227 < 0.001

75College Board Research Reports
Appendix
Variable Value / Group Est. p
Fixed Parameter Estimates
Indicator {Mean AP English Literature and Comp. Course Enrollment ≥ 5} 3.241 < 0.001
High School GPA a 1.397 < 0.001
PSAT/NMSQT Critical Reading a, b 0.791 < 0.001
PSAT/NMSQT Mathematics a, b 0.179 < 0.001
PSAT/NMSQT Writing a, b 0.541 < 0.001
P/N Crit. Read. a, b x P/N Math. a, b -0.021 < 0.001
P/N Crit. Read. a, b x P/N Writing a, b -0.064 < 0.001
P/N Math. a, b x P/N Writing a, b -0.067 < 0.001
Random Variance Parameter Estimate (Standard Error)
Intercept High School 4.122 (0.070)
Summary of Classification
Classification Accuracy (Precision) 90.1% (68.5%)
Note: The reference group was white males whose anticipated college major was undecided. Estimated based on 1,736,806 students from 22,244 high schools. a Variable was grand-mean centered. b Variable was divided by 10.

76 College Board Research Reports
Appendix
Table A18.Propensity Score Model for AP Spanish Language Exam Participation
Variable Value / Group Est. p
Fixed Parameter Estimates
Intercept -7.404 < 0.001
Gender Female 0.431 < 0.001
Racial/Ethnic Identity
American Indian or Alaska Native -0.064 0.449
Asian, Asian American, or Pacific Islander -0.119 < 0.001
Black or African American 0.014 0.614
Hispanic, Latino, or Latin American 2.128 < 0.001
Not Reported -1.246 < 0.001
Other 0.281 < 0.001
BestSpokenLanguage
English and Another Language 0.976 < 0.001
Another Language 1.182 < 0.001
Not Reported -0.135 < 0.001
AnticipatedCollegeMajor
Agriculture and Natural Resources -0.328 < 0.001
Architecture and Design -0.048 0.075
Area and Interdisciplinary Studies 0.427 < 0.001
The Arts -0.396 < 0.001
Biological and Life Sciences 0.020 0.372
Business and Management 0.054 0.004
Communications 0.065 0.017
Computer and Information Sciences -0.291 < 0.001
Education 0.029 0.274
Engineering -0.136 < 0.001
Foreign and Classical Languages 0.973 < 0.001
Health Sciences and Services 0.032 0.047
Home Economics -0.249 < 0.001
Language and Literature 0.009 0.793
Mathematics and Statistics -0.054 0.239
Philosophy, Religion, and Theology -0.150 0.025
Physical Sciences -0.162 < 0.001
Public Administration and Services -0.052 0.127
Social and Behavioral Sciences and History 0.075 < 0.001
Other -0.269 < 0.001

77College Board Research Reports
Appendix
Variable Value / Group Est. p
Fixed Parameter Estimates
Indicator{Mean AP Spanish Language Course Enrollment ≥ 5} 2.884 < 0.001
High School GPA a 1.066 < 0.001
PSAT/NMSQT Critical Reading a, b 0.081 < 0.001
PSAT/NMSQT Mathematics a, b 0.174 < 0.001
PSAT/NMSQT Writing a, b 0.381 < 0.001
P/N Crit. Read. a, b x P/N Math. a, b 0.028 < 0.001
P/N Crit. Read. a, b x P/N Writing a, b -0.025 < 0.001
P/N Math. a, b x P/N Writing a, b 0.039 < 0.001
Random Variance Parameter Estimate (Standard Error)
Intercept High School 2.414 (0.062)
Summary of Classification
Classification Accuracy (Precision) 96.4% (54.5%)
Note: The reference group was white males whose best spoken language was English alone and whose anticipated college major was undecided. Estimated based on 1,736,806 students from 22,244 high schools. a Variable was grand-mean centered. b Variable was divided by 10.


VALIDITY
• Providing data-based solutions to important educational problems and questions
• Applying scientific procedures and research to inform our work
• Designing and evaluating improvements to current assessments and developing new assessments as well as educational tools to ensure the highest technical standards
• Analyzing and resolving critical issues for all programs, including AP®, SAT®, PSAT/NMSQT®
• Publishing findings and presenting our work at key scientific and education conferences
• Generating new knowledge and forward-thinking ideas with a highly trained and credentialed staff
Admission
Alignment
Evaluation
Fairness
Measurement
Research
Trends
Validity
Our work focuses on the following areas
Follow us online: research.collegeboard.org
The Research department actively supports the
College Board’s mission by:
Follow us online: research.collegeboard.org

13b-7235


![Practical Nursing EducationNursing (PN) designated as major on file in Admissions Office. [ ] 2. Have met the placement test requirements. (Have official placement scores on file in](https://static.fdocuments.in/doc/165x107/5ecbc6b1aab05a781359c40a/practical-nursing-education-nursing-pn-designated-as-major-on-file-in-admissions.jpg)