
Validated measurements for transformers · 2017-11-27 · ANSI/IEEE C57.12.90-1993 P = k = P m P 1...
16
Bulletin WT3000ETR-01E-E Precision Making WT3000E Precision Power Analyzer Transformer Version Validated measurements for transformers
Transcript of Validated measurements for transformers · 2017-11-27 · ANSI/IEEE C57.12.90-1993 P = k = P m P 1...

Bulletin WT3000ETR-01E-EPrecision Making
WT3000E Precision Power AnalyzerTransformer Version
Validated measurements for transformers

Transformers play a critical role in ensuring the efficient and reliable distribution of electricity to homes and businesses. In order to develop economical and ecologically friendly transformers for utility providers, manufacturers need to find ways to reduce losses and costs at every stage of the development cycle. Every kilowatt of power loss exceeding the limits under no-load condition can cost a manufacturer tens of thousands of dollars in fines. The more precise the measurement, the less likely there will be penalties, and the greater the trust from the customer. Yokogawa supports the transformer industry with a power analyzer designed specifically for their high accuracy needs . Whether it is during R&D or production testing, the WT3000E Transformer Version ensures the consistently reliable measurements needed by engineers to reduce the total cost of ownership for utility companies.
The WT3000E Transformer Version delivers:
Accuracy – With a guaranteed basic power accuracy of 0.01% of reading, the WT3000E Transformer Version is the world’s most accurate power analyzer even at power factors as low as 0.001.
Reliability – The proven stability of the WT3000ETransformer Version ensures that consistent precision measurements are made for every one of your tests.
Trust – Complete with a calibration certificate from Yokogawa’s ISO17025 accredited calibration laboratory, the WT3000E Transformer Version delivers the confidence needed in low power factor measurements to ensure compliance with the IEC60076-8 standard.


WT3000E Transformer Version 44Features and benefits
Accuracy specificationsRange 100V 1A or 5A
Frequency 44-66 Hz
Specification value in % of reading, valid for 24 months
Temperature 23 +/- 4º C
Integration Time 2 seconds
Voltage 100V range:
20% to 60% of range 0.025%
60% to 110% of range 0.005%
Current 1A or 5A range:
20% to 60% of range 0.025%
60% to 110% of range 0.005%
Phase 100V, 1A or 5A range:
10 to 170º 0.002º Normal mode
-10 to -170º 0.002º Normal mode
Phase 100V, 1A or 5A range:
0 to +/-180º 0.002º Harmonics mode
Power 100V, 1A or 5A range:
60% to 110% of range
PF 1 0.01%
PF <1 to 0.5 0.03%
PF <0.5 to 0.05 0.15%
PF <0.05 to 0.02 0.3%
PF <0.02 to 0.01 0.5%
PF <0.01 to 0.001 7%
20% to 60% of range
PF 1 0.03%
PF <1 to 0.5 0.06%
PF <0.5 to 0.05 0.15%
PF <0.05 to 0.02 0.35%
PF <0.02 to 0.01 0.6%
PF <0.01 to 0.001 9%
WhereP or P0 = corrected power U’ = mean value of voltagePm = measured power U = rms value of voltageP1 = ratio of hysteresis loss to total iron lossesP2 = ratio of eddy current losses to total iron losses
IEC76-1(1993)
P0 = Pm (1 + d )
d = U - U'U'
IEC76-1(1976),
ANSI/IEEE C57.12.90-1993
P =
k =
Pm
P1 + k . P2
U'
U( )
2
Unmatched accuracy – even at lower power factors The WT3000E Transformer Version is the world's most accurate precision power analyzer, offering the best accuracies at low power factors for commercial frequencies of 44 to 66 Hz. Even at power factors as low as 0.01 at 100 V and 1 A, the WT3000E Transformer Version offers an accuracy of 0.5% of the reading. This makes the power analyzer ideal for the precision testing of transformer losses according to the IEC60076-8 standard.
As shown in the table above, the WT3000E Transformer Version goes above and beyond the industry expectations by calibrating at power factors as low as 0.001.
Minimize losses with the world’s most accurate power analyzer
Direct readout of corrected power for potential transformers When small loads are connected to the potential transformers, the WT3000E Transformer Version directly supports both standard formulas used to calculate the correct power.
Precision compensation functions These functions compensate for the loss caused by the wiring of each element. The WT3000E Transformer Version provides the following three types of correction functions to measure power and efficiency. - Wiring Compensation - Efficiency Compensation - Compensation for the Two-Wattmeter Method
These compensation functions enable the WT3000E Transformer Version to measure power accurately and precisely.
SOURCE LOADU
II
ULOADSOURCE
±±
U
II
U
±±
For U-I WiringCompensated instantaneous voltage: u’(n) = u(n) – Ri×i(n)The instantaneous current is i(n).
For I-U WiringCompensated instantaneous current: i’(n) = i(n) – u(n)/RuThe instantaneous voltage is u(n).

55 Features and benefits
Accreditation bodies The calibration capabilities of the Yokogawa Calibration laboratory in the Netherlands are accredited by the Raad voor Accreditatie, a member of the European Co-operation for Accreditation (EA) and signatory to the ILAC Mutual Recognition Arrangements (MRA) for the mutual recognition of calibration Certificates. ILAC (International Laboratory Accreditation Cooperation) is the international organization for accreditation bodies.
Power calibration 53 Hz 100 V & 1 A range PF = Inductive (Excerpt from a sample calibration certificate from Yokogawa Europe)
Range Applied Measured ±Uncertainty Unit Deviation %/VA100 V 1A PF=1 100,000 100,001 0,004 W 0,0001
100V 1A PF=0.5 50,000 50,003 0,004 W 0,0007
100 V 1A PF=0.05 5,000 5,003 0,003 W 0,0009
100 V 1A PF=0.02 2,000 2,003 0,003 W 0,0008
100 V 1A PF=0.01 1,000 1,003 0,003 W 0,0009
100 V 1A PF=0.001 0,100 0,103 0,003 W 0,0009
80 V 1A PF=1 80,000 80,001 0,004 W 0,0009
80V 1A PF=0.5 40,000 40,003 0,003 W 0,0006
80 V 1A PF=0.05 4,0000 4,0022 0,0028 W 0,0008
80 V 1A PF=0.02 1,6000 1,6021 0,0028 W 0,0009
80 V 1A PF=0.01 0,8000 0,8023 0,0028 W 0,0006
80 V 1A PF=0.001 0,0800 0,0822 0,0028 W 0,0004
60 V 0.8A PF=1 48,000 48,001 0,003 W 0,0031
60V 0.8A PF=0.5 24,0000 24,0010 0,0021 W 0,0021
60 V 0.8A PF=0.05 2,4000 2,4011 0,0017 W 0,0012
60 V 0.8A PF=0.02 0,9600 0,9612 0,0017 W 0,0008
60 V 0.8A PF=0.01 0,4800 0,4813 0,0017 W 0,0008
60 V 0.8A PF=0.001 0,0480 0,0493 0,0017 W 0,0010
40 V 0.5A PF=1 20,0000 19,9995 0,0020 W 0,0030
40 V 0.5A PF=0.5 10,0000 10,0000 0,0013 W 0,0020
40 V 0.5A PF=0.05 1,0000 1,0003 0,0009 W 0,0010
40 V 0.5A PF=0.02 0,4000 0,4003 0,0009 W 0,0010
40 V 0.5A PF=0.01 0,2000 0,2003 0,0009 W 0,0010
40 V 0.5A PF=0.001 0,0200 0,0203 0,0009 W 0,0005
Accredited calibration certificate When every kilowatt lost beyond specified limits can cost thousands of dollars in fines, it becomes necessary to have confidence in the measurement of power losses, particularly under no load conditions and power factors as low as 0.01.
To address this, the WT3000E Transformer Version is calibrated, tested and measured at 53Hz at power factors of 1, 0.5, 0.05, 0.01 and 0.001. This enables the integrated transformer measurement system to measure power losses with great accuracy and capture any drift outside the limits described in the IEC60076-8 Standard.
As the only ISO 17025 certified non-governmental organization that offers calibration up to 100kHz, Yokogawa is uniquely equipped to guarantee the power accuracy specifications of the WT3000E Transformer Version and improve upon it with calibration.
CALIBRATIONRvA K 164

WT3000E Transformer Version 66Features and benefits
Intuitive high resolution display Compare up to 4 different input signals in numeric, waveform, vector or trend display modes on the 8.4inch TFT display of the WT3000E Transformer Version. Power readings are displayed with a resolution of up to six digits minimizing the uncertainties in calibration. Clear overload and safety indicators ensure that incidents are avoided.
Intuitive high resolution display
Three phase delta calculation Check line voltage and phase voltage simultaneously without changing wiring. The built-in delta computation function allows both star-delta and delta-star conversion. It allows users to calculate individual phase voltages from the line voltages measured in a three-phase, three-wire (3V3A) system.
The R-S line-to-line voltage can be calculated in systems measured from a three-phase, three-wire method (using two input elements).
Delta calculation display
Features and benefits
T phase
R phase
S phase
User-defined events and computations The WT3000E Transformer Version has an event trigger function that allows users to set limits for capture of readings that fall into or out of a specific range of power, current or other parameters . Data that meets the trigger conditions are stored, printed, saved to a USB memory device etc. Users can also define and use up to 20 expressions for custom calculations.
User-defined function - expression setting screen
Cycle by cycle trend analysis This analysis function enables users to list the measurement parameters such as voltage, current, and active power for each cycle. Input frequencies from 0.1 Hz to 1000 Hz can be measured and up to 3000 data can be saved in .CSV format.
Also by using Yokogawa’s PC application software users can graphically display the data by cycle.
Measurement data display
100.4 V 100.2 V 101.5 V
Normal Update Interval Data
Cycle by Cycle measurement data
99.8 V
98.5 V 98.2 V

7 Features and benefits7
WTViewerEfree
Advanced waveform analysis Harmonic measurement in normal measurement mode During the no-load loss test, the current will be a distorted waveform due to the eddy current and hysteresis in the core. The WT3000E Transformer Version enables users to measure harmonics and distortions while simultaneously measuring power.
Wide bandwidth harmonic measurement The function is useful for ascertaining the distortion factor and harmonic components in measurements of fundamental frequencies from 0.1 Hz to 2.6 kHz.
FFT (Fast Fourier Transform) The WT3000E Transformer Version can analyze and display a waveform’s individual frequency components. It can also check signal components other than the integer multiples of the fundamental wave.
Save raw waveform sample data WT3000E Transformer Version can save sampling raw data of input waveforms, waveform computations, and FFT computations. The saved data can be accessed for any kind of computation by PC software.
Advanced Waveform and Harmonic
Easy PC application software This application software is a free tool which is used to read numeric, waveform, and harmonic data from the WT3000E Transformer Version Precision Power Analyzer through a communications interface such as GP-IB,USB (/C12 option) or Ethernet.
Numeric data The voltage, current, power and various other measured parameters can be simultaneously displayed for one to four elements and ∑A and ∑B calculations.
Harmonics measurement The software can numerically or graphically display the results of measured harmonics up to the 100th order for parameters such as voltage, current, power and phase angle.
Waveform Voltage and current waveforms can be monitored using the software and be used to confirm such things as phase differences between the voltage and current, and waveform distortion.
Viewing trends The software can be used to capture and view various data measured using the WT3000E Transformer Version, on the PC in a graphical trend format. This feature enables the users to monitor power supply voltage fluctuations, changes in current consumption and other time-based variations.

WT3000E Transformer Version 88The WT3000E Transformer Version in detail
The WT3000E Transformer Version in detail
1 External media slot Settings, waveform display data, numerical data, and screen image data can be saved to external media
2 U/I range display Choose voltage ranges from 15V to 1000 V and current ranges from 0.5A to 30 A in RMS, Mean, DC and RMEAN
3 Element setting Choose the element(s) for your measurement settings
4 Display settings Choose one or more display modes from numeric, waveform, vector or trend.
5 Measurement item selection
Choose measurement items and elements for readings
6 Integration settings Integrate instantaneously measured values
7 Data saving Save or store measurement data or images
8 Built-in printer (option /B5) Print measurement data
9 USB port for storage and peripherals including keyboard, mouse etc.
2
4
51
3
8
6
7
9

99 The WT3000E Transformer Version in detail
3
4
7
2
51
6
1 Voltage Input terminals 150mv to 1100Vrms
2 Current input terminals Direct input 30A element
3 GP-IB port - General purpose interface bus
4 BNC connector for two-system synchronized
measurement
5 Ethernet port with RJ-45 connector for TCP/IP access.
6 USB port (option /C12) for PC connectivity
7 VGA port (option/V1) Video signal output for enhanced display on analog RGB displays

WT3000E Transformer Version 10Specifications
Specifications for other conditions are described in subsequent sections.
Key specifications for WT3000E Transformer Version
Range 100V 1A or 5A
Frequency 44-66 HzSpecification value in % of reading, valid for 24 months
Temperature 23 +/- 4º CIntegration Time 2 secondsVoltage 100V range:
20% to 60% of range 0.025%60% to 110% of range 0.005%
Current 1A or 5A range:20% to 60% of range 0.025%60% to 110% of range 0.005%
Phase 100V, 1A or 5A range:10 to 170º 0.002º Normal mode-10 to -170º 0.002º Normal mode
Phase 100V, 1A or 5A range:
0 to +/-180º 0.002º Harmonics modePower 100V, 1A or 5A range:
20% to 60% of rangePF 1 0.03%PF <1 to 0.5 0.06%PF <0.5 to 0.05 0.15%PF <0.05 to 0.02 0.35%PF <0.02 to 0.01 0.6%PF <0.01 to 0.001 9%
60% to 110% of rangePF 1 0.01%PF <1 to 0.5 0.03%PF <0.5 to 0.05 0.15%PF <0.05 to 0.02 0.3%PF <0.02 to 0.01 0.5%PF <0.01 to 0.001 7%
Inputs
Input terminal type Voltage Plug-in terminal (safety terminal)
Current Direct input: Large binding postExternal Current Sensor input: Insulated BNC connector
Input type Voltage Floating input, resistive potential divider method
Current Floating input, shunt input method
Measurement range (rated value)Voltage 15 V, 30 V, 60 V, 100 V, 150 V, 300 V, 600 V, 1000 V (for crest factor 3)
7.5 V, 15 V, 30 V, 50 V, 75 V, 150 V, 300 V, 500 V (for crest factor 6)
Current (30 A input element)Direct input 500 mA, 1 A, 2 A, 5 A, 10 A, 20 A, and 30 A (for crest factor 3)
250 mA, 500 mA,1 A, 2.5 A, 5 A, 10 A, and 15 A (for crest factor 6)
External Current Sensor input50 mV, 100 mV, 200 mV, 500 mV, 1 V, 2 V, 5 V, and 10 V (for crest factor 3) 25 mV, 50 mV, 100 mV, 250 mV, 500 mV, 1 V, 2.5 V, and 5 V (for crest factor 6)
Input impedance Voltage Input resistance: Approx. 10 MΩ, input capacitance: Approx. 5 pF
External Current Sensor inputInput resistance: Approx. 1 MΩ, input capacitance: Approx. 40 pF
Current (30 A input element)Direct input Approx. 5.5 mΩ + approx. 0.03 μH
External Current Sensor inputInput resistance: Approx. 1 MΩ, input capacitance: Approx. 40 pF
Instantaneous maximum allowable input (1s or less) Voltage Peak value of 2500 V or RMS value of 1500 V, whichever is less.
Peak value less than or equal to 10 times the measurement range.
Current (30 A input element)Direct input Peak value of 150 A or RMS value of 50 A, whichever is less.
External Current Sensor inputPeak value less than or equal to 10 times the measurement range.
Continuous maximum allowable inputVoltage Peak value of 1600 V or RMS value of 1100 V, whichever is less.
Or up to 1500 Vdc. This is a reference value.
External Current Sensor inputPeak value less than or equal to 5 times the measurement range.
Current (30 A input element)Direct input Peak value of 90 A or RMS value of 33 A, whichever is less.
External Current Sensor inputPeak value less than or equal to 5 times the measurement range.
Continuous maximum common mode voltage (50/60 Hz) Voltage input terminals 1000 Vrms
Current input terminals 1000 Vrms (Maximum allowable voltage that can be measured)600 Vrms (Rated voltage of EN61010-2-030 standard)
External current sensor input connector: 600 VrmsImportant Safety Note: Do not touch the inside of the BNC connector of the External Current Sensor input for safety reasons.
Rated voltage to ground Voltage input terminals 1000 V
Current input terminals 1000 V (Maximum allowable voltage that can be measured) 600 V (Rated voltage of EN61010-2-030 standard)
External current sensor input connector: 600 VImportant Safety Note: Do not touch the inside of the BNC connector of the External Current Sensor input for safety reasons.
Influence from common mode voltageApply 1000 Vrms with the voltage input terminals shorted and the current input terminals open.
• 50/60 Hz: ±0.01% of range or less
• Reference value up to 200 kHzVoltage: ±3/range × f% of range or less. However, 3% or less.Current direct input and external current sensor input: ±(max. range/range) × 0.001 × f% of range or less.
However, 0.01% or more. The units of f are kHz. The max. range within equations is 30 A or 10 V.
Line filter Select OFF, 500 Hz, 5.5 kHz, or 50 kHz.
Frequency filter Select OFF, or ON
A/D converter Simultaneous voltage and current conversion and 16-bit resolution.Conversion speed (sampling rate): Approximately 5 μs. See harmonic measurement items for harmonic display.
Range switching Can be set for each input element.
Auto range functions Increasing range value • When the measured values of U and I exceed 110% of the range
rating
• When the peak value exceeds approximately 330% of the range rating (or approximately 660% for crest factor 6)
Decreasing range value • When the measured values of U and I fall to 30% or less of the range rating, and Upk and Ipk are 300% or less of the lower range value (or 600% for crest factor 6)
Display
Display 8.4-inch color TFT LCD monitor
Total number of pixels* 640 (horiz.) × 480 (vert.) dots*Up to 0.02% of the pixels on the LCD may be defective.
Waveform display resolution 501 (horiz.) × 432 (vert.) dots
Display updateSame as the data update rate. Exceptions are listed below.
• The display update interval of numeric display (4, 8, and 16 items) is 250 ms when the data update rate is 50 ms or 100 ms.
• The display update interval of numeric display (ALL, Single List, and Dual List) is 500 ms when the data update rate is 50 ms to 250 ms.
• The display update rate of the trend display, bar graph display, and vector display is 1 s when the data update rate is 50 ms to 500 ms.
• The display update interval of the waveform display is approximately 1 s when the data update rate is 50 ms to 1 s. However, it may be longer depending on the trigger setting.
Calculation function
Single-phase,3 wire 3 phase, 3 wire 3 phase, 3 wire
(3 voltage 3 current) 3 phase, 4 wire
U∑ [V] (U1+U2)/2 (U1+U2 +U3)/3
I∑ [A] ( I1+ I2)/2 ( I1+ I2+ I3)/3
P∑ [W] P1+P2 P1+P2+P3
S∑ [VA] TYPE1 TYPE2
S1+S2 3——(S1+S2)2
3——(S1+S2+S3)3
S1+S2+S3
TYPE3 P∑2+ Q∑2
Q∑ [var] TYPE1 Q1+Q2 Q1+Q2+Q3
TYPE2 S∑2− P∑2
TYPE3 Q1+Q2 Q1+Q2+Q3
Pc∑ [W] Pc1+Pc2 Pc1+Pc2+Pc3
WP∑ [Wh] WP1+WP2 WP1+WP2+WP3
WP+∑ [Wh] WP+1+WP+2 WP+1+WP+2+WP+3
WP−∑ [Wh] WP−1+WP−2 WP−1+WP−2+WP−3
q∑ [Ah] q1+q2 q1+q2+q3
q+∑ [Ah] q+1+q+2 q+1+q+2+q+3
q−∑ [Ah] q−1+q−2 q−1+q−2+q−3
WS∑ [VAh] 1——N
N
∑ n=1
S∑(n) × Time
S∑(n) is the nth apparent power ∑ function, and N is the number of data updates.
WQ∑ [varh] 1——N
N
∑ n=1
| Q∑(n) | × Time
Q∑(n) is the nth reactive power ∑ function, and N is the number of data updates.
∑ P∑S∑
∑ [°] P∑cos−1
S∑
Note 1) The instrument’s apparent power (S), reactive power (Q), power factor ( ), and phase angle ( ) are calculated using measured values of voltage, current, and active power. (However, reactive power is calculated directly from sampled data when TYPE3 is selected.) Therefore, when distorted waveforms are input, these values may be different from those of other measuring instruments based on different measuring principals.
Note 2) The value of Q in the Q∑ calculation is calculated with a preceding minus sign (−) when the current input leads the voltage input, and a plus sign when it lags the voltage input, so the value of Q∑ may be negative.
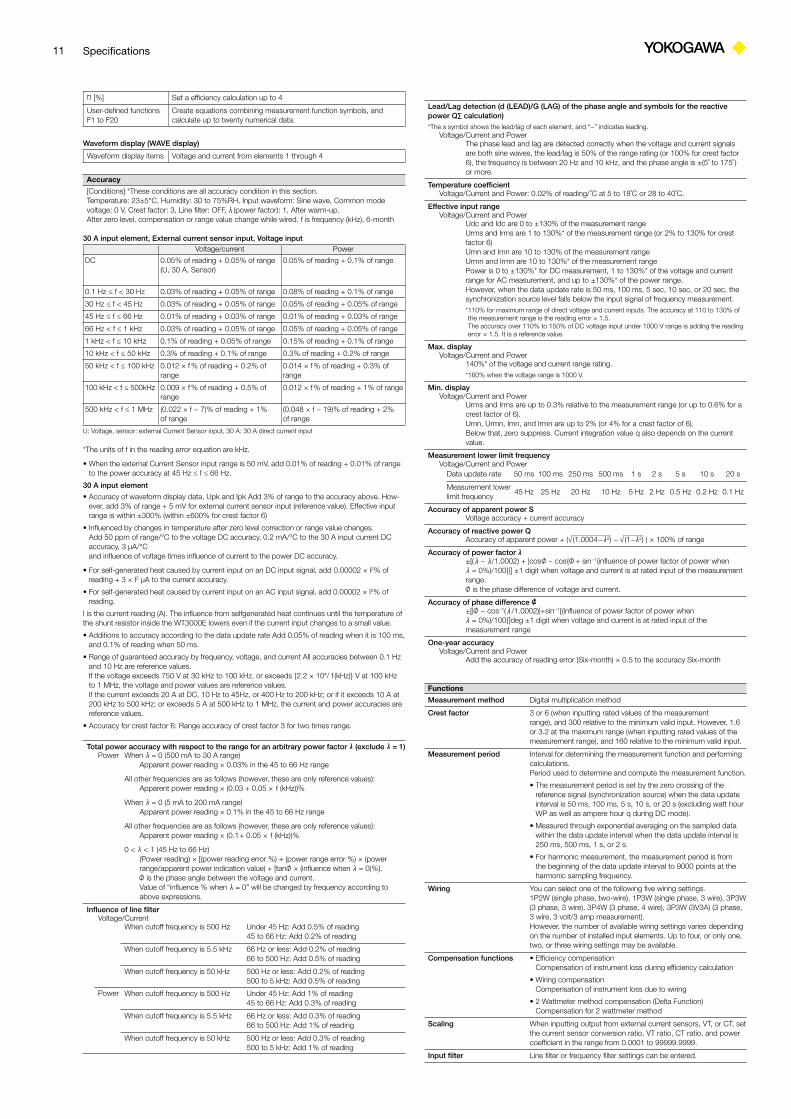
11 Specifications
[%] Set a efficiency calculation up to 4
User-defined functionsF1 to F20
Create equations combining measurement function symbols, and calculate up to twenty numerical data.
Waveform display (WAVE display)
Waveform display items Voltage and current from elements 1 through 4
Accuracy
[Conditions] *These conditions are all accuracy condition in this section.Temperature: 23±5°C, Humidity: 30 to 75%RH, Input waveform: Sine wave, Common mode voltage: 0 V, Crest factor: 3, Line filter: OFF, (power factor): 1, After warm-up.After zero level, compensation or range value change while wired. f is frequency (kHz), 6-month
30 A input element, External current sensor input, Voltage inputVoltage/current Power
DC 0.05% of reading + 0.05% of range (U, 30 A, Sensor)
0.05% of reading + 0.1% of range
0.1 Hz ≤ f < 30 Hz 0.03% of reading + 0.05% of range 0.08% of reading + 0.1% of range
30 Hz ≤ f < 45 Hz 0.03% of reading + 0.05% of range 0.05% of reading + 0.05% of range
45 Hz ≤ f ≤ 66 Hz 0.01% of reading + 0.03% of range 0.01% of reading + 0.03% of range
66 Hz < f ≤ 1 kHz 0.03% of reading + 0.05% of range 0.05% of reading + 0.05% of range
1 kHz < f ≤ 10 kHz 0.1% of reading + 0.05% of range 0.15% of reading + 0.1% of range
10 kHz < f ≤ 50 kHz 0.3% of reading + 0.1% of range 0.3% of reading + 0.2% of range
50 kHz < f ≤ 100 kHz 0.012 × f % of reading + 0.2% of range
0.014 × f % of reading + 0.3% of range
100 kHz < f ≤ 500kHz 0.009 × f % of reading + 0.5% of range
0.012 × f % of reading + 1% of range
500 kHz < f ≤ 1 MHz (0.022 × f − 7)% of reading + 1% of range
(0.048 × f − 19)% of reading + 2% of range
U: Voltage, sensor: external Current Sensor input, 30 A: 30 A direct current input
*The units of f in the reading error equation are kHz.
• When the external Current Sensor input range is 50 mV, add 0.01% of reading + 0.01% of range to the power accuracy at 45 Hz ≤ f ≤ 66 Hz.
30 A input element
• Accuracy of waveform display data, Upk and Ipk Add 3% of range to the accuracy above. How-ever, add 3% of range + 5 mV for external current sensor input (reference value). Effective input range is within ±300% (within ±600% for crest factor 6)
• Influenced by changes in temperature after zero level correction or range value changes. Add 50 ppm of range/°C to the voltage DC accuracy, 0.2 mA/°C to the 30 A input current DC accuracy, 3 μA/°C and influence of voltage times influence of current to the power DC accuracy.
• For self-generated heat caused by current input on an DC input signal, add 0.00002 × I2% of reading + 3 × I2 μA to the current accuracy.
• For self-generated heat caused by current input on an AC input signal, add 0.00002 × I2% of reading.
I is the current reading (A). The influence from selfgenerated heat continues until the temperature of the shunt resistor inside the WT3000E lowers even if the current input changes to a small value.
• Additions to accuracy according to the data update rate Add 0.05% of reading when it is 100 ms, and 0.1% of reading when 50 ms.
• Range of guaranteed accuracy by frequency, voltage, and current All accuracies between 0.1 Hz and 10 Hz are reference values. If the voltage exceeds 750 V at 30 kHz to 100 kHz, or exceeds {2.2 × 10⁴/ f (kHz)} V at 100 kHz to 1 MHz, the voltage and power values are reference values. If the current exceeds 20 A at DC, 10 Hz to 45Hz, or 400 Hz to 200 kHz; or if it exceeds 10 A at 200 kHz to 500 kHz; or exceeds 5 A at 500 kHz to 1 MHz, the current and power accuracies are reference values.
• Accuracy for crest factor 6: Range accuracy of crest factor 3 for two times range.
Total power accuracy with respect to the range for an arbitrary power factor (exclude = 1)Power When = 0 (500 mA to 30 A range)
Apparent power reading × 0.03% in the 45 to 66 Hz range
All other frequencies are as follows (however, these are only reference values):Apparent power reading × (0.03 + 0.05 × f (kHz))%
When = 0 (5 mA to 200 mA range)Apparent power reading × 0.1% in the 45 to 66 Hz range
All other frequencies are as follows (however, these are only reference values):Apparent power reading × (0.1+ 0.05 × f (kHz))%
0 < < 1 (45 Hz to 66 Hz)(Power reading) × [(power reading error %) + (power range error %) × (power range/apparent power indication value) + [tan × (influence when = 0)%}. is the phase angle between the voltage and current.Value of “influence % when = 0” will be changed by frequency according to above expressions.
Influence of line filterVoltage/Current
When cutoff frequency is 500 Hz Under 45 Hz: Add 0.5% of reading45 to 66 Hz: Add 0.2% of reading
When cutoff frequency is 5.5 kHz 66 Hz or less: Add 0.2% of reading66 to 500 Hz: Add 0.5% of reading
When cutoff frequency is 50 kHz 500 Hz or less: Add 0.2% of reading500 to 5 kHz: Add 0.5% of reading
Power When cutoff frequency is 500 Hz Under 45 Hz: Add 1% of reading45 to 66 Hz: Add 0.3% of reading
When cutoff frequency is 5.5 kHz 66 Hz or less: Add 0.3% of reading66 to 500 Hz: Add 1% of reading
When cutoff frequency is 50 kHz 500 Hz or less: Add 0.3% of reading500 to 5 kHz: Add 1% of reading
Lead/Lag detection (d (LEAD)/G (LAG) of the phase angle and symbols for the reactive power Q∑ calculation)*The s symbol shows the lead/lag of each element, and “−” indicates leading.
Voltage/Current and PowerThe phase lead and lag are detected correctly when the voltage and current signals are both sine waves, the lead/lag is 50% of the range rating (or 100% for crest factor 6), the frequency is between 20 Hz and 10 kHz, and the phase angle is ±(5˚ to 175˚ ) or more.
Temperature coefficientVoltage/Current and Power: 0.02% of reading/ ˚C at 5 to 18˚C or 28 to 40˚C.
Effective input rangeVoltage/Current and Power
Udc and Idc are 0 to ±130% of the measurement rangeUrms and Irms are 1 to 130%* of the measurement range (or 2% to 130% for crest factor 6)Umn and Imn are 10 to 130% of the measurement rangeUrmn and Irmn are 10 to 130%* of the measurement rangePower is 0 to ±130%* for DC measurement, 1 to 130%* of the voltage and current range for AC measurement, and up to ±130%* of the power range.However, when the data update rate is 50 ms, 100 ms, 5 sec, 10 sec, or 20 sec, the synchronization source level falls below the input signal of frequency measurement.* 110% for maximum range of direct voltage and current inputs. The accuracy at 110 to 130% of the measurement range is the reading error × 1.5. The accuracy over 110% to 150% of DC voltage input under 1000 V range is adding the reading error × 1.5. It is a reference value.
Max. displayVoltage/Current and Power
140%* of the voltage and current range rating.*160% when the voltage range is 1000 V.
Min. displayVoltage/Current and Power
Urms and Irms are up to 0.3% relative to the measurement range (or up to 0.6% for a crest factor of 6).Umn, Urmn, Imn, and Irmn are up to 2% (or 4% for a crest factor of 6).Below that, zero suppress. Current integration value q also depends on the current value.
Measurement lower limit frequencyVoltage/Current and Power
Data update rate 50 ms 100 ms 250 ms 500 ms 1 s 2 s 5 s 10 s 20 s
Measurement lower limit frequency
45 Hz 25 Hz 20 Hz 10 Hz 5 Hz 2 Hz 0.5 Hz 0.2 Hz 0.1 Hz
Accuracy of apparent power SVoltage accuracy + current accuracy
Accuracy of reactive power QAccuracy of apparent power + ( (1.0004− 2) − (1− 2) ) × 100% of range
Accuracy of power factor ±[( − /1.0002) + |cos − cos{ + sin−1(influence of power factor of power when = 0%)/100}|] ±1 digit when voltage and current is at rated input of the measurement range. is the phase difference of voltage and current.
Accuracy of phase difference ±[| − cos−1( /1.0002)|+sin−1{(influence of power factor of power when = 0%)/100}]deg ±1 digit when voltage and current is at rated input of the measurement range
One-year accuracyVoltage/Current and Power
Add the accuracy of reading error (Six-month) × 0.5 to the accuracy Six-month
Functions
Measurement method Digital multiplication method
Crest factor 3 or 6 (when inputting rated values of the measurementrange), and 300 relative to the minimum valid input. However, 1.6 or 3.2 at the maximum range (when inputting rated values of the measurement range), and 160 relative to the minimum valid input.
Measurement period Interval for determining the measurement function and performing calculations.Period used to determine and compute the measurement function.
• The measurement period is set by the zero crossing of the reference signal (synchronization source) when the data update interval is 50 ms, 100 ms, 5 s, 10 s, or 20 s (excluding watt hour WP as well as ampere hour q during DC mode).
• Measured through exponential averaging on the sampled data within the data update interval when the data update interval is 250 ms, 500 ms, 1 s, or 2 s.
• For harmonic measurement, the measurement period is from the beginning of the data update interval to 9000 points at the harmonic sampling frequency.
Wiring You can select one of the following five wiring settings.1P2W (single phase, two-wire), 1P3W (single phase, 3 wire), 3P3W (3 phase, 3 wire), 3P4W (3 phase, 4 wire), 3P3W (3V3A) (3 phase, 3 wire, 3 volt/3 amp measurement).However, the number of available wiring settings varies depending on the number of installed input elements. Up to four, or only one, two, or three wiring settings may be available.
Compensation functions • Efficiency compensation Compensation of instrument loss during efficiency calculation
• Wiring compensation Compensation of instrument loss due to wiring
• 2 Wattmeter method compensation (Delta Function) Compensation for 2 wattmeter method
Scaling When inputting output from external current sensors, VT, or CT, set the current sensor conversion ratio, VT ratio, CT ratio, and power coefficient in the range from 0.0001 to 99999.9999.
Input filter Line filter or frequency filter settings can be entered.

WT3000E Transformer Version 12Specifications
Averaging The average calculations below are performed on the normal measurement parameters of voltage U, current I, power P, apparent power S, reactive power Q. Power factor and phase angle are determined by calculating the average of P and S. Select exponential or moving averaging.
• Exponential average Select an attenuation constant of 2, 4, 8, 16, 32, or 64.
• Moving average Select the number of averages from 8, 16, 32, 64, 128, or 256.
The average calculations below are performed on the harmonic display items of voltage U, current I, power P, apparent power S, reactive power Q. Power factor l is determined by calculating the average of P and Q. Only exponential averaging is performed. Select an attenuation constant of 2, 4, 8, 16, 32 or 64.
Data update rate Select 50 ms, 100 ms, 250 ms, 500 ms, 1 s, 2 s, 5 s, 10 s, or 20 s.
Response time At maximum, two times the data update rate (only during numerical display)
Hold Holds the data display.
Single Executes a single measurement during measurement hold.
Zero level compensation/Null Compensates the zero level.
Integration
Mode Select a mode of Manual, Standard, Continuous (repeat), Real Time Control Standard, or Real Time Control Continuous (Repeat).
Timer Integration can be stopped automatically using the integration timer setting. 0000 h 00 m 00 s to 10000 h 00 m 00 s
Count over If the count over integration time reaches the maximum integration time (10000 hours), or if the integration value reaches max/min display integration value (±999999 M), the elapsed time and value is saved and the operation is stopped.
Accuracy ±[power accuracy (or current accuracy) + time accuracy]
Time accuracy ±0.02% of reading
Display
Numerical display functionDisplay resolution 600000
Number of display items Select 4, 8, 16, all, single list, or dual list.
Waveform display itemsNo. of display rasters 501
Display format Peak-peak compressed data
Time axis Range from 0.5 ms to 2 s/div. However, it must be 1/10th of the data update rate.
TriggersTrigger type Edge type
Trigger mode Select Auto, Normal or OFF. Triggers are turned OFF automatically during integration.
Trigger source Select from the voltage or current applied to the input element and external clock.
Trigger slope Select (Rising), (Falling), or (Rising/Falling).
Trigger level When the trigger source is the voltage or current input to the input elements. Set in the range from the center of the screen to ±100% (top/bottom edge of the screen). Setting resolution: 0.1%When the trigger source is Ext Clk, TTL level.
Vertical axis zoom Voltage and current input to the waveform vertical axis zoom input element can be zoomed along the vertical axis.Set in the range of 0.1 to 100 times.
ON/OFF ON/OFF can be set for each voltage and current input to the input element.
Format You can select 1, 2, 3 or 4 splits for the waveform display.
Interpolation Select dot or linear interpolation.
Graticule Select grid or cross scale display.
Other display ON/OFF Upper/lower limit (scale value), and waveform label ON/OFF.
Cursor measurements When you place the cursor on the waveform, the value of that point is measured.
Zoom function No time axis zoom function* Since the sampling frequency is approximately 200 kHz, waveforms that can be accurately reproduced are those of about 10 kHz.
Vector display/Bar graph display (requires /G6 option)Vector display Vector display of the phase difference in the fundamental waves of
voltage and current. (without Single Input Element model)
Bar graph display Displays the size of each harmonic in a bar graph.
Trend display Number of measurement channels Up to 16 parameters.Displays trends (transitions) in numerical data of the measurement functions in a sequential line graph.
Simultaneous display Two windows can be selected (from numerical display, waveform display, bar graph display, or trend display) and displayed in the upper and lower parts of the screen.
Saving and loading data
Settings, waveform display data, numerical data, and screen image data can be saved to media.*Saved settings can be loaded from a medium.*PC card, USB memory
Store function
Internal memory size Approx. 30 MB
Store interval (waveform OFF) Maximum 50 msec to 99 hour 59 minutes 59 seconds.
Guideline for Storage Time (Waveform display OFF, Integration function OFF)
Number of measurement channels
Measured items (Per CH) Storage interval Storable Amnt. of data
2 ch 3 50 ms Approx. 10 hr 20 m
2 ch 10 1 sec Approx. 86 hr
4 ch 10 50 ms Approx. 2 hr 30 m
4 ch 20 1 sec Approx. 24 hr
Note: Depending on the user-defined math, integration, and other settings, the actual measurement time may be shorter than stated above. Store function can’t use in combination with auto print function.
Delta calculation function
Item Specifications
Voltage (V) difference ∆U1: Differential voltage determined by computation u1 and u2
3P3W -> 3V3A ∆U1: Line voltage that are not measured but can be computed for a threephase, three-wire system
DELTA -> STAR ∆U1, ∆U2, ∆U3: Line voltage that can be computed for a three phase, three-wire (3V3A) system
STAR -> DELTA ∆U1, ∆U2, ∆U3: Neutral line voltage that can be computed for a three phase, four-wire system
Current (A) difference ∆I1: Differential current determined by computation
3P3W -> 3V3A Phase current that are not measured but can be computed
DELTA -> STAR Neutral line current
STAR -> DELTA Neutral line current
Cycle-by-cycle measurement
Measurement items Freq (Synch source frequency), U, I, P, S, Q,
Synch source Select an external source of U1, I1, U2, I2, U3, I3, U4, or I4.(the above parameters are measured continuously for each cycle of the one sync source signal)
Number of measurements 10 to 3000
Timeout time 0, 1 to 3600 seconds (set in units of seconds). (when it is set to 0, it is approx. 24 hours)
Synch source frequency range
1 Hz to 1000 Hz (for U and I) 0.1 Hz to 1000 Hz (for Ext Clk)
Accuracy U, I, P Add [(0.3 + 2 × f )% of reading + ((0.05 + 0.05 × f )% of range] to the accuracy for
normal measurement. For external current sensor input, Add (100 + 100 × f ) µV to the accuracy.
Freq Add [(0.3 + 2 × f )% of reading to the accuracy for normal measurement.
*f is kHz
Added frequency measurement (/FQ Optional)
Device under measurement
If the frequency option (/FQ) is installed, the frequencies of the voltages and currents being input to all input elements can be measured.
Measurement method
Reciprocal method
Measurement range Data update rate Measuring range
50 ms 45Hz ≤ f ≤ 1 MHz
100 ms 25Hz ≤ f ≤ 1 MHz
250 ms 10 Hz ≤ f ≤ 500 kHz
500 ms 5 Hz ≤ f ≤ 200 kHz
1 s 2.5 Hz ≤ f ≤ 100 kHz
2 s 1.5 Hz ≤ f ≤ 50 kHz
5 s 0.5 Hz ≤ f ≤ 20 kHz
10 s 0.25 Hz ≤ f ≤ 10 kHz
20 s 0.15 Hz ≤ f ≤ 5 kHz
Accuracy ±0.05% of readingWhen the input signal levels are greater than or equal to 25 mV (external current sensor input) and 150 mA (current direct input of 30 A input element) respectively, and the signal is greater than or equal to 30% (0.1 Hz to 440 Hz, frequency filter ON), 10% (440 Hz to 500 kHz), or 30% (500 kHz to 1 MHz) of the measurement range. However, when the measuring frequency is smaller or equal to 2 times of above lower frequency, the input signal is greater than or equal to 50%. Add 0.05% of reading when external current input is smaller than or equal to 50 mV input signal level for each is double for crest factor 6.
Built-in printer (/B5 Optional)
Printing method Thermal line-dot
Dot density 8 dots/mm
Paper width 112 mm
Effective recording width 104 mm
Recorded information Screenshots, list of measured values, harmonic bar graph printouts, settings
Auto print function Measured values are printed out automatically. However, auto print function can’t use in combination with store function.

13 Specifications
RGB video signal (VGA) output section (/V1 Optional)
Connector type 15-pin D-Sub (receptacle)
Output format VGA compatible
Advanced calculation (/G6)
Wide bandwidth harmonic measurementMeasured source All installed elements
Format • PLL synchronization method
When the PLL source is not set to Smp Clk• External sampling clock method
When the PLL source is set to Smp Clk
Frequency range
• PLL synchronization method Fundamental frequency of the PLL source is in the range of 10 Hz to 2.6 kHz.
• External sampling clock method Input a sampling clock signal having a frequency that is 3000 times the fundamental frequency between 0.1 Hz and 66 Hz of the waveform on which to perform harmonic measurement. The input level is TTL. The input waveform is a rectangular wave with a duty ratio of 50%.
PLL source
• Select the voltage or current of each input element (external current sensor range is greater than or equal to 500 mV) or the external clock (Ext Clk or Smp Clk).
• Input level Greater than or equal to 50% of the measurement range rating when the crest factor is 3 Greater than or equal to 100% of the measurement range rating when the crest factor is 6
• Turn the frequency filter ON when the fundamental frequency is less than or equal to 440 Hz.
FFT data length 9000
FFT processing word length
32 bits
Window function Rectangular
Anti-aliasing filter Set using a line filter (OFF, 500 Hz, 5.5 kHz, or 50 kHz).
Sample rate (sampling frequency), window width, and upper limit of measured orderPLL source synchronization method
Fundamental frequency of the PLL
source (Hz)
Sample rate (S/s)
Window width against the FFT data length
(Frequency of the fundamental wave)
Upper limit of the measured order
10 to 20 f × 3000 3 100
20 to 40 f × 1500 6 100
40 to 55 f × 900 10 100
55 to 75 f × 750 12 100
75 to 150 f × 450 20 62
150 to 440 f × 360 25 62
440 to 1100 f × 150 60 62
1100 to 2600 f × 60 150 20
External sampling clock method
Fundamental frequency of the PLL
source (Hz)
Sample rate (S/s)
Window width against the FFT data length
(Frequency of the fundamental wave)
Upper l imit of the measured order
0.1 to 66 f × 3000 3 100
Accuracy ±(Reading error + Range error)
When the line filter (500 Hz) is ONFrequency Voltage and Current Power
0.1 Hz ≤ f < 10 Hz 0.7% of reading + 0.3% of range 1.4% of reading + 0.4% of range
10 Hz ≤ f < 30 Hz 0.7% of reading + 0.3% of range 1.4% of reading + 0.4% of range
30 Hz ≤ f < 66 Hz 0.7% of reading + 0.05% of range 1.4% of reading + 0.1% of range
When the line filter (5.5 kHz) is ONFrequency Voltage and Current Power
0.1 Hz ≤ f < 10 Hz 0.25% of reading + 0.3% of range 0.5% of reading + 0.4% of range
10 Hz ≤ f < 30 Hz 0.25% of reading + 0.3% of range 0.5% of reading + 0.4% of range
30 Hz ≤ f ≤ 66 Hz 0.3% of reading + 0.05% of range 0.45% of reading + 0.1% of range
66 Hz < f ≤ 440 Hz 0.6% of reading + 0.05% of range 1.2% of reading + 0.1% of range
440 Hz < f ≤ 1 kHz 1% of reading + 0.05% of range 2% of reading + 0.1% of range
1 kHz < f ≤ 2.5 kHz 2.5% of reading + 0.05% of range 5% of reading + 0.15% of range
2.5 kHz < f ≤ 3.5 kHz 8% of reading + 0.05% of range 16% of reading + 0.15% of range
If the fundamental frequency is between 1 kHz and 2.6 kHz• Add 0.5% of reading to the voltage and current accuracy for frequencies greater than 1 kHz.• Add 1% of reading to the power accuracy for frequencies greater than 1 kHz.
When the line filter (50 kHz) is ONFrequency Voltage and Current Power
0.1 Hz ≤ f < 10 Hz 0.25% of reading + 0.3% of range 0.45% of reading + 0.4% of range
10 Hz ≤ f < 30 Hz 0.25% of reading + 0.3% of range 0.45% of reading + 0.4% of range
30 Hz ≤ f ≤ 440 Hz 0.3% of reading + 0.05% of range 0.45% of reading + 0.1% of range
440 Hz < f ≤ 1 kHz 0.7% of reading + 0.05% of range 1.4% of reading + 0.1% of range
1 kHz < f ≤ 5 kHz 0.7% of reading + 0.05% of range 1.4% of reading + 0.15% of range
5 kHz < f ≤ 10 kHz 3.0% of reading + 0.05% of range 6% of reading + 0.15% of range
If the fundamental frequency is between 1 kHz and 2.6 kHz• Add 0.5% of reading to the voltage and current accuracy for frequencies greater than 1 kHz.• Add 1% of reading to the power accuracy for frequencies greater than 1 kHz.
When the line filter is OFFFrequency Voltage and Current Power
0.1 Hz ≤ f < 10 Hz 0.15% of reading + 0.3% of range 0.25% of reading + 0.4% of range
10 Hz ≤ f < 30 Hz 0.15% of reading + 0.3% of range 0.25% of reading + 0.4% of range
30 Hz ≤ f ≤ 1 kHz 0.1% of reading + 0.05% of range 0.2% of reading + 0.1% of range
1 kHz < f ≤ 10 kHz 0.3% of reading + 0.05% of range 0.6% of reading + 0.15% of range
10 kHz < f ≤ 55 kHz 1% of reading + 0.2% of range 2% of reading + 0.4% of range
If the fundamental frequency is between 400 Hz and 1 kHz• Add 1.5% of reading to the voltage and current accuracy for frequencies greater than
10 kHz.
• Add 3% of reading to the power accuracy for frequencies greater than 10 kHz.
If the fundamental frequency is between 1 kHz and 2.6 kHz
• Add 0.5% of reading to the voltage and current accuracy for frequencies greater than 1 kHz and less than or equal to 10 kHz.
• Add 7% of reading to the voltage and current accuracy for frequencies greater than 10 kHz. Add 1% of reading to the power accuracy for frequencies greater than 1 kHz and less than equal to 10 kHz. Add 14% of reading to the power accuracy for frequencies greater than 10 kHz.
However, all the items below apply to all tables.
• When the crest factor is set to 3
• When (power factor) = 1
• Power figures that exceed 440 Hz are reference values.
• For external current sensor range, add 0.2 mV to the current accuracy and add (0.2 mV/external current sensor range rating) × 100% of range to the power accuracy.
• For 30 A direct current input range, add 0.2 mA to the current accuracy and add (0.2 mA/direct current input range rating) × 100% of range to the power accuracy.
• For nth order component input, add {n/(m+1)}/50% of (the nth order reading) to the n+mth order and n−mth order of the voltage and current, and add {n/(m+1)}/25% of (the nth order reading) to the n+mth order and n−mth order of the power.
• Add (n/500)% of reading to the nth component of the voltage and current, and add (n/250)% of reading to the nth component of the power.
• Accuracy when the crest factor is 6: The same as when the range is doubled for crest factor 3.
• The accuracy guaranteed range by frequency and voltage/current is the same as the guaranteed range of normal measurement.
Frequency measurement range • PLL synchronization method: 2.5 Hz ≤ f ≤ 100 kHz• External sampling clock method: 0.15 Hz ≤ f ≤ 5 kHz
Display update(Depends on the PLL source)
• PLL synchronization method: 1 s or more• External sampling clock method: 20 s or more
PPL timeout value(Depends on the PLL source)
• PLL synchronization method: 5 s or more• External sampling clock method: 40 s or more
IEC Harmonic Measurement (IEC Harmonic/Flicker measurement software 761922 is required.)
Measured source Select an input element or an ∑ wiring unit
Format PLL synchronization method
Frequency range Fundamental frequency of the PLL source is in the range of 45 Hz to 66 Hz.
PLL source • Select the voltage or current of each input element (external current sensor range is greater than or equal to 500 mV) or the external clock (fundamental frequency).
• Input level Greater than or equal to 50% of the measurement range rating when the crest factor is 3 Greater than or equal to 100% of the measurement range rating when the crest factor is 6
• Be sure to turn the frequency filter ON.
FFT data length 9000
FFT processing word length 32 bits
Window function Rectangular
Anti-aliasing filter Set using a line filter (cut off is 5.5 kHz).
Interharmonic measurement Select OFF, Type1, or Type2.
Sample rate (sampling frequency), window width, and upper limit of measured order
Fundamental frequency of the PLL
source (Hz)
Sample rate(S/s)
Window width against the FFT data length
(Frequency of the fundamental wave)
Upper limit of the measured order
45 to 55 f × 900 10 50
55 to 66 f × 750 12 50

WT3000E Transformer Version 14Specifications
Accuracy ±(Reading error + Range error)
When the line filter (5.5 kHz) is ONFrequency Voltage and Current Power
45 Hz ≤ f ≤ 66 Hz 0.2% of reading + 0.04% of range 0.4% of reading + 0.05% of range
66 Hz < f ≤ 440 Hz 0.5% of reading + 0.05% of range 1.2% of reading + 0.1% of range
440 Hz < f ≤ 1 kHz 1% of reading + 0.05% of range 2% of reading + 0.1% of range
1 kHz < f ≤ 2.5 kHz 2.5% of reading + 0.05% of range 5% of reading + 0.15% of range
2.5 kHz < f ≤ 3.3 kHz 8% of reading + 0.05% of range 16% of reading + 0.15% of range
However, all the items below apply.• When the crest factor is set to 3
• When (power factor) = 1
• Power figures that exceed 440 Hz are reference values.
• For external current sensor range, add 0.03 mV to the current accuracy and add (0.03 mV/ external current sensor range rating) × 100% of range to the power accuracy.
• For 30 A direct current input range, add (0.1 mA/direct current input range rating) × 100% of range to the power accuracy.
• For direct current input in a range less than or equal to 200-mA on the 2-A input element, add 0.02% of reading + 0.01% of range to the current accuracy in the range of 45 Hz ≤ f ≤ 66 Hz and add 0.03% of reading + 0.01% of range to the power accuracy.
• For nth order component input, add {n/(m+1)}/50% of (the nth order reading) to the n+mth
order and n−mth order of the voltage and current, and add {n/(m+1)}/25% of (the nth order reading) to the n+mth order and n−mth order of the power (only when applying a single frequency).
• Accuracy when the crest factor is 6: The same as when the range is doubled for crest factor 3.
• The accuracy guaranteed range by frequency and voltage/current is the same as the guaranteed range of normal measurement.
Frequency measurement range 45 Hz ≤ f ≤ 1 MHz
Display update Depends on the PLL source (Approx. 200 ms when the frequency of the PLL source is 45 Hz to 66 Hz.)
Waveform computation function (Waveform calculation function (MATH) cannot be used with FFT calculation at the same time.)
Computed source Voltage waveform, current waveform, analog input waveform of torque and speed waveform calculation, FFT performing data
Data type Voltage, current, and active power of each input element;
Equation Two equations (MATH1 and MATH2
Operator +, −, ×, /, ABS (absolute value), SQR (square), SQRT (square root), LOG (natural logarithm), LOG10 (common logarithm), EXP (exponent), NEG (negation), AVG2, AVG4, AVG8, AVG16, AVG32, AVG64 (exponential average).
Sampling clock Fixed to 200 kHz
Display update Data update interval + computing time
FFT function specifications (Waveform calculation function (MATH) cannot be used with FFT calculation at the same time.)
Computed source Voltage, current, active power, and reactive power of each input element.Active power and reactive power of an ∑ wiring unit.
Type PS (power spectrum)
Number of computations Two computations (FFT1 and FFT2)
Maximum frequency of analysis 100 kHz
Number of points 20000 points or 200000 points
Measurement period for the computation
100 ms or 1 s** The measurement period is 1 s when the number of FFT points is 200 k (when the frequency resolution is 1 Hz). The measurement period is 100 ms when the number of FFT points is 20 k (when the frequency resolution is 10 Hz).
Frequency resolution 10 Hz or 1 Hz
Window function Rectangular, Hanning, or Flattop
Anti-aliasing filter Set using a line filter (OFF, 500 Hz, 5.5 kHz, or 50 kHz).
Sampling clock Fixed to 200 kHz
Display update Data update rate or (measurement period of the FFT + FFT computing time), whichever is longer
Harmonic measurement in normal measurement (To measure and display harmonic data requires a data update rate of 500 ms or more)
Measured source All installed elements
Format PLL synchronization method
Frequency range Range in which the fundamental frequency of the PLL source is 10 Hz to 2600 Hz
PLL source
• Select the voltage or current of each input element (external current sensor range is greater than or equal to 500 mV) or the external clock (Ext Clk).
• Input level Greater than or equal to 50% of the measurement range rating when the crest factor is 3 Greater than or equal to 100% of the measurement range rating when the crest factor is 6
• Turn the frequency filter ON when the fundamental frequency is less than or equal to 440 Hz.
FFT data length 9000
FFT processing word length 32 bits
Window function Rectangular
Anti-aliasing filter Set using a line filter (OFF. 5.5 kHz or 50 kHz).
Sample rate (sampling frequency), window width, and upper limit of measured order during PLL synchronization
Fundamental the PLL source (Hz)
Sample rate (S/s)
Window width against the FFT data length
(Frequency of the fundamental wave)
Upper limit of the measured order
10 to 20 f × 3000 3 100
20 to 40 f × 1500 6 100
40 to 55 f × 900 10 100
55 to 75 f × 750 12 100
75 to 150 f × 450 20 50
150 to 440 f × 360 25 15
440 to 1100 f × 150 60 7
1100 to 2600 f × 60 150 3
Accuracy ±(Reading error + Range error)
When the line filter (5.5 kHz) is ONFrequency Voltage and Current Power
10 Hz ≤ f < 30 Hz 0.25% of reading + 0.3% of range 0.5% of reading + 0.4% of range
30 Hz ≤ f ≤ 66 Hz 0.2% of reading + 0.15% of range 0.4% of reading + 0.15% of range
66 Hz < f ≤ 440 Hz 0.5% of reading + 0.15% of range 1.2% of reading + 0.15% of range
440 Hz < f ≤ 1 kHz 1.2% of reading + 0.15% of range 2% of reading + 0.15% of range
1 kHz < f ≤ 2.5 kHz 2.5% of reading + 0.15% of range 6% of reading + 0.2% of range
2.5 kHz < f ≤ 3.5 kHz 8% of reading + 0.15% of range 16% of reading + 0.3% of range
If the fundamental frequency is between 1 kHz and 2.6 kHz, add 0.5% of reading to the voltage and current accuracy and 1% of reading to the power accuracy when the frequency exceeds 1 kHz.
When the line filter (50 kHz) is ONFrequency Voltage and Current Power
10 Hz ≤ f < 30 Hz 0.25% of reading + 0.3% of range 0.45% of reading + 0.4% of range
30 Hz ≤f ≤ 440 Hz 0.2% of reading + 0.15% of range 0.4% of reading + 0.15% of range
440 Hz < f ≤ 2.5 kHz 1% of reading + 0.15% of range 2% of reading + 0.2% of range
2.5 kHz < f ≤ 5 kHz 2% of reading + 0.15% of range 4% of reading + 0.2% of range
5 kHz < f ≤ 7.8 kHz 3.5% of reading + 0.15% of range 6.5% of reading + 0.2% of range
If the fundamental frequency is between 1 kHz and 2.6 kHz, add 0.5% of reading to the voltage and current accuracy and 1% of reading to the power accuracy when the frequency exceeds 1 kHz.
When the line filter is OFFFrequency Voltage and Current Power
10 Hz ≤ f < 30 Hz 0.15% of reading + 0.3% of range 0.25% of reading + 0.4% of range
30 Hz ≤ f ≤ 440 Hz 0.1% of reading + 0.15% of range 0.2% of reading + 0.15% of range
440 Hz < f ≤ 2.5 kHz 0.6% of reading + 0.15% of range 1.2% of reading + 0.2% of range
2.5 kHz < f ≤ 5 kHz 1.6% of reading + 0.15% of range 3.2% of reading + 0.2% of range
5 kHz < f ≤ 7.8 kHz 2.5% of reading + 0.15% of range 5% of reading + 0.2% of range
If the fundamental frequency is between 1 kHz and 2.6 kHz, add 0.5% of reading to the voltage and current accuracy and 1% of reading to the power accuracy when the frequency exceeds 1 kHz.
However, all the items below apply to all tables.
• When averaging is ON, the averaging type is EXP, and the attenuation constant is greater than or equal to 8.
• When the crest factor is set to 3
• When (power factor) = 1
• Power exceeding 440 Hz are reference value.
• For external current sensor range, add 0.2 mV to the current accuracy and add (0.2 mV/ external current sensor range rating) × 100% of range to the power accuracy.
• For 30 A direct current input range, add 0.2 mA to the current accuracy and add (0.2 mA/ direct current input range rating) × 100% of range to the power accuracy.
• For nth order component input, add {n/(m+1)}/50% of (the nth order reading) to the n+mth order and n−mth order of the voltage and current, and add {n/(m+1)}/25% of (the nth order reading) to the n+mth order and n−mth order of the power.
• Add (n/500)% of reading to the nth component of the voltage and current, and add (n/250)% of reading to the nth component of the power.
• Accuracy when the crest factor is 6: The same as when the range is doubled for crest factor 3.
• The accuracy guaranteed range by frequency and voltage/current is the same as the guaranteed range of normal measurement.
If the amplitude of the high frequency component is large, influence of approximately 1% may appear in certain orders. The influence depends on the size of the frequency component. Therefore, if the frequency component is small with respect to the range rating, this does not cause a problem.
Waveform sampling data saving functionParameters Voltage waveform, current waveform, FFT performing data
Data type CSV format, WVF format
Storage PCMCIA, USB memory (/C5)
GP-IB Interface
Use one of the following by NATIONAL INSTRUMENTS:
• GPIB-USB-HS• PCI-GPIB and PCI-GPIB+• PCMCIA-GPIB and PCMCIA-GPIB+Use driver NI-488.2M version 1.60 or later excepting version 2.3.
Conforms electrically and mechanically
IEEE St’d 488-1978 (JIS C 1901-1992).

15 Specifications
Functional specification SH1, AH1, T6, L4, SR1, RL1, PP0, DC1, DT1, and C0.
Conforms to protocol IEEE St’d 488.2-1992.
Encoding ISO (ASCII)
Mode Addressable mode
Address 0 to 30
Clear remote mode Remote mode can be cleared using the LOCAL key (except during Local Lockout).
Ethernet communications (/C7)
Number of communication ports
1
Connector type RJ-45 connector
Electrical and mechanical specifications
Conforms to IEEE 802.3.
Transmission system 100BASE-TX/10BASE-T
Transmission rate 10 Mbps/100Mbps
Protocol TCP/IP
Supported Services FTP server, FTP client (network drive), LPR client (network printer), SMTP client (mail transmission), Web server, DHCP, DNS, Remote control
USB port (PC) (/C12 optional) Connector Type B connector (receptacle)
Electrical and mechanical specifications
Conforms to USB Rev.1.1
Speed Max. 12 Mbps
Number of ports 1
Supported service Remote control
Supported systems Models with standard USB ports that run Windows Vista, Windows7 or Windows8/8.1 with USB port as a standard. (A separate device driver is required for connecting to a PC.)
USB port (Peripheral) (/C5)
Connector Type A connector (receptacle)
Electrical and mechanical specifications
Conforms to USB Rev.1.1
Speed Max. 12 Mbps
Number of ports 2
Supported keyboards 104 keyboard (US) and 109 keyboard (Japanese) conforming to USB HID Class Ver.1.1devices
Supported USB memory devices
USB (USB memory) flash memory
Power supply 5 V, 500 mA* (per port)* However, device whose maximum current consumption exceeds 100 mA cannot be connected simultaneously to the two ports.
External I/O
I/O Section for master/slave synchronization signalsConnector type BNC connector: Both slave and master
External clockinput section
Connector type BNC connector
Input level TTL
Inputting the synchronization source as the Ext Clk of normal measurement.Frequency range Same as the measurement range for frequency measurement.
Input waveform 50% duty ratio square wave
Inputting the PLL source as the Ext Clk of harmonic measurement.Frequency range 10 Hz to 2.6 kHz
Input waveform 50% duty ratio square wave
Inputting the external sampling clock (Smp Clk) of wide bandwidth harmonic measurement.Frequency range 3000 times the frequency of 0.1 Hz to 66 Hz
Input waveform 50% duty ratio square wave
For triggersMinimum pulse width 1 μs
Trigger delay time Within (1 μs + 1 sample rate)
PC card interface TYPE II (Flash ATA card)
General specifications
Warm-up time Approx. thirty minutes.
Operating temperature +5 to +40°C
Operating humidity 20 to 80% (when printer not used), 35 to 80% RH (when printer is used) (no condensation)
Operating altitude 2000 m or less
Installation location Indoors
Storage environment −25 to +60°C
Storage humidity 20 to 80% RH (no condensation)
Rated supply voltage 100 to 240 VAC
Allowed supply voltage fluctuation range
90 to 264 VAC
Rated supply frequency 50/60 Hz
Allowed supply frequency fluctuation
48 to 63 Hz
Maximum power consumption 150 VA (when using built-in printer)
Weight Approx. 15 kg (including main unit, 4 input elements, and options)
Battery backup Setup information and internal clock are backed up with the lithium battery
Exterior
13 426 13 32 427 35
177
20
32
unit : mm
Due to the nature of this product, it is possible to touch its metal parts. Therefore, there is a risk of electric shock, so the product must be used with caution.
*1 Maximum diameters of cables that can be connected to the adapters 758923 core diameter: 2.5 mm or less; sheath diameter: 4.8 mm or less 758931 core diameter: 1.8 mm or less; sheath diameter: 3.9 mm or less
*2 Use with a low-voltage circuit (42 V or less)
*3 The coax cable is simply cut on the current sensor side. Preparation by the user is required.
Adapters and Cables
758917Measurement leads
Two leads in a set. Use 758917 in combination with 758922 or758929. Total length: 75 cm Rating: 1000 V, 32 A
701959Safety mini-clip set (hook type)
2 pieces (red and black) in one set. Rating 1000 V
758924Conversion adapter
For conversion between male BNC and female banana plug
366924/25*2
BNC cable
(BNC-BNC 1 m/2 m) For connection to simultaneously measurement with 2 units, or for input external trigger signal.
B9284LK*3
External sensor cable
For connection the external input of the WT3000E to current sensor. Length:50 cm
758922Small alligator adapters
For connection to measurement leads (758917). Two in a set. Rating: 300 V
758929Large alligator adapters
For connection to measurement leads (758917). Two in a set. Rating: 1000 V
758923*1
Safety terminal adapter set
(spring-hold type) Two adapters in a set.
758931*1
Safety terminal adapter set
Screw-fastened adapters. Two adapters in a set. 1.5 mm Allen wrench included for tightening.
758921Fork terminal adapter
Two adapters (red and black) to a set. Used when attaching banana plug to binding post.

Model and Suffix codeModel Suffix Code DescriptionWT3003E_T-2A0-30A3 WT3000E Transformer Version, 3 input elements
WT3004E_T-2A0-30A4 WT3000E Transformer Version, 4 input elements
Power Cord -F VDE Standard-Q BS Standard
Options /C12 Communication with PC by USB connection type B/FQ Frequency measurements on every element /V1 VGA output to external monitor/B5 Internal printer
Standard in the WT3000E Transformer Version
GPIB communicationAdvanced calculation and harmonicsEthernet port (100BASE-TX/10BASE-T)USB ports, for screenshots, data and settings on USB memory.
Accessory (sold separately)Model/parts number Product Description Order Q’ty
758917 Test lead setA set of 0.8 m long, red and black test leads
1
758922 Small alligator-clip Rated at 300 V and used in a pair 1758929 Large alligator-clip Rated at 1000 V and used in a pair 1758923 Safety terminal adapter (spring-hold type) Two adapters to a set. 1
758931 Safety terminal adapter(screw-fastened type) Two adapters to a set. 1.5 mm hex Wrench is attached
1
758921 Fork terminal adapterBanana-fork adapter. Two adapters to a set
1
701959 Safety mini-clip Hook type. Two in a set 1758924 Conversion adapter BNC-banana-jack (female) adapter 1366924 * BNC-BNC cable 1 m 1366925 * BNC-BNC cable 2 m 1
B9284LK External sensor cableCurrent sensor input connector. Length 0.5 m
1
B9316FX Printer roll pager Thermal paper, 10 meters (1 roll) 10
Due to the nature of this product, it is possible to touch its metal parts. Therefore, there is a risk of electric shock, so the product must be used with caution.
*Use these products with low-voltage circuits (42V or less).
Application SoftwareModel Product Description Order Q’ty760122 WTViewer Software Data acquisition software 1
Rack MountModel Product Description751535-E4 Rack mounting kit For EIA751535-J4 Rack mounting kit For JIS
Subject to Change without notice.Copyright © 2017, Yokogawa Electric Corporation
Copyright © 2017, Yokogawa Meters & Instruments Corporation[Ed: 01]
Printed in Japan, 506(KP)YOKOGAWA CORPORATION OF AMERICA Phone: +1-770-253-7000 Facsimile: +1-770-254-0928YOKOGAWA EUROPE B.V. Phone: +31-88-4641000 Facsimile: +31-88-4641111YOKOGAWA SHANGHAI TRADING CO., LTD. Phone: +86-21-6239-6363 Facsimile: +86-21-6880-4987YOKOGAWA ELECTRIC KOREA CO., LTD. Phone: +82-2-2628-3810 Facsimile: +82-2-2628-3899YOKOGAWA ENGINEERING ASIA PTE. LTD. Phone: +65-6241-9933 Facsimile: +65-6241-2606YOKOGAWA INDIA LTD. Phone: +91-80-4158-6000 Facsimile: +91-80-2852-8656YOKOGAWA ELECTRIC CIS LTD. Phone: +7-495-737-7868 Facsimile: +7-495-737-7869YOKOGAWA AMERICA DO SUL LTDA. Phone: +55-11-5681-2400 Facsimile: +55-11-5681-4434YOKOGAWA AUSTRALIA PTY. LTD. Phone: +61-2-8870-1100 Facsimile: +61-2-8870-1111YOKOGAWA MIDDLE EAST & AFRICA B.S.C(c) Phone: +973-17-358100 Facsimile: +973-17-336100 http://tmi.yokogawa.com/
YOKOGAWA METERS & INSTRUMENTS CORPORATIONGlobal Sales Dept. /Phone: +81-422-52-6237 Facsimile: +81-422-52-6462E-mail: [email protected]
nAny company’s names and product names mentioned in this document are trade names, trademarks or registered trademarks of their respective companies.
• Yokogawa’s electrical products are developed and produced in facilities that have received ISO14001 approval.
• In order to protect the global environment, Yokogawa’s electrical products are designed in accordance with Yokogawa’s Environmentally Friendy Product Design Guidelines and Product Design Assessment Criteria.
Yokogawa’s Approach to Preserving the Global Environment
Safety terminal adapter 758931
Standard accessoriesPower cord, spare power fuse, rubber feet, current input protective cover, user’s manual, expanded user’s manual, communication interface user’s manual, printer roll paper(provided only with /B5), Safety terminal adapter 758931(provided two adapters in a set times input element number)
* *Cable B9284LK (light blue) for external current sensor input is sold separately. Safety terminal adapter 758931 is included with the WT3000E Transformer Version. Other cables and adapters must be purchased by the user..
NOTICE● Before operating the product, read the user's manual thoroughly for proper and
safe operation.
Typical voltage/current connections
Measurement using current sensorConnection example
Unit whose current is to be measured
Power meter’s current input terminals Four load resistors*
(B8200JR) connected inparallelConnector
(B8200JQ)
DC power supply (15 V, 1 A)
Current sensor
Measurement using voltage input terminal
Power meter’s voltage input terminal
758917
758923
701959
758921
758922
758929
758931
Unit whose currentis to be measured


