3D Kinematics Methods and Instrumentation Santiago De Grau and Jess Valic October 28, 2014.

Prospectus, October 1, 2020
VALIC Company I
VALIC Company I (“VC I”) is a mutual fund complex made up of 34 separate funds (each, a “Fund”, and collectively, the “Funds”). Each of the Funds has its own investment objective. Thirty- of the Funds are explained in more detail in this prospectus.
Asset Allocation Fund VCAAX
Blue Chip Growth Fund VCBCX
Capital Conservation Fund VCCCX
Core Equity Fund VCCEX
Dividend Value Fund VCIGX
Dynamic Allocation Fund VDAFX
Emerging Economies Fund VCGEX
Global Real Estate Fund VGREX
Global Strategy Fund VGLSX
Government Money Market I Fund VCIXX
Government Securities Fund VCGSX
Growth Fund VCULX
Health Sciences Fund VCHSX
Inflation Protected Fund VCTPX
International Equities Index Fund VCIEX
International Government Bond Fund VCIFX
International Growth Fund VCINX
International Socially Responsible Fund VCSOX
International Value Fund VCFVX
Large Cap Core Fund VLCCX
Large Capital Growth Fund VLCGX
Mid Cap Index Fund VMIDX
Mid Cap Strategic Growth Fund VMSGX
Nasdaq-100® Index Fund VCNIX
Science & Technology Fund VCSTX
Small Cap Aggressive Growth Fund VSAGX
Small Cap Fund VCSMX
Small Cap Index Fund VCSLX
Small Cap Special Values Fund VSSVX
Small-Mid Growth Fund VSSGX
Stock Index Fund VSTIX
Systematic Core Fund VCGAX
Systematic Value Fund VBCVX
Value Fund VAVAX
This Prospectus contains information you should know before investing, including information about risks. Please read it before you invest and keep it for future reference.
The Securities and Exchange Commission (the “SEC”) has not approved or disapproved these securities, nor has it determined that this Prospectus is accurate or complete. It is a criminal offense totstate otherwise.
Beginning on January 1, 2021, as permitted by regulations adopted by the Securities and Exchange Commission, paper copies of the Registrant’s shareholder reports will no longer be sent by mail,unless you specifically request paper copies of the reports from the Registrant. Instead, the reports will be made available on a website, and you will be notified by mail each time a report is posted and provided with a website link to access the report. If you already elected to receive shareholder reports electronically, you will not be affected by this change and you need not take any action. You may elect to receive shareholder reports and other communications from the Registrant or VALIC Retirement Services Company (VRSCO), as your retirement plan recordkeeper, electronically by contacting usat 1-800-448-2542 or logging into your account at VALIC Online at www.valic.com.
You may elect to receive all future reports in paper free of charge. You can inform the Registrant or VRSCO that you wish to continue receiving paper copies of your shareholder reports by contacting1-866-345-5954 or visiting FundReports.com and providing the 20-digit unique ID located above or below your mailing address. Your election to receive reports in paper will apply to all fundsheld within your employer-sponsored retirement plan account with VRSCO.

Topic Page
Fund Summaries ................................................................................................................................................. 1Asset Allocation Fund ................................................................................................................................ 1Blue Chip Growth Fund .............................................................................................................................. 5Capital Conservation Fund ........................................................................................................................ 8Core Equity Fund ....................................................................................................................................... 11Dividend Value Fund .................................................................................................................................. 14Dynamic Allocation Fund ........................................................................................................................... 18Emerging Economies Fund ........................................................................................................................ 25Global Real Estate Fund ............................................................................................................................ 29Global Strategy Fund ................................................................................................................................. 33Government Money Market I Fund ............................................................................................................. 39Government Securities Fund ...................................................................................................................... 41Growth Fund ............................................................................................................................................... 44Health Sciences Fund ................................................................................................................................ 49Inflation Protected Fund ............................................................................................................................. 52International Equities Index Fund ............................................................................................................... 57International Government Bond Fund ........................................................................................................ 60International Growth Fund .......................................................................................................................... 64International Socially Responsible Fund .................................................................................................... 68International Value Fund ............................................................................................................................ 72Large Cap Core Fund ................................................................................................................................. 76Large Capital Growth Fund ........................................................................................................................ 79Mid Cap Index Fund ................................................................................................................................... 82Mid Cap Strategic Growth Fund ................................................................................................................. 85Nasdaq-100® Index Fund ........................................................................................................................... 89Science & Technology Fund ....................................................................................................................... 92Small Cap Aggressive Growth Fund .......................................................................................................... 96Small Cap Fund ......................................................................................................................................... 100Small Cap Index Fund ................................................................................................................................ 104Small Cap Special Values Fund ................................................................................................................. 107Small-Mid Growth Fund .............................................................................................................................. 110Stock Index Fund ....................................................................................................................................... 113Systematic Core Fund (formerly, Growth & Income Fund) ......................................................................... 116Systematic Value Fund .............................................................................................................................. 120Value Fund ................................................................................................................................................. 124
Important Additional Information ......................................................................................................................... 127Additional Information About the Funds’ Investment Objectives, Strategies and Risks....................................... 128Investment Glossary............................................................................................................................................ 143
Investment Terms ........................................................................................................................................ 143Investment Risks ......................................................................................................................................... 149About the Indices......................................................................................................................................... 160
Account Information ........................................................................................................................................... 164Management........................................................................................................................................................ 168
Investment Adviser ...................................................................................................................................... 168Investment Subadvisers .............................................................................................................................. 168How VALIC is Paid for its Services.............................................................................................................. 179Additional Information About Fund Expenses ............................................................................................. 179
Financial Highlights ............................................................................................................................................. 181Appendix A—Underlying Portfolios ..................................................................................................................... 215Interested in Learning More?............................................................................................................................... 231
TABLE OF CONTENTS
- i -

Investment Objective
The Fund seeks maximum aggregate rate of return overthe long-term through controlled investment risk byadjusting its investment mix among stocks, long-term debtsecurities and short-term money market securities.
Fees and Expenses of the Fund
This table describes the fees and expenses that you maypay if you buy and hold shares of the Fund. The Fund’sannual operating expenses do not reflect the separateaccount fees charged in the variable annuity or variablelife insurance policy (“Variable Contracts”) in which theFund is offered. If separate account fees were shown, theFund’s annual operating expenses would be higher.Please see your Variable Contract prospectus for moredetails on the separate account fees.
Annual Fund Operating Expenses (expenses that yougpay each year as a percentage of the value of yourinvestment)
Management Fees 0.50%Other Expenses 0.27%Acquired Fund Fees and Expenses 0.05%Total Annual Fund Operating Expenses1 0.82%1 The Total Annual Fund Operating Expenses for the Fund do notcorrelate to the ratio of net expenses to average net assets providedin the Financial Highlights table of the Fund’s annual report, whichreflects the gross operating expenses of the Fund (0.77%) and doesnot include Acquired Fund Fees and Expenses. “Acquired Fund Feesand Expenses” include fees and expenses incurred indirectly by theFund as a result of investments in shares of one or more mutualfunds, hedge funds, private equity funds or other pooled investmentvehicles.
Expense Example
This Example is intended to help you compare the cost ofinvesting in the Fund with the cost of investing in othermutual funds. The Example assumes that you invest$10,000 in the Fund for the time periods indicated andthen redeem all of your shares at the end of those periods.The Example also assumes that your investment has a 5%return each year and that the Fund’s operating expensesremain the same. The Example does not reflect chargesimposed by the Variable Contract. If the Variable Contractfees were reflected, the expenses would be higher. Seethe Variable Contract prospectus for information on suchcharges. Although your actual costs may be higher orlower, based on these assumptions and the net expensesshown in the fee table, your costs would be:
1 Year 3 Years 5 Years 10 Years
$84 $262 $455 $1,014
Portfolio Turnover
The Fund pays transaction costs, such as commissions,when it buys and sells securities (or “turns over” itsportfolio). These costs, which are not reflected in annualfund operating expenses or in the Example, affect theFund’s performance.
During the most recent fiscal year, the Fund’s portfolioturnover rate was 177% of the average value of itsportfolio.
Principal Investment Strategies of the Fund
The Fund is an asset allocation fund that attempts tomaximize returns with a mix of stocks, bonds and moneymarket securities. The Subadviser buys and sellssecurities for the Fund by changing its investment mixamong common stocks, intermediate- and long-termbonds (fixed income securities) and money marketsecurities. As a result, the Fund’s investments maychange often. The Fund can invest 100% of its assets injust one of these asset classes. The Subadviser mayengage in frequent and active trading of portfoliosecurities to achieve the Fund’s investment objective.
The Fund may invest up to 40% of its assets in foreignsecurities. The Fund may use forward foreign currencyexchange contracts to hedge against movement in thevalue of foreign currencies.
Unlike an index fund, which tries to increase the moneyyou invest by matching a specific index’s performance, theFund tries to perform better than a blend of three marketsectors measured by:
• the S&P 500® Index;
• the Bloomberg Barclays U.S. Aggregate BondIndex; and
• the FTSE Treasury-Bill 3 Month Index.
An asset allocation model is used to help the Subadviserdecide how to allocate the Fund’s assets. The modelanalyzes many factors that affect the performance ofsecurities that comprise certain indexes.
Based on the model, the Subadviser will normally allocatethe Fund’s total assets approximately according to thefollowing asset classes:
• Common stocks and equity securities 55%
• Intermediate- and long-term bonds 35%
• High quality money market securities 10%
The Fund’s equity assets generally consist of large-capcommon stocks. The Fund’s fixed income assets
FUND SUMMARY: ASSET ALLOCATION FUND
- 1 -

generally consist of investment grade corporate debtsecurities and U.S. Government securities. A significantportion of the Fund’s U.S. Government securities may beissued or guaranteed by the Federal National MortgageAssociation (“FNMA”) or the Federal Home LoanMortgage Corporation (“FHLMC”).
The allocation among the three asset classes may differfrom the percentages referenced above at the solediscretion of the Subadviser.
In order to generate additional income, the Fund may lendportfolio securities to broker-dealers and other financialinstitutions provided that the value of the loaned securitiesdoes not exceed 30% of the Fund’s total assets. Theseloans earn income for the Fund and are collateralized bycash and securities issued or guaranteed by the U.S.Government or its agencies or instrumentalities.
Principal Risks of Investing in the Fund
As with any mutual fund, there can be no assurance thatthe Fund’s investment objective will be met or that the netreturn on an investment in the Fund will exceed what couldhave been obtained through other investment or savingsvehicles. Shares of the Fund are not bank deposits andare not guaranteed or insured by any bank, governmententity or the Federal Deposit Insurance Corporation. If thevalue of the assets of the Fund goes down, you could losemoney.
The following is a summary of the principal risks ofinvesting in the Fund.
Model Risk. The Fund’s asset allocation model may failto produce the optimal portfolio allocation.
Management Risk. The investment style or strategy usedby the Subadviser may fail to produce the intended result.The Subadviser’s assessment of a particular security orcompany may prove incorrect, resulting in losses orunderperformance.
Equity Securities Risk. The Fund’s investments in equitysecurities are subject to the risk that stock prices will falland may underperform other asset classes. Individualstock prices fluctuate from day-to-day and may declinesignificantly. The prices of individual stocks may benegatively affected by poor company results or otherfactors affecting individual prices, as well as industry and/or economic trends and developments affecting industriesor the securities market as a whole.
Credit Risk. The Fund may suffer losses if the issuer ofa fixed income security owned by the Fund is unable tomake interest or principal payments.
Currency Risk. Because the Fund’s foreign investmentsare generally held in foreign currencies, the Fund couldexperience gains or losses based solely on changes in theexchange rate between foreign currencies and the U.S.dollar. Such gains or losses may be substantial.
Interest Rate Risk. The value of fixed-income securitiesmay decline when interest rates go up or increase wheninterest rates go down. The interest earned on fixed-income securities may decline when interest rates godown or increase when interest rates go up. Longer-termand lower coupon bonds tend to be more sensitive tochanges in interest rates. The Fund may be subject to agreater risk of rising interest rates due to the currentperiod of historically low rates and the effect of potentialgovernment fiscal policy initiatives and resulting marketreaction to these initiatives. The Fund may be subject to agreater risk of rising interest rates due to the currentperiod of historically low rates and the effect of potentialgovernment fiscal policy initiatives and resulting marketreaction to these initiatives.
Derivatives Risk. The prices of derivatives may move inunexpected ways due to the use of leverage and otherfactors and may result in increased volatility or losses. TheFund may not be able to terminate or sell derivativepositions, and a liquid secondary market may not alwaysexist for derivative positions.
Hedging Risk. A hedge is an investment made in orderto reduce the risk of adverse price movements in acurrency or other investment by taking an offsettingposition (often through a derivative instrument, such as anoption or forward contract). While hedging strategies canbe very useful and inexpensive ways of reducing risk, theyare sometimes ineffective due to unexpected changes inthe market. Hedging also involves the risk that changes inthe value of the related security will not match those of theinstruments being hedged as expected, in which case anylosses on the instruments being hedged may not bereduced.
Foreign Investment Risk. Investment in foreignsecurities involves risks due to several factors, such asilliquidity, the lack of public information, changes in theexchange rates between foreign currencies and the U.S.dollar, unfavorable political, social and legaldevelopments, or economic and financial instability.Foreign companies are not subject to the U.S. accountingand financial reporting standards and may have riskiersettlement procedures. U.S. investments that aredenominated in foreign currencies or that are traded inforeign markets, or securities of U.S. companies that have
FUND SUMMARY: ASSET ALLOCATION FUND
- 2 -

significant foreign operations may be subject to foreigninvestment risk.
Call or Prepayment Risk. During periods of fallinginterest rates, a bond issuer may “call” a bond to repay itbefore its maturity date. The Fund may only be able toinvest the bond’s proceeds at lower interest rates,resulting in a decline in the Fund’s income.
Large-Cap Companies Risk. Investing primarily in large-cap companies carries the risk that due to current marketconditions these companies may be out of favor withinvestors. Large-cap companies may be unable torespond quickly to new competitive challenges or attainthe high growth rate of successful smaller companies.
Market Risk. The Fund’s share price can fall because ofweakness in the broad market, a particular industry, orspecific holdings or due to adverse political or economicdevelopments here or abroad, changes in investorpsychology, or heavy institutional selling and otherconditions or events (including, for example, militaryconfrontations, war, terrorism, disease/virus, outbreaksand epidemics). The prices of individual securities mayfluctuate, sometimes dramatically, from day to day. Theprices of stocks and other equity securities tend to bemore volatile than those of fixed-income securities.
The coronavirus pandemic and the related governmentaland public responses have had and may continue to havean impact on the Fund’s investments and net asset valueand have led and may continue to lead to increasedmarket volatility and the potential for illiquidity in certainclasses of securities and sectors of the market.Preventative or protective actions that governments maytake in respect of pandemic or epidemic diseases mayresult in periods of business disruption, businessclosures, inability to obtain raw materials, supplies andcomponent parts, and reduced or disrupted operations forthe issuers in which the Fund invests. Governmentintervention in markets may impact interest rates, marketvolatility and security pricing. The occurrence,reoccurrence and pendency of such diseases couldadversely affect the economies (including throughchanges in business activity and increasedunemployment) and financial markets either in specificcountries or worldwide.
Liquidity Risk. If the active trading market for certainsecurities becomes limited or non-existent, it can becomemore difficult to sell the securities at or near theirperceived value. This may cause the value of suchsecurities and the Fund’s share price to fall dramatically.
U.S. Government Obligations Risk. U.S. Treasuryobligations are backed by the “full faith and credit” of the
U.S. Government and are generally considered to havelow credit risk. Unlike U.S. Treasury obligations, securitiesissued or guaranteed by federal agencies or authoritiesand U.S. Government-sponsored instrumentalities orenterprises, including FNMA and FHLMC, may or may notbe backed by the full faith and credit of the U.S.Government and are therefore subject to greater creditrisk than securities issued or guaranteed by the U.S.Treasury.
Active Trading Risk. High portfolio turnover rates thatare associated with active trading may result in highertransaction costs, which can adversely affect the Fund’sperformance. Active trading tends to be more pronouncedduring periods of increased market volatility.
Risk of Investing in Money Market Securities. Aninvestment in the Fund is subject to the risk that the valueof its investments may be subject to changes in interestrates, changes in the rating of any money market securityand in the ability of an issuer to make payments of interestand principal.
Securities Lending Risk. Engaging in securities lendingcould increase the market and credit risk for Fundinvestments. The Fund may lose money if it does notrecover borrowed securities, the value of the collateralfalls, or the value of investments made with cash collateraldeclines. If the value of either the cash collateral or theFund’s investments of the cash collateral falls below theamount owed to a borrower, the Fund also may incurlosses that exceed the amount it earned on lending thesecurity. Securities lending also involves the risks of delayin receiving additional collateral or possible loss of rightsin the collateral if the borrower fails. Another risk ofsecurities lending is the risk that the loaned portfoliosecurities may not be available to the Fund on a timelybasis and the Fund may therefore lose the opportunity tosell the securities at a desirable price.
Performance Information
The following Risk/Return Bar Chart and Table illustratethe risks of investing in the Fund by showing changes inthe Fund’s performance from calendar year to calendaryear and comparing the Fund’s average annual returns tothose of the S&P 500® Index, a blended index and eachof its components. The Blended Index is comprised of55% S&P 500® Index, 35% Bloomberg Barclays U.S.Aggregate Index and 10% FTSE Treasury Bill 3 MonthIndex. Fees and expenses incurred at the contract levelare not reflected in the bar chart or table. If these amountswere reflected, returns would be less than those shown.Of course, past performance is not necessarily anindication of how the Fund will perform in the future.
FUND SUMMARY: ASSET ALLOCATION FUND
- 3 -

14.56%
0.92%
13.33%
15.96%
5.36%
-0.45%
7.31%
13.25%
-9.02%
15.32%
-15%
-10%
-5%
0%
5%
10%
15%
20%
2010 2011 2012 2013 2014 2015 2016 2017 2018 2019
During the 10-year period shown in the bar chart, thehighest return for a quarter was 9.59% (quarter endedMarch 31, 2012) and the lowest return for a quarter was-9.54% (quarter ended September 30, 2011). The year-to-date calendar return as of June 30, 2020 was -7.46%.
Average Annual Total Returns (For the periods endedDecember 31, 2019)
1Year
5Years
10Years
Fund 15.32% 4.88% 7.35%Blended Index (reflects nodeduction for fees,expenses or taxes) 20.29% 7.73% 8.94%
Bloomberg Barclays U.S.Aggregate Bond Index(reflects no deduction forfees, expenses or taxes) 8.72% 3.05% 3.75%
FTSE Treasury Bill 3 MonthIndex (reflects nodeduction for fees,expenses or taxes) 2.25% 1.05% 0.56%
S&P 500® Index (reflects nodeduction for fees,expenses or taxes) 31.49% 11.70% 13.56%
Investment Adviser
The Fund’s investment adviser is The Variable AnnuityLife Insurance Company.
The Fund is subadvised by PineBridge Investments LLC.
Portfolio Managersg
Name and Title
PortfolioManager ofthe FundSince
Michael Kelly, CFAManaging Director, Global Head of Multi-Asset ........................................................... 2002
Jose R. AragonSenior Vice President and PortfolioManager, Global Multi-Asset ....................... 2008
Robert Vanden Assem, CFAManaging Director, Head of DevelopedMarkets Investments Grade Fixed Income.. 2002
Kate FaradayManaging Director and Portfolio Manager,Equities ....................................................... 2012
For important information about purchases and sales ofFund shares, taxes and payments to broker-dealers andother financial intermediaries, please turn to the section“Important Additional Information” on page 127.
FUND SUMMARY: ASSET ALLOCATION FUND
- 4 -

Investment Objective
The Fund seeks long-term capital growth. Income is asecondary objective.
Fees and Expenses of the Fund
This table describes the fees and expenses that you maypay if you buy and hold shares of the Fund. The Fund’sannual operating expenses do not reflect the separateaccount fees charged in the variable annuity or variablelife insurance policy (“Variable Contracts”) in which theFund is offered. If separate account fees were shown, theFund’s annual operating expenses would be higher.Please see your Variable Contract prospectus for moredetails on the separate account fees.
Annual Fund Operating Expenses (expenses that yougpay each year as a percentage of the value of yourinvestment)
Management Fees 0.72%Other Expenses 0.11%Total Annual Fund Operating Expenses 0.83%
Expense Example
This Example is intended to help you compare the cost ofinvesting in the Fund with the cost of investing in othermutual funds. The Example assumes that you invest$10,000 in the Fund for the time periods indicated andthen redeem all of your shares at the end of those periods.The Example also assumes that your investment has a 5%return each year and that the Fund’s operating expensesremain the same. The Example does not reflect chargesimposed by the Variable Contract. If the Variable Contractfees were reflected, the expenses would be higher. Seethe Variable Contract prospectus for information on suchcharges. Although your actual costs may be higher orlower, based on these assumptions and the net expensesshown in the fee table, your costs would be:
1 Year 3 Years 5 Years 10 Years
$85 $265 $460 $1,025
Portfolio Turnover
The Fund pays transaction costs, such as commissions,when it buys and sells securities (or “turns over” itsportfolio). These costs, which are not reflected in annualfund operating expenses or in the Example, affect theFund’s performance.
During the most recent fiscal year, the Fund’s portfolioturnover rate was 27% of the average value of its portfolio.
Principal Investment Strategies of the Fund
The Fund pursues long-term capital appreciation byinvesting, under normal circumstances, at least 80% ofnet assets in the common stocks of large- and mid-capblue chip growth companies. Generally, large- and mid-cap stocks will include companies whose marketcapitalizations, at the time of purchase, are greater thanor equal to the smallest company included in the RussellMidcap® Index. As of May 8, 2020, the marketcapitalization range of the companies in the RussellMidcap® Index was approximately $1.8 billion to$31.7 billion.
Blue chip growth companies are firms that, in theSubadviser’s view, are well-established in their industriesand have the potential for above-average earnings growth,which may include companies in the informationtechnology sector.
In order to generate additional income, the Fund may lendportfolio securities to broker-dealers and other financialinstitutions provided that the value of the loaned securitiesdoes not exceed 30% of the Fund’s total assets. Theseloans earn income for the Fund and are collateralized bycash and securities issued or guaranteed by the U.S.Government or its agencies or instrumentalities. Investorswill be given at least 60 days’ written notice in advance ofany change to the Fund’s 80% investment policy set forthabove.
Principal Risks of Investing in the Fund
As with any mutual fund, there can be no assurance thatthe Fund’s investment objective will be met or that the netreturn on an investment in the Fund will exceed what couldhave been obtained through other investment or savingsvehicles. Shares of the Fund are not bank deposits andare not guaranteed or insured by any bank, governmententity or the Federal Deposit Insurance Corporation. If thevalue of the assets of the Fund goes down, you could losemoney.
The following is a summary of the principal risks ofinvesting in the Fund.
Management Risk. The investment style or strategy usedby the Subadviser may fail to produce the intended result.The Subadviser’s assessment of a particular security orcompany may prove incorrect, resulting in losses orunderperformance.
Dividend-paying Stocks Risk. There is no guaranteethat the issuers of the stocks held by the Fund will declare
FUND SUMMARY: BLUE CHIP GROWTH FUND
- 5 -

dividends in the future or that, if dividends are declared,they will remain at their current levels or increase overtime. Dividend-paying stocks may not participate in abroad market advance to the same degree as otherstocks, and a sharp rise in interest rates or economicdownturn could cause a company to unexpectedly reduceor eliminate its dividend.
Equity Securities Risk. The Fund invests principally inequity securities and is therefore subject to the risk thatstock prices will fall and may underperform other assetclasses. Individual stock prices fluctuate from day-to-dayand may decline significantly. The prices of individualstocks may be negatively affected by poor companyresults or other factors affecting individual prices, as wellas industry and/or economic trends and developmentsaffecting industries or the securities market as a whole.
Growth Style Risk. Generally, “growth” stocks are stocksof companies that a subadviser believes have anticipatedearnings ranging from steady to accelerated growth.Many investors buy growth stocks because of anticipatedsuperior earnings growth, but earnings disappointmentsoften result in sharp price declines. Growth companiesusually invest a high portion of earnings in their ownbusinesses so their stocks may lack the dividends that cancushion share prices in a down market. In addition, thevalue of growth stocks may be more sensitive to changesin current or expected earnings than the value of otherstocks, because growth stocks trade at higher pricesrelative to current earnings.
Large- and Mid-Cap Company Risk. Investing in large-andmid-cap companies carries the risk that due to currentmarket conditions these companies may be out of favorwith investors. Large-cap companies may be unable torespond quickly to new competitive challenges or attainthe high growth rate of successful smaller companies.Stocks of mid-cap companies may be more volatile thanthose of larger companies due to, among other reasons,narrower product lines, more limited financial resourcesand fewer experienced managers.
Market Risk. The Fund’s share price can fall because ofweakness in the broad market, a particular industry, orspecific holdings or due to adverse political or economicdevelopments here or abroad, changes in investorpsychology, or heavy institutional selling and otherconditions or events (including, for example, militaryconfrontations, war, terrorism, disease/virus, outbreaksand epidemics). The prices of individual securities mayfluctuate, sometimes dramatically, from day to day. Theprices of stocks and other equity securities tend to bemore volatile than those of fixed-income securities.
The coronavirus pandemic and the related governmentaland public responses have had and may continue to havean impact on the Fund’s investments and net asset valueand have led and may continue to lead to increasedmarket volatility and the potential for illiquidity in certainclasses of securities and sectors of the market.Preventative or protective actions that governments maytake in respect of pandemic or epidemic diseases mayresult in periods of business disruption, businessclosures, inability to obtain raw materials, supplies andcomponent parts, and reduced or disrupted operations forthe issuers in which the Fund invests. Governmentintervention in markets may impact interest rates, marketvolatility and security pricing. The occurrence,reoccurrence and pendency of such diseases couldadversely affect the economies (including throughchanges in business activity and increasedunemployment) and financial markets either in specificcountries or worldwide.
Securities Lending Risk. Engaging in securities lendingcould increase the market and credit risk for Fundinvestments. The Fund may lose money if it does notrecover borrowed securities, the value of the collateralfalls, or the value of investments made with cash collateraldeclines. If the value of either the cash collateral or theFund’s investments of the cash collateral falls below theamount owed to a borrower, the Fund also may incurlosses that exceed the amount it earned on lending thesecurity. Securities lending also involves the risks of delayin receiving additional collateral or possible loss of rightsin the collateral if the borrower fails. Another risk ofsecurities lending is the risk that the loaned portfoliosecurities may not be available to the Fund on a timelybasis and the Fund may therefore lose the opportunity tosell the securities at a desirable price.
Technology Sector Risk. Technology stocks historicallyhave experienced unusually wide price swings. Earningsdisappointments and intense competition for market sharecan result in sharp declines in the prices of technologystocks.
Performance Information
The following Risk/Return Bar Chart and Table illustratethe risks of investing in the Fund by showing changes inthe Fund’s performance from calendar year to calendaryear and comparing the Fund’s average annual returns tothose of the S&P 500® Index. Fees and expenses incurredat the contract level are not reflected in the bar chart ortable. If these amounts were reflected, returns would beless than those shown. Of course, past performance is not
FUND SUMMARY: BLUE CHIP GROWTH FUND
- 6 -
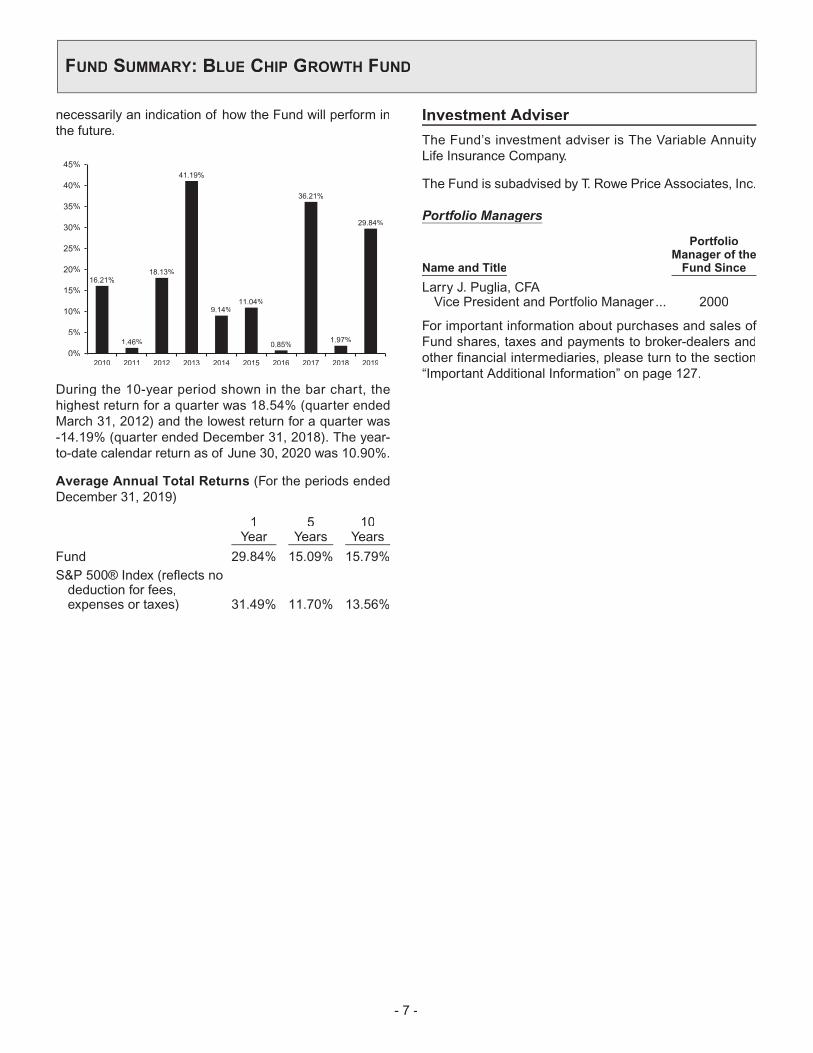
necessarily an indication of how the Fund will perform inthe future.
16.21%
1.46%
18.13%
41.19%
9.14%11.04%
0.85%
36.21%
1.97%
29.84%
0%
5%
10%
15%
20%
25%
30%
35%
40%
45%
2010 2011 2012 2013 2014 2015 2016 2017 2018 2019
During the 10-year period shown in the bar chart, thehighest return for a quarter was 18.54% (quarter endedMarch 31, 2012) and the lowest return for a quarter was-14.19% (quarter ended December 31, 2018). The year-to-date calendar return as of June 30, 2020 was 10.90%.
Average Annual Total Returns (For the periods endedDecember 31, 2019)
1Year
5Years
10Years
Fund 29.84% 15.09% 15.79%S&P 500® Index (reflects nodeduction for fees,expenses or taxes) 31.49% 11.70% 13.56%
Investment Adviser
The Fund’s investment adviser is The Variable AnnuityLife Insurance Company.
The Fund is subadvised by T. Rowe Price Associates, Inc.
Portfolio Managersg
Name and Title
PortfolioManager of theFund Since
Larry J. Puglia, CFAVice President and Portfolio Manager ... 2000
For important information about purchases and sales ofFund shares, taxes and payments to broker-dealers andother financial intermediaries, please turn to the section“Important Additional Information” on page 127.
FUND SUMMARY: BLUE CHIP GROWTH FUND
- 7 -

Investment Objective
The Fund seeks the highest possible total returnconsistent with preservation of capital through currentincome and capital gains on investments in intermediateand long-term debt instruments and other incomeproducing securities.
Fees and Expenses of the Fund
This table describes the fees and expenses that you maypay if you buy and hold shares of the Fund. The Fund’sannual operating expenses do not reflect the separateaccount fees charged in the variable annuity or variablelife insurance policy (“Variable Contracts”) in which theFund is offered. If separate account fees were shown, theFund’s annual operating expenses would be higher.Please see your Variable Contract prospectus for moredetails on the separate account fees.
Annual Fund Operating Expenses (expenses that yougpay each year as a percentage of the value of yourinvestment)
Management Fees 0.50%Other Expenses 0.14%Total Annual Fund Operating Expenses 0.64%
Expense Example
This Example is intended to help you compare the cost ofinvesting in the Fund with the cost of investing in othermutual funds. The Example assumes that you invest$10,000 in the Fund for the time periods indicated andthen redeem all of your shares at the end of those periods.The Example also assumes that your investment has a 5%return each year and that the Fund’s operating expensesremain the same. The Example does not reflect chargesimposed by the Variable Contract. If the Variable Contractfees were reflected, the expenses would be higher. Seethe Variable Contract prospectus for information on suchcharges. Although your actual costs may be higher orlower, based on these assumptions and the net expensesshown in the fee table, your costs would be:
1 Year 3 Years 5 Years 10 Years
$65 $205 $357 $798
Portfolio Turnover
The Fund pays transaction costs, such as commissions,when it buys and sells securities (or “turns over” itsportfolio). These costs, which are not reflected in annualfund operating expenses or in the Example, affect theFund’s performance.
During the most recent fiscal year, the Fund’s portfolioturnover rate was 74% of the average value of its portfolio.
Principal Investment Strategies of the Fund
The Fund invests in investment grade bonds to seek toprovide you with the highest possible total return fromcurrent income and capital gains while preserving yourinvestment. The Subadviser may engage in frequent andactive trading of portfolio securities to achieve the Fund’sinvestment objective.
The Fund invests at least 75% of the Fund’s total assetsat the time of purchase in investment-grade, intermediate-and long-term corporate bonds, including dollardenominated foreign corporate bonds, securities issuedor guaranteed by the U.S. Government, mortgage-backedsecurities, asset-backed securities, securities issued bythe Federal National Mortgage Association (“FNMA”) orthe Federal Home Loan Mortgage Corporation(“FHLMC”), collateralized mortgage obligations (“CMOs”),and high quality money market securities.
In order to generate additional income, the Fund may lendportfolio securities to broker-dealers and other financialinstitutions provided that the value of the loaned securitiesdoes not exceed 30% of the Fund’s total assets. Theseloans earn income for the Fund and are collateralized bycash and securities issued or guaranteed by the U.S.Government or its agencies or instrumentalities.
Principal Risks of Investing in the Fund
As with any mutual fund, there can be no assurance thatthe Fund’s investment objective will be met or that the netreturn on an investment in the Fund will exceed what couldhave been obtained through other investment or savingsvehicles. Shares of the Fund are not bank deposits andare not guaranteed or insured by any bank, governmententity or the Federal Deposit Insurance Corporation. If thevalue of the assets of the Fund goes down, you could losemoney.
The following is a summary of the principal risks ofinvesting in the Fund.
Management Risk. The investment style or strategy usedby the Subadviser may fail to produce the intended result.The Subadviser’s assessment of a particular security orcompany may prove incorrect, resulting in losses orunderperformance.
Call or Prepayment Risk. During periods of fallinginterest rates, a bond issuer may “call” a bond to repay itbefore its maturity date. The Fund may only be able toinvest the bond’s proceeds at lower interest rates,resulting in a decline in the Fund’s income.
FUND SUMMARY: CAPITAL CONSERVATION FUND
- 8 -

Credit Risk. The Fund may suffer losses if the issuer ofa fixed income security owned by the Fund is unable tomake interest or principal payments.
Currency Risk. Because the Fund’s foreign investmentsare generally held in foreign currencies, the Fund couldexperience gains or losses based solely on changes in theexchange rate between foreign currencies and the U.S.dollar. Such gains or losses may be substantial.
Interest Rate Risk. The value of fixed-income securitiesmay decline when interest rates go up or increase wheninterest rates go down. The interest earned on fixed-income securities may decline when interest rates godown or increase when interest rates go up. Longer-termand lower coupon bonds tend to be more sensitive tochanges in interest rates. The Fund may be subject to agreater risk of rising interest rates due to the currentperiod of historically low rates and the effect of potentialgovernment fiscal policy initiatives and resulting marketreaction to these initiatives. The Fund may be subject to agreater risk of rising interest rates due to the currentperiod of historically low rates and the effect of potentialgovernment fiscal policy initiatives and resulting marketreaction to these initiatives.
Foreign Investment Risk. Investment in foreignsecurities involves risks due to several factors, such asilliquidity, the lack of public information, changes in theexchange rates between foreign currencies and the U.S.dollar, unfavorable political, social and legaldevelopments, or economic and financial instability.Foreign companies are not subject to the U.S. accountingand financial reporting standards and may have riskiersettlement procedures. U.S. investments that aredenominated in foreign currencies or that are traded inforeign markets, or securities of U.S. companies that havesignificant foreign operations may be subject to foreigninvestment risk.
Market Risk. The Fund’s share price can fall because ofweakness in the broad market, a particular industry, orspecific holdings or due to adverse political or economicdevelopments here or abroad, changes in investorpsychology, or heavy institutional selling and otherconditions or events (including, for example, militaryconfrontations, war, terrorism, disease/virus, outbreaksand epidemics). The prices of individual securities mayfluctuate, sometimes dramatically, from day to day. Theprices of stocks and other equity securities tend to bemore volatile than those of fixed-income securities.
The coronavirus pandemic and the related governmentaland public responses have had and may continue to havean impact on the Fund’s investments and net asset valueand have led and may continue to lead to increased
market volatility and the potential for illiquidity in certainclasses of securities and sectors of the market.Preventative or protective actions that governments maytake in respect of pandemic or epidemic diseases mayresult in periods of business disruption, businessclosures, inability to obtain raw materials, supplies andcomponent parts, and reduced or disrupted operations forthe issuers in which the Fund invests. Governmentintervention in markets may impact interest rates, marketvolatility and security pricing. The occurrence,reoccurrence and pendency of such diseases couldadversely affect the economies (including throughchanges in business activity and increasedunemployment) and financial markets either in specificcountries or worldwide.
Mortgage-Backed Securities Risk. Mortgage-backedsecurities are similar to other debt securities in that theyare subject to credit risk and interest rate risk. Mortgage-backed securities may be issued or guaranteed by theU.S. Government, its agencies or instrumentalities or maybe non-guaranteed securities issued by private issuers.These securities are also subject to the risk that issuerswill prepay the principal more quickly or more slowly thanexpected, which could cause the Fund to invest theproceeds in less attractive investments or increase thevolatility of their prices. CMOs, which are a type ofmortgage-backed security, may be less liquid and mayexhibit greater price volatility than other types ofmortgage- and asset-backed securities.
Asset -Backed Securities Risk. Asset-backed securitiesare bonds or notes that are normally supported by aspecific property. If the issuer fails to pay the interest orreturn the principal when the bond matures, then theissuer must give the property to the bondholders ornoteholders. Examples of assets supporting asset-backed securities include credit card receivables, retailinstallment loans, home equity loans, auto loans, andmanufactured housing loans.
Risk of Investing in Money Market Securities. Aninvestment in the Fund is subject to the risk that the valueof its investments may be subject to changes in interestrates, changes in the rating of any money market securityand in the ability of an issuer to make payments of interestand principal.
Active Trading Risk. High portfolio turnover rates thatare associated with active trading may result in highertransaction costs, which can adversely affect the Fund’sperformance. Active trading tends to be more pronouncedduring periods of increased market volatility.
Securities Lending Risk. Engaging in securities lendingcould increase the market and credit risk for Fund
FUND SUMMARY: CAPITAL CONSERVATION FUND
- 9 -

investments. The Fund may lose money if it does notrecover borrowed securities, the value of the collateralfalls, or the value of investments made with cash collateraldeclines. If the value of either the cash collateral or theFund’s investments of the cash collateral falls below theamount owed to a borrower, the Fund also may incurlosses that exceed the amount it earned on lending thesecurity. Securities lending also involves the risks of delayin receiving additional collateral or possible loss of rightsin the collateral if the borrower fails. Another risk ofsecurities lending is the risk that the loaned portfoliosecurities may not be available to the Fund on a timelybasis and the Fund may therefore lose the opportunity tosell the securities at a desirable price.
U.S. Government Obligations Risk. U.S Treasuryobligations are backed by the “full faith and credit” of theU.S. Government and are generally considered to havelow credit risk. Unlike U.S. Treasury obligations, securitiesissued or guaranteed by federal agencies or authoritiesand U.S. Government-sponsored instrumentalities orenterprises, including FNMA and FHLMC, may or may notbe backed by the full faith and credit of the U.S.Government and are therefore subject to greater creditrisk than securities issued or guaranteed by the U.S.Treasury.
Performance Information
The following Risk/Return Bar Chart and Table illustratethe risks of investing in the Fund by showing changes inthe Fund’s performance from calendar year to calendaryear and comparing the Fund’s average annual returns tothose of the Bloomberg Barclays U.S. Aggregate BondIndex. Fees and expenses incurred at the contract levelare not reflected in the bar chart or table. If these amountswere reflected, returns would be less than those shown.Of course, past performance is not necessarily anindication of how the Fund will perform in the future.
7.84%6.83%
6.06%
-2.37%
5.99%
0.20%
2.27%
3.52%
-1.11%
9.58%
-4%
-2%
0%
2%
4%
6%
8%
10%
12%
2010 2011 2012 2013 2014 2015 2016 2017 2018 2019
During the 10-year period shown in the bar chart, thehighest return for a quarter was 3.41% (quarter endedMarch 31, 2019) and the lowest return for a quarter was-3.14% (quarter ended December 31, 2016). The year-to-date calendar return as of June 30, 2020 was 5.98%.
Average Annual Total Returns (For the periods endedDecember 31, 2019)
1Year
5Years
10Years
Fund 9.58% 2.83% 3.81%Bloomberg Barclays U.S.Aggregate Bond Index(reflects no deduction forfees, expenses or taxes) 8.72% 3.05% 3.75%
Investment Adviser
The Fund’s investment adviser is The Variable AnnuityLife Insurance Company.
The Fund is subadvised by PineBridge Investments LLC.
Portfolio Managersg
Name and Title
PortfolioManager of theFund Since
Dana G. BurnsManaging Director and Senior PortfolioManager,Investment Grade Fixed Income............ 2008
Robert Vanden Assem, CFAManaging Director and Head ofDeveloped Markets Investment GradeFixed Income......................................... 2002
For important information about purchases and sales ofFund shares, taxes and payments to broker-dealers andother financial intermediaries, please turn to the section“Important Additional Information” on page 127.
FUND SUMMARY: CAPITAL CONSERVATION FUND
- 10 -
Investment Objective
The Fund seeks to provide long-term growth of capitalthrough investment primarily in equity securities.
Fees and Expenses of the Fund
This table describes the fees and expenses that you maypay if you buy and hold shares of the Fund. The Fund’sannual operating expenses do not reflect the separateaccount fees charged in the variable annuity or variablelife insurance policy (“Variable Contracts”) in which theFund is offered. If separate account fees were shown, theFund’s annual operating expenses would be higher.Please see your Variable Contract prospectus for moredetails on the separate account fees.
Annual Fund Operating Expenses (expenses that yougpay each year as a percentage of the value of yourinvestment)
Management Fees 0.80%Other Expenses 0.13%Total Annual Fund Operating Expenses 0.93%Fee Waivers and/or Expense Reimbursements1 -0.18%Total Annual Fund Operating ExpensesAfter Fee Waivers and/or ExpenseReimbursements1 0.75%
1 The Fund’s investment adviser, The Variable Annuity Life InsuranceCompany, has contractually agreed to waive its advisory fee throughSeptember 30, 2021, so that the advisory fee payable by the Fund toVALIC equals 0.62% of average monthly assets on the first$250 million, 0.57% on the next $250 million, 0.52% on the next$500 million and 0.47% thereafter. This agreement may be modifiedor discontinued prior to such time only with the approval of the Boardof Directors of the Fund, including a majority of the directors who arenot “interested persons” of the Fund as defined in the InvestmentCompany Act of 1940, as amended.
Expense Example
This Example is intended to help you compare the cost ofinvesting in the Fund with the cost of investing in othermutual funds. The Example assumes that you invest$10,000 in the Fund for the time periods indicated andthen redeem all of your shares at the end of those periods.The Example also assumes that your investment has a 5%return each year and that the Fund’s operating expensesinclude fee waivers for one year. The Example does notreflect charges imposed by the Variable Contract. If theVariable Contract fees were reflected, the expenses wouldbe higher. See the Variable Contract prospectus forinformation on such charges. Although your actual costs
may be higher or lower, based on these assumptions andthe net expenses shown in the fee table, your costs wouldbe:
1 Year 3 Years 5 Years 10 Years
$77 $278 $497 $1,127
Portfolio Turnover
The Fund pays transaction costs, such as commissions,when it buys and sells securities (or “turns over” itsportfolio). These costs, which are not reflected in annualfund operating expenses or in the Example, affect theFund’s performance.
During the most recent fiscal year, the Fund’s portfolioturnover rate was 41% of the average value of its portfolio.
Principal Investment Strategies of the Fund
The Fund invests primarily in quality large-cap companieswith long-term growth potential. Important characteristicsof such companies include: a strong management team,a leadership position within an industry, a globallycompetitive focus, a strong balance sheet and a highreturn on equity. The Fund invests, under normalcircumstances, at least 80% of its net assets, at the timeof purchase, in equity securities, consisting primarily ofcommon stocks. The Subadviser may engage in frequentand active trading of portfolio securities to achieve theFund’s investment objective.
In order to generate additional income, the Fund may lendportfolio securities to broker-dealers and other financialinstitutions provided that the value of the loaned securitiesdoes not exceed 30% of the Fund’s total assets. Theseloans earn income for the Fund and are collateralized bycash and securities issued or guaranteed by the U.S.Government or its agencies or instrumentalities. Investorswill be given at least 60 days’ written notice in advance ofany change to the Fund’s 80% investment policy set forthabove.
Principal Risks of Investing in the Fund
As with any mutual fund, there can be no assurance thatthe Fund’s investment objective will be met or that the netreturn on an investment in the Fund will exceed what couldhave been obtained through other investment or savingsvehicles. Shares of the Fund are not bank deposits andare not guaranteed or insured by any bank, government
FUND SUMMARY: CORE EQUITY FUND
- 11 -

entity or the Federal Deposit Insurance Corporation. If thevalue of the assets of the Fund goes down, you could losemoney.
The following is a summary of the principal risks ofinvesting in the Fund.
Management Risk. The investment style or strategy usedby the Subadviser may fail to produce the intended result.The Subadviser’s assessment of a particular security orcompany may prove incorrect, resulting in losses orunderperformance.
Growth Style Risk. Generally, “growth” stocks are stocksof companies that a subadviser believes have anticipatedearnings ranging from steady to accelerated growth.Many investors buy growth stocks because of anticipatedsuperior earnings growth, but earnings disappointmentsoften result in sharp price declines. Growth companiesusually invest a high portion of earnings in their ownbusinesses so their stocks may lack the dividends that cancushion share prices in a down market. In addition, thevalue of growth stocks may be more sensitive to changesin current or expected earnings than the value of otherstocks, because growth stocks trade at higher pricesrelative to current earnings.
Equity Securities Risk. The Fund invests primarily inequity securities and is therefore subject to the risk thatstock prices will fall and may underperform other assetclasses. Individual stock prices fluctuate from day-to-dayand may decline significantly. The prices of individualstocks may be negatively affected by poor companyresults or other factors affecting individual prices, as wellas industry and/or economic trends and developmentsaffecting industries or the securities market as a whole.
Large-Cap Companies Risk. Investing primarily in large-cap companies carries the risk that due to current marketconditions these companies may be out of favor withinvestors. Large-cap companies may be unable torespond quickly to new competitive challenges or attainthe high growth rate of successful smaller companies.
Market Risk. The Fund’s share price can fall because ofweakness in the broad market, a particular industry, orspecific holdings or due to adverse political or economicdevelopments here or abroad, changes in investorpsychology, or heavy institutional selling and otherconditions or events (including, for example, militaryconfrontations, war, terrorism, disease/virus, outbreaksand epidemics). The prices of individual securities mayfluctuate, sometimes dramatically, from day to day. The
prices of stocks and other equity securities tend to bemore volatile than those of fixed-income securities.
The coronavirus pandemic and the related governmentaland public responses have had and may continue to havean impact on the Fund’s investments and net asset valueand have led and may continue to lead to increasedmarket volatility and the potential for illiquidity in certainclasses of securities and sectors of the market.Preventative or protective actions that governments maytake in respect of pandemic or epidemic diseases mayresult in periods of business disruption, businessclosures, inability to obtain raw materials, supplies andcomponent parts, and reduced or disrupted operations forthe issuers in which the Fund invests. Governmentintervention in markets may impact interest rates, marketvolatility and security pricing. The occurrence,reoccurrence and pendency of such diseases couldadversely affect the economies (including throughchanges in business activity and increasedunemployment) and financial markets either in specificcountries or worldwide.
Securities Lending Risk. Engaging in securities lendingcould increase the market and credit risk for Fundinvestments. The Fund may lose money if it does notrecover borrowed securities, the value of the collateralfalls, or the value of investments made with cash collateraldeclines. If the value of either the cash collateral or theFund’s investments of the cash collateral falls below theamount owed to a borrower, the Fund also may incurlosses that exceed the amount it earned on lending thesecurity. Securities lending also involves the risks of delayin receiving additional collateral or possible loss of rightsin the collateral if the borrower fails. Another risk ofsecurities lending is the risk that the loaned portfoliosecurities may not be available to the Fund on a timelybasis and the Fund may therefore lose the opportunity tosell the securities at a desirable price.
Performance Information
The following Risk/Return Bar Chart and Table illustratethe risks of investing in the Fund by showing changes inthe Fund’s performance from calendar year to calendaryear and comparing the Fund’s average annual returns tothose of the Russell 1000® Index. Fees and expensesincurred at the contract level are not reflected in the barchart or table. If these amounts were reflected, returnswould be less than those shown. Of course, pastperformance is not necessarily an indication of how theFund will perform in the future.
FUND SUMMARY: CORE EQUITY FUND
- 12 -

BlackRock Investment Management, LLC (“BlackRock”)assumed sub-advisory duties of the Fund on March 5,2007.
12.82%
-0.48%
14.20%
34.87%
11.52%
-1.85%
12.71%
21.04%
-6.75%
28.54%
-10%
-5%
0%
5%
10%
15%
20%
25%
30%
35%
40%
2010 2011 2012 2013 2014 2015 2016 2017 2018 2019
During the 10-year period shown in the bar chart, thehighest return for a quarter was 13.55% (quarter endedMarch 31, 2012) and the lowest return for a quarter was-18.21% (quarter ended September 30, 2011). The year-to-date calendar return as of June 30, 2020 was -5.26%.
Average Annual Total Returns (For the periods endedDecember 31, 2019)
1Year
5Years
10Years
Fund 28.54% 9.92% 11.96%Russell 1000® Index(reflects no deduction forfees, expenses or taxes) 31.43% 11.48% 13.54%
Investment Adviser
The Fund’s investment adviser is The Variable AnnuityLife Insurance Company.
The Fund is subadvised by BlackRock InvestmentManagement, LLC.
Portfolio Managersg
Name and Title
PortfolioManager of theFund Since
Joseph WolfeDirector and Portfolio Manager.............. 2017
Todd BurnsideDirector and Portfolio Manager.............. 2017
For important information about purchases and sales ofFund shares, taxes and payments to broker-dealers andother financial intermediaries, please turn to the section“Important Additional Information” on page 127.
FUND SUMMARY: CORE EQUITY FUND
- 13 -
Investment Objective
The Fund seeks capital growth by investing in commonstocks. Income is a secondary objective.
Fees and Expenses of the Fund
This table describes the fees and expenses that you maypay if you buy and hold shares of the Fund. The Fund’sannual operating expenses do not reflect the separateaccount fees charged in the variable annuity or variablelife insurance policy (“Variable Contracts”) in which theFund is offered. If separate account fees were shown, theFund’s annual operating expenses would be higher.Please see your Variable Contract prospectus for moredetails on the separate account fees.
Annual Fund Operating Expenses (expenses that yougpay each year as a percentage of the value of yourinvestment)
Management Fees 0.70%Other Expenses 0.11%Total Annual Fund Operating Expenses 0.81%Fee Waivers and/or Expense Reimbursements1 -0.11%Total Annual Fund Operating ExpensesAfter Fee Waivers and/or ExpenseReimbursements1 0.70%
1 The Fund’s investment adviser, The Variable Annuity Life InsuranceCompany, has contractually agreed to waive its advisory fee throughSeptember 30, 2021, so that the advisory fee payable by the Fund toVALIC equals 0.64% of average monthly assets on the first$250 million, 0.61% on the next $250 million, 0.56% on the next$500 million and 0.51% thereafter. This agreement may be modifiedor discontinued prior to such time only with the approval of the Boardof Directors of the Fund, including a majority of the directors who arenot “interested persons” of the Fund as defined in the InvestmentCompany Act of 1940, as amended.
Expense Example
This Example is intended to help you compare the cost ofinvesting in the Fund with the cost of investing in othermutual funds. The Example assumes that you invest$10,000 in the Fund for the time periods indicated andthen redeem all of your shares at the end of those periods.The Example also assumes that your investment has a 5%return each year and that the Fund’s operating expensesinclude fee waivers for one year. The Example does notreflect charges imposed by the Variable Contract. If theVariable Contract fees were reflected, the expenses wouldbe higher. See the Variable Contract prospectus for
information on such charges. Although your actual costsmay be higher or lower, based on these assumptions andthe net expenses shown in the fee table, your costs wouldbe:
1 Year 3 Years 5 Years 10 Years
$72 $248 $439 $991
Portfolio Turnover
The Fund pays transaction costs, such as commissions,when it buys and sells securities (or “turns over” itsportfolio). These costs, which are not reflected in annualfund operating expenses or in the Example, affect theFund’s performance.
During the most recent fiscal year, the Fund’s portfolioturnover rate was 63% of the average value of its portfolio.
Principal Investment Strategies of the Fund
The Fund seeks to achieve its objective by investingprimarily in a diversified portfolio of equity securitiesincluding common stock, preferred stock and convertiblesecurities. Under normal circumstances, the Fund willinvest at least 80% of its net assets in dividend payingequity securities. The Fund may invest in securities ofcompanies with any market capitalization, but willgenerally focus on large cap securities. In selectingportfolio securities, one of the Subadvisers will generallyemploy a value-oriented analysis, but may purchaseequity securities based on a growth-oriented analysiswhen such securities pay dividends or the Subadviserbelieves such securities have particularly good prospectsfor capital appreciation. The other Subadviser uses rules-based strategies to select portfolio securities and willselect up to thirty high dividend yielding common stocks,which will be evaluated and adjusted at the discretion ofthe portfolio manager on an annual basis.
The Fund may also invest in convertible securities andnon-convertible preferred stock.
In order to generate additional income, the Fund may lendportfolio securities to broker-dealers and other financialinstitutions provided that the value of the loaned securitiesdoes not exceed 30% of the Fund’s total assets. Theseloans earn income for the Fund and are collateralized bycash and securities issued or guaranteed by the U.S.Government or its agencies or instrumentalities. Investors
FUND SUMMARY: DIVIDEND VALUE FUND
- 14 -
will be given at least 60 days’ written notice in advance ofany change to the Fund’s 80% investment policy set forthabove.
Principal Risks of Investing in the Fund
As with any mutual fund, there can be no assurance thatthe Fund’s investment objective will be met or that the netreturn on an investment in the Fund will exceed what couldhave been obtained through other investment or savingsvehicles. Shares of the Fund are not bank deposits andare not guaranteed or insured by any bank, governmententity or the Federal Deposit Insurance Corporation. If thevalue of the assets of the Fund goes down, you could losemoney.
The following is a summary of the principal risks ofinvesting in the Fund.
Management Risk. The investment style or strategy usedby the Subadviser may fail to produce the intended result.The Subadviser’s assessment of a particular security orcompany may prove incorrect, resulting in losses orunderperformance.
Dividend-paying Stocks Risk. The Fund’s emphasis ondividend-paying stocks could cause the Fund tounderperform similar funds that invest withoutconsideration of a company’s track record of payingdividends. There is no guarantee that the issuers of thestocks held by the Fund will declare dividends in the futureor that, if dividends are declared, they will remain at theircurrent levels or increase over time. Dividend-payingstocks may not participate in a broad market advance tothe same degree as other stocks, and a sharp rise ininterest rates or economic downturn could cause acompany to unexpectedly reduce or eliminate its dividend.
Equity Securities Risk. The Fund invests principally inequity securities and is therefore subject to the risk thatstock prices will fall and may underperform other assetclasses. Individual stock prices fluctuate from day-to-dayand may decline significantly. The prices of individualstocks may be negatively affected by poor companyresults or other factors affecting individual prices, as wellas industry and/or economic trends and developmentsaffecting industries or the securities market as a whole.
Value Style Risk. Generally, “value” stocks are stocks ofcompanies that a subadviser believes are currentlyundervalued in the marketplace. A subadviser’s judgmentthat a particular security is undervalued in relation to thecompany’s fundamental economic value may proveincorrect and the price of the company’s stock may fall ormay not approach the value the subadviser has placed onit.
Growth Style Risk. Generally, “growth” stocks are stocksof companies that a subadviser believes have anticipatedearnings ranging from steady to accelerated growth.Many investors buy growth stocks because of anticipatedsuperior earnings growth, but earnings disappointmentsoften result in sharp price declines. Growth companiesusually invest a high portion of earnings in their ownbusinesses so their stocks may lack the dividends that cancushion share prices in a down market. In addition, thevalue of growth stocks may be more sensitive to changesin current or expected earnings than the value of otherstocks, because growth stocks trade at higher pricesrelative to current earnings.
Convertible Securities Risk. Convertible security valuesmay be affected by market interest rates, issuer defaultsand underlying common stock values; security valuesmay fall if market interest rates rise and rise if marketinterest rates fall. Additionally, an issuer may have the rightto buy back the securities at a time unfavorable to theFund.
Preferred Stock Risk. Unlike common stock, preferredstock generally pays a fixed dividend from a company’searnings and may have a preference over common stockon the distribution of a company’s assets in the event ofbankruptcy or liquidation. Preferred stockholders’liquidation rights are subordinate to the company’s debtholders and creditors. If interest rates rise, the fixeddividend on preferred stocks may be less attractive andthe price of preferred stocks may decline. Preferredstockholders typically do not have voting rights.
Income Producing Stock Availability Risk. Incomeproducing common stock meeting the Fund’s investmentcriteria may not be widely available and/or may be highlyconcentrated in only a fewmarket sectors, thus limiting theability of the Fund to produce current income whileremaining fully diversified.
Large-Cap Companies Risk. Investing primarily in large-cap companies carries the risk that due to current marketconditions these companies may be out of favor withinvestors. Large-cap companies may be unable torespond quickly to new competitive challenges or attainthe high growth rate of successful smaller companies.
Market Risk. The Fund’s share price can fall because ofweakness in the broad market, a particular industry, orspecific holdings or due to adverse political or economicdevelopments here or abroad, changes in investorpsychology, or heavy institutional selling and otherconditions or events (including, for example, militaryconfrontations, war, terrorism, disease/virus, outbreaksand epidemics). The prices of individual securities may
FUND SUMMARY: DIVIDEND VALUE FUND
- 15 -
fluctuate, sometimes dramatically, from day to day. Theprices of stocks and other equity securities tend to bemore volatile than those of fixed-income securities.
The coronavirus pandemic and the related governmentaland public responses have had and may continue to havean impact on the Fund’s investments and net asset valueand have led and may continue to lead to increasedmarket volatility and the potential for illiquidity in certainclasses of securities and sectors of the market.Preventative or protective actions that governments maytake in respect of pandemic or epidemic diseases mayresult in periods of business disruption, businessclosures, inability to obtain raw materials, supplies andcomponent parts, and reduced or disrupted operations forthe issuers in which the Fund invests. Governmentintervention in markets may impact interest rates, marketvolatility and security pricing. The occurrence,reoccurrence and pendency of such diseases couldadversely affect the economies (including throughchanges in business activity and increasedunemployment) and financial markets either in specificcountries or worldwide.
Mid-Cap Company Risk. Investing in mid-cap companiescarries the risk that due to current market conditions thesecompanies may be out of favor with investors. Stocks ofmid-cap companies may be more volatile than those oflarger companies due to, among other reasons, narrowerproduct lines, more limited financial resources and fewerexperienced managers.
Small-Cap Company Risk. Investing in small-capcompanies carries the risk that due to current marketconditions these companies may be out of favor withinvestors. Small companies often are in the early stagesof development with limited product lines, markets, orfinancial resources and managements lacking depth andexperience, which may cause their stock prices to bemorevolatile than those of larger companies. Small companystocks may be less liquid yet subject to abrupt or erraticprice movements. It may take a substantial period of timebefore the Fund realizes a gain on an investment in asmall-cap company, if it realizes any gain at all.
Securities Lending Risk. Engaging in securities lendingcould increase the market and credit risk for Fundinvestments. The Fund may lose money if it does notrecover borrowed securities, the value of the collateralfalls, or the value of investments made with cash collateraldeclines. If the value of either the cash collateral or theFund’s investments of the cash collateral falls below theamount owed to a borrower, the Fund also may incurlosses that exceed the amount it earned on lending thesecurity. Securities lending also involves the risks of delay
in receiving additional collateral or possible loss of rightsin the collateral if the borrower fails. Another risk ofsecurities lending is the risk that the loaned portfoliosecurities may not be available to the Fund on a timelybasis and the Fund may therefore lose the opportunity tosell the securities at a desirable price.
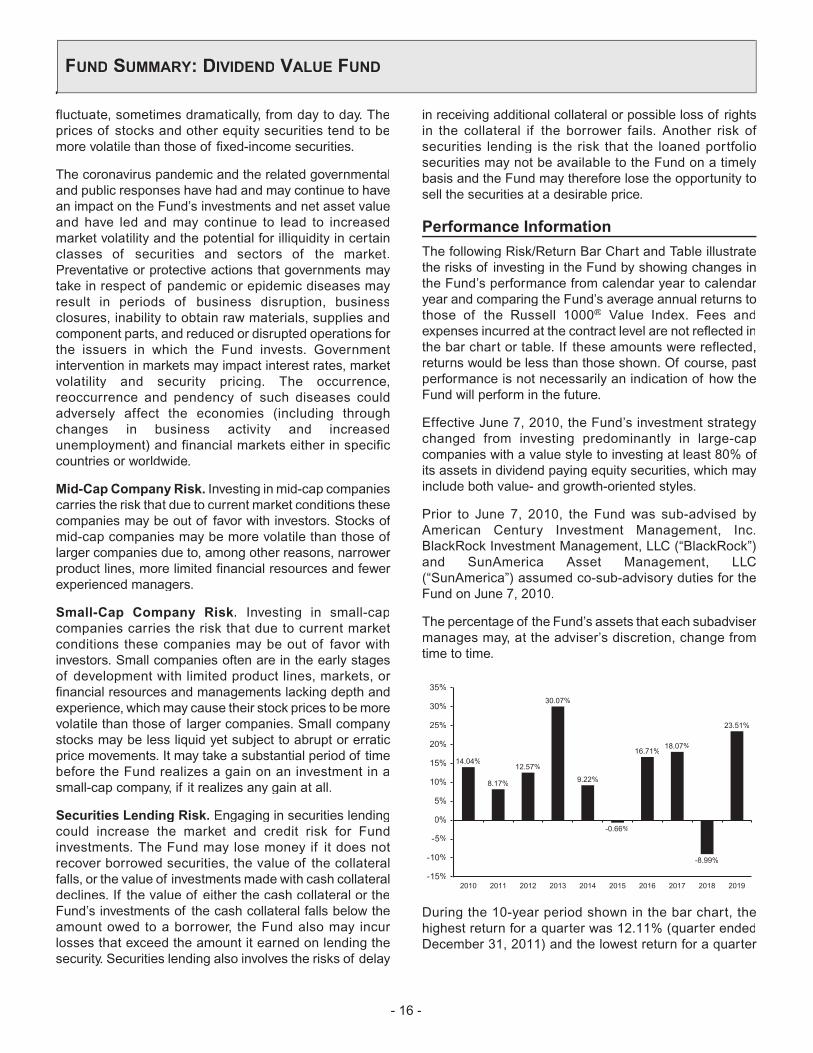
Performance Information
The following Risk/Return Bar Chart and Table illustratethe risks of investing in the Fund by showing changes inthe Fund’s performance from calendar year to calendaryear and comparing the Fund’s average annual returns tothose of the Russell 1000® Value Index. Fees andexpenses incurred at the contract level are not reflected inthe bar chart or table. If these amounts were reflected,returns would be less than those shown. Of course, pastperformance is not necessarily an indication of how theFund will perform in the future.
Effective June 7, 2010, the Fund’s investment strategychanged from investing predominantly in large-capcompanies with a value style to investing at least 80% ofits assets in dividend paying equity securities, which mayinclude both value- and growth-oriented styles.
Prior to June 7, 2010, the Fund was sub-advised byAmerican Century Investment Management, Inc.BlackRock Investment Management, LLC (“BlackRock”)and SunAmerica Asset Management, LLC(“SunAmerica”) assumed co-sub-advisory duties for theFund on June 7, 2010.
The percentage of the Fund’s assets that each subadvisermanages may, at the adviser’s discretion, change fromtime to time.
14.04%
8.17%
12.57%
30.07%
9.22%
-0.66%
16.71%18.07%
-8.99%
23.51%
-15%
-10%
-5%
0%
5%
10%
15%
20%
25%
30%
35%
2010 2011 2012 2013 2014 2015 2016 2017 2018 2019
During the 10-year period shown in the bar chart, thehighest return for a quarter was 12.11% (quarter endedDecember 31, 2011) and the lowest return for a quarter
FUND SUMMARY: DIVIDEND VALUE FUND
- 16 -

was -11.40% (quarter ended December 31, 2018). Theyear-to-date calendar return as of June 30, 2020 was-15.33%.
Average Annual Total Returns (For the periods endedDecember 31, 2019)
1Year
5Years
10Years
Fund 23.51% 9.00% 11.74%Russell 1000® Value Index(reflects no deduction forfees, expenses or taxes) 26.54% 8.29% 11.80%
Investment Adviser
The Fund’s investment adviser is The Variable AnnuityLife Insurance Company.
The Fund is subadvised by BlackRock and SunAmerica.
Portfolio Managersg
Name and Title
PortfolioManager of theFund Since
BlackRockTony DeSpiritoManaging Director and PortfolioManager ................................................ 2014
David ZhaoManaging Director and PortfolioManager ................................................ 2017
Franco TapiaManaging Director and PortfolioManager ................................................ 2017
SunAmericaTimothy PetteeSenior Vice President, ChiefInvestment Strategist and LeadPortfolio Manager .................................. 2013
Andrew SheridanSenior Vice President and Co-PortfolioManager ................................................ 2013
Timothy CampionSenior Vice President and Co-PortfolioManager ................................................ 2013
Jane AlgieriVice President and Co-Manager ........... 2019
For important information about purchases and sales ofFund shares, taxes and payments to broker-dealers andother financial intermediaries, please turn to the section“Important Additional Information” on page 127.
FUND SUMMARY: DIVIDEND VALUE FUND
- 17 -

Investment Objective
The Fund’s investment objectives are capital appreciationand current income while managing net equity exposure.
Fees and Expenses of the Fund
This table describes the fees and expenses that you maypay if you buy and hold shares of the Fund. The Fund’sannual operating expenses do not reflect the separateaccount fees charged in the variable annuity or variablelife insurance policy (“Variable Contracts”) in which theFund is offered. If separate account fees were shown, theFund’s annual operating expenses would be higher.Please see your Variable Contract prospectus for moredetails on the separate account fees. As an investor in theFund, you pay the expenses of the Fund and indirectly paya proportionate share of the expenses of the investmentcompanies in which the Fund invests (the “UnderlyingFunds”).
Annual Fund Operating Expenses (expenses that yougpay each year as a percentage of the value of yourinvestment)
Management Fees 0.25%Other Expenses 0.08%Acquired Fund Fees and Expenses 0.56%Total Annual Fund Operating Expenses1 0.89%Fee Waivers and/or Expense Reimbursements2 -0.01%Total Annual Fund Operating ExpensesAfter Fee Waivers and/or ExpenseReimbursements 0.88%
1 The Total Annual Fund Operating Expenses for the Fund do notcorrelate to the ratio of net expenses to average net assets providedin the Financial Highlights table of the Fund’s annual report, whichreflects the gross operating expenses of the Fund (0.33%) and doesnot include Acquired Fund Fees and Expenses. “Acquired Fund Feesand Expenses” include fees and expenses incurred indirectly by theFund as a result of investments in shares of one or more mutualfunds, hedge funds, private equity funds or other pooled investmentvehicles.
2 The Fund’s investment adviser, The Variable Annuity Life InsuranceCompany, has contractually agreed to reimburse the expenses of theFund through September 30, 2021, so that the Fund’s Total AnnualFund Operating Expenses After Fee Waivers and/or ExpenseReimbursements do not exceed 0.32%. For purposes of the ExpenseLimitation Agreement, “Total Annual Fund Operating Expenses” shallnot include extraordinary expenses (i.e. expenses that are unusual innature and infrequent in occurrence, such as litigation), or acquiredfund fees and expenses, brokerage commissions and othertransactional expenses relating to the purchase and sale of portfoliosecurities, interest, taxes and governmental fees, and otherexpenses not incurred in the ordinary course of the Fund’s business.This Expense Limitation Agreement will continue in effect from yearto year thereafter unless terminated by the Board of Directors priorto any such renewal.
Expense Example
This Example is intended to help you compare the cost ofinvesting in the Fund with the cost of investing in othermutual funds. The Example assumes that you invest$10,000 in the Fund for the time periods indicated andthen redeem all of your shares at the end of those periods.The Example also assumes that your investment has a 5%return each year and that the Fund’s operating expensesinclude fee waivers for one year. The Example does notreflect charges imposed by the Variable Contract. If theVariable Contract fees were reflected, the expenses wouldbe higher. See the Variable Contract prospectus forinformation on such charges. Although your actual costsmay be higher or lower, based on these assumptions andthe net expenses shown in the fee table, your costs wouldbe:
1 Year 3 Years 5 Years 10 Years
$90 $283 $492 $1,095
Portfolio Turnover
The portion of the Fund that operates as a fund-of-fundsdoes not pay transaction costs when it buys and sellsshares of Underlying Funds (or “turns over” its portfolio).An Underlying Fund pays transaction costs, such ascommissions, when it turns over its portfolio, and a higherportfolio turnover rate may indicate higher transactioncosts. These costs, which are not reflected in annual Fundoperating expenses or in the Example, affect theperformance of both the Underlying Funds and the Fund.The Fund does, however, pay transaction costs when itbuys and sells the financial instruments held in theOverlay Component of the Fund (defined below). Duringthe most recent fiscal year, the Fund’s portfolio turnoverrate was 20% of the average value of its portfolio.
Principal Investment Strategies of the Fund
The Fund seeks to achieve its objectives by investingunder normal conditions approximately 70% to 90% of itsassets in shares of the Underlying Funds, which areportfolios of VALIC Company I (“VC I”) and VALICCompany II (“VC II”), (collectively, the “UnderlyingCompanies”) (the “Fund-of-Funds Component”) and 10%to 30% of its assets in a portfolio of derivative instruments,fixed income securities and short-term investments (the“Overlay Component”).
The Fund-of-Funds Component will allocateapproximately 50% to 80% of its assets to UnderlyingFunds investing primarily in equity securities and 20% to
FUND SUMMARY: DYNAMIC ALLOCATION FUND
- 18 -

50% of its assets to Underlying Funds investing primarilyin fixed income securities and short-term investments,which may include mortgage- and asset-backedsecurities, to seek capital appreciation and generateincome.
VALIC is the Fund’s investment adviser (the “Adviser”).The Fund is sub-advised by SunAmerica AssetManagement, LLC (“SunAmerica”) and AllianceBernsteinL.P. (“AllianceBernstein”). The Adviser will determine thePPallocation between the Fund-of-Funds Component andthe Overlay Component. SunAmerica is responsible formanaging the Fund-of-Funds Component’s investment inUnderlying Funds, so it will determine the target allocationbetween Underlying Funds that invest primarily in equitysecurities and Underlying Funds that invest primarily infixed income securities. SunAmerica performs aninvestment analysis of possible investments for the Fundand selects the universe of permitted Underlying Fundsas well as the allocation to each Underlying Fund. TheAdviser may change the Fund’s asset allocation betweenthe Fund-of-Funds Component and the OverlayComponent from time to time without prior notice.SunAmerica may change the Fund-of-FundsComponent’s allocation among the Underlying Funds,and may invest in other funds not currently among theUnderlying Funds, from time to time without prior notice toinvestors.
The Fund-of-Funds Component seeks to achieve capitalappreciation primarily through its investments inUnderlying Funds that invest in equity securities of bothU.S. and non-U.S. companies of all market capitalizations,but expects to invest to a lesser extent in UnderlyingFunds that invest primarily in small- and mid-cap U.S.companies and foreign companies. The Fund normallydoes not expect to have more than 25% of its total assetsallocated to Underlying Funds investing primarily inforeign securities, and no more than 5% of its total assetsto Underlying Funds investing primarily in emergingmarkets (an emerging market is any country that isincluded in the MSCI Emerging Markets Index). The Fund-of-Funds Component seeks to achieve current incomethrough its investments in Underlying Funds that primarilyinvest in fixed income securities, including both U.S. andforeign investment grade securities, but the Fund normallydoes not expect to have more than 5% of total assetsallocated to Underlying Funds investing primarily in high-yield, high-risk bonds (commonly known as “junk bonds”),which are considered speculative. Fund cash flows areexpected to be used to maintain or move Underlying Fundexposure close to target allocations, but sales andpurchases of Underlying Funds may also be used tochange or remain near target allocations.
The Overlay Component comprises the remaining 10%-30% of the Fund’s total assets. AllianceBernstein isresponsible for managing the Overlay Component, whichincludes management of the derivative instruments, fixedincome securities and short-term investments.
AllianceBernstein may invest the Overlay Component inderivative instruments to increase or decrease the Fund’soverall net equity exposure and, therefore, its volatility andreturn potential. Volatility is a statistical measurement ofthe magnitude of up and down fluctuations in the value ofa financial instrument or index over time. High levels ofvolatility may result from rapid and dramatic price swings.Through its use of derivative instruments,AllianceBernstein may adjust the Fund’s net equityexposure down to a minimum of 25% or up to a maximumof 100%, although the Fund’s average net equityexposure over long term periods is expected to beapproximately 60%-65%. The Fund’s net equity exposureis primarily adjusted through the use of derivativeinstruments, such as stock index futures and stock indexoptions, and to a lesser extent options on stock indexfutures and stock index swaps, as the allocation amongUnderlying Funds in the Fund-of-Funds Component isexpected to remain fairly stable. For example, when themarket is in a state of higher volatility, AllianceBernsteinmay decrease the Fund’s net equity exposure by taking ashort position in derivative instruments. A short saleinvolves the sale by the Fund of a security or instrument itdoes not own with the expectation of purchasing the samesecurity or instrument at a later date at a lower price. Theoperation of the Overlay Component may thereforeexpose the Fund to leverage. Because derivativeinstruments may be purchased with a fraction of theassets that would be needed to purchase the equitysecurities directly, the remainder of the assets in theOverlay Component will be invested in a variety of fixedincome securities.
The Fund’s performance may be lower than similar Fundsthat do not seek to manage their equity exposure. IfAllianceBernstein increases the Fund’s net equityexposure and equity markets decline, the Fund mayunderperform traditional or static allocation funds.Likewise, if AllianceBernstein reduces the Fund’s netequity exposure and equity markets rise, the Fund mayalso underperform traditional or static allocation funds.Efforts to manage the Fund’s volatility may also exposethe Fund to additional costs. In addition, AllianceBernsteinwill seek to reduce exposure to certain downside risks bypurchasing equity index put options that aim to reduce theFund exposure to certain severe and unanticipatedmarket events that could significantly detract from returns.
FUND SUMMARY: DYNAMIC ALLOCATION FUND
- 19 -
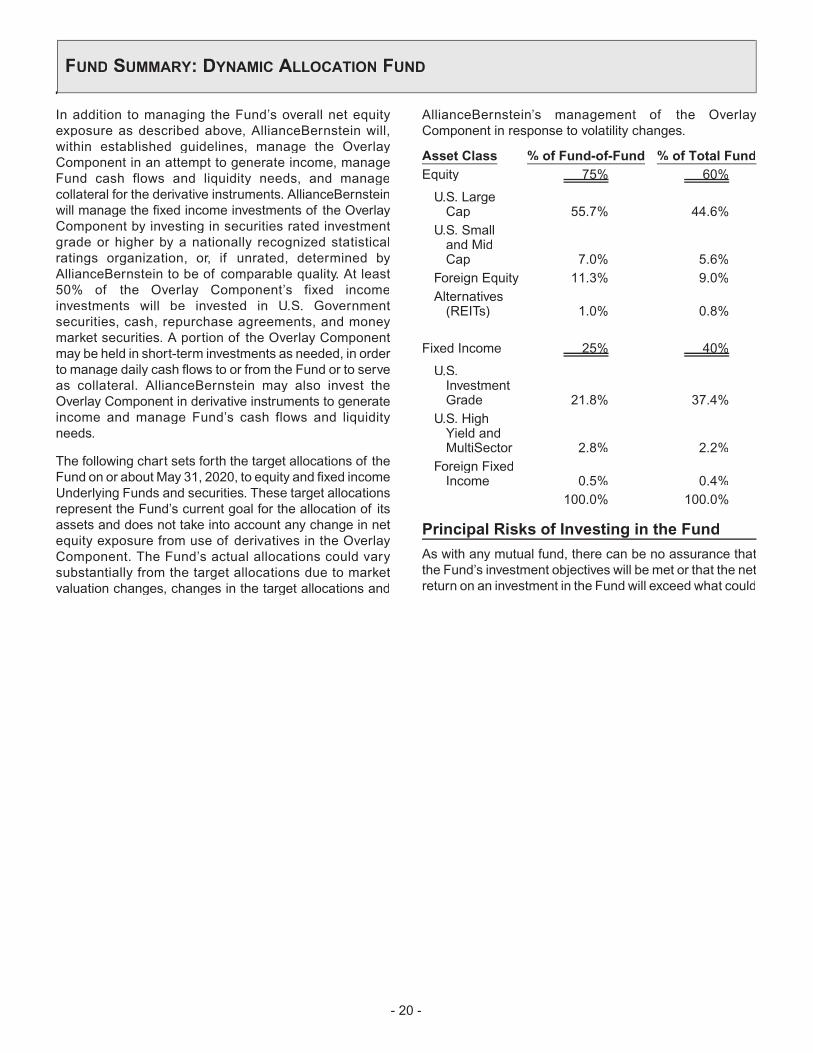
In addition to managing the Fund’s overall net equityexposure as described above, AllianceBernstein will,within established guidelines, manage the OverlayComponent in an attempt to generate income, manageFund cash flows and liquidity needs, and managecollateral for the derivative instruments. AllianceBernsteinwill manage the fixed income investments of the OverlayComponent by investing in securities rated investmentgrade or higher by a nationally recognized statisticalratings organization, or, if unrated, determined byAllianceBernstein to be of comparable quality. At least50% of the Overlay Component’s fixed incomeinvestments will be invested in U.S. Governmentsecurities, cash, repurchase agreements, and moneymarket securities. A portion of the Overlay Componentmay be held in short-term investments as needed, in orderto manage daily cash flows to or from the Fund or to serveas collateral. AllianceBernstein may also invest theOverlay Component in derivative instruments to generateincome and manage Fund’s cash flows and liquidityneeds.
The following chart sets forth the target allocations of theFund on or about May 31, 2020, to equity and fixed incomeUnderlying Funds and securities. These target allocationsrepresent the Fund’s current goal for the allocation of itsassets and does not take into account any change in netequity exposure from use of derivatives in the OverlayComponent. The Fund’s actual allocations could varysubstantially from the target allocations due to marketvaluation changes, changes in the target allocations and
AllianceBernstein’s management of the OverlayComponent in response to volatility changes.
Asset Class % of Fund-of-Fund % of Total FundEquity 75% 60%75% 60%
U.S. LargeCap 55.7% 44.6%
U.S. Smalland MidCap 7.0% 5.6%
Foreign Equity 11.3% 9.0%Alternatives(REITs) 1.0% 0.8%
Fixed Income 25% 40%25% 40%
U.S.InvestmentGrade 21.8% 37.4%
U.S. HighYield andMultiSector 2.8% 2.2%
Foreign FixedIncome 0.5% 0.4%
100.0% 100.0%
Principal Risks of Investing in the Fund
As with any mutual fund, there can be no assurance thatthe Fund’s investment objectives will be met or that the netreturn on an investment in the Fund will exceed what could
FUND SUMMARY: DYNAMIC ALLOCATION FUND
- 20 -

have been obtained through other investment or savingsvehicles. Shares of the Fund are not bank deposits andare not guaranteed or insured by any bank, governmententity or the Federal Deposit Insurance Corporation. If thevalue of the assets of the Fund goes down, you could losemoney.
The risks of investing in the Fund include indirect risksassociated with the Fund’s investments in UnderlyingFunds. The risks of investing in the Fund include indirectrisks associated with the Fund’s investments inUnderlying Funds. The value of your investment in theFund may be affected by one or more of the followingrisks, which are described in more detail in the sections“Additional Information About the Funds’ InvestmentObjectives, Strategies and Investment Risks” and the“Investment Glossary” in the Prospectus, any of whichcould cause the Fund’s return, the price of the Fund’sshares or the Fund’s yield to fluctuate. Please note thatthere are many other circumstances that could adverselyaffect your investment and prevent the Fund from reachingits objective, which are not described here.
Market Risk. Market risk is both a direct and indirect riskof investing in the Fund. The Fund’s or an UnderlyingFund’s share price can fall because of weakness in thebroad market, a particular industry, or specific holdings.The market as a whole can decline for many reasons,including adverse political or economic developmentshere or abroad, changes in investor psychology, or heavyinstitutional selling. The prospects for an industry orcompany may deteriorate because of a variety of factors,including disappointing earnings or changes in thecompetitive environment. In addition, the investmentadviser’s assessment of companies held in an UnderlyingFund may prove incorrect, resulting in losses or poorperformance even in a rising market. Finally, the Fund’s oran Underlying Fund’s investment approach could fall outof favor with the investing public, resulting in laggingperformance versus other comparable portfolios.
Derivatives Risk. Derivatives risk is both a direct andindirect risk of investing in the Fund. A derivative is anyfinancial instrument whose value is based on, anddetermined by, another security, index or benchmark (i.e.,stock option, futures, caps, floors, etc.). To the extent aderivative contract is used to hedge another position in theFund or an Underlying Fund, the Fund or Underlying Fundwill be exposed to the risks associated with hedgingdescribed below. To the extent an option, futures contract,swap, or other derivative is used to enhance return, ratherthan as a hedge, the Fund or Underlying Fund will be
directly exposed to the risks of the contract. Gains orlosses from non-hedging positions may be substantiallygreater than the cost of the position. By purchasing over-the-counter derivatives, the Fund or Underlying Fund isexposed to credit quality risk of the counterparty.
Counterparty Risk. Counterparty risk is both a direct andindirect risk of investing in the Fund. Counterparty risk isthe risk that a counterparty to a security, loan or derivativeheld by the Fund or an Underlying Fund becomesbankrupt or otherwise fails to perform its obligations dueto financial difficulties. The Fund or an Underlying Fundmay experience significant delays in obtaining anyrecovery in a bankruptcy or other reorganizationproceeding, and there may be no recovery or limitedrecovery in such circumstances.
Leverage Risk. Leverage risk is a direct risk of investingin the Fund. Certain managed futures instruments, andsome other derivatives the Fund buys involve a degree ofleverage. Leverage occurs when an investor has the rightto a return on an investment that exceeds the return thatthe investor would be expected to receive based on theamount contributed to the investment. The Fund’s use ofcertain economically leveraged futures and otherderivatives can result in a loss substantially greater thanthe amount invested in the futures or other derivative itself.Certain futures and other derivatives have the potential forunlimited loss, regardless of the size of the initialinvestment. When the Fund uses futures and otherderivatives for leverage, a shareholder’s investment in theFund will tend to be more volatile, resulting in larger gainsor losses in response to the fluctuating prices of theFund’s investments.
Risk of Investing in Bonds. This is both a direct andindirect risk of investing in the Fund. As with any fund thatinvests significantly in bonds, the value of an investmentin the Fund or an Underlying Fund may go up or down inresponse to changes in interest rates or defaults (or eventhe potential for future defaults) by bond issuers.
Interest Rate Fluctuations Risk. Fixed income securitiesmay be subject to volatility due to changes in interestrates. Duration is a measure of interest rate risk thatindicates how price-sensitive a bond is to changes ininterest rates. Longer-term and lower coupon bonds tendto be more sensitive to changes in interest rates. Interestrates have been historically low, so the Fund faces aheightened risk that interest rates may rise. For example,a bond with a duration of three years will decrease in valueby approximately 3% if interest rates increase by 1%.
FUND SUMMARY: DYNAMIC ALLOCATION FUND
- 21 -
Potential future changes in monetary policy made bycentral banks and/or their governments are likely to affectthe level of interest rates.
Credit Risk. Credit risk is both a direct and indirect risk ofinvesting in the Fund. Credit risk applies to most debtsecurities, but is generally not a factor for obligationsbacked by the “full faith and credit” of the U.S.Government. The Fund or an Underlying Fund could losemoney if the issuer of a debt security is unable orperceived to be unable to pay interest or repay principalwhen it becomes due. Various factors could affect theissuer’s actual or perceived willingness or ability to maketimely interest or principal payments, including changes inthe issuer’s financial condition or in general economicconditions.
Hedging Risk. Hedging risk is both a direct and indirectrisk of investing in this Fund. A hedge is an investmentmade in order to reduce the risk of adverse pricemovements in a currency or other investment, by taking anoffsetting position (often through a derivative, such as anoption or forward). While hedging strategies can be veryuseful and inexpensive ways of reducing risk, they aresometimes ineffective due to the unexpected changes inthe market. Hedging also involves the risk that changes inthe value of the related security will not match those of theinstruments being hedged as expected, in which case anylosses on the instruments being hedged may not bereduced. For gross currency hedges by Underlying Funds,there is an additional risk, to the extent that thesetransactions create exposure to currencies in which anUnderlying Fund’s securities are not denominated.
Short Sales Risk. Short sale risk is both a direct andindirect risk of investing in the Fund. Short sales by theFund or an Underlying Fund involve certain risks andspecial considerations. Possible losses from short salesdiffer from losses that could be incurred from a purchaseof a security, because losses from short sales arepotentially unlimited, whereas losses from purchases canbe no greater than the total amount invested.
U.S. Government Obligations Risk. This is both a directand indirect risk of investing in the Fund. U.S. Treasuryobligations are backed by the “full faith and credit” of theU.S. Government and are generally considered to haveminimal credit risk. Securities issued or guaranteed byfederal agencies or authorities and U.S. Government-sponsored instrumentalities or enterprises may or may notbe backed by the full faith and credit of theU.S. Government. For example, securities issued by theFederal Home Loan Mortgage Corporation, the FederalNational Mortgage Association and the Federal HomeLoan Banks are neither insured nor guaranteed by theU.S. Government; the securities may be supported only by
the ability to borrow from the U.S. Treasury or by the creditof the issuing agency, authority, instrumentality orenterprise and, as a result, are subject to greater creditrisk than securities issued or guaranteed by theU.S. Treasury.
Risk of Investing in Money Market Securities. This isboth a direct and indirect risk of investing in the Fund. Aninvestment in the Fund is subject to the risk that the valueof its investments in high-quality short-term obligations(“money market securities”) may be subject to changes ininterest rates, changes in the rating of any money marketsecurity and in the ability of an issuer to make paymentsof interest and principal.
Issuer Risk. The value of a security may decline for anumber of reasons directly related to the issuer, such asmanagement performance, financial leverage andreduced demand for the issuer’s goods and services.
Dynamic Allocation Risk. The Fund’s risks will directlycorrespond to the risks of the Underlying Funds and otherdirect investments in which it invests. The Fund is subjectto the risk that the investment process that will determinethe selection of the Underlying Funds and the allocationand reallocation of the Fund’s assets among the variousasset classes may not produce the desired result. TheFund is also subject to the risk that AllianceBernstein maybe prevented from trading certain derivatives effectively orin a timely manner.
Risk of Conflict with Insurance Company Interests.Managing the Fund’s net equity exposure may serve toreduce the risk from equity market volatility to the affiliatedinsurance companies and facilitate their ability to provideguaranteed benefits associated with certain VariableContracts. While the interests of Fund shareholders andthe affiliated insurance companies providing guaranteedbenefits associated with the Variable Contracts aregenerally aligned, the affiliated insurance companies (andthe Adviser by virtue of its affiliation with the insurancecompanies) may face potential conflicts of interest. Inparticular, certain aspects of the Fund’s managementhave the effect of mitigating the financial risks to which theaffiliated insurance companies are subjected by providingthose guaranteed benefits. In addition, the Fund’sperformance may be lower than similar Funds that do notseek to manage their equity exposure.
Investment Company Risk. The risks of the Fundowning other investment companies, including theUnderlying Funds, generally reflect the risks of owning theunderlying securities they are designed to track, althoughlack of liquidity in these investments could result in it beingmore volatile than the underlying Fund of securities.Disruptions in the markets for the securities held by other
FUND SUMMARY: DYNAMIC ALLOCATION FUND
- 22 -

investment company companies, including the UnderlyingFunds purchased or sold by the Fund could result inlosses on the Fund’s investment in such securities. Theother investment company companies, includingUnderlying Funds also have fees that increase their costsversus owning the underlying securities directly.
Affiliated Fund Risk. In managing the portion of theFund that invests in Underlying Funds, SunAmerica willhave the authority to select and substitute the UnderlyingFunds. SunAmerica may be subject to potential conflictsof interest in allocating the Fund’s assets among thevarious Underlying Funds because the fees payable to itby the Adviser for some of the Underlying Funds arehigher than the fees payable by other Underlying Fundsand because SunAmerica also is responsible formanaging and administering certain of the UnderlyingFunds.
Other indirect principal risks of investing in the Fund(direct risks of investing in the Underlying Funds) include:
Large-Cap Companies Risk. Large-cap companies tendto be less volatile than companies with smaller marketcapitalizations. In exchange for this potentially lower risk,an Underlying Fund’s value may not rise as much as thevalue of Funds that emphasize smaller companies.
“Passively Managed” Strategy Risk. An UnderlyingFund following a passively managed strategy will notdeviate from its investment strategy. In most cases, it willinvolve a passively managed strategy utilized to achieveinvestment results that correspond to a particular marketindex. Such a Fund will not sell securities in its portfolioand buy different securities for other reasons, even if thereare adverse developments concerning a particularsecurity, company or industry. There can be no assurancethat the strategy will be successful.
Small- and Medium-Sized Companies Risk. Securitiesof small- and medium-sized companies are usually morevolatile and entail greater risks than securities of largecompanies.
Growth Stock Risk. Growth stocks are historicallyvolatile, which will affect certain Underlying Funds.
Value Investing Risk. The investment adviser’sjudgments that a particular security is undervalued inrelation to the company’s fundamental economic valuemay prove incorrect, which will affect certain UnderlyingFunds.
Foreign Investment Risk. Investments in foreigncountries are subject to a number of risks. A principal riskis that fluctuations in the exchange rates between the U.S.dollar and foreign currencies may negatively affect the
value of an investment. In addition, there may be lesspublicly available information about a foreign companyand it may not be subject to the same uniform accounting,auditing and financial reporting standards as U.S.companies. Foreign governments may not regulatesecurities markets and companies to the same degree asthe U.S. government. Foreign investments will also beaffected by local political or economic developments andgovernmental actions by the United States or othergovernments. Consequently, foreign securities may beless liquid, more volatile and more difficult to price thanU.S. securities. These risks are heightened for emergingmarkets issuers. Historically, the markets of emergingmarket countries have been more volatile than moredeveloped markets; however, such markets can providehigher rates of return to investors.
Credit Quality Risk. The creditworthiness of an issuer isalways a factor in analyzing fixed income securities. Anissuer with a lower credit rating will be more likely than ahigher rated issuer to default or otherwise become unableto honor its financial obligations. Issuers with low creditratings typically issue junk bonds, which are consideredspeculative. In addition to the risk of default, junk bondsmay be more volatile, less liquid, more difficult to valueand more susceptible to adverse economic conditions orinvestor perceptions than investment grade bonds.
Mortgage- and Asset-Backed Securities Risk.Mortgage- and asset-backed securities representinterests in “pools” of mortgages or other assets, includingconsumer loans or receivables held in trust. Thecharacteristics of these mortgage-backed and asset-backed securities differ from traditional fixed-incomesecurities. Mortgage-backed securities are subject to“prepayment risk” and “extension risk.” Prepayment risk isthe risk that, when interest rates fall, certain types ofobligations will be paid off by the obligor more quickly thanoriginally anticipated and the Fund may have to invest theproceeds in securities with lower yields. Extension risk isthe risk that, when interest rates rise, certain obligationswill be paid off by the obligor more slowly than anticipated,causing the value of these securities to fall. Smallmovements in interest rates (both increases anddecreases) may quickly and significantly reduce the valueof certain mortgage-backed securities. These securitiesalso are subject to risk of default on the underlyingmortgage, particularly during periods of economicdownturn.
Performance Information
The following Risk/Return Bar Chart and Table illustratethe risks of investing in the Fund by showing changes inthe Fund’s performance from calendar year to calendar
FUND SUMMARY: DYNAMIC ALLOCATION FUND
- 23 -

year and comparing the Fund’s average annual returns tothose of the S&P 500® Index, the Bloomberg BarclaysU.S. Aggregate Bond Index, and a Blended Index. Theblended index is comprised of the S&P 500® Index(60%) and the Bloomberg Barclays U.S. Aggregate BondIndex (40%). Fees and expenses incurred at the contractlevel are not reflected in the bar chart or table. If theseamounts were reflected, returns would be less than thoseshown. Of course, past performance is not necessarily anindication of how the Fund will perform in the future.
The percentage of the Fund’s assets that each sub-adviser manages may, at the adviser’s discretion, changefrom time to time.
4.24%
-4.57%
4.84%
20.22%
-6.92%
20.32%
-10%
-5%
0%
5%
10%
15%
20%
25%
2013 2014 2015 2016 2017 2018 2019
During the 7-year period shown in the bar chart, thehighest return for a quarter was 9.62% (quarter endedMarch 31, 2019) and the lowest return for a quarter was-10.10% (quarter ended December 31, 2018). The year-to-date calendar return as of June 30, 2020 was -0.12%.
Average Annual Total Returns (For the periods endedDecember 31, 2019)
1Year
5Years
SinceInception(12-19-12)
Fund 20.32% 6.14% 7.35%Blended Index (reflectsno deduction for fees,expenses or taxes) 22.18% 8.37% 9.81%
Bloomberg Barclays U.S.Aggregate Bond Index(reflects no deductionfor fees, expenses ortaxes) 8.72% 3.05% 2.77%
S&P 500® Index (reflectsno deduction for fees,expenses or taxes) 31.49% 11.70% 14.43%
Investment Adviser
The Fund’s investment adviser is VALIC.
The Fund-of-Funds Component is sub-advised bySunAmerica. The Overlay Component of the Fund is sub-advised by AllianceBernstein.
Portfolio Managersg
Name and Title
PortfolioManager of theFund Since
SunAmericaDouglas A. Loeffler, CFASenior Vice President and LeadPortfolio Manager .................................. 2015
Manisha Singh, CFASenior Vice President and Co-PortfolioManager ................................................ 2017
AllianceBernsteinJoshua LisserChief Investment Officer and LeadPortfolio Manager - Index Strategies ..... 2012
Ben SklarPortfolio Manager - Index Strategies ..... 2012
For important information about purchases and sales ofFund shares, taxes and payments to broker-dealers andother financial intermediaries, please turn to the section“Important Additional Information” on page 127.
FUND SUMMARY: DYNAMIC ALLOCATION FUND
- 24 -

Investment Objective
The Fund seeks capital appreciation.
Fees and Expenses of the Fund
This table describes the fees and expenses that you maypay if you buy and hold shares of the Fund. The Fund’sannual operating expenses do not reflect the separateaccount fees charged in the variable annuity or variablelife insurance policy (“Variable Contracts”) in which theFund is offered. If separate account fees were shown, theFund’s annual operating expenses would be higher.Please see your Variable Contract prospectus for moredetails on the separate account fees.
Annual Fund Operating Expenses (expenses that yougpay each year as a percentage of the value of yourinvestment)
Management Fees 0.76%Other Expenses 0.15%Total Annual Fund Operating Expenses 0.91%
Expense Example
This Example is intended to help you compare the cost ofinvesting in the Fund with the cost of investing in othermutual funds. The Example assumes that you invest$10,000 in the Fund for the time periods indicated andthen redeem all of your shares at the end of those periods.The Example also assumes that your investment has a 5%return each year and that the Fund’s operating expensesremain the same. The Example does not reflect chargesimposed by the Variable Contract. If the Variable Contractfees were reflected, the expenses would be higher. Seethe Variable Contract prospectus for information on suchcharges. Although your actual costs may be higher orlower, based on these assumptions and the net expensesshown in the fee table, your costs would be:
1 Year 3 Years 5 Years 10 Years
$93 $290 $504 $1,120
Portfolio Turnover
The Fund pays transaction costs, such as commissions,when it buys and sells securities (or “turns over” itsportfolio). These costs, which are not reflected in annualfund operating expenses or in the Example, affect theFund’s performance.
During the most recent fiscal year, the Fund’s portfolioturnover rate was 62% of the average value of its portfolio.
Principal Investment Strategies of the Fund
Under normal circumstances, the Fund invests at least80% of value of its net assets in equity securities ofemerging market companies and other investments thatare tied economically to emerging markets. Emergingmarkets include most countries in the world exceptAustralia, Canada, Japan, New Zealand, the UnitedKingdom, the United States, and most of the countries ofWestern Europe. An emerging market company is onethat is organized under the laws of, or has a principal placeof business in an emerging market; where the principalsecurities market is in an emerging market; that derives atleast 50% of its total revenues or profits from goods thatare produced or sold, investments made, or servicesperformed in an emerging market; or at least 50% of theassets of which are located in an emerging market. TheFund is not required to allocate its investments in any setpercentages to any particular countries. The Fund is notconstrained by company size or style limits and will investacross sectors. The Fund will invest in securities issued bycompanies of any size, although the Fund may invest asignificant portion of its assets in companies of aparticular market capitalization size at the discretion of theSubadviser.
The Fund may overweight or underweight countriesrelative to its benchmark, the MSCI Emerging MarketsIndex. The Fund emphasizes securities that are ranked asundervalued, while underweighting or avoiding securitiesthat appear overvalued. The Fund, from time to time, mayinvest a significant portion of its assets in one or morecountries or regions.
The Fund may invest in securities denominated in U.S.dollars, other major reserve currencies, such as the euro,yen and pound sterling, and currencies of other countriesin which it can invest. The Fund typically maintains fullcurrency exposure to those markets in which it invests.However, the Fund may from time to time hedge a portionof its foreign currency exposure into the U.S. dollar. TheFund’s equity securities generally consist of common andpreferred stock. The Fund may also invest in depositaryreceipts.
In order to generate additional income, the Fund may lendportfolio securities to broker-dealers and other financialinstitutions provided that the value of the loaned securitiesdoes not exceed 30% of the Fund’s total assets. Theseloans earn income for the Fund and are collateralized bycash and securities issued or guaranteed by the U.S.Government or its agencies or instrumentalities. Investors
FUND SUMMARY: EMERGING ECONOMIES FUND
- 25 -

will be given at least 60 days’ written notice in advance ofany change to the Fund’s 80% investment policy set forthabove.
Principal Risks of Investing in the Fund
As with any mutual fund, there can be no assurance thatthe Fund’s investment objective will be met or that the netreturn on an investment in the Fund will exceed what couldhave been obtained through other investment or savingsvehicles. Shares of the Fund are not bank deposits andare not guaranteed or insured by any bank, governmententity or the Federal Deposit Insurance Corporation. If thevalue of the assets of the Fund goes down, you could losemoney.
The following is a summary of the principal risks ofinvesting in the Fund.
Management Risk. The investment style or strategy usedby the Subadviser may fail to produce the intended result.The Subadviser’s assessment of a particular security orcompany may prove incorrect, resulting in losses orunderperformance.
Foreign Investment Risk. Investment in foreignsecurities involves risks due to several factors, such asilliquidity, the lack of public information, changes in theexchange rates between foreign currencies and the U.S.dollar, unfavorable political, social and legaldevelopments, or economic and financial instability.Foreign companies are not subject to the U.S. accountingand financial reporting standards and may have riskiersettlement procedures. U.S. investments that aredenominated in foreign currencies or that are traded inforeign markets, or securities of U.S. companies that havesignificant foreign operations may be subject to foreigninvestment risk.
Emerging Markets Risk. In addition to the risksassociated with investments in foreign securities,emerging market securities are subject to additional risks,which cause these securities generally to be more volatilethan securities of issuers located in developed countries.
Currency Risk. Because the Fund’s foreign investmentsare generally held in foreign currencies, the Fund couldexperience gains or losses based solely on changes in theexchange rate between foreign currencies and the U.S.dollar. Such gains or losses may be substantial.
Geographic Risk. If the Fund invests a significant portionof its assets in issuers located in a single country, a limitednumber of countries, or a particular geographic region, itassumes the risk that economic, political and socialconditions in those countries or that region may have asignificant impact on its investment performance.
Equity Securities Risk. The Fund invests principally inequity securities and is the subject to the risk that stockprices will fall and may underperform other asset classes.Individual stock prices fluctuate from day-to-day and maydecline significantly. The prices of individual stocks maybe negatively affected by poor company results or otherfactors affecting individual prices, as well as industry and/or economic trends and developments affecting industriesor the securities market as a whole.
Preferred Stock Risk. Unlike common stock, preferredstock generally pays a fixed dividend from a company’searnings and may have a preference over common stockon the distribution of a company’s assets in the event ofbankruptcy or liquidation. Preferred stockholders’liquidation rights are subordinate to the company’s debtholders and creditors. If interest rates rise, the fixeddividend on preferred stocks may be less attractive andthe price of preferred stocks may decline. Preferredstockholders typically do not have voting rights.
Depositary Receipts Risk. Depositary receipts aregenerally subject to the same risks as the foreignsecurities that they evidence or into which they may beconverted. Depositary receipts may or may not be jointlysponsored by the underlying issuer. The issuers ofunsponsored depositary receipts are not obligated todisclose information that is considered material in theUnited States. Therefore, there may be less informationavailable regarding the issuers and there may not be acorrelation between such information and the marketvalue of the depositary receipts. Certain depositaryreceipts are not listed on an exchange and therefore maybe considered to be illiquid securities.
Large-Cap Companies Risk. Large-cap companies tendto go in and out of favor based on market and economicconditions and tend to be less volatile than companieswith smaller market capitalizations. In exchange for thispotentially lower risk, the Fund’s value may not rise asmuch as the value of funds that emphasize smallercapitalization companies. Larger, more establishedcompanies may be unable to respond quickly to newcompetitive challenges, such as changes in technologyand consumer tastes. Larger companies also may not beable to attain the high growth rate of successful smallercompanies, particularly during extended periods ofeconomic expansion.
Mid-Cap Company Risk. Investing in mid-cap companiescarries the risk that due to current market conditions thesecompanies may be out of favor with investors. Stocks ofmid-cap companies may be more volatile than those oflarger companies due to, among other reasons, narrowerproduct lines, more limited financial resources and fewerexperienced managers.
FUND SUMMARY: EMERGING ECONOMIES FUND
- 26 -

Small-Cap Company Risk. Investing in small-capcompanies carries the risk that due to current marketconditions these companies may be out of favor withinvestors. Small companies often are in the early stagesof development with limited product lines, markets, orfinancial resources and managements lacking depth andexperience, which may cause their stock prices to bemorevolatile than those of larger companies. Small companystocks may be less liquid yet subject to abrupt or erraticprice movements. It may take a substantial period of timebefore the Fund realizes a gain on an investment in asmall-cap company, if it realizes any gain at all.
Derivatives Risk. The prices of derivatives may move inunexpected ways due to the use of leverage and otherfactors and may result in increased volatility or losses. TheFund may not be able to terminate or sell derivativepositions, and a liquid secondary market may not alwaysexist for derivative positions.
Hedging Risk. A hedge is an investment made in order toreduce the risk of adverse price movements in a currencyor other investment by taking an offsetting position (oftenthrough a derivative instrument, such as an option orforward contract). While hedging strategies can be veryuseful and inexpensive ways of reducing risk, they aresometimes ineffective due to unexpected changes in themarket. Hedging also involves the risk that changes in thevalue of the related security will not match those of theinstruments being hedged as expected, in which case anylosses on the instruments being hedged may not bereduced.
Market Risk. The Fund’s share price can fall because ofweakness in the broad market, a particular industry, orspecific holdings or due to adverse political or economicdevelopments here or abroad, changes in investorpsychology, or heavy institutional selling and otherconditions or events (including, for example, militaryconfrontations, war, terrorism, disease/virus, outbreaksand epidemics). The prices of individual securities mayfluctuate, sometimes dramatically, from day to day. Theprices of stocks and other equity securities tend to bemore volatile than those of fixed-income securities.
The coronavirus pandemic and the related governmentaland public responses have had and may continue to havean impact on the Fund’s investments and net asset valueand have led and may continue to lead to increasedmarket volatility and the potential for illiquidity in certainclasses of securities and sectors of the market.Preventative or protective actions that governments maytake in respect of pandemic or epidemic diseases may
result in periods of business disruption, businessclosures, inability to obtain raw materials, supplies andcomponent parts, and reduced or disrupted operations forthe issuers in which the Fund invests. Governmentintervention in markets may impact interest rates, marketvolatility and security pricing. The occurrence,reoccurrence and pendency of such diseases couldadversely affect the economies (including throughchanges in business activity and increasedunemployment) and financial markets either in specificcountries or worldwide.
Value Style Risk. Generally, “value” stocks are stocks ofcompanies that a subadviser believes are currentlyundervalued in the marketplace. A subadviser’s judgmentthat a particular security is undervalued in relation to thecompany’s fundamental economic value may proveincorrect and the price of the company’s stock may fall ormay not approach the value the subadviser has placed onit.
Securities Lending Risk. Engaging in securities lendingcould increase the market and credit risk for Fundinvestments. The Fund may lose money if it does notrecover borrowed securities, the value of the collateralfalls, or the value of investments made with cash collateraldeclines. If the value of either the cash collateral or theFund’s investments of the cash collateral falls below theamount owed to a borrower, the Fund also may incurlosses that exceed the amount it earned on lending thesecurity. Securities lending also involves the risks of delayin receiving additional collateral or possible loss of rightsin the collateral if the borrower fails. Another risk ofsecurities lending is the risk that the loaned portfoliosecurities may not be available to the Fund on a timelybasis and the Fund may therefore lose the opportunity tosell the securities at a desirable price.
Performance Information
The following Risk/Return Bar Chart and Table illustratethe risks of investing in the Fund by showing changes inthe Fund’s performance from calendar year to calendaryear and comparing the Fund’s average annual returns tothose of the MSCI Emerging Markets Index (net). Feesand expenses incurred at the contract level are notreflected in the bar chart or table. If these amounts werereflected, returns would be less than those shown. Ofcourse, past performance is not necessarily an indicationof how the Fund will perform in the future.
Effective October 1, 2011, J.P. Morgan InvestmentManagement Inc. (“JPMIM”) assumed sub-advisory
FUND SUMMARY: EMERGING ECONOMIES FUND
- 27 -
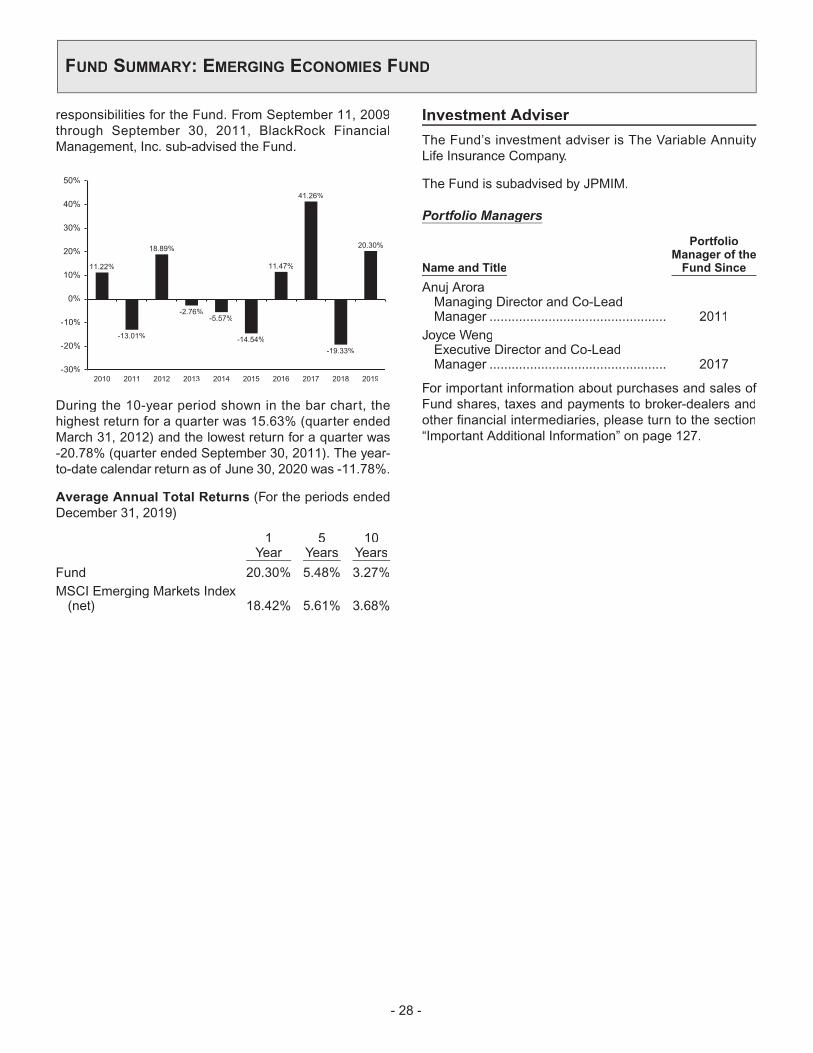
responsibilities for the Fund. From September 11, 2009through September 30, 2011, BlackRock FinancialManagement, Inc. sub-advised the Fund.
11.22%
-13.01%
18.89%
-2.76%-5.57%
-14.54%
11.47%
41.26%
-19.33%
20.30%
-30%
-20%
-10%
0%
10%
20%
30%
40%
50%
2010 2011 2012 2013 2014 2015 2016 2017 2018 2019
During the 10-year period shown in the bar chart, thehighest return for a quarter was 15.63% (quarter endedMarch 31, 2012) and the lowest return for a quarter was-20.78% (quarter ended September 30, 2011). The year-to-date calendar return as of June 30, 2020 was -11.78%.
Average Annual Total Returns (For the periods endedDecember 31, 2019)
1Year
5Years
10Years
Fund 20.30% 5.48% 3.27%MSCI Emerging Markets Index(net) 18.42% 5.61% 3.68%
Investment Adviser
The Fund’s investment adviser is The Variable AnnuityLife Insurance Company.
The Fund is subadvised by JPMIM.
Portfolio Managersg
Name and Title
PortfolioManager of theFund Since
Anuj AroraManaging Director and Co-LeadManager ................................................ 2011
Joyce WengExecutive Director and Co-LeadManager ................................................ 2017
For important information about purchases and sales ofFund shares, taxes and payments to broker-dealers andother financial intermediaries, please turn to the section“Important Additional Information” on page 127.
FUND SUMMARY: EMERGING ECONOMIES FUND
- 28 -

Investment Objective
The Fund seeks high total return through long-termgrowth of capital and current income.
Fees and Expenses of the Fund
This table describes the fees and expenses that you maypay if you buy and hold shares of the Fund. The Fund’sannual operating expenses do not reflect the separateaccount fees charged in the variable annuity or variablelife insurance policy (“Variable Contracts”) in which theFund is offered. If separate account fees were shown, theFund’s annual operating expenses would be higher.Please see your Variable Contract prospectus for moredetails on the separate account fees.
Annual Fund Operating Expenses (expenses that yougpay each year as a percentage of the value of yourinvestment)
Management Fees 0.73%Other Expenses 0.12%Total Annual Fund Operating Expenses 0.85%
Expense Example
This Example is intended to help you compare the cost ofinvesting in the Fund with the cost of investing in othermutual funds. The Example assumes that you invest$10,000 in the Fund for the time periods indicated andthen redeem all of your shares at the end of those periods.The Example also assumes that your investment has a 5%return each year and that the Fund’s operating expensesremain the same. The Example does not reflect chargesimposed by the Variable Contract. If the Variable Contractfees were reflected, the expenses would be higher. Seethe Variable Contract prospectus for information on suchcharges. Although your actual costs may be higher orlower, based on these assumptions and the net expensesshown in the fee table, your costs would be:
1 Year 3 Years 5 Years 10 Years
$87 $271 $471 $1,049
Portfolio Turnover
The Fund pays transaction costs, such as commissions,when it buys and sells securities (or “turns over” itsportfolio). These costs, which are not reflected in annualfund operating expenses or in the Example, affect theFund’s performance.
During the most recent fiscal year, the Fund’s portfolioturnover rate was 78% of the average value of its portfolio.
Principal Investment Strategies of the Fund
The Fund invests, under normal circumstances, at least80% of its net assets in a diversified portfolio of equityinvestments in real estate and real estate-relatedcompanies. A company is considered a “real estatecompany” or “real estate-related company” if at least 50%of its net assets, gross income or net profits areattributable to ownership, development, construction,financing, management or sale of commercial, industrialor residential real estate or interests therein. The principaltype of securities purchased by the Fund is commonstock. The Fund’s investments in real estate and realestate-related companies may include real estateinvestment trusts (“REITs”), REIT-like structures, or realestate operating companies whose businesses andservices are related to the real estate industry.
In complying with the 80% investment requirement, theFund may include synthetic securities that have economiccharacteristics similar to the Fund’s direct investmentsthat are counted toward the 80% investment requirement.
The Fund may invest up to 75% of its total assets inforeign securities, including securities of issuers inemerging markets. The Fund expects to invest asubstantial portion of its assets in the securities of issuerseconomically tied to Japan, the United Kingdom,Australia, Hong Kong, Singapore, China, Canada andContinental Europe. The Fund considers an investmenttied economically to a country if the investment is exposedto the economic risks and returns of such country. Fromtime to time, the Fund’s investments with respect to aparticular country may exceed 25% of its investmentportfolio.
In order to generate additional income, the Fund may lendportfolio securities to broker-dealers and other financialinstitutions provided that the value of the loaned securitiesdoes not exceed 30% of the Fund’s total assets. Theseloans earn income for the Fund and are collateralized bycash and securities issued or guaranteed by the U.S.Government or its agencies or instrumentalities. Investorswill be given at least 60 days’ written notice in advance ofany change to the Fund’s 80% investment policy set forthabove.
FUND SUMMARY: GLOBAL REAL ESTATE FUND
- 29 -

Principal Risks of Investing in the Fund
As with any mutual fund, there can be no assurance thatthe Fund’s investment objective will be met or that the netreturn on an investment in the Fund will exceed what couldhave been obtained through other investment or savingsvehicles. Shares of the Fund are not bank deposits andare not guaranteed or insured by any bank, governmententity or the Federal Deposit Insurance Corporation. If thevalue of the assets of the Fund goes down, you could losemoney.
The following is a summary of the principal risks ofinvesting in the Fund.
Management Risk. The investment style or strategy usedby the Subadviser may fail to produce the intended result.The Subadviser’s assessment of a particular security orcompany may prove incorrect, resulting in losses orunderperformance.
Real Estate Investments Risk. Securities of companiesin the real estate industry are sensitive to several factors,such as changes in real estate values, interest rates, cashflow, occupancy rates, and greater company liabilities.Substantial investments in a particular industry or sectormake the Fund’s performance more susceptible to anysingle economic, market, political or regulatoryoccurrence affecting that particular industry, group ofindustries, or sector than a fund that invests more broadly.
REITs Risk. The performance of a REIT depends oncurrent economic conditions and the types of realproperty in which it invests and how well the property ismanaged. If a REIT concentrates its investments in ageographic region or property type, changes in underlyingreal estate values may have an exaggerated effect on thevalue of the REIT.
Equity Securities Risk. The Fund invests primarily inequity securities and is therefore subject to the risk thatstock prices will fall and may underperform other assetclasses. Individual stock prices fluctuate from day-to-dayand may decline significantly. The prices of individualstocks may be negatively affected by poor companyresults or other factors affecting individual prices, as wellas industry and/or economic trends and developmentsaffecting industries or the securities market as a whole.
Currency Risk. Because the Fund’s foreign investmentsare generally held in foreign currencies, the Fund couldexperience gains or losses based solely on changes in theexchange rate between foreign currencies and the U.S.dollar. Such gains or losses may be substantial.
Emerging Markets Risk. In addition to the risksassociated with investments in foreign securities,
emerging market securities are subject to additional risks,which cause these securities generally to be more volatilethan securities of issuers located in developed countries.
Foreign Investment Risk. Investment in foreignsecurities involves risks due to several factors, such asilliquidity, the lack of public information, changes in theexchange rates between foreign currencies and the U.S.dollar, unfavorable political, social and legaldevelopments, or economic and financial instability.Foreign companies are not subject to the U.S. accountingand financial reporting standards and may have riskiersettlement procedures. U.S. investments that aredenominated in foreign currencies or that are traded inforeign markets, or securities of U.S. companies that havesignificant foreign operations may be subject to foreigninvestment risk.
Geographic Risk. If the Fund invests a significant portionof its assets in issuers located in a single country, a limitednumber of countries, or a particular geographic region, itassumes the risk that economic, political and socialconditions in those countries or that region may have asignificant impact on its investment performance.
Market Risk. The Fund’s share price can fall because ofweakness in the broad market, a particular industry, orspecific holdings or due to adverse political or economicdevelopments here or abroad, changes in investorpsychology, or heavy institutional selling and otherconditions or events (including, for example, militaryconfrontations, war, terrorism, disease/virus, outbreaksand epidemics). The prices of individual securities mayfluctuate, sometimes dramatically, from day to day. Theprices of stocks and other equity securities tend to bemore volatile than those of fixed-income securities.
The coronavirus pandemic and the related governmentaland public responses have had and may continue to havean impact on the Fund’s investments and net asset valueand have led and may continue to lead to increasedmarket volatility and the potential for illiquidity in certainclasses of securities and sectors of the market.Preventative or protective actions that governments maytake in respect of pandemic or epidemic diseases mayresult in periods of business disruption, businessclosures, inability to obtain raw materials, supplies andcomponent parts, and reduced or disrupted operations forthe issuers in which the Fund invests. Governmentintervention in markets may impact interest rates, marketvolatility and security pricing. The occurrence,reoccurrence and pendency of such diseases couldadversely affect the economies (including throughchanges in business activity and increased
FUND SUMMARY: GLOBAL REAL ESTATE FUND
- 30 -

unemployment) and financial markets either in specificcountries or worldwide.
Mid-Cap Company Risk. Investing in mid-cap companiescarries the risk that due to current market conditions thesecompanies may be out of favor with investors. Stocks ofmid-cap companies may be more volatile than those oflarger companies due to, among other reasons, narrowerproduct lines, more limited financial resources and fewerexperienced managers.
Small-Cap Company Risk. Investing in small-capcompanies carries the risk that due to current marketconditions these companies may be out of favor withinvestors. Small companies often are in the early stagesof development with limited product lines, markets, orfinancial resources and managements lacking depth andexperience, which may cause their stock prices to bemorevolatile than those of larger companies. Small companystocks may be less liquid yet subject to abrupt or erraticprice movements. It may take a substantial period of timebefore the Fund realizes a gain on an investment in asmall-cap company, if it realizes any gain at all.
Synthetic Securities Risk. Fluctuations in the values ofsynthetic securities may not correlate perfectly with theinstruments they are designed to replicate and may bevolatile. Synthetic securities may be subject to interestrate changes, market price fluctuations, counterparty riskand liquidity risk.
Securities Lending Risk. Engaging in securities lendingcould increase the market and credit risk for Fundinvestments. The Fund may lose money if it does notrecover borrowed securities, the value of the collateralfalls, or the value of investments made with cash collateraldeclines. If the value of either the cash collateral or theFund’s investments of the cash collateral falls below theamount owed to a borrower, the Fund also may incurlosses that exceed the amount it earned on lending thesecurity. Securities lending also involves the risks of delayin receiving additional collateral or possible loss of rightsin the collateral if the borrower fails. Another risk ofsecurities lending is the risk that the loaned portfoliosecurities may not be available to the Fund on a timelybasis and the Fund may therefore lose the opportunity tosell the securities at a desirable price.
Performance Information
The following Risk/Return Bar Chart and Table illustratethe risks of investing in the Fund by showing changes inthe Fund’s performance from calendar year to calendaryear and comparing the Fund’s average annual returns tothose of the Financial Times Stock Exchange European
Public Real Estate Association / National Association ofReal Estate Investment Trusts (“FTSE EPRANAREIT”) Developed Index. Fees and expenses incurredat the contract level are not reflected in the bar chart ortable. If these amounts were reflected, returns would beless than those shown. Of course, past performance is notnecessarily an indication of how the Fund will perform inthe future.
Invesco Advisers, Inc. (“Invesco”) is generally responsiblefor investing the portion of the Fund’s assets invested indomestic real estate securities. Goldman Sachs AssetManagement, L.P. (“GSAM”) is generally responsible forPPinvesting the portion of the Fund’s assets investedin foreign real estate securities. The percentage of theFund’s assets that each subadviser manages may, at theadviser’s discretion, change from time to time.
18.22%
-8.00%
31.01%
4.55%
12.06%
0.01%2.27%
13.84%
-6.02%
24.50%
-15%
-10%
-5%
0%
5%
10%
15%
20%
25%
30%
35%
2010 2011 2012 2013 2014 2015 2016 2017 2018 2019
During the 10-year period shown in the bar chart, thehighest return for a quarter was 17.64% (quarter endedSeptember 30, 2010) and the lowest return for a quarterwas -19.06% (quarter ended September 30, 2011). Theyear-to-date calendar return as of June 30, 2020 was-15.63%.
Average Annual Total Returns (For the periods endedDecember 31, 2019)
1Year
5Years
10Years
Fund 24.50% 6.38% 8.56%FTSE EPRA/ NAREITDeveloped Index (reflects nodeduction for fees, expensesor taxes) 23.06% 6.53% 9.25%
Investment Adviser
The Fund’s investment adviser is The Variable AnnuityLife Insurance Company.
FUND SUMMARY: GLOBAL REAL ESTATE FUND
- 31 -
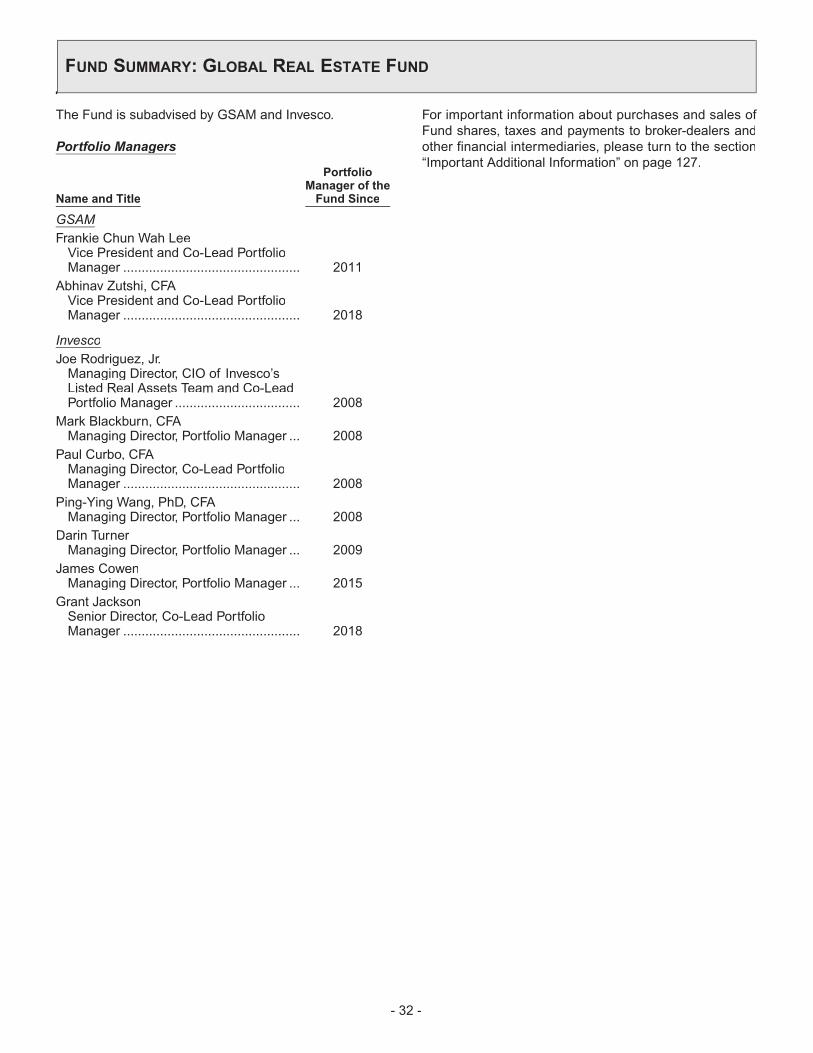
The Fund is subadvised by GSAM and Invesco.
Portfolio Managersg
Name and Title
PortfolioManager of theFund Since
GSAMFrankie Chun Wah LeeVice President and Co-Lead PortfolioManager ................................................ 2011
Abhinav Zutshi, CFAVice President and Co-Lead PortfolioManager ................................................ 2018
InvescoJoe Rodriguez, Jr.Managing Director, CIO of Invesco’sListed Real Assets Team and Co-LeadPortfolio Manager .................................. 2008
Mark Blackburn, CFAManaging Director, Portfolio Manager ... 2008
Paul Curbo, CFAManaging Director, Co-Lead PortfolioManager ................................................ 2008
Ping-Ying Wang, PhD, CFAManaging Director, Portfolio Manager ... 2008
Darin TurnerManaging Director, Portfolio Manager ... 2009
James CowenManaging Director, Portfolio Manager ... 2015
Grant JacksonSenior Director, Co-Lead PortfolioManager ................................................ 2018
For important information about purchases and sales ofFund shares, taxes and payments to broker-dealers andother financial intermediaries, please turn to the section“Important Additional Information” on page 127.
FUND SUMMARY: GLOBAL REAL ESTATE FUND
- 32 -

Investment Objective
The Fund seeks high total return.
Fees and Expenses of the Fund
This table describes the fees and expenses that you maypay if you buy and hold shares of the Fund. The Fund’sannual operating expenses do not reflect the separateaccount fees charged in the variable annuity or variablelife insurance policy (“Variable Contracts”) in which theFund is offered. If separate account fees were shown, theFund’s annual operating expenses would be higher.Please see your Variable Contract prospectus for moredetails on the separate account fees.
Annual Fund Operating Expenses (expenses that yougpay each year as a percentage of the value of yourinvestment)
Management Fees 0.50%Other Expenses 0.23%Total Annual Fund Operating Expenses 0.73%Fee Waivers and/or Expense Reimbursements1 -0.02%Total Annual Fund Operating ExpensesAfter Fee Waivers and/or ExpenseReimbursements1 0.71%
1 The Fund’s investment adviser, The Variable Annuity Life InsuranceCompany (“VALIC”), has contractually agreed to waive its advisoryfee through September 30, 2021, so that the advisory fee payable bythe Fund to VALIC equals 0.48% of average monthly assets on thefirst $500 million and 0.44% of average monthly assets over$500 million. This agreement may be modified or discontinued priorto such time only with the approval of the Board of Directors of VALICCompany I (“VC I”), including a majority of the directors who are not“interested persons” of VC I as defined in the Investment CompanyAct of 1940, as amended.
Expense Example
This Example is intended to help you compare the cost ofinvesting in the Fund with the cost of investing in othermutual funds. The Example assumes that you invest$10,000 in the Fund for the time periods indicated andthen redeem all of your shares at the end of those periods.The Example also assumes that your investment has a 5%return each year and that the Fund’s operating expensesinclude fee waivers for one year. The Example does notreflect charges imposed by the Variable Contract. If theVariable Contract fees were reflected, the expenses wouldbe higher. See the Variable Contract prospectus forinformation on such charges. Although your actual costsmay be higher or lower, based on these assumptions andthe net expenses shown in the fee table, your costs wouldbe:
1 Year 3 Years 5 Years 10 Years
$73 $231 $404 $905
Portfolio Turnover
The Fund pays transaction costs, such as commissions,when it buys and sells securities (or “turns over” itsportfolio). These costs, which are not reflected in annualfund operating expenses or in the Example, affect theFund’s performance.
During the most recent fiscal year, the Fund’s portfolioturnover rate was 108% of the average value of itsportfolio.
Principal Investment Strategies of the Fund
Under normal market conditions, the Fund invests inequity securities of companies in any country, fixedincome (debt) securities of companies and governmentsof any country, and in money market securities. There areno minimum or maximum percentage targets for eachasset class, though under normal market conditions, theFund invests 50% to 80% of its assets in equity securities.Although the Fund seeks investments across a number ofcountries and sectors, from time to time, based oneconomic conditions, the Fund may have significantpositions in particular countries or sectors.
The equity securities in which the Fund invests areprimarily common stock of large- and mid-capitalizationcompanies included in the Morgan Stanley CapitalInternational All Country World Index (the “MSCI ACWIIndex”) and depositary receipts representing such stocks.As of August 31, 2020, the market capitalization range ofthe companies in the MSCI ACWI Index wasapproximately $117.21million to $539 billion.With respectto equity securities, the Fund seeks to achieve a lowerlevel of risk and higher risk-adjusted performance than theMSCI ACWI Index over the long term through a rules-based multi-factor selection process employed by theFund’s subadviser.
The subadviser’s selection process is designed to selectstocks for the Fund that have favorable exposure to fourinvestment style factors (commonly referred to as “smartbeta”) – quality, value, momentum and low volatility.Factors are common characteristics that relate to a groupof issuers or securities that are important in explaining thereturns and risks of those issuers’ securities. The “quality”factor incorporates measurements such as return onequity, earnings variability, cash return on assets andleverage. The “value” factor incorporates measurementssuch as price to earnings, price to forward earnings, priceto book value and dividend yield. The “momentum” factorincorporates measurements such as 6-month riskadjusted price momentum and 12-month risk-adjustedprice momentum. The “low volatility” factor incorporates
FUND SUMMARY: GLOBAL STRATEGY FUND
- 33 -
measurements such as historical beta (i.e., a measure ofthe volatility of a security relative to the total market).
Under normal market conditions, the Fund will hold 600 to900 of the common stocks in the MSCI ACWI Index. Thesubadviser will select such stocks on a semi-annual basis.The Fund employs a strategy to continue to hold stocksbetween its semi-annual selection of stocks, even if thereare adverse developments concerning a particular stock,an industry, the economy or the stock market generally.The subadviser may reduce the position size of a stock orsell the stock at the time of the semi-annual selectionprocess if the stock no longer has favorable exposure tothe four investment style factors. The size of thecompanies in the MSCI ACWI Index changes with marketconditions and the composition of the MSCI ACWI Index.
The debt obligations in which the Fund invests areprimarily foreign and domestic sovereign debt obligationsof any maturity and duration and may include bonds,notes, bills and debentures. Although the Fund may buybonds rated in any category, including bonds that arerated below investment grade, it generally focuses on“investment grade” bonds.With respect to debt obligationsand money market securities, the mix of investments willbe adjusted in an effort to capitalize on the total returnpotential produced by changing market, political andeconomic conditions throughout the world. For example,the subadviser may adjust the Fund’s investments as aresult of its independent analysis of countries, interestrates and exchange rates, among other factors. Thesubadviser may purchase a debt security when it believesthe security is undervalued or will provide highlycompetitive rate yields. Conversely, the subadviser mayconsider selling a debt security when it believes thesecurity has become fully valued due to either its priceappreciation or changes in the issuer’s fundamentals, orwhen the subadviser believes another security is a moreattractive investment opportunity. The Fund may allocatea significant portion of its assets to cash and cashequivalents to take advantage of investment opportunitiesas they arise, to manage volatility and for other portfoliomanagement purposes.
Under normal market conditions, the Fund expects toinvest at least 40% of its net assets in foreign securities,including foreign equity securities and foreign sovereigndebt securities. Although the Fund generally invests insecurities of issuers located in developed countries, theFund may invest up to 50% of its total assets in securitiesof issuers located in emerging markets.
The Fund regularly uses various currency relatedtransactions involving derivative instruments, includingcurrency and cross currency forwards and currency andcurrency index futures contracts and currency options.
The Fund may maintain significant positions in currencyrelated derivative instruments as a hedging technique orto implement a currency investment strategy, which couldexpose a large amount of the Fund’s assets to obligationsunder these instruments. The Fund may also enter intovarious other transactions involving derivatives, includingfinancial futures contracts (such as interest rate or bondfutures) and swap agreements (which may includeinterest rate and credit default swaps). The use of thesederivative transactions may allow the Fund to obtain netlong or net negative (short) exposure to selectedcurrencies. The Fund may use a portion of its cash andcash equivalents as collateral for derivatives.
In order to generate additional income, the Fund may lendportfolio securities to broker-dealers and other financialinstitutions provided that the value of the loaned securitiesdoes not exceed 30% of the Fund’s total assets. Theseloans earn income for the Fund and are collateralized bycash and securities issued or guaranteed by the U.S.Government or its agencies or instrumentalities.
Principal Risks of Investing in the Fund
As with any mutual fund, there can be no assurance thatthe Fund’s investment objective will be met or that the netreturn on an investment in the Fund will exceed what couldhave been obtained through other investment or savingsvehicles. Shares of the Fund are not bank deposits andare not guaranteed or insured by any bank, governmententity or the Federal Deposit Insurance Corporation. If thevalue of the assets of the Fund goes down, you could losemoney.
The following is a summary of the principal risks ofinvesting in the Fund.
Management Risk. The investment style or strategy usedby the Subadviser may fail to produce the intended result.The Subadviser’s assessment of a particular security orcompany may prove incorrect, resulting in losses orunderperformance.
Dividend-paying Stocks Risk. There is no guaranteethat the issuers of the stocks held by the Fund will declaredividends in the future or that, if dividends are declared,they will remain at their current levels or increase overtime. Dividend-paying stocks may not participate in abroad market advance to the same degree as otherstocks, and a sharp rise in interest rates or economicdownturn could cause a company to unexpectedly reduceor eliminate its dividend.
Emerging Markets Risk. In addition to the risksassociated with investments in foreign securities,emerging market securities are subject to additional risks,
FUND SUMMARY: GLOBAL STRATEGY FUND
- 34 -

which cause these securities generally to be more volatilethan securities of issuers located in developed countries.
Foreign Investment Risk. Investment in foreignsecurities involves risks due to several factors, such asilliquidity, the lack of public information, changes in theexchange rates between foreign currencies and the U.S.dollar, unfavorable political, social and legaldevelopments, or economic and financial instability.Foreign companies are not subject to the U.S. accountingand financial reporting standards and may have riskiersettlement procedures. U.S. investments that aredenominated in foreign currencies or that are traded inforeign markets, or securities of U.S. companies that havesignificant foreign operations may be subject to foreigninvestment risk.
Geographic Risk. If the Fund invests a significant portionof its assets in issuers located in a single country, a limitednumber of countries, or a particular geographic region, itassumes the risk that economic, political and socialconditions in those countries or that region may have asignificant impact on its investment performance.
Equity Securities Risk. The Fund’s investments in equitysecurities are subject to the risk that stock prices will falland may underperform other asset classes. Individualstock prices fluctuate from day-to-day and may declinesignificantly. The prices of individual stocks may benegatively affected by poor company results or otherfactors affecting individual prices, as well as industry and/or economic trends and developments affecting industriesor the securities market as a whole.
Depositary Receipts Risk. Depositary receipts aregenerally subject to the same risks as the foreignsecurities that they evidence or into which they may beconverted. Depositary receipts may or may not be jointlysponsored by the underlying issuer. The issuers ofunsponsored depositary receipts are not obligated todisclose information that is considered material in theUnited States. Therefore, there may be less informationavailable regarding the issuers and there may not be acorrelation between such information and the marketvalue of the depositary receipts. Certain depositaryreceipts are not listed on an exchange and therefore maybe considered to be illiquid securities.
Factor-Based Investing Risk. There can be noassurance that the multi-factor selection processemployed by the subadviser will enhance performance.Exposure to investment style factors may detract fromperformance in some market environments, which maycontinue for prolonged periods.
Disciplined Strategy Risk. The Fund will not deviatefrom its equity strategy (except to the extent necessary tocomply with federal tax laws or other applicable laws). Ifthe Fund is committed to a strategy that is unsuccessful,the Fund will not meet its investment goal. Because theFund generally will not use certain techniques available toother mutual funds to reduce stock market exposure, theFund may be more susceptible to general market declinesthan other mutual funds.
Credit Risk. The issuer of a fixed income security ownedby the Fund may be unable to make interest or principalpayments.
Interest Rate Fluctuations Risk. Fixed income securitiesmay be subject to volatility due to changes in interestrates. Duration is a measure of interest rate risk thatindicates how price-sensitive a bond is to changes ininterest rates. Longer-term and lower coupon bonds tendto be more sensitive to changes in interest rates. Interestrates have been historically low, so the Fund faces aheightened risk that interest rates may rise. For example,a bond with a duration of three years will decrease in valueby approximately 3% if interest rates increase by 1%.Potential future changes in monetary policy made bycentral banks and/or their governments are likely to affectthe level of interest rates.
Currency Risk. Because the Fund’s foreign investmentsare generally held in foreign currencies, the Fund couldexperience gains or losses based solely on changes in theexchange rate between foreign currencies and the U.S.dollar. Such gains or losses may be substantial.
Derivatives Risk. The prices of derivatives may move inunexpected ways due to the use of leverage and otherfactors and may result in increased volatility or losses. TheFund may not be able to terminate or sell derivativepositions, and a liquid secondary market may not alwaysexist for derivative positions. When currency forwards areused by the Fund for hedging purposes, there is a risk thatdue to imperfect correlations, the currency forwards willnot fully hedge against adverse changes in foreigncurrency values or, under extreme market conditions, willnot provide any hedging benefit. The successful use ofcurrency forwards for non-hedging purposes usuallydepends on the portfolio managers’ ability to forecastmovements in foreign currency values and may bespeculative. Should these values move in unexpectedways, the Fund may not achieve the anticipated benefitfrom using currency forwards, and it may realize losses,which could be significant.
FUND SUMMARY: GLOBAL STRATEGY FUND
- 35 -

Foreign Sovereign Debt Risk. Foreign sovereign debtsecurities are subject to the risk that a governmental entitymay delay or refuse to pay interest or to repay principal onits sovereign debt, due, for example, to cash flowproblems, insufficient foreign currency reserves, political,social and economic considerations, the relative size ofthe governmental entity’s debt position in relation to theeconomy or the failure to put in place economic reformsrequired by the International Monetary Fund or othermultilateral agencies. If a governmental entity defaults, itmay ask for more time in which to pay or for further loans.
Futures Risk. A futures contract is considered aderivative because it derives its value from the price of theunderlying currency, security or financial index. The pricesof futures contracts can be volatile and futures contractsmay lack liquidity. In addition, there may be imperfect oreven negative correlation between the price of a futurescontract and the price of the underlying currency, securityor financial index.
Credit Default Swap Risk. A credit default swap is anagreement between two parties: a buyer of creditprotection and a seller of credit protection. The buyer in acredit default swap agreement is obligated to pay theseller a periodic stream of payments over the term of theswap agreement. If no default or other designated creditevent occurs, the seller of credit protection will havereceived a fixed rate of income throughout the term of theswap agreement. If a default or designated credit eventdoes occur, the seller of credit protection must pay thebuyer of credit protection the full value of the referenceobligation. Credit default swaps increase counterparty riskwhen the Fund is the buyer. The absence of a centralexchange or market for swap transactions has led, insome instances, to difficulties in trading and valuation,especially in the event of market disruptions. Recentlegislation requires most swaps to be executed through acentralized exchange or regulated facility and be clearedthrough a regulated clearinghouse. The swap marketcould be disrupted or limited as a result of this legislation,which could adversely affect the Fund. Moreover, theestablishment of a centralized exchange or market forswap transactions may not result in swaps being easier totrade or value.
Junk Bond Risk. High yielding, high risk fixed-incomesecurities (often referred to as “junk bonds”) may involvesignificantly greater credit risk, market risk and interestrate risk compared to higher rated fixed-income securities.Issuers of junk bonds are less secure financially and theirsecurities are more sensitive to downturns in the economy.The market for junk bonds may not be as liquid as that formore highly rated securities.
Income Risk. Because the Fund can only distribute whatit earns, the Fund’s distributions to shareholders maydecline when prevailing interest rates fall or when theFund experiences defaults on debt securities it holds.
Counterparty Risk. Counterparty risk is the risk that acounterparty to a security, loan or derivative held by theFund becomes bankrupt or otherwise fails to perform itsobligations due to financial difficulties. The Fund mayexperience significant delays in obtaining any recovery ina bankruptcy or other reorganization proceeding, andthere may be no recovery or limited recovery in suchcircumstances.
Liquidity Risk. If the active trading market for certainsecurities becomes limited or non-existent, it can becomemore difficult to sell the securities at or near theirperceived value. This may cause the value of suchsecurities and the Fund’s share price to fall dramatically.
Market Risk. The Fund’s share price can fall because ofweakness in the broad market, a particular industry, orspecific holdings or due to adverse political or economicdevelopments here or abroad, changes in investorpsychology, or heavy institutional selling and otherconditions or events (including, for example, militaryconfrontations, war, terrorism, disease/virus, outbreaksand epidemics). The prices of individual securities mayfluctuate, sometimes dramatically, from day to day. Theprices of stocks and other equity securities tend to bemore volatile than those of fixed-income securities.
The coronavirus pandemic and the related governmentaland public responses have had and may continue to havean impact on the Fund’s investments and net asset valueand have led and may continue to lead to increasedmarket volatility and the potential for illiquidity in certainclasses of securities and sectors of the market.Preventative or protective actions that governments maytake in respect of pandemic or epidemic diseases mayresult in periods of business disruption, businessclosures, inability to obtain raw materials, supplies andcomponent parts, and reduced or disrupted operations forthe issuers in which the Fund invests. Governmentintervention in markets may impact interest rates, marketvolatility and security pricing. The occurrence,reoccurrence and pendency of such diseases couldadversely affect the economies (including throughchanges in business activity and increasedunemployment) and financial markets either in specificcountries or worldwide.
Large-Cap Companies Risk. Large-cap companies tendto go in and out of favor based on market and economic
FUND SUMMARY: GLOBAL STRATEGY FUND
- 36 -
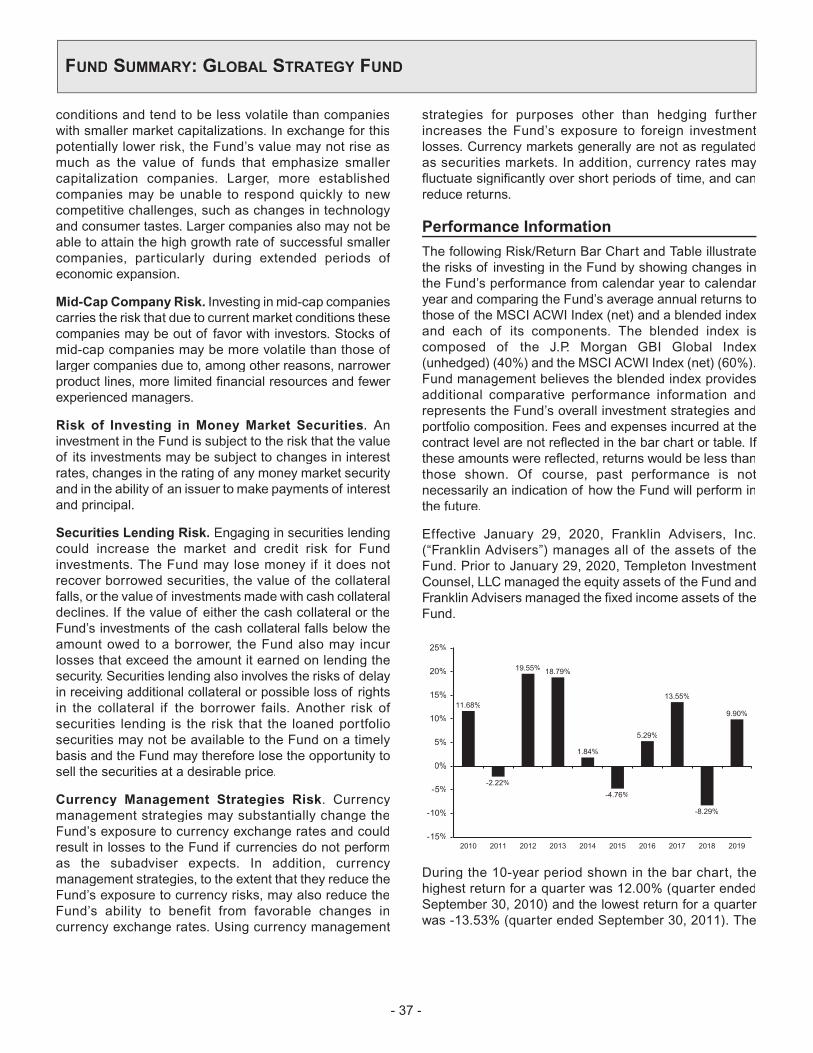
conditions and tend to be less volatile than companieswith smaller market capitalizations. In exchange for thispotentially lower risk, the Fund’s value may not rise asmuch as the value of funds that emphasize smallercapitalization companies. Larger, more establishedcompanies may be unable to respond quickly to newcompetitive challenges, such as changes in technologyand consumer tastes. Larger companies also may not beable to attain the high growth rate of successful smallercompanies, particularly during extended periods ofeconomic expansion.
Mid-Cap Company Risk. Investing in mid-cap companiescarries the risk that due to current market conditions thesecompanies may be out of favor with investors. Stocks ofmid-cap companies may be more volatile than those oflarger companies due to, among other reasons, narrowerproduct lines, more limited financial resources and fewerexperienced managers.
Risk of Investing in Money Market Securities. Aninvestment in the Fund is subject to the risk that the valueof its investments may be subject to changes in interestrates, changes in the rating of any money market securityand in the ability of an issuer to make payments of interestand principal.
Securities Lending Risk. Engaging in securities lendingcould increase the market and credit risk for Fundinvestments. The Fund may lose money if it does notrecover borrowed securities, the value of the collateralfalls, or the value of investments made with cash collateraldeclines. If the value of either the cash collateral or theFund’s investments of the cash collateral falls below theamount owed to a borrower, the Fund also may incurlosses that exceed the amount it earned on lending thesecurity. Securities lending also involves the risks of delayin receiving additional collateral or possible loss of rightsin the collateral if the borrower fails. Another risk ofsecurities lending is the risk that the loaned portfoliosecurities may not be available to the Fund on a timelybasis and the Fund may therefore lose the opportunity tosell the securities at a desirable price.
Currency Management Strategies Risk. Currencymanagement strategies may substantially change theFund’s exposure to currency exchange rates and couldresult in losses to the Fund if currencies do not performas the subadviser expects. In addition, currencymanagement strategies, to the extent that they reduce theFund’s exposure to currency risks, may also reduce theFund’s ability to benefit from favorable changes incurrency exchange rates. Using currency management
strategies for purposes other than hedging furtherincreases the Fund’s exposure to foreign investmentlosses. Currency markets generally are not as regulatedas securities markets. In addition, currency rates mayfluctuate significantly over short periods of time, and canreduce returns.
Performance Information
The following Risk/Return Bar Chart and Table illustratethe risks of investing in the Fund by showing changes inthe Fund’s performance from calendar year to calendaryear and comparing the Fund’s average annual returns tothose of the MSCI ACWI Index (net) and a blended indexand each of its components. The blended index iscomposed of the J.P. Morgan GBI Global Index(unhedged) (40%) and the MSCI ACWI Index (net) (60%).Fund management believes the blended index providesadditional comparative performance information andrepresents the Fund’s overall investment strategies andportfolio composition. Fees and expenses incurred at thecontract level are not reflected in the bar chart or table. Ifthese amounts were reflected, returns would be less thanthose shown. Of course, past performance is notnecessarily an indication of how the Fund will perform inthe future.
Effective January 29, 2020, Franklin Advisers, Inc.(“Franklin Advisers”) manages all of the assets of theFund. Prior to January 29, 2020, Templeton InvestmentCounsel, LLC managed the equity assets of the Fund andFranklin Advisers managed the fixed income assets of theFund.
11.68%
-2.22%
19.55% 18.79%
1.84%
-4.76%
5.29%
13.55%
-8.29%
9.90%
-15%
-10%
-5%
0%
5%
10%
15%
20%
25%
2010 2011 2012 2013 2014 2015 2016 2017 2018 2019
During the 10-year period shown in the bar chart, thehighest return for a quarter was 12.00% (quarter endedSeptember 30, 2010) and the lowest return for a quarterwas -13.53% (quarter ended September 30, 2011). The
FUND SUMMARY: GLOBAL STRATEGY FUND
- 37 -

year-to-date calendar return as of June 30, 2020 was-7.08%.
Average Annual Total Returns (For the periods endedDecember 31, 2019)
1Year
5Years
10Years
Fund 9.90% 2.79% 6.13%Blended Index (reflects nodeduction for fees, expensesor taxes) 18.23% 6.08% 6.32%
JPM GBI Global Index(unhedged) (reflects nodeduction for fees, expensesor taxes) 6.02% 2.16% 2.15%
MSCI ACWI Index (net) 26.60% 8.41% 8.79%
Investment Adviser
The Fund’s investment adviser is The Variable AnnuityLife Insurance Company.
The Fund is subadvised by Franklin Advisers.
Portfolio Managersg
Name and Title
PortfolioManager of theFund Since
Franklin AdvisersMichael Hasenstab, Ph.D.Executive Vice President, PortfolioManagerand Chief Investment Officer................. 2005
Christine Yuhui ZhuPortfolio Manager, Vice President,Director of Portfolio Construction andQuantitative Analysis ............................. 2014
Chandra Seethamraju, Ph.D.Portfolio Manager and Senior VicePresident ............................................... 2020
Sundaram Chettiappan, CFAPortfolio Manager and Vice President .. 2020
For important information about purchases and sales ofFund shares, taxes and payments to broker-dealers andother financial intermediaries, please turn to the section“Important Additional Information” on page 127.
FUND SUMMARY: GLOBAL STRATEGY FUND
- 38 -

Investment Objective
The Fund seeks liquidity, protection of capital and currentincome through investments in short-term money marketinstruments.
Fees and Expenses of the Fund
This table describes the fees and expenses that you maypay if you buy and hold shares of the Fund. The Fund’sannual operating expenses do not reflect the separateaccount fees charged in the variable annuity or variablelife insurance policy (“Variable Contracts”) in which theFund is offered. If separate account fees were shown, theFund’s annual operating expenses would be higher.Please see your Variable Contract prospectus for moredetails on the separate account fees.
Annual Fund Operating Expenses (expenses that yougpay each year as a percentage of the value of yourinvestment)
Management Fees 0.40%Other Expenses 0.11%Total Annual Fund Operating Expenses 0.51%
Expense Example
This Example is intended to help you compare the cost ofinvesting in the Fund with the cost of investing in othermutual funds. The Example assumes that you invest$10,000 in the Fund for the time periods indicated andthen redeem all of your shares at the end of those periods.The Example also assumes that your investment has a 5%return each year and that the Fund’s operating expensesremain the same. The Example does not reflect chargesimposed by the Variable Contract. If the Variable Contractfees were reflected, the expenses would be higher. Seethe Variable Contract prospectus for information on suchcharges. Although your actual costs may be higher orlower, based on these assumptions and the net expensesshown in the fee table, your costs would be:
1 Year 3 Years 5 Years 10 Years
$52 $164 $285 $640
Principal Investment Strategies of the Fund
The Fund invests at least 99.5% of its total assets in cash,U.S. Government securities, and/or repurchaseagreements that are collateralized by cash and/or U.S.Government securities. In addition, under normalcircumstances, the Fund invests at least 80% of its netassets in U.S. Government securities and/or repurchaseagreements that are collateralized by U.S. Governmentsecurities. A “government money market fund” underRule 2a-7, such as the Fund, may, but is not required to,impose liquidity fees and redemption gates. The Fund’s
Board of Directors has determined that the Fund will notbe subject to the liquidity fee and redemption gateprovisions of Rule 2a-7, although the Board may elect toimpose liquidity fees or redemption gates in the future.
The Fund is a money market fund and seeks to maintaina stable share price of $1.00. In order to do this, the Fundmust follow rules of the Securities and ExchangeCommission (“SEC”) as to the liquidity, diversification andmaturity of its investments.
Investors will be given at least 60 days’ written notice inadvance of any change to the Fund’s 80% investmentpolicy set forth above.
Principal Risks of Investing in the Fund
You could lose money by investing in the Fund. Althoughthe Fund seeks to preserve the value of your investmentat $1.00 per share, it cannot guarantee it will do so. Aninvestment in the Fund is not insured or guaranteed by theFederal Deposit Insurance Corporation or any othergovernment agency. The Fund’s sponsor has no legalobligation to provide financial support to the Fund, andyou should not expect that the sponsor will providefinancial support to the Fund at any time.
The following is a summary of the principal risks ofinvesting in the Fund.
Credit Risk. The Fund may suffer losses if the issuer ofa fixed income security owned by the Fund is unable tomake interest or principal payments. Credit risk isexpected to be low for the Fund because of its investmentin U.S. Government securities.
Interest Rate Risk.While the Fund will invest primarily inshort-term securities, you should be aware that the valueof the Fund’s investments may be subject to changes ininterest rates. A decline in interest rates will generallyaffect the Fund’s yield as these securities mature or aresold and the Fund purchases new short-term securitieswith lower yields. Generally, an increase in interest ratescauses the value of a debt instrument to decrease. Thechange in value for shorter-term securities is usuallysmaller than for securities with longer maturities. Becausethe Fund invests in securities with short maturities andseeks to maintain a stable net asset value of $1.00 pershare, it is possible, though unlikely, that an increase ordecrease in interest rates would change the value of yourinvestment in the Fund. In addition, when interest rates arevery low, the Fund’s expenses could absorb all or asignificant portion of the Fund’s income, and, if the Fund’sexpenses exceed the Fund’s income, the Fund may beunable to maintain its $1.00 share price. The Fund may besubject to a greater risk of rising interest rates due to thecurrent period of historically low rates and the effect of
FUND SUMMARY: GOVERNMENT MONEY MARKET I FUND
- 39 -

potential government fiscal policy initiatives and resultingmarket reaction to these initiatives.
Repurchase Agreements Risk. Repurchaseagreements are agreements in which the seller of asecurity to the Fund agrees to repurchase that securityfrom the Fund at a mutually agreed upon price and date.Repurchase agreements carry the risk that thecounterparty may not fulfill its obligations under theagreement. This could cause the Fund’s income and thevalue of the Fund to decline.
U.S. Government Obligations Risk. U.S. Treasuryobligations are backed by the “full faith and credit” of theU.S. Government and are generally considered to havelow credit risk. Unlike U.S. Treasury obligations, securitiesissued or guaranteed by federal agencies or authoritiesand U.S. Government-sponsored instrumentalities orenterprises may or may not be backed by the full faith andcredit of the U.S. Government and are therefore subject togreater credit risk than securities issued or guaranteed bythe U.S. Treasury.
Performance Information
The following Risk/Return Bar Chart and Table illustratethe risks of investing in the Fund by showing changes inthe Fund’s performance from calendar year to calendaryear and comparing the Fund’s average annual returns tothose of the FTSE Treasury Bill 3 Month Index. Prior toSeptember 28, 2016, the Fund operated as a primemoney market fund and invested in certain types ofsecurities that the Fund is no longer permitted to hold aspart of its principal investment strategy. Consequently, theperformance information below may have been different ifthe current investment limitations had been in effectduring the period prior to the Fund’s conversion to agovernment money market fund. Fees and expensesincurred at the contract level are not reflected in the barchart or table. If these amounts were reflected, returnswould be less than those shown. Of course, pastperformance is not necessarily an indication of how theFund will perform in the future.
0.01% 0.01% 0.01% 0.01% 0.01% 0.01%
0.38%
1.32%
1.67%
0%
0.5%
1.0%
1.5%
2.0%
2010 2011 2012 2013 2014 2015 2016 2017 2018 2019
During the 10-year period shown in the bar chart, thehighest return for a quarter was 0.47% (quarter endedJune 30, 2019) and the lowest return for a quarter was0.00% (quarter ended March 31, 2015). The year-to-datecalendar return as of June 30, 2020 was 0.21%.
Average Annual Total Returns (For the periods endedDecember 31, 2019)
1Year
5Years
10Years
Fund 1.67% 0.68% 0.34%FTSE Treasury Bill 3 MonthIndex (reflects no deductionfor fees, expenses or taxes) 2.25% 1.05% 0.56%
Investment Adviser
The Fund’s investment adviser is The Variable AnnuityLife Insurance Company.
The Fund is subadvised by SunAmerica.
For important information about purchases and sales ofFund shares, taxes and payments to broker-dealers andother financial intermediaries, please turn to the section“Important Additional Information” on page 127.
FUND SUMMARY: GOVERNMENT MONEY MARKET I FUND
- 40 -

Investment Objective
The Fund seeks high current income and protection ofcapital through investments in intermediate and long-termU.S. Government debt securities.
Fees and Expenses of the Fund
This table describes the fees and expenses that you maypay if you buy and hold shares of the Fund. The Fund’sannual operating expenses do not reflect the separateaccount fees charged in the variable annuity or variablelife insurance policy (“Variable Contracts”) in which theFund is offered. If separate account fees were shown, theFund’s annual operating expenses would be higher.Please see your Variable Contract prospectus for moredetails on the separate account fees.
Annual Fund Operating Expenses (expenses that yougpay each year as a percentage of the value of yourinvestment)
Management Fees 0.50%Other Expenses 0.16%Total Annual Fund Operating Expenses 0.66%
Expense Example
This Example is intended to help you compare the cost ofinvesting in the Fund with the cost of investing in othermutual funds. The Example assumes that you invest$10,000 in the Fund for the time periods indicated andthen redeem all of your shares at the end of those periods.The Example also assumes that your investment has a 5%return each year and that the Fund’s operating expensesremain the same. The Example does not reflect chargesimposed by the Variable Contract. If the Variable Contractfees were reflected, the expenses would be higher. Seethe Variable Contract prospectus for information on suchcharges. Although your actual costs may be higher orlower, based on these assumptions and the net expensesshown in the fee table, your costs would be:
1 Year 3 Years 5 Years 10 Years
$67 $211 $368 $822
Portfolio Turnover
The Fund pays transaction costs, such as commissions,when it buys and sells securities (or “turns over” itsportfolio). These costs, which are not reflected in annualfund operating expenses or in the Example, affect theFund’s performance.
During the most recent fiscal year, the Fund’s portfolioturnover rate was 17% of the average value of its portfolio.
Principal Investment Strategies of the Fund
The Fund invests at least 80% of net assets inintermediate- and long-term U.S. Government andgovernment-sponsored debt securities.
The Fund may also invest in mortgage-backed securities,asset-backed securities, repurchase agreements, highquality corporate debt securities and high quality domesticmoney market securities. In addition, the Fund may investup to 20% of its net assets in high quality foreigninvestments payable in U.S. dollars.
In order to generate additional income, the Fund may lendportfolio securities to broker-dealers and other financialinstitutions provided that the value of the loaned securitiesdoes not exceed 30% of the Fund’s total assets. Theseloans earn income for the Fund and are collateralized bycash and securities issued or guaranteed by the U.S.Government or its agencies or instrumentalities. Investorswill be given at least 60 days’ written notice in advance ofany change to the Fund’s 80% investment policy set forthabove.
Principal Risks of Investing in the Fund
As with any mutual fund, there can be no assurance thatthe Fund’s investment objective will be met or that the netreturn on an investment in the Fund will exceed what couldhave been obtained through other investment or savingsvehicles. Shares of the Fund are not bank deposits andare not guaranteed or insured by any bank, governmententity or the Federal Deposit Insurance Corporation. If thevalue of the assets of the Fund goes down, you could losemoney.
The following is a summary of the principal risks ofinvesting in the Fund.
U.S. Government Obligations Risk. U.S. Treasuryobligations are backed by the “full faith and credit” of theU.S. Government and are generally considered to havelow credit risk. Unlike U.S. Treasury obligations, securitiesissued or guaranteed by federal agencies or authoritiesand U.S. Government-sponsored instrumentalities orenterprises may or may not be backed by the full faith andcredit of the U.S. Government and are therefore subject togreater credit risk than securities issued or guaranteed bythe U.S. Treasury.
FUND SUMMARY: GOVERNMENT SECURITIES FUND
- 41 -
Credit Risk. The Fund may suffer losses if the issuer ofa fixed income security owned by the Fund is unable tomake interest or principal payments.
Interest Rate Risk. The value of fixed-income securitiesmay decline when interest rates go up or increase wheninterest rates go down. The interest earned on fixed-income securities may decline when interest rates godown or increase when interest rates go up. Longer-termand lower coupon bonds tend to be more sensitive tochanges in interest rates. The Fund may be subject to agreater risk of rising interest rates due to the currentperiod of historically low rates and the effect of potentialgovernment fiscal policy initiatives and resulting marketreaction to these initiatives.
Call or Prepayment Risk. During periods of fallinginterest rates, a bond issuer may “call” a bond to repay itbefore its maturity date. The Fund may only be able toinvest the bond’s proceeds at lower interest rates,resulting in a decline in the Fund’s income.
Currency Risk. Because the Fund’s foreign investmentsare generally held in foreign currencies, the Fund couldexperience gains or losses based solely on changes in theexchange rate between foreign currencies and the U.S.dollar. Such gains or losses may be substantial.
Foreign Investment Risk. Investment in foreignsecurities involves risks due to several factors, such asilliquidity, the lack of public information, changes in theexchange rates between foreign currencies and the U.S.dollar, unfavorable political, social and legaldevelopments, or economic and financial instability.Foreign companies are not subject to the U.S. accountingand financial reporting standards and may have riskiersettlement procedures. U.S. investments that aredenominated in foreign currencies or that are traded inforeign markets, or securities of U.S. companies that havesignificant foreign operations may be subject to foreigninvestment risk.
Market Risk. The Fund’s share price can fall because ofweakness in the broad market, a particular industry, orspecific holdings or due to adverse political or economicdevelopments here or abroad, changes in investorpsychology, or heavy institutional selling and otherconditions or events (including, for example, militaryconfrontations, war, terrorism, disease/virus, outbreaksand epidemics). The prices of individual securities mayfluctuate, sometimes dramatically, from day to day. Theprices of stocks and other equity securities tend to bemore volatile than those of fixed-income securities.
The coronavirus pandemic and the related governmentaland public responses have had and may continue to have
an impact on the Fund’s investments and net asset valueand have led and may continue to lead to increasedmarket volatility and the potential for illiquidity in certainclasses of securities and sectors of the market.Preventative or protective actions that governments maytake in respect of pandemic or epidemic diseases mayresult in periods of business disruption, businessclosures, inability to obtain raw materials, supplies andcomponent parts, and reduced or disrupted operations forthe issuers in which the Fund invests. Governmentintervention in markets may impact interest rates, marketvolatility and security pricing. The occurrence,reoccurrence and pendency of such diseases couldadversely affect the economies (including throughchanges in business activity and increasedunemployment) and financial markets either in specificcountries or worldwide.
Mortgage-Backed Securities Risk. Mortgage-backedsecurities are similar to other debt securities in that theyare subject to credit risk and interest rate risk. Mortgage-backed securities may be issued or guaranteed by theU.S. Government, its agencies or instrumentalities or maybe non-guaranteed securities issued by private issuers.These securities are also subject to the risk that issuerswill prepay the principal more quickly or more slowly thanexpected, which could cause the Fund to invest theproceeds in less attractive investments or increase thevolatility of their prices.
Asset -Backed Securities Risk. Asset-backed securitiesare bonds or notes that are normally supported by aspecific property. If the issuer fails to pay the interest orreturn the principal when the bond matures, then theissuer must give the property to the bondholders ornoteholders. Examples of assets supporting asset-backed securities include credit card receivables, retailinstallment loans, home equity loans, auto loans, andmanufactured housing loans.
Securities Lending Risk. Engaging in securities lendingcould increase the market and credit risk for Fundinvestments. The Fund may lose money if it does notrecover borrowed securities, the value of the collateralfalls, or the value of investments made with cash collateraldeclines. If the value of either the cash collateral or theFund’s investments of the cash collateral falls below theamount owed to a borrower, the Fund also may incurlosses that exceed the amount it earned on lending thesecurity. Securities lending also involves the risks of delayin receiving additional collateral or possible loss of rightsin the collateral if the borrower fails. Another risk ofsecurities lending is the risk that the loaned portfoliosecurities may not be available to the Fund on a timely
FUND SUMMARY: GOVERNMENT SECURITIES FUND
- 42 -
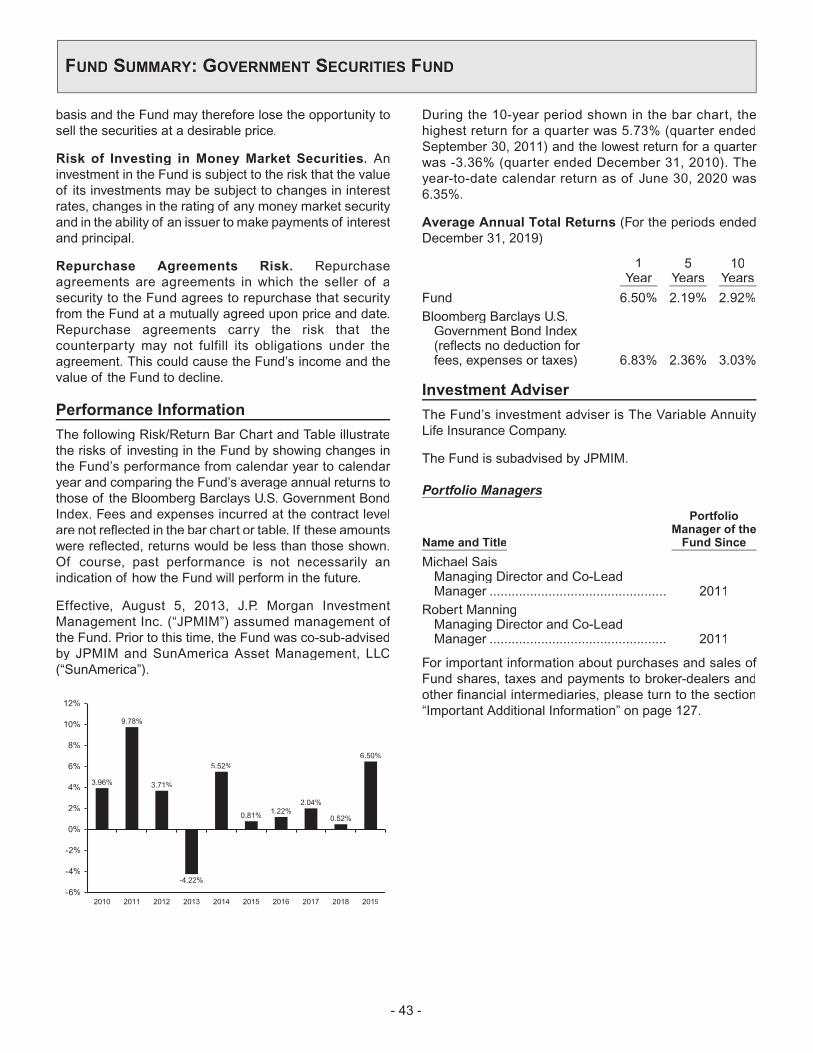
basis and the Fund may therefore lose the opportunity tosell the securities at a desirable price.
Risk of Investing in Money Market Securities. Aninvestment in the Fund is subject to the risk that the valueof its investments may be subject to changes in interestrates, changes in the rating of any money market securityand in the ability of an issuer to make payments of interestand principal.
Repurchase Agreements Risk. Repurchaseagreements are agreements in which the seller of asecurity to the Fund agrees to repurchase that securityfrom the Fund at a mutually agreed upon price and date.Repurchase agreements carry the risk that thecounterparty may not fulfill its obligations under theagreement. This could cause the Fund’s income and thevalue of the Fund to decline.
Performance Information
The following Risk/Return Bar Chart and Table illustratethe risks of investing in the Fund by showing changes inthe Fund’s performance from calendar year to calendaryear and comparing the Fund’s average annual returns tothose of the Bloomberg Barclays U.S. Government BondIndex. Fees and expenses incurred at the contract levelare not reflected in the bar chart or table. If these amountswere reflected, returns would be less than those shown.Of course, past performance is not necessarily anindication of how the Fund will perform in the future.
Effective, August 5, 2013, J.P. Morgan InvestmentManagement Inc. (“JPMIM”) assumed management ofthe Fund. Prior to this time, the Fund was co-sub-advisedby JPMIM and SunAmerica Asset Management, LLC(“SunAmerica”).
3.96%
9.78%
3.71%
-4.22%
5.52%
0.81% 1.22%2.04%
0.52%
6.50%
-6%
-4%
-2%
0%
2%
4%
6%
8%
10%
12%
2010 2011 2012 2013 2014 2015 2016 2017 2018 2019
During the 10-year period shown in the bar chart, thehighest return for a quarter was 5.73% (quarter endedSeptember 30, 2011) and the lowest return for a quarterwas -3.36% (quarter ended December 31, 2010). Theyear-to-date calendar return as of June 30, 2020 was6.35%.
Average Annual Total Returns (For the periods endedDecember 31, 2019)
1Year
5Years
10Years
Fund 6.50% 2.19% 2.92%Bloomberg Barclays U.S.Government Bond Index(reflects no deduction forfees, expenses or taxes) 6.83% 2.36% 3.03%
Investment Adviser
The Fund’s investment adviser is The Variable AnnuityLife Insurance Company.
The Fund is subadvised by JPMIM.
Portfolio Managersg
Name and Title
PortfolioManager of theFund Since
Michael SaisManaging Director and Co-LeadManager ................................................ 2011
Robert ManningManaging Director and Co-LeadManager ................................................ 2011
For important information about purchases and sales ofFund shares, taxes and payments to broker-dealers andother financial intermediaries, please turn to the section“Important Additional Information” on page 127.
FUND SUMMARY: GOVERNMENT SECURITIES FUND
- 43 -

Investment Objective
The Fund seeks long-term capital growth.
Fees and Expenses of the Fund
This table describes the fees and expenses that you maypay if you buy and hold shares of the Fund. The Fund’sannual operating expenses do not reflect the separateaccount fees charged in the variable annuity or variablelife insurance policy (“Variable Contracts”) in which theFund is offered. If separate account fees were shown, theFund’s annual operating expenses would be higher.Please see your Variable Contract prospectus for moredetails on the separate account fees.
Annual Fund Operating Expenses (expenses that yougpay each year as a percentage of the value of yourinvestment)
Management Fees 0.69%Other Expenses 0.12%Total Annual Fund Operating Expenses 0.81%Fee Waivers and/or Expense Reimbursements1 -0.16%Total Annual Fund Operating ExpensesAfter Fee Waivers and/or ExpenseReimbursements1 0.65%
1 The Fund’s investment adviser, The Variable Annuity Life InsuranceCompany, has contractually agreed to waive its advisory fee throughSeptember 30, 2021, so that the advisory fee payable by the Fund toVALIC equals 0.57% of average monthly assets on the first$500 million, 0.51% on the next $500 million, 0.48% on the next$500 million and 0.45% thereafter. This agreement may be modifiedor discontinued prior to such time only with the approval of the Boardof Directors of the Fund, including a majority of the directors who arenot “interested persons” of the Fund as defined in the InvestmentCompany Act of 1940, as amended.
Expense Example
This Example is intended to help you compare the cost ofinvesting in the Fund with the cost of investing in othermutual funds. The Example assumes that you invest$10,000 in the Fund for the time periods indicated andthen redeem all of your shares at the end of those periods.The Example also assumes that your investment has a 5%return each year and that the Fund’s operating expensesinclude fee waivers for one year. The Example does notreflect charges imposed by the Variable Contract. If theVariable Contract fees were reflected, the expenses wouldbe higher. See the Variable Contract prospectus forinformation on such charges. Although your actual costsmay be higher or lower, based on these assumptions andthe net expenses shown in the fee table, your costs wouldbe:
1 Year 3 Years 5 Years 10 Years
$66 $243 $434 $987
Portfolio Turnover
The Fund pays transaction costs, such as commissions,when it buys and sells securities (or “turns over” itsportfolio). These costs, which are not reflected in annualfund operating expenses or in the Example, affect theFund’s performance.
During the most recent fiscal year, the Fund’s portfolioturnover rate was 219% of the average value of itsportfolio.
Principal Investment Strategies of the Fund
The Fund attempts to achieve its investment objective byinvesting primarily in common stock of companies that areselected based on such factors as strong earnings, strongsales and revenue growth and capital appreciationpotential. The Fund will emphasize common stock ofcompanies with mid- to large-stock market capitalizations;however, the Fund also may invest in the common stock ofsmall companies. The Fund generally invests at least 65%of its total assets in equity securities. Equity securitiesconsist of common stock and American DepositaryReceipts (“ADRs”). The Fund may invest without limitationin the securities of foreign companies in the form of ADRs.In addition to ADRs, the Fund may also invest up to 20%of its total assets in securities of foreign companies,including companies located in emerging markets.
VALIC is the Fund’s investment adviser. The Fund ismanaged by two subadvisers. The Fund’s assets are notnecessarily divided equally among the subadvisers.Approximately 25% of the Fund’s assets will be allocatedto one subadviser (the “Passive Manager”) that willpassively manage a portion of the assets allocated to it byseeking to track the S&P 500® Growth Index (the“Underlying Index”), and the remainder of the Fund’sassets will be allocated to the other subadviser (the “ActiveManager”). The Fund’s target allocations among thesubadvisers are subject to change at the discretion ofVALIC, and actual allocations could vary substantiallyfrom the target allocations due to market valuationchanges.
The Passive Manager primarily seeks to track its sleeve’sUnderlying Index by investing in all or substantially all ofthe stocks included in the Underlying Index, a strategyknown as “replication.” The Passive Manager may,however, utilize an “optimization” strategy incircumstances in which replication is difficult orimpossible. The goal of optimization is to select stockswhich ensure that characteristics such as industryweightings, average market capitalizations andfundamental characteristics (e.g., price-to-book, price-to-
FUND SUMMARY: GROWTH FUND
- 44 -

earnings, debt-to-asset ratios and dividend yields) closelyapproximate those of the Underlying Index.
The Active Manager selects not less than 25 to not morethan 45 companies through a process of both top-downmacro-economic analysis of economic and businessconditions, and bottom-up analysis of the businessfundamentals of individual companies. Stocks areselected from a universe of companies that the ActiveManager believes have above average growth potential.The Active Manager will make investment decisions basedon judgments regarding several valuation parametersrelative to anticipated rates of growth in earnings andpotential rates of return on equity.
In order to generate additional income, the Fund may lendportfolio securities to broker-dealers and other financialinstitutions provided that the value of the loaned securitiesdoes not exceed 30% of the Fund’s total assets. Theseloans earn income for the Fund and are collateralized bycash and securities issued or guaranteed by the U.S.Government or its agencies or instrumentalities.
Principal Risks of Investing in the Fund
As with any mutual fund, there can be no assurance thatthe Fund’s investment objective will be met or that the netreturn on an investment in the Fund will exceed what couldhave been obtained through other investment or savingsvehicles. Shares of the Fund are not bank deposits andare not guaranteed or insured by any bank, governmententity or the Federal Deposit Insurance Corporation. If thevalue of the assets of the Fund goes down, you could losemoney.
The following is a summary of the principal risks ofinvesting in the Fund.
Index Risk. In attempting to track the performance of theindex, the Fund may be more susceptible to adversedevelopments concerning a particular security, companyor industry because the Fund generally will not use anydefensive strategies to mitigate its risk exposure.
Failure to Match Index Performance Risk. The ability ofthe Fund to match the performance of the UnderlyingIndex may be affected by, among other things, changes insecurities markets, the manner in which performance ofthe Underlying Index is calculated, changes in thecomposition of the Underlying Index, the amount andtiming of cash flows into and out of the Fund,commissions, portfolio expenses, and any differences inthe pricing of securities by the Fund and the UnderlyingIndex. When the Fund employs an “optimization” strategy,the Fund is subject to an increased risk of tracking error,in that the securities selected in the aggregate for theFund may perform differently than the Index.
Management Risk. The investment style or strategy usedby the Active Manager may fail to produce the intendedresult. The Active Manager’s assessment of a particularsecurity or company may prove incorrect, resulting inlosses or underperformance.
Dividend-paying Stocks Risk. There is no guaranteethat the issuers of the stocks held by the Fund will declaredividends in the future or that, if dividends are declared,they will remain at their current levels or increase overtime. Dividend-paying stocks may not participate in abroad market advance to the same degree as otherstocks, and a sharp rise in interest rates or economicdownturn could cause a company to unexpectedly reduceor eliminate its dividend.
Equity Securities Risk. The Fund’s investments in equitysecurities are subject to the risk that stock prices will falland may underperform other asset classes. Individualstock prices fluctuate from day-to-day and may declinesignificantly. The prices of individual stocks may benegatively affected by poor company results or otherfactors affecting individual prices, as well as industry and/or economic trends and developments affecting industriesor the securities market as a whole.
Currency Risk. Because the Fund’s foreign investmentsare generally held in foreign currencies, the Fund couldexperience gains or losses based solely on changes in theexchange rate between foreign currencies and the U.S.dollar. Such gains or losses may be substantial.
Foreign Investment Risk. Investment in foreignsecurities involves risks due to several factors, such asilliquidity, the lack of public information, changes in theexchange rates between foreign currencies and the U.S.dollar, unfavorable political, social and legaldevelopments, or economic and financial instability.Foreign companies are not subject to the U.S. accountingand financial reporting standards and may have riskiersettlement procedures. U.S. investments that aredenominated in foreign currencies or that are traded inforeign markets, or securities of U.S. companies that havesignificant foreign operations may be subject to foreigninvestment risk.
Depositary Receipts Risk. Depositary receipts aregenerally subject to the same risks as the foreignsecurities that they evidence or into which they may beconverted. Depositary receipts may or may not be jointlysponsored by the underlying issuer. The issuers ofunsponsored depositary receipts are not obligated todisclose information that is considered material in theUnited States. Therefore, there may be less informationavailable regarding the issuers and there may not be acorrelation between such information and the market
FUND SUMMARY: GROWTH FUND
- 45 -
value of the depositary receipts. Certain depositaryreceipts are not listed on an exchange and therefore maybe considered to be illiquid securities.
Emerging Markets Risk. Investments in emergingmarkets are subject to all of the risks of investments inforeign securities, generally to a greater extent than indevelopedmarkets, and additional risks as well. Generally,the economic, social, legal, and political structures inemerging market countries are less diverse, mature andstable than those in developed countries. As a result,investments in emergingmarket securities tend to bemorevolatile than investments in developed countries. Unlikemost developed countries, emerging market countriesmay impose restrictions on foreign investment. Thesecountries may also impose confiscatory taxes oninvestment proceeds or otherwise restrict the ability offoreign investors to withdraw their money at will.
Focused Fund Risk. The Fund, because it may invest ina limited number of companies, may have more volatilityin its net asset value and is considered to have more riskthan a portfolio that invests in a greater number ofcompanies because changes in the value of a singlesecurity may have a more significant effect, eithernegative or positive, on the Fund’s net asset value. To theextent the Fund invests its assets in fewer securities, theFund is subject to greater risk of loss if any of thosesecurities decline in price.
Growth Style Risk. Generally, “growth” stocks are stocksof companies that a subadviser believes have anticipatedearnings ranging from steady to accelerated growth.Many investors buy growth stocks because of anticipatedsuperior earnings growth, but earnings disappointmentsoften result in sharp price declines. Growth companiesusually invest a high portion of earnings in their ownbusinesses so their stocks may lack the dividends that cancushion share prices in a down market. In addition, thevalue of growth stocks may be more sensitive to changesin current or expected earnings than the value of otherstocks, because growth stocks trade at higher pricesrelative to current earnings.
Large- and Mid-Cap Company Risk. Investing in large-andmid-cap companies carries the risk that due to currentmarket conditions these companies may be out of favorwith investors. Large-cap companies may be unable torespond quickly to new competitive challenges or attainthe high growth rate of successful smaller companies.Stocks of mid-cap companies may be more volatile thanthose of larger companies due to, among other reasons,narrower product lines, more limited financial resourcesand fewer experienced managers.
Small-Cap Company Risk. Investing in small-capcompanies carries the risk that due to current marketconditions these companies may be out of favor withinvestors. Small companies often are in the early stagesof development with limited product lines, markets, orfinancial resources and managements lacking depth andexperience, which may cause their stock prices to bemorevolatile than those of larger companies. Small companystocks may be less liquid yet subject to abrupt or erraticprice movements. It may take a substantial period of timebefore the Fund realizes a gain on an investment in asmall-cap company, if it realizes any gain at all.
Market Risk. The Fund’s share price can fall because ofweakness in the broad market, a particular industry, orspecific holdings or due to adverse political or economicdevelopments here or abroad, changes in investorpsychology, or heavy institutional selling and otherconditions or events (including, for example, militaryconfrontations, war, terrorism, disease/virus, outbreaksand epidemics). The prices of individual securities mayfluctuate, sometimes dramatically, from day to day. Theprices of stocks and other equity securities tend to bemore volatile than those of fixed-income securities.
The coronavirus pandemic and the related governmentaland public responses have had and may continue to havean impact on the Fund’s investments and net asset valueand have led and may continue to lead to increasedmarket volatility and the potential for illiquidity in certainclasses of securities and sectors of the market.Preventative or protective actions that governments maytake in respect of pandemic or epidemic diseases mayresult in periods of business disruption, businessclosures, inability to obtain raw materials, supplies andcomponent parts, and reduced or disrupted operations forthe issuers in which the Fund invests. Governmentintervention in markets may impact interest rates, marketvolatility and security pricing. The occurrence,reoccurrence and pendency of such diseases couldadversely affect the economies (including throughchanges in business activity and increasedunemployment) and financial markets either in specificcountries or worldwide.
Price Volatility Risk. The Fund’s investment strategymay subject the Fund’s portfolio to increased volatility.Volatility may cause the value of the Fund’s portfolio tofluctuate significantly in the short term.
Securities Lending Risk. Engaging in securities lendingcould increase the market and credit risk for Fundinvestments. The Fund may lose money if it does notrecover borrowed securities, the value of the collateral
FUND SUMMARY: GROWTH FUND
- 46 -

falls, or the value of investments made with cash collateraldeclines. If the value of either the cash collateral or theFund’s investments of the cash collateral falls below theamount owed to a borrower, the Fund also may incurlosses that exceed the amount it earned on lending thesecurity. Securities lending also involves the risks of delayin receiving additional collateral or possible loss of rightsin the collateral if the borrower fails. Another risk ofsecurities lending is the risk that the loaned portfoliosecurities may not be available to the Fund on a timelybasis and the Fund may therefore lose the opportunity tosell the securities at a desirable price.
Sector Risk. Companies with similar characteristics maybe grouped together in broad categories called sectors.Sector risk is the risk that securities of companies withinspecific sectors of the economy can perform differentlythan the overall market. This may be due to changes insuch things as the regulatory or competitive environmentor to changes in investor perceptions regarding a sector.Because the Fund may allocate relatively more assets tocertain sectors than others, the Fund’s performance maybe more susceptible to any developments which affectthose sectors emphasized by the Fund.
Performance Information
The following Risk/Return Bar Chart and Table illustratethe risks of investing in the Fund by showing changes inthe Fund’s performance from calendar year to calendaryear and comparing the Fund’s average annual returns tothose of the Russell 1000® Growth Index and S&P® 500Growth Index. Fees and expenses incurred at the contractlevel are not reflected in the bar chart or table. If theseamounts were reflected, returns would be less than thoseshown. Of course, past performance is not necessarily anindication of how the Fund will perform in the future.
American Century Investment Management, Inc. servedas subadviser of the Fund from its inception until
September 30, 2019. BlackRock InvestmentManagement, LLC (“BlackRock”) and SunAmerica AssetManagement, LLC (“SunAmerica”) assumed subadvisoryduties of the Fund on September 30, 2019.
18.24%
-0.62%
14.92%
31.10%
10.73%
3.08%4.79%
30.23%
-2.77%
31.87%
-10%
-5%
0%
5%
10%
15%
20%
25%
30%
35%
2010 2011 2012 2013 2014 2015 2016 2017 2018 2019
During the 10-year period shown in the bar chart, thehighest return for a quarter was 16.22% (quarter endedMarch 31, 2012) and the lowest return for a quarter was-16.34% (quarter ended December 31, 2018). The year-to-date calendar return as of June 30, 2020 was 14.35%.
Average Annual Total Returns (For the periods endedDecember 31, 2019)
1Year
5Years
10Years
Fund 31.87% 12.52% 13.46%Russell 1000® GrowthIndex (reflects nodeduction for fees,expenses or taxes) 36.39% 14.63% 15.22%
S&P 500® Growth Index(reflects no deduction forfees, expenses or taxes) 31.13% 13.52% 14.78%
FUND SUMMARY: GROWTH FUND
- 47 -

Investment Adviser
The Fund’s investment adviser is The Variable AnnuityLife Insurance Company.
The Fund is subadvised by BlackRock and SunAmerica.
Portfolio Managersg
Name and Title
PortfolioManager ofthe FundSince
SunAmerica ....................................................Timothy CampionSenior Vice President and Lead PortfolioManager ...................................................... 2019
Elizabeth MauroPortfolio Manager and Co-PortfolioManager ...................................................... 2019
BlackRock.......................................................Lawrence Kemp, CFAManaging Director and Portfolio Manager .. 2019
Philip H. Ruvinsky, CFAManaging Director and Portfolio Manager .. 2020
For important information about purchases and sales ofFund shares, taxes and payments to broker-dealers andother financial intermediaries, please turn to the section“Important Additional Information” on page 127.
FUND SUMMARY: GROWTH FUND
- 48 -

Investment Objective
The Fund seeks long-term capital growth.
Fees and Expenses of the Fund
This table describes the fees and expenses that you maypay if you buy and hold shares of the Fund. The Fund’sannual operating expenses do not reflect the separateaccount fees charged in the variable annuity or variablelife insurance policy (“Variable Contracts”) in which theFund is offered. If separate account fees were shown, theFund’s annual operating expenses would be higher.Please see your Variable Contract prospectus for moredetails on the separate account fees.
Annual Fund Operating Expenses (expenses that yougpay each year as a percentage of the value of yourinvestment)
Management Fees 0.98%Other Expenses 0.11%Total Annual Fund Operating Expenses 1.09%Fee Waivers and/or Expense Reimbursements1 -0.04%Total Annual Fund Operating ExpensesAfter Fee Waivers and/or ExpenseReimbursements1 1.05%
1 The Fund’s investment adviser, The Variable Annuity Life InsuranceCompany, has contractually agreed to waive its advisory fee throughSeptember 30, 2021, so that the advisory fee payable by the Fund toVALIC equals 0.97% of the Fund’s average daily net assets when theFund’s assets are between $700 million and $750 million and equals0.94% of the Fund’s average daily net assets when the Fund’s assetsexceed $750 million. This Fee Waiver Agreement will continue ineffect from year to year thereafter provided such continuance isagreed to by VALIC and approved by the Fund’s Board of Directors,including a majority of the Board’s Independent Directors.
Expense Example
This Example is intended to help you compare the cost ofinvesting in the Fund with the cost of investing in othermutual funds. The Example assumes that you invest$10,000 in the Fund for the time periods indicated andthen redeem all of your shares at the end of those periods.The Example also assumes that your investment has a 5%return each year and that the Fund’s operating expensesinclude fee waivers for one year. The Example does notreflect charges imposed by the Variable Contract. If theVariable Contract fees were reflected, the expenses wouldbe higher. See the Variable Contract prospectus forinformation on such charges. Although your actual costsmay be higher or lower, based on these assumptions andthe net expenses shown in the fee table, your costs wouldbe:
1 Year 3 Years 5 Years 10 Years
$107 $343 $597 $1,325
Portfolio Turnover
The Fund pays transaction costs, such as commissions,when it buys and sells securities (or “turns over” itsportfolio). These costs, which are not reflected in annualfund operating expenses or in the Example, affect theFund’s performance.
During the most recent fiscal year, the Fund’s portfolioturnover rate was 37% of the average value of its portfolio.
Principal Investment Strategies of the Fund
The Fund pursues long-term capital appreciation byinvesting, under normal circumstances, at least 80% of itsnet assets in the common stocks of companies engagedin the research, development, production, or distribution ofproducts or services related to health care, medicine, orthe life sciences (collectively termed “health sciences”).While the Fund can invest in companies of any size, themajority of Fund assets are expected to be invested inlarge- and mid-cap companies.
The Fund’s Subadviser divides the health sciences sectorinto four main areas: pharmaceuticals, health careservices companies, medical products and devicesproviders, and biotechnology firms. The allocation amongthese four areas will vary depending on the relativepotential the Subadviser sees within each area and theoutlook for the overall health sciences sector.
While most assets will be invested in U.S. common stocks,the Fund may invest in foreign stocks, consistent with theFund’s objective. The Fund may invest up to 35% of itstotal assets in foreign stocks, which include non-dollardenominated securities traded outside the U.S.
In pursuing its investment objective, the Subadviser hasthe discretion to deviate from its normal investmentcriteria, as described in this Fund Summary, when itperceives an opportunity for substantial appreciation.These situations might arise when the Subadviserbelieves a security could increase in value for a variety ofreasons, including a change in management, anextraordinary corporate event, a new product introductionor innovation, a favorable competitive development or achange in management. The Fund may sell securities fora variety of reasons, such as to secure gains, limit losses,or redeploy assets into more promising opportunities.
In order to generate additional income, the Fund may lendportfolio securities to broker-dealers and other financialinstitutions provided that the value of the loaned securitiesdoes not exceed 30% of the Fund’s total assets. Theseloans earn income for the Fund and are collateralized bycash and securities issued or guaranteed by the U.S.Government or its agencies or instrumentalities. Investors
FUND SUMMARY: HEALTH SCIENCES FUND
- 49 -

will be given at least 60 days’ written notice in advance ofany change to the Fund’s 80% investment policy set forthabove.
Principal Risks of Investing in the Fund
As with any mutual fund, there can be no assurance thatthe Fund’s investment objective will be met or that the netreturn on an investment in the Fund will exceed what couldhave been obtained through other investment or savingsvehicles. Shares of the Fund are not bank deposits andare not guaranteed or insured by any bank, governmententity or the Federal Deposit Insurance Corporation. If thevalue of the assets of the Fund goes down, you could losemoney.
The following is a summary of the principal risks ofinvesting in the Fund.
Health Sector Risk.Since the Fund is concentrated in thehealth sciences industry, the Fund is less diversified thanfunds investing in a broader range of industries and couldexperience significant volatility. The Fund may invest aconsiderable portion of assets in companies in the samebusiness, such as pharmaceuticals, or in relatedbusinesses such as hospital management and managedcare. Developments that could adversely affect the Fundinclude: increased competition within the health careindustry, changes in legislation or government regulations,reductions in government funding or price controlsimposed by a government, product liability or otherlitigation and the obsolescence of popular products. Theimplementation of the Affordable Care Act and otherreforms could materially and adversely affect the mannerin which health care companies conduct business andtheir results of operations, financial position and cashflows.
Management Risk. The investment style or strategy usedby the Subadviser may fail to produce the intended result.The Subadviser’s assessment of a particular security orcompany may prove incorrect, resulting in losses orunderperformance.
Currency Risk. Because the Fund’s foreign investmentsare generally held in foreign currencies, the Fund couldexperience gains or losses based solely on changes in theexchange rate between foreign currencies and the U.S.dollar. Such gains or losses may be substantial.
Dividend-paying Stocks Risk. There is no guaranteethat the issuers of the stocks held by the Fund will declaredividends in the future or that, if dividends are declared,they will remain at their current levels or increase overtime. Dividend-paying stocks may not participate in abroad market advance to the same degree as otherstocks, and a sharp rise in interest rates or economic
downturn could cause a company to unexpectedly reduceor eliminate its dividend.
Equity Securities Risk. The Fund invests principally inequity securities and is therefore subject to the risk thatstock prices will fall and may underperform other assetclasses. Individual stock prices fluctuate from day-to-dayand may decline significantly. The prices of individualstocks may be negatively affected by poor companyresults or other factors affecting individual prices, as wellas industry and/or economic trends and developmentsaffecting industries or the securities market as a whole.
Foreign Investment Risk. Investment in foreignsecurities involves risks due to several factors, such asilliquidity, the lack of public information, changes in theexchange rates between foreign currencies and the U.S.dollar, unfavorable political, social and legaldevelopments, or economic and financial instability.Foreign companies are not subject to the U.S. accountingand financial reporting standards and may have riskiersettlement procedures. U.S. investments that aredenominated in foreign currencies or that are traded inforeign markets, or securities of U.S. companies that havesignificant foreign operations may be subject to foreigninvestment risk.
Large- and Mid-Cap Company Risk. Investing in large-andmid-cap companies carries the risk that due to currentmarket conditions these companies may be out of favorwith investors. Large-cap companies may be unable torespond quickly to new competitive challenges or attainthe high growth rate of successful smaller companies.Stocks of mid-cap companies may be more volatile thanthose of larger companies due to, among other reasons,narrower product lines, more limited financial resourcesand fewer experienced managers.
Market Risk. The Fund’s share price can fall because ofweakness in the broad market, a particular industry, orspecific holdings or due to adverse political or economicdevelopments here or abroad, changes in investorpsychology, or heavy institutional selling and otherconditions or events (including, for example, militaryconfrontations, war, terrorism, disease/virus, outbreaksand epidemics). The prices of individual securities mayfluctuate, sometimes dramatically, from day to day. Theprices of stocks and other equity securities tend to bemore volatile than those of fixed-income securities.
The coronavirus pandemic and the related governmentaland public responses have had and may continue to havean impact on the Fund’s investments and net asset valueand have led and may continue to lead to increasedmarket volatility and the potential for illiquidity in certainclasses of securities and sectors of the market.
FUND SUMMARY: HEALTH SCIENCES FUND
- 50 -

Preventative or protective actions that governments maytake in respect of pandemic or epidemic diseases mayresult in periods of business disruption, businessclosures, inability to obtain raw materials, supplies andcomponent parts, and reduced or disrupted operations forthe issuers in which the Fund invests. Governmentintervention in markets may impact interest rates, marketvolatility and security pricing. The occurrence,reoccurrence and pendency of such diseases couldadversely affect the economies (including throughchanges in business activity and increasedunemployment) and financial markets either in specificcountries or worldwide.
Sector Risk. Companies with similar characteristics maybe grouped together in broad categories called sectors.Sector risk is the risk that securities of companies withinspecific sectors of the economy can perform differentlythan the overall market. This may be due to changes insuch things as the regulatory or competitive environmentor to changes in investor perceptions regarding a sector.Because the Fund may allocate relatively more assets tocertain sectors than others, the Fund’s performance maybe more susceptible to any developments which affectthose sectors emphasized by the Fund.
Securities Lending Risk. Engaging in securities lendingcould increase the market and credit risk for Fundinvestments. The Fund may lose money if it does notrecover borrowed securities, the value of the collateralfalls, or the value of investments made with cash collateraldeclines. If the value of either the cash collateral or theFund’s investments of the cash collateral falls below theamount owed to a borrower, the Fund also may incurlosses that exceed the amount it earned on lending thesecurity. Securities lending also involves the risks of delayin receiving additional collateral or possible loss of rightsin the collateral if the borrower fails. Another risk ofsecurities lending is the risk that the loaned portfoliosecurities may not be available to the Fund on a timelybasis and the Fund may therefore lose the opportunity tosell the securities at a desirable price.
Performance Information
The following Risk/Return Bar Chart and Table illustratethe risks of investing in the Fund by showing changes inthe Fund’s performance from calendar year to calendaryear and comparing the Fund’s average annual returns tothose of the S&P 500® Health Care Index. Fees andexpenses incurred at the contract level are not reflected inthe bar chart or table. If these amounts were reflected,returns would be less than those shown. Of course, past
performance is not necessarily an indication of how theFund will perform in the future.
15.75%10.48%
31.73%
51.04%
31.57%
12.65%
-10.50%
27.66%
0.97%
28.84%
-20%
-10%
0%
10%
20%
30%
40%
50%
60%
2010 2011 2012 2013 2014 2015 2016 2017 2018 2019
During the 10-year period shown in the bar chart, thehighest return for a quarter was 18.94% (quarter endedDecember 31, 2019) and the lowest return for a quarterwas -15.83% (quarter ended December 31, 2018). Theyear-to-date calendar return as of June 30, 2020 was6.60%.
Average Annual Total Returns (For the periods endedDecember 31, 2019)
1Year
5Years
10Years
Fund 28.84% 10.86% 18.81%S&P 500® Health CareIndex (reflects nodeduction for fees,expenses or taxes) 20.82% 10.31% 14.76%
Investment Adviser
The Fund’s investment adviser is The Variable AnnuityLife Insurance Company.
The Fund is subadvised by T. Rowe Price Associates, Inc.
Portfolio Managersg
Name and Title
PortfolioManager of theFund Since
Ziad Bakri, CFA, MDVice President and Portfolio Manager ... 2016
For important information about purchases and sales ofFund shares, taxes and payments to broker-dealers andother financial intermediaries, please turn to the section“Important Additional Information” on page 127.
FUND SUMMARY: HEALTH SCIENCES FUND
- 51 -

Investment Objective
The Fund seeks maximum real return.
Fees and Expenses of the Fund
This table describes the fees and expenses that you maypay if you buy and hold shares of the Fund. The Fund’sannual operating expenses do not reflect the separateaccount fees charged in the variable annuity or variablelife insurance policy (“Variable Contracts”) in which theFund is offered. If separate account fees were shown, theFund’s annual operating expenses would be higher.Please see your Variable Contract prospectus for moredetails on the separate account fees.
Annual Fund Operating Expenses (expenses that yougpay each year as a percentage of the value of yourinvestment)
Management Fees 0.45%Other Expenses 0.12%Total Annual Fund Operating Expenses 0.57%Fee Waivers and/or Expense Reimbursements1 -0.03%Total Annual Fund Operating ExpensesAfter Fee Waivers and/or ExpenseReimbursements1 0.54%
1 The Fund’s investment adviser, The Variable Annuity Life InsuranceCompany (“VALIC”), has contractually agreed to waive its advisoryfee through September 30, 2021, so that the advisory fee payable bythe Fund to VALIC equals 0.47% of average monthly assets on thefirst $250 million, 0.42% on the next $250 million, and 0.37%thereafter. This agreement may be modified or discontinued prior tosuch time only with the approval of the Board of Directors of theVALIC Company I (“VC I”), including a majority of the directors whoare not “interested persons” of VC I as defined in the InvestmentCompany Act of 1940, as amended.
Expense Example
This Example is intended to help you compare the cost ofinvesting in the Fund with the cost of investing in othermutual funds. The Example assumes that you invest$10,000 in the Fund for the time periods indicated andthen redeem all of your shares at the end of those periods.The Example also assumes that your investment has a 5%return each year and that the Fund’s operating expensesinclude fee waivers for one year. The Example does notreflect charges imposed by the Variable Contract. If theVariable Contract fees were reflected, the expenses wouldbe higher. See the Variable Contract prospectus forinformation on such charges. Although your actual costsmay be higher or lower, based on these assumptions andthe net expenses shown in the fee table, your costs wouldbe:
1 Year 3 Years 5 Years 10 Years
$55 $180 $315 $711
Portfolio Turnover
The Fund pays transaction costs, such as commissions,when it buys and sells securities (or “turns over” itsportfolio). These costs, which are not reflected in annualfund operating expenses or in the Example, affect theFund’s performance.
During the most recent fiscal year, the Fund’s portfolioturnover rate was 38% of the average value of its portfolio.
Principal Investment Strategies of the Fund
The Fund seeks to achieve its investment objective byinvesting, under normal circumstances, at least 80% of itsnet assets in inflation-indexed fixed income securitiesissued by domestic and foreign governments (includingthose in emerging market countries), their agencies orinstrumentalities, and corporations and in derivativeinstruments that have economic characteristics similar tosuch securities.
Inflation-indexed fixed income securities are structured toprovide protection against the negative effects of inflation.The value of a fixed income security’s principal or theinterest income paid on the fixed income security isadjusted to track changes in an official inflation measure,usually the Consumer Price Index for Urban Consumers(“CPI-U”) with respect to domestic issuers.
The Fund invests primarily in investment grade securitiesrated Baa3 or higher by Moody’s Investors Service, Inc. orBBB-or higher by S&P Global Ratings. The Fund also mayinvest up to 50% of its total assets in securitiesdenominated in foreign currencies, and may investbeyond this limit in U.S. dollar denominated securities offoreign and emerging market issuers. The Fund mayinvest in debt securities that are not inflation indexed,including mortgage- and asset-backed securities andcollateralized loan obligations. The subadviser mayconsider, among other things, credit, interest rate andprepayment risks, as well as general market conditions,when deciding whether to buy or sell fixed incomeinvestments, and the Fund may invest in fixed incomeinvestments of any maturity and duration. The Fundgenerally intends to utilize currency forwards and futurestomanage foreign currency risk. The Fundmay also investin derivative instruments, such as forwards, futures,contracts or swap agreements, as a substitute for directlyinvesting in the above instruments or for risk managementpurposes. The subadviser may engage in frequent andactive trading of portfolio securities to achieve the Fund’sinvestment objective.
In order to generate additional income, the Fund may lendportfolio securities to broker-dealers and other financial
FUND SUMMARY: INFLATION PROTECTED FUND
- 52 -
institutions provided that the value of the loaned securitiesdoes not exceed 30% of the Fund’s total assets. Theseloans earn income for the Fund and are collateralized bycash and securities issued or guaranteed by the U.S.Government or its agencies or instrumentalities. Investorswill be given at least 60 days’ written notice in advance ofany change to the Fund’s 80% investment policy set forthabove.
Principal Risks of Investing in the Fund
As with any mutual fund, there can be no assurance thatthe Fund’s investment objective will be met or that the netreturn on an investment in the Fund will exceed what couldhave been obtained through other investment or savingsvehicles. Shares of the Fund are not bank deposits andare not guaranteed or insured by any bank, governmententity or the Federal Deposit Insurance Corporation. If thevalue of the assets of the Fund goes down, you could losemoney.
The following is a summary of the principal risks ofinvesting in the Fund.
Risks of Investing in Inflation-Indexed Securities. Ifthe interest rate rises for reasons other than inflation, thevalue of inflation-indexed securities can be negativelyimpacted. In certain interest rate environments, suchinstruments may experience greater losses than otherfixed income securities with similar durations.
Risks of Inflation Indexing Methodology. An inflationindex may not accurately measure the real rate of inflationin the prices of goods and services, whether for the U.S.or a foreign country. Market perceptions of adjustmenttimes or a lag between the time a security is adjusted forinflation and the time interest is paid can each adverselyaffect an inflation-indexed security, particularly duringperiods of significant, rapid changes in inflation.
Interest Rate Fluctuations Risk. Fixed income securitiesmay be subject to volatility due to changes in interestrates. Duration is a measure of interest rate risk thatindicates how price-sensitive a bond is to changes ininterest rates. Longer-term and lower coupon bonds tendto be more sensitive to changes in interest rates. Interestrates have been historically low, so the Fund faces aheightened risk that interest rates may rise. For example,a bond with a duration of three years will decrease in valueby approximately 3% if interest rates increase by 1%.Potential future changes in monetary policy made bycentral banks and/or their governments are likely to affectthe level of interest rates.
Call or Prepayment Risk. During periods of fallinginterest rates, a bond issuer may “call” a bond to repay itbefore its maturity date. The Fund may only be able to
invest the bond’s proceeds at lower interest rates,resulting in a decline in the Fund’s income.
Credit Risk. The Fund may suffer losses if the issuer ofa fixed income security owned by the Fund is unable tomake interest or principal payments.
Foreign Investment Risk. Investment in foreignsecurities involves risks due to several factors, such asilliquidity, the lack of public information, changes in theexchange rates between foreign currencies and the U.S.dollar, unfavorable political, social and legaldevelopments, or economic and financial instability.Foreign companies are not subject to the U.S. accountingand financial reporting standards and may have riskiersettlement procedures. U.S. investments that aredenominated in foreign currencies or that are traded inforeign markets, or securities of U.S. companies that havesignificant foreign operations may be subject to foreigninvestment risk.
Emerging Markets Risk. Investments in emergingmarkets are subject to all of the risks of investments inforeign securities, generally to a greater extent than indevelopedmarkets, and additional risks as well. Generally,the economic, social, legal, and political structures inemerging market countries are less diverse, mature andstable than those in developed countries. As a result,investments in emergingmarket securities tend to bemorevolatile than investments in developed countries. Unlikemost developed countries, emerging market countriesmay impose restrictions on foreign investment. Thesecountries may also impose confiscatory taxes oninvestment proceeds or otherwise restrict the ability offoreign investors to withdraw their money at will.
Currency Risk. Because the Fund’s foreign investmentsare generally held in foreign currencies, the Fund couldexperience gains or losses based solely on changes in theexchange rate between foreign currencies and the U.S.dollar. Such gains or losses may be substantial.
Market Risk. The Fund’s share price can fall because ofweakness in the broad market, a particular industry, orspecific holdings or due to adverse political or economicdevelopments here or abroad, changes in investorpsychology, or heavy institutional selling and otherconditions or events (including, for example, militaryconfrontations, war, terrorism, disease/virus, outbreaksand epidemics). The prices of individual securities mayfluctuate, sometimes dramatically, from day to day. Theprices of stocks and other equity securities tend to bemore volatile than those of fixed-income securities.
The coronavirus pandemic and the related governmentaland public responses have had and may continue to have
FUND SUMMARY: INFLATION PROTECTED FUND
- 53 -

an impact on the Fund’s investments and net asset valueand have led and may continue to lead to increasedmarket volatility and the potential for illiquidity in certainclasses of securities and sectors of the market.Preventative or protective actions that governments maytake in respect of pandemic or epidemic diseases mayresult in periods of business disruption, businessclosures, inability to obtain raw materials, supplies andcomponent parts, and reduced or disrupted operations forthe issuers in which the Fund invests. Governmentintervention in markets may impact interest rates, marketvolatility and security pricing. The occurrence,reoccurrence and pendency of such diseases couldadversely affect the economies (including throughchanges in business activity and increasedunemployment) and financial markets either in specificcountries or worldwide.
U.S. Government Obligations Risk. U.S. Treasuryobligations are backed by the “full faith and credit” of theU.S. Government and are generally considered to havelow credit risk. Unlike U.S. Treasury obligations, securitiesissued or guaranteed by federal agencies or authoritiesand U.S. Government-sponsored instrumentalities orenterprises may or may not be backed by the full faith andcredit of the U.S. Government and are therefore subject togreater credit risk than securities issued or guaranteed bythe U.S. Treasury.
Foreign Sovereign Debt Risk. Foreign sovereign debtsecurities are subject to the risk that a governmental entitymay delay or refuse to pay interest or to repay principal onits sovereign debt, due, for example, to cash flowproblems, insufficient foreign currency reserves, political,social and economic considerations, the relative size ofthe governmental entity’s debt position in relation to theeconomy or the failure to put in place economic reformsrequired by the International Monetary Fund or othermultilateral agencies. If a governmental entity defaults, itmay ask for more time in which to pay or for further loans.
Mortgage- and Asset-Backed SecuritiesRisk.Mortgage-backed securities are similar to other debtsecurities in that they are subject to credit risk and interestrate risk. Mortgage-backed securities may be issued orguaranteed by the U.S. Government, its agencies orinstrumentalities or may be non-guaranteed securitiesissued by private issuers. These securities are alsosubject to the risk that issuers will prepay the principalmore quickly or more slowly than expected, which couldcause the Fund to invest the proceeds in less attractiveinvestments or increase the volatility of their prices.
Asset-backed securities are bonds or notes that arenormally supported by a specific property. If the issuer
fails to pay the interest or return the principal when thebond matures, then the issuer must give the property tothe bondholders or noteholders. Examples of assetssupporting asset-backed securities include credit cardreceivables, retail installment loans, home equity loans,auto loans, and manufactured housing loans.
Collateralized Loan Obligation Risk. A collateralizedloan obligation is a trust typically collateralized by a poolof loans, which may include, among others, domestic andforeign senior secured loans, senior unsecured loans, andsubordinate corporate loans, including loans that may berated below investment grade or equivalent unrated loans.The cash flows from the trust are split into two or moreportions, called tranches, varying in risk and yield. Theriskiest portion is the “equity” tranche which bears the bulkof defaults from the bonds or loans in the trust and servesto protect the other, more senior tranches from default inall but the most severe circumstances. Because it ispartially protected from defaults, a senior tranche from acollateralized loan obligation trust typically has higherratings and lower yields than its underlying securities, andcan be rated investment grade. Despite the protectionfrom the equity tranche, collateralized loan obligationtranches can experience substantial losses due to actualdefaults, increased sensitivity to defaults due to collateraldefault and disappearance of protecting tranches, marketanticipation of defaults, as well as aversion tocollateralized loan obligation securities as a class.
Derivatives Risk. The prices of derivatives may move inunexpected ways due to the use of leverage and otherfactors and may result in increased volatility or losses. TheFund may not be able to terminate or sell derivativepositions, and a liquid secondary market may not alwaysexist for derivative positions. When currency forwards areused by the Fund for hedging purposes, there is a risk thatdue to imperfect correlations, the currency forwards willnot fully hedge against adverse changes in foreigncurrency values or, under extreme market conditions, willnot provide any hedging benefit. The successful use ofcurrency forwards for non-hedging purposes usuallydepends on the portfolio managers’ ability to forecastmovements in foreign currency values and may bespeculative. Should these values move in unexpectedways, the Fund may not achieve the anticipated benefitfrom using currency forwards, and it may realize losses,which could be significant.
Futures Risk. A futures contract is considered aderivative because it derives its value from the price of theunderlying currency, security or financial index. The pricesof futures contracts can be volatile and futures contractsmay lack liquidity. In addition, there may be imperfect or
FUND SUMMARY: INFLATION PROTECTED FUND
- 54 -

even negative correlation between the price of a futurescontract and the price of the underlying currency, securityor financial index.
Counterparty Risk. Counterparty risk is the risk that acounterparty to a security, loan or derivative held by theFund becomes bankrupt or otherwise fails to perform itsobligations due to financial difficulties. The Fund mayexperience significant delays in obtaining any recovery ina bankruptcy or other reorganization proceeding, andthere may be no recovery or limited recovery in suchcircumstances.
Hedging Risk. A hedge is an investment made in order toreduce the risk of adverse price movements in a currencyor other investment by taking an offsetting position (oftenthrough a derivative instrument, such as an option orforward contract). While hedging strategies can be veryuseful and inexpensive ways of reducing risk, they aresometimes ineffective due to unexpected changes in themarket. Hedging also involves the risk that changes in thevalue of the related security will not match those of theinstruments being hedged as expected, in which case anylosses on the instruments being hedged may not bereduced.
Active Trading Risk. High portfolio turnover rates thatare associated with active trading may result in highertransaction costs, which can adversely affect the Fund’sperformance. Active trading tends to be more pronouncedduring periods of increased market volatility.
Securities Lending Risk. Engaging in securities lendingcould increase the market and credit risk for Fundinvestments. The Fund may lose money if it does notrecover borrowed securities, the value of the collateralfalls, or the value of investments made with cash collateraldeclines. If the value of either the cash collateral or theFund’s investments of the cash collateral falls below theamount owed to a borrower, the Fund also may incurlosses that exceed the amount it earned on lending thesecurity. Securities lending also involves the risks of delayin receiving additional collateral or possible loss of rightsin the collateral if the borrower fails. Another risk ofsecurities lending is the risk that the loaned portfoliosecurities may not be available to the Fund on a timelybasis and the Fund may therefore lose the opportunity tosell the securities at a desirable price.
Performance Information
The following Risk/Return Bar Chart and Table illustratethe risks of investing in the Fund by showing changes in
the Fund’s performance from calendar year to calendaryear and comparing the Fund’s average annual returns tothose of the Bloomberg Barclays U.S. Treasury Inflation-Protected Securities (“TIPS”) Index. Fees and expensesincurred at the contract level are not reflected in the barchart or table. If these amounts were reflected, returnswould be less than those shown. Of course, pastperformance is not necessarily an indication of how theFund will perform in the future.
Effective September 28, 2020, Wellington ManagementCompany LLP (“Wellington Management”) assumedsubadvisory responsibilities for the Fund. Prior toSeptember 28, 2020, PineBridge Investments LLCsubadvised the Fund.
9.13%10.11%
8.03%
-6.97%
2.97%
-3.01%
3.80%4.86%
-2.22%
8.66%
-10%
-8%
-6%
-4%
-2%
0%
2%
4%
6%
8%
10%
12%
2010 2011 2012 2013 2014 2015 2016 2017 2018 2019
During the 10-year period shown in the bar chart, thehighest return for a quarter was 3.98% (quarter endedSeptember 30, 2010) and the lowest return for a quarterwas -5.98% (quarter ended June 30, 2013). The year-to-date calendar return as of June 30, 2020 was 3.27%.
Average Annual Total Returns (For the periods endedDecember 31, 2019)
1Year
5Years
10Years
Fund 8.66% 2.32% 3.38%Bloomberg Barclays U.S. TIPSIndex (reflects no deductionfor fees, expenses or taxes) 8.43% 2.62% 3.36%
Investment Adviser
The Fund’s investment adviser is The Variable AnnuityLife Insurance Company.
The Fund is subadvised by Wellington Management.
FUND SUMMARY: INFLATION PROTECTED FUND
- 55 -
Portfolio Managersg
Name and Title
PortfolioManager of theFund Since
Joseph F. Marvan, CFASenior Managing Director and FixedIncome Portfolio Manager.................. September 2020
Allan M. Levin, CFA, FRM, FSAManaging Director and Fixed IncomePortfolio Manager............................... September 2020
Jeremy ForsterManaging Director and Fixed IncomePortfolio Manager............................... September 2020
For important information about purchases and sales ofFund shares, taxes and payments to broker-dealers andother financial intermediaries, please turn to the section“Important Additional Information” on page 127.
FUND SUMMARY: INFLATION PROTECTED FUND
- 56 -

Investment Objective
The Fund seeks long-term capital growth throughinvestments in equity securities that, as a group, areexpected to provide investment results closelycorresponding to the performance of the MSCI EAFEIndex (the “Index”).
Fees and Expenses of the Fund
This table describes the fees and expenses that you maypay if you buy and hold shares of the Fund. The Fund’sannual operating expenses do not reflect the separateaccount fees charged in the variable annuity or variablelife insurance policy (“Variable Contracts”) in which theFund is offered. If separate account fees were shown, theFund’s annual operating expenses would be higher.Please see your Variable Contract prospectus for moredetails on the separate account fees.
Annual Fund Operating Expenses (expenses that yougpay each year as a percentage of the value of yourinvestment)
Management Fees 0.29%Other Expenses 0.14%Acquired Fund Fees and Expenses 0.01%Total Annual Fund Operating Expenses1 0.44%1 The Total Annual Fund Operating Expenses for the Fund do notcorrelate to the ratio of net expenses to average net assets providedin the Financial Highlights table of the Fund’s annual report, whichreflects the gross operating expenses of the Fund (0.43%) and doesnot include Acquired Fund Fees and Expenses. “Acquired Fund Feesand Expenses” include fees and expenses incurred indirectly by theFund as a result of investments in shares of one or more mutualfunds, hedge funds, private equity funds or other pooled investmentvehicles.
Expense Example
This Example is intended to help you compare the cost ofinvesting in the Fund with the cost of investing in othermutual funds. The Example assumes that you invest$10,000 in the Fund for the time periods indicated andthen redeem all of your shares at the end of those periods.The Example also assumes that your investment has a 5%return each year and that the Fund’s operating expensesremain the same. The Example does not reflect chargesimposed by the Variable Contract. If the Variable Contractfees were reflected, the expenses would be higher. Seethe Variable Contract prospectus for information on suchcharges. Although your actual costs may be higher orlower, based on these assumptions and the net expensesshown in the fee table, your costs would be:
1 Year 3 Years 5 Years 10 Years
$45 $141 $246 $555
Portfolio Turnover
The Fund pays transaction costs, such as commissions,when it buys and sells securities (or “turns over” itsportfolio). These costs, which are not reflected in annualfund operating expenses or in the Example, affect theFund’s performance.
During the most recent fiscal year, the Fund’s portfolioturnover rate was 10% of the average value of its portfolio.
Principal Investment Strategies of the Fund
The Fund is managed to seek to track the performance ofthe Index, which measures the stock performance oflarge- and mid-cap companies in developed countriesoutside the U.S. The Subadviser may endeavor to trackthe Index by purchasing every stock included in the Index,in the same proportions; or, in the alternative, theSubadviser may invest in a sampling of Index stocks byutilizing a statistical technique known as “optimization.”The goal of optimization is to select stocks which ensurethat various industry weightings, market capitalizations,and fundamental characteristics, (e.g., price-to-book,price-to-earnings, debt-to-asset ratios and dividendyields) closely approximate those of the Index.
The Fund invests, under normal circumstances, at least80% of net assets in stocks that are in the Index. Althoughthe Fund seeks to track the performance of the Index, theperformance of the Fund will not match that of the Indexexactly because, among other reasons, the Fund incursoperating expenses and other investment overhead aspart of its normal operations.
In order to generate additional income, the Fund may lendportfolio securities to broker-dealers and other financialinstitutions provided that the value of the loaned securitiesdoes not exceed 30% of the Fund’s total assets. Theseloans earn income for the Fund and are collateralized bycash and securities issued or guaranteed by the U.S.Government or its agencies or instrumentalities. Investorswill be given at least 60 days’ written notice in advance ofany change to the Fund’s 80% investment policy set forthabove.
Principal Risks of Investing in the Fund
As with any mutual fund, there can be no assurance thatthe Fund’s investment objective will be met or that the netreturn on an investment in the Fund will exceed what couldhave been obtained through other investment or savingsvehicles. Shares of the Fund are not bank deposits andare not guaranteed or insured by any bank, governmententity or the Federal Deposit Insurance Corporation. If the
FUND SUMMARY: INTERNATIONAL EQUITIES INDEX FUND
- 57 -
value of the assets of the Fund goes down, you could losemoney.
The following is a summary of the principal risks ofinvesting in the Fund.
Equity Securities Risk. The Fund invests principally inequity securities and is therefore subject to the risk thatstock prices will fall and may underperform other assetclasses. Individual stock prices fluctuate from day-to-dayand may decline significantly. The prices of individualstocks may be negatively affected by poor companyresults or other factors affecting individual prices, as wellas industry and/or economic trends and developmentsaffecting industries or the securities market as a whole.
Index Risk. In attempting to track the performance of theindex, the Fund may be more susceptible to adversedevelopments concerning a particular security, companyor industry because the Fund generally will not use anydefensive strategies to mitigate its risk exposure.
Failure to Match Index Performance Risk. The ability ofthe Fund to match the performance of the UnderlyingIndex may be affected by, among other things, changes insecurities markets, the manner in which performance ofthe Underlying Index is calculated, changes in thecomposition of the Underlying Index, the amount andtiming of cash flows into and out of the Fund,commissions, portfolio expenses, and any differences inthe pricing of securities by the Fund and the UnderlyingIndex. When the Fund employs an “optimization” strategy,the Fund is subject to an increased risk of tracking error,in that the securities selected in the aggregate for theFund may perform differently than the Index.
Foreign Investment Risk. Investment in foreignsecurities involves risks due to several factors, such asilliquidity, the lack of public information, changes in theexchange rates between foreign currencies and the U.S.dollar, unfavorable political, social and legaldevelopments, or economic and financial instability.Foreign companies are not subject to the U.S. accountingand financial reporting standards and may have riskiersettlement procedures. U.S. investments that aredenominated in foreign currencies or that are traded inforeign markets, or securities of U.S. companies that havesignificant foreign operations may be subject to foreigninvestment risk.
Currency Risk. Because the Fund’s foreign investmentsare generally held in foreign currencies, the Fund couldexperience gains or losses based solely on changes in the
exchange rate between foreign currencies and the U.S.dollar. Such gains or losses may be substantial.
Geographic Risk. If the Fund invests a significant portionof its assets in issuers located in a single country, a limitednumber of countries, or a particular geographic region, itassumes the risk that economic, political and socialconditions in those countries or that region may have asignificant impact on its investment performance.
Large- and Mid-Cap Company Risk. Investing in large-andmid-cap companies carries the risk that due to currentmarket conditions these companies may be out of favorwith investors. Large-cap companies may be unable torespond quickly to new competitive challenges or attainthe high growth rate of successful smaller companies.Stocks of mid-cap companies may be more volatile thanthose of larger companies due to, among other reasons,narrower product lines, more limited financial resourcesand fewer experienced managers.
Market Risk. The Fund’s share price can fall because ofweakness in the broad market, a particular industry, orspecific holdings or due to adverse political or economicdevelopments here or abroad, changes in investorpsychology, or heavy institutional selling and otherconditions or events (including, for example, militaryconfrontations, war, terrorism, disease/virus, outbreaksand epidemics). The prices of individual securities mayfluctuate, sometimes dramatically, from day to day. Theprices of stocks and other equity securities tend to bemore volatile than those of fixed-income securities.
The coronavirus pandemic and the related governmentaland public responses have had and may continue to havean impact on the Fund’s investments and net asset valueand have led and may continue to lead to increasedmarket volatility and the potential for illiquidity in certainclasses of securities and sectors of the market.Preventative or protective actions that governments maytake in respect of pandemic or epidemic diseases mayresult in periods of business disruption, businessclosures, inability to obtain raw materials, supplies andcomponent parts, and reduced or disrupted operations forthe issuers in which the Fund invests. Governmentintervention in markets may impact interest rates, marketvolatility and security pricing. The occurrence,reoccurrence and pendency of such diseases couldadversely affect the economies (including throughchanges in business activity and increasedunemployment) and financial markets either in specificcountries or worldwide.
FUND SUMMARY: INTERNATIONAL EQUITIES INDEX FUND
- 58 -
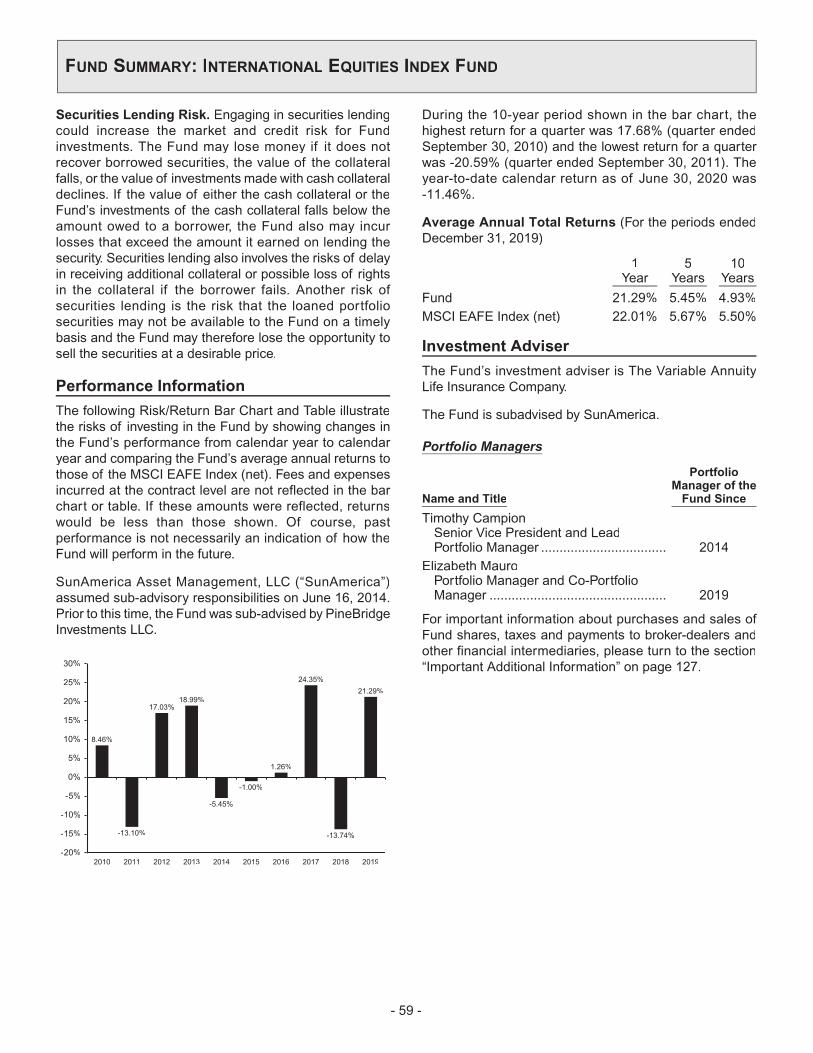
Securities Lending Risk. Engaging in securities lendingcould increase the market and credit risk for Fundinvestments. The Fund may lose money if it does notrecover borrowed securities, the value of the collateralfalls, or the value of investments made with cash collateraldeclines. If the value of either the cash collateral or theFund’s investments of the cash collateral falls below theamount owed to a borrower, the Fund also may incurlosses that exceed the amount it earned on lending thesecurity. Securities lending also involves the risks of delayin receiving additional collateral or possible loss of rightsin the collateral if the borrower fails. Another risk ofsecurities lending is the risk that the loaned portfoliosecurities may not be available to the Fund on a timelybasis and the Fund may therefore lose the opportunity tosell the securities at a desirable price.
Performance Information
The following Risk/Return Bar Chart and Table illustratethe risks of investing in the Fund by showing changes inthe Fund’s performance from calendar year to calendaryear and comparing the Fund’s average annual returns tothose of the MSCI EAFE Index (net). Fees and expensesincurred at the contract level are not reflected in the barchart or table. If these amounts were reflected, returnswould be less than those shown. Of course, pastperformance is not necessarily an indication of how theFund will perform in the future.
SunAmerica Asset Management, LLC (“SunAmerica”)assumed sub-advisory responsibilities on June 16, 2014.Prior to this time, the Fund was sub-advised by PineBridgeInvestments LLC.
8.46%
-13.10%
17.03%18.99%
-5.45%
-1.00%
1.26%
24.35%
-13.74%
21.29%
-20%
-15%
-10%
-5%
0%
5%
10%
15%
20%
25%
30%
2010 2011 2012 2013 2014 2015 2016 2017 2018 2019
During the 10-year period shown in the bar chart, thehighest return for a quarter was 17.68% (quarter endedSeptember 30, 2010) and the lowest return for a quarterwas -20.59% (quarter ended September 30, 2011). Theyear-to-date calendar return as of June 30, 2020 was-11.46%.
Average Annual Total Returns (For the periods endedDecember 31, 2019)
1Year
5Years
10Years
Fund 21.29% 5.45% 4.93%MSCI EAFE Index (net) 22.01% 5.67% 5.50%
Investment Adviser
The Fund’s investment adviser is The Variable AnnuityLife Insurance Company.
The Fund is subadvised by SunAmerica.
Portfolio Managersg
Name and Title
PortfolioManager of theFund Since
Timothy CampionSenior Vice President and LeadPortfolio Manager .................................. 2014
Elizabeth MauroPortfolio Manager and Co-PortfolioManager ................................................ 2019
For important information about purchases and sales ofFund shares, taxes and payments to broker-dealers andother financial intermediaries, please turn to the section“Important Additional Information” on page 127.
FUND SUMMARY: INTERNATIONAL EQUITIES INDEX FUND
- 59 -

Investment Objective
The Fund seeks high current income through investmentsprimarily in investment grade debt securities issued orguaranteed by foreign governments.
Fees and Expenses of the Fund
This table describes the fees and expenses that you maypay if you buy and hold shares of the Fund. The Fund’sannual operating expenses do not reflect the separateaccount fees charged in the variable annuity or variablelife insurance policy (“Variable Contracts”) in which theFund is offered. If separate account fees were shown, theFund’s annual operating expenses would be higher.Please see your Variable Contract prospectus for moredetails on the separate account fees.
Annual Fund Operating Expenses (expenses that yougpay each year as a percentage of the value of yourinvestment)
Management Fees 0.50%Other Expenses 0.15%Total Annual Fund Operating Expenses 0.65%
Expense Example
This Example is intended to help you compare the cost ofinvesting in the Fund with the cost of investing in othermutual funds. The Example assumes that you invest$10,000 in the Fund for the time periods indicated andthen redeem all of your shares at the end of those periods.The Example also assumes that your investment has a 5%return each year and that the Fund’s operating expensesremain the same. The Example does not reflect chargesimposed by the Variable Contract. If the Variable Contractfees were reflected, the expenses would be higher. Seethe Variable Contract prospectus for information on suchcharges. Although your actual costs may be higher orlower, based on these assumptions and the net expensesshown in the fee table, your costs would be:
1 Year 3 Years 5 Years 10 Years
$66 $208 $362 $810
Portfolio Turnover
The Fund pays transaction costs, such as commissions,when it buys and sells securities (or “turns over” itsportfolio). These costs, which are not reflected in annualfund operating expenses or in the Example, affect theFund’s performance.
During the most recent fiscal year, the Fund’s portfolioturnover rate was 105% of the average value of itsportfolio.
Principal Investment Strategies of the Fund
The Fund aims to give you foreign investmentopportunities primarily in investment grade governmentand government sponsored debt securities. Also, theFund attempts to have all of its investments payable inforeign currencies. The Fund may also convert its cash toforeign currency.
Under normal circumstances, at least 80% of net assetsof the Fund must be government issued, sponsored, orguaranteed. The Fund invests at least 65% of total assetsin investment grade debt securities. The Fund may investup to 35% of total assets in below investment gradesecurities (“junk bonds”). Examples of Fund investmentsinclude foreign debt and foreign money market securities,high quality domestic money market securities and debtobligations issued or guaranteed by the U.S. Government,and foreign currency exchange transactions.
Additionally, the Subadviser may attempt to hedgecurrency exposure, and may invest up to 50% of totalassets in futures and options (derivatives), for currencyhedging purposes. The Fund may invest significantly ingovernment securities of emerging market countries.
The Fund is a non-diversified fund, which means that itmay invest in a smaller number of issuers than adiversified fund.
In order to generate additional income, the Fund may lendportfolio securities to broker-dealers and other financialinstitutions provided that the value of the loaned securitiesdoes not exceed 30% of the Fund’s total assets. Theseloans earn income for the Fund and are collateralized bycash and securities issued or guaranteed by the U.S.Government or its agencies or instrumentalities. Investorswill be given at least 60 days’ written notice in advance ofany change to the Fund’s 80% investment policy set forthabove.
Principal Risks of Investing in the Fund
As with any mutual fund, there can be no assurance thatthe Fund’s investment objective will be met or that the netreturn on an investment in the Fund will exceed what couldhave been obtained through other investment or savingsvehicles. Shares of the Fund are not bank deposits andare not guaranteed or insured by any bank, governmententity or the Federal Deposit Insurance Corporation. If thevalue of the assets of the Fund goes down, you could losemoney.
The following is a summary of the principal risks ofinvesting in the Fund.
FUND SUMMARY: INTERNATIONAL GOVERNMENT BOND FUND
- 60 -

Call or Prepayment Risk. During periods of fallinginterest rates, a bond issuer may “call” a bond to repay itbefore its maturity date. The Fund may only be able toinvest the bond’s proceeds at lower interest rates,resulting in a decline in the Fund’s income.
Credit Risk. The Fund may suffer losses if the issuer ofa fixed income security owned by the Fund is unable tomake interest or principal payments.
Currency Risk. Because the Fund’s foreign investmentsare generally held in foreign currencies, the Fund couldexperience gains or losses based solely on changes in theexchange rate between foreign currencies and the U.S.dollar. Such gains or losses may be substantial.
Derivatives Risk. The prices of derivatives may move inunexpected ways due to the use of leverage and otherfactors and may result in increased volatility or losses. TheFund may not be able to terminate or sell derivativepositions, and a liquid secondary market may not alwaysexist for derivative positions.
Hedging Risk. A hedge is an investment made in order toreduce the risk of adverse price movements in a security,by taking an offsetting position (often through a derivativeinstrument, such as an option or a short sale). Whilehedging strategies can be very useful and inexpensiveways of reducing risk, they are sometimes ineffective dueto unexpected changes in the market. Hedging alsoinvolves the risk that changes in the value of the relatedsecurity will not match those of the instruments beinghedged as expected, in which case any losses on theinstruments being hedged may not be reduced.
Foreign Investment Risk. Investment in foreignsecurities involves risks due to several factors, such asilliquidity, the lack of public information, changes in theexchange rates between foreign currencies and the U.S.dollar, unfavorable political, social and legaldevelopments, or economic and financial instability.Foreign companies are not subject to the U.S. accountingand financial reporting standards and may have riskiersettlement procedures. U.S. investments that aredenominated in foreign currencies or that are traded inforeign markets, or securities of U.S. companies that havesignificant foreign operations may be subject to foreigninvestment risk.
Emerging Markets Risk. In addition to the risksassociated with investments in foreign securities,emerging market securities are subject to additional risks,which cause these securities generally to be more volatilethan securities of issuers located in developed countries.
Foreign Sovereign Debt Risk. Foreign sovereign debtsecurities are subject to the risk that a governmental entity
may delay or refuse to pay interest or to repay principal onits sovereign debt, due, for example, to cash flowproblems, insufficient foreign currency reserves, political,social and economic considerations, the relative size ofthe governmental entity’s debt position in relation to theeconomy or the failure to put in place economic reformsrequired by the International Monetary Fund or othermultilateral agencies. If a governmental entity defaults, itmay ask for more time in which to pay or for further loans.
Interest Rate Risk. The value of fixed-income securitiesmay decline when interest rates go up or increase wheninterest rates go down. The interest earned on fixed-income securities may decline when interest rates godown or increase when interest rates go up. Longer-termand lower coupon bonds tend to be more sensitive tochanges in interest rates. The Fund may be subject to agreater risk of rising interest rates due to the currentperiod of historically low rates and the effect of potentialgovernment fiscal policy initiatives and resulting marketreaction to these initiatives. The Fund may be subject to agreater risk of rising interest rates due to the currentperiod of historically low rates and the effect of potentialgovernment fiscal policy initiatives and resulting marketreaction to these initiatives.
Junk Bond Risk. High yielding, high risk fixed-incomesecurities (often referred to as “junk bonds”) may involvesignificantly greater credit risk, market risk and interestrate risk compared to higher rated fixed-income securities.Issuers of junk bonds are less secure financially and theirsecurities are more sensitive to downturns in the economy.The market for junk bonds may not be as liquid as that formore highly rated securities.
Market Risk. The Fund’s share price can fall because ofweakness in the broad market, a particular industry, orspecific holdings or due to adverse political or economicdevelopments here or abroad, changes in investorpsychology, or heavy institutional selling and otherconditions or events (including, for example, militaryconfrontations, war, terrorism, disease/virus, outbreaksand epidemics). The prices of individual securities mayfluctuate, sometimes dramatically, from day to day. Theprices of stocks and other equity securities tend to bemore volatile than those of fixed-income securities.
The coronavirus pandemic and the related governmentaland public responses have had and may continue to havean impact on the Fund’s investments and net asset valueand have led and may continue to lead to increasedmarket volatility and the potential for illiquidity in certainclasses of securities and sectors of the market.Preventative or protective actions that governments maytake in respect of pandemic or epidemic diseases mayresult in periods of business disruption, business
FUND SUMMARY: INTERNATIONAL GOVERNMENT BOND FUND
- 61 -
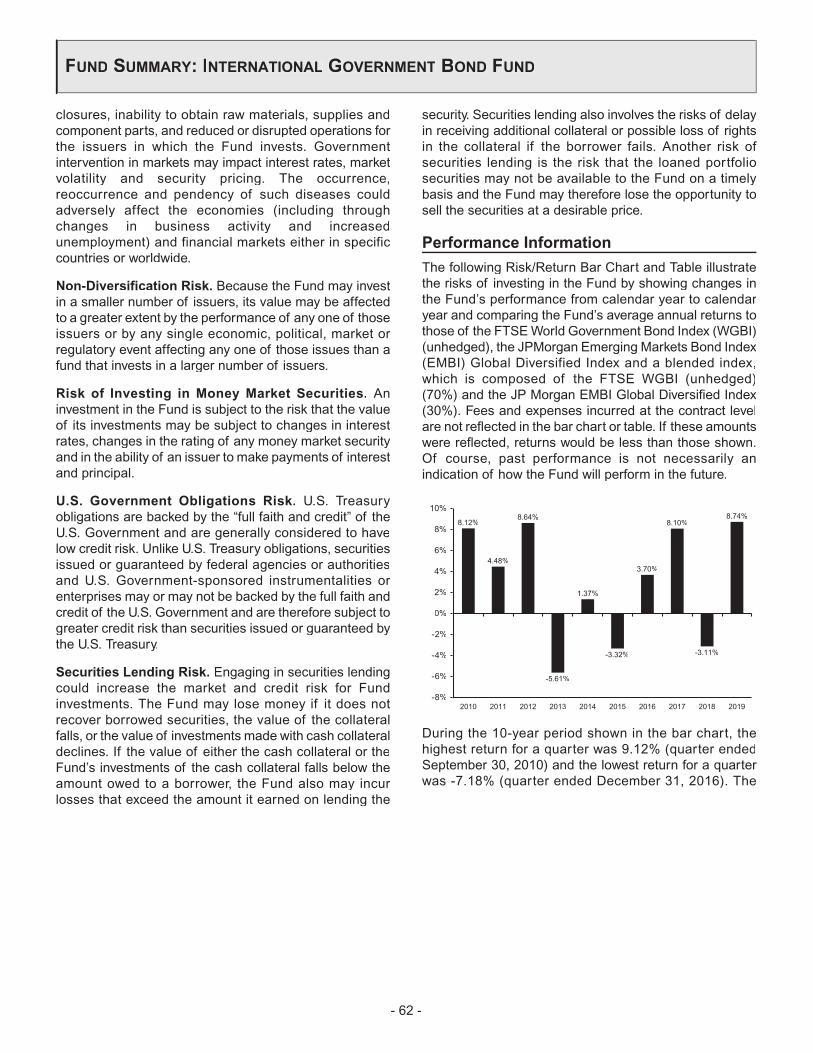
closures, inability to obtain raw materials, supplies andcomponent parts, and reduced or disrupted operations forthe issuers in which the Fund invests. Governmentintervention in markets may impact interest rates, marketvolatility and security pricing. The occurrence,reoccurrence and pendency of such diseases couldadversely affect the economies (including throughchanges in business activity and increasedunemployment) and financial markets either in specificcountries or worldwide.
Non-Diversification Risk. Because the Fund may investin a smaller number of issuers, its value may be affectedto a greater extent by the performance of any one of thoseissuers or by any single economic, political, market orregulatory event affecting any one of those issues than afund that invests in a larger number of issuers.
Risk of Investing in Money Market Securities. Aninvestment in the Fund is subject to the risk that the valueof its investments may be subject to changes in interestrates, changes in the rating of any money market securityand in the ability of an issuer to make payments of interestand principal.
U.S. Government Obligations Risk. U.S. Treasuryobligations are backed by the “full faith and credit” of theU.S. Government and are generally considered to havelow credit risk. Unlike U.S. Treasury obligations, securitiesissued or guaranteed by federal agencies or authoritiesand U.S. Government-sponsored instrumentalities orenterprises may or may not be backed by the full faith andcredit of the U.S. Government and are therefore subject togreater credit risk than securities issued or guaranteed bythe U.S. Treasury.
Securities Lending Risk. Engaging in securities lendingcould increase the market and credit risk for Fundinvestments. The Fund may lose money if it does notrecover borrowed securities, the value of the collateralfalls, or the value of investments made with cash collateraldeclines. If the value of either the cash collateral or theFund’s investments of the cash collateral falls below theamount owed to a borrower, the Fund also may incurlosses that exceed the amount it earned on lending the
security. Securities lending also involves the risks of delayin receiving additional collateral or possible loss of rightsin the collateral if the borrower fails. Another risk ofsecurities lending is the risk that the loaned portfoliosecurities may not be available to the Fund on a timelybasis and the Fund may therefore lose the opportunity tosell the securities at a desirable price.
Performance Information
The following Risk/Return Bar Chart and Table illustratethe risks of investing in the Fund by showing changes inthe Fund’s performance from calendar year to calendaryear and comparing the Fund’s average annual returns tothose of the FTSEWorld Government Bond Index (WGBI)(unhedged), the JPMorgan Emerging Markets Bond Index(EMBI) Global Diversified Index and a blended index,which is composed of the FTSE WGBI (unhedged)(70%) and the JP Morgan EMBI Global Diversified Index(30%). Fees and expenses incurred at the contract levelare not reflected in the bar chart or table. If these amountswere reflected, returns would be less than those shown.Of course, past performance is not necessarily anindication of how the Fund will perform in the future.
8.12%
4.48%
8.64%
-5.61%
1.37%
-3.32%
3.70%
8.10%
-3.11%
8.74%
-8%
-6%
-4%
-2%
0%
2%
4%
6%
8%
10%
2010 2011 2012 2013 2014 2015 2016 2017 2018 2019
During the 10-year period shown in the bar chart, thehighest return for a quarter was 9.12% (quarter endedSeptember 30, 2010) and the lowest return for a quarterwas -7.18% (quarter ended December 31, 2016). The
FUND SUMMARY: INTERNATIONAL GOVERNMENT BOND FUND
- 62 -
year-to-date calendar return as of June 30, 2020 was2.68%.
Average Annual Total Returns (For the periods endedDecember 31, 2019)
1Year
5Years
10Years
Fund 8.74% 2.69% 2.98%Blended Index (reflects nodeduction for fees, expensesor taxes) 8.59% 3.30% 3.37%
FTSE WGBI (unhedged)(reflects no deduction forfees, expenses or taxes) 5.90% 2.03% 1.85%
JPMorgan EMBI GlobalDiversified Index (reflects nodeduction for fees, expensesor taxes) 15.04% 6.24% 6.90%
Investment Adviser
The Fund’s investment adviser is The Variable AnnuityLife Insurance Company.
The Fund is subadvised by PineBridge Investments LLC.
Portfolio Managersg
Name and Title
PortfolioManager of theFund Since
Anders FaergemannManaging Director and SeniorSovereign Portfolio Manager,Emerging Markets Fixed Income........... 2009
Dmitri Savin, CFASenior Vice President and PortfolioManager, Emerging Markets FixedIncome................................................... 2016
For important information about purchases and sales ofFund shares, taxes and payments to broker-dealers andother financial intermediaries, please turn to the section“Important Additional Information” on page 127.
FUND SUMMARY: INTERNATIONAL GOVERNMENT BOND FUND
- 63 -

Investment Objective
The Fund seeks capital appreciation.
Fees and Expenses of the Fund
This table describes the fees and expenses that you maypay if you buy and hold shares of the Fund. The Fund’sannual operating expenses do not reflect the separateaccount fees charged in the variable annuity or variablelife insurance policy (“Variable Contracts”) in which theFund is offered. If separate account fees were shown, theFund’s annual operating expenses would be higher.Please see your Variable Contract prospectus for moredetails on the separate account fees.
Annual Fund Operating Expenses (expenses that yougpay each year as a percentage of the value of yourinvestment)
Management Fees 0.93%Other Expenses 0.13%Total Annual Fund Operating Expenses 1.06%Fee Waivers and/or Expense Reimbursements1 -0.20%Total Annual Fund Operating ExpensesAfter Fee Waivers and/or ExpenseReimbursements1 0.86%
1 The Fund’s investment adviser, The Variable Annuity Life InsuranceCompany, has contractually agreed to waive its advisory fee throughSeptember 30, 2021, so that the advisory fee payable by the Fund toVALIC equals 0.75% of average monthly assets on the first$250 million, 0.70% on the next $250 million, 0.65% on the next$500 million and 0.60% thereafter. This agreement may be modifiedor discontinued prior to such time only with the approval of the Boardof Directors of the Fund, including a majority of the directors who arenot “interested persons” of the Fund as defined in the InvestmentCompany Act of 1940, as amended.
Expense Example
This Example is intended to help you compare the cost ofinvesting in the Fund with the cost of investing in othermutual funds. The Example assumes that you invest$10,000 in the Fund for the time periods indicated andthen redeem all of your shares at the end of those periods.The Example also assumes that your investment has a 5%return each year and that the Fund’s operating expensesinclude fee waivers for one year. The Example does notreflect charges imposed by the Variable Contract. If theVariable Contract fees were reflected, the expenses wouldbe higher. See the Variable Contract prospectus forinformation on such charges. Although your actual costsmay be higher or lower, based on these assumptions andthe net expenses shown in the fee table, your costs wouldbe:
1 Year 3 Years 5 Years 10 Years
$88 $317 $565 $1,276
Portfolio Turnover
The Fund pays transaction costs, such as commissions,when it buys and sells securities (or “turns over” itsportfolio). These costs, which are not reflected in annualfund operating expenses or in the Example, affect theFund’s performance.
During the most recent fiscal year, the Fund’s portfolioturnover rate was 22% of the average value of its portfolio.
Principal Investment Strategies of the Fund
The Fund’s subadviser uses a proprietary investmentstrategy to invest in companies that it believes willincrease in value over time. Under normal marketconditions, the subadviser seeks to achieve the Fund’sobjective by investing primarily in established companieson an international basis, with capitalizations within therange of companies included in the MSCI ACWI ex USAIndex. As of August 31, 2020, the market capitalizationrange of the companies in the MSCI ACWI ex USA Indexwas approximately $117.21 million to $539 billion.
The subadviser emphasizes a bottom-up stock selectionprocess, seeking attractive investments on an individualcompany basis. In selecting securities for investment, thesubadviser seeks high-quality, established companiesthat the subadviser believes are undervalued at the timeof purchase. The subadviser typically favors companies itbelieves have sustainable competitive advantages thatcan be monetized through growth. The investmentprocess integrates analysis of sustainability with respectto disruptive change, financial strength, environmentaland social externalities and governance (also referred toas ESG). The subadviser generally considers selling aportfolio holding when it determines that the holding nolonger satisfies its investment criteria because the qualityof the company’s business deteriorates or the pricerelative to the company’s intrinsic value is no longerattractive. The subadviser views incorporating ESG-related potential risks and opportunities within theinvestment process as important to ensure long-termstewardship of capital. Over extended time horizons, thesubadviser believes that ESG risks are more likely tomaterialize and externalities not borne by the companyare more likely to be priced into the value of securities.Since ESG risks could potentially impact the risk andreward profile of investment opportunities, the subadvisertypically engages company management in constructivediscussions on a range of ESG issues the subadviserdeems materially important.
The Fund invests in foreign securities, which may includeemerging market securities. Under normal circumstances,the Fund invests at least 40% of its net assets in the
FUND SUMMARY: INTERNATIONAL GROWTH FUND
- 64 -
securities of issuers from at least three countries outsideof the United States. The Fund considers an issuer to befrom a particular country (including the United States) orgeographic region if: (i) its principal securities tradingmarket is in that country or geographic region; (ii) alone oron a consolidated basis it derives 50% or more of itsannual revenue or profits from goods produced, salesmade or services performed in that country or geographicregion or has at least 50% of its assets in that country orgeographic region; or (iii) it is organized under the laws of,or has a principal office in, that country or geographicregion.
The Fund primarily invests in equity securities and indepositary receipts of foreign issuers, although it mayinvest in equity securities of U.S. issuers. The equitysecurities in which the Fund invests are denominated inboth U.S. and non-U.S. currencies and include commonstock.
In order to generate additional income, the Fund may lendportfolio securities to broker-dealers and other financialinstitutions provided that the value of the loaned securitiesdoes not exceed 30% of the Fund’s total assets. Theseloans earn income for the Fund and are collateralized bycash and securities issued or guaranteed by the U.S.Government or its agencies or instrumentalities.
Principal Risks of Investing in the Fund
As with any mutual fund, there can be no assurance thatthe Fund’s investment objective will be met or that the netreturn on an investment in the Fund will exceed what couldhave been obtained through other investment or savingsvehicles. Shares of the Fund are not bank deposits andare not guaranteed or insured by any bank, governmententity or the Federal Deposit Insurance Corporation. If thevalue of the assets of the Fund goes down, you could losemoney.
The following is a summary of the principal risks ofinvesting in the Fund.
Management Risk. The investment style or strategy usedby the Subadviser may fail to produce the intended result.The Subadviser’s assessment of a particular security orcompany may prove incorrect, resulting in losses orunderperformance.
Foreign Investment Risk. Investment in foreignsecurities involves risks due to several factors, such asilliquidity, the lack of public information, changes in theexchange rates between foreign currencies and the U.S.dollar, unfavorable political, social and legaldevelopments, or economic and financial instability.
Foreign companies are not subject to the U.S. accountingand financial reporting standards and may have riskiersettlement procedures. U.S. investments that aredenominated in foreign currencies or that are traded inforeign markets, or securities of U.S. companies that havesignificant foreign operations may be subject to foreigninvestment risk. Economies and financial markets arebecoming more connected, which increases the likelihoodthat conditions in one country or region can adverselyimpact issuers in different countries and regions.
Focused Fund Risk. The Fund, because it may invest ina limited number of companies, may have more volatilityin its net asset value and is considered to have more riskthan a portfolio that invests in a greater number ofcompanies because changes in the value of a singlesecurity may have a more significant effect, eithernegative or positive, on the Fund’s net asset value. To theextent the Fund invests its assets in fewer securities, theFund is subject to greater risk of loss if any of thosesecurities decline in price.
Currency Risk. Because the Fund’s foreign investmentsare generally held in foreign currencies, the Fund couldexperience gains or losses based solely on changes in theexchange rate between foreign currencies and the U.S.dollar. Such gains or losses may be substantial.
Depositary Receipts Risk. Depositary receipts aregenerally subject to the same risks as the foreignsecurities that they evidence or into which they may beconverted. Depositary receipts may or may not be jointlysponsored by the underlying issuer. The issuers ofunsponsored depositary receipts are not obligated todisclose information that is considered material in theUnited States. Therefore, there may be less informationavailable regarding the issuers and there may not be acorrelation between such information and the marketvalue of the depositary receipts. Certain depositaryreceipts are not listed on an exchange and therefore maybe considered to be illiquid securities.
Emerging Markets Risk. In addition to the risksassociated with investments in foreign securities,emerging market securities are subject to additional risks,which cause these securities generally to be more volatilethan securities of issuers located in developed countries.
Equity Securities Risk. The Fund invests primarily inequity securities and is therefore subject to the risk thatstock prices will fall and may underperform other assetclasses. Individual stock prices fluctuate from day-to-dayand may decline significantly. The prices of individualstocks may be negatively affected by poor company
FUND SUMMARY: INTERNATIONAL GROWTH FUND
- 65 -

results or other factors affecting individual prices, as wellas industry and/or economic trends and developmentsaffecting industries or the securities market as a whole.
Large-Cap Companies Risk. Investing primarily in large-cap companies carries the risk that due to current marketconditions these companies may be out of favor withinvestors. Large-cap companies may be unable torespond quickly to new competitive challenges or attainthe high growth rate of successful smaller companies.
Mid-Cap Company Risk. Investing in mid-cap companiescarries the risk that due to current market conditions thesecompanies may be out of favor with investors. Stocks ofmid-cap companies may be more volatile than those oflarger companies due to, among other reasons, narrowerproduct lines, more limited financial resources and fewerexperienced managers.
Small-Cap Company Risk. Investing in small-capcompanies carries the risk that due to current marketconditions these companies may be out of favor withinvestors. Small companies often are in the early stagesof development with limited product lines, markets, orfinancial resources and managements lacking depth andexperience, which may cause their stock prices to bemorevolatile than those of larger companies. Small companystocks may be less liquid yet subject to abrupt or erraticprice movements. It may take a substantial period of timebefore the Fund realizes a gain on an investment in asmall-cap company, if it realizes any gain at all.
Growth Style Risk. Generally, “growth” stocks are stocksof companies that a subadviser believes have anticipatedearnings ranging from steady to accelerated growth.Many investors buy growth stocks because of anticipatedsuperior earnings growth, but earnings disappointmentsoften result in sharp price declines. Growth companiesusually invest a high portion of earnings in their ownbusinesses so their stocks may lack the dividends that cancushion share prices in a down market. In addition, thevalue of growth stocks may be more sensitive to changesin current or expected earnings than the value of otherstocks, because growth stocks trade at higher pricesrelative to current earnings.
Liquidity Risk. If the active trading market for certainsecurities becomes limited or non-existent, it can becomemore difficult to sell the securities at or near theirperceived value. This may cause the value of suchsecurities and the Fund’s share price to fall dramatically.
Market Risk. The Fund’s share price can fall because ofweakness in the broad market, a particular industry, orspecific holdings or due to adverse political or economicdevelopments here or abroad, changes in investor
psychology, or heavy institutional selling and otherconditions or events (including, for example, militaryconfrontations, war, terrorism, disease/virus, outbreaksand epidemics). The prices of individual securities mayfluctuate, sometimes dramatically, from day to day. Theprices of stocks and other equity securities tend to bemore volatile than those of fixed-income securities.
The coronavirus pandemic and the related governmentaland public responses have had and may continue to havean impact on the Fund’s investments and net asset valueand have led and may continue to lead to increasedmarket volatility and the potential for illiquidity in certainclasses of securities and sectors of the market.Preventative or protective actions that governments maytake in respect of pandemic or epidemic diseases mayresult in periods of business disruption, businessclosures, inability to obtain raw materials, supplies andcomponent parts, and reduced or disrupted operations forthe issuers in which the Fund invests. Governmentintervention in markets may impact interest rates, marketvolatility and security pricing. The occurrence,reoccurrence and pendency of such diseases couldadversely affect the economies (including throughchanges in business activity and increasedunemployment) and financial markets either in specificcountries or worldwide.
Securities Lending Risk. Engaging in securities lendingcould increase the market and credit risk for Fundinvestments. The Fund may lose money if it does notrecover borrowed securities, the value of the collateralfalls, or the value of investments made with cash collateraldeclines. If the value of either the cash collateral or theFund’s investments of the cash collateral falls below theamount owed to a borrower, the Fund also may incurlosses that exceed the amount it earned on lending thesecurity. Securities lending also involves the risks of delayin receiving additional collateral or possible loss of rightsin the collateral if the borrower fails. Another risk ofsecurities lending is the risk that the loaned portfoliosecurities may not be available to the Fund on a timelybasis and the Fund may therefore lose the opportunity tosell the securities at a desirable price.
Performance Information
The following Risk/Return Bar Chart and Table illustratethe risks of investing in the Fund by showing changes inthe Fund’s performance from calendar year to calendaryear and comparing the Fund’s average annual returns tothose of the MSCI ACWI ex USA Index (net). Fees andexpenses incurred at the contract level are not reflected inthe bar chart or table. If these amounts were reflected,returns would be less than those shown. Of course, past
FUND SUMMARY: INTERNATIONAL GROWTH FUND
- 66 -

performance is not necessarily an indication of how theFund will perform in the future.
American Century Investment Management, Inc. servedas subadviser of the Fund from its inception until March 7,2018. Invesco Advisers, Inc. and Massachusetts FinancialServices Company have served as co-subadvisers fromJune 20, 2005 to March 7, 2018. Morgan StanleyInvestment Management Inc. (“MSIM”) assumed solesubadvisory duties of the Fund on March 8, 2018.
12.59%
-9.81%
20.19% 20.75%
-3.46%-0.49%
-2.75%
27.63%
-8.12%
32.64%
-15%
-10%
-5%
0%
5%
10%
15%
20%
25%
30%
35%
40%
2010 2011 2012 2013 2014 2015 2016 2017 2018 2019
During the 10-year period shown in the bar chart, thehighest return for a quarter was 17.20% (quarter endedMarch 31, 2019) and the lowest return for a quarter was-20.37% (quarter ended September 30, 2011). The year-to-date calendar return as of June 30, 2020 was 2.76%.
Average Annual Total Returns (For the periods endedDecember 31, 2019)
1Year
5Years
10Years
Fund 32.64% 8.52% 7.91%MSCI ACWI ex USA Index(net) 21.51% 5.51% 4.97%
Investment Adviser
The Fund’s investment adviser is The Variable AnnuityLife Insurance Company.
The Fund is subadvised by Morgan Stanley InvestmentManagement Inc..
Portfolio Managerg
Name and Title
PortfolioManager of theFund Since
Kristian Heugh, CFAManaging Director and Lead Manager.. 2018
Wendy Wang, CFAExecutive Director and PortfolioManager ................................................ 2018
For important information about purchases and sales ofFund shares, taxes and payments to broker-dealers andother financial intermediaries, please turn to the section“Important Additional Information” on page 127.
FUND SUMMARY: INTERNATIONAL GROWTH FUND
- 67 -

Investment Objective
The Fund seeks to obtain growth of capital throughinvestment, primarily in equity securities of companieswhich meet the social criteria established for the Fund.
Fees and Expenses of the Fund
This table describes the fees and expenses that you maypay if you buy and hold shares of the Fund. The Fund’sannual operating expenses do not reflect the separateaccount fees charged in the variable annuity or variablelife insurance policy (“Variable Contracts”) in which theFund is offered. If separate account fees were shown, theFund’s annual operating expenses would be higher.Please see your Variable Contract prospectus for moredetails on the separate account fees.
Annual Fund Operating Expenses (expenses that yougpay each year as a percentage of the value of yourinvestment)
Management Fees 0.50%Other Expenses 0.13%Total Annual Fund Operating Expenses 0.63%
Expense Example
This Example is intended to help you compare the cost ofinvesting in the Fund with the cost of investing in othermutual funds. The Example assumes that you invest$10,000 in the Fund for the time periods indicated andthen redeem all of your shares at the end of those periods.The Example also assumes that your investment has a 5%return each year and that the Fund’s operating expensesremain the same. The Example does not reflect chargesimposed by the Variable Contract. If the Variable Contractfees were reflected, the expenses would be higher. Seethe Variable Contract prospectus for information on suchcharges. Although your actual costs may be higher orlower, based on these assumptions and the net expensesshown in the fee table, your costs would be:
1 Year 3 Years 5 Years 10 Years
$64 $202 $351 $786
Portfolio Turnover
The Fund pays transaction costs, such as commissions,when it buys and sells securities (or “turns over” itsportfolio). These costs, which are not reflected in annualfund operating expenses or in the Example, affect theFund’s performance.
During the most recent fiscal year, the Fund’s portfolioturnover rate was 68% of the average value of its portfolio.
Principal Investment Strategies of the Fund
The Fund invests in foreign companies that meet theFund’s social criteria of avoiding companies that aresignificantly engaged in the areas listed below. The Fundwill generally invest in the equity securities of large- andmid-cap companies domiciled in Europe, Australasia andthe Far East. The Fund does not invest in companies thatare significantly engaged in:
• the manufacture or distribution of civilianfirearms, military weapons or weapons deliverysystems;
• the manufacture or distribution of alcoholicbeverages or tobacco products;
• the operation of gambling-related businesses;and
• the production of nuclear energy.
The Fund also does not invest in companies that:
• have a history of poor labor-managementrelations;
• engage in businesses or have products that havea severely negative impact on the environment;
• have significant business operations in countrieswhose governments pose human rightsconcerns; operate businesses that have asignificantly adverse impact on the communitiesin which they are located;
• engage in businesses or have products that havea severely negative impact on their customers,which may include companies that have productsthat pose safety or health concerns, engage inpractices that are anti-competitive or havemarketing that is inappropriate or misleading; and
• have a history of poor business ethics, which mayinclude companies that have incidents of briberyor fraud, or poor governance structures.
Under normal circumstances, the Fund will invest at least80% of net assets in the equity securities of companiesthat meet the Fund’s social criteria located in at least threedifferent countries, with at least 40% of net assets inforeign securities, or if conditions are unfavorable, at least30% of net assets in foreign securities. To find out whichcompanies meet the Fund’s social criteria of avoidingcompanies that are significantly engaged in the areaslisted above, the Fund’s Subadviser relies on industryclassifications and research service companies. Acompany is considered to be a foreign security if it isassigned a non-U.S. country classification by MSCI, aprominent provider of investment tools and data services
FUND SUMMARY: INTERNATIONAL SOCIALLY RESPONSIBLE FUND
- 68 -

for institutions worldwide, or another unaffiliated third-party data provider. The designated country classificationwill generally be determined by the country ofincorporation and primary listing of the company. In theevent a company is incorporated in one country and listedin another, however, a company will generally be classifiedin the country of the primary listing of its securities,although additional factors may be considered indetermining the appropriate country classification.
In addition, the Fund may invest up to 20% of net assetsin other securities of companies that meet the Fund’ssocial criteria, including preferred stock, convertiblesecurities, and high quality money market securities andwarrants. Social criteria may cause active or frequenttrading of portfolio securities.
In order to generate additional income, the Fund may lendportfolio securities to broker-dealers and other financialinstitutions provided that the value of the loaned securitiesdoes not exceed 30% of the Fund’s total assets. Theseloans earn income for the Fund and are collateralized bycash and securities issued or guaranteed by the U.S.Government or its agencies or instrumentalities. Investorswill be given at least 60 days’ written notice in advance ofany change to the Fund’s 80% investment policy set forthabove.
Principal Risks of Investing in the Fund
As with any mutual fund, there can be no assurance thatthe Fund’s investment objective will be met or that the netreturn on an investment in the Fund will exceed what couldhave been obtained through other investment or savingsvehicles. Shares of the Fund are not bank deposits andare not guaranteed or insured by any bank, governmententity or the Federal Deposit Insurance Corporation. If thevalue of the assets of the Fund goes down, you could losemoney.
The following is a summary of the principal risks ofinvesting in the Fund.
Equity Securities Risk. The Fund invests primarily inequity securities and is therefore subject to the risk thatstock prices will fall and may underperform other assetclasses. Individual stock prices fluctuate from day-to-dayand may decline significantly. The prices of individualstocks may be negatively affected by poor companyresults or other factors affecting individual prices, as wellas industry and/or economic trends and developmentsaffecting industries or the securities market as a whole.
Social Criteria Risk. Social criteria screening limits theavailability of investment opportunities for the Fund. If theFund changes its social criteria or a company stops
meeting the Fund’s social criteria, the Fund will sell theaffected investments even if this means the Fund losesmoney. Therefore, adhering to the social criteria screeningmay affect the Fund’s performance relative to similarfunds that do not adhere to such criteria.
Foreign Investment Risk. Investment in foreignsecurities involves risks due to several factors, such asilliquidity, the lack of public information, changes in theexchange rates between foreign currencies and the U.S.dollar, unfavorable political, social and legaldevelopments, or economic and financial instability.Foreign companies are not subject to the U.S. accountingand financial reporting standards and may have riskiersettlement procedures. U.S. investments that aredenominated in foreign currencies or that are traded inforeign markets, or securities of U.S. companies that havesignificant foreign operations may be subject to foreigninvestment risk.
Large- and Mid-Cap Company Risk. Investing in large-andmid-cap companies carries the risk that due to currentmarket conditions these companies may be out of favorwith investors. Large-cap companies may be unable torespond quickly to new competitive challenges or attainthe high growth rate of successful smaller companies.Stocks of mid-cap companies may be more volatile thanthose of larger companies due to, among other reasons,narrower product lines, more limited financial resourcesand fewer experienced managers.
Geographic Risk. If the Fund invests a significant portionof its assets in issuers located in a single country, a limitednumber of countries, or a particular geographic region, itassumes the risk that economic, political and socialconditions in those countries or that region may have asignificant impact on its investment performance.
Currency Risk. Because the Fund’s foreign investmentsare generally held in foreign currencies, the Fund couldexperience gains or losses based solely on changes in theexchange rate between foreign currencies and the U.S.dollar. Such gains or losses may be substantial.
Market Risk. The Fund’s share price can fall because ofweakness in the broad market, a particular industry, orspecific holdings or due to adverse political or economicdevelopments here or abroad, changes in investorpsychology, or heavy institutional selling and otherconditions or events (including, for example, militaryconfrontations, war, terrorism, disease/virus, outbreaksand epidemics). The prices of individual securities mayfluctuate, sometimes dramatically, from day to day. Theprices of stocks and other equity securities tend to bemore volatile than those of fixed-income securities.
FUND SUMMARY: INTERNATIONAL SOCIALLY RESPONSIBLE FUND
- 69 -

The coronavirus pandemic and the related governmentaland public responses have had and may continue to havean impact on the Fund’s investments and net asset valueand have led and may continue to lead to increasedmarket volatility and the potential for illiquidity in certainclasses of securities and sectors of the market.Preventative or protective actions that governments maytake in respect of pandemic or epidemic diseases mayresult in periods of business disruption, businessclosures, inability to obtain raw materials, supplies andcomponent parts, and reduced or disrupted operations forthe issuers in which the Fund invests. Governmentintervention in markets may impact interest rates, marketvolatility and security pricing. The occurrence,reoccurrence and pendency of such diseases couldadversely affect the economies (including throughchanges in business activity and increasedunemployment) and financial markets either in specificcountries or worldwide.
Securities Lending Risk. Engaging in securities lendingcould increase the market and credit risk for Fundinvestments. The Fund may lose money if it does notrecover borrowed securities, the value of the collateralfalls, or the value of investments made with cash collateraldeclines. If the value of either the cash collateral or theFund’s investments of the cash collateral falls below theamount owed to a borrower, the Fund also may incurlosses that exceed the amount it earned on lending thesecurity. Securities lending also involves the risks of delayin receiving additional collateral or possible loss of rightsin the collateral if the borrower fails. Another risk ofsecurities lending is the risk that the loaned portfoliosecurities may not be available to the Fund on a timelybasis and the Fund may therefore lose the opportunity tosell the securities at a desirable price.
Convertible Securities Risk. Convertible security valuesmay be affected by market interest rates, issuer defaultsand underlying common stock values; security valuesmay fall if market interest rates rise and rise if marketinterest rates fall. Additionally, an issuer may have the rightto buy back the securities at a time unfavorable to theFund.
Preferred Stock Risk. Unlike common stock, preferredstock generally pays a fixed dividend from a company’searnings and may have a preference over common stockon the distribution of a company’s assets in the event ofbankruptcy or liquidation. Preferred stockholders’liquidation rights are subordinate to the company’s debtholders and creditors. If interest rates rise, the fixeddividend on preferred stocks may be less attractive and
the price of preferred stocks may decline. Preferredstockholders typically do not have voting rights.
Risk of Investing in Money Market Securities. Aninvestment in the Fund is subject to the risk that the valueof its investments may be subject to changes in interestrates, changes in the rating of any money market securityand in the ability of an issuer to make payments of interestand principal.
Warrant Risk. A warrant entitles the holder to purchase aspecified amount of securities at a pre-determined price.Warrants may not track the value of the securities theholder is entitled to purchase and may expire worthless ifthe market price of the securities is below the exerciseprice of the warrant.
Performance Information
The following Risk/Return Bar Chart and Table illustratethe risks of investing in the Fund by showing changes inthe Fund’s performance from calendar year to calendaryear and comparing the Fund’s average annual returns tothose of the MSCI EAFE Index (net). Fees and expensesincurred at the contract level are not reflected in the barchart or table. If these amounts were reflected, returnswould be less than those shown. Of course, pastperformance is not necessarily an indication of how theFund will perform in the future.
SunAmerica Asset Management, LLC (“SunAmerica”)assumed sub-advisory responsibilities on June 16, 2014.Prior to this time, the Fund was sub-advised by PineBridgeInvestments LLC.
12.23%
-6.18%
17.30%
28.87%
7.97%
-0.33%
6.95%
22.71%
-8.45%
25.98%
-15%
-10%
-5%
0%
5%
10%
15%
20%
25%
30%
35%
2010 2011 2012 2013 2014 2015 2016 2017 2018 2019
During the 10-year period shown in the bar chart, thehighest return for a quarter was 13.79% (quarter endedSeptember 30, 2010) and the lowest return for a quarterwas -17.41% (quarter ended September 30, 2011). The
FUND SUMMARY: INTERNATIONAL SOCIALLY RESPONSIBLE FUND
- 70 -

year-to-date calendar return as of June 30, 2020 was-10.76%.
Average Annual Total Returns (For the periods endedDecember 31, 2019)
1Year
5Years
10Years
Fund 25.98% 8.57% 10.00%MSCI EAFE Index (net) 22.01% 5.67% 5.50%
Investment Adviser
The Fund’s investment adviser is The Variable AnnuityLife Insurance Company.
The Fund is subadvised by SunAmerica.
Portfolio Managersg
Name and Title
PortfolioManager of theFund Since
Timothy CampionSenior Vice President and LeadPortfolio Manager .................................. 2014
Elizabeth MauroCo-Portfolio Manager ............................ 2019
For important information about purchases and sales ofFund shares, taxes and payments to broker-dealers andother financial intermediaries, please turn to the section“Important Additional Information” on page 127.
FUND SUMMARY: INTERNATIONAL SOCIALLY RESPONSIBLE FUND
- 71 -

Investment Objective
The Fund seeks long-term growth of capital.
Fees and Expenses of the Fund
This table describes the fees and expenses that you maypay if you buy and hold shares of the Fund. The Fund’sannual operating expenses do not reflect the separateaccount fees charged in the variable annuity or variablelife insurance policy (“Variable Contracts”) in which theFund is offered. If separate account fees were shown, theFund’s annual operating expenses would be higher.Please see your Variable Contract prospectus for moredetails on the separate account fees.
Annual Fund Operating Expenses (expenses that yougpay each year as a percentage of the value of yourinvestment)
Management Fees 0.69%Other Expenses 0.11%Total Annual Fund Operating Expenses 0.80%Fee Waivers and/or Expense Reimbursements1 -0.07%Total Annual Fund Operating ExpensesAfter Fee Waivers and/or ExpenseReimbursements1 0.73%
1 The Fund’s investment adviser, The Variable Annuity Life InsuranceCompany, has contractually agreed to waive its advisory fee throughSeptember 30, 2021, so that the advisory fee payable by the Fund toVALIC equals 0.66% of average monthly assets on the first$250 million, 0.61% on the next $250 million, 0.56% on the next$500 million and 0.51% thereafter. This agreement may be modifiedor discontinued prior to such time only with the approval of the Boardof Directors of the Fund, including a majority of the directors who arenot “interested persons” of the Fund as defined in the InvestmentCompany Act of 1940, as amended.
Expense Example
This Example is intended to help you compare the cost ofinvesting in the Fund with the cost of investing in othermutual funds. The Example assumes that you invest$10,000 in the Fund for the time periods indicated andthen redeem all of your shares at the end of those periods.The Example also assumes that your investment has a 5%return each year and that the Fund’s operating expensesinclude fee waivers for one year. The Example does notreflect charges imposed by the Variable Contract. If theVariable Contract fees were reflected, the expenses wouldbe higher. See the Variable Contract prospectus forinformation on such charges. Although your actual costsmay be higher or lower, based on these assumptions andthe net expenses shown in the fee table, your costs wouldbe:
1 Year 3 Years 5 Years 10 Years
$75 $248 $437 $983
Portfolio Turnover
The Fund pays transaction costs, such as commissions,when it buys and sells securities (or “turns over” itsportfolio). These costs, which are not reflected in annualfund operating expenses or in the Example, affect theFund’s performance.
During the most recent fiscal year, the Fund’s portfolioturnover rate was 64% of the average value of its portfolio.
Principal Investment Strategies of the Fund
Under normal market conditions, the Fund invests at least80% of its net assets in equity securities of foreignissuers. The Fund may also invest up to 30% of its totalassets in emerging market equity securities. The Fund willinvest in securities of at least three different countries,including the United States. The Fund normally invests incommon stock, preferred stock, rights, warrants andAmerican Depository Receipts (ADRs). The Subadviserconsiders equity securities of foreign issuers (or foreignsecurities) to be equity securities: (1) issued by companieswith their principal place of business or principal office orboth, as determined in their reasonable discretion, in acountry other than the U.S.; or (2) issued by companies forwhich the principal securities trading market is a countryother than the U.S.
The Subadviser uses bottom-up stock selection, based onin-depth fundamental research as the cornerstone of theirinvestment process. During each stage of the process, italso considers the influence on the investment theses oftop-down factors such as macroeconomic forecasts, realeconomic growth prospects, fiscal and monetary policy,currency issues, and demographic and political risks.Sector and country weights result from, rather thandetermine, their stock-selection decisions. TheSubadviser’s investment process seeks companies that itbelieves are undervalued in the marketplace compared totheir intrinsic value. Additionally, the Subadviser seeks toidentify catalysts that will unlock value, which will then berecognized by the market. The Subadviser may purchasesecurities across any market capitalization and may useforward foreign currency exchange rate contracts tohedge against the movement in the value of foreigncurrencies.
The Subadviser conducts ongoing review, research, andanalysis of their portfolio holdings. The Fund may sell astock if it achieves its investment objective for the position,if a stock’s fundamentals or price change significantly, ifthey change their view of a country or sector, or if thestock no longer fits within the risk characteristics of theFund’s portfolio.
FUND SUMMARY: INTERNATIONAL VALUE FUND
- 72 -
In order to generate additional income, the Fund may lendportfolio securities to broker-dealers and other financialinstitutions provided that the value of the loaned securitiesdoes not exceed 30% of the Fund’s total assets. Theseloans earn income for the Fund and are collateralized bycash and securities issued or guaranteed by the U.S.Government or its agencies or instrumentalities. Investorswill be given at least 60 days’ written notice in advance ofany change to the Fund’s 80% investment policy set forthabove.
Principal Risks of Investing in the Fund
As with any mutual fund, there can be no assurance thatthe Fund’s investment objective will be met or that the netreturn on an investment in the Fund will exceed what couldhave been obtained through other investment or savingsvehicles. Shares of the Fund are not bank deposits andare not guaranteed or insured by any bank, governmententity or the Federal Deposit Insurance Corporation. If thevalue of the assets of the Fund goes down, you could losemoney.
The following is a summary of the principal risks ofinvesting in the Fund.
Management Risk. The investment style or strategy usedby the Subadviser may fail to produce the intended result.The Subadviser’s assessment of a particular security orcompany may prove incorrect, resulting in losses orunderperformance.
Equity Securities Risk. The Fund invests predominantlyin equity securities and is therefore subject to the risk thatstock prices will fall and may underperform other assetclasses. Individual stock prices fluctuate from day-to-dayand may decline significantly. The prices of individualstocks may be negatively affected by poor companyresults or other factors affecting individual prices, as wellas industry and/or economic trends and developmentsaffecting industries or the securities market as a whole.
Derivatives Risk. The prices of derivatives may move inunexpected ways due to the use of leverage and otherfactors and may result in increased volatility or losses. TheFund may not be able to terminate or sell derivativepositions, and a liquid secondary market may not alwaysexist for derivative positions.
Large-Cap Companies Risk. Investing in large-capcompanies carries the risk that due to current marketconditions these companies may be out of favor withinvestors. Large-cap companies may be unable torespond quickly to new competitive challenges or attainthe high growth rate of successful smaller companies.
Mid-Cap Company Risk. Investing in mid-cap companiescarries the risk that due to current market conditions thesecompanies may be out of favor with investors. Stocks ofmid-cap companies may be more volatile than those oflarger companies due to, among other reasons, narrowerproduct lines, more limited financial resources and fewerexperienced managers.
Small-Cap Company Risk. Investing in small-capcompanies carries the risk that due to current marketconditions these companies may be out of favor withinvestors. Small companies often are in the early stagesof development with limited product lines, markets, orfinancial resources and managements lacking depth andexperience, which may cause their stock prices to bemorevolatile than those of larger companies. Small companystocks may be less liquid yet subject to abrupt or erraticprice movements. It may take a substantial period of timebefore the Fund realizes a gain on an investment in asmall-cap company, if it realizes any gain at all.
Hedging Risk. A hedge is an investment made in order toreduce the risk of adverse price movements in a currencyor other investment by taking an offsetting position (oftenthrough a derivative instrument, such as an option orforward contract). While hedging strategies can be veryuseful and inexpensive ways of reducing risk, they aresometimes ineffective due to unexpected changes in themarket. Hedging also involves the risk that changes in thevalue of the related security will not match those of theinstruments being hedged as expected, in which case anylosses on the instruments being hedged may not bereduced.
Warrant Risk. A warrant entitles the holder to purchase aspecified amount of securities at a pre-determined price.Warrants may not track the value of the securities theholder is entitled to purchase and may expire worthless ifthe market price of the securities is below the exerciseprice of the warrant.
Emerging Markets Risk. In addition to the risksassociated with investments in foreign securities,emerging market securities are subject to additional risks,which cause these securities generally to be more volatilethan securities of issuers located in developed countries.
Foreign Investment Risk. Investment in foreignsecurities involves risks due to several factors, such asilliquidity, the lack of public information, changes in theexchange rates between foreign currencies and the U.S.dollar, unfavorable political, social and legaldevelopments, or economic and financial instability.Foreign companies are not subject to the U.S. accounting
FUND SUMMARY: INTERNATIONAL VALUE FUND
- 73 -
and financial reporting standards and may have riskiersettlement procedures. U.S. investments that aredenominated in foreign currencies or that are traded inforeign markets, or securities of U.S. companies that havesignificant foreign operations may be subject to foreigninvestment risk.
Currency Risk. Because the Fund’s foreign investmentsare generally held in foreign currencies, the Fund couldexperience gains or losses based solely on changes in theexchange rate between foreign currencies and the U.S.dollar. Such gains or losses may be substantial.
Depositary Receipts Risk. Depositary receipts aregenerally subject to the same risks as the foreignsecurities that they evidence or into which they may beconverted. Depositary receipts may or may not be jointlysponsored by the underlying issuer. The issuers ofunsponsored depositary receipts are not obligated todisclose information that is considered material in theUnited States. Therefore, there may be less informationavailable regarding the issuers and there may not be acorrelation between such information and the marketvalue of the depositary receipts. Certain depositaryreceipts are not listed on an exchange and therefore maybe considered to be illiquid securities.
Geographic Risk. If the Fund invests a significant portionof its assets in issuers located in a single country, a limitednumber of countries, or a particular geographic region, itassumes the risk that economic, political and socialconditions in those countries or that region may have asignificant impact on its investment performance.
Market Risk. The Fund’s share price can fall because ofweakness in the broad market, a particular industry, orspecific holdings or due to adverse political or economicdevelopments here or abroad, changes in investorpsychology, or heavy institutional selling and otherconditions or events (including, for example, militaryconfrontations, war, terrorism, disease/virus, outbreaksand epidemics). The prices of individual securities mayfluctuate, sometimes dramatically, from day to day. Theprices of stocks and other equity securities tend to bemore volatile than those of fixed-income securities.
The coronavirus pandemic and the related governmentaland public responses have had and may continue to havean impact on the Fund’s investments and net asset valueand have led and may continue to lead to increasedmarket volatility and the potential for illiquidity in certainclasses of securities and sectors of the market.Preventative or protective actions that governments maytake in respect of pandemic or epidemic diseases may
result in periods of business disruption, businessclosures, inability to obtain raw materials, supplies andcomponent parts, and reduced or disrupted operations forthe issuers in which the Fund invests. Governmentintervention in markets may impact interest rates, marketvolatility and security pricing. The occurrence,reoccurrence and pendency of such diseases couldadversely affect the economies (including throughchanges in business activity and increasedunemployment) and financial markets either in specificcountries or worldwide.
Value Style Risk. Generally, “value” stocks are stocks ofcompanies that a subadviser believes are currentlyundervalued in the marketplace. A subadviser’s judgmentthat a particular security is undervalued in relation to thecompany’s fundamental economic value may proveincorrect and the price of the company’s stock may fall ormay not approach the value the subadviser has placed onit.
Securities Lending Risk. Engaging in securities lendingcould increase the market and credit risk for Fundinvestments. The Fund may lose money if it does notrecover borrowed securities, the value of the collateralfalls, or the value of investments made with cash collateraldeclines. If the value of either the cash collateral or theFund’s investments of the cash collateral falls below theamount owed to a borrower, the Fund also may incurlosses that exceed the amount it earned on lending thesecurity. Securities lending also involves the risks of delayin receiving additional collateral or possible loss of rightsin the collateral if the borrower fails. Another risk ofsecurities lending is the risk that the loaned portfoliosecurities may not be available to the Fund on a timelybasis and the Fund may therefore lose the opportunity tosell the securities at a desirable price.
Performance Information
The following Risk/Return Bar Chart and Table illustratethe risks of investing in the Fund by showing changes inthe Fund’s performance from calendar year to calendaryear and comparing the Fund’s average annual returns tothose of the MSCI ACWI ex USA Index (net). Fees andexpenses incurred at the contract level are not reflected inthe bar chart or table. If these amounts were reflected,returns would be less than those shown. Of course, pastperformance is not necessarily an indication of how theFund will perform in the future.
Wells Capital Management Incorporated (“WellsCap”)assumed subadvisory duties on September 10, 2018.
FUND SUMMARY: INTERNATIONAL VALUE FUND
- 74 -

From inception through September 9, 2018, TempletonGlobal Advisors Limited was subadviser to the Fund.
7.58%
-13.01%
18.78%
26.20%
-11.63%
-7.31%
12.09%
17.00%
-17.81%
16.42%
-25%
-20%
-15%
-10%
-5%
0%
5%
10%
15%
20%
25%
30%
2010 2011 2012 2013 2014 2015 2016 2017 2018 2019
During the 10-year period shown in the bar chart, thehighest return for a quarter was 15.92% (quarter endedSeptember 30, 2010) and the lowest return for a quarterwas -21.31% (quarter ended September 30, 2011). Theyear-to-date calendar return as of June 30, 2020 was-18.18%.
Average Annual Total Returns (For the periods endedDecember 31, 2019)
1Year
5Years
10Years
Fund 16.42% 3.07% 3.73%MSCI ACWI ex USA Index(net) 21.51% 5.51% 4.97%
Investment Adviser
The Fund’s investment adviser is The Variable AnnuityLife Insurance Company.
The Fund is subadvised by Wells Capital ManagementIncorporated.
Portfolio Managersg
Name and Title
PortfolioManager of theFund Since
Dale A. Winner, CFALead Portfolio Manager ......................... 2018
Venkateshwar (Venk) LalAssociate Portfolio Manager, Head ofEverKey Investment Risk and Strategy . 2018
For important information about purchases and sales ofFund shares, taxes and payments to broker-dealers andother financial intermediaries, please turn to the section“Important Additional Information” on page 127.
FUND SUMMARY: INTERNATIONAL VALUE FUND
- 75 -

Investment Objective
The Fund seeks capital growth with the potential forcurrent income.
Fees and Expenses of the Fund
This table describes the fees and expenses that you maypay if you buy and hold shares of the Fund. The Fund’sannual operating expenses do not reflect the separateaccount fees charged in the variable annuity or variablelife insurance policy (“Variable Contracts”) in which theFund is offered. If separate account fees were shown, theFund’s annual operating expenses would be higher.Please see your Variable Contract prospectus for moredetails on the separate account fees.
Annual Fund Operating Expenses (expenses that yougpay each year as a percentage of the value of yourinvestment)
Management Fees 0.70%Other Expenses 0.15%Total Annual Fund Operating Expenses 0.85%Fee Waivers and/or Expense Reimbursements1 -0.07%Total Annual Fund Operating ExpensesAfter Fee Waivers and/or ExpenseReimbursements1 0.78%
1 Effective on September 1, 2020, the Fund’s investment adviser, TheVariable Annuity Life Insurance Company, has contractually agreedto waive its advisory fee through September 30, 2022, so that theadvisory fee payable by the Fund to VALIC equals 0.63% on the first$250 million of the Fund’s average monthly net assets, 0.58% on thenext $250 million of the Fund’s average monthly net assets, 0.53%on the next $500 million of the Fund’s average monthly net assetsand 0.48% on average monthly net assets over $1 billion. Thisagreement may be modified or discontinued prior to such time onlywith the approval of the Board of Directors of the Fund, including amajority of the directors who are not “interested persons” of the Fundas defined in the Investment Company Act of 1940, as amended.VALIC may not recoup any advisory fees waived with respect to theFund pursuant to this Fee Waiver Agreement.
Expense Example
This Example is intended to help you compare the cost ofinvesting in the Fund with the cost of investing in othermutual funds. The Example assumes that you invest$10,000 in the Fund for the time periods indicated andthen redeem all of your shares at the end of those periods.The Example also assumes that your investment has a 5%return each year and that the Fund’s operating expensesinclude fee waivers for one year. The Example does notreflect charges imposed by the Variable Contract. If theVariable Contract fees were reflected, the expenses wouldbe higher. See the Variable Contract prospectus forinformation on such charges. Although your actual costsmay be higher or lower, based on these assumptions and
the net expenses shown in the fee table, your costs wouldbe:
1 Year 3 Years 5 Years 10 Years
$80 $264 $465 $1,043
Portfolio Turnover
The Fund pays transaction costs, such as commissions,when it buys and sells securities (or “turns over” itsportfolio). These costs, which are not reflected in annualfund operating expenses or in the Example, affect theFund’s performance.
During the most recent fiscal year, the Fund’s portfolioturnover rate was 49% of the average value of its portfolio.
Principal Investment Strategies of the Fund
The Fund invests, under normal circumstances, at least80% of its net assets in the common stocks of large-capU.S. companies. The Fund invests in equity securities ofU.S. companies that have large market capitalizations(generally over $2 billion) that the Subadviser believes areundervalued and have the potential for long-term growthand current income.
In addition, the Fundmay invest up to 20% of its net assetsin foreign securities, including depositary receipts.Depositary receipts are receipts issued by a bank or trustcompany reflecting ownership of underlying securitiesissued by foreign companies. The Fund may from time totime emphasize one or more sectors in selecting itsinvestments, including the financial services sector andthe information technology and technology-relatedsectors.
In order to generate additional income, the Fund may lendportfolio securities to broker-dealers and other financialinstitutions provided that the value of the loaned securitiesdoes not exceed 30% of the Fund’s total assets. Theseloans earn income for the Fund and are collateralized bycash and securities issued or guaranteed by the U.S.Government or its agencies or instrumentalities. Investorswill be given at least 60 days’ written notice in advance ofany change to the Fund’s 80% investment policy set forthabove.
Principal Risks of Investing in the Fund
As with any mutual fund, there can be no assurance thatthe Fund’s investment objective will be met or that the netreturn on an investment in the Fund will exceed what couldhave been obtained through other investment or savingsvehicles. Shares of the Fund are not bank deposits andare not guaranteed or insured by any bank, government
FUND SUMMARY: LARGE CAP CORE FUND
- 76 -

entity or the Federal Deposit Insurance Corporation. If thevalue of the assets of the Fund goes down, you could losemoney.
The following is a summary of the principal risks ofinvesting in the Fund.
Depositary Receipts Risk. Depositary receipts aregenerally subject to the same risks as the foreignsecurities that they evidence or into which they may beconverted. Depositary receipts may or may not be jointlysponsored by the underlying issuer. The issuers ofunsponsored depositary receipts are not obligated todisclose information that is considered material in theUnited States. Therefore, there may be less informationavailable regarding the issuers and there may not be acorrelation between such information and the marketvalue of the depositary receipts. Certain depositaryreceipts are not listed on an exchange and therefore maybe considered to be illiquid securities.
Management Risk. The investment style or strategy usedby the Subadviser may fail to produce the intended result.The Subadviser’s assessment of a particular security orcompany may prove incorrect, resulting in losses orunderperformance.
Equity Securities Risk. The Fund generally invests inequity securities and is therefore subject to the risk thatstock prices will fall and may underperform other assetclasses. Individual stock prices fluctuate from day-to-dayand may decline significantly. The prices of individualstocks may be negatively affected by poor companyresults or other factors affecting individual prices, as wellas industry and/or economic trends and developmentsaffecting industries or the securities market as a whole.
Large-Cap Companies Risk. Investing primarily in large-cap companies carries the risk that due to current marketconditions these companies may be out of favor withinvestors. Large-cap companies may be unable torespond quickly to new competitive challenges or attainthe high growth rate of successful smaller companies.
Currency Risk. Because the Fund’s foreign investmentsare generally held in foreign currencies, the Fund couldexperience gains or losses based solely on changes in theexchange rate between foreign currencies and the U.S.dollar. Such gains or losses may be substantial.
Foreign Investment Risk. Investment in foreignsecurities involves risks due to several factors, such asilliquidity, the lack of public information, changes in theexchange rates between foreign currencies and the U.S.dollar, unfavorable political, social and legaldevelopments, or economic and financial instability.Foreign companies are not subject to the U.S. accounting
and financial reporting standards and may have riskiersettlement procedures. U.S. investments that aredenominated in foreign currencies or that are traded inforeign markets, or securities of U.S. companies that havesignificant foreign operations may be subject to foreigninvestment risk.
Growth Stock Risk. Growth stocks can be volatile forseveral reasons. Since the issuers of growth stocksusually reinvest a high portion of earnings in their ownbusiness, growth stocks may lack the dividend yieldassociated with value stocks that can cushion total returnin a bear market. Also, growth stocks normally carry ahigher price/earnings ratio than many other stocks.Consequently, if earnings expectations are not met, themarket price of growth stocks will often decline more thanother stocks. However, the market frequently rewardsgrowth stocks with price increases when expectations aremet or exceeded.
Market Risk. The Fund’s share price can fall because ofweakness in the broad market, a particular industry, orspecific holdings or due to adverse political or economicdevelopments here or abroad, changes in investorpsychology, or heavy institutional selling and otherconditions or events (including, for example, militaryconfrontations, war, terrorism, disease/virus, outbreaksand epidemics). The prices of individual securities mayfluctuate, sometimes dramatically, from day to day. Theprices of stocks and other equity securities tend to bemore volatile than those of fixed-income securities.
The coronavirus pandemic and the related governmentaland public responses have had and may continue to havean impact on the Fund’s investments and net asset valueand have led and may continue to lead to increasedmarket volatility and the potential for illiquidity in certainclasses of securities and sectors of the market.Preventative or protective actions that governments maytake in respect of pandemic or epidemic diseases mayresult in periods of business disruption, businessclosures, inability to obtain raw materials, supplies andcomponent parts, and reduced or disrupted operations forthe issuers in which the Fund invests. Governmentintervention in markets may impact interest rates, marketvolatility and security pricing. The occurrence,reoccurrence and pendency of such diseases couldadversely affect the economies (including throughchanges in business activity and increasedunemployment) and financial markets either in specificcountries or worldwide.
Sector Risk. Companies with similar characteristics maybe grouped together in broad categories called sectors.Sector risk is the risk that securities of companies withinspecific sectors of the economy can perform differently
FUND SUMMARY: LARGE CAP CORE FUND
- 77 -

than the overall market. This may be due to changes insuch things as the regulatory or competitive environmentor to changes in investor perceptions regarding a sector.Because the Fund may allocate relatively more assets tocertain sectors than others, the Fund’s performance maybe more susceptible to any developments which affectthose sectors emphasized by the Fund.
Securities Lending Risk. Engaging in securities lendingcould increase the market and credit risk for Fundinvestments. The Fund may lose money if it does notrecover borrowed securities, the value of the collateralfalls, or the value of investments made with cash collateraldeclines. If the value of either the cash collateral or theFund’s investments of the cash collateral falls below theamount owed to a borrower, the Fund also may incurlosses that exceed the amount it earned on lending thesecurity. Securities lending also involves the risks of delayin receiving additional collateral or possible loss of rightsin the collateral if the borrower fails. Another risk ofsecurities lending is the risk that the loaned portfoliosecurities may not be available to the Fund on a timelybasis and the Fund may therefore lose the opportunity tosell the securities at a desirable price.
Value Style Risk. Value securities are securities ofcompanies that may have experienced, for example,adverse business, industry or other developments or maybe subject to special risks that have caused the securitiesto be out of favor and, in turn, potentially undervalued. Themarket value of a portfolio security may not meet theSubadviser’s future value assessment of that security, ormay decline. There is also a risk that it may take longerthan expected for the value of these investments to rise tothe believed value. In addition, value securities, at times,may not perform as well as growth securities or the stockmarket in general, and may be out of favor with investorsfor varying periods of time.
Performance Information
The following Risk/Return Bar Chart and Table illustratethe risks of investing in the Fund by showing changes inthe Fund’s performance from calendar year to calendaryear and comparing the Fund’s average annual returns tothose of the Russell 1000® Index. Fees and expensesincurred at the contract level are not reflected in the barchart or table. If these amounts were reflected, returnswould be less than those shown. Of course, pastperformance is not necessarily an indication of how theFund will perform in the future.
Prior to November 14, 2011, the Fund was sub-advised byWells Capital Management Incorporated. Columbia
Management Investment Advisers, LLC (“Columbia”)assumed sub-advisory duties effective November 14,2011.
16.74%
-1.04%
18.67%
36.04%
13.27%
3.05%
8.61%
21.44%
-8.74%
32.58%
-15%
-10%
-5%
0%
5%
10%
15%
20%
25%
30%
35%
40%
2010 2011 2012 2013 2014 2015 2016 2017 2018 2019
During the 10-year period shown in the bar chart, thehighest return for a quarter was 14.70% (quarter endedMarch 31, 2012) and the lowest return for a quarter was-17.15% (quarter ended September 30, 2011). The year-to-date calendar return as of June 30, 2020 was -1.67%.
Average Annual Total Returns (For the periods endedDecember 31, 2019)
1Year
5Years
10Years
Fund 32.58% 10.46% 13.26%Russell 1000® Index(reflects no deduction forfees, expenses or taxes) 31.43% 11.48% 13.54%
Investment Adviser
The Fund’s investment adviser is The Variable AnnuityLife Insurance Company.
The Fund is subadvised by Columbia.
Portfolio Managersg
Name and Title
PortfolioManager of theFund Since
Guy W. Pope, CFASenior Portfolio Manager and Head ofContrarian Core Strategy....................... 2011
For important information about purchases and sales ofFund shares, taxes and payments to broker-dealers andother financial intermediaries, please turn to the section“Important Additional Information” on page 127.
FUND SUMMARY: LARGE CAP CORE FUND
- 78 -

Investment Objective
The Fund seeks to provide long-term growth of capital.
Fees and Expenses of the Fund
This table describes the fees and expenses that you maypay if you buy and hold shares of the Fund. The Fund’sannual operating expenses do not reflect the separateaccount fees charged in the variable annuity or variablelife insurance policy (“Variable Contracts”) in which theFund is offered. If separate account fees were shown, theFund’s annual operating expenses would be higher.Please see your Variable Contract prospectus for moredetails on the separate account fees.
Annual Fund Operating Expenses (expenses that yougpay each year as a percentage of the value of yourinvestment)
Management Fees 0.64%Other Expenses 0.11%Total Annual Fund Operating Expenses 0.75%
Expense Example
This Example is intended to help you compare the cost ofinvesting in the Fund with the cost of investing in othermutual funds. The Example assumes that you invest$10,000 in the Fund for the time periods indicated andthen redeem all of your shares at the end of those periods.The Example also assumes that your investment has a 5%return each year and that the Fund’s operating expensesremain the same. The Example does not reflect chargesimposed by the Variable Contract. If the Variable Contractfees were reflected, the expenses would be higher. Seethe Variable Contract prospectus for information on suchcharges. Although your actual costs may be higher orlower, based on these assumptions and the net expensesshown in the fee table, your costs would be:
1 Year 3 Years 5 Years 10 Years
$77 $240 $417 $930
Portfolio Turnover
The Fund pays transaction costs, such as commissions,when it buys and sells securities (or “turns over” itsportfolio). These costs, which are not reflected in annualfund operating expenses or in the Example, affect theFund’s performance.
During the most recent fiscal year, the Fund’s portfolioturnover rate was 37% of the average value of its portfolio.
Principal Investment Strategies of the Fund
The Fund seeks to meet its objective by investing,normally, at least 80% of its net assets in securities oflarge-cap companies. In complying with this 80%investment requirement, the Fund will invest primarily incommon stocks.
Generally, large-cap companies will include companieswhose market capitalizations, at the time of purchase, areequal to or greater than the market capitalization of thesmallest company in the Russell 1000® Index during themost recent 12-month period. As of May 8, 2020, themarket capitalization range of the companies in theRussell 1000® Index was approximately $1.8 billion to$1.400.5 billion.
The Fund’s Subadviser focuses on investing the Fund’sassets in the stocks of companies it believes to haveabove average earnings growth potential compared toother companies. Growth companies tend to have stockprices that are high relative to their earnings, dividends,book value, or other financial measures.
The Fund’s Subadviser uses an active bottom-upinvestment approach to buying and selling investments forthe Fund. Investments are selected primarily based onfundamental analysis of individual issuers. Quantitativescreening tools that systematically evaluate issuers mayalso be considered. The Fund’s Subadviser may invest asignificant percentage of the Fund’s assets in a singleissuer or a small number of issuers
The Fund may invest up to 25% of its total assets inforeign securities.
In order to generate additional income, the Fund may lendportfolio securities to broker-dealers and other financialinstitutions provided that the value of the loaned securitiesdoes not exceed 30% of the Fund’s total assets. Theseloans earn income for the Fund and are collateralized bycash and securities issued or guaranteed by the U.S.Government or its agencies or instrumentalities. Investorswill be given at least 60 days’ written notice in advance ofany change to the Fund’s 80% investment policy set forthabove.
Principal Risks of Investing in the Fund
As with any mutual fund, there can be no assurance thatthe Fund’s investment objective will be met or that the netreturn on an investment in the Fund will exceed what couldhave been obtained through other investment or savings
FUND SUMMARY: LARGE CAPITAL GROWTH FUND
- 79 -

vehicles. Shares of the Fund are not bank deposits andare not guaranteed or insured by any bank, governmententity or the Federal Deposit Insurance Corporation. If thevalue of the assets of the Fund goes down, you could losemoney.
The following is a summary of the principal risks ofinvesting in the Fund.
Management Risk. The investment style or strategy usedby the Subadviser may fail to produce the intended result.The Subadviser’s assessment of a particular security orcompany may prove incorrect, resulting in losses orunderperformance.
Dividend-paying Stocks Risk. There is no guaranteethat the issuers of the stocks held by the Fund will declaredividends in the future or that, if dividends are declared,they will remain at their current levels or increase overtime. Dividend-paying stocks may not participate in abroad market advance to the same degree as otherstocks, and a sharp rise in interest rates or economicdownturn could cause a company to unexpectedly reduceor eliminate its dividend.
Equity Securities Risk. The Fund invests primarily inequity securities and is therefore subject to the risk thatstock prices will fall and may underperform other assetclasses. Individual stock prices fluctuate from day-to-dayand may decline significantly. The prices of individualstocks may be negatively affected by poor companyresults or other factors affecting individual prices, as wellas industry and/or economic trends and developmentsaffecting industries or the securities market as a whole.
Currency Risk. Because the Fund’s foreign investmentsare generally held in foreign currencies, the Fund couldexperience gains or losses based solely on changes in theexchange rate between foreign currencies and the U.S.dollar. Such gains or losses may be substantial.
Focused Fund Risk. The Fund, because it may invest ina limited number of companies, may have more volatilityin its net asset value and is considered to have more riskthan a portfolio that invests in a greater number ofcompanies because changes in the value of a singlesecurity may have a more significant effect, eithernegative or positive, on the Fund’s net asset value. To theextent the Fund invests its assets in fewer securities, theFund is subject to greater risk of loss if any of thosesecurities decline in price.
Foreign Investment Risk. Investment in foreignsecurities involves risks due to several factors, such asilliquidity, the lack of public information, changes in theexchange rates between foreign currencies and the U.S.dollar, unfavorable political, social and legal
developments, or economic and financial instability.Foreign companies are not subject to the U.S. accountingand financial reporting standards and may have riskiersettlement procedures. U.S. investments that aredenominated in foreign currencies or that are traded inforeign markets, or securities of U.S. companies that havesignificant foreign operations may be subject to foreigninvestment risk.
Large-Cap Companies Risk. Investing primarily in large-cap companies carries the risk that due to current marketconditions these companies may be unable to respondquickly to new competitive challenges or attain the highgrowth rate of successful smaller companies.
Growth Stock Risk. Growth stocks can be volatile forseveral reasons. Since the issuers of growth stocksusually reinvest a high portion of earnings in their ownbusiness, growth stocks may lack the dividend yieldassociated with value stocks that can cushion total returnin a bear market. Also, growth stocks normally carry ahigher price/earnings ratio than many other stocks.Consequently, if earnings expectations are not met, themarket price of growth stocks will often decline more thanother stocks. However, the market frequently rewardsgrowth stocks with price increases when expectations aremet or exceeded.
Market Risk. The Fund’s share price can fall because ofweakness in the broad market, a particular industry, orspecific holdings or due to adverse political or economicdevelopments here or abroad, changes in investorpsychology, or heavy institutional selling and otherconditions or events (including, for example, militaryconfrontations, war, terrorism, disease/virus, outbreaksand epidemics). The prices of individual securities mayfluctuate, sometimes dramatically, from day to day. Theprices of stocks and other equity securities tend to bemore volatile than those of fixed-income securities.
The coronavirus pandemic and the related governmentaland public responses have had and may continue to havean impact on the Fund’s investments and net asset valueand have led and may continue to lead to increasedmarket volatility and the potential for illiquidity in certainclasses of securities and sectors of the market.Preventative or protective actions that governments maytake in respect of pandemic or epidemic diseases mayresult in periods of business disruption, businessclosures, inability to obtain raw materials, supplies andcomponent parts, and reduced or disrupted operations forthe issuers in which the Fund invests. Governmentintervention in markets may impact interest rates, marketvolatility and security pricing. The occurrence,reoccurrence and pendency of such diseases couldadversely affect the economies (including through
FUND SUMMARY: LARGE CAPITAL GROWTH FUND
- 80 -

changes in business activity and increasedunemployment) and financial markets either in specificcountries or worldwide.
Securities Lending Risk. Engaging in securities lendingcould increase the market and credit risk for Fundinvestments. The Fund may lose money if it does notrecover borrowed securities, the value of the collateralfalls, or the value of investments made with cash collateraldeclines. If the value of either the cash collateral or theFund’s investments of the cash collateral falls below theamount owed to a borrower, the Fund also may incurlosses that exceed the amount it earned on lending thesecurity. Securities lending also involves the risks of delayin receiving additional collateral or possible loss of rightsin the collateral if the borrower fails. Another risk ofsecurities lending is the risk that the loaned portfoliosecurities may not be available to the Fund on a timelybasis and the Fund may therefore lose the opportunity tosell the securities at a desirable price.
Performance Information
The following Risk/Return Bar Chart and Table illustratethe risks of investing in the Fund by showing changes inthe Fund’s performance from calendar year to calendaryear and comparing the Fund’s average annual returns tothose of the Russell 1000® Growth Index. Fees andexpenses incurred at the contract level are not reflected inthe bar chart or table. If these amounts were reflected,returns would be less than those shown. Of course, pastperformance is not necessarily an indication of how theFund will perform in the future.
On September 16, 2013, Massachusetts FinancialServices Company (“MFS”) became the Fund’ssubadviser. Prior to such time, the Fund was sub-advisedby SunAmerica Asset Management, LLC (“SunAmerica”)and Invesco Advisers, Inc.
15.49%
-6.12%
12.43%
31.56%
11.45%
-0.01%
6.15%
28.55%
0.71%
39.96%
-10%
-5%
0%
5%
10%
15%
20%
25%
30%
35%
40%
45%
2010 2011 2012 2013 2014 2015 2016 2017 2018 2019
During the 10-year period shown in the bar chart, thehighest return for a quarter was 17.63% (quarter ended
March 31, 2019) and the lowest return for a quarter was-16.46% (quarter ended September 30, 2011). The year-to-date calendar return as of June 30, 2020 was -0.81%.
Average Annual Total Returns (For the periods endedDecember 31, 2019)
1Year
5Years
10Years
Fund 39.96% 13.97% 13.14%Russell 1000® GrowthIndex (reflects nodeduction for fees,expenses or taxes) 36.39% 14.63% 15.22%
Investment Adviser
The Fund’s investment adviser is The Variable AnnuityLife Insurance Company.
The Fund is subadvised by MFS.
Portfolio Managersg
Name and Title
PortfolioManager of theFund Since
Jeffrey ConstantinoInvestment Officer and PortfolioManager ................................................ 2013
Joseph SkorskiInvestment Officer and PortfolioManager ................................................ 2019
For important information about purchases and sales ofFund shares, taxes and payments to broker-dealers andother financial intermediaries, please turn to the section“Important Additional Information” on page 127.
FUND SUMMARY: LARGE CAPITAL GROWTH FUND
- 81 -

Investment Objective
The Fund seeks to provide growth of capital throughinvestments primarily in a diversified portfolio of commonstocks that, as a group, are expected to provideinvestment results closely corresponding to theperformance of the S&PMidCap 400® Index (the “Index”).
Fees and Expenses of the Fund
This table describes the fees and expenses that you maypay if you buy and hold shares of the Fund. The Fund’sannual operating expenses do not reflect the separateaccount fees charged in the variable annuity or variablelife insurance policy (“Variable Contracts”) in which theFund is offered. If separate account fees were shown, theFund’s annual operating expenses would be higher.Please see your Variable Contract prospectus for moredetails on the separate account fees.
Annual Fund Operating Expenses (expenses that yougpay each year as a percentage of the value of yourinvestment)
Management Fees 0.26%Other Expenses 0.10%Total Annual Fund Operating Expenses 0.36%
Expense Example
This Example is intended to help you compare the cost ofinvesting in the Fund with the cost of investing in othermutual funds. The Example assumes that you invest$10,000 in the Fund for the time periods indicated andthen redeem all of your shares at the end of those periods.The Example also assumes that your investment has a 5%return each year and that the Fund’s operating expensesremain the same. The Example does not reflect chargesimposed by the Variable Contract. If the Variable Contractfees were reflected, the expenses would be higher. Seethe Variable Contract prospectus for information on suchcharges. Although your actual costs may be higher orlower, based on these assumptions and the net expensesshown in the fee table, your costs would be:
1 Year 3 Years 5 Years 10 Years
$37 $116 $202 $456
Portfolio Turnover
The Fund pays transaction costs, such as commissions,when it buys and sells securities (or “turns over” itsportfolio). These costs, which are not reflected in annualfund operating expenses or in the Example, affect theFund’s performance.
During the most recent fiscal year, the Fund’s portfolioturnover rate was 14% of the average value of its portfolio.
Principal Investment Strategies of the Fund
The Fund is managed to seek to track the performance ofthe Index, which measures the performance of the mid-capitalization sector of the U.S. equity market. TheSubadviser may endeavor to track the Index bypurchasing every stock included in the Index, in the sameproportions; or, in the alternative, the Subadviser mayinvest in a sampling of Index stocks by utilizing a statisticaltechnique known as “optimization.” The goal ofoptimization is to select stocks which ensure that variousindustry weightings, market capitalizations, andfundamental characteristics, (e.g., price-to-book, price-to-earnings, debt-to-asset ratios and dividend yields) closelyapproximate those of the Index.
Under normal circumstances, at least 80% of the Fund’snet assets are invested in stocks that are in the Index.Although the Fund seeks to track the performance of theIndex, the performance of the Fund will not match that ofthe Index exactly because, among other reasons, theFund incurs operating expenses and other investmentoverhead as part of its normal operations.
In order to generate additional income, the Fund may lendportfolio securities to broker-dealers and other financialinstitutions provided that the value of the loaned securitiesdoes not exceed 30% of the Fund’s total assets. Theseloans earn income for the Fund and are collateralized bycash and securities issued or guaranteed by the U.S.Government or its agencies or instrumentalities. Investorswill be given at least 60 days’ written notice in advance ofany change to the Fund’s 80% investment policy set forthabove.
Principal Risks of Investing in the Fund
As with any mutual fund, there can be no assurance thatthe Fund’s investment objective will be met or that the netreturn on an investment in the Fund will exceed what couldhave been obtained through other investment or savingsvehicles. Shares of the Fund are not bank deposits andare not guaranteed or insured by any bank, governmententity or the Federal Deposit Insurance Corporation. If thevalue of the assets of the Fund goes down, you could losemoney.
The following is a summary of the principal risks ofinvesting in the Fund.
Index Risk. In attempting to track the performance of theindex, the Fund may be more susceptible to adversedevelopments concerning a particular security, companyor industry because the Fund generally will not use anydefensive strategies to mitigate its risk exposure.
FUND SUMMARY: MID CAP INDEX FUND
- 82 -

Failure to Match Index Performance Risk. The ability ofthe Fund to match the performance of the UnderlyingIndex may be affected by, among other things, changes insecurities markets, the manner in which performance ofthe Underlying Index is calculated, changes in thecomposition of the Underlying Index, the amount andtiming of cash flows into and out of the Fund,commissions, portfolio expenses, and any differences inthe pricing of securities by the Fund and the UnderlyingIndex. When the Fund employs an “optimization” strategy,the Fund is subject to an increased risk of tracking error,in that the securities selected in the aggregate for theFund may perform differently than the Index.
Equity Securities Risk. The Fund invests principally inequity securities and is therefore subject to the risk thatstock prices will fall and may underperform other assetclasses. Individual stock prices fluctuate from day-to-dayand may decline significantly. The prices of individualstocks may be negatively affected by poor companyresults or other factors affecting individual prices, as wellas industry and/or economic trends and developmentsaffecting industries or the securities market as a whole.
Market Risk. The Fund’s share price can fall because ofweakness in the broad market, a particular industry, orspecific holdings or due to adverse political or economicdevelopments here or abroad, changes in investorpsychology, or heavy institutional selling and otherconditions or events (including, for example, militaryconfrontations, war, terrorism, disease/virus, outbreaksand epidemics). The prices of individual securities mayfluctuate, sometimes dramatically, from day to day. Theprices of stocks and other equity securities tend to bemore volatile than those of fixed-income securities.
The coronavirus pandemic and the related governmentaland public responses have had and may continue to havean impact on the Fund’s investments and net asset valueand have led and may continue to lead to increasedmarket volatility and the potential for illiquidity in certainclasses of securities and sectors of the market.Preventative or protective actions that governments maytake in respect of pandemic or epidemic diseases mayresult in periods of business disruption, businessclosures, inability to obtain raw materials, supplies andcomponent parts, and reduced or disrupted operations forthe issuers in which the Fund invests. Governmentintervention in markets may impact interest rates, marketvolatility and security pricing. The occurrence,reoccurrence and pendency of such diseases couldadversely affect the economies (including throughchanges in business activity and increasedunemployment) and financial markets either in specificcountries or worldwide.
Mid-Cap Company Risk. Investing in mid-cap companiescarries the risk that due to current market conditions thesecompanies may be out of favor with investors. Stocks ofmid-cap companies may be more volatile than those oflarger companies due to, among other reasons, narrowerproduct lines, more limited financial resources and fewerexperienced managers.
Securities Lending Risk. Engaging in securities lendingcould increase the market and credit risk for Fundinvestments. The Fund may lose money if it does notrecover borrowed securities, the value of the collateralfalls, or the value of investments made with cash collateraldeclines. If the value of either the cash collateral or theFund’s investments of the cash collateral falls below theamount owed to a borrower, the Fund also may incurlosses that exceed the amount it earned on lending thesecurity. Securities lending also involves the risks of delayin receiving additional collateral or possible loss of rightsin the collateral if the borrower fails. Another risk ofsecurities lending is the risk that the loaned portfoliosecurities may not be available to the Fund on a timelybasis and the Fund may therefore lose the opportunity tosell the securities at a desirable price.
Performance Information
The following Risk/Return Bar Chart and Table illustratethe risks of investing in the Fund by showing changes inthe Fund’s performance from calendar year to calendaryear and comparing the Fund’s average annual returns tothose of the S&PMidCap 400® Index. Fees and expensesincurred at the contract level are not reflected in the barchart or table. If these amounts were reflected, returnswould be less than those shown. Of course, pastperformance is not necessarily an indication of how theFund will perform in the future.
26.25%
-2.01%
17.52%
33.11%
9.41%
-2.50%
20.62%
15.91%
-11.43%
25.71%
-15%
-10%
-5%
0%
5%
10%
15%
20%
25%
30%
35%
40%
2010 2011 2012 2013 2014 2015 2016 2017 2018 2019
During the 10-year period shown in the bar chart, thehighest return for a quarter was 14.40% (quarter ended
FUND SUMMARY: MID CAP INDEX FUND
- 83 -

March 31, 2019) and the lowest return for a quarter was-19.96% (quarter ended September 30, 2011). The year-to-date calendar return as of June 30, 2020 was -12.93%.
Average Annual Total Returns (For the periods endedDecember 31, 2019)
1Year
5Years
10Years
Fund 25.71% 8.70% 12.38%S&P MidCap 400® Index(reflects no deduction forfees, expenses or taxes) 26.20% 9.03% 12.72%
Investment Adviser
The Fund’s investment adviser is The Variable AnnuityLife Insurance Company.
The Fund is subadvised by SunAmerica AssetManagement LLC.
Portfolio Managersg
Name and Title
PortfolioManager of theFund Since
Timothy CampionSenior Vice President and LeadPortfolio Manager .................................. 2012
Elizabeth MauroPortfolio Manager and Co-PortfolioManager ................................................ 2019
For important information about purchases and sales ofFund shares, taxes and payments to broker-dealers andother financial intermediaries, please turn to the section“Important Additional Information” on page 127.
FUND SUMMARY: MID CAP INDEX FUND
- 84 -
Investment Objective
The Fund seeks long-term capital growth.
Fees and Expenses of the Fund
This table describes the fees and expenses that you maypay if you buy and hold shares of the Fund. The Fund’sannual operating expenses do not reflect the separateaccount fees charged in the variable annuity or variablelife insurance policy (“Variable Contracts”) in which theFund is offered. If separate account fees were shown, theFund’s annual operating expenses would be higher.Please see your Variable Contract prospectus for moredetails on the separate account fees.
Annual Fund Operating Expenses (expenses that yougpay each year as a percentage of the value of yourinvestment)
Management Fees 0.69%Other Expenses 0.12%Total Annual Fund Operating Expenses 0.81%
Expense Example
This Example is intended to help you compare the cost ofinvesting in the Fund with the cost of investing in othermutual funds. The Example assumes that you invest$10,000 in the Fund for the time periods indicated andthen redeem all of your shares at the end of those periods.The Example also assumes that your investment has a 5%return each year and that the Fund’s operating expensesremain the same. The Example does not reflect chargesimposed by the Variable Contract. If the Variable Contractfees were reflected, the expenses would be higher. Seethe Variable Contract prospectus for information on suchcharges. Although your actual costs may be higher orlower, based on these assumptions and the net expensesshown in the fee table, your costs would be:
1 Year 3 Years 5 Years 10 Years
$83 $259 $450 $1,002
Portfolio Turnover
The Fund pays transaction costs, such as commissions,when it buys and sells securities (or “turns over” itsportfolio). These costs, which are not reflected in annualfund operating expenses or in the Example, affect theFund’s performance.
During the most recent fiscal year, the Fund’s portfolioturnover rate was 25% of the average value of its portfolio.
Principal Investment Strategies of the Fund
The Subadvisers seek long-term capital growth byinvesting primarily in growth-oriented equity securities ofdomestic and foreign mid-cap companies.
Under normal circumstances, at least 80% of the Fund’snet assets will be invested in common stocks of mid-capcompanies. Generally, mid-cap companies will includecompanies whose market capitalizations, at the time ofpurchase, range from the market capitalization of thesmallest company included in the Russell Midcap®Growth Index to the market capitalization of the largestcompany in the Russell Midcap® Growth Index during themost recent 12-month period. As of May 31, 2020, thelargest stock by market capitalization in the RussellMidcap® Growth Index was approximately $72.59 billionand the median was $9.502 billion.
The Fund may invest up to 25% of its net assets insecurities of foreign issuers, which may include emergingmarket securities. The securities in which the Fund mayinvest may be denominated in U.S. dollars or in currenciesother than U.S. dollars. The Fund may also invest inprivate placements.
In order to generate additional income, the Fund may lendportfolio securities to broker-dealers and other financialinstitutions provided that the value of the loaned securitiesdoes not exceed 30% of the Fund’s total assets. Theseloans earn income for the Fund and are collateralized bycash and securities issued or guaranteed by the U.S.Government or its agencies or instrumentalities. Investorswill be given at least 60 days’ written notice in advance ofany change to the Fund’s 80% investment policy set forthabove.
Principal Risks of Investing in the Fund
As with any mutual fund, there can be no assurance thatthe Fund’s investment objective will be met or that the netreturn on an investment in the Fund will exceed what couldhave been obtained through other investment or savingsvehicles. Shares of the Fund are not bank deposits andare not guaranteed or insured by any bank, governmententity or the Federal Deposit Insurance Corporation. If thevalue of the assets of the Fund goes down, you could losemoney.
The following is a summary of the principal risks ofinvesting in the Fund.
FUND SUMMARY: MID CAP STRATEGIC GROWTH FUND
- 85 -

Management Risk. The investment style or strategy usedby the Subadviser may fail to produce the intended result.The Subadviser’s assessment of a particular security orcompany may prove incorrect, resulting in losses orunderperformance.
Currency Risk. Because the Fund’s foreign investmentsare generally held in foreign currencies, the Fund couldexperience gains or losses based solely on changes in theexchange rate between foreign currencies and the U.S.dollar. Such gains or losses may be substantial.
Equity Securities Risk. The Fund invests primarily inequity securities and is therefore subject to the risk thatstock prices will fall and may underperform other assetclasses. Individual stock prices fluctuate from day-to-dayand may decline significantly. The prices of individualstocks may be negatively affected by poor companyresults or other factors affecting individual prices, as wellas industry and/or economic trends and developmentsaffecting industries or the securities market as a whole.
Foreign Investment Risk. Investment in foreignsecurities involves risks due to several factors, such asilliquidity, the lack of public information, changes in theexchange rates between foreign currencies and the U.S.dollar, unfavorable political, social and legaldevelopments, or economic and financial instability.Foreign companies are not subject to the U.S. accountingand financial reporting standards and may have riskiersettlement procedures. U.S. investments that aredenominated in foreign currencies or that are traded inforeign markets, or securities of U.S. companies that havesignificant foreign operations may be subject to foreigninvestment risk.
Emerging Markets Risk. In addition to the risksassociated with investments in foreign securities,emerging market securities are subject to additional risks,which cause these securities generally to be more volatilethan securities of issuers located in developed countries.
Growth Style Risk. Generally, “growth” stocks are stocksof companies that a subadviser believes have anticipatedearnings ranging from steady to accelerated growth.Many investors buy growth stocks because of anticipatedsuperior earnings growth, but earnings disappointmentsoften result in sharp price declines. Growth companiesusually invest a high portion of earnings in their ownbusinesses so their stocks may lack the dividends that cancushion share prices in a down market. In addition, thevalue of growth stocks may be more sensitive to changesin current or expected earnings than the value of otherstocks, because growth stocks trade at higher pricesrelative to current earnings.
Market Risk. The Fund’s share price can fall because ofweakness in the broad market, a particular industry, orspecific holdings or due to adverse political or economicdevelopments here or abroad, changes in investorpsychology, or heavy institutional selling and otherconditions or events (including, for example, militaryconfrontations, war, terrorism, disease/virus, outbreaksand epidemics). The prices of individual securities mayfluctuate, sometimes dramatically, from day to day. Theprices of stocks and other equity securities tend to bemore volatile than those of fixed-income securities.
The coronavirus pandemic and the related governmentaland public responses have had and may continue to havean impact on the Fund’s investments and net asset valueand have led and may continue to lead to increasedmarket volatility and the potential for illiquidity in certainclasses of securities and sectors of the market.Preventative or protective actions that governments maytake in respect of pandemic or epidemic diseases mayresult in periods of business disruption, businessclosures, inability to obtain raw materials, supplies andcomponent parts, and reduced or disrupted operations forthe issuers in which the Fund invests. Governmentintervention in markets may impact interest rates, marketvolatility and security pricing. The occurrence,reoccurrence and pendency of such diseases couldadversely affect the economies (including throughchanges in business activity and increasedunemployment) and financial markets either in specificcountries or worldwide.
Mid-Cap Company Risk. Investing in mid-cap companiescarries the risk that due to current market conditions thesecompanies may be out of favor with investors. Stocks ofmid-cap companies may be more volatile than those oflarger companies due to, among other reasons, narrowerproduct lines, more limited financial resources and fewerexperienced managers.
Privately Placed Securities Risk. The Fund’sinvestments may also include privately placed securities,which are subject to resale restrictions. These securitieswill have the effect of increasing the level of Fund illiquidityto the extent the Fund may be unable to sell or transferthese securities due to restrictions on transfers or on theability to find buyers interested in purchasing thesecurities. The illiquidity of the market, as well as the lackof publicly available information regarding thesesecurities, may also adversely affect the ability to arrive ata fair value for certain securities at certain times and couldmake it difficult for the Fund to sell certain securities.
FUND SUMMARY: MID CAP STRATEGIC GROWTH FUND
- 86 -
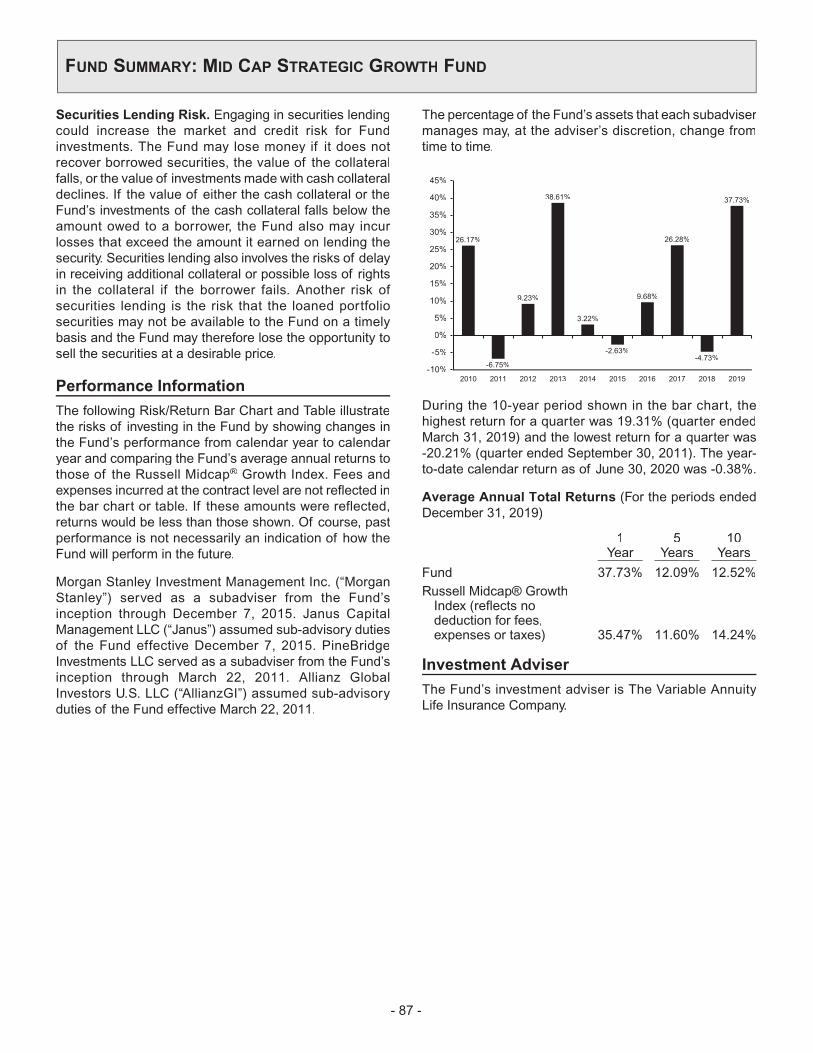
Securities Lending Risk. Engaging in securities lendingcould increase the market and credit risk for Fundinvestments. The Fund may lose money if it does notrecover borrowed securities, the value of the collateralfalls, or the value of investments made with cash collateraldeclines. If the value of either the cash collateral or theFund’s investments of the cash collateral falls below theamount owed to a borrower, the Fund also may incurlosses that exceed the amount it earned on lending thesecurity. Securities lending also involves the risks of delayin receiving additional collateral or possible loss of rightsin the collateral if the borrower fails. Another risk ofsecurities lending is the risk that the loaned portfoliosecurities may not be available to the Fund on a timelybasis and the Fund may therefore lose the opportunity tosell the securities at a desirable price.
Performance Information
The following Risk/Return Bar Chart and Table illustratethe risks of investing in the Fund by showing changes inthe Fund’s performance from calendar year to calendaryear and comparing the Fund’s average annual returns tothose of the Russell Midcap® Growth Index. Fees andexpenses incurred at the contract level are not reflected inthe bar chart or table. If these amounts were reflected,returns would be less than those shown. Of course, pastperformance is not necessarily an indication of how theFund will perform in the future.
Morgan Stanley Investment Management Inc. (“MorganStanley”) served as a subadviser from the Fund’sinception through December 7, 2015. Janus CapitalManagement LLC (“Janus”) assumed sub-advisory dutiesof the Fund effective December 7, 2015. PineBridgeInvestments LLC served as a subadviser from the Fund’sinception through March 22, 2011. Allianz GlobalInvestors U.S. LLC (“AllianzGI”) assumed sub-advisoryduties of the Fund effective March 22, 2011.
The percentage of the Fund’s assets that each subadvisermanages may, at the adviser’s discretion, change fromtime to time.
26.17%
-6.75%
9.23%
38.61%
3.22%
-2.63%
9.68%
26.28%
-4.73%
37.73%
-10%
-5%
0%
5%
10%
15%
20%
25%
30%
35%
40%
45%
2010 2011 2012 2013 2014 2015 2016 2017 2018 2019
During the 10-year period shown in the bar chart, thehighest return for a quarter was 19.31% (quarter endedMarch 31, 2019) and the lowest return for a quarter was-20.21% (quarter ended September 30, 2011). The year-to-date calendar return as of June 30, 2020 was -0.38%.
Average Annual Total Returns (For the periods endedDecember 31, 2019)
1Year
5Years
10Years
Fund 37.73% 12.09% 12.52%Russell Midcap® GrowthIndex (reflects nodeduction for fees,expenses or taxes) 35.47% 11.60% 14.24%
Investment Adviser
The Fund’s investment adviser is The Variable AnnuityLife Insurance Company.
FUND SUMMARY: MID CAP STRATEGIC GROWTH FUND
- 87 -

The Fund is subadvised by Janus and AllianzGI.
Portfolio Managersg
Name and Title
PortfolioManager of theFund Since
JanusBrian Demain, CFAPortfolio Manager .................................. 2015
Cody Wheaton, CFAPortfolio Manager .................................. 2016
AllianzGISteven Klopukh, CFADirector and Senior Portfolio Manager,Co-Lead Portfolio Manager ................... 2011
Tim M. McCarthy, CFADirector and Portfolio Manager, Co-Lead Portfolio Manager ......................... 2014
For important information about purchases and sales ofFund shares, taxes and payments to broker-dealers andother financial intermediaries, please turn to the section“Important Additional Information” on page 127.
FUND SUMMARY: MID CAP STRATEGIC GROWTH FUND
- 88 -

Investment Objective
The Fund seeks long-term capital growth throughinvestments in the stocks that are included in the Nasdaq-100® Index (the “Index”).
Fees and Expenses of the Fund
This table describes the fees and expenses that you maypay if you buy and hold shares of the Fund. The Fund’sannual operating expenses do not reflect the separateaccount fees charged in the variable annuity or variablelife insurance policy (“Variable Contracts”) in which theFund is offered. If separate account fees were shown, theFund’s annual operating expenses would be higher.Please see your Variable Contract prospectus for moredetails on the separate account fees.
Annual Fund Operating Expenses (expenses that yougpay each year as a percentage of the value of yourinvestment)
Management Fees 0.39%Other Expenses 0.14%Total Annual Fund Operating Expenses 0.53%
Expense Example
This Example is intended to help you compare the cost ofinvesting in the Fund with the cost of investing in othermutual funds. The Example assumes that you invest$10,000 in the Fund for the time periods indicated andthen redeem all of your shares at the end of those periods.The Example also assumes that your investment has a 5%return each year and that the Fund’s operating expensesremain the same. The Example does not reflect chargesimposed by the Variable Contract. If the Variable Contractfees were reflected, the expenses would be higher. Seethe Variable Contract prospectus for information on suchcharges. Although your actual costs may be higher orlower, based on these assumptions and the net expensesshown in the fee table, your costs would be:
1 Year 3 Years 5 Years 10 Years
$54 $170 $296 $665
Portfolio Turnover
The Fund pays transaction costs, such as commissions,when it buys and sells securities (or “turns over” itsportfolio). These costs, which are not reflected in annualfund operating expenses or in the Example, affect theFund’s performance.
During the most recent fiscal year, the Fund’s portfolioturnover rate was 8% of the average value of its portfolio.
Principal Investment Strategies of the Fund
The Fund invests in stocks that are included in the Index.The Index represents the largest and most active non-financial domestic and international securities listed onThe NASDAQ Stock Market, based on market value(capitalization). This includes major industry groups, suchas computer hardware and software, telecommunications,retail and wholesale trade and biotechnology.
The Subadviser invests, under normal circumstances, atleast 80% of the Fund’s net assets in companies that arelisted in the Index. The Fund is managed to seek to trackthe performance of the Index. The Subadviser mayendeavor to track the Index by purchasing every stockincluded in the Index, in the same proportions; or, in thealternative, the Subadviser may invest in a sampling ofIndex stocks by utilizing a statistical technique known as“optimization.” The goal of optimization is to select stockswhich ensure that various industry weightings, marketcapitalizations, and fundamental characteristics, (e.g.,price-to-book, price-to-earnings, debt-to-asset ratios anddividend yields) closely approximate those of the Index.
The Fund may also invest in some futures contracts inorder to help the Fund’s liquidity and to manage its cashposition. If the market value of the futures contracts isclose to the Fund’s cash balance, then that helps tominimize the tracking errors, while helping to maintainliquidity. The Fund is a non-diversified fund, which meansthat it will invest in a smaller number of issuers than adiversified fund.
The Fund may concentrate its investments (invest morethan 25% of its total assets) in the technology sector, in theproportion consistent with the industry weightings in theIndex.
Although the Fund seeks to track the performance of theIndex, the performance of the Fund will not match that ofthe Index exactly because, among other reasons, theFund incurs operating expenses and other investmentoverhead as part of its normal operations.
In order to generate additional income, the Fund may lendportfolio securities to broker-dealers and other financialinstitutions provided that the value of the loaned securitiesdoes not exceed 30% of the Fund’s total assets. Theseloans earn income for the Fund and are collateralized bycash and securities issued or guaranteed by the U.S.Government or its agencies or instrumentalities. Investorswill be given at least 60 days’ written notice in advance ofany change to the Fund’s 80% investment policy set forthabove.
FUND SUMMARY: NASDAQ-100® INDEX FUND
- 89 -

Principal Risks of Investing in the Fund
As with any mutual fund, there can be no assurance thatthe Fund’s investment objective will be met or that the netreturn on an investment in the Fund will exceed what couldhave been obtained through other investment or savingsvehicles. Shares of the Fund are not bank deposits andare not guaranteed or insured by any bank, governmententity or the Federal Deposit Insurance Corporation. If thevalue of the assets of the Fund goes down, you could losemoney.
The following is a summary of the principal risks ofinvesting in the Fund.
Technology Sector Risk. Technology stocks historicallyhave experienced unusually wide price swings. Earningsdisappointments and intense competition for market sharecan result in sharp declines in the prices of technologystocks.
Equity Securities Risk. The Fund invests principally inequity securities and is therefore subject to the risk thatstock prices will fall and may underperform other assetclasses. Individual stock prices fluctuate from day-to-dayand may decline significantly. The prices of individualstocks may be negatively affected by poor companyresults or other factors affecting individual prices, as wellas industry and/or economic trends and developmentsaffecting industries or the securities market as a whole.
Index Risk. In attempting to track the performance of theindex, the Fund may be more susceptible to adversedevelopments concerning a particular security, companyor industry because the Fund generally will not use anydefensive strategies to mitigate its risk exposure.
Failure to Match Index Performance Risk. The ability ofthe Fund to match the performance of the UnderlyingIndex may be affected by, among other things, changes insecurities markets, the manner in which performance ofthe Underlying Index is calculated, changes in thecomposition of the Underlying Index, the amount andtiming of cash flows into and out of the Fund,commissions, portfolio expenses, and any differences inthe pricing of securities by the Fund and the UnderlyingIndex. When the Fund employs an “optimization” strategy,the Fund is subject to an increased risk of tracking error,in that the securities selected in the aggregate for theFund may perform differently than the Index.
Derivatives Risk. The prices of derivatives may move inunexpected ways due to the use of leverage and otherfactors and may result in increased volatility or losses. TheFund may not be able to terminate or sell derivativepositions, and a liquid secondary market may not alwaysexist for derivative positions.
Market Risk. The Fund’s share price can fall because ofweakness in the broad market, a particular industry, orspecific holdings or due to adverse political or economicdevelopments here or abroad, changes in investorpsychology, or heavy institutional selling and otherconditions or events (including, for example, militaryconfrontations, war, terrorism, disease/virus, outbreaksand epidemics). The prices of individual securities mayfluctuate, sometimes dramatically, from day to day. Theprices of stocks and other equity securities tend to bemore volatile than those of fixed-income securities.
The coronavirus pandemic and the related governmentaland public responses have had and may continue to havean impact on the Fund’s investments and net asset valueand have led and may continue to lead to increasedmarket volatility and the potential for illiquidity in certainclasses of securities and sectors of the market.Preventative or protective actions that governments maytake in respect of pandemic or epidemic diseases mayresult in periods of business disruption, businessclosures, inability to obtain raw materials, supplies andcomponent parts, and reduced or disrupted operations forthe issuers in which the Fund invests. Governmentintervention in markets may impact interest rates, marketvolatility and security pricing. The occurrence,reoccurrence and pendency of such diseases couldadversely affect the economies (including throughchanges in business activity and increasedunemployment) and financial markets either in specificcountries or worldwide.
Non-Diversification Risk. Because the Fund may investin a smaller number of issuers, its value may be affectedto a greater extent by the performance of any one of thoseissuers or by any single economic, political, market orregulatory event affecting any one of those issues than afund that invests in a larger number of issuers.
Sector Risk. Companies with similar characteristics maybe grouped together in broad categories called sectors.Sector risk is the risk that securities of companies withinspecific sectors of the economy can perform differentlythan the overall market. This may be due to changes insuch things as the regulatory or competitive environmentor to changes in investor perceptions regarding a sector.Because the Fund may allocate relatively more assets tocertain sectors than others, the Fund’s performance maybe more susceptible to any developments which affectthose sectors emphasized by the Fund.
Securities Lending Risk. Engaging in securities lendingcould increase the market and credit risk for Fundinvestments. The Fund may lose money if it does notrecover borrowed securities, the value of the collateralfalls, or the value of investments made with cash collateral
FUND SUMMARY: NASDAQ-100® INDEX FUND
- 90 -

declines. If the value of either the cash collateral or theFund’s investments of the cash collateral falls below theamount owed to a borrower, the Fund also may incurlosses that exceed the amount it earned on lending thesecurity. Securities lending also involves the risks of delayin receiving additional collateral or possible loss of rightsin the collateral if the borrower fails. Another risk ofsecurities lending is the risk that the loaned portfoliosecurities may not be available to the Fund on a timelybasis and the Fund may therefore lose the opportunity tosell the securities at a desirable price.
Performance Information
The following Risk/Return Bar Chart and Table illustratethe risks of investing in the Fund by showing changes inthe Fund’s performance from calendar year to calendaryear and comparing the Fund’s average annual returns tothose of the Nasdaq-100® Index. Fees and expensesincurred at the contract level are not reflected in the barchart or table. If these amounts were reflected, returnswould be less than those shown. Of course, pastperformance is not necessarily an indication of how theFund will perform in the future.
19.72%
2.96%
17.94%
36.23%
18.69%
9.19%6.77%
32.29%
-0.63%
38.66%
-5%
0%
5%
10%
15%
20%
25%
30%
35%
40%
45%
2010 2011 2012 2013 2014 2015 2016 2017 2018 2019
During the 10-year period shown in the bar chart, thehighest return for a quarter was 21.22% (quarter endedMarch 31, 2012) and the lowest return for a quarter was-16.92% (quarter ended December 31, 2018). The year-to-date calendar return as of June 30, 2020 was 16.53%.
Average Annual Total Returns (For the periods endedDecember 31, 2019)
1Year
5Years
10Years
Fund 38.66% 16.27% 17.45%Nasdaq-100® Index(reflects no deduction forfees, expenses or taxes) 39.46% 16.91% 18.07%
Investment Adviser
The Fund’s investment adviser is The Variable AnnuityLife Insurance Company.
The Fund is subadvised by SunAmerica AssetManagement LLC.
Portfolio Managersg
Name and Title
PortfolioManager of theFund Since
Timothy CampionSenior Vice President and LeadPortfolio Manager .................................. 2012
Elizabeth MauroPortfolio Manager and Co-PortfolioManager ................................................ 2019
For important information about purchases and sales ofFund shares, taxes and payments to broker-dealers andother financial intermediaries, please turn to the section“Important Additional Information” on page 127.
FUND SUMMARY: NASDAQ-100® INDEX FUND
- 91 -

Investment Objective
The Fund seeks long-term capital appreciation.
Fees and Expenses of the Fund
This table describes the fees and expenses that you maypay if you buy and hold shares of the Fund. The Fund’sannual operating expenses do not reflect the separateaccount fees charged in the variable annuity or variablelife insurance policy (“Variable Contracts”) in which theFund is offered. If separate account fees were shown, theFund’s annual operating expenses would be higher.Please see your Variable Contract prospectus for moredetails on the separate account fees.
Annual Fund Operating Expenses (expenses that yougpay each year as a percentage of the value of yourinvestment)
Management Fees 0.87%Other Expenses 0.10%Total Annual Fund Operating Expenses 0.97%
Expense Example
This Example is intended to help you compare the cost ofinvesting in the Fund with the cost of investing in othermutual funds. The Example assumes that you invest$10,000 in the Fund for the time periods indicated andthen redeem all of your shares at the end of those periods.The Example also assumes that your investment has a 5%return each year and that the Fund’s operating expensesremain the same. The Example does not reflect chargesimposed by the Variable Contract. If the Variable Contractfees were reflected, the expenses would be higher. Seethe Variable Contract prospectus for information on suchcharges. Although your actual costs may be higher orlower, based on these assumptions and the net expensesshown in the fee table, your costs would be:
1 Year 3 Years 5 Years 10 Years
$99 $309 $536 $1,190
Portfolio Turnover
The Fund pays transaction costs, such as commissions,when it buys and sells securities (or “turns over” itsportfolio). These costs, which are not reflected in annualfund operating expenses or in the Example, affect theFund’s performance.
During the most recent fiscal year, the Fund’s portfolioturnover rate was 98% of the average value of its portfolio.
Principal Investment Strategies of the Fund
The Fund invests, under normal circumstances, at least80% of net assets in the common stocks of companiesthat are expected to benefit from the development,advancement, and use of science and/or technology.
Investments may also include companies that shouldbenefit from technological advances even if they are notdirectly involved in research and development. The Fundmay invest in suitable technology companies throughinitial public offerings (“IPOs”), and a portion of the Fund’sreturns may be attributable to the Fund’s investments inIPOs. There is no guarantee that as the Fund’s assetsgrow it will be able to experience significant improvementin performance by investing in IPOs.
The Fund may invest up to 50% of its total assets inforeign securities, which include non-dollar denominatedsecurities traded outside the U.S. In addition, the Fund hasthe ability to invest up to 30% of its total assets incompanies organized or headquartered in emergingmarket countries, but no more than 20% of its total assetsmay be invested in any one emerging market country. TheFund may also invest in privately placed securities.
The Subadvisers may engage in frequent and activetrading of portfolio securities to achieve the Fund’sinvestment objective.
In order to generate additional income, the Fund may lendportfolio securities to broker-dealers and other financialinstitutions provided that the value of the loaned securitiesdoes not exceed 30% of the Fund’s total assets. Theseloans earn income for the Fund and are collateralized bycash and securities issued or guaranteed by the U.S.Government or its agencies or instrumentalities. Investorswill be given at least 60 days’ written notice in advance ofany change to the Fund’s 80% investment policy set forthabove.
Principal Risks of Investing in the Fund
As with any mutual fund, there can be no assurance thatthe Fund’s investment objective will be met or that the netreturn on an investment in the Fund will exceed what couldhave been obtained through other investment or savingsvehicles. Shares of the Fund are not bank deposits andare not guaranteed or insured by any bank, governmententity or the Federal Deposit Insurance Corporation. If thevalue of the assets of the Fund goes down, you could losemoney.
FUND SUMMARY: SCIENCE & TECHNOLOGY FUND
- 92 -

The following is a summary of the principal risks ofinvesting in the Fund.
Management Risk. The investment style or strategy usedby the Subadviser may fail to produce the intended result.The Subadviser’s assessment of a particular security orcompany may prove incorrect, resulting in losses orunderperformance.
Technology Sector Risk. Technology stocks historicallyhave experienced unusually wide price swings. Earningsdisappointments and intense competition for market sharecan result in sharp declines in the prices of technologystocks.
Dividend-paying Stocks Risk. There is no guaranteethat the issuers of the stocks held by the Fund will declaredividends in the future or that, if dividends are declared,they will remain at their current levels or increase overtime. Dividend-paying stocks may not participate in abroad market advance to the same degree as otherstocks, and a sharp rise in interest rates or economicdownturn could cause a company to unexpectedly reduceor eliminate its dividend.
Equity Securities Risk. The Fund invests principally inequity securities and is therefore subject to the risk thatstock prices will fall and may underperform other assetclasses. Individual stock prices fluctuate from day-to-dayand may decline significantly. The prices of individualstocks may be negatively affected by poor companyresults or other factors affecting individual prices, as wellas industry and/or economic trends and developmentsaffecting industries or the securities market as a whole.
Emerging Markets Risk. In addition to the risksassociated with investments in foreign securities,emerging market securities are subject to additional risks,which cause these securities generally to be more volatilethan securities of issuers located in developed countries.
Currency Risk. Because the Fund’s foreign investmentsare generally held in foreign currencies, the Fund couldexperience gains or losses based solely on changes in theexchange rate between foreign currencies and the U.S.dollar. Such gains or losses may be substantial.
Foreign Investment Risk. Investment in foreignsecurities involves risks due to several factors, such asilliquidity, the lack of public information, changes in theexchange rates between foreign currencies and the U.S.dollar, unfavorable political, social and legaldevelopments, or economic and financial instability.Foreign companies are not subject to the U.S. accountingand financial reporting standards and may have riskiersettlement procedures. U.S. investments that are
denominated in foreign currencies or that are traded inforeign markets, or securities of U.S. companies that havesignificant foreign operations may be subject to foreigninvestment risk.
Geographic Risk. If the Fund invests a significant portionof its assets in issuers located in a single country, a limitednumber of countries, or a particular geographic region, itassumes the risk that economic, political and socialconditions in those countries or that region may have asignificant impact on its investment performance.
IPO Risk. Share prices of newly-public companies mayfluctuate significantly over short periods of time.
Market Risk. The Fund’s share price can fall because ofweakness in the broad market, a particular industry, orspecific holdings or due to adverse political or economicdevelopments here or abroad, changes in investorpsychology, or heavy institutional selling and otherconditions or events (including, for example, militaryconfrontations, war, terrorism, disease/virus, outbreaksand epidemics). The prices of individual securities mayfluctuate, sometimes dramatically, from day to day. Theprices of stocks and other equity securities tend to bemore volatile than those of fixed-income securities.
The coronavirus pandemic and the related governmentaland public responses have had and may continue to havean impact on the Fund’s investments and net asset valueand have led and may continue to lead to increasedmarket volatility and the potential for illiquidity in certainclasses of securities and sectors of the market.Preventative or protective actions that governments maytake in respect of pandemic or epidemic diseases mayresult in periods of business disruption, businessclosures, inability to obtain raw materials, supplies andcomponent parts, and reduced or disrupted operations forthe issuers in which the Fund invests. Governmentintervention in markets may impact interest rates, marketvolatility and security pricing. The occurrence,reoccurrence and pendency of such diseases couldadversely affect the economies (including throughchanges in business activity and increasedunemployment) and financial markets either in specificcountries or worldwide.
Sector Risk. Companies with similar characteristics maybe grouped together in broad categories called sectors.Sector risk is the risk that securities of companies withinspecific sectors of the economy can perform differentlythan the overall market. This may be due to changes insuch things as the regulatory or competitive environmentor to changes in investor perceptions regarding a sector.Because the Fund may allocate relatively more assets to
FUND SUMMARY: SCIENCE & TECHNOLOGY FUND
- 93 -

certain sectors than others, the Fund’s performance maybe more susceptible to any developments which affectthose sectors emphasized by the Fund.
Securities Lending Risk. Engaging in securities lendingcould increase the market and credit risk for Fundinvestments. The Fund may lose money if it does notrecover borrowed securities, the value of the collateralfalls, or the value of investments made with cash collateraldeclines. If the value of either the cash collateral or theFund’s investments of the cash collateral falls below theamount owed to a borrower, the Fund also may incurlosses that exceed the amount it earned on lending thesecurity. Securities lending also involves the risks of delayin receiving additional collateral or possible loss of rightsin the collateral if the borrower fails. Another risk ofsecurities lending is the risk that the loaned portfoliosecurities may not be available to the Fund on a timelybasis and the Fund may therefore lose the opportunity tosell the securities at a desirable price.
Privately Placed Securities Risk. The Fund’sinvestments may also include privately placed securities,which are subject to resale restrictions. These securitieswill have the effect of increasing the level of Fund illiquidityto the extent the Fund may be unable to sell or transferthese securities due to restrictions on transfers or on theability to find buyers interested in purchasing thesecurities. The illiquidity of the market, as well as the lackof publicly available information regarding thesesecurities, may also adversely affect the ability to arrive ata fair value for certain securities at certain times and couldmake it difficult for the Fund to sell certain securities.
Mid-Cap Company Risk. Investing in mid-cap companiescarries the risk that due to current market conditions thesecompanies may be out of favor with investors. Stocks ofmid-cap companies may be more volatile than those oflarger companies due to, among other reasons, narrowerproduct lines, more limited financial resources and fewerexperienced managers.
Small-Cap Company Risk. Investing in small-capcompanies carries the risk that due to current marketconditions these companies may be out of favor withinvestors. Small companies often are in the early stagesof development with limited product lines, markets, orfinancial resources and managements lacking depth andexperience, which may cause their stock prices to bemore
volatile than those of larger companies. Small companystocks may be less liquid yet subject to abrupt or erraticprice movements. It may take a substantial period of timebefore the Fund realizes a gain on an investment in asmall-cap company, if it realizes any gain at all.
Active Trading Risk. High portfolio turnover rates thatare associated with active trading may result in highertransaction costs, which can adversely affect the Fund’sperformance. Active trading tends to be more pronouncedduring periods of increased market volatility.
Performance Information
The following Risk/Return Bar Chart and Table illustratethe risks of investing in the Fund by showing changes inthe Fund’s performance from calendar year to calendaryear and comparing the Fund’s average annual returns tothose of the S&P® North American Technology SectorIndex. Fees and expenses incurred at the contract levelare not reflected in the bar chart or table. If these amountswere reflected, returns would be less than those shown.Of course, past performance is not necessarily anindication of how the Fund will perform in the future.
The percentage of the Fund’s assets that each subadvisermanages may, at the adviser’s discretion, change fromtime to time.
22.09%
-5.99%
12.14%
42.49%
14.43%
7.88% 7.33%
41.32%
-1.48%
39.47%
-10%
-5%
0%
5%
10%
15%
20%
25%
30%
35%
40%
45%
50%
2010 2011 2012 2013 2014 2015 2016 2017 2018 2019
During the 10-year period shown in the bar chart, thehighest return for a quarter was 22.23% (quarter endedMarch 31, 2019) and the lowest return for a quarter was-17.13% (quarter ended December 31, 2018). The year-to-date calendar return as of June 30, 2020 was 18.00%.
FUND SUMMARY: SCIENCE & TECHNOLOGY FUND
- 94 -

Average Annual Total Returns (For the periods endedDecember 31, 2019)
1Year
5Years
10Years
Fund 39.47% 17.59% 16.78%S&P® North AmericanTechnology Sector Index(reflects no deduction forfees, expenses or taxes) 42.68% 20.34% 17.55%
Investment Adviser
The Fund’s investment adviser is The Variable AnnuityLife Insurance Company.
The Fund is subadvised by Allianz Global Investors,T. Rowe Price Associates, Inc. and WellingtonManagement Company LLPPP
Portfolio Managersg
Name and Title
PortfolioManager of theFund Since
AllianzGIWalter C. Price, Jr., CFAManaging Director and Senior PortfolioManager, Co-Lead Manager.................. 2005
Huachen Chen, CFAManaging Director and Senior PortfolioManager, Co-Lead Manager.................. 2005
Michael A. SeidenbergDirector, Portfolio Manager .................... 2018
T. Rowe PriceKennard W. AllenVice President and Portfolio Manager ... 2009
Wellington Managementg gJohn F. Averill, CFASenior Managing Director and GlobalIndustry Analyst..................................... 2007
Bruce L. GlazerSenior Managing Director and GlobalIndustry Analyst..................................... 2007
Eunhak BaeSenior Managing Director and GlobalIndustry Analyst..................................... 2019
Brian BarbettaSenior Managing Director and GlobalIndustry Analyst..................................... 2017
Jeffrey S. WantmanSenior Managing Director and GlobalIndustry Analyst..................................... 2019
For important information about purchases and sales ofFund shares, taxes and payments to broker-dealers andother financial intermediaries, please turn to the section“Important Additional Information” on page 127.
FUND SUMMARY: SCIENCE & TECHNOLOGY FUND
- 95 -
Investment Objective
The Fund seeks capital growth.
Fees and Expenses of the Fund
This table describes the fees and expenses that you maypay if you buy and hold shares of the Fund. The Fund’sannual operating expenses do not reflect the separateaccount fees charged in the variable annuity or variablelife insurance policy (“Variable Contracts”) in which theFund is offered. If separate account fees were shown, theFund’s annual operating expenses would be higher.Please see your Variable Contract prospectus for moredetails on the separate account fees.
Annual Fund Operating Expenses (expenses that yougpay each year as a percentage of the value of yourinvestment)
Management Fees 0.85%Other Expenses 0.16%Total Annual Fund Operating Expenses 1.01%Fee Waivers and/or Expense Reimbursements1 -0.02%Total Annual Fund Operating ExpensesAfter Fee Waivers and/or ExpenseReimbursements1 0.99%
1 The Fund’s investment adviser, The Variable Annuity Life InsuranceCompany, has contractually agreed to reimburse the expenses of theFund through September 30, 2021, so that the Fund’s Total AnnualFund Operating Expenses After Expense Reimbursement do notexceed 0.99%. For purposes of the Expense Limitation Agreement,“Total Annual Fund Operating Expenses” shall not includeextraordinary expenses (i.e., expenses that are unusual in nature andinfrequent in occurrence, such as litigation), or acquired fund feesand expenses, brokerage commissions and other transactionalexpenses relating to the purchase and sale of portfolio securities,interest, taxes and governmental fees, and other expenses notincurred in the ordinary course of the Fund’s business. This ExpenseLimitation Agreement will continue in effect from year to yearthereafter unless terminated by the Board of Directors prior to anysuch renewal.
Expense Example
This Example is intended to help you compare the cost ofinvesting in the Fund with the cost of investing in othermutual funds. The Example assumes that you invest$10,000 in the Fund for the time periods indicated andthen redeem all of your shares at the end of those periods.The Example also assumes that your investment has a 5%return each year and that the Fund’s operating expensesinclude expense reimbursements for year one. TheExample does not reflect charges imposed by the VariableContract. If the Variable Contract fees were reflected, theexpenses would be higher. See the Variable Contract
prospectus for information on such charges. Althoughyour actual costs may be higher or lower, based on theseassumptions and the net expenses shown in the fee table,your costs would be:
1 Year 3 Years 5 Years 10 Years
$101 $320 $556 $1,234
Portfolio Turnover
The Fund pays transaction costs, such as commissions,when it buys and sells securities (or “turns over” itsportfolio). These costs, which are not reflected in annualfund operating expenses or in the Example, affect theFund’s performance.
During the most recent fiscal year, the Fund’s portfolioturnover rate was 87% of the average value of its portfolio.
Principal Investment Strategies of the Fund
The Fund normally invests at least 80% of its net assetsin small-cap companies. The Fund considers a companyto be a small-cap company if its market capitalization, atthe time of purchase, is equal to or less than the marketcapitalization of the largest company in the Russell 2000®
Index during the most recent 12-month period. As ofMay 8, 2020, the market capitalization range of thecompanies in the Russell 2000® Index was approximately$94.8 million to 4.4 billion. Some companies may outgrowthe definition of a small company after the Fund haspurchased their securities. These companies continue tobe considered small for purposes of the Fund’s minimum80% allocation to small-cap companies.
The Fund typically invests most of its assets in securitiesof U.S. companies but may also invest a portion of itsassets in foreign securities (up to 10% of net assets).
The Subadviser may engage in active and frequent tradingof portfolio securities to achieve the Fund’s investmentobjective.
In order to generate additional income, the Fund may lendportfolio securities to broker-dealers and other financialinstitutions provided that the value of the loaned securitiesdoes not exceed 30% of the Fund’s total assets. Theseloans earn income for the Fund and are collateralized bycash and securities issued or guaranteed by the U.S.Government or its agencies or instrumentalities. Investorswill be given at least 60 days’ written notice in advance ofany change to the Fund’s 80% investment policy set forthabove.
FUND SUMMARY: SMALL CAP AGGRESSIVE GROWTH FUND
- 96 -

Principal Risks of Investing in the Fund
As with any mutual fund, there can be no assurance thatthe Fund’s investment objective will be met or that the netreturn on an investment in the Fund will exceed what couldhave been obtained through other investment or savingsvehicles. Shares of the Fund are not bank deposits andare not guaranteed or insured by any bank, governmententity or the Federal Deposit Insurance Corporation. If thevalue of the assets of the Fund goes down, you could losemoney.
The following is a summary of the principal risks ofinvesting in the Fund.
Management Risk. The investment style or strategy usedby the Subadviser may fail to produce the intended result.The Subadviser’s assessment of a particular security orcompany may prove incorrect, resulting in losses orunderperformance.
Small-Cap Company Risk. Investing in small-capcompanies carries the risk that due to current marketconditions these companies may be out of favor withinvestors. Small companies often are in the early stagesof development with limited product lines, markets, orfinancial resources and managements lacking depth andexperience, which may cause their stock prices to bemorevolatile than those of larger companies. Small companystocks may be less liquid yet subject to abrupt or erraticprice movements. It may take a substantial period of timebefore the Fund realizes a gain on an investment in asmall-cap company, if it realizes any gain at all.
Active Trading Risk. High portfolio turnover rates thatare associated with active trading may result in highertransaction costs, which can adversely affect the Fund’sperformance. Active trading tends to be more pronouncedduring periods of increased market volatility.
Currency Risk. Because the Fund’s foreign investmentsare generally held in foreign currencies, the Fund couldexperience gains or losses based solely on changes in theexchange rate between foreign currencies and the U.S.dollar. Such gains or losses may be substantial.
Dividend-paying Stocks Risk. There is no guaranteethat the issuers of the stocks held by the Fund will declaredividends in the future or that, if dividends are declared,they will remain at their current levels or increase overtime. Dividend-paying stocks may not participate in abroad market advance to the same degree as otherstocks, and a sharp rise in interest rates or economic
downturn could cause a company to unexpectedly reduceor eliminate its dividend.
Equity Securities Risk. The Fund invests principally inequity securities and is therefore subject to the risk thatstock prices will fall and may underperform other assetclasses. Individual stock prices fluctuate from day-to-dayand may decline significantly. The prices of individualstocks may be negatively affected by poor companyresults or other factors affecting individual prices, as wellas industry and/or economic trends and developmentsaffecting industries or the securities market as a whole.
Growth Style Risk. Generally, “growth” stocks are stocksof companies that a subadviser believes have anticipatedearnings ranging from steady to accelerated growth.Many investors buy growth stocks because of anticipatedsuperior earnings growth, but earnings disappointmentsoften result in sharp price declines. Growth companiesusually invest a high portion of earnings in their ownbusinesses so their stocks may lack the dividends that cancushion share prices in a down market. In addition, thevalue of growth stocks may be more sensitive to changesin current or expected earnings than the value of otherstocks, because growth stocks trade at higher pricesrelative to current earnings.
Foreign Investment Risk. Investment in foreignsecurities involves risks due to several factors, such asilliquidity, the lack of public information, changes in theexchange rates between foreign currencies and the U.S.dollar, unfavorable political, social and legaldevelopments, or economic and financial instability.Foreign companies are not subject to the U.S. accountingand financial reporting standards and may have riskiersettlement procedures. U.S. investments that aredenominated in foreign currencies or that are traded inforeign markets, or securities of U.S. companies that havesignificant foreign operations may be subject to foreigninvestment risk.
Market Risk. The Fund’s share price can fall because ofweakness in the broad market, a particular industry, orspecific holdings or due to adverse political or economicdevelopments here or abroad, changes in investorpsychology, or heavy institutional selling and otherconditions or events (including, for example, militaryconfrontations, war, terrorism, disease/virus, outbreaksand epidemics). The prices of individual securities mayfluctuate, sometimes dramatically, from day to day. Theprices of stocks and other equity securities tend to bemore volatile than those of fixed-income securities.
FUND SUMMARY: SMALL CAP AGGRESSIVE GROWTH FUND
- 97 -

The coronavirus pandemic and the related governmentaland public responses have had and may continue to havean impact on the Fund’s investments and net asset valueand have led and may continue to lead to increasedmarket volatility and the potential for illiquidity in certainclasses of securities and sectors of the market.Preventative or protective actions that governments maytake in respect of pandemic or epidemic diseases mayresult in periods of business disruption, businessclosures, inability to obtain raw materials, supplies andcomponent parts, and reduced or disrupted operations forthe issuers in which the Fund invests. Governmentintervention in markets may impact interest rates, marketvolatility and security pricing. The occurrence,reoccurrence and pendency of such diseases couldadversely affect the economies (including throughchanges in business activity and increasedunemployment) and financial markets either in specificcountries or worldwide.
Securities Lending Risk. Engaging in securities lendingcould increase the market and credit risk for Fundinvestments. The Fund may lose money if it does notrecover borrowed securities, the value of the collateralfalls, or the value of investments made with cash collateraldeclines. If the value of either the cash collateral or theFund’s investments of the cash collateral falls below theamount owed to a borrower, the Fund also may incurlosses that exceed the amount it earned on lending thesecurity. Securities lending also involves the risks of delayin receiving additional collateral or possible loss of rightsin the collateral if the borrower fails. Another risk ofsecurities lending is the risk that the loaned portfoliosecurities may not be available to the Fund on a timelybasis and the Fund may therefore lose the opportunity tosell the securities at a desirable price.
Performance Information
The following Risk/Return Bar Chart and Table illustratethe risks of investing in the Fund by showing changes inthe Fund’s performance from calendar year to calendaryear and comparing the Fund’s average annual returns tothose of the Russell 2000® Growth Index. Fees andexpenses incurred at the contract level are not reflected inthe bar chart or table. If these amounts were reflected,returns would be less than those shown. Of course, past
performance is not necessarily an indication of how theFund will perform in the future.
From November 6, 2006 through August 19, 2011, WellsCapital Management Incorporated served as subadviser.RS Investment Management Co. LLC (“RS Investments”)became the sub-adviser on August 22, 2011. Upon theacquisition of RS Investments on July 29, 2016, VictoryCapital Management Inc. (“Victory Capital”) assumedsub-advisory duties for the Fund.
27.81%
-10.21%
15.07%
49.73%
9.91%
1.50% 1.79%
37.88%
-8.35%
38.60%
-20%
-10%
0%
10%
20%
30%
40%
50%
60%
2010 2011 2012 2013 2014 2015 2016 2017 2018 2019
During the 10-year period shown in the bar chart, thehighest return for a quarter was 22.94% (quarter endedMarch 31, 2019) and the lowest return for a quarter was-23.81% (quarter ended September 30, 2011). The year-to-date calendar return as of June 30, 2020 was 2.58%.
Average Annual Total Returns (For the periods endedDecember 31, 2019)
1Year
5Years
10Years
Fund 38.60% 12.59% 14.67%Russell 2000® GrowthIndex (reflects nodeduction for fees,expenses or taxes) 28.48% 9.34% 13.01%
Investment Adviser
The Fund’s investment adviser is The Variable AnnuityLife Insurance Company.
FUND SUMMARY: SMALL CAP AGGRESSIVE GROWTH FUND
- 98 -

The Fund is subadvised by Victory Capital.
Portfolio Managersg
Name and Title
PortfolioManager ofthe FundSince
D. Scott Tracy, CFACIO/Portfolio Manager/Analyst.................... 2011
Stephen J. BishopPortfolio Manager/Analyst ........................... 2011
Melissa Chadwick-DunnPortfolio Manager/Analyst ........................... 2011
Christopher W. Clark, CFAPortfolio Manager/Analyst ........................... 2014
Paul Leung, CFAPortfolio Manager/Analyst ........................... 2018
For important information about purchases and sales ofFund shares, taxes and payments to broker-dealers andother financial intermediaries, please turn to the section“Important Additional Information” on page 127.
FUND SUMMARY: SMALL CAP AGGRESSIVE GROWTH FUND
- 99 -

Investment Objective
The Fund seeks to provide long-term capital growth byinvesting primarily in the stocks of small companies.
Fees and Expenses of the Fund
This table describes the fees and expenses that you maypay if you buy and hold shares of the Fund. The Fund’sannual operating expenses do not reflect the separateaccount fees charged in the variable annuity or variablelife insurance policy (“Variable Contracts”) in which theFund is offered. If separate account fees were shown, theFund’s annual operating expenses would be higher.Please see your Variable Contract prospectus for moredetails on the separate account fees.
Annual Fund Operating Expenses (expenses that yougpay each year as a percentage of the value of yourinvestment)
Management Fees 0.89%Other Expenses 0.14%Total Annual Fund Operating Expenses 1.03%Fee Waivers and/or Expense Reimbursements1 -0.10%Total Annual Fund Operating ExpensesAfter Fee Waivers and/or ExpenseReimbursements1 0.93%
1 The Fund’s investment adviser, The Variable Annuity Life InsuranceCompany, has contractually agreed to reimburse the expenses of theFund through September 30, 2021, so that the Fund’s Total AnnualFund Operating Expenses After Expense Reimbursement do notexceed 0.93%. For purposes of the Expense Limitation Agreement,“Total Annual Fund Operating Expenses” shall not includeextraordinary expenses (i.e., expenses that are unusual in nature andinfrequent in occurrence, such as litigation), or acquired fund feesand expenses, brokerage commissions and other transactionalexpenses relating to the purchase and sale of portfolio securities,interest, taxes and governmental fees, and other expenses notincurred in the ordinary course of the Fund’s business. This ExpenseLimitation Agreement will continue in effect from year to yearthereafter unless terminated by the Board of Directors prior to anysuch renewal.
Expense Example
This Example is intended to help you compare the cost ofinvesting in the Fund with the cost of investing in othermutual funds. The Example assumes that you invest$10,000 in the Fund for the time periods indicated andthen redeem all of your shares at the end of those periods.The Example also assumes that your investment has a 5%return each year and that the Fund’s operating expensesinclude expense reimbursements for year one. TheExample does not reflect charges imposed by the VariableContract. If the Variable Contract fees were reflected, theexpenses would be higher. See the Variable Contract
prospectus for information on such charges. Althoughyour actual costs may be higher or lower, based on theseassumptions and the net expenses shown in the fee table,your costs would be:
1 Year 3 Years 5 Years 10 Years
$95 $318 $559 $1,250
Portfolio Turnover
The Fund pays transaction costs, such as commissions,when it buys and sells securities (or “turns over” itsportfolio). These costs, which are not reflected in annualfund operating expenses or in the Example, affect theFund’s performance.
During the most recent fiscal year, the Fund’s portfolioturnover rate was 25% of the average value of its portfolio.
Principal Investment Strategies of the Fund
The Fund normally invests at least 80% of net assets instocks of small companies. A company is considered a“small” company if its total market value (capitalization), atthe time of purchase, falls (i) within or below the range ofcompanies in either the current Russell 2000® Index or theS&P SmallCap 600® Index or (ii) below the three-yearaverage maximum market cap of companies in eitherindex as of December 31 of the three preceding years.The Fund will not automatically sell or cease to purchasestock of a company it already owns just because thecompany’s market capitalization grows or falls outside thisrange. The Russell 2000® and S&P SmallCap 600®
Indexes are widely used benchmarks for small-cap stockperformance. The market capitalization range and thecomposition of the Russell 2000® and S&P SmallCap600® Indexes are subject to change. If the companies inwhich the Fund invests are successful, these companiesmay grow into mid- and large-cap companies.
The Fund may purchase stocks that have a marketcapitalization above the range if the companies appear tohave better prospects for capital appreciation. Stockselection may reflect a growth or a value investmentapproach or a combination of both.
In order to generate additional income, the Fund may lendportfolio securities to broker-dealers and other financialinstitutions provided that the value of the loaned securitiesdoes not exceed 30% of the Fund’s total assets. Theseloans earn income for the Fund and are collateralized bycash and securities issued or guaranteed by the U.S.Government or its agencies or instrumentalities. Investorswill be given at least 60 days’ written notice in advance of
FUND SUMMARY: SMALL CAP FUND
- 100 -
any change to the Fund’s 80% investment policy set forthabove.
Principal Risks of Investing in the Fund
As with any mutual fund, there can be no assurance thatthe Fund’s investment objective will be met or that the netreturn on an investment in the Fund will exceed what couldhave been obtained through other investment or savingsvehicles. Shares of the Fund are not bank deposits andare not guaranteed or insured by any bank, governmententity or the Federal Deposit Insurance Corporation. If thevalue of the assets of the Fund goes down, you could losemoney.
The following is a summary of the principal risks ofinvesting in the Fund.
Management Risk. The investment style or strategy usedby the Subadviser may fail to produce the intended result.The Subadviser’s assessment of a particular security orcompany may prove incorrect, resulting in losses orunderperformance.
Small-Cap Company Risk. Investing in small-capcompanies carries the risk that due to current marketconditions these companies may be out of favor withinvestors. Small companies often are in the early stagesof development with limited product lines, markets, orfinancial resources and managements lacking depth andexperience, which may cause their stock prices to bemorevolatile than those of larger companies. Small companystocks may be less liquid yet subject to abrupt or erraticprice movements. It may take a substantial period of timebefore the Fund realizes a gain on an investment in asmall-cap company, if it realizes any gain at all.
Micro-Cap Company Risk. Micro-cap companies aregenerally subject to the same risks as small-capcompanies. However, the prices of micro-cap companiesare generally more volatile. In addition, because micro-cap securities tend to have significantly lower tradingvolumes, the Fund may have difficulty selling holdings ormay only be able to sell holdings at prices substantiallylower than the Subadviser believes they are worth.Therefore, the Fund may involve considerably more risk ofloss and its returns may differ significantly from fundsinvesting in larger-cap companies or other asset classes.For more information about the risks of investing in small-cap companies please see Small-Cap Company Riskabove.
Dividend-paying Stocks Risk. There is no guaranteethat the issuers of the stocks held by the Fund will declaredividends in the future or that, if dividends are declared,they will remain at their current levels or increase overtime. Dividend-paying stocks may not participate in a
broad market advance to the same degree as otherstocks, and a sharp rise in interest rates or economicdownturn could cause a company to unexpectedly reduceor eliminate its dividend.
Equity Securities Risk. The Fund invests principally inequity securities and is therefore subject to the risk thatstock prices will fall and may underperform other assetclasses. Individual stock prices fluctuate from day-to-dayand may decline significantly. The prices of individualstocks may be negatively affected by poor companyresults or other factors affecting individual prices, as wellas industry and/or economic trends and developmentsaffecting industries or the securities market as a whole.
Market Risk. The Fund’s share price can fall because ofweakness in the broad market, a particular industry, orspecific holdings or due to adverse political or economicdevelopments here or abroad, changes in investorpsychology, or heavy institutional selling and otherconditions or events (including, for example, militaryconfrontations, war, terrorism, disease/virus, outbreaksand epidemics). The prices of individual securities mayfluctuate, sometimes dramatically, from day to day. Theprices of stocks and other equity securities tend to bemore volatile than those of fixed-income securities.
The coronavirus pandemic and the related governmentaland public responses have had and may continue to havean impact on the Fund’s investments and net asset valueand have led and may continue to lead to increasedmarket volatility and the potential for illiquidity in certainclasses of securities and sectors of the market.Preventative or protective actions that governments maytake in respect of pandemic or epidemic diseases mayresult in periods of business disruption, businessclosures, inability to obtain raw materials, supplies andcomponent parts, and reduced or disrupted operations forthe issuers in which the Fund invests. Governmentintervention in markets may impact interest rates, marketvolatility and security pricing. The occurrence,reoccurrence and pendency of such diseases couldadversely affect the economies (including throughchanges in business activity and increasedunemployment) and financial markets either in specificcountries or worldwide.
Securities Lending Risk. Engaging in securities lendingcould increase the market and credit risk for Fundinvestments. The Fund may lose money if it does notrecover borrowed securities, the value of the collateralfalls, or the value of investments made with cash collateraldeclines. If the value of either the cash collateral or theFund’s investments of the cash collateral falls below theamount owed to a borrower, the Fund also may incurlosses that exceed the amount it earned on lending the
FUND SUMMARY: SMALL CAP FUND
- 101 -

security. Securities lending also involves the risks of delayin receiving additional collateral or possible loss of rightsin the collateral if the borrower fails. Another risk ofsecurities lending is the risk that the loaned portfoliosecurities may not be available to the Fund on a timelybasis and the Fund may therefore lose the opportunity tosell the securities at a desirable price.
Growth Style Risk. Generally, “growth” stocks are stocksof companies that a subadviser believes have anticipatedearnings ranging from steady to accelerated growth.Many investors buy growth stocks because of anticipatedsuperior earnings growth, but earnings disappointmentsoften result in sharp price declines. Growth companiesusually invest a high portion of earnings in their ownbusinesses so their stocks may lack the dividends that cancushion share prices in a down market. In addition, thevalue of growth stocks may be more sensitive to changesin current or expected earnings than the value of otherstocks, because growth stocks trade at higher pricesrelative to current earnings.
Value Style Risk. Generally, “value” stocks are stocks ofcompanies that a subadviser believes are currentlyundervalued in the marketplace. A subadviser’s judgmentthat a particular security is undervalued in relation to thecompany’s fundamental economic value may proveincorrect and the price of the company’s stock may fall ormay not approach the value the subadviser has placed onit.
Performance Information
The following Risk/Return Bar Chart and Table illustratethe risks of investing in the Fund by showing changes inthe Fund’s performance from calendar year to calendaryear and comparing the Fund’s average annual returns tothose of the Russell 2000® Index. Fees and expensesincurred at the contract level are not reflected in the barchart or table. If these amounts were reflected, returnswould be less than those shown. Of course, pastperformance is not necessarily an indication of how theFund will perform in the future.
T. Rowe Price Associates, Inc. (“T. Rowe Price”) hasserved as sub-adviser of the Fund since its inception.American Century Investment Management and FranklinPortfolio Associate served as sub-advisers from June 21,
2004 through March 7, 2008. Bridgeway CapitalManagement, Inc. (“Bridgeway”) became a sub-adviser onOctober 1, 2006. Effective March 7, 2017, J.P. MorganInvestment Management Inc. (“JPMIM”), assumedmanagement of a portion of the Fund. From March 10,2008 to March 6, 2017, the portion of the Fund managedby JPMIM was managed by Invesco Advisers, Inc.
The percentage of the Fund’s assets that each sub-adviser manages may, at the adviser’s discretion, changefrom time to time.
29.55%
-0.76%
15.85%
40.42%
4.00%
-4.78%
15.29% 14.72%
-7.78%
29.43%
-20%
-10%
0%
10%
20%
30%
40%
50%
2010 2011 2012 2013 2014 2015 2016 2017 2018 2019
During the 10-year period shown in the bar chart, thehighest return for a quarter was 17.05% (quarter endedDecember 31, 2010) and the lowest return for a quarterwas -22.57% (quarter ended September 30, 2011). Theyear-to-date calendar return as of June 30, 2020 was-9.07%.
Average Annual Total Returns (For the periods endedDecember 31, 2019)
1Year
5Years
10Years
Fund 29.43% 8.49% 12.58%Russell 2000® Index (reflectsno deduction for fees,expenses or taxes) 25.52% 8.23% 11.83%
Investment Adviser
The Fund’s investment adviser is The Variable AnnuityLife Insurance Company.
FUND SUMMARY: SMALL CAP FUND
- 102 -

The Fund is subadvised by Bridgeway, JPMIM andT. Rowe Price.
Portfolio Managersg
Name and Title
PortfolioManager of theFund Since
Bridgewayg yJohn N.R. MontgomeryChief Investment Officer, PortfolioManager ................................................ 2006
Elena Khoziaeva, CFAPortfolio Manager .................................. 2006
Michael Whipple, CFAPortfolio Manager .................................. 2006
Christine L. Wang, CFA, CPAPortfolio Manager .................................. 2010
JPMIMDon San JoseManaging Director and Lead PortfolioManager ................................................ 2017
Dan PercellaManaging Director and PortfolioManager ................................................ 2017
T. Rowe PriceFrank M. AlonsoVice President and Portfolio Manager ... 2016
For important information about purchases and sales ofFund shares, taxes and payments to broker-dealers andother financial intermediaries, please turn to the section“Important Additional Information” on page 127.
FUND SUMMARY: SMALL CAP FUND
- 103 -

Investment Objective
The Fund seeks to provide growth of capital throughinvestment primarily in a diversified portfolio of commonstocks that, as a group, the subadviser believes mayprovide investment results closely corresponding to theperformance of the Russell 2000® Index (the “Index”).
Fees and Expenses of the Fund
This table describes the fees and expenses that you maypay if you buy and hold shares of the Fund. The Fund’sannual operating expenses do not reflect the separateaccount fees charged in the variable annuity or variablelife insurance policy (“Variable Contracts”) in which theFund is offered. If separate account fees were shown, theFund’s annual operating expenses would be higher.Please see your Variable Contract prospectus for moredetails on the separate account fees.
Annual Fund Operating Expenses (expenses that yougpay each year as a percentage of the value of yourinvestment)
Management Fees 0.30%Other Expenses 0.14%Total Annual Fund Operating Expenses 0.44%
Expense Example
This Example is intended to help you compare the cost ofinvesting in the Fund with the cost of investing in othermutual funds. The Example assumes that you invest$10,000 in the Fund for the time periods indicated andthen redeem all of your shares at the end of those periods.The Example also assumes that your investment has a 5%return each year and that the Fund’s operating expensesremain the same. The Example does not reflect chargesimposed by the Variable Contract. If the Variable Contractfees were reflected, the expenses would be higher. Seethe Variable Contract prospectus for information on suchcharges. Although your actual costs may be higher orlower, based on these assumptions and the net expensesshown in the fee table, your costs would be:
1 Year 3 Years 5 Years 10 Years
$45 $141 $246 $555
Portfolio Turnover
The Fund pays transaction costs, such as commissions,when it buys and sells securities (or “turns over” itsportfolio). These costs, which are not reflected in annualfund operating expenses or in the Example, affect theFund’s performance.
During the most recent fiscal year, the Fund’s portfolioturnover rate was 13% of the average value of its portfolio.
Principal Investment Strategies of the Fund
The Fund is managed to seek to track the performance ofthe Index, which measures the performance of thoseRussell 2000 companies with higher price-to-book ratiosand higher forecasted growth values. The Subadviser mayendeavor to track the Index by purchasing every stockincluded in the Index, in the same proportions. Or, in thealternative, the Subadviser may invest in a sampling ofIndex stocks by utilizing a statistical technique known as“optimization.” The goal of optimization is to select stockswhich ensure that various industry weightings, marketcapitalizations, and fundamental characteristics (e.g.,price-to-book, price-to-earnings, debt-to-asset ratios anddividend yields) closely approximate those of the Index.
The Fund invests, under normal circumstances, at least80% of net assets in stocks that are in the Index. Althoughthe Fund seeks to track the performance of the Index, theperformance of the Fund will not match that of the Indexexactly because, among other reasons, the Fund incursoperating expenses and other investment overhead aspart of its normal operations.
In order to generate additional income, the Fund may lendportfolio securities to broker-dealers and other financialinstitutions provided that the value of the loaned securitiesdoes not exceed 30% of the Fund’s total assets. Theseloans earn income for the Fund and are collateralized bycash and securities issued or guaranteed by the U.S.Government or its agencies or instrumentalities. Investorswill be given at least 60 days’ written notice in advance ofany change to the Fund’s 80% investment policy set forthabove.
Principal Risks of Investing in the Fund
As with any mutual fund, there can be no assurance thatthe Fund’s investment objective will be met or that the netreturn on an investment in the Fund will exceed what couldhave been obtained through other investment or savingsvehicles. Shares of the Fund are not bank deposits andare not guaranteed or insured by any bank, governmententity or the Federal Deposit Insurance Corporation. If thevalue of the assets of the Fund goes down, you could losemoney.
The following is a summary of the principal risks ofinvesting in the Fund.
Index Risk. In attempting to track the performance of theindex, the Fund may be more susceptible to adversedevelopments concerning a particular security, companyor industry because the Fund generally will not use anydefensive strategies to mitigate its risk exposure.
FUND SUMMARY: SMALL CAP INDEX FUND
- 104 -
Failure to Match Index Performance Risk. The ability ofthe Fund to match the performance of the UnderlyingIndex may be affected by, among other things, changes insecurities markets, the manner in which performance ofthe Underlying Index is calculated, changes in thecomposition of the Underlying Index, the amount andtiming of cash flows into and out of the Fund,commissions, portfolio expenses, and any differences inthe pricing of securities by the Fund and the UnderlyingIndex. When the Fund employs an “optimization” strategy,the Fund is subject to an increased risk of tracking error,in that the securities selected in the aggregate for theFund may perform differently than the Index.
Market Risk. The Fund’s share price can fall because ofweakness in the broad market, a particular industry, orspecific holdings or due to adverse political or economicdevelopments here or abroad, changes in investorpsychology, or heavy institutional selling and otherconditions or events (including, for example, militaryconfrontations, war, terrorism, disease/virus, outbreaksand epidemics). The prices of individual securities mayfluctuate, sometimes dramatically, from day to day. Theprices of stocks and other equity securities tend to bemore volatile than those of fixed-income securities.
The coronavirus pandemic and the related governmentaland public responses have had and may continue to havean impact on the Fund’s investments and net asset valueand have led and may continue to lead to increasedmarket volatility and the potential for illiquidity in certainclasses of securities and sectors of the market.Preventative or protective actions that governments maytake in respect of pandemic or epidemic diseases mayresult in periods of business disruption, businessclosures, inability to obtain raw materials, supplies andcomponent parts, and reduced or disrupted operations forthe issuers in which the Fund invests. Governmentintervention in markets may impact interest rates, marketvolatility and security pricing. The occurrence,reoccurrence and pendency of such diseases couldadversely affect the economies (including throughchanges in business activity and increasedunemployment) and financial markets either in specificcountries or worldwide.
Equity Securities Risk. The Fund’s investments in equitysecurities are subject to the risk that stock prices will falland may underperform other asset classes. Individual
stock prices fluctuate from day-to-day and may declinesignificantly. The prices of individual stocks may benegatively affected by poor company results or otherfactors affecting individual prices, as well as industry and/or economic trends and developments affecting industriesor the securities market as a whole.
Small-Cap Company Risk. Investing in small-capcompanies carries the risk that due to current marketconditions these companies may be out of favor withinvestors. Small companies often are in the early stagesof development with limited product lines, markets, orfinancial resources and managements lacking depth andexperience, which may cause their stock prices to bemorevolatile than those of larger companies. Small companystocks may be less liquid yet subject to abrupt or erraticprice movements. It may take a substantial period of timebefore the Fund realizes a gain on an investment in asmall-cap company, if it realizes any gain at all.
Securities Lending Risk. Engaging in securities lendingcould increase the market and credit risk for Fundinvestments. The Fund may lose money if it does notrecover borrowed securities, the value of the collateralfalls, or the value of investments made with cash collateraldeclines. If the value of either the cash collateral or theFund’s investments of the cash collateral falls below theamount owed to a borrower, the Fund also may incurlosses that exceed the amount it earned on lending thesecurity. Securities lending also involves the risks of delayin receiving additional collateral or possible loss of rightsin the collateral if the borrower fails. Another risk ofsecurities lending is the risk that the loaned portfoliosecurities may not be available to the Fund on a timelybasis and the Fund may therefore lose the opportunity tosell the securities at a desirable price.
Performance Information
The following Risk/Return Bar Chart and Table illustratethe risks of investing in the Fund by showing changes inthe Fund’s performance from calendar year to calendaryear and comparing the Fund’s average annual returns tothose of the Russell 2000® Index. Fees and expensesincurred at the contract level are not reflected in the barchart or table. If these amounts were reflected, returnswould be less than those shown. Of course, pastperformance is not necessarily an indication of how theFund will perform in the future.
FUND SUMMARY: SMALL CAP INDEX FUND
- 105 -
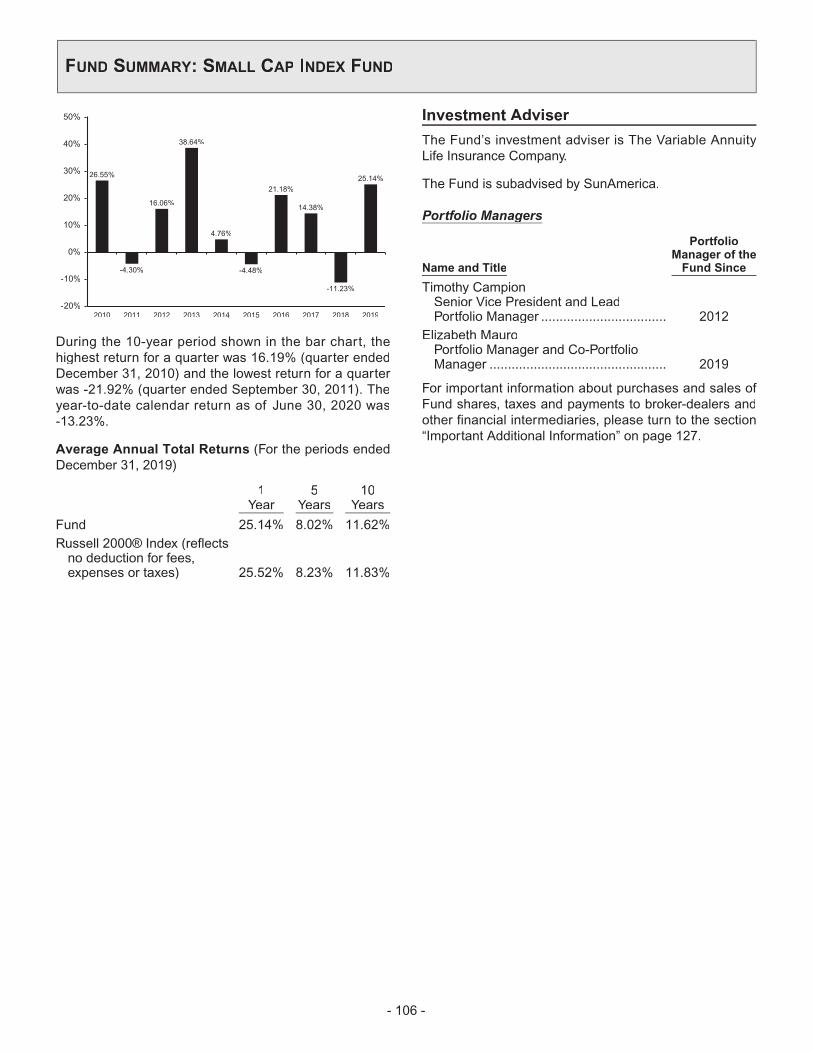
26.55%
-4.30%
16.06%
38.64%
4.76%
-4.48%
21.18%
14.38%
-11.23%
25.14%
-20%
-10%
0%
10%
20%
30%
40%
50%
2010 2011 2012 2013 2014 2015 2016 2017 2018 2019
During the 10-year period shown in the bar chart, thehighest return for a quarter was 16.19% (quarter endedDecember 31, 2010) and the lowest return for a quarterwas -21.92% (quarter ended September 30, 2011). Theyear-to-date calendar return as of June 30, 2020 was-13.23%.
Average Annual Total Returns (For the periods endedDecember 31, 2019)
1Year
5Years
10Years
Fund 25.14% 8.02% 11.62%Russell 2000® Index (reflectsno deduction for fees,expenses or taxes) 25.52% 8.23% 11.83%
Investment Adviser
The Fund’s investment adviser is The Variable AnnuityLife Insurance Company.
The Fund is subadvised by SunAmerica.
Portfolio Managersg
Name and Title
PortfolioManager of theFund Since
Timothy CampionSenior Vice President and LeadPortfolio Manager .................................. 2012
Elizabeth MauroPortfolio Manager and Co-PortfolioManager ................................................ 2019
For important information about purchases and sales ofFund shares, taxes and payments to broker-dealers andother financial intermediaries, please turn to the section“Important Additional Information” on page 127.
FUND SUMMARY: SMALL CAP INDEX FUND
- 106 -
Investment Objective
The Fund seeks to produce growth of capital by investingprimarily in common stocks.
Fees and Expenses of the Fund
This table describes the fees and expenses that you maypay if you buy and hold shares of the Fund. The Fund’sannual operating expenses do not reflect the separateaccount fees charged in the variable annuity or variablelife insurance policy (“Variable Contracts”) in which theFund is offered. If separate account fees were shown, theFund’s annual operating expenses would be higher.Please see your Variable Contract prospectus for moredetails on the separate account fees.
Annual Fund Operating Expenses (expenses that yougpay each year as a percentage of the value of yourinvestment)
Management Fees 0.75%Other Expenses 0.13%Total Annual Fund Operating Expenses 0.88%
Expense Example
This Example is intended to help you compare the cost ofinvesting in the Fund with the cost of investing in othermutual funds. The Example assumes that you invest$10,000 in the Fund for the time periods indicated andthen redeem all of your shares at the end of those periods.The Example also assumes that your investment has a 5%return each year and that the Fund’s operating expensesremain the same. The Example does not reflect chargesimposed by the Variable Contract. If the Variable Contractfees were reflected, the expenses would be higher. Seethe Variable Contract prospectus for information on suchcharges. Although your actual costs may be higher orlower, based on these assumptions and the net expensesshown in the fee table, your costs would be:
1 Year 3 Years 5 Years 10 Years
$90 $281 $488 $1,084
Portfolio Turnover
The Fund pays transaction costs, such as commissions,when it buys and sells securities (or “turns over” itsportfolio). These costs, which are not reflected in annualfund operating expenses or in the Example, affect theFund’s performance.
During the most recent fiscal year, the Fund’s portfolioturnover rate was 37% of the average value of its portfolio.
Principal Investment Strategies of the Fund
Under normal market conditions, the Fund invests at least80% of its net assets in common stocks of domesticsmall-cap companies. Generally, small-cap companieswill include companies whose market capitalizations, atthe time of purchase, are equal to or less than the marketcapitalization of the largest company in the Russell 2000®Index during the most recent 12-month period. As ofMay 8, 2020, the market capitalization range of thecompanies in the Russell 2000® Index was $94.8 millionto $4.4 billion.
The Subadviser looks for undervalued companies that itbelieves have the potential for above-average capitalappreciation with below-average risk. Rigorousfundamental research drives its search for companies withfavorable reward-to-risk ratios and that possess a long-term competitive advantage provided by a durable assetbase, strong balance sheets, and sustainable andsuperior cash flows. Typical investments include stocks ofcompanies that are generally out of favor in themarketplace, or are undergoing reorganization or othercorporate action that may create above-average priceappreciation. The Subadviser regularly reviews theinvestments of the portfolio and may sell a portfolioholding when a stock nears its price target, downside risksincrease considerably, the company’s fundamentals havedeteriorated, or the Subadviser identifies a more attractiveinvestment opportunity.
In order to generate additional income, the Fund may lendportfolio securities to broker-dealers and other financialinstitutions provided that the value of the loaned securitiesdoes not exceed 30% of the Fund’s total assets. Theseloans earn income for the Fund and are collateralized bycash and securities issued or guaranteed by the U.S.Government or its agencies or instrumentalities. Investorswill be given at least 60 days’ written notice in advance ofany change to the Fund’s 80% investment policy set forthabove.
Principal Risks of Investing in the Fund
As with any mutual fund, there can be no assurance thatthe Fund’s investment objective will be met or that the netreturn on an investment in the Fund will exceed what couldhave been obtained through other investment or savingsvehicles. Shares of the Fund are not bank deposits andare not guaranteed or insured by any bank, governmententity or the Federal Deposit Insurance Corporation. If thevalue of the assets of the Fund goes down, you could losemoney.
FUND SUMMARY: SMALL CAP SPECIAL VALUES FUND
- 107 -

The following is a summary of the principal risks ofinvesting in the Fund.
Management Risk. The investment style or strategy usedby the Subadviser may fail to produce the intended result.The Subadviser’s assessment of a particular security orcompany may prove incorrect, resulting in losses orunderperformance.
Equity Securities Risk. The Fund invests principally inequity securities and is therefore subject to the risk thatstock prices will fall and may underperform other assetclasses. Individual stock prices fluctuate from day-to-dayand may decline significantly. The prices of individualstocks may be negatively affected by poor companyresults or other factors affecting individual prices, as wellas industry and/or economic trends and developmentsaffecting industries or the securities market as a whole.
Small-Cap Company Risk. Investing in small-capcompanies carries the risk that due to current marketconditions these companies may be out of favor withinvestors. Small companies often are in the early stagesof development with limited product lines, markets, orfinancial resources and managements lacking depth andexperience, which may cause their stock prices to bemorevolatile than those of larger companies. Small companystocks may be less liquid yet subject to abrupt or erraticprice movements. It may take a substantial period of timebefore the Fund realizes a gain on an investment in asmall-cap company, if it realizes any gain at all.
Value Style Risk. Generally, “value” stocks are stocks ofcompanies that a subadviser believes are currentlyundervalued in the marketplace. A subadviser’s judgmentthat a particular security is undervalued in relation to thecompany’s fundamental economic value may proveincorrect and the price of the company’s stock may fall ormay not approach the value the subadviser has placed onit.
Market Risk. The Fund’s share price can fall because ofweakness in the broad market, a particular industry, orspecific holdings or due to adverse political or economicdevelopments here or abroad, changes in investorpsychology, or heavy institutional selling and otherconditions or events (including, for example, militaryconfrontations, war, terrorism, disease/virus, outbreaksand epidemics). The prices of individual securities mayfluctuate, sometimes dramatically, from day to day. Theprices of stocks and other equity securities tend to bemore volatile than those of fixed-income securities.
The coronavirus pandemic and the related governmentaland public responses have had and may continue to have
an impact on the Fund’s investments and net asset valueand have led and may continue to lead to increasedmarket volatility and the potential for illiquidity in certainclasses of securities and sectors of the market.Preventative or protective actions that governments maytake in respect of pandemic or epidemic diseases mayresult in periods of business disruption, businessclosures, inability to obtain raw materials, supplies andcomponent parts, and reduced or disrupted operations forthe issuers in which the Fund invests. Governmentintervention in markets may impact interest rates, marketvolatility and security pricing. The occurrence,reoccurrence and pendency of such diseases couldadversely affect the economies (including throughchanges in business activity and increasedunemployment) and financial markets either in specificcountries or worldwide.
Securities Lending Risk. Engaging in securities lendingcould increase the market and credit risk for Fundinvestments. The Fund may lose money if it does notrecover borrowed securities, the value of the collateralfalls, or the value of investments made with cash collateraldeclines. If the value of either the cash collateral or theFund’s investments of the cash collateral falls below theamount owed to a borrower, the Fund also may incurlosses that exceed the amount it earned on lending thesecurity. Securities lending also involves the risks of delayin receiving additional collateral or possible loss of rightsin the collateral if the borrower fails. Another risk ofsecurities lending is the risk that the loaned portfoliosecurities may not be available to the Fund on a timelybasis and the Fund may therefore lose the opportunity tosell the securities at a desirable price.
Performance Information
The following Risk/Return Bar Chart and Table illustratethe risks of investing in the Fund by showing changes inthe Fund’s performance from calendar year to calendaryear and comparing the Fund’s average annual returns tothose of the Russell 2000® Value Index. Fees andexpenses incurred at the contract level are not reflected inthe bar chart or table. If these amounts were reflected,returns would be less than those shown. Of course, pastperformance is not necessarily an indication of how theFund will perform in the future.
Wells Capital Management Incorporated (and itspredecessor) (“WellsCap”) has sub-advised the Fundsince its inception. Putnam Investment Management, LLC(“Putnam”) served as a co-subadviser of the Fund frominception through September 11, 2009. Dreman ValueManagement, LLC (“Dreman”) replaced Putnam as the
FUND SUMMARY: SMALL CAP SPECIAL VALUES FUND
- 108 -
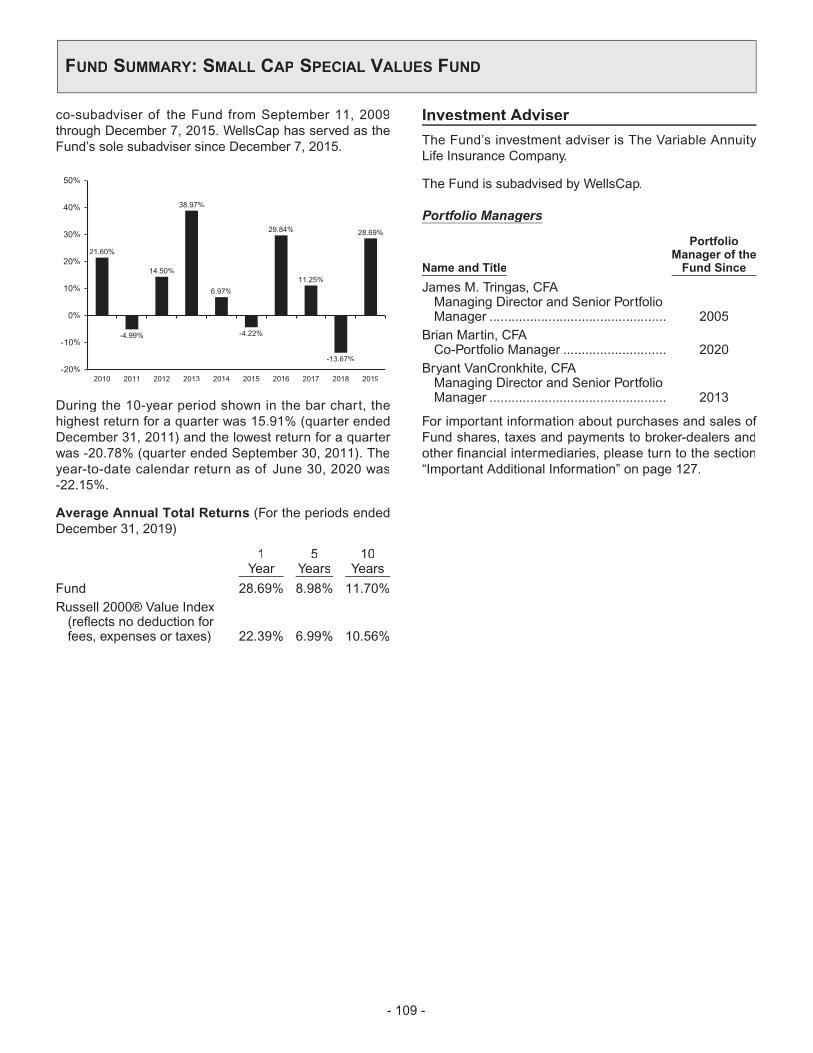
co-subadviser of the Fund from September 11, 2009through December 7, 2015. WellsCap has served as theFund’s sole subadviser since December 7, 2015.
21.60%
-4.99%
14.50%
38.97%
6.97%
-4.22%
29.84%
11.25%
-13.67%
28.69%
-20%
-10%
0%
10%
20%
30%
40%
50%
2010 2011 2012 2013 2014 2015 2016 2017 2018 2019
During the 10-year period shown in the bar chart, thehighest return for a quarter was 15.91% (quarter endedDecember 31, 2011) and the lowest return for a quarterwas -20.78% (quarter ended September 30, 2011). Theyear-to-date calendar return as of June 30, 2020 was-22.15%.
Average Annual Total Returns (For the periods endedDecember 31, 2019)
1Year
5Years
10Years
Fund 28.69% 8.98% 11.70%Russell 2000® Value Index(reflects no deduction forfees, expenses or taxes) 22.39% 6.99% 10.56%
Investment Adviser
The Fund’s investment adviser is The Variable AnnuityLife Insurance Company.
The Fund is subadvised by WellsCap.
Portfolio Managersg
Name and Title
PortfolioManager of theFund Since
James M. Tringas, CFAManaging Director and Senior PortfolioManager ................................................ 2005
Brian Martin, CFACo-Portfolio Manager ............................ 2020
Bryant VanCronkhite, CFAManaging Director and Senior PortfolioManager ................................................ 2013
For important information about purchases and sales ofFund shares, taxes and payments to broker-dealers andother financial intermediaries, please turn to the section“Important Additional Information” on page 127.
FUND SUMMARY: SMALL CAP SPECIAL VALUES FUND
- 109 -

Investment Objective
The Fund seeks capital growth by investing primarily incommon stocks.
Fees and Expenses of the Fund
This table describes the fees and expenses that you maypay if you buy and hold shares of the Fund. The Fund’sannual operating expenses do not reflect the separateaccount fees charged in the variable annuity or variablelife insurance policy (“Variable Contracts”) in which theFund is offered. If separate account fees were shown, theFund’s annual operating expenses would be higher.Please see your Variable Contract prospectus for moredetails on the separate account fees.
Annual Fund Operating Expenses (expenses that yougpay each year as a percentage of the value of yourinvestment)
Management Fees 0.85%Other Expenses 0.17%Acquired Fund Fees and Expenses 0.01%Total Annual Fund Operating Expenses1 1.03%Fee Waivers and/or Expense Reimbursements2 -0.07%Total Annual Fund Operating ExpensesAfter Fee Waivers and/or ExpenseReimbursements2 0.96%
1 The Total Annual Fund Operating Expenses for the Fund do notcorrelate to the ratio of net expenses to average net assets providedin the Financial Highlights table of the Fund’s annual report, whichreflects the gross operating expenses of the Fund (1.02%) and doesnot include Acquired Fund Fees and Expenses. “Acquired Fund Feesand Expenses” include fees and expenses incurred indirectly by theFund as a result of investments in shares of one or more mutualfunds, hedge funds, private equity funds or other pooled investmentvehicles.
2 The Fund’s investment adviser, The Variable Annuity Life InsuranceCompany, has contractually agreed to waive its advisory fee throughSeptember 30, 2021, so that the advisory fee payable by the Fund toVALIC equals 0.78% of average monthly assets on the first$250 million and 0.68% thereafter. This agreement may be modifiedor discontinued prior to such time only with the approval of the Boardof Directors of the Fund, including a majority of the directors who arenot “interested persons” of the Fund as defined in the InvestmentCompany Act of 1940, as amended.
Expense Example
This Example is intended to help you compare the cost ofinvesting in the Fund with the cost of investing in othermutual funds. The Example assumes that you invest$10,000 in the Fund for the time periods indicated andthen redeem all of your shares at the end of those periods.The Example also assumes that your investment has a 5%return each year and that the Fund’s operating expenses
include fee waivers for one year. The Example does notreflect charges imposed by the Variable Contract. If theVariable Contract fees were reflected, the expenses wouldbe higher. See the Variable Contract prospectus forinformation on such charges. Although your actual costsmay be higher or lower, based on these assumptions andthe net expenses shown in the fee table, your costs wouldbe:
1 Year 3 Years 5 Years 10 Years
$98 $321 $562 $1,253
Portfolio Turnover
The Fund pays transaction costs, such as commissions,when it buys and sells securities (or “turns over” itsportfolio). These costs, which are not reflected in annualfund operating expenses or in the Example, affect theFund’s performance.
During the most recent fiscal year, the Fund’s portfolioturnover rate was 67% of the average value of its portfolio.
Principal Investment Strategies of the Fund
The Fund pursues its investment objective by investingprimarily in common stocks selected for their growthpotential. In pursuing that objective, under normalcircumstances, the Fund invests at least 80% of its netassets in equity securities of small- and mid-capcompanies located in domestic (U.S.) markets.
Generally, small- and mid-cap companies includecompanies whose market capitalizations, at the time ofpurchase, are within the range of the marketcapitalizations of companies constituting the Russell2000® Growth Index and the Russell Midcap® GrowthIndex. If the market capitalization of a company held bythe Fund subsequently moves outside of this range, theFund is not required to sell the company’s securities. Asof May 31, 2020, the market capitalization ranges ofcompanies in the Russell 2000® Growth Index and theRussell Midcap® Growth Index were between$152.3million and $5 billion and $72.59 billion andmedian$9.502 billion, respectively.
In order to generate additional income, the Fund may lendportfolio securities to broker-dealers and other financialinstitutions provided that the value of the loaned securitiesdoes not exceed 30% of the Fund’s total assets. Theseloans earn income for the Fund and are collateralized bycash and securities issued or guaranteed by the U.S.Government or its agencies or instrumentalities. Investorswill be given at least 60 days’ written notice in advance of
FUND SUMMARY: SMALL-MID GROWTH FUND
- 110 -

any change to the Fund’s 80% investment policy set forthabove.
Principal Risks of Investing in the Fund
As with any mutual fund, there can be no assurance thatthe Fund’s investment objective will be met or that the netreturn on an investment in the Fund will exceed what couldhave been obtained through other investment or savingsvehicles. Shares of the Fund are not bank deposits andare not guaranteed or insured by any bank, governmententity or the Federal Deposit Insurance Corporation. If thevalue of the assets of the Fund goes down, you could losemoney.
The following is a summary of the principal risks ofinvesting in the Fund.
Management Risk. The investment style or strategy usedby the Subadviser may fail to produce the intended result.The Subadviser’s assessment of a particular security orcompany may prove incorrect, resulting in losses orunderperformance.
Dividend-paying Stocks Risk. There is no guaranteethat the issuers of the stocks held by the Fund will declaredividends in the future or that, if dividends are declared,they will remain at their current levels or increase overtime. Dividend-paying stocks may not participate in abroad market advance to the same degree as otherstocks, and a sharp rise in interest rates or economicdownturn could cause a company to unexpectedly reduceor eliminate its dividend.
Equity Securities Risk. The Fund invests primarily inequity securities and is therefore subject to the risk thatstock prices will fall and may underperform other assetclasses. Individual stock prices fluctuate from day-to-dayand may decline significantly. The prices of individualstocks may be negatively affected by poor companyresults or other factors affecting individual prices, as wellas industry and/or economic trends and developmentsaffecting industries or the securities market as a whole.
Growth Style Risk. Generally, “growth” stocks are stocksof companies that a subadviser believes have anticipatedearnings ranging from steady to accelerated growth.Many investors buy growth stocks because of anticipatedsuperior earnings growth, but earnings disappointmentsoften result in sharp price declines. Growth companiesusually invest a high portion of earnings in their ownbusinesses so their stocks may lack the dividends that cancushion share prices in a down market. In addition, thevalue of growth stocks may be more sensitive to changesin current or expected earnings than the value of otherstocks, because growth stocks trade at higher pricesrelative to current earnings.
Mid-Cap Company Risk. Investing in mid-cap companiescarries the risk that due to current market conditions thesecompanies may be out of favor with investors. Stocks ofmid-cap companies may be more volatile than those oflarger companies due to, among other reasons, narrowerproduct lines, more limited financial resources and fewerexperienced managers.
Small-Cap Company Risk. Investing in small-capcompanies carries the risk that due to current marketconditions these companies may be out of favor withinvestors. Small companies often are in the early stagesof development with limited product lines, markets, orfinancial resources and managements lacking depth andexperience, which may cause their stock prices to bemorevolatile than those of larger companies. Small companystocks may be less liquid yet subject to abrupt or erraticprice movements. It may take a substantial period of timebefore the Fund realizes a gain on an investment in asmall-cap company, if it realizes any gain at all.
Market Risk. The Fund’s share price can fall because ofweakness in the broad market, a particular industry, orspecific holdings or due to adverse political or economicdevelopments here or abroad, changes in investorpsychology, or heavy institutional selling and otherconditions or events (including, for example, militaryconfrontations, war, terrorism, disease/virus, outbreaksand epidemics). The prices of individual securities mayfluctuate, sometimes dramatically, from day to day. Theprices of stocks and other equity securities tend to bemore volatile than those of fixed-income securities.
The coronavirus pandemic and the related governmentaland public responses have had and may continue to havean impact on the Fund’s investments and net asset valueand have led and may continue to lead to increasedmarket volatility and the potential for illiquidity in certainclasses of securities and sectors of the market.Preventative or protective actions that governments maytake in respect of pandemic or epidemic diseases mayresult in periods of business disruption, businessclosures, inability to obtain raw materials, supplies andcomponent parts, and reduced or disrupted operations forthe issuers in which the Fund invests. Governmentintervention in markets may impact interest rates, marketvolatility and security pricing. The occurrence,reoccurrence and pendency of such diseases couldadversely affect the economies (including throughchanges in business activity and increasedunemployment) and financial markets either in specificcountries or worldwide.
Securities Lending Risk. Engaging in securities lendingcould increase the market and credit risk for Fundinvestments. The Fund may lose money if it does not
FUND SUMMARY: SMALL-MID GROWTH FUND
- 111 -

recover borrowed securities, the value of the collateralfalls, or the value of investments made with cash collateraldeclines. If the value of either the cash collateral or theFund’s investments of the cash collateral falls below theamount owed to a borrower, the Fund also may incurlosses that exceed the amount it earned on lending thesecurity. Securities lending also involves the risks of delayin receiving additional collateral or possible loss of rightsin the collateral if the borrower fails. Another risk ofsecurities lending is the risk that the loaned portfoliosecurities may not be available to the Fund on a timelybasis and the Fund may therefore lose the opportunity tosell the securities at a desirable price.
Active Trading Risk. High portfolio turnover rates thatare associated with active trading may result in highertransaction costs, which can adversely affect the Fund’sperformance. Active trading tends to be more pronouncedduring periods of increased market volatility.
Performance Information
The following Risk/Return Bar Chart and Table illustratethe risks of investing in the Fund by showing changes inthe Fund’s performance from calendar year to calendaryear and comparing the Fund’s average annual returns tothose of the Russell 2500® Growth Index. Fees andexpenses incurred at the contract level are not reflected inthe bar chart or table. If these amounts were reflected,returns would be less than those shown. Of course, pastperformance is not necessarily an indication of how theFund will perform in the future.
Goldman Sachs Asset Management, L.P. (“GSAM”)assumed subadvisory responsibility on August 16, 2013.Prior to this time, the Fund was subadvised by WellsCapital Management Incorporated and Century CapitalManagement, LLC.
26.23%
-4.36%
11.61%
34.76%
11.07%
-0.63%
0.22%
27.76%
-5.30%
37.92%
-10%
-5%
0%
5%
10%
15%
20%
25%
30%
35%
40%
45%
2010 2011 2012 2013 2014 2015 2016 2017 2018 2019
During the 10-year period shown in the bar chart, thehighest return for a quarter was 19.90% (quarter endedMarch 31, 2019) and the lowest return for a quarter was-21.81% (quarter ended September 30, 2011). The year-to-date calendar return as of June 30, 2020 was 11.54%.
Average Annual Total Returns (For the periods endedDecember 31, 2019)
1Year
5Years
10Years
Fund 37.92% 10.69% 12.86%Russell 2500® GrowthIndex (reflects nodeduction for fees,expenses or taxes) 32.65% 10.84% 14.01%
Investment Adviser
The Fund’s investment adviser is The Variable AnnuityLife Insurance Company.
The Fund is subadvised by GSAM.
Portfolio Managersg
Name and Title
PortfolioManager of theFund Since
Steven M. BarryManaging Director and Co-LeadPortfolio Manager .............................. 2005-2018; 2019
Jessica KatzVice President and Co-LeadPortfolio Manager .............................. 2019
Greg TuortoManaging Director and Co-LeadPortfolio Manager .............................. 2019
For important information about purchases and sales ofFund shares, taxes and payments to broker-dealers andother financial intermediaries, please turn to the section“Important Additional Information” on page 127.
FUND SUMMARY: SMALL-MID GROWTH FUND
- 112 -
Investment Objective
The Fund seeks long-term capital growth throughinvestment in common stocks that, as a group, areexpected to provide investment results closelycorresponding to the performance of the S&P 500® Index(the “Index”).
Fees and Expenses of the Fund
This table describes the fees and expenses that you maypay if you buy and hold shares of the Fund. The Fund’sannual operating expenses do not reflect the separateaccount fees charged in the variable annuity or variablelife insurance policy (“Variable Contracts”) in which theFund is offered. If separate account fees were shown, theFund’s annual operating expenses would be higher.Please see your Variable Contract prospectus for moredetails on the separate account fees.
Annual Fund Operating Expenses (expenses that yougpay each year as a percentage of the value of yourinvestment)
Management Fees 0.24%Other Expenses 0.09%Total Annual Fund Operating Expenses 0.33%Fee Waivers and/or Expense Reimbursements1 -0.04%Total Annual Fund Operating ExpensesAfter Fee Waivers and/or ExpenseReimbursements1 0.29%
1 The Fund’s investment adviser, The Variable Annuity Life InsuranceCompany, has contractually agreed to reimburse the expenses of theFund through September 30, 2021, so that the Fund’s Total AnnualFund Operating Expenses After Expense Reimbursement do notexceed 0.29%. For purposes of the Expense Limitation Agreement,“Total Annual Fund Operating Expenses” shall not includeextraordinary expenses (i.e., expenses that are unusual in nature andinfrequent in occurrence, such as litigation), or acquired fund feesand expenses, brokerage commissions and other transactionalexpenses relating to the purchase and sale of portfolio securities,interest, taxes and governmental fees, and other expenses notincurred in the ordinary course of the Fund’s business. This ExpenseLimitation Agreement will continue in effect from year to yearthereafter unless terminated by the Board of Directors prior to anysuch renewal.
Expense Example
This Example is intended to help you compare the cost ofinvesting in the Fund with the cost of investing in othermutual funds. The Example assumes that you invest$10,000 in the Fund for the time periods indicated andthen redeem all of your shares at the end of those periods.The Example also assumes that your investment has a 5%return each year and that the Fund’s operating expensesinclude expense reimbursements for year one. The
Example does not reflect charges imposed by the VariableContract. If the Variable Contract fees were reflected, theexpenses would be higher. See the Variable Contractprospectus for information on such charges. Althoughyour actual costs may be higher or lower, based on theseassumptions and the net expenses shown in the fee table,your costs would be:
1 Year 3 Years 5 Years 10 Years
$30 $102 $181 $414
Portfolio Turnover
The Fund pays transaction costs, such as commissions,when it buys and sells securities (or “turns over” itsportfolio). These costs, which are not reflected in annualfund operating expenses or in the Example, affect theFund’s performance.
During the most recent fiscal year, the Fund’s portfolioturnover rate was 3% of the average value of its portfolio.
Principal Investment Strategies of the Fund
The Fund is managed to seek to track the performance ofthe Index, which measures the stock performance of 500large- and mid-cap companies and is often used toindicate the performance of the overall stock market. TheSubadviser may endeavor to track the Index bypurchasing every stock included in the Index, in the sameproportions. Or, in the alternative, the Subadviser mayinvest in a sampling of Index stocks by utilizing a statisticaltechnique known as “optimization.” The goal ofoptimization is to select stocks which ensure that variousindustry weightings, market capitalizations, andfundamental characteristics, (e.g., price-to-book, price-to-earnings, debt-to-asset ratios and dividend yields) closelyapproximate those of the Index.
The Fund invests, under normal circumstances, at least80% of net assets in stocks that are in the Index. Althoughthe Fund seeks to track the performance of the Index, theperformance of the Fund will not match that of the Indexexactly because, among other reasons, the Fund incursoperating expenses and other investment overhead aspart of its normal operations.
In order to generate additional income, the Fund may lendportfolio securities to broker-dealers and other financialinstitutions provided that the value of the loaned securitiesdoes not exceed 30% of the Fund’s total assets. Theseloans earn income for the Fund and are collateralized bycash and securities issued or guaranteed by the U.S.Government or its agencies or instrumentalities. Investors
FUND SUMMARY: STOCK INDEX FUND
- 113 -

will be given at least 60 days’ written notice in advance ofany change to the Fund’s 80% investment policy set forthabove.
Principal Risks of Investing in the Fund
As with any mutual fund, there can be no assurance thatthe Fund’s investment objective will be met or that the netreturn on an investment in the Fund will exceed what couldhave been obtained through other investment or savingsvehicles. Shares of the Fund are not bank deposits andare not guaranteed or insured by any bank, governmententity or the Federal Deposit Insurance Corporation. If thevalue of the assets of the Fund goes down, you could losemoney.
The following is a summary of the principal risks ofinvesting in the Fund.
Management Risk. The investment style or strategy usedby the Subadviser may fail to produce the intended result.The Subadviser’s assessment of a particular security orcompany may prove incorrect, resulting in losses orunderperformance.
Index Risk. In attempting to track the performance of theindex, the Fund may be more susceptible to adversedevelopments concerning a particular security, companyor industry because the Fund generally will not use anydefensive strategies to mitigate its risk exposure.
Failure to Match Index Performance Risk. The ability ofthe Fund to match the performance of the UnderlyingIndex may be affected by, among other things, changes insecurities markets, the manner in which performance ofthe Underlying Index is calculated, changes in thecomposition of the Underlying Index, the amount andtiming of cash flows into and out of the Fund,commissions, portfolio expenses, and any differences inthe pricing of securities by the Fund and the UnderlyingIndex. When the Fund employs an “optimization” strategy,the Fund is subject to an increased risk of tracking error,in that the securities selected in the aggregate for theFund may perform differently than the Index.
Equity Securities Risk. The Fund invests primarily inequity securities and is therefore subject to the risk thatstock prices will fall and may underperform other assetclasses. Individual stock prices fluctuate from day-to-dayand may decline significantly. The prices of individualstocks may be negatively affected by poor companyresults or other factors affecting individual prices, as wellas industry and/or economic trends and developmentsaffecting industries or the securities market as a whole.
Large- and Mid-Cap Company Risk. Investing in large-andmid-cap companies carries the risk that due to current
market conditions these companies may be out of favorwith investors. Large-cap companies may be unable torespond quickly to new competitive challenges or attainthe high growth rate of successful smaller companies.Stocks of mid-cap companies may be more volatile thanthose of larger companies due to, among other reasons,narrower product lines, more limited financial resourcesand fewer experienced managers.
Market Risk. The Fund’s share price can fall because ofweakness in the broad market, a particular industry, orspecific holdings or due to adverse political or economicdevelopments here or abroad, changes in investorpsychology, or heavy institutional selling and otherconditions or events (including, for example, militaryconfrontations, war, terrorism, disease/virus, outbreaksand epidemics). The prices of individual securities mayfluctuate, sometimes dramatically, from day to day. Theprices of stocks and other equity securities tend to bemore volatile than those of fixed-income securities.
The coronavirus pandemic and the related governmentaland public responses have had and may continue to havean impact on the Fund’s investments and net asset valueand have led and may continue to lead to increasedmarket volatility and the potential for illiquidity in certainclasses of securities and sectors of the market.Preventative or protective actions that governments maytake in respect of pandemic or epidemic diseases mayresult in periods of business disruption, businessclosures, inability to obtain raw materials, supplies andcomponent parts, and reduced or disrupted operations forthe issuers in which the Fund invests. Governmentintervention in markets may impact interest rates, marketvolatility and security pricing. The occurrence,reoccurrence and pendency of such diseases couldadversely affect the economies (including throughchanges in business activity and increasedunemployment) and financial markets either in specificcountries or worldwide.
Securities Lending Risk. Engaging in securities lendingcould increase the market and credit risk for Fundinvestments. The Fund may lose money if it does notrecover borrowed securities, the value of the collateralfalls, or the value of investments made with cash collateraldeclines. If the value of either the cash collateral or theFund’s investments of the cash collateral falls below theamount owed to a borrower, the Fund also may incurlosses that exceed the amount it earned on lending thesecurity. Securities lending also involves the risks of delayin receiving additional collateral or possible loss of rightsin the collateral if the borrower fails. Another risk ofsecurities lending is the risk that the loaned portfoliosecurities may not be available to the Fund on a timely
FUND SUMMARY: STOCK INDEX FUND
- 114 -

basis and the Fund may therefore lose the opportunity tosell the securities at a desirable price.
Performance Information
The following Risk/Return Bar Chart and Table illustratethe risks of investing in the Fund by showing changes inthe Fund’s performance from calendar year to calendaryear and comparing the Fund’s average annual returns tothose of the S&P 500® Index. Fees and expenses incurredat the contract level are not reflected in the bar chart ortable. If these amounts were reflected, returns would beless than those shown. Of course, past performance is notnecessarily an indication of how the Fund will perform inthe future.
14.69%
1.82%
15.58%
31.92%
13.28%
1.05%
11.60%
21.41%
-4.72%
31.09%
-10%
-5%
0%
5%
10%
15%
20%
25%
30%
35%
2010 2011 2012 2013 2014 2015 2016 2017 2018 2019
During the 10-year period shown in the bar chart, thehighest return for a quarter was 13.56% (quarter endedMarch 31, 2019) and the lowest return for a quarter was-13.94% (quarter ended September 30, 2011). The year-to-date calendar return as of June 30, 2020 was -3.26%.
Average Annual Total Returns (For the periods endedDecember 31, 2019)
1Year
5Years
10Years
Fund 31.09% 11.33% 13.18%S&P 500® Index (reflects nodeduction for fees,expenses or taxes) 31.49% 11.70% 13.56%
Investment Adviser
The Fund’s investment adviser is The Variable AnnuityLife Insurance Company.
The Fund is subadvised by SunAmerica AssetManagement LLC.
Portfolio Managersg
Name and Title
PortfolioManager of theFund Since
Timothy CampionSenior Vice President and LeadPortfolio Manager .................................. 2012
Elizabeth MauroPortfolio Manager and Co-PortfolioManager ................................................ 2019
For important information about purchases and sales ofFund shares, taxes and payments to broker-dealers andother financial intermediaries, please turn to the section“Important Additional Information” on page 127.
FUND SUMMARY: STOCK INDEX FUND
- 115 -

Investment Objective
The Fund seeks to provide long-term growth of capitalthrough investment in common stocks
Fees and Expenses of the Fund
This table describes the fees and expenses that you maypay if you buy and hold shares of the Fund. The Fund’sannual operating expenses do not reflect the separateaccount fees charged in the variable annuity or variablelife insurance policy (“Variable Contracts”) in which theFund is offered. If separate account fees were shown, theFund’s annual operating expenses would be higher.Please see your Variable Contract prospectus for moredetails on the separate account fees.
Annual Fund Operating Expenses (expenses that yougpay each year as a percentage of the value of yourinvestment)
Management Fees 0.75%Other Expenses 0.24%Total Annual Fund Operating Expenses 0.99%Fee Waivers and/or Expense Reimbursements1 -0.22%Total Annual Fund Operating ExpensesAfter Fee Waivers and/or ExpenseReimbursements1 0.77%
1 The Fund’s investment adviser, The Variable Annuity Life InsuranceCompany (“VALIC”), has contractually agreed to waive its advisoryfee through September 30, 2022, so that the advisory fee payable bythe Fund to VALIC equals 0.53% of average monthly assets on thefirst $500 million and 0.505% of average monthly assets over$500 million. This agreement may be modified or discontinued priorto such time only with the approval of the Board of Directors of VALICCompany I (“VC I”), including a majority of the directors who are not“interested persons” of VC I as defined in the Investment CompanyAct of 1940, as amended.
Expense Example
This Example is intended to help you compare the cost ofinvesting in the Fund with the cost of investing in othermutual funds. The Example assumes that you invest$10,000 in the Fund for the time periods indicated andthen redeem all of your shares at the end of those periods.The Example also assumes that your investment has a 5%return each year and that the Fund’s operating expensesinclude fee waivers for year one. The Example does notreflect charges imposed by the Variable Contract. If theVariable Contract fees were reflected, the expenses would
be higher. See the Variable Contract prospectus forinformation on such charges. Although your actual costsmay be higher or lower, based on these assumptions andthe net expenses shown in the fee table, your costs wouldbe:
1 Year 3 Years 5 Years 10 Years
$79 $293 $526 $1,193
Portfolio Turnover
The Fund pays transaction costs, such as commissions,when it buys and sells securities (or “turns over” itsportfolio). These costs, which are not reflected in annualfund operating expenses or in the Example, affect theFund’s performance.
During the most recent fiscal year, the Fund’s portfolioturnover rate was 98% of the average value of its portfolio.
Principal Investment Strategies of the Fund
The Fund seeks to achieve a higher risk-adjustedperformance than the Russell 1000® Index (the “Index”)over the long term through a proprietary selection processemployed by the Fund’s Subadviser. The Fund primarilyinvests in common stock of U.S. large capitalizationcompanies included in the Index. As of June 30, 2020, themedian market capitalization of a company in the Indexwas approximately $10 billion and the dollar-weightedaverage capitalization of the companies in the Index wasapproximately $348 billion. The size of the companies inthe Index changes with market conditions and thecomposition of the Index.
The Subadviser uses a rules-based methodology thatemphasizes quantitatively-based stock selection andportfolio construction and efficient implementation. TheFund seeks to capture common sources of active equityreturns, including the following factors: value (i.e., howattractively a stock is priced relative to its “fundamentals,”such as book value and free cash flow), momentum (i.e.,whether a company’s share price is trending up or down),quality (i.e., profitability) and low volatility (i.e., a relativelylow degree of fluctuation in a company’s share price overtime). The Subadviser seeks to capitalize on the lowcorrelations in returns across these factors by diversifyingexposure to securities selected based on such factors.The Subadviser may, in its discretion, make changes to its
FUND SUMMARY: SYSTEMATIC CORE FUND (FORMERLY, GROWTH & INCOME FUND)
- 116 -

quantitative techniques, or use other quantitativetechniques that are based on the Subadviser’s proprietaryresearch.
The Subadviser constructs the Fund’s portfolio byinvesting in the securities comprising the Index andadjusting the relative weight of each security based on thesecurity’s attractiveness when evaluated based on thefactors as described above, subject to the Fund beingconstrained to long-only positions. Based on theSubadviser’s process, the Fund expects that its portfoliowill be overweight with respect to certain securities (i.e.,the Fund will hold a greater percentage of those securitiesthan the Index) and underweight with respect to others(i.e., the Fund will hold a lesser percentage of thosesecurities than the Index), and that such weightings maychange over time. The percentage of the Fund’s portfolioexposed to any single security will vary from time to timeas the weightings of the securities within the Fund change.The degree to which components of the Fund representcertain sectors or industries may change over time.
The Subadviser will rebalance the Fund’s portfolioaccording to the process set forth above on a quarterlybasis, and it generally employs a strategy to continue tohold securities between quarterly rebalancings, even ifthere are adverse developments concerning a particularsecurity, an industry, the economy or the stock marketgenerally. The Subadviser may reduce the position size ofa security or sell the security during quarterly rebalancingsif the security no longer has favorable scores in one ormore of the four factors.
In order to generate additional income, the Fund may lendportfolio securities to broker-dealers and other financialinstitutions provided that the value of the loaned securitiesdoes not exceed 30% of the Fund’s total assets. Theseloans earn income for the Fund and are collateralized bycash and securities issued or guaranteed by the U.S.Government or its agencies or instrumentalities.
Principal Risks of Investing in the Fund
As with any mutual fund, there can be no assurance thatthe Fund’s investment objective will be met or that the netreturn on an investment in the Fund will exceed what couldhave been obtained through other investment or savingsvehicles. Shares of the Fund are not bank deposits andare not guaranteed or insured by any bank, governmententity or the Federal Deposit Insurance Corporation. If thevalue of the assets of the Fund goes down, you could losemoney.
The following is a summary of the principal risks ofinvesting in the Fund.
Disciplined Strategy Risk. The Fund will generally notdeviate from its strategy, even during adverse market,economic, political, or other conditions (except to theextent necessary to comply with federal tax laws or otherapplicable laws). If the Fund is committed to a strategythat is unsuccessful, the Fund will not meet its investmentgoal. Because the Fund generally will not use certaintechniques available to other mutual funds to reduce stockmarket exposure, the Fund may be more susceptible togeneral market declines than other mutual funds.
Equity Securities Risk. The Fund’s investments in equitysecurities are subject to the risk that stock prices will falland may underperform other asset classes. Individualstock prices fluctuate from day-to-day and may declinesignificantly. The prices of individual stocks may benegatively affected by poor company results or otherfactors affecting individual prices, as well as industry and/or economic trends and developments affecting industriesor the securities market as a whole.
Factor-Based Investing Risk. There can be noassurance that the multi-factor selection processemployed by the subadviser will enhance performance.Exposure to investment style factors may detract fromperformance in some market environments, which maycontinue for prolonged periods.
Large-Cap Companies Risk. Large-cap companies tendto go in and out of favor based on market and economicconditions and tend to be less volatile than companieswith smaller market capitalizations. In exchange for thispotentially lower risk, the Fund’s value may not rise asmuch as the value of funds that emphasize smallercapitalization companies. Larger, more establishedcompanies may be unable to respond quickly to newcompetitive challenges, such as changes in technologyand consumer tastes. Larger companies also may not beable to attain the high growth rate of successful smallercompanies, particularly during extended periods ofeconomic expansion.
Management Risk. The investment style or strategy usedby the Subadviser may fail to produce the intended result.The Subadviser’s assessment of a particular security orcompany may prove incorrect, resulting in losses orunderperformance.
Market Risk. The Fund’s share price can fall because ofweakness in the broad market, a particular industry, orspecific holdings or due to adverse political or economicdevelopments here or abroad, changes in investorpsychology, or heavy institutional selling and otherconditions or events (including, for example, military
FUND SUMMARY: SYSTEMATIC CORE FUND (FORMERLY, GROWTH & INCOME FUND)
- 117 -

confrontations, war, terrorism, disease/virus, outbreaksand epidemics). The prices of individual securities mayfluctuate, sometimes dramatically, from day to day. Theprices of stocks and other equity securities tend to bemore volatile than those of fixed-income securities.
The coronavirus pandemic and the related governmentaland public responses have had and may continue to havean impact on the Fund’s investments and net asset valueand have led and may continue to lead to increasedmarket volatility and the potential for illiquidity in certainclasses of securities and sectors of the market.Preventative or protective actions that governments maytake in respect of pandemic or epidemic diseases mayresult in periods of business disruption, businessclosures, inability to obtain raw materials, supplies andcomponent parts, and reduced or disrupted operations forthe issuers in which the Fund invests. Governmentintervention in markets may impact interest rates, marketvolatility and security pricing. The occurrence,reoccurrence and pendency of such diseases couldadversely affect the economies (including throughchanges in business activity and increasedunemployment) and financial markets either in specificcountries or worldwide.
Securities Lending Risk. Engaging in securities lendingcould increase the market and credit risk for Fundinvestments. The Fund may lose money if it does notrecover borrowed securities, the value of the collateralfalls, or the value of investments made with cash collateraldeclines. If the value of either the cash collateral or theFund’s investments of the cash collateral falls below theamount owed to a borrower, the Fund also may incurlosses that exceed the amount it earned on lending thesecurity. Securities lending also involves the risks of delayin receiving additional collateral or possible loss of rightsin the collateral if the borrower fails. Another risk ofsecurities lending is the risk that the loaned portfoliosecurities may not be available to the Fund on a timelybasis and the Fund may therefore lose the opportunity tosell the securities at a desirable price.
Performance Information
The following Risk/Return Bar Chart and Table illustratethe risks of investing in the Fund by showing changes inthe Fund’s performance from calendar year to calendaryear and comparing the Fund’s average annual returns tothose of the Russell 1000® Index and the S&P 500®Index. Effective April 27, 2020, the Russell 1000® Indexreplaced the S&P 500® Index as the performancebenchmark against which the Fund measures itsperformance. Fund management believes that the Russell
1000® Index is more representative of the securities inwhich the Fund invests. The Fund’s returns prior toApril 27, 2020, as reflected in the Bar Chart and Table, arethe returns of the Fund when it had a different investmentobjective and followed different investment strategiesunder the name “Growth & Income Fund.” Fees andexpenses incurred at the contract level are not reflected inthe bar chart or table. If these amounts were reflected,returns would be less than those shown. Of course, pastperformance is not necessarily an indication of how theFund will perform in the future.
Effective April 27, 2020, Goldman Sachs AssetManagement L.P. (“GSAM”) assumed subadvisoryresponsibility for the Fund. From September 16, 2013 toApril 26, 2020, the Fund was subadvised by J.P. MorganPPInvestment Management, Inc., and prior to September 16,2013, the Fund was subadvised by SunAmerica AssetManagement, LLC.
12.26%
-4.35%
13.36%
32.66%
14.13%
-0.09%
11.22%
21.07%
-5.79%
30.63%
-10%
-5%
0%
5%
10%
15%
20%
25%
30%
35%
40%
2010 2011 2012 2013 2014 2015 2016 2017 2018 2019
During the 10-year period shown in the bar chart, thehighest return for a quarter was 14.93% (quarter endedMarch 31, 2012) and the lowest return for a quarter was-16.73% (quarter ended September 30, 2011). The year-to-date calendar return as of June 30, 2020 was -0.84%.
Average Annual Total Returns (For the periods endedDecember 31, 2019)
1Year
5Years
10Years
Fund 30.63% 10.61% 11.80%Russell 1000® Index(reflects no deduction forfees, expenses or taxes) 31.43% 11.48% 13.54%
S&P 500® Index (reflects nodeduction for fees,expenses or taxes) 31.49% 11.70% 13.56%
FUND SUMMARY: SYSTEMATIC CORE FUND (FORMERLY, GROWTH & INCOME FUND)
- 118 -
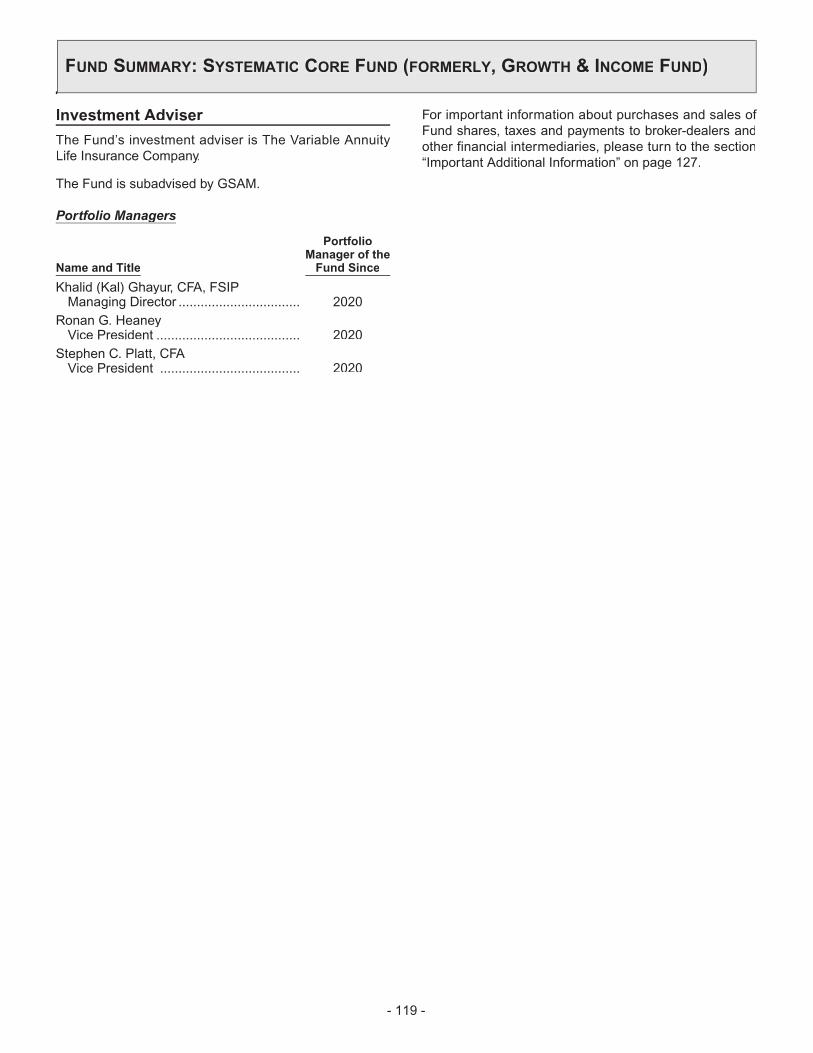
Investment Adviser
The Fund’s investment adviser is The Variable AnnuityLife Insurance Company.
The Fund is subadvised by GSAM.
Portfolio Managersg
Name and Title
PortfolioManager of theFund Since
Khalid (Kal) Ghayur, CFA, FSIPManaging Director ................................. 2020
Ronan G. HeaneyVice President ....................................... 2020
Stephen C. Platt, CFAVice President ...................................... 2020
For important information about purchases and sales ofFund shares, taxes and payments to broker-dealers andother financial intermediaries, please turn to the section“Important Additional Information” on page 127.
FUND SUMMARY: SYSTEMATIC CORE FUND (FORMERLY, GROWTH & INCOME FUND)
- 119 -

Investment Objective
The Fund seeks total return through capital appreciation.
Fees and Expenses of the Fund
This table describes the fees and expenses that you maypay if you buy and hold shares of the Fund. The Fund’sannual operating expenses do not reflect the separateaccount fees charged in the variable annuity or variablelife insurance policy (“Variable Contracts”) in which theFund is offered. If separate account fees were shown, theFund’s annual operating expenses would be higher.Please see your Variable Contract prospectus for moredetails on the separate account fees.
Annual Fund Operating Expenses (expenses that yougpay each year as a percentage of the value of yourinvestment)
Management Fees 0.70%Other Expenses 0.46%Total Annual Fund Operating Expenses 1.16%Fee Waivers and/or Expense Reimbursements1 -0.30%Total Annual Fund Operating ExpensesAfter Fee Waivers and/or ExpenseReimbursements1 0.86%
1 The Fund’s investment adviser, The Variable Annuity Life InsuranceCompany (“VALIC”), has contractually agreed to waive its advisoryfee through September 30, 2021, so that the advisory fee payable bythe Fund to VALIC equals 0.40% of average monthly net assets onthe first $250 million, 0.35% on the next $250 million, 0.30% on thenext $500 million, and 0.25% on assets over $1 billion. Thisagreement may be modified or discontinued prior to such time onlywith the approval of the Board of Directors of VALIC Company I(“VC I”), including a majority of the directors who are not “interestedpersons” of VC I as defined in the Investment Company Act of 1940,as amended.
Expense Example
This Example is intended to help you compare the cost ofinvesting in the Fund with the cost of investing in othermutual funds. The Example assumes that you invest$10,000 in the Fund for the time periods indicated andthen redeem all of your shares at the end of those periods.The Example also assumes that your investment has a 5%return each year and that the Fund’s operating expensesinclude fee waivers for one year. The Example does notreflect charges imposed by the Variable Contract. If theVariable Contract fees were reflected, the expenses wouldbe higher. See the Variable Contract prospectus forinformation on such charges. Although your actual costsmay be higher or lower, based on these assumptions and
the net expenses shown in the fee table, your costs wouldbe:
1 Year 3 Years 5 Years 10 Years
$88 $339 $609 $1,382
Portfolio Turnover
The Fund pays transaction costs, such as commissions,when it buys and sells securities (or “turns over” itsportfolio). These costs, which are not reflected in annualfund operating expenses or in the Example, affect theFund’s performance.
During the most recent fiscal year, the Fund’s portfolioturnover rate was 265% of the average value of itsportfolio.
Principal Investment Strategies of the Fund
The Fund seeks to achieve its investment objective byinvesting primarily in equity securities of U.S. large- andmid-cap companies. Companies are determined to belarge- or mid-cap based on the inclusion of their equitysecurities in the MSCI USA Value Index, whoseconstituents are companies that exhibit certain valuequalities, as defined by the index provider, such as lowerprice-to-book ratios, lower prices relative to forecastedearnings, and higher dividend yields. Generally, thesecompanies will have a market capitalization of at least$2 billion. The equity securities in which the Fund investsinclude common stock, preferred stock, convertiblesecurities, rights and warrants.
The subadviser employs a proprietary, dynamic multi-factor approach to managing the Fund’s assets that isbased on quantitative and qualitative research andanalysis. In selecting securities, the subadviser seeks toallocate the Fund’s assets to equity securities that thesubadviser believes share complementary factorexposures. Factors are characteristics that are importantin explaining the returns and risks of a group of securities.Among the kinds of factors that the subadviser uses toselect equity securities for the Fund are: (1) meanreversion (e.g., stocks that are inexpensive relative to theirhistorical fundamentals); (2) trend following (e.g., strongmomentum and higher growth potential); (3) risk aversion(e.g., financially healthy, stable, and lower volatilitycompanies); and (4) risk seeking (e.g., stocks that aretypically more volatile, but may play an important role inoverall portfolio diversification). In exceptionalcircumstances, the subadviser may exclude or remove an
FUND SUMMARY: SYSTEMATIC VALUE FUND
- 120 -

issuer or security from the Fund where it believes the dataavailable does not accurately reflect current events.
The subadviser may engage in frequent and active tradingof portfolio securities to achieve the Fund’s investmentobjective.
In order to generate additional income, the Fund may lendportfolio securities to broker-dealers and other financialinstitutions provided that the value of the loaned securitiesdoes not exceed 30% of the Fund’s total assets. Theseloans earn income for the Fund and are collateralized bycash and securities issued or guaranteed by the U.S.Government or its agencies or instrumentalities.
Principal Risks of Investing in the Fund
As with any mutual fund, there can be no assurance thatthe Fund’s investment objective will be met or that the netreturn on an investment in the Fund will exceed what couldhave been obtained through other investment or savingsvehicles. Shares of the Fund are not bank deposits andare not guaranteed or insured by any bank, governmententity or the Federal Deposit Insurance Corporation. If thevalue of the assets of the Fund goes down, you could losemoney.
The following is a summary of the principal risks ofinvesting in the Fund.
Management Risk. The investment style or strategy usedby the Subadviser may fail to produce the intended result.The Subadviser’s assessment of a particular security orcompany may prove incorrect, resulting in losses orunderperformance.
Equity Securities Risk. The Fund invests principally inequity securities and is therefore subject to the risk thatstock prices will fall and may underperform other assetclasses. Individual stock prices fluctuate from day-to-dayand may decline significantly. The prices of individualstocks may be negatively affected by poor companyresults or other factors affecting individual prices, as wellas industry and/or economic trends and developmentsaffecting industries or the securities market as a whole.
Preferred Stock Risk. Unlike common stock, preferredstock generally pays a fixed dividend from a company’searnings and may have a preference over common stockon the distribution of a company’s assets in the event ofbankruptcy or liquidation. Preferred stockholders’liquidation rights are subordinate to the company’s debtholders and creditors. If interest rates rise, the fixeddividend on preferred stocks may be less attractive andthe price of preferred stocks may decline. Preferredstockholders typically do not have voting rights.
Convertible Securities Risk. Convertible security valuesmay be affected by market interest rates, issuer defaultsand underlying common stock values; security valuesmay fall if market interest rates rise and rise if marketinterest rates fall. Additionally, an issuer may have the rightto buy back the securities at a time unfavorable to theFund.
Warrant Risk. A warrant entitles the holder to purchase aspecified amount of securities at a pre-determined price.Warrants may not track the value of the securities theholder is entitled to purchase and may expire worthless ifthe market price of the securities is below the exerciseprice of the warrant.
Large- and Mid-Cap Company Risk. Investing in large-andmid-cap companies carries the risk that due to currentmarket conditions these companies may be out of favorwith investors. Large-cap companies may be unable torespond quickly to new competitive challenges or attainthe high growth rate of successful smaller companies.Stocks of mid-cap companies may be more volatile thanthose of larger companies due to, among other reasons,narrower product lines, more limited financial resourcesand fewer experienced managers.
Market Risk. The Fund’s share price can fall because ofweakness in the broad market, a particular industry, orspecific holdings or due to adverse political or economicdevelopments here or abroad, changes in investorpsychology, or heavy institutional selling and otherconditions or events (including, for example, militaryconfrontations, war, terrorism, disease/virus, outbreaksand epidemics). The prices of individual securities mayfluctuate, sometimes dramatically, from day to day. Theprices of stocks and other equity securities tend to bemore volatile than those of fixed-income securities.
The coronavirus pandemic and the related governmentaland public responses have had and may continue to havean impact on the Fund’s investments and net asset valueand have led and may continue to lead to increasedmarket volatility and the potential for illiquidity in certainclasses of securities and sectors of the market.Preventative or protective actions that governments maytake in respect of pandemic or epidemic diseases mayresult in periods of business disruption, businessclosures, inability to obtain raw materials, supplies andcomponent parts, and reduced or disrupted operations forthe issuers in which the Fund invests. Governmentintervention in markets may impact interest rates, marketvolatility and security pricing. The occurrence,reoccurrence and pendency of such diseases couldadversely affect the economies (including throughchanges in business activity and increased
FUND SUMMARY: SYSTEMATIC VALUE FUND
- 121 -

unemployment) and financial markets either in specificcountries or worldwide.
Value Style Risk. Generally, “value” stocks are stocks ofcompanies that the index provider believes are currentlyundervalued in the marketplace based on a combinationof variables. The index provider’s calculation to identify aparticular security is undervalued in relation to thecompany’s fundamental economic value may proveincorrect and the price of the company’s stock may fall.
Quantitative Investing Risk. The value of securitiesselected using quantitative analysis can react differently toissuer, political, market, and economic developments fromthe market as a whole or securities selected using onlyfundamental analysis. This may be the result of the factorsused in building the quantitative analytical framework, theweights placed on each factor, and the accuracy ofhistorical data supplied by third parties. In addition, factorsthat affect a security’s value can change over time andthese changes may not be reflected in the quantitativemodel.
Sector Risk. Companies with similar characteristics maybe grouped together in broad categories called sectors.Sector risk is the risk that securities of companies withinspecific sectors of the economy can perform differentlythan the overall market. This may be due to changes insuch things as the regulatory or competitive environmentor to changes in investor perceptions regarding a sector.Because the Fund may allocate relatively more assets tocertain sectors than others, the Fund’s performance maybe more susceptible to any developments which affectthose sectors emphasized by the Fund.
Active Trading Risk. High portfolio turnover rates thatare associated with active trading may result in highertransaction costs, which can adversely affect the Fund’sperformance. Active trading tends to be more pronouncedduring periods of increased market volatility.
Securities Lending Risk. Engaging in securities lendingcould increase the market and credit risk for Fundinvestments. The Fund may lose money if it does notrecover borrowed securities, the value of the collateralfalls, or the value of investments made with cash collateraldeclines. If the value of either the cash collateral or theFund’s investments of the cash collateral falls below theamount owed to a borrower, the Fund also may incurlosses that exceed the amount it earned on lending the
security. Securities lending also involves the risks of delayin receiving additional collateral or possible loss of rightsin the collateral if the borrower fails. Another risk ofsecurities lending is the risk that the loaned portfoliosecurities may not be available to the Fund on a timelybasis and the Fund may therefore lose the opportunity tosell the securities at a desirable price.
Performance Information
The following Risk/Return Bar Chart and Table illustratethe risks of investing in the Fund by showing changes inthe Fund’s performance from calendar year to calendaryear and comparing the Fund’s average annual returns tothose of the Russell 1000® Value Index. Fees andexpenses incurred at the contract level are not reflected inthe bar chart or table. If these amounts were reflected,returns would be less than those shown. Of course, pastperformance is not necessarily an indication of how theFund will perform in the future.
Effective October 1, 2019, the Fund’s investment strategychanged from investing in a combination of U.S. andforeign equity securities to investing solely in U.S. equitysecurities.
Prior to October 1, 2019, the Fund was subadvised byBarrow, Hanley, Mewhinney & Strauss, LLC. WellingtonManagement Company LLP (“Wellington Management”)assumed subadvisory duties for the Fund on October 1,2019.
14.43%
1.67%
13.98%
36.47%
7.53%
-1.33%
13.84%
18.14%
-11.41%
23.78%
-15%
-10%
-5%
0%
5%
10%
15%
20%
25%
30%
35%
40%
2010 2011 2012 2013 2014 2015 2016 2017 2018 2019
During the 10-year period shown in the bar chart, thehighest return for a quarter was 13.13% (quarter endedDecember 31, 2011) and the lowest return for a quarter
FUND SUMMARY: SYSTEMATIC VALUE FUND
- 122 -
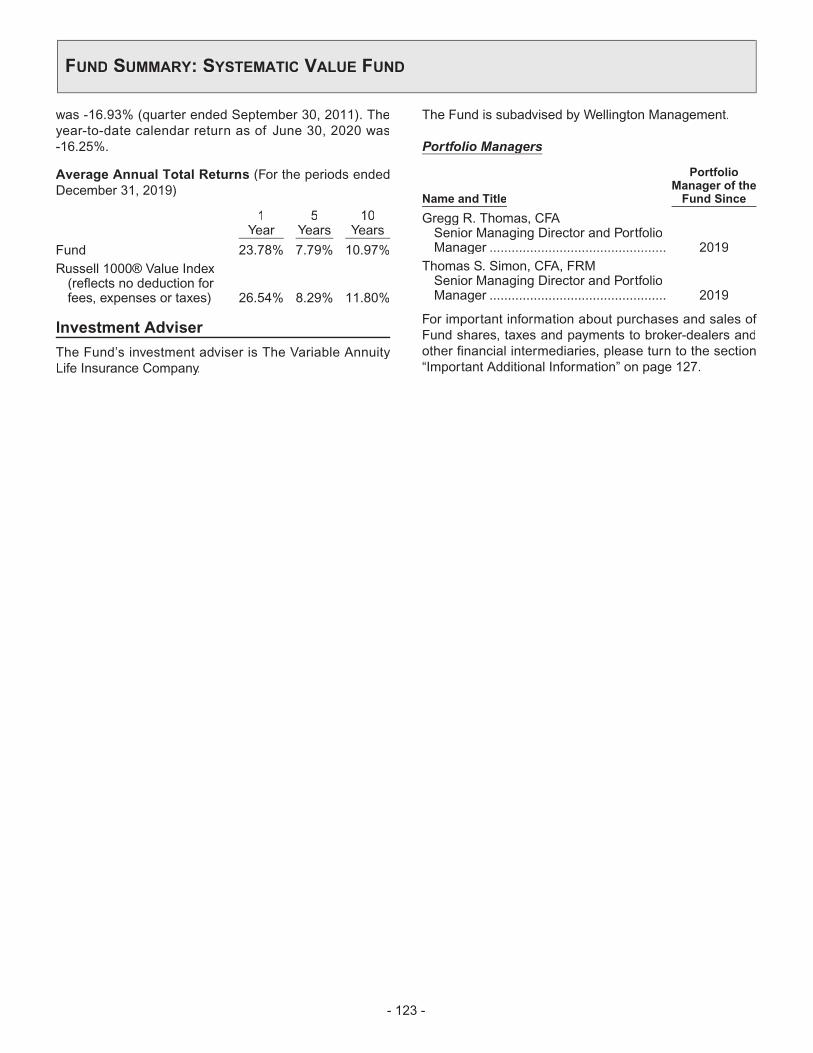
was -16.93% (quarter ended September 30, 2011). Theyear-to-date calendar return as of June 30, 2020 was-16.25%.
Average Annual Total Returns (For the periods endedDecember 31, 2019)
1Year
5Years
10Years
Fund 23.78% 7.79% 10.97%Russell 1000® Value Index(reflects no deduction forfees, expenses or taxes) 26.54% 8.29% 11.80%
Investment Adviser
The Fund’s investment adviser is The Variable AnnuityLife Insurance Company.
The Fund is subadvised by Wellington Management.
Portfolio Managersg
Name and Title
PortfolioManager of theFund Since
Gregg R. Thomas, CFASenior Managing Director and PortfolioManager ................................................ 2019
Thomas S. Simon, CFA, FRMSenior Managing Director and PortfolioManager ................................................ 2019
For important information about purchases and sales ofFund shares, taxes and payments to broker-dealers andother financial intermediaries, please turn to the section“Important Additional Information” on page 127.
FUND SUMMARY: SYSTEMATIC VALUE FUND
- 123 -
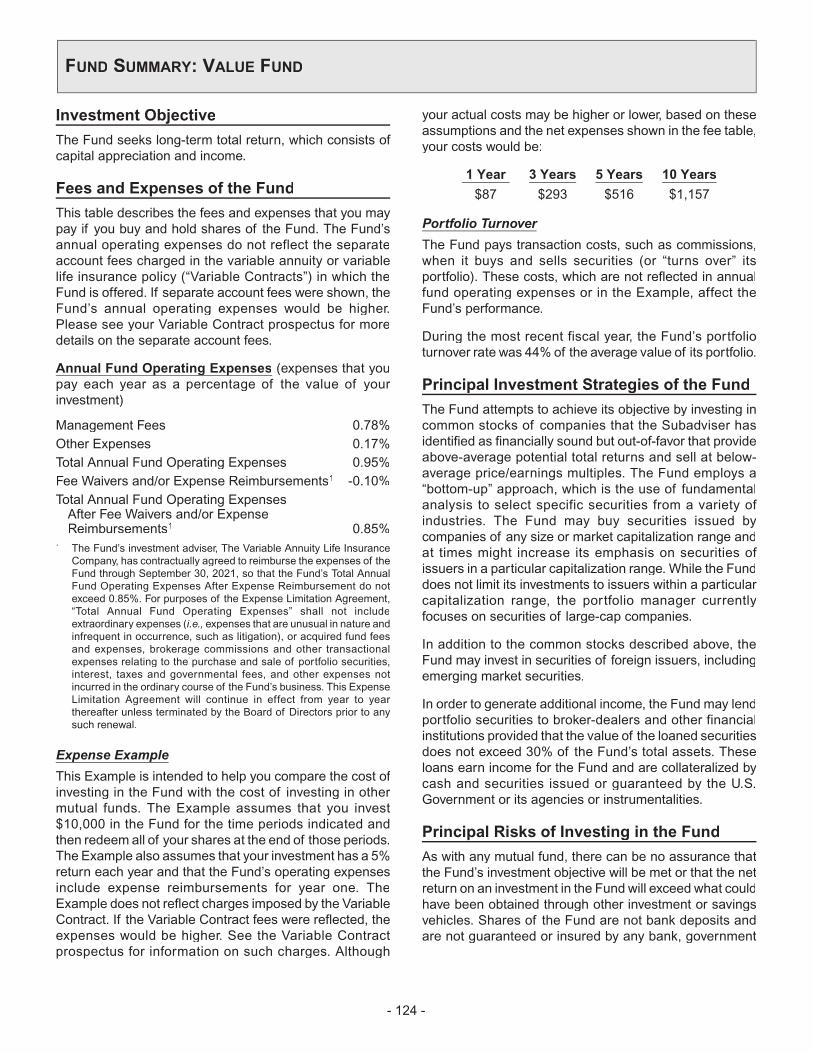
Investment Objective
The Fund seeks long-term total return, which consists ofcapital appreciation and income.
Fees and Expenses of the Fund
This table describes the fees and expenses that you maypay if you buy and hold shares of the Fund. The Fund’sannual operating expenses do not reflect the separateaccount fees charged in the variable annuity or variablelife insurance policy (“Variable Contracts”) in which theFund is offered. If separate account fees were shown, theFund’s annual operating expenses would be higher.Please see your Variable Contract prospectus for moredetails on the separate account fees.
Annual Fund Operating Expenses (expenses that yougpay each year as a percentage of the value of yourinvestment)
Management Fees 0.78%Other Expenses 0.17%Total Annual Fund Operating Expenses 0.95%Fee Waivers and/or Expense Reimbursements1 -0.10%Total Annual Fund Operating ExpensesAfter Fee Waivers and/or ExpenseReimbursements1 0.85%
1 The Fund’s investment adviser, The Variable Annuity Life InsuranceCompany, has contractually agreed to reimburse the expenses of theFund through September 30, 2021, so that the Fund’s Total AnnualFund Operating Expenses After Expense Reimbursement do notexceed 0.85%. For purposes of the Expense Limitation Agreement,“Total Annual Fund Operating Expenses” shall not includeextraordinary expenses (i.e., expenses that are unusual in nature andinfrequent in occurrence, such as litigation), or acquired fund feesand expenses, brokerage commissions and other transactionalexpenses relating to the purchase and sale of portfolio securities,interest, taxes and governmental fees, and other expenses notincurred in the ordinary course of the Fund’s business. This ExpenseLimitation Agreement will continue in effect from year to yearthereafter unless terminated by the Board of Directors prior to anysuch renewal.
Expense Example
This Example is intended to help you compare the cost ofinvesting in the Fund with the cost of investing in othermutual funds. The Example assumes that you invest$10,000 in the Fund for the time periods indicated andthen redeem all of your shares at the end of those periods.The Example also assumes that your investment has a 5%return each year and that the Fund’s operating expensesinclude expense reimbursements for year one. TheExample does not reflect charges imposed by the VariableContract. If the Variable Contract fees were reflected, theexpenses would be higher. See the Variable Contractprospectus for information on such charges. Although
your actual costs may be higher or lower, based on theseassumptions and the net expenses shown in the fee table,your costs would be:
1 Year 3 Years 5 Years 10 Years
$87 $293 $516 $1,157
Portfolio Turnover
The Fund pays transaction costs, such as commissions,when it buys and sells securities (or “turns over” itsportfolio). These costs, which are not reflected in annualfund operating expenses or in the Example, affect theFund’s performance.
During the most recent fiscal year, the Fund’s portfolioturnover rate was 44% of the average value of its portfolio.
Principal Investment Strategies of the Fund
The Fund attempts to achieve its objective by investing incommon stocks of companies that the Subadviser hasidentified as financially sound but out-of-favor that provideabove-average potential total returns and sell at below-average price/earnings multiples. The Fund employs a“bottom-up” approach, which is the use of fundamentalanalysis to select specific securities from a variety ofindustries. The Fund may buy securities issued bycompanies of any size or market capitalization range andat times might increase its emphasis on securities ofissuers in a particular capitalization range. While the Funddoes not limit its investments to issuers within a particularcapitalization range, the portfolio manager currentlyfocuses on securities of large-cap companies.
In addition to the common stocks described above, theFund may invest in securities of foreign issuers, includingemerging market securities.
In order to generate additional income, the Fund may lendportfolio securities to broker-dealers and other financialinstitutions provided that the value of the loaned securitiesdoes not exceed 30% of the Fund’s total assets. Theseloans earn income for the Fund and are collateralized bycash and securities issued or guaranteed by the U.S.Government or its agencies or instrumentalities.
Principal Risks of Investing in the Fund
As with any mutual fund, there can be no assurance thatthe Fund’s investment objective will be met or that the netreturn on an investment in the Fund will exceed what couldhave been obtained through other investment or savingsvehicles. Shares of the Fund are not bank deposits andare not guaranteed or insured by any bank, government
FUND SUMMARY: VALUE FUND
- 124 -

entity or the Federal Deposit Insurance Corporation. If thevalue of the assets of the Fund goes down, you could losemoney.
The following is a summary of the principal risks ofinvesting in the Fund.
Management Risk. The investment style or strategy usedby the Subadviser may fail to produce the intended result.The Subadviser’s assessment of a particular security orcompany may prove incorrect, resulting in losses orunderperformance.
Equity Securities Risk. The Fund invests principally inequity securities and is therefore subject to the risk thatstock prices will fall and may underperform other assetclasses. Individual stock prices fluctuate from day-to-dayand may decline significantly. The prices of individualstocks may be negatively affected by poor companyresults or other factors affecting individual prices, as wellas industry and/or economic trends and developmentsaffecting industries or the securities market as a whole.
Currency Risk. Because the Fund’s foreign investmentsare generally held in foreign currencies, the Fund couldexperience gains or losses based solely on changes in theexchange rate between foreign currencies and the U.S.dollar. Such gains or losses may be substantial.
Foreign Investment Risk. Investment in foreignsecurities involves risks due to several factors, such asilliquidity, the lack of public information, changes in theexchange rates between foreign currencies and the U.S.dollar, unfavorable political, social and legaldevelopments, or economic and financial instability.Foreign companies are not subject to the U.S. accountingand financial reporting standards and may have riskiersettlement procedures. U.S. investments that aredenominated in foreign currencies or that are traded inforeign markets, or securities of U.S. companies that havesignificant foreign operations may be subject to foreigninvestment risk.
Emerging Markets Risk. In addition to the risksassociated with investments in foreign securities,emerging market securities are subject to additional risks,which cause these securities generally to be more volatilethan securities of issuers located in developed countries.
Large- and Mid-Cap Company Risk. Investing in large-andmid-cap companies carries the risk that due to currentmarket conditions these companies may be out of favorwith investors. Large-cap companies may be unable torespond quickly to new competitive challenges or attainthe high growth rate of successful smaller companies.
Stocks of mid-cap companies may be more volatile thanthose of larger companies due to, among other reasons,narrower product lines, more limited financial resourcesand fewer experienced managers.
Small-Cap Company Risk. Investing in small-capcompanies carries the risk that due to current marketconditions these companies may be out of favor withinvestors. Small companies often are in the early stagesof development with limited product lines, markets, orfinancial resources and managements lacking depth andexperience, which may cause their stock prices to bemorevolatile than those of larger companies. Small companystocks may be less liquid yet subject to abrupt or erraticprice movements. It may take a substantial period of timebefore the Fund realizes a gain on an investment in asmall-cap company, if it realizes any gain at all.
Market Risk. The Fund’s share price can fall because ofweakness in the broad market, a particular industry, orspecific holdings or due to adverse political or economicdevelopments here or abroad, changes in investorpsychology, or heavy institutional selling and otherconditions or events (including, for example, militaryconfrontations, war, terrorism, disease/virus, outbreaksand epidemics). The prices of individual securities mayfluctuate, sometimes dramatically, from day to day. Theprices of stocks and other equity securities tend to bemore volatile than those of fixed-income securities.
The coronavirus pandemic and the related governmentaland public responses have had and may continue to havean impact on the Fund’s investments and net asset valueand have led and may continue to lead to increasedmarket volatility and the potential for illiquidity in certainclasses of securities and sectors of the market.Preventative or protective actions that governments maytake in respect of pandemic or epidemic diseases mayresult in periods of business disruption, businessclosures, inability to obtain raw materials, supplies andcomponent parts, and reduced or disrupted operations forthe issuers in which the Fund invests. Governmentintervention in markets may impact interest rates, marketvolatility and security pricing. The occurrence,reoccurrence and pendency of such diseases couldadversely affect the economies (including throughchanges in business activity and increasedunemployment) and financial markets either in specificcountries or worldwide.
Value Style Risk. Generally, “value” stocks are stocks ofcompanies that a subadviser believes are currentlyundervalued in the marketplace. A subadviser’s judgmentthat a particular security is undervalued in relation to the
FUND SUMMARY: VALUE FUND
- 125 -

company’s fundamental economic value may proveincorrect and the price of the company’s stock may fall ormay not approach the value the subadviser has placed onit.
Securities Lending Risk. Engaging in securities lendingcould increase the market and credit risk for Fundinvestments. The Fund may lose money if it does notrecover borrowed securities, the value of the collateralfalls, or the value of investments made with cash collateraldeclines. If the value of either the cash collateral or theFund’s investments of the cash collateral falls below theamount owed to a borrower, the Fund also may incurlosses that exceed the amount it earned on lending thesecurity. Securities lending also involves the risks of delayin receiving additional collateral or possible loss of rightsin the collateral if the borrower fails. Another risk ofsecurities lending is the risk that the loaned portfoliosecurities may not be available to the Fund on a timelybasis and the Fund may therefore lose the opportunity tosell the securities at a desirable price.
Performance Information
The following Risk/Return Bar Chart and Table illustratethe risks of investing in the Fund by showing changes inthe Fund’s performance from calendar year to calendaryear and comparing the Fund’s average annual returns tothose of the Russell 1000® Value Index. Fees andexpenses incurred at the contract level are not reflected inthe bar chart or table. If these amounts were reflected,returns would be less than those shown. Of course, pastperformance is not necessarily an indication of how theFund will perform in the future.
From June 21, 2004 through March 14, 2011,OppenheimerFunds, Inc. (“Oppenheimer”) subadvisedthe Fund. Effective March 14, 2011, WellingtonManagement Company LLP (“Wellington Management”)assumed subadvisory duties of the Fund.
14.89%
-2.27%
16.94%
31.13%
11.40%
-3.18%
13.31%15.34%
-9.88%
27.45%
-15%
-10%
-5%
0%
5%
10%
15%
20%
25%
30%
35%
2010 2011 2012 2013 2014 2015 2016 2017 2018 2019
During the 10-year period shown in the bar chart, thehighest return for a quarter was 13.91% (quarter endedDecember 31, 2011) and the lowest return for a quarterwas -17.55% (quarter ended September 30, 2011). Theyear-to-date calendar return as of June 30, 2020 was-14.96%.
Average Annual Total Returns (For the periods endedDecember 31, 2019)
1Year
5Years
10Years
Fund 27.45% 7.76% 10.80%Russell 1000® Value Index(reflects no deduction forfees, expenses or taxes) 26.54% 8.29% 11.80%
Investment Adviser
The Fund’s investment adviser is The Variable AnnuityLife Insurance Company.
The Fund is subadvised by Wellington Management.
Portfolio Managersg
Name and Title
PortfolioManager of theFund Since
Adam H. Illfelder, CFAManaging Director and Equity PortfolioManager ................................................ 2018
For important information about purchases and sales ofFund shares, taxes and payments to broker-dealers andother financial intermediaries, please turn to the section“Important Additional Information” on page 127.
FUND SUMMARY: VALUE FUND
- 126 -

Purchases and Sales of Fund Shares
Shares of the Funds may only be purchased or redeemedthrough Variable Contracts offered by the separateaccounts of VALIC or other participating life insurancecompanies and through qualifying retirement plans(“Plans”) and IRAs. Shares of each Funds may bepurchased and redeemed each day the New York StockExchange is open, at the Fund’s net asset valuedetermined after receipt of a request in good order.
The Funds do not have any initial or subsequentinvestment minimums. However, your insurance companymay impose investment or account value minimums. Theprospectus (or other offering document) for your VariableContract contains additional information about purchasesand redemptions of the Funds’ shares.
Tax Information
A Fund will not be subject to U.S. federal income tax solong as it qualifies as a regulated investment company anddistributes its income and gains each year to itsshareholders. However, contractholders may be subject tofederal income tax (and a federal Medicare tax of 3.8%that applies to net income, including taxable annuitypayments, if applicable) upon withdrawal from a VariableContract. Contractholders should consult the prospectus(or other offering document) for the Variable Contract foradditional information regarding taxation.
Payments to Broker-Dealers andOther Financial Intermediaries
The Funds are not sold directly to the general public butinstead are offered to registered and unregisteredseparate accounts of VALIC and its affiliates and to Plansand IRAs. The Funds and their related companies maymake payments to the sponsoring insurance company orits affiliates for recordkeeping and distribution. Thesepayments may create a conflict of interest as they may bea factor that the insurance company considers in includingthe Funds as underlying investment options in a variablecontract. Visit your sponsoring insurance company’swebsite for more information.
IMPORTANT ADDITIONAL INFORMATION
- 127 -

The Funds’ investment objectives, principal investment strategies and principal risks are described in their respectiveFund Summaries. In addition to the principal strategies described therein, a Fund may from time-to-time invest in othersecurities and use other investment techniques. We have identified below those securities and techniques and thenon-principal risks associated with them. Descriptions of these investments and risks are provided in the “Glossary”section under “Investment Terms” or “Investment Risks.”
From time to time, certain Funds may take temporary defensive positions that are inconsistent with their principalinvestment strategies, in attempting to respond to adverse market, economic, political, or other conditions. There is nolimit on a Fund’s investments in money market securities for temporary defensive purposes. If a Fund takes such atemporary defensive position, it may not achieve its investment objective. The following Funds may not take temporarydefensive positions that are inconsistent with their principal investment strategies: International Equities Index Fund, MidCap Index Fund, Nasdaq- 100 Index® Fund, Small Cap Index Fund, Stock Index Fund and Systematic Core Fund
The investment objective and principal strategies for each of the Fund in this Prospectus are non-fundamental and maybe changed by the Board of Directors of VALIC Company I (“VC I”) without investor approval. Investors will be given atleast 60 days’ written notice in advance of any change to a Fund’s investment strategy that requires 80% of its net assetsto be invested in certain types of securities described in the name of the Fund. References to “net assets” in the FundSummaries take into account any borrowings for investment purposes by a Fund. Unless stated otherwise, allpercentages are calculated as of the time of purchase.
The Funds enter into contractual arrangements with various parties, including, among others, the Funds’ investmentadviser, The Variable Annuity Life Insurance Company (“VALIC” or the “Adviser”), who provide services to the Funds.Shareholders are not parties to, or intended (or “third-party”) beneficiaries, of those contractual arrangements and thosecontractual arrangements cannot be enforced by shareholders.
This Prospectus and the Statement of Additional Information (“SAI”) provide information concerning the Funds that youshould consider in determining whether to purchase shares of the Funds. The Funds may make changes to thisinformation from time to time. Neither this Prospectus nor the SAI is intended to give rise to any contract rights or otherrights in any shareholder, other than any rights conferred by federal or state securities laws.
In addition to the securities and investment techniques described in this Prospectus, there are other securities andinvestment techniques in which the Funds may invest in limited instances. These other securities and investmenttechniques are listed in the SAI, which you may obtain free of charge (see back cover).
VALIC, as the investment adviser of VC I, initially allocates the assets of certain Funds that have more than oneSubadviser in a manner designed to maximize investment efficiency as well as properly reflect the investment style andprovide complementary fit within the Fund. VALIC allocates subscriptions and redemptions equally among the multipleSubadvisers, unless VALIC determines that a different allocation of assets would be in the best interest of the respectiveFund and its shareholders. VALIC periodically reviews the asset allocation in each Fund to determine the extent to whicha portion of assets managed by a Subadviser differs from that portion initially allocated to the Subadviser. If VALICdetermines that the difference is significant, VALIC may effect a re-balancing of a Fund’s assets and adjustment of theFund’s allocation of cash flows among Subadvisers. However, VALIC reserves the right to reallocate assets from oneSubadviser to another when it would be in the best interests of a Fund and its shareholders to do so. VALIC makes suchdetermination based on a number of factors including to maintain a consistent investment style and to better reflect aFund’s benchmark or its peers. In some instances, the effect of the reallocation will be to shift assets from a betterperforming Subadviser to a portion of the Fund with a relatively lower total return.
Asset Allocation Fund
Within the stock sector, the Fund seeks appreciation ofcapital by selecting stocks of primarily large-capcompanies that the Subadviser believesmay participate inthe growth of the nation’s economy. Within the bondsector, the Fund will generally seek high current incomeconsistent with reasonable investment risk. The Fund’s
fixed income securities may consist of investment gradeU.S. dollar denominated emerging market debt in anamount which is the greater of up to 5% of total assets orthe percentage represented within the BloombergBarclays U.S. Aggregate Bond Index as well as asset-backed securities and lower rated high yield fixed incomesecurities (“junk bonds”). Within the money market sector,
ADDITIONAL INFORMATION ABOUT THE FUNDS’ INVESTMENT OBJECTIVES, STRATEGIESAND RISKS
- 128 -

the Fund seeks the highest level of current incomeconsistent with liquidity, stability, and preservation ofcapital.
The Fund may also use exchange-traded funds (“ETFs”)to achieve access to a diversified portfolio of foreignsecurities, including emerging market securities, anddomestic small cap stocks.
The Fund is also subject to the following additional risks:Investment Company Risk, Emerging Markets Risk,Small-Cap Company Risk, Mortgage and Asset-BackedSecurities Risk, Non-Mortgage Asset-Backed SecuritiesRisk, Junk Bond Risk, Growth-Style Risk andCybersecurity Risk.
Blue Chip Growth Fund
In selecting investments for the Fund, the Subadviserfocuses on companies with leading market positions,seasoned management, and strong financialfundamentals. The Subadviser’s investment approachreflects the belief that solid company fundamentals (withemphasis on strong growth in earnings per share oroperating cash flow) combined with a positive industryoutlook will ultimately reward investors with stronginvestment performance. Some of the companies theSubadviser targets will have good prospects for dividendgrowth. The Fund may at times invest significantly instocks of information technology companies.
In pursuing its investment objective, the Fund’sSubadviser has the discretion to purchase somesecurities that do not meet its normal investment criteria,such as when it perceives an opportunity for substantialappreciation. These situations might arise when theFund’s Subadviser believes a security could increase invalue for a variety of reasons, including a change inmanagement, an extraordinary corporate event, a newproduct introduction or innovation, or a favorablecompetitive development.
While most assets will be invested in common stocks,other securities may also be purchased to achieve theFund’s objective, including futures and options, ETFs,foreign securities, including American DepositaryReceipts (“ADRs”), emerging market securities and othernon-dollar denominated securities traded outside of theUnited States. The Fund may sell securities for a varietyof reasons, such as to secure gains, limit losses, orredeploy assets into more promising opportunities.
The Fund is also subject to the following additional risks:Currency Risk, Foreign Investment Risk, EmergingMarkets Risk, Depositary Receipts Risk, Currency Risk,Investment Company Risk, Derivatives Risk andCybersecurity Risk.
Capital Conservation Fund
The Fund may also invest in investment grade U.S. dollardenominated emerging market debt in an amount which isthe greater of up to 5% of total assets or the percentagerepresented within the Bloomberg Barclays U.S.Aggregate Bond Index. The Fund may acquire commonstocks by conversion of income bearing securities or byexercising warrants attached to income bearing securities.The Fund may hold up to 10% of its assets in commonstocks.
The Fund is also subject to the following additional risks:Convertible Securities Risk, Equity Securities Risk,Currency Risk, Foreign Investment Risk, EmergingMarkets Risk and Cybersecurity Risk.
Core Equity Fund
The Subadviser’s investment strategy is a conservative,long-term approach which is a blend of top-down sectoranalysis and bottom-up security selection.
Top-Down Sector Analysis. The Subadviser analyzes themacroeconomic and investment environment, includingan evaluation of economic conditions, U.S. fiscal andmonetary policy, demographic trends and investorsentiment. Through top-down analysis, the Subadviseranticipates trends and changes in markets in the economyas a whole and identifies industries and sectors that areexpected to outperform.
Bottom-Up Security Selection. Bottom-up securityselection consists of the use of fundamental analysis toidentify specific securities for purchase or sale.Fundamental analysis of a company involves theassessment of such factors as its management, businessenvironment, balance sheet, income statement,anticipated earnings, revenues, dividends and otherrelated measures of value.
In addition to common stocks, the Fund may invest inpreferred stocks and convertible securities in an effort toachieve its objective. The Fund may also use futurescontracts to manage the Fund’s cash position.
ADDITIONAL INFORMATION ABOUT THE FUNDS’ INVESTMENT OBJECTIVES, STRATEGIESAND RISKS
- 129 -
The Fund is also subject to the following additional risks:Convertible Securities Risk, Preferred Stock Risk,Derivatives Risk, Depositary Receipts Risk, ForeignInvestment Risk, Investment Company Risk andCybersecurity Risk.
Dividend Value Fund
Equity securities include common stock, preferred stock,securities convertible into common stock, or securities orother instruments whose price is linked to the value ofcommon stock. Convertible securities are generally debtsecurities or preferred stock that may be converted intocommon stock. Convertible securities typically pay currentincome as either interest (e.g., debt security convertibles)or dividends (preferred stock). A convertible’s valueusually reflects both the stream of current incomepayments and themarket value of the underlying commonstock. Preferred stock is a class of stock that often paysdividends at a specified rate and has preference overcommon stock in dividend payments and liquidation ofassets. Preferred stock may also be convertible intocommon stock.
BlackRock selects investments for the Fund that itbelieves will both increase in value over the long-term andprovide current income, focusing on investments that willdo both instead of those that will favor current income overcapital appreciation. SunAmerica Asset Management,LLC (“SunAmerica”) will select up to thirty high dividendyielding common stocks, which will be evaluated andadjusted at the discretion of the portfolio manager on anannual basis. The first ten stocks selected will representthe ten highest yielding stocks within the Dow JonesIndustrial Average. The next twenty stocks will be selectedfrom the Russell 1000® Index, although stocks in thefinancials and utilities sectors will generally be excludedfrom this twenty stock selection process. Certain stocks inthe Russell 1000® Index may also be excluded as a resultof liquidity screens or industry-related caps applied duringthe selection process. The selection criteria used to selectstocks for the twenty stock portion of the component ofthe Fund sub-advised by SunAmerica will generallyinclude dividend yield as well as a combination of factorsthat relate to profitability and valuation. Selections for theFund may include securities of foreign issuers. While thesecurities selection process will take place on an annualbasis, the portfolio managers may, from time to time,substitute certain securities for those selected for theFund or reduce the position size of a portfolio security inbetween the annual rebalancing, under certain limitedcircumstances. These circumstances will generally
include where a security held by the Fund no longer meetsthe dividend yielding criteria, when the value of a securitybecomes a disproportionately large percentage of theFund’s holdings, or when the size of the Fund’s position inthe security has the potential to create market liquidity orother issues in connection with the annual rebalancing orefficient management of the Fund, or to maintain anindustry-related cap, each in the discretion of the portfoliomanagers. The annual consideration of the stocks thatmeet the selection criteria will take place on or aboutAugust 31.
Dynamic Allocation Fund
Understanding the Fund
The Fund’s design is based on well-established principlesof asset allocation and diversification, combined with anoverlay strategy designed to adjust the Fund’s net equityexposure to maintain a relatively constant exposure toequity market volatility over time. The Fund has twoseparate components: the Fund-of-Funds Componentand the Overlay Component.
The Fund-of-Funds Component (70%-90%)
The Fund’s Fund-of-Funds Component will investsubstantially all of its assets in Underlying Funds that areseries of VC I or VC II.
SunAmerica establishes a target allocation between thetwo broad asset classes (equity and fixed income) withina range of 50% to 80% of the Fund-of-FundsComponent’s assets allocated to Underlying Funds thatinvest primarily in equities and 20% to 50% of its assetsto fixed income securities or instruments throughUnderlying Funds and direct investments.
SunAmerica considers a variety of factors, including therelationships between the various asset classes and theirlong-term outlook for risk and return characteristics, todetermine the target allocations between the followingasset classes: large cap, mid cap, small cap, foreignequity, and fixed income securities. In selecting theUnderlying Funds through which to achieve the assetallocation targets, SunAmerica considers, among otherfactors, the Underlying Funds’ investment objectives,policies, investment processes, historic performance,expenses, investment teams, reputation of the sub-advisers, and any diversification benefit to the overallFund’s holdings. The Fund-of-Funds Component isdesigned to include allocations to Underlying Funds thatvary with respect to sub-advisers, investment process,
ADDITIONAL INFORMATION ABOUT THE FUNDS’ INVESTMENT OBJECTIVES, STRATEGIESAND RISKS
- 130 -

and investment style (such as deep value versus relativevalue), and in some cases may include index funds orfunds with passively-managed components.
SunAmerica may add new Underlying Funds, replaceexisting Underlying Funds or change the Fund’s assetallocation among the Underlying Funds, without notice toinvestors, depending upon, among other factors,changing market environment, changes to target assetallocations, changes to the investment personnel,investment process, performance or criteria for holdings ofthe Underlying Funds, or the availability of otherUnderlying Funds that may provide a better diversificationbenefit to the Fund. If a new Underlying Fund is selectedor the allocation to an existing Underlying Fund is adjustedby SunAmerica, a corresponding shift of allocationsamong the remaining Underlying Funds generally willresult. While the Fund retains the ability to invest in anUnderlying Fund that holds only money market securities,it does not anticipate doing so for liquidity purposes, but itmay so invest to manage interest rate risks. The Fund mayuse daily cash flows to maintain the Underlying Funds’weights near the target or to change target allocations. Insome cases, sales and purchases of Underlying Fundsmay be used to move Underlying Fund weights towardsthe target more quickly. Sales and purchases ofUnderlying Funds by the Fund may lead to increasedportfolio turnover within the Underlying Funds. In the eventof such redemptions or investments, the Underlying Fundcould be required to sell securities or to invest cash at atime when it is not advantageous for the Underlying Fundto do so.
Appendix A to this Prospectus lists the Underlying Fundsin which the Fund may invest its assets, as of the date ofthis Prospectus, along with their investment goal andprincipal strategies, risks and investment techniques.SunAmerica may add new Underlying Fund investmentsor replace existing Underlying Fund investments for theFund at any time without prior notice to shareholders. Inaddition, the investment goal and principal strategies,risks and investment techniques of the Underlying Fundsheld by the Fund may change over time. In addition, theinvestment goal and principal strategies, risks andinvestment techniques of the Underlying Funds held bythe Fund may change over time. Additional informationregarding the Underlying Funds is included in thesummary prospectuses and statutory prospectuses,dated October 1, 2020 for those funds of VC I, and datedJanuary 1, 2020 for those funds of VC II. Copies of thesummary prospectuses and statutory prospectuses maybe obtained free of charge by calling or writing theUnderlying Companies at the telephone number oraddress on the back cover page of this Prospectus.
The Fund may invest in any or all of the Underlying Funds,but will not normally invest in every Underlying Fund at anyparticular time. There may be limits on the amount of cashinflows some Underlying Funds may accept frominvestors, including the Fund. VALIC may take intoaccount these capacity considerations when allocatinginvestments among the Underlying Funds. In someinstances, VALIC may allocate capacity in certainUnderlying Funds to other investors, which may have theeffect of limiting the Fund’s opportunity to invest in theUnderlying Fund.
Although the Fund-of-Funds Component’s investments inthe Underlying Funds attempt to achieve the targetallocation to equity and fixed incomeUnderlying Funds, asset forth in the Fund Summary, the actual allocations maybe different from the target. Actual allocations may differfrom target allocations due to, among other things,changes to the Underlying Funds’ asset values due tomarket movements or because of a recent change in thetarget allocation. Fund cash flows may be used tomaintain or move Underlying Funds towards the targetallocation, although SunAmerica may, from time to time,rebalance allocations to correspond to the targetallocations through either, purchases and sales ofUnderlying Funds, or through allocating Fund cash flowsbelow or above the target allocations. When SunAmericarebalances the Underlying Funds to its target allocation(whether through cash flow allocations or purchases orsales), it does so based on the most recent value of theUnderlying Funds, which may be higher or lower than thevalue on the date of purchase.
The Fund-of-Funds Component seeks capitalappreciation primarily through its investments inUnderlying Funds that invest in equity securities. Theseinvestments may include Underlying Funds that invest inequity securities of both U.S. and non-U.S. companies ofall market capitalizations with above average growthpotential, but are expected to include to a lesser extentUnderlying Funds that invest primarily in small- and mid-cap U.S. companies and foreign companies. The Fundnormally does not expect to have more than 25% of itstotal assets allocated to Underlying Funds investingprimarily in foreign securities, and no more than 5% of itstotal assets to Underlying Funds investing primarily inemerging markets. The Fund-of-Funds Component seeksto achieve current income through its investments inUnderlying Funds that primarily invest in fixed incomesecurities, including both U.S. and foreign investmentgrade securities, but no more than 5% of the Fund’s totalassets are expected to be invested in Underlying Fundsinvesting primarily in high-yield, high-risk bonds(commonly known as “junk bonds”). Please note that the
ADDITIONAL INFORMATION ABOUT THE FUNDS’ INVESTMENT OBJECTIVES, STRATEGIESAND RISKS
- 131 -

Acquired Fund Fees and Expenses of the UnderlyingFunds, as set forth in the Fund Summary, could change asthe Underlying Funds’ asset values change or through theaddition or deletion of Underlying Funds. Because of thecosts incurred by the Fund in connection with itsinvestment in the Underlying Funds, the costs of investingin the Underlying Funds through the Fund will generally behigher than the cost of investing in an Underlying Funddirectly. The Fund, as a shareholder, will pay its share ofthe Underlying Funds’ expenses as well as the Fund’sown expenses. Therefore, an investment in the Fund mayresult in the duplication of certain expenses. Investorsmay be able to realize lower aggregate expenses byinvesting directly in the Underlying Funds instead of theFund. An investor who chooses to invest directly in theUnderlying Funds would not, however, receive the assetallocation services provided by SunAmerica or theservices of the Subadviser in connection with the OverlayComponent. In addition, certain Underlying Funds maynot be available as investment options under your VariableContract.
The Overlay Component (10%-30%)
The Overlay Component comprises the remaining 10% to30% of the Fund’s total assets. The Overlay Componentwill invest in fixed income securities to generate currentincome and to serve as collateral for derivativestransactions. The Overlay Component will also invest inshort-term investments to manage the overall Fund’s dailycash flows and liquidity needs and to serve as collateralfor derivative transactions. The Overlay Component mayalso increase or reduce the Fund’s net equity exposurethrough stock index futures, stock index options, optionson stock index futures, and stock index swaps (“StockIndex Instruments”). If AllianceBernstein determines thatthe Stock Index Instruments are not being accuratelypriced by the market in relation to the price of the actualstocks in the S&P 500® Index, AllianceBernstein mayinvest in stock positions directly to emulate the index untilsuch time as the Stock Index Instruments’ valuationsreturn to fair value.
The Fund’s investment in derivative instruments will beused to increase or decrease the Fund’s overall net equityexposure, and therefore, its volatility and return potential.High levels of volatility may result from rapid and dramaticprice swings. Through the use of derivative instruments,AllianceBernstein may adjust the Fund’s net equityexposure down to a minimum of 25% or up to a maximumof 100%, although the Fund’s average net equityexposure over long-term periods is expected to beapproximately 60%-65%. For example, when themarket isin a state of higher volatility, AllianceBernstein maydecrease the Fund’s net equity exposure by taking a short
position in derivative instruments. The use of derivativesin this manner may expose the Fund to leverage when theFund’s index futures position is larger than the collateralbacking it. Trading in the Overlay Component will bemanaged in accordance with established guidelines in anattempt to maintain a relatively stable exposure to equitymarket volatility over time, subject to minimum andmaximum net equity exposure ranges.
The Fund’s performance may be lower than similar fundthat do not seek to manage their equity exposure. IfAllianceBernstein increases the Fund’s net equityexposure and equity markets decline, the Fund mayunderperform traditional or static allocation funds.Likewise, if AllianceBernstein reduces the Fund’s netequity exposure and equity markets rise, the Fund mayalso underperform traditional or static allocation funds.Efforts to manage the Fund’s volatility may also exposethe Fund to additional costs. In addition, AllianceBernsteinwill seek to reduce exposure to certain downside risks bypurchasing equity index put options that aim to reduce theFund exposure to certain severe and unanticipatedmarket events that could significantly detract from returns.
In addition to managing the Fund’s net equity exposure asdescribed above, AllianceBernstein will, withinestablished guidelines, manage the Overlay Componentin an attempt to generate income, manage Fund cashflows and liquidity needs, and manage collateral for thederivative instruments. AllianceBernstein will manage thefixed income investments of the Overlay Component byinvesting only in securities rated investment grade orhigher by a nationally recognized statistical ratingorganization, or, if unrated, determined byAllianceBernstein to be of comparable quality. A portion ofthe Overlay Component may be held in short-terminvestments as needed, in order to manage daily cashflows to or from the Fund or to serve as collateral.
AllianceBernstein uses a proprietary system to help itestimate the Fund’s expected volatility. The proprietarysystem used by AllianceBernstein may perform differentlythan expected and may negatively affect performance andthe ability of the Fund to maintain its volatility within itstarget volatility level for various reasons, including errorsin using or building the system, technical issuesimplementing the system, data issues and various non-quantitative factors (e.g., market or trading systemdysfunctions, and investor fear or over-reaction).
Emerging Economies Fund
The Subadviser believes that emerging markets aregenerally inefficient as demonstrated by the high andvariable volatility of many emerging markets and
ADDITIONAL INFORMATION ABOUT THE FUNDS’ INVESTMENT OBJECTIVES, STRATEGIESAND RISKS
- 132 -

individual companies in these markets. Corporatedisclosure and transparency can vary widely therebyexacerbating the inefficiency of these markets andoffering opportunities to experienced, well-informed activeinvestors.
In managing the Fund, the Subadviser adheres to adisciplined process for stock selection and portfolioconstruction. A proprietary multi-factor model is used toquantitatively rank securities in the Fund’s investmentuniverse, which the Subadviser uses to select securities.Securities held in the Fund that the Subadviser believeshave become over-valued and/or whose factor signalshave deteriorated materially may be sold and aregenerally replaced with more attractive securities, on thebasis of the Subadviser’s disciplined investment process.
The portfolio construction process controls for sector andindustry weights, number of stocks held, and position size.Risk or factor exposures are actively managed throughportfolio construction.
The Fund has access to the Subadviser’s currencyspecialists in determining the extent and nature of theFund’s exposure to various foreign currencies. The Fundmay also use participatory notes in the management ofportfolio assets. Participatory notes are participationinterest notes that are issued by banks or broker-dealersand are designed to offer a return linked to a particularunderlying equity, debt, currency or market. TheSubadviser typically uses participatory notes to accessforeign markets to which the Fund lacks direct access.The Fund may also use exchange-traded futures tomanage the Fund’s cash position.
The Fund is also subject to the following additional risks:Participatory Notes Risk and Cybersecurity Risk.
Global Real Estate Fund
Real estate and real-estate companies in which the Fundmay invest include (i) real estate investment trusts(“REITs”) or other real estate operating companies that(a) own property, (b) make or invest in short-termconstruction and development mortgage loans, or(c) invest in long-term mortgages or mortgage pools, and(ii) companies whose products and services are related tothe real estate industry, such as manufacturers anddistributors of building supplies and financial institutionsthat issue or service mortgages.
The Fund may also invest in other equity securities anddebt securities includingmortgage-backed securities, U.S.Treasury and agency bonds and notes. The Fund mayinvest up to 10% of net assets in non-investment gradedebt securities (commonly known as “junk bonds”).
The Fund is also subject to the following additional risks:Convertible Securities Risk, Credit Risk, Junk Bond Risk,Interest Rate Risk, Mortgage-Backed Securities Risk,Preferred Securities Risk and U.S. GovernmentObligations Risk.
Global Strategy Fund
Under normal market conditions, the Fund invests inequity securities of companies in any country, fixedincome (debt) securities of companies and governmentsof any country, and in money market securities to achieveits investment objective of total return.
In choosing equity securities, Franklin Advisers, theFund’s subadviser, seeks to achieve a lower level of riskand higher risk-adjusted performance than the MSCIACWI Index over the long term through a rules-basedmulti-factor selection process. Franklin Advisers selectsstocks from the MSCI ACWI Index for the Fund that havefavorable exposure to the following four investment stylefactors (commonly referred to as “smart beta”):
Quality: This factor utilizes traditional financial statementanalysis in an attempt to capture companies with highprofitability, strong balance sheets, low earnings variabilityand efficiency in use of assets.
Value: This factor identifies companies that are attractivelyvalued and poised for strong performance byincorporating measurements such as price to earnings,price to forward earnings, price to book value and dividendyield.
Momentum: This factor identifies investment trends andseeks to avoid value traps by incorporatingmeasurementssuch as 6-month risk adjusted price momentum and 12-month risk-adjusted price momentum.
Low Volatility: This factor identifies companies that exhibitlower risk relative to the market by incorporatingmeasurements such as historical beta.
During the stock selection process, Franklin Advisersassigns weights to each of the investment style factors asfollows to construct the Fund’s portfolio: 50% to Quality;30% to Value; 10% to Momentum; and 10% to LowVolatility. These factor weights are then used to scoreeach stock in the MSCI ACWI Index. Only stocks thatscore in the top 25% will be included in the Fund’sportfolio. Franklin Advisers limits the position size of astock to 1% of the Fund’s portfolio so that no one issuerhas an outsized impact on overall Fund performance.Franklin Advisers rebalances the Fund’s portfolio on asemi-annual basis based on the investment style factors,and will continue to hold stocks between its semi-annual
ADDITIONAL INFORMATION ABOUT THE FUNDS’ INVESTMENT OBJECTIVES, STRATEGIESAND RISKS
- 133 -
selection of stocks, even if there are adversedevelopments concerning a particular stock, an industry,the economy or the stock market generally. Thesubadviser may reduce the position size of a stock or sellthe stock at the time of the semi-annual selection processif the stock no longer has favorable exposure to the fourinvestment style factors as a result of its score decreasing.
In choosing debt investments, Franklin Advisers primarilyinvests the Fund’s assets in foreign and domesticsovereign debt obligations and allocates the Fund’sassets among issuers, geographic regions, andcurrencies based upon its assessment of relative interestrates among currencies, Franklin Advisers’ outlook forchanges in interest rates, and credit risks. The Fund mayinvest in debt securities that are rated below investmentgrade or, if unrated, determined by the subadviser to be ofcomparable quality, including high yield debt securitiesand debt securities that are in default at the time ofpurchase. Many debt securities of non-U.S. issuers, andespecially emerging market issuers, are rated belowinvestment grade or are unrated so that their selectiondepends on the subadviser’s internal analysis. Thesubadviser may purchase a debt security when it believesthe security is undervalued or will provide highlycompetitive rate yields. Conversely, the subadviser mayconsider selling a debt security when it believes thesecurity has become fully valued due to either its priceappreciation or changes in the issuer’s fundamentals, orwhen the subadviser believes another security is a moreattractive investment opportunity. The Fund may allocatea significant portion of its assets to cash and cashequivalents to take advantage of investment opportunitiesas they arise, to manage volatility and for other portfoliomanagement purposes.
Franklin Advisers may, on behalf of the Fund, enter intovarious currency related transactions involving derivativeinstruments, including currency and cross currencyforwards, currency options and currency and currencyindex futures contracts (such futures will be limited to 5%of total fund assets). These derivative instruments may beused to hedge (protect) against currency risks or to allowthe Fund to obtain net long or net short exposures toselected currencies for the purpose of pursuing itsinvestment goals. The Fund may use a portion of its cashand cash equivalents as collateral for derivatives.
Government Money Market I Fund
All Government Money Market I Fund investments mustcomply with the quality, diversification and otherrequirements of Rule 2a-7 under the InvestmentCompany Act of 1940, as amended (the “1940 Act”), and
other rules adopted by the Securities and ExchangeCommission (“SEC”).
Government Securities Fund
U.S. Government securities are issued or guaranteed bythe U.S. Government, its agencies and instrumentalities.Some U.S. Government securities are issued orunconditionally guaranteed by the U.S. Treasury. Suchsecurities are high quality debt securities. While thesesecurities are subject to variations in market value due tofluctuations in interest rates, they will be paid in full if heldto maturity. Other U.S. Government securities are neitherdirect obligations of, nor guaranteed by, the U.S. Treasury.However, they involve federal sponsorship in one way oranother. For example, some are backed by specific typesof collateral; some are supported by the issuer’s right toborrow from the Treasury; some are supported by thediscretionary authority of the Treasury to purchase certainobligations of the issuer; and others are supported only bythe credit of the issuing government agency orinstrumentality.
The Fund is also subject to the following additional risks:Derivatives Risk and Cybersecurity Risk.
Growth Fund
The Passive Manager primarily seeks to track its sleeve’sUnderlying Index by investing in all or substantially all ofthe stocks included in the Underlying Index, (i.e.,S&P 500® Growth Index) a strategy known as“replication.” The Passive Manager may, however, utilizean “optimization” strategy in circumstances in whichreplication is difficult or impossible, such as if the Fundhas low asset levels and cannot replicate, to reducetrading costs or to gain exposure to securities that theFund cannot access directly. The goal of optimization is toselect stocks which ensure that characteristics such asindustry weightings, average market capitalizations andfundamental characteristics (e.g., price-to-book, price-to-earnings, debt-to-asset ratios and dividend yields) closelyapproximate those of the Underlying Index. Stocks not inthe Underlying Index may be held before or after changesin the composition of the Underlying Index or if they havecharacteristics similar to stocks in the Underlying Index.Because the Fund may not always hold all of the stocksincluded in the Underlying Index, and because the Fundhas expenses and the Underlying Index does not, thepassively managed portion of the Fund will not duplicatethe Underlying Index’s performance precisely. However,the Passive Manager believes there should be a closecorrelation between the Underlying Index’s performanceand that of the sleeve of the Fund that tracks the
ADDITIONAL INFORMATION ABOUT THE FUNDS’ INVESTMENT OBJECTIVES, STRATEGIESAND RISKS
- 134 -

performance of the Underlying Index, in both rising andfalling markets.
Companies in the actively managed sleeve of the Fund’sportfolio are selected through a process of both top-downmacro-economic analysis of economic and businessconditions, and bottom-up analysis of the businessfundamentals of individual companies. The Fund willemphasize common stock of companies with mid to largestock market capitalizations; however, the Fund also mayinvest in the common stock of small companies. Thestocks are selected from a universe of companies thatFund management believes have above average growthpotential. Fund management will make investmentdecisions based on judgments regarding several valuationparameters relative to anticipated rates of growth inearnings and potential rates of return on equity.
The Fund may invest to a limited extent in the followingtypes of investments: convertible securities, preferredstocks, rights and warrants, fixed-income securities, otherinvestment companies including ETFs, illiquid securities,privately placed and restricted securities and repurchaseagreements and purchase and sale contracts.
The Fund may also use futures contracts for both hedgingand non-hedging purposes including, for example, tohedge its portfolio against market, interest rate andcurrency risks, to enhance Fund returns and to manage itscash position. The Fund currently intends to use futurescontracts in non-principal amounts.
The Fund is also subject to the following additional risks:Credit Risk, Interest Rate Risk, U.S. GovernmentObligations Risk, Foreign Sovereign Debt Risk,Derivatives Risk, Hedging Risk, Counterparty Risk,Convertible Securities Risk, Investment Company Risk,Privately Placed Securities Risk, Risks of Leverage,Liquidity Risk, Repurchase Agreements and Purchaseand Sale Contracts Risk, Preferred Stock Risk, WarrantRisk and Cybersecurity Risk.
Health Sciences Fund
In pursuing its investment objective, the Fund will usefundamental, bottom-up analysis that seeks to identifyhigh-quality companies and the most compellinginvestment opportunities. In general, the Fund will follow agrowth investment strategy, seeking companies whoseearnings are expected to grow faster than inflation and theeconomy in general. When stock valuations seemunusually high, however, a “value” approach, which givespreference to seemingly undervalued companies, may beemphasized. The Fund generally seeks to invest incompanies that are developing new and effectivemedicines, as well as in companies whose business
models reduce costs or improve quality in health caresystems.
Options will be used by the Subadviser mainly to protectagainst downside risk or to enhance the Fund’s income.Writing call options on securities that it owns exposes theFund to the risk that it will have to sell those securities ata price below their market value and forgo the benefitotherwise available from an increase in the value of thesecurities. Writing put options exposes the Fund to the riskthat it will have to purchase securities at a price above theirmarket value and can increase Fund losses if the value ofthe securities declines. Losses associated with these riskscan exceed any premium income received by the Fund forwriting options.
While most assets will be invested in common stocks andoptions, the Subadviser may employ other strategies thatare not considered part of the Fund’s principal investmentstrategies. From time to time, the Subadviser may investin securities other than common stocks and usederivatives that are consistent with its investmentprogram. For instance, the Subadviser may invest, to alimited extent, in futures. Any investments in futures wouldtypically serve as an efficient means of gaining exposureto certain markets, or as a tool to manage cash flows intoand out of the Fund and maintain liquidity while beinginvested in the market. To the extent the Fund invests infutures, it could be exposed to potential volatility andlosses greater than direct investments in the contract’sunderlying assets.
The Subadviser may sell securities for a variety ofreasons, such as to secure gains, limit losses, or re-deployassets into more promising opportunities.
Inflation Protected Fund
The Fund seeks maximum real return. The Fund seeks toachieve its investment objective by investing, undernormal circumstances, at least 80% of its net assets ininflation-indexed fixed income securities issued bydomestic and foreign governments (including those inemerging market countries), their agencies orinstrumentalities, and corporations and in derivativeinstruments that have economic characteristics similar tosuch securities.
The Fund invests primarily in investment grade securitiesrated Baa3 or higher by Moody’s Investors Service, Inc. orBBB– or higher by S&P Global Ratings. The Fund alsomay invest up to 50% of its total assets in securitiesdenominated in foreign currencies, and may investbeyond this limit in U.S. dollar denominated securities offoreign and emerging market issuers. The Fund mayinvest in debt securities that are not inflation indexed,
ADDITIONAL INFORMATION ABOUT THE FUNDS’ INVESTMENT OBJECTIVES, STRATEGIESAND RISKS
- 135 -

including mortgage- and asset-backed securities andcollateralized loan obligations. The subadviser mayconsider, among other things, credit, interest rate andprepayment risks, as well as general market conditions,when deciding whether to buy or sell fixed incomeinvestments, and the Fund may invest in fixed incomeinvestments of any maturity and duration. The Fundgenerally intends to utilize currency forwards and futurestomanage foreign currency risk. The Fundmay also investin derivative instruments, such as forwards, futurescontracts or swap agreements as a substitute for directlyinvesting in the above instruments or for risk managementpurposes.
Inflation-indexed fixed income securities are structured toprovide protection against the negative effects of inflation.The value of a fixed income security’s principal or theinterest income paid on the fixed income security isadjusted to track changes in an official inflation measure,usually the Consumer Price Index for Urban Consumers(“CPI-U”) with respect to domestic issuers. Inflation-indexed fixed income securities issued by a foreigngovernment or foreign corporation are adjusted to reflectan inflation index comparable to the CPI-U calculated bythat government.
Repayment of the original principal upon maturity (asadjusted for inflation) is guaranteed in the case of U.S.Treasury inflation protected bonds (“TIPS”), even during aperiod of deflation. However, the current market value ofthe fixed income security is not guaranteed, and willfluctuate. Inflation-indexed fixed income securities, otherthan TIPS, may not provide a similar guarantee and aresupported only by the credit of the issuing entity. If aguarantee of principal is not provided, the adjustedprincipal value of the fixed income security repaid atmaturity may be less than the original principal.
Inflation-indexed fixed income securities issued bycorporations may be similar to TIPS, but are subject to therisk of the corporation’s inability to meet principal andinterest payments on the obligation and may also besubject to price volatility due to such factors as interestrate sensitivity, market perception of the credit-worthinessof the issuer and general market liquidity. There are manydifferent types of corporate bonds, and each bond issuehas specific terms.
The Fund’s share price and total return may fluctuatewithin a wide range, similar to the fluctuations of theoverall fixed income securities market. The value ofinflation-indexed fixed income securities is expected tochange in response to changes in real interest rates. Realinterest rates in turn are tied to the relationship betweennominal interest rates and the rate of inflation. Therefore,
if inflation were to rise at a faster rate than nominal interestrates, real interest rates might decline, leading to anincrease in value of inflation-indexed fixed incomesecurities. In contrast, if nominal interest rates increasedat a faster rate than inflation, then real interest rates mightrise, leading to a decrease in value of inflation-indexedfixed income securities.
“Real return” equals total return less the estimated rate ofinflation, which is typically measured by the change in anofficial inflation measure. “Nominal interest rate” equalsthe sum of the real interest rate and the expected rate ofinflation.
The subadviser may engage in frequent and active tradingof portfolio securities to achieve the Fund’s investmentobjective.
In addition to the principal strategies discussed above, theFund may also invest to a limited extent in high yield debtsecurities (“junk bonds”), non-inflation linked securitiesissued by global governments and their agencies orinstrumentalities, hybrid instruments, bank loans,repurchase and reverse repurchase agreements, when-issued and delayed delivery securities, and short-terminvestments.
The Fund is also subject to the following non-principalinvestment risks: Cybersecurity Risk, Junk Bond Risk,Liquidity Risk, Bank Loan Risk, Repurchase Agreementsand Purchase and Sale Contracts Risk, When-Issued andDelayed Delivery Transactions Risk and Risk of Investingin Money Market Securities.
International Equities Index Fund
Unlike the Fund, the Index is an unmanaged group ofsecurities, so it does not incur operating expenses andother investment overhead. An investor cannot investdirectly in an index. Factors that contribute to differencesin performance between an index fund and its index arecalled tracking differences. An index fund seeks tominimize tracking error versus the benchmark.
The tracking difference is reviewed periodically by theSubadviser. If the Fund does not accurately track theIndex, the Subadviser will rebalance the Fund’s portfolioby selecting securities which will provide a morerepresentative sampling of the securities in the Index as awhole or the sector diversification within the Index, asappropriate.
The Fund may also invest in futures contracts and otherderivatives in order to help the Fund’s liquidity and tomanage its cash position. If the market value of thefutures contracts is close to the Fund’s cash balance, then
ADDITIONAL INFORMATION ABOUT THE FUNDS’ INVESTMENT OBJECTIVES, STRATEGIESAND RISKS
- 136 -

that helps to minimize the tracking error, while helping tomaintain liquidity. The Fund currently intends to usefutures and other derivatives in non-principal amounts.
The Fund is subject to the following additional risks:Derivatives Risk and Cybersecurity Risk.
International Government Bond Fund
Futures and options include covered put and call optionson foreign currencies, listed put and call options oncurrencies, and listed and unlisted foreign currencyfutures contracts.
The Fund uses a blend of the FTSE World GovernmentBond Index and the JP Morgan EMBI Global DiversifiedIndex as a guide for choosing countries in which to invest,though the Fund may invest in securities in other countriesnot represented in either benchmark.
International Growth Fund
The Fund’s subadviser utilizes fundamental research todrive the investment process. The subadviser studies onan ongoing basis company developments, includingbusiness strategy and financial results.
The Fund may also invest in privately placed andrestricted securities. In addition, the Fund may invest incurrency options to enhance returns or hedge against thedecline in the value of a currency. Derivative instrumentsused by the Fund will be counted toward the Fund’sexposure in the types of securities listed in the FundSummary to the extent that they have economiccharacteristics similar to such securities. The Fund will notconcentrate its assets in any single industry but may fromtime to time invest a higher percentage of its assets incompanies conducting business in various industrieswithin an economic sector.
The Fund is subject to the following additional risks: CyberSecurity Risk, Derivatives Risk, Counterparty Risk,Privately Placed Securities Risk, Sector Risk andCybersecurity Risk.
International Socially Responsible Fund
Since the Fund’s definition of social criteria is not“fundamental,” VC I’s Board of Directors may change itwithout shareholder approval. When deciding to makechanges to the criteria, the Board will consider, amongother things, new or revised state laws that govern oraffect the investments of public funds.
International Value Fund
The Fund may use futures or forward foreign currencycontracts to manage risk or to enhance return.
The Fund is also subject to the following additional risks:Credit Risk, Interest Rate Risk, Foreign Sovereign DebtRisk, U.S. Government Securities Risk and CybersecurityRisk.
Large Cap Core Fund
The Subadviser combines fundamental and quantitativeanalysis with risk management in identifying investmentopportunities and constructing the Fund’s portfolio. Inselecting investments, the Subadviser considers, amongother factors:
• Various measures of valuation, including price-to-cash flow, price-to-earnings, price-to-sales, price-to-book value and discounted cash flow. TheSubadviser believes that companies with lowervaluations are generally more likely to provideopportunities for capital appreciation;
• Potential indicators of stock price appreciation,such as anticipated earnings growth, companyrestructuring, changes in management, businessmodel changes, new product opportunities, oranticipated improvements in macroeconomicfactors;
• The financial condition and management of acompany, including its competitive position, thequality of its balance sheet and earnings, itsfuture prospects, and the potential for growth andstock price appreciation; and/or
• Overall economic and market conditions.
The Subadviser may sell a security when the security’sprice reaches a target set by the Subadviser; if theSubadviser believes that there is deterioration in theissuer’s financial circumstances or fundamentalprospects; if other investments are more attractive; or forother reasons.
The Fund will not concentrate its assets in any singleindustry but may from time to time invest a higherpercentage of its assets in companies conductingbusiness in various industries within an economic sector.
The Fund will be able to invest in derivatives, includingfutures, forwards, options, swap contracts and otherderivative instruments. The Fund may invest in derivatives
ADDITIONAL INFORMATION ABOUT THE FUNDS’ INVESTMENT OBJECTIVES, STRATEGIESAND RISKS
- 137 -
for both hedging and non-hedging purposes including, forexample, to produce incremental earnings, to hedgeexisting positions, to provide a substitute for a position inan underlying asset, to increase or reduce market or creditexposure, or to increase flexibility.
The Fund is also subject to the following additional risks:Derivatives Risk, Junk Bond Risk, Convertible SecuritiesRisk, Preferred Stock Risk, Unseasoned Issuer Risk andCybersecurity Risk.
The “contrarian” nature of the strategy places emphasison considering securities believed to be suffering fromprice weaknesses due to current market reaction orsentiment, or liquidity-driven or other factors, but that arebelieved to possess identifiable price improvementcatalysts. The strategy seeks to identify advantageousentry points to buy these securities to capture potentialupward valuation contrary to prevailing market sentiment.Contrarian ideas are typically identified through theportfolio manager’s bottom-up analysis. In selectinginvestments, Columbia employs fundamental analysiswith risk management in identifying investmentopportunities and constructing the Fund’s portfolio.
Large Capital Growth Fund
The Fund’s Subadviser uses an active bottom-upinvestment approach to buying and selling investments forthe Fund. Investments are selected primarily based onfundamental analysis of individual issuers and theirpotential in light of their financial condition, and market,economic, political, and regulatory conditions. The Fund’sSubadviser may also consider environmental, social, andgovernance (ESG) factors in its fundamental investmentanalysis. Factors considered may include analysis of anissuer’s earnings, cash flows, competitive position, andmanagement ability. Quantitative screening tools thatsystematically evaluate an issuer’s valuation, price andearnings momentum, earnings quality, and other factorsmay also be considered.
The Fund may also invest to a lesser extent in preferredstock and convertible securities.
The Fund will not concentrate its assets in any singleindustry but may from time to time invest a higherpercentage of its assets in companies conductingbusiness in various industries within an economic sector.
The Fund is subject to the following additional risks:Preferred Stock, Convertible Securities, Sector Risk andCybersecurity Risk.
Mid Cap Index Fund
Because the companies whose stocks are owned by theFund are mid-cap companies, they have more potential togrow than large-cap stocks, which means the value oftheir stock may increase. An index fund holding nearly allof the 400 stocks in the Index avoids the risk of individualstock selection and seeks to provide the return of themid-cap company sector of the market. On average thatreturn has been positive over many years but can benegative at certain times. There is no assurance that apositive return will occur in the future.
Unlike the Fund, the Index is an unmanaged group ofsecurities, so it does not incur operating expenses andother investment overhead. An investor cannot investdirectly in an index. Factors that contribute to differencesin performance between an index fund and its index arecalled tracking differences.
If the Fund does not accurately track the Index, theSubadviser will rebalance the Fund’s portfolio by selectingsecurities which will provide a more representativesampling of the securities in the Index as a whole or thesector diversification within the Index, as appropriate.
The Fund may invest up to 331⁄1 3⁄⁄ % of total assets in futuresand options, and up to 20% of net assets in equitysecurities that are not in the Index, high quality moneymarket securities, and illiquid securities. The Fundcurrently uses futures to manage its cash position butcurrently has no intention to invest more than a non-principal amount of total assets in such derivatives.
The Fund is also subject to the following additional risks:Derivatives Risk, Preferred Stock Risk, ConvertibleSecurities Risk, Risks of Investing in Money MarketSecurities, Liquidity Risk and Cybersecurity Risk.
Mid Cap Strategic Growth Fund
The Subadvisers’ investment process follows a flexibleinvestment program in seeking to achieve the Fund’sinvestment objective. The Subadvisers seek to invest inestablished and emerging high quality companies theybelieve have sustainable competitive advantages and theability to redeploy capital at high rates of return. TheSubadvisers typically favor companies with rising returnson invested capital, above average business visibility,strong free cash flow generation and an attractive risk/reward. A Subadviser generally considers selling aportfolio holding when it determines that the holding nolonger satisfies its investment criteria.
ADDITIONAL INFORMATION ABOUT THE FUNDS’ INVESTMENT OBJECTIVES, STRATEGIESAND RISKS
- 138 -

The Fund may purchase and sell options, futurescontracts and options on futures contracts for hedgingpurposes.
The Fund may invest up to 10% of its net assets in realestate investment trusts (“REITs”). The Fund may invest infixed income securities and initial public offerings (“IPOs”).
The Fund may invest in privately placed securities. Inaddition, the Fund may invest in convertible securities.
The Fund may utilize foreign currency forward exchangecontracts, which are derivatives, in connection with itsinvestments in foreign securities.
The Fund is also subject to the following additional risks:Convertible Securities Risk, Credit Risk, Currency Risk,Derivatives Risk, Hedging Risk, Interest Rate Risk, IPORisk, Liquidity Risk, REITs Risk and Cybersecurity Risk.
Nasdaq-100® Index Fund
Unlike the Fund, the Index is an unmanaged group ofsecurities, so it does not incur operating expenses andother investment overhead. An investor cannot investdirectly in an index. Factors that contribute to differencesin performance between an index fund and its index arecalled tracking differences.
If the Fund does not accurately track the Index, theSubadviser will rebalance the Fund’s portfolio by selectingsecurities which will provide a more representativesampling of the securities in the Index as a whole or thesector diversification within the Index, as appropriate.
Science & Technology Fund
Some of the industries likely to be included in the Fund’sportfolio are:
• Information technology, including software,services, hardware, semiconductors andtechnology equipment;
• Telecommunication equipment and services;
• Health care, including pharmaceuticals,biotechnology, life sciences, and health careequipment and services;
• Professional services;
• Media, including advertising, broadcasting, cableand satellite, movies and entertainment, andpublishing;
• Internet commerce and advertising;
• Alternative energy;
• Aerospace and defense; and
• Materials and chemicals.
The Fund’s holdings can range from small, unseasonedcompanies developing new technologies to large firmswith established track records of developing andmarketing technology.
Generally, the Fund’s Subadvisers seek to identifycompanies with earnings and sales growth. In addition,the Subadvisers have the discretion to purchase somesecurities that do not meet their normal investment criteriawhen they perceive an opportunity for substantialappreciation. These situations might arise when theFund’s Subadvisers believe a security could increase invalue for a variety of reasons, including a change inmanagement, an extraordinary corporate event, a newproduct introduction or innovation, or a favorablecompetitive development.
The Fundmay sell securities for a variety of reasons, suchas to secure gains, limit losses, or re-deploy assets intomore promising opportunities.
The Fund is also subject to the following additional risks:Special Situations Risk and Cybersecurity Risk.
Small Cap Aggressive Growth Fund
The Subadviser’s investment team employs both rigorousfundamental analysis and quantitative screening toidentify potential investment candidates that theinvestment team believes will produce sustainableearnings growth over a multi-year horizon. Investmentcandidates typically exhibit some or all of the following keycriteria: strong organic revenue growth, expandingmargins and profitability, innovative products or services,defensible competitive advantages, growing market shareand experienced management teams. Valuation is anintegral part of the investment process and purchasedecisions are based on the investment team’s expectationof the potential reward relative to risk of each securitybased on the investment team’s proprietary earningscalculations.
Small Cap Fund
In pursuing the Fund’s investment objective, theSubadvisers have the discretion to purchase securitiesthat do not meet their normal investment criteria whenthey perceive an opportunity for substantial appreciation.These situations might arise when a Subadviser believesa security could increase in value for a variety of reasons,including a change in management, an extraordinarycorporate event, or a new product introduction orinnovation, or a favorable competitive development. TheFund may sell securities for a variety of reasons, such as
ADDITIONAL INFORMATION ABOUT THE FUNDS’ INVESTMENT OBJECTIVES, STRATEGIESAND RISKS
- 139 -

to secure gains, limit losses, or re-deploy assets into morepromising opportunities.
Stock selection may reflect a growth or a value investmentapproach or a combination of both. For example, if acompany’s price/earnings ratio is attractive relative to theunderlying earnings growth rate, it would be classified asa growth stock. A value stock is one where the stock priceappears undervalued in relation to earnings, projectedcash flow, or asset value per share.
A portion of the Fund is passively managed using astatistically driven approach.
The Fund’s investments are expected to be widely-diversified by industry and company.
The Fund is also subject to the following additional risks:Currency Risk, Foreign Investment Risk andCybersecurity Risk.
Small Cap Index Fund
The Fund, which holds a large sampling of the 2,000stocks in the Russell 2000® Index, seeks to avoid the risksof individual stock selection and to provide the return ofthe smaller-sized company sector of the market. Onaverage that return has been positive over the years buthas also been negative at certain times. There is noassurance that a positive return will occur in the future.Because the companies whose stocks the Fund owns aresmall, their stock prices may fluctuate more over the short-term, but they have more potential to grow than large- ormid-cap stocks. This means their stock value may offergreater potential for appreciation.
Unlike the Fund, the Index is an unmanaged group ofsecurities, so it does not incur operating expenses andother investment overhead. An investor cannot investdirectly in an index. Factors that contribute to differencesin performance between an index fund and its index arecalled tracking differences.
If the Fund does not accurately track the Index, theSubadviser will rebalance the Fund’s portfolio by selectingsecurities which will provide a more representativesampling of the securities in the Index as a whole or thesector diversification within the Index, as appropriate.
The Fund may invest up to 20% in assets that are not partof the Index. These investments will generally consist ofcommon stock, illiquid securities, and high quality moneymarket securities. The Fund may also invest up to 331⁄1 3⁄⁄ %in futures and options to manage the Fund’s cash position.
The Fund is also subject to the following additional risks:Derivatives Risk, Liquidity Risk, Risks of Investing inMoney Market Securities and Cybersecurity Risk.
Small Cap Special Values Fund
Typical investments of the Fund include stocks ofcompanies that have low price-to-earnings ratios, aregenerally out of favor in the marketplace, are sellingsignificantly below their stated or replacement book valueor are undergoing reorganizations or other corporateaction that may create above-average price appreciation.
While the Fund normally invests at least 80% of its netassets in common stocks of U.S. companies, the Fundmay invest the remaining 20% of its net assets in othertypes of securities including those that fall outside therange of the Russell 2000® Index. The Fund intends toinvest in such instruments only to a limited extent. Suchinvestments and the limitations in such investments are asfollows: foreign securities, including securities ofemerging market issuers (20%), investment grade fixedincome securities (20%), depositary receipts (20%), otherinvestment companies including ETFs (10%), derivativessuch as futures, options and equity swaps (20%) andconvertible securities and preferred stocks (20%).
The Fund is subject to additional risks: ConvertibleSecurities Risk, Currency Risk, Foreign Investment Risk,Emerging Markets Risk, Credit Risk, Interest Rate Risk,Depositary Receipts Risk, Investment Company Risk,Derivatives Risk, Preferred Stock Risk and CybersecurityRisk.
Small-Mid Growth Fund
The Subadviser’s fundamental equity growth investmentprocess involves evaluating potential investments basedon specific characteristics believed to indicate a high-quality business with sustainable growth, including strongbusiness franchises, favorable long-term prospects, andexcellent management. The Subadviser will also considera company’s valuation when determining whether to buyand/or sell a company’s stock.
The Subadviser may decide to sell a position for variousreasons, including when a company’s fundamentaloutlook deteriorates, because of valuation and priceconsiderations, for risk management purposes, or when acompany is deemed to be misallocating capital or acompany no longer fits within the Fund’s definition of asmall- or mid-cap company. The Subadviser may also sella position to meet shareholder redemptions.
ADDITIONAL INFORMATION ABOUT THE FUNDS’ INVESTMENT OBJECTIVES, STRATEGIESAND RISKS
- 140 -
Although the Fund invests primarily in publicly traded U.S.securities, the Subadviser may invest up to 25% of theFund’s net assets in foreign securities, including emergingmarket countries, and in securities quoted in foreigncurrencies. The Subadviser may also invest up to 20% ofthe Fund’s net assets in fixed income securities, such asgovernment, corporate and bank debt obligations.
The Fund is subject to the following additional risks:Foreign Investment Risk, Emerging Markets Risk, InterestRate Risk, U.S. Government Obligations Risk, Credit Riskand Cybersecurity Risk.
Stock Index Fund
The Fund seeks to avoid the risk of individual stockselection and to provide the return of the large companysector of the market. In the past that return has beenpositive over many years but can be negative at certaintimes. There is no assurance that a positive return willoccur in the future. The Index includes the stocks of manylarge, well-established companies. These companiesusually have the financial strength to weather difficultfinancial times. However, the value of any stock can riseand fall over short and long periods of time.
Unlike the Fund, the Index is an unmanaged group ofsecurities, so it does not have to incur operating expensesand other investment overhead. An investor cannot investdirectly in an index. Factors that can contribute todifferences in performance between an index fund and itsindex are called tracking differences.
If the Fund does not accurately track the Index, theSubadviser will rebalance the Fund’s portfolio by selectingsecurities which will provide a more representativesampling of the securities in the Index as a whole or thesector diversification within the Index, as appropriate. TheFund may invest up to 20% in assets that are not in theIndex, including common stock and high quality moneymarket securities. The Fund may also invest up to 331⁄1 3⁄⁄ %in futures and options to manage its cash position.
The Fund is subject to the following additional risks: Risksof Investing in Money Market Securities and DerivativesRisk and Cybersecurity Risk.
Systematic Core Fund
The Fund seeks to provide long-term growth of capitalthrough investment in common stocks. The Fund seeks toachieve a higher risk-adjusted performance than the Indexover the long term through a proprietary selection process
employed by the Fund’s Subadviser. The Fund primarilyinvests in common stock of U.S. large capitalizationcompanies included in the Index. In managing the Fund,GSAM uses a rules-based methodology that involves twosteps.
Step One
In the first step, individual factor portfolios are constructedat the same level of targeted tracking error to the Index.GSAM assigns all securities in the Index a “factor score”that is derived from the measurements described below tocreate four factor portfolios.
• Value: The value measurement is a composite ofthree valuation measures, which consist of bookvalue-to-price, sales-to-price and free cash flow-to-price (earnings-to-price ratios are used forfinancial stocks or where free cash flow data arenot available).
• Momentum: The momentum measurement isbased on beta- and volatility-adjusted dailyreturns over an 11-month period ending onemonth prior to the rebalance date.
• Quality: The quality measurement is gross profitdivided by total assets or return on equity forfinancial stocks or when gross profit is notavailable.
• Low Volatility: The volatility measurement isdefined as the inverse of the standard deviation ofpast 12-month daily total stock returns.
The securities are ranked and scored on each factormeasurement independently. Based on these scores,securities with a favorable factor score will be generallyoverweight in the factor portfolio relative to the Index andsecurities with an unfavorable factor score will begenerally underweight in the factor portfolio relative to theIndex. Securities in each factor portfolio are also subjectto minimum and maximum weights, depending on thesecurities’ relative weight in the Index. The Fund’sportfolio only includes long positions (i.e., short positionsare impermissible).
Step Two
In the second step, GSAM combines the factor portfoliosin equal weights to create the Fund’s portfolio. As part ofthis combination, offsetting security positions arecalculated and netted across the factor portfolios. As partof this netting process, trades are generally reducedacross factor portfolios by offsetting trades in one factor
ADDITIONAL INFORMATION ABOUT THE FUNDS’ INVESTMENT OBJECTIVES, STRATEGIESAND RISKS
- 141 -
portfolio against weights in another factor portfolio,subject to all security weights remaining within the upperand lower bounds around the target weight.
GSAM will rebalance the Fund’s portfolio according to theprocess set forth above on a quarterly basis, and itgenerally employs a strategy to continue to hold securitiesbetween quarterly rebalancings, even if there are adversedevelopments concerning a particular security, anindustry, the economy or the stock market generally.GSAM may reduce the position size of a security or sellthe security during quarterly rebalancings if the securityno longer has favorable scores in one or more of the fourfactors. GSAM may, in its discretion, make changes to itsquantitative techniques or investment approach, includingwith respect to intra-quarter actions, from time to time.
Systematic Value Fund
The Fund may also invest in equity securities of U.S. smallcap companies. In addition, it may invest in futurescontracts and exchange-traded funds to manage theFund’s cash position and real estate investment trusts.
The Fund is also subject to the following additional risks:Cybersecurity Risk, Derivatives Risk, InvestmentCompany Risk, REITs Risk and Small-Cap CompanyRisk.
Value Fund
The Fund mainly invests in stocks of financially sound butout-of-favor companies that provide above-averagepotential total returns and sell at below-average price/earnings multiples. Investment decisions are basedprimarily on detailed in-house fundamental research andsecurity valuations. Investment opportunities are typicallyfound primarily in four areas: misunderstood negativeevents, consolidating industry structures, low butimproving return on capital, and new or capital-incentedmanagement.
The Subadviser uses a bottom-up process to selectsecurities. Stock selection is price-driven in that securitiesare purchased and sold primarily on the basis of theirrelative return/appreciation potential. New positions areadded to the Fund when they exhibit superior appreciationpotential relative to others stocks. Existing holdings aresold as they approach their target price, reflecting adiminishing opportunity for incremental relative return.
A portion of the Fund’s investments may also be investedin preferred stocks, convertible securities and ETFs.
The Fund is also subject to the following additional risks:Preferred Stock Risk, Convertible Securities Risk,Investment Company Risk and Cybersecurity Risk.
ADDITIONAL INFORMATION ABOUT THE FUNDS’ INVESTMENT OBJECTIVES, STRATEGIESAND RISKS
- 142 -

Investment Terms
More detail on the Funds’ investments and investmenttechniques is shown below. The Funds may utilize theseinvestments and techniques as noted in the FundSummaries and/or in the section entitled “AdditionalInformation About the Funds’ Investment Objectives,Strategies and Risks,” though an investment or techniquediscussed in the latter may not be a principal strategy. AllGovernment Money Market I Fund investments mustcomply with Rule 2a-7 of the 1940 Act, which allows thepurchase of only high quality money market instruments.
American Depositary Receipts (“ADRs”)
ADRs are certificates issued by a U.S. bank or trustcompany and represent the right to receive securities of aforeign issuer deposited in a domestic bank or foreignbranch of a U.S. bank. ADRs in which the Fund may investmay be sponsored or unsponsored. There may be lessinformation available about foreign issuers ofunsponsored ADRs.
Asset-Backed Securities
Asset -Backed Securities Risk. Asset-backed securitiesare bonds or notes that are normally supported by aspecific property. If the issuer fails to pay the interest orreturn the principal when the bond matures, then theissuer must give the property to the bondholders ornoteholders. Examples of assets supporting asset-backed securities include credit card receivables, retailinstallment loans, home equity loans, auto loans, andmanufactured housing loans.
Collateralized Loan Obligations
Collateralized loan obligations include trusts typicallycollateralized by a pool of loans, which may include,among others, domestic and foreign senior secured loans,senior unsecured loans, and subordinate corporate loans,including loans that may be rated below investment gradeor equivalent unrated loans. Collateralized loanobligations may charge management and otheradministrative fees.
Derivatives
Unlike stocks and bonds that represent actual ownershipof a stock or bond, derivatives are instruments that“derive” their value from securities issued by a company,government, or government agency, such as futures andoptions. In certain cases, derivatives may be purchasedfor non-speculative investment purposes or to protect(“hedge”) against a change in the price of the underlyingsecurity. There are some investors who take higher risk
(“speculate”) and buy derivatives to profit from a changein price of the underlying security. The Funds maypurchase derivatives to hedge their investment portfoliosand to earn additional income in order to help achieve theirobjectives. Generally, the Funds do not buy derivatives tospeculate. Futures contracts and options may not alwaysbe successful hedges; their prices can be highly volatile;using them could lower Fund total return; and the potentialloss from the use of futures can exceed a Fund’s initialinvestment in such contracts.
Diversification
Each Fund’s diversification policy limits the amount thatthe Fund may invest in certain securities. Each Fund’sdiversification policy is also designed to comply with thediversification requirements of the Internal Revenue Code(the “Code”) as well as the 1940 Act. Except as noted inthe Fund Summaries, all of the Funds are diversifiedunder the 1940 Act. All of the Funds are expected tosatisfy the Code’s diversification requirements.
The Government Money Market I Fund may not purchasethe securities of any issuer, if, as a result, the Fund wouldnot comply with any applicable diversificationrequirements for a money market fund under the 1940 Actand the rules thereunder, as such may be amended fromtime to time.
Equity Securities
Equity securities represent an ownership position in acompany. The prices of equity securities fluctuate basedon changes in the financial condition of the issuingcompany and on market and economic conditions. If youown an equity security, you own a part of the company thatissued it. Companies sell equity securities to get themoney they need to grow.
Stocks are one type of equity security. Generally, there arethree types of stocks:
• Common stock — Each share of common stockrepresents a part of the ownership of thecompany. The holder of common stockparticipates in the growth of the company throughincreasing stock price and receipt of dividends. Ifthe company runs into difficulty, the stock pricecan decline and dividends may not be paid.
• Preferred stock— Each share of preferred stockusually allows the holder to get a set dividendbefore the common stock shareholders receiveany dividends on their shares.
INVESTMENT GLOSSARY
- 143 -

• Convertible preferred stock— A stock with a setdividend which the holder may exchange for acertain amount of common stock.
Stocks are not the only type of equity security. Otherequity securities include but are not limited to convertiblesecurities, depositary receipts, warrants, rights andpartially paid shares, investment company securities, realestate securities, convertible bonds and ADRs, EuropeanDepositary Receipts (“EDRs”) and Global DepositaryReceipts (“GDRs”). More information about these equitysecurities is included elsewhere in this Prospectus orcontained in the SAI.
Market cap ranges. Companies are determined to belarge-cap companies, mid-cap companies, or small-capcompanies based upon the total market value of theoutstanding common stock (or similar securities) of thecompany at the time of purchase. The marketcapitalization of the companies in which the Funds invest,and the indexes described below, change over time. AFund will not automatically sell or cease to purchase stockof a company that it already owns just because thecompany’s market capitalization grows or falls outside thisrange.With respect to all Funds, except as noted in a FundSummary or in the section entitled “Additional InformationAbout the Funds’ Investment Objectives, Strategies andRisks”:
Large-Cap companies will generally includecompanies whose market capitalizations areequal to or greater than the market capitalizationof the smallest company in the Russell 1000®Index during the most recent 12-month period. Asof May 8, 2020, the market capitalization range ofthe companies in the Russell 1000® Index wasapproximately $1.8 billion to $1.400.5 billion.
Mid-Cap companies will generally includecompanies whose market capitalizations rangefrom the market capitalization of the smallestcompany included in the S&P MidCap 400 andRussell Midcap® Indices to the marketcapitalization of the largest company in the S&PMidCap 400 and Russell Midcap® Indices duringthe most recent 12-month period. As ofAugust 31, 2020, the market capitalization rangeof the companies in the S&P MidCap 400 Indexwas approximately $749.78 million to$15.04 billion. As of May 8, 2020, the marketcapitalization range of the companies in theRussell Midcap® Index was approximately$1.8 billion to $31.7 billion.
Small-Cap companies will generally includecompanies whose market capitalizations areequal to or less than the market capitalization of
the largest company in the Russell 2000® Indexduring the most recent 12-month period. As ofMay 8, 2020, the market capitalization range ofthe companies in the Russell 2000® Index wasapproximately $94.8 million to $4.4 billion.
Exchange-Traded Funds (“ETFs”)
ETFs are a type of investment company bought and soldon a securities exchange. An ETF trades like commonstock. While most ETFs are passively-managed and seekto replicate the performance of a particular market indexor segment, some ETFs are actively-managed and do nottrack a particular market index or segment, therebysubjecting investors to active management risk. APortfolio could purchase an ETF to gain exposure to aportion of the U.S. or a foreign market while awaitingpurchase of underlying securities. The risks of owning anETF generally reflect the risks of owning the securitiesunderlying the ETF, although an ETF has managementfees which increase its cost. A Fund’s ability to invest inETFs is limited by the Investment Company Act of 1940,as amended (the “1940 Act”).
Firm Commitment
A firm commitment is a buy order for delayed delivery inwhich a Fund agrees to purchase a security from a sellerat a future date, stated price, and fixed yield. Theagreement binds the seller as to delivery and binds thepurchaser as to acceptance of delivery.
Fixed-Income Securities
Fixed-income securities include a broad array of short-,medium- and long-term obligations, including notes andbonds. Fixed-income securities may have fixed, variable,or floating rates of interest, including rates of interest thatvary inversely at a multiple of a designated or floating rate,or that vary according to changes in relative values ofcurrencies. Fixed-income securities generally involve anobligation of the issuer to pay interest on either a currentbasis or at the maturity of the security and to repay theprincipal amount of the security at maturity.
Bonds are one type of fixed-income security and are soldby governments on the local, state, and federal levels, andby companies. There are many different kinds of bonds.For example, each bond issue has specific terms. U.S.Government bonds are guaranteed by the federalgovernment to pay interest and principal. Revenue bondsare usually only paid from the revenue of the issuer. Anexample of that would be an airport revenue bond.Debentures are a very common type of corporate bond (abond sold by a company). Payment of interest and returnof principal is subject to the company’s ability to pay.
INVESTMENT GLOSSARY
- 144 -

Convertible bonds are corporate bonds that can beexchanged for stock.
Investing in a bond is like making a loan for a fixed periodof time at a fixed interest rate. During the fixed period, thebond pays interest on a regular basis. At the end of thefixed period, the bond matures and the investor usuallygets back the principal amount of the bond. Fixed periodsto maturity are categorized as short term (generally lessthan 12 months), intermediate (one to 10 years), and longterm (10 years or more).
Investment grade bonds are bonds that are rated at leastBBB by S&P Global Ratings (“S&P®”), Baa by Moody’sInvestors Service, Inc. (“Moody’s”) or the equivalentthereof by another rating organization or, if unrated, aredetermined by the subadviser to be of comparable qualityat the time of purchase. The SAI has more detail aboutratings.
Bonds that are rated Baa by Moody’s or BBB by S&P®
have speculative characteristics. Bonds that are unratedor rated below Baa3 by Moody’s or BBB– by S&P®
(commonly referred to as high yield, high risk or junkbonds) are regarded, on balance, as predominantlyspeculative. Changes in economic conditions or othercircumstances are more likely to weaken the issuer’scapacity to pay interest and principal in accordance withthe terms of the obligation than is the case with higherrated bonds. While such bonds may have some qualityand protective characteristics, these are outweighed byuncertainties or risk exposures to adverse conditions.Lower rated bonds may be more susceptible to real orperceived adverse economic and individual corporatedevelopments than would investment grade bonds. Forexample, a projected economic downturn or the possibilityof an increase in interest rates could cause a decline inhigh-yield, high-risk bond prices because such an eventmight lessen the ability of highly leveraged high yieldissuers to meet their principal and interest paymentobligations, meet projected business goals, or obtainadditional financing. In addition, the secondary tradingmarket for lower-medium and lower-quality bonds may beless liquid than the market for investment grade bonds.This potential lack of liquidity may make it more difficult toaccurately value certain of these lower-grade portfoliosecurities.
Bonds are not the only type of fixed-income security. Otherfixed-income securities include, but are not limited to, U.S.and foreign corporate fixed-income securities, includingconvertible securities (bonds, debentures, notes and othersimilar instruments) and corporate commercial paper,mortgage-backed and other asset-backed securities;inflation-indexed bonds issued by both governments and
corporations; structured notes, including hybrid or“indexed” securities, preferred or preference stock,catastrophe bonds, and loan participations; bankcertificates of deposit, fixed time deposits and bankers’acceptances; repurchase agreements and reverserepurchase agreements; fixed-income securities issuedby states or local governments and their agencies,authorities and other instrumentalities; obligations offoreign governments or their subdivisions, agencies andinstrumentalities; and obligations of internationalagencies or supranational entities. Commercial paper is aspecific type of corporate or short-term note payable inless than 270 days. Most commercial paper matures in50 days or less. Fixed-income securities may be acquiredwith warrants attached. For more information aboutspecific income securities see the SAI.
Investments in fixed-income securities include U.S.Government securities. U.S. Government securities areissued or guaranteed by the U.S. Government, itsagencies and instrumentalities. Some U.S. Governmentsecurities are issued or unconditionally guaranteed by theU.S. Treasury. They are of the highest possible creditquality. While these securities are subject to variations inmarket value due to fluctuations in interest rates, they willbe paid in full if held to maturity. Other U.S. Governmentsecurities are neither direct obligations of, nor guaranteedby the U.S. Treasury; however, they involve federalsponsorship. For example, some are backed by specifictypes of collateral; some are supported by the issuer’sright to borrow from the Treasury; some are supported bythe discretionary authority of the Treasury to purchasecertain obligations of the issuer; and others are supportedonly by the credit of the issuing government agency orinstrumentality. For more information about mortgage-backed fixed-income securities see “Mortgage-BackedSecurities” below.
Recent market conditions have resulted in fixed-incomeinstruments experiencing unusual liquidity issues,increased price volatility and, in some cases, creditdowngrades and increased likelihood of default. Theseevents have reduced the willingness of some lenders toextend credit, and have made it more difficult forborrowers to obtain financing on attractive terms, if at all.As a result, the value of many types of debt securities hasbeen reduced, including, but not limited to, asset-backedsecurities. Because the situation in the markets iswidespread and largely unprecedented, it may beunusually difficult to identify both risks and opportunities,or to predict the duration of these market events.Mortgage-backed securities have been especiallyaffected by these events. Some financial institutions mayhave large (but still undisclosed) exposures to such
INVESTMENT GLOSSARY
- 145 -

securities, which could have a negative effect on thebroader economy. Securities in which a Fund invests maybecome less liquid in response to market developments oradverse investor perceptions. In some cases, traditionalmarket participants have been less willing to make amarket in some types of debt instruments, which hasaffected the liquidity of those instruments. Illiquidinvestments may be harder to value, especially inchanging markets, and if a Fund is forced to sell suchinvestments to meet redemptions or for other cash needs,such Fund may suffer a loss.
Foreign Currency
Funds buy foreign currencies when they believe the valueof the currency will increase. If it does increase, they sellthe currency for a profit. If it decreases they willexperience a loss. A Fundmay also buy foreign currenciesto pay for foreign securities bought for the Fund or forhedging purposes.
Foreign Securities
Securities of foreign issuers include obligations of foreignbranches of U.S. banks and of foreign banks, commonand preferred stocks, fixed-income securities issued byforeign governments, corporations and supranationalorganizations, and GDRs and EDRs. There is generallyless publicly available information about foreigncompanies, and they are generally not subject to uniformaccounting, auditing and financial reporting standards,practices and requirements comparable to thoseapplicable to U.S. companies.
Hybrid Instruments
Hybrid instruments, such as indexed or structuredsecurities, can combine the characteristics of securities,futures, and options. For example, the principal amount,redemption, or conversion terms of a security could berelated to the market price of some commodity, currency,or securities index. Such securities may bear interest orpay dividends at below market (or even relatively nominal)rates. Under certain conditions, the redemption value ofsuch an investment could be zero. In addition, anothertype of hybrid instrument is a participatory note, which isissued by banks or broker-dealers and is designed to offera return linked to a particular underlying equity, debt,currency or market.
Illiquid Investments
An illiquid investment is any investment that the Fundreasonably expects cannot be sold or disposed of incurrent market conditions in seven calendar days or lesswithout the sale or disposition significantly changing themarket value of the investment.
Lending Portfolio Securities
Each Fund may make secured loans of its portfoliosecurities for purposes of realizing additional income. Nolending may be made with any companies affiliated withVALIC. The Funds will only make loans to broker-dealersand other financial institutions deemed by State StreetBank and Trust Company (the “securities lending agent”)to be creditworthy. The securities lending agent also holdsthe cash and the portfolio securities of VC II. Each loan ofportfolio securities will be continuously secured bycollateral in an amount at least equal to the market valueof the securities loaned. Such collateral will be cash andsecurities issued or guaranteed by the U.S. Government orits agencies or instrumentalities. As with other extensionsof credit, securities lending involves the risk that theborrower may fail to return the securities in a timelymanner or at all. A Fund may lose money if the Fund doesnot recover the securities and/or the value of the collateralor the value of investments made with cash collateral falls.Such events may also trigger adverse tax consequencesfor a Fund. To the extent that either the value of the cashcollateral or a Fund’s investments of the cash collateraldeclines below the amount owed to a borrower, such Fundalso may incur losses that exceed the amount it earned onlending the security. Securities lending also involves therisks of delay in receiving additional collateral or possibleloss of rights in the collateral should the borrower failfinancially. Engaging in securities lending could also havea leveraging effect, which may intensify the market risk,credit risk and other risks associated with investments ina Fund.
Loan Assignments
Loan assignments are purchased from a lender andtypically result in the purchaser succeeding to all rightsand obligations under the loan agreement between theassigning lender and the borrower. However, loanassignments may be arranged through privatenegotiations, and the rights and obligations acquired bythe purchaser of a loan assignment may differ from, andbe more limited than, those held by the assigning lender.
Loan Participations
Loan participations are interests in loans acquired from alender or from other owners of loan participations (a“Participant”). In either case, the purchaser does notestablish any direct contractual relationship with theborrower. The purchaser of a loan participation is requiredto rely on the lender or the Participant that sold the loanparticipation not only for the enforcement of its rightsunder the loan agreement against the borrower but alsofor the receipt and processing of payments due under the
INVESTMENT GLOSSARY
- 146 -

loan. Therefore, the owner of a loan participation issubject to the credit risk of both the borrower and a lenderor Participant.
Money Market Securities
All of the Funds may invest part of their assets in highquality money market securities payable in U.S. dollars. Amoney market security is a high quality, short-term debtobligation that is eligible for inclusion in money marketfund portfolios, in accordance with Rule 2a-7 under the1940 Act.
These high quality money market securities include:
• Securities issued or guaranteed by the U.S.Government, its agencies or instrumentalities.
• Certificates of deposit and other obligations ofdomestic banks having total assets in excess of$1 billion.
• Commercial paper sold by corporations andfinance companies.
• Corporate debt obligations with remainingmaturities of 13 months or less.
• Repurchase agreements, money marketsecurities of foreign issuers if payable in U.S.dollars, asset-backed securities, loanparticipations, adjustable rate securities, andvariable rate demand notes.
Mortgage-Backed Securities
Mortgage-backed securities include, but are not limited to,mortgage pass-through securities, collateralizedmortgage obligations and commercial mortgage-backedsecurities.
Mortgage pass-through securities represent interests in“pools” of mortgage loans secured by residential orcommercial real property. Payments of interest andprincipal on these securities are generally made monthly,in effect “passing through” monthly payments made by theindividual borrowers on the mortgage loans whichunderlie the securities (net of fees paid to the issuer orguarantor of the securities). Mortgage-backed securitiesare subject to interest rate risk and prepayment risk.
Payment of principal and interest on some mortgagepass-through securities may be guaranteed by the fullfaith and credit of the U.S. Government (i.e., securitiesguaranteed by Government National MortgageAssociation (“GNMA”)) or guaranteed by agencies orinstrumentalities of the U.S. Government (i.e., securitiesguaranteed by Federal National Mortgage Association(“FNMA”) or the Federal Home Loan Mortgage
Corporation (“FHLMC”), which are supported only by thediscretionary authority of the U.S. Government topurchase the agency’s obligations). Mortgage-backedsecurities created by non-governmental issuers (such ascommercial banks, private mortgage insurancecompanies and other secondary market issuers) may besupported by various forms of insurance or guarantees,including individual loan, title, pool and hazard insuranceand letters of credit, which may be issued bygovernmental entities, private insurers or the mortgagepoolers.
Collateralized mortgage obligations (“CMOs”) are hybridmortgage-backed instruments. CMOs may becollateralized by whole mortgage loans or by portfolios ofmortgage pass-through securities guaranteed by GNMA,FHLMC, or FNMA. CMOs are structured into multipleclasses, with each class bearing a different statedmaturity. CMOs that are issued or guaranteed by the U.S.Government or by any of its agencies or instrumentalitieswill be considered U.S. Government securities by theFunds, while other CMOs, even if collateralized by U.S.Government securities, will have the same status as otherprivately issued securities for purposes of applying aFund’s diversification tests.
Commercial mortgage-backed securities includesecurities that reflect an interest in, and are secured by,mortgage loans on commercial real property. Many of therisks of investing in commercial mortgage-backedsecurities reflect the risks of investing in the real estatesecuring the underlying mortgage loans. These risksreflect the effects of local and other economic conditionson real estate markets, the ability of tenants to make loanpayments, and the ability of a property to attract and retaintenants. Commercial mortgage-backed securities may beless liquid and exhibit greater price volatility than othertypes of mortgage-backed or asset-backed securities.Mortgage-backed securities include mortgage pass-through securities described above and securities thatdirectly or indirectly represent a participation in, or aresecured by and payable from, mortgage loans on realproperty, such as mortgage dollar rolls, CMO residuals orstripped mortgage-backed securities. These securitiesmay be structured in classes with rights to receive varyingproportions of principal and interest.
Repurchase Agreements
A repurchase agreement requires the seller of the securityto buy it back at a set price at a certain time. If a Fundenters into a repurchase agreement, it is really making ashort-term loan (usually for one day to one week). TheFunds may enter into repurchase agreements only with
INVESTMENT GLOSSARY
- 147 -

well-established securities dealers or banks that aremembers of the Federal Reserve System. All the Fundsin this Prospectus may invest in repurchase agreements.
The risk in a repurchase agreement is the failure of theseller to be able to buy the security back. If the value ofthe security declines, a Fund may have to sell at a loss.
Reverse Repurchase Agreements, Dollar Rolls andBorrowings
A reverse repurchase agreement involves the sale of asecurity by a Fund and its agreement to repurchase theinstrument at a specified time and price. Under a reverserepurchase agreement, the Fund continues to receive anyprincipal and interest payments on the underlying securityduring the term of the agreement.
In a dollar roll transaction, a Fund sells mortgage-backedor other securities for delivery in the current month andsimultaneously contracts to purchase substantially similarsecurities on a specified future date. The time period fromthe date of sale to the date of purchase under a dollar rollis known as the roll period. A Fund foregoes principal andinterest paid during the roll period on the securities sold ina dollar roll. However, a Fund receives an amount equal tothe difference between the current sales price and thelower price for the future purchase as well as any interestearned on the proceeds of the securities sold.
If a Fund’s positions in reverse repurchase agreements,dollar rolls or similar transactions are not covered by liquidassets, such transactions would be subject to the Fund’slimitations on borrowings. Apart from such transactions, aFund will not borrow money, except as provided in itsinvestment restrictions. See “Investment Restrictions” inthe SAI for a complete listing of each Fund’s investmentrestrictions.
Special Situations
A special situation arises when, in the opinion of theadviser or subadviser, the securities of a particular issuerwill be recognized and appreciate in value due to aspecific development with respect to the issuer.Developments creating a special situation might include,among others, a new product or process, a technologicalbreakthrough, a management change or otherextraordinary corporate events, or differences in marketsupply of and demand for the security. Investment inspecial situations may carry an additional risk of loss inthe event that the anticipated development does not occuror does not attract the expected attention.
Short salesShort sales by a Fund involve certain risks and specialconsiderations. Possible losses from short sales differ
from losses that could be incurred from a purchase of asecurity, because losses from short sales are potentiallyunlimited, whereas losses from purchases can be nogreater than the total amount invested.
Swap Agreements
Swap agreements are two party contracts entered intoprimarily by institutional investors for periods ranging froma few weeks to more than one year. In a standard “swap”transaction, two parties agree to exchange the returns (ordifferentials in rates of return) earned or realized onparticular predetermined investments or instruments,which may be adjusted for an interest factor. The grossreturns to be exchanged or “swapped” between theparties are generally calculated with respect to a “notionalamount” (i.e., the return on or increase in value of aparticular dollar amount invested at a particular interestrate or in a particular foreign currency), or in a “basket” ofsecurities representing a particular index. Forms of swapagreements include credit default swaps, equity swaps,interest rate swaps, floors, and collars, and fixed-incometotal return swaps.
Credit default swaps give one party to a transaction theright to dispose of or acquire an asset (or group ofassets), or the right to receive or make a payment from theother party, upon the occurrence of specified creditevents. An equity swap is a special type of total returnswap, where the underlying asset is a stock, a basket ofstocks, or a stock index. Compared to actually owning thestock, in this case you do not have to pay anything up front,but you do not have any voting or other rights thatstockholders do have. Interest rate swaps are the mostcommon type of swap. The parties typically exchangefixed-rate payments against floating rate payments. Afixed-income total return swap is a swap, where one partypays the total return of an asset, and the other partymakes periodic interest payments. The total return is thecapital gain or loss, plus any interest or dividendpayments. The parties have exposure to the return of theunderlying asset without having to hold the underlyingassets.
Total Return
Total Return is a measure of performance whichcombines all elements of return including income andcapital gain or loss; it represents the change in a value ofan investment over a given period expressed as apercentage of the initial investment.
When-Issued Securities, Delayed Delivery andForward Commitment Transactions
The Funds may purchase or sell when-issued securitiesthat have been authorized but not yet issued in the market.
INVESTMENT GLOSSARY
- 148 -

In addition, the Fund may purchase or sell securities on aforward commitment basis. A forward commitmentinvolves entering into a contract to purchase or sellsecurities, typically on an extended settlement basis, for afixed price at a future date. The Funds may engage inwhen-issued or forward commitment transactions in orderto secure what is considered to be an advantageous priceand yield at the time of entering into the obligation. The
purchase of securities on a when-issued or forwardcommitment basis involves a risk of loss if the value of thesecurity to be purchased declines before the settlementdate. Conversely, the sale of securities on a when-issuedor forward commitment basis involves the risk that thevalue of the securities sold may increase before thesettlement date.
Investment Risks
Active Trading Risk. A strategy used whereby a Fundmay engage in frequent trading of portfolio securities in aneffort to achieve its investment objective. Active tradingmay result in high portfolio turnover and correspondinglygreater brokerage commissions and other transactioncosts, which will be borne directly by the Fund. Duringperiods of increased market volatility, active trading maybe more pronounced. In the “Financial Highlights” section,each Fund’s portfolio turnover rate is provided for each ofthe last five years.
Affiliated Fund Risk. In managing the portion of a Fundthat invests in Underlying Funds, SunAmerica will havethe authority to select and substitute the UnderlyingFunds. SunAmerica may be subject to potential conflictsof interest in allocating a Fund’s assets among the variousUnderlying Funds because the fees payable to it by theAdviser for some of the Underlying Funds are higher thanthe fees payable by other Underlying Funds and becauseSunAmerica also is responsible for managing andadministering certain of the Underlying Funds.
Asset Allocation Risk. The Fund’s ability to achieve itsinvestment objective depends in part on the Subadviser’sskill in determining the Fund’s investment strategyallocations. Although allocation among differentinvestment strategies generally reduces risk and exposureto any one strategy, the risk remains that the Subadvisermay favor an investment strategy that performs poorlyrelative to other investment strategies.
Bank Loan Risk. Bank loans are subject to the credit riskof nonpayment of principal or interest. Economicdownturns or increases in interest rates may cause anincrease in defaults, interest rate risk and liquidity risk.Bank loans may or may not be collateralized at the time ofacquisition, and any collateral may lack liquidity or lose allor substantially all of its value subsequent to investment.In the event of bankruptcy of a borrower, a Fund couldexperience delays or limitations with respect to its abilityto realize the benefits of any collateral securing a loan.
A Fund may invest in certain commercial bank loans,including loans generally known as “syndicated bank
loans,” by acquiring participations or assignments in suchloans. The lack of a liquid secondary market for suchsecurities may have an adverse impact on the value of thesecurities and a Fund’s ability to dispose of particularassignments or participations when necessary to meetredemptions of shares or to meet the Fund’s liquidityneeds. When purchasing a participation, a Fund may besubject to the credit risks of both the borrower and thelender that is selling the participation. When purchasing aloan assignment, a Fund acquires direct rights against theborrowers, but only to the extent of those held by theassigning lender. Investment in loans through a directassignment from the financial institutions interests withrespect to a loanmay involve additional risks. Junior loans,which have a lower place in the borrower’s capitalstructure than senior loans andmay be unsecured, involvea higher degree of overall risk than senior loans of thesame borrower. Second lien loans are secured by theassets of the issuer. In a typical structure, the claim oncollateral and right of payment of second lien loans arejunior to those of first-lien loans. Subordinated bridgeloans are loans that are intended to provide short-termfinancing to provide a “bridge” to an asset sale, bondoffering, stock offering, or divestiture. Generally, bridgeloans are provided by arrangers as part of an overallfinancing package. Typically, the issuer will agree toincreasing interest rates if the loan is not repaid asexpected. A subordinated bridge loan is junior to a seniorbridge loan in right of payment.
Transactions in bank loans may settle on a delayed basis,resulting in the proceeds from the sale of a loan not beingavailable to make additional investments or to meet aFund’s redemption obligations. To the extent the extendedsettlement process gives rise to short-term liquidity needs,a Fund may hold additional cash, sell investments ortemporarily borrow from banks or other lenders.
Call or Prepayment Risk. During periods of fallinginterest rates, a bond issuer may “call”—or repay—itshigh-yielding bonds before their maturity date. Typically,such repayments will occur during periods of fallinginterest rates requiring a Fund to invest in new securities
INVESTMENT GLOSSARY
- 149 -

with lower interest rates. This will reduce the stream ofcash payments that flow through a Fund and result in adecline in a Fund’s income. Securities subject toprepayment risk generally offer less potential for gainswhen prevailing interest rates decline, and have greaterpotential for loss when interest rates rise. The impact ofprepayments on the price of a security may be difficult topredict and may increase the volatility of the price.
Collateralized Loan Obligation Risk. A collateralizedloan obligation is a trust typically collateralized by a poolof loans, which may include, among others, domestic andforeign senior secured loans, senior unsecured loans, andsubordinate corporate loans, including loans that may berated below investment grade or equivalent unrated loans.The cash flows from the trust are split into two or moreportions, called tranches, varying in risk and yield. Theriskiest portion is the “equity” tranche which bears the bulkof defaults from the bonds or loans in the trust and servesto protect the other, more senior tranches from default inall but the most severe circumstances. Because it ispartially protected from defaults, a senior tranche from acollateralized loan obligation trust typically has higherratings and lower yields than its underlying securities, andcan be rated investment grade. Despite the protectionfrom the equity tranche, collateralized loan obligationtranches can experience substantial losses due to actualdefaults, increased sensitivity to defaults due to collateraldefault and disappearance of protecting tranches, marketanticipation of defaults, as well as aversion tocollateralized loan obligation securities as a class. Therisks of an investment in a collateralized loan obligationdepend largely on the type of the collateral securities andthe class of the collateralized loan obligation in which aFund invests. Normally, collateralized loan obligations areprivately offered and sold, and thus, are not registeredunder the securities laws. As a result, investments incollateralized loan obligations may lack liquidity. However,an active dealer market may exist for collateralized loanobligations, allowing a collateralized loan obligation toqualify under the Rule 144A “safe harbor” from theregistration requirements of the Securities Act of 1933 forresales of certain securities to qualified institutionalbuyers.
Convertible Securities Risk. The values of theconvertible securities in which a Fund may invest also willbe affected bymarket interest rates, the risk that the issuermay default on interest or principal payments and thevalue of the underlying common stock into which thesesecurities may be converted. Specifically, since thesetypes of convertible securities pay fixed interest anddividends, their values may fall if market interest rates riseand rise if market interest rates fall. At times a convertible
security may be more susceptible to fixed-income securityrelated risks, while at other times such a security may bemore susceptible to equity security related risks.Additionally, an issuer may have the right to buy backcertain of the convertible securities at a time and a pricethat is unfavorable to the Fund.
Counterparty Risk. Counterparty risk is the risk that acounterparty to a security, loan or derivative held by theFund becomes bankrupt or otherwise fails to perform itsobligations due to financial difficulties. The Fund mayexperience significant delays in obtaining any recovery ina bankruptcy or other reorganization proceeding, andthere may be no recovery or limited recovery in suchcircumstances.
Credit Default Swap Risk. A credit default swap is anagreement between two parties: a buyer of creditprotection and a seller of credit protection. The buyer in acredit default swap agreement is obligated to pay theseller a periodic stream of payments over the term of theswap agreement. If no default or other designated creditevent occurs, the seller of credit protection will havereceived a fixed rate of income throughout the term of theswap agreement. If a default or designated credit eventdoes occur, the seller of credit protection must pay thebuyer of credit protection the full value of the referenceobligation. Credit default swaps increase counterparty riskwhen the Fund is the buyer. Commodity Futures TradingCommission rules require that certain credit default swapsbe executed through a centralized exchange or regulatedfacility and be cleared through a regulated clearinghouse.As a general matter, these rates have increased costs inconnection with trading these instruments.
Credit Risk. The value of a fixed-income security isdirectly affected by an issuer’s ability to pay principal andinterest on time. If the Fund invests in fixed-incomesecurities, the value of your investment may be adverselyaffected if a security’s credit rating is downgraded; anissuer of an investment held by a Fund fails to pay anobligation on a timely basis, otherwise defaults; or isperceived by other investors to be less creditworthy. Creditrisk is expected to be low for the Government MoneyMarket I Fund because of its investment in U.S.Government securities.
Credit Quality Risk. The creditworthiness of an issuer isalways a factor in analyzing fixed income securities. Anissuer with a lower credit rating will be more likely than ahigher rated issuer to default or otherwise become unableto honor its financial obligations. Issuers with low creditratings typically issue junk bonds. In addition to the risk ofdefault, junk bonds may be more volatile, less liquid, more
INVESTMENT GLOSSARY
- 150 -

difficult to value and more susceptible to adverseeconomic conditions or investor perceptions than otherbonds.
Currency Management Strategies Risk. Currencymanagement strategies may substantially change theFund’s exposure to currency exchange rates and couldresult in losses to the Fund if currencies do not performas the subadviser expects. In addition, currencymanagement strategies, to the extent that they reduce theFund’s exposure to currency risks, may also reduce theFund’s ability to benefit from favorable changes incurrency exchange rates. Using currency managementstrategies for purposes other than hedging furtherincreases the Fund’s exposure to foreign investmentlosses. Currency markets generally are not as regulatedas securities markets. In addition, currency rates mayfluctuate significantly over short periods of time, and canreduce returns.
Cybersecurity Risk. Intentional cybersecurity breachesinclude: unauthorized access to systems, networks, ordevices (such as through “hacking” activity); infection fromcomputer viruses or other malicious software code; andattacks that shut down, disable, slow, or otherwise disruptoperations, business processes, or website access orfunctionality. In addition, unintentional incidents can occur,such as the inadvertent release of confidential information(possibly resulting in the violation of applicable privacylaws).
A cybersecurity breach could result in the loss or theft ofcustomer data or funds, the inability to access electronicsystems (“denial of services”), loss or theft of proprietaryinformation or corporate data, physical damage to acomputer or network system, or costs associated withsystem repairs. Such incidents could cause the Fund, theAdviser, a subadviser, or other service providers to incurregulatory penalties, reputational damage, additionalcompliance costs, or financial loss. In addition, suchincidents could affect issuers in which the Fund invests,and thereby cause the Fund’s investments to lose value.
Depositary Receipts Risk. Depositary receipts, such asADRs and other depositary receipts, including GDRs,EDRs, are generally subject to the same risks as theforeign securities that they evidence or into which theymay be converted. Depositary receipts may or may not bejointly sponsored by the underlying issuer. The issuers ofunsponsored depositary receipts are not obligated todisclose information that is considered material in theUnited States. Therefore, there may be less informationavailable regarding these issuers and there may not be a
correlation between such information and the marketvalue of the depositary receipts. Certain depositaryreceipts are not listed on an exchange and therefore aresubject to illiquidity risk.
Derivatives Risk. The use of derivatives involves risksdifferent from, or possibly greater than, the risksassociated with investing directly in the underlying assets.Derivatives can significantly increase a Fund’s exposureto market and credit risk. Derivatives can be highly volatile,illiquid and difficult to value, and there is the risk thatchanges in the value of a derivative held by a Fund will notcorrelate with the underlying instruments or such Fund’sother investments. A small investment in derivatives canhave a potentially large impact on a Fund’s performance.Derivative instruments also involve the risk that a loss maybe sustained as a result of the failure of the counterpartyto the derivative instruments to make required paymentsor otherwise comply with the derivative instruments’terms. Certain types of derivatives involve greater risksthan the underlying obligations because, in addition togeneral market risks, they are subject to illiquidity risk,counterparty risk and credit risk.
Additionally, some derivatives involve economic leverage,which could increase the volatility of these investments asthey may fluctuate in value more than the underlyinginstrument. Leveraging also may expose the Fund tolosses in excess of the amount invested. Due to theircomplexity, derivatives may not perform as intended. As aresult, the Fund may not realize the anticipated benefitsfrom a derivative it holds or it may realize losses. A Fundmay not be able to terminate or sell a derivative undersome market conditions, which could result in substantiallosses. The Fund may be required to segregate liquidassets in connection with the purchase of derivativeinstruments.
Derivatives are often used to hedge against positions inthe Fund. A hedge is an investment made in order toreduce the risk of adverse price movements in a security,by taking an offsetting position in a related security (oftena derivative, such as an option or a short sale). Whilehedging strategies can be very useful and inexpensiveways of reducing risk, they are sometimes ineffective dueto unexpected changes in the market or exchange rates.Hedging also involves the risk that changes in the value ofthe related security will not match those of the instrumentsbeing hedged as expected, in which case any losses onthe instruments being hedged may not be reduced. Forgross currency hedges, there is an additional risk, to theextent that these transactions create exposure to
INVESTMENT GLOSSARY
- 151 -

currencies in which the Fund’s securities are notdenominated. Moreover, while hedging can reduce oreliminate losses, it can also reduce or eliminate gains.
Writing call options on securities that the Fund ownsexposes it to the risk that it will have to sell those securitiesat a price below their market value and forgo the benefitotherwise available from an increase in the value of thesecurities. Writing put options exposes a Fund to the riskthat it will have to purchase securities at a price above theirmarket value and can increase Fund losses if the value ofthe securities declines. Losses associated with these riskscan exceed any premium income received by the Fund forwriting options.
The applicable Funds are subject to legal requirementsapplicable to all mutual funds that are designed to reducethe effects of any leverage created by the use of derivativeinstruments. Under these requirements, the Funds mustset aside liquid assets (referred to sometimes as “assetsegregation”), or engage in other measures, while thederivatives instruments are held. Generally, under currentlaw, the Funds must set aside liquid assets equal to the fullnotional value for derivative contracts that are notcontractually required to “cash-settle.” For derivativecontracts that are contractually required to cash-settle, theFunds only need to set aside liquid assets in an amountequal to the Funds’ daily marked-to-market net obligationrather than the contract’s full notional value. The Fundsreserve the right to alter its asset segregation policies inthe future to comply with changes in the law orinterpretations thereunder.
Recent legislation calls for a new regulatory framework forthe derivatives markets. The extent and impact of newregulations are not yet known and may not be known forsome time. New regulations may make the use ofderivatives by funds more costly, may limit the availabilityof certain types of derivatives, and may otherwiseadversely affect the value or performance of derivativesused by a Fund. In addition, the SEC has proposed a newrule that would change the regulation of the use ofderivatives by registered investment companies, such asthe Funds. If the proposed rule takes effect, it could limitthe ability of the Funds to invest in derivatives.
Disciplined Strategy Risk. The Fund will generally notdeviate from its strategy, even during adverse market,economic, political, or other conditions (except to theextent necessary to comply with federal tax laws or otherapplicable laws). If the Fund is committed to a strategythat is unsuccessful, the Fund will not meet its investmentgoal. Because the Fund generally will not use certaintechniques available to other mutual funds to reduce stock
market exposure, the Fund may be more susceptible togeneral market declines than other mutual funds.
Dividend-paying Stocks Risk. There is no guaranteethat the issuers of the stocks held by the Fund will declaredividends in the future or that, if dividends are declared,they will remain at their current levels or increase overtime. Dividend-paying stocks may not participate in abroad market advance to the same degree as otherstocks, and a sharp rise in interest rates or economicdownturn could cause a company to unexpectedly reduceor eliminate its dividend.
Dynamic Allocation Risk. A Fund’s risks will directlycorrespond to the risks of any Underlying Portfolios andother direct investments in which it invests. A Fund issubject to the risk that the investment process that willdetermine the selection of any Underlying Portfolios andthe allocation and reallocation of the Fund’s assetsamong the various asset may not produce the desiredresult. A Fund is also subject to the risk that its managersmay be prevented from trading certain derivativeseffectively or in a timely manner.
Emerging Markets Risk. Investments in emergingmarkets are subject to all of the risks of investments inforeign securities, generally to a greater extent than indevelopedmarkets, and additional risks as well. Generally,the economic, social, legal, and political structures inemerging market countries are less diverse, mature andstable than those in developed countries. As a result,investments in emergingmarket securities tend to bemorevolatile than investments in developed countries. Unlikemost developed countries, emerging market countriesmay impose restrictions on foreign investment. Thesecountries may also impose confiscatory taxes oninvestment proceeds or otherwise restrict the ability offoreign investors to withdraw their money at will. Inaddition, there may be less publicly available informationabout emerging market issuers due to differences inregulatory, accounting, auditing, and financialrecordkeeping standards and available information maybe unreliable or outdated.
The securities markets in emerging market countries tendto be smaller and less mature than those in developedcountries, and they may experience lower tradingvolumes. As a result, investments in emerging marketsecurities may be less liquid and their prices more volatilethan investments in developed countries.
The fiscal and monetary policies of emerging marketcountries may result in high levels of inflation or deflationor currency devaluation. As a result, investments in
INVESTMENT GLOSSARY
- 152 -

emerging market securities may be subject to abrupt andsevere price changes.
Investments in emerging market securities may be moresusceptible to investor sentiment than investments indeveloped countries. As a result, emerging marketsecurities may be adversely affected by negativeperceptions about an emerging market country’s stabilityand prospects for continued growth.
Equity Securities Risk. The Fund’s investments in equitysecurities are subject to the risk that stock prices will falland may underperform other asset classes. Individualstock prices fluctuate from day-to-day and may declinesignificantly. The prices of individual stocks may benegatively affected by poor company results or otherfactors affecting individual prices, as well as industry and/or economic trends and developments affecting industriesor the securities market as a whole.
Factor-Based Investing Risk. There can be noassurance that the multi-factor selection processemployed by the subadviser will enhance performance.Exposure to investment style factors may detract fromperformance in some market environments, which maycontinue for prolonged periods.
Failure to Match Index Performance Risk. The ability ofthe Fund to match the performance of the UnderlyingIndex may be affected by, among other things, changes insecurities markets, the manner in which performance ofthe Underlying Index is calculated, changes in thecomposition of the Underlying Index, the amount andtiming of cash flows into and out of the Fund,commissions, portfolio expenses, and any differences inthe pricing of securities by the Fund and the UnderlyingIndex. When the Fund employs an “optimization” strategy,the Fund is subject to an increased risk of tracking error,in that the securities selected in the aggregate for theFund may perform differently than the Underlying Index orthe Index.
Focused Fund Risk. The Fund, because it may invest ina limited number of companies, may have more volatilityin its net asset value and is considered to have more riskthan a portfolio that invests in a greater number ofcompanies because changes in the value of a singlesecurity may have a more significant effect, eithernegative or positive, on the Fund’s net asset value. To theextent the Fund invests its assets in fewer securities, theFund is subject to greater risk of loss if any of thosesecurities decline in price.
Foreign Investment Risk. Investments in foreignsecurities involve risks in addition to those associated withinvestments in domestic securities due to changes in
currency exchange rates, unfavorable political, social andlegal developments or economic and financial instability,for example. Foreign companies are not subject to the U.S.accounting and financial reporting standards and publicinformation may not be as available. In addition, theliquidity of these investments may be more limited than forU.S. investments, which means a subadviser may at timesbe unable to sell at desirable prices. Foreign settlementprocedures may also involve additional risks. Certain ofthese risks may also apply to U.S. investments that aredenominated in foreign currencies or that are traded inforeign markets, or to securities of U.S. companies thathave significant foreign operations. These risks areheightened when an issuer is in an emerging market.Historically, the markets of emerging market countrieshave been more volatile than markets of developedcountries. A Fund investing in foreign securities may alsobe subject to the following risks:
• Currency Risk. Because a Fund’s foreigninvestments are generally held in foreigncurrencies, a Fund could experience gains orlosses based solely on changes in the exchangerate between foreign currencies and the U.S.dollar. Such gains or losses may be substantial.
• Foreign Sovereign Debt Risk. To the extent aFund invests in foreign sovereign debt securities,it may be subject to the risk that a governmentalentity may delay or refuse to pay interest or repayprincipal on its sovereign debt, due, for example,to cash flow problems, insufficient foreigncurrency reserves, political, social and economicconsiderations, the relative size of thegovernmental entity’s debt position in relation tothe economy or the failure to put in placeeconomic reforms required by the InternationalMonetary Fund or other multilateral agencies. If agovernmental entity defaults, it may ask for moretime in which to pay or for further loans.
Futures Risk. A futures contract is considered aderivative because it derives its value from the price of theunderlying currency, security or financial index. The pricesof futures contracts can be volatile and futures contractsmay lack liquidity. In addition, there may be imperfect oreven negative correlation between the price of a futurescontract and the price of the underlying currency, securityor financial index.
Geographic Risk. If a Fund invests a significant portionof its assets in issuers located in a single country, a limitednumber of countries, or a particular geographic region, itassumes the risk that economic, political and socialconditions in those countries or that region may have asignificant impact on its investment performance.
INVESTMENT GLOSSARY
- 153 -

Hedging Risk. A hedge is an investment made in order toreduce the risk of adverse price movements in a currencyor other investment, by taking an offsetting position (oftenthrough a derivative instrument, such as an option orforward contract). While hedging strategies can be veryuseful and inexpensive ways of reducing risk, they aresometimes ineffective due to unexpected changes in themarket. Hedging also involves the risk that changes in thevalue of the related security will not match those of theinstruments being hedged as expected, in which case anylosses on the instruments being hedged may not bereduced.
Income Risk. Because a Fund can only distribute what itearns, a Fund’s distributions to shareholders may declinewhen prevailing interest rates fall or when a Fundexperiences defaults on debt securities it holds.
Index Risk.Certain Funds aremanaged to track an index,which will result in a Fund’s performance being closelytied to the performance of the index. As a result, a Fundgenerally will not sell securities in its portfolio and buydifferent securities over the course of a year other than inconjunction with changes in its target index, even if thereare adverse developments concerning a particularsecurity, company or industry. As a result, you may sufferlosses that you would not experience with an activelymanaged mutual fund. In addition, a Fund’s returns maydeviate from those of the index it seeks to track as a resultof, among other factors, fund operating expenses,transaction costs and delays in investing cash.
Information Risk. When the quantitative models(“Models”) and information and data (“Data”) used inmanaging a Fund prove to be incorrect or incomplete, anyinvestment decisions made in reliance on the Models andData may not produce the desired results and a Fund mayrealize losses. In addition, any hedging based on faultyModels and Data may prove to be unsuccessful.Furthermore, the success of Models that are predictive innature is dependent largely on the accuracy and reliabilityof the supplies historical data. All models are susceptibleto input errors that may cause the resulting information tobe incorrect.
Interest Rate Risk. The volatility of fixed-incomesecurities is due principally to changes in interest rates.The market value of money market securities and otherfixed-income securities usually tends to vary inverselywith the level of interest rates. Duration is a measure ofinterest rate risk that indicates how price-sensitive a bondis to changes in interest rates. As interest rates rise the
value of such securities typically falls, and as interestrates fall, the value of such securities typically rises. Forexample, a bond with a duration of three years willdecrease in value by approximately 3% if interest ratesincrease by 1%. The interest earned on fixed-incomesecurities may decline when interest rates go down orincrease when interest rates go up. Longer-term and lowercoupon bonds tend to be more sensitive to changes ininterest rates. The Fund may be subject to a greater riskof rising interest rates due to the current period ofhistorically low rates and the effect of potentialgovernment fiscal policy initiatives and resulting marketreaction to these initiatives.
While the Government Money Market I Fund will investprimarily in short-term securities, you should be awarethat the value of the Fund’s investments may nonethelessbe subject to changes in interest rates. The change invalue for shorter-term securities is usually smaller than forsecurities with longer maturities. Because the Fundinvests in securities with short maturities and seeks tomaintain a stable NAV of $1.00 per share, it is possible,though unlikely, that an increase or decrease in interestrates would change the value of your investment in theFund. In addition, when interest rates are very low, theFund’s expenses could absorb all or a significant portionof the Fund’s income, and, if the Fund’s expenses exceedthe Fund’s income, the Fund may be unable to maintainits $1.00 share price. The Funds may be subject to agreater risk of rising interest rates due to the currentperiod of historically low rates and the effect of potentialgovernment fiscal policy initiatives and resulting marketreaction to these initiatives.
Investment Company Risk. An exchange-traded fund(“ETF”) or investment company may not achieve itsinvestment objective or execute its investment strategyeffectively, which may adversely affect the performance ofa Fund investing in these instruments. Investments inETFs and investment companies involve substantially thesame risks as investing directly in the instruments held bythese entities. However, the total return from suchinvestments will be reduced by the operating expensesand fees of the ETF or investment company. In addition, aFund that invests in shares of an ETF or anotherinvestment company bears a proportionate share of theETF or other investment company’s expenses. In addition,an ETF may fail to accurately track the market segment orindex that underlies its investment objective. The price ofan ETF can fluctuate, and the Fund could lose moneyinvesting in an ETF.
INVESTMENT GLOSSARY
- 154 -

Disruptions in the markets for the securities held by theother investment companies purchased or sold by theFund could result in losses on the Fund’s investment insuch securities. Other investment companies also havefees that increase their costs versus owning theunderlying securities directly.
IPO Risk. A Fund’s purchase of shares issued as part of,or a short period after a company’s initial public offering(“IPO”) exposes it to risks associated with companies thathave little operating history as public companies, as wellas to the risks inherent in those sectors of the marketwhere these new issuers operate. The market for IPOissuers has been volatile, and share prices of newly-publiccompanies have fluctuated in significant amounts overshort periods of time.
Junk Bond Risk. A portion of the Fund’s investmentsmay be invested in high yielding, high risk fixed incomesecurities, commonly known as junk bonds. Thesesecurities can range from those for which the prospect forrepayment of principal and interest is predominantlyspeculative to those which are currently in default onprincipal or interest payments or whose issuers are inbankruptcy. Investments in junk bonds involve significantlygreater credit risk, market risk and interest rate riskcompared to higher rated fixed income securities becauseissuers of junk bonds are less secure financially, are morelikely to default on their obligations, and their securities aremore sensitive to interest rate changes and downturns inthe economy. Accordingly, these investments coulddecrease in value and therefore negatively impact theFund. In addition, the secondary market for junk bondsmay not be as liquid as that for higher rated fixed incomesecurities. As a result, the Fund may find it more difficultto value junk bonds or sell them and may have to sell themat prices significantly lower than the values assigned tothem by a Fund.
Large-Cap Companies Risk. Large-cap companies tendto go in and out of favor based on market and economicconditions. Large-cap companies tend to be less volatilethan companies with smaller market capitalizations. Inexchange for this potentially lower risk, a Fund’s valuemay not rise as much as the value of fund that emphasizesmaller capitalization companies. Larger, moreestablished companies may be unable to respond quicklyto new competitive challenges, such as changes intechnology and consumer tastes. Larger Companies alsomay not be able to attain the high growth rate ofsuccessful smaller companies, particularly duringextended periods of economic expansion..
Liquidity Risk. When there is little or no active tradingmarket for specific types of securities, it can becomemore
difficult to sell the securities at or near their perceivedvalue. In such a market, the value of such securities anda Fund’s share price may fall dramatically. Moreover, aFundmay have to hold such securities longer than it wouldlike and may have to forego other investmentopportunities. The inability of a Fund to dispose ofsecurities promptly or at a reasonable price could impaira Fund’s ability to raise cash for redemptions or otherpurposes.
Liquidity Risk for Mortgage- and Asset-BackedSecurities. In recent years, the market for mortgage-backed securities has experienced substantially, oftendramatically, lower valuations and greatly reducedliquidity. Markets for other asset-backed securities havesimilarly been affected. These instruments areincreasingly subject to liquidity constraints, price volatility,credit downgrades and unexpected increases in defaultrates, and therefore may be more difficult to value andmore difficult to dispose of than previously. As notedabove, a Fund may invest in mortgage- and asset-backedsecurities and therefore may be exposed to theseincreased risks.
Management Risk. Different investment styles andstrategies tend to shift in and out of favor depending uponmarket and economic conditions, as well as investorsentiment. The investment style or strategy used by eachFund may fail to produce the intended result. Moreover, aFund may outperform or underperform funds that employa different investment style or strategy. A subadviser’sassessment of a particular security or company mayprove incorrect, resulting in losses or underperformance.
Generally, stocks with growth characteristics can haverelatively wide price swings as a result of their potentiallyhigh valuations, while stocks with value characteristicscarry the risk that investors will not recognize their intrinsicvalue for a long time or that they are actually appropriatelypriced at a low level. The share price of a Fund that holdsstocks with growth and value characteristics may benegatively affected by either set of risks, as discussed inmore detail below.
• Growth Style Risk. Generally, “growth” stocks arestocks of companies that a subadviser believeshave anticipated earnings ranging from steady toaccelerated growth. Many investors buy growthstocks because of anticipated superior earningsgrowth, but earnings disappointments often resultin sharp price declines. Growth companiesusually invest a high portion of earnings in theirown businesses so their stocks may lack thedividends that can cushion share prices in a downmarket. In addition, the value of growth stocks
INVESTMENT GLOSSARY
- 155 -
may be more sensitive to changes in current orexpected earnings than the values of otherstocks, because growth stocks trade at higherprices relative to current earnings.
• Value Style Risk. Generally, “value” stocks arestocks of companies that a subadviser believesare currently undervalued in the marketplace. Asubadviser’s judgments that a particular securityis undervalued in relation to the company’sfundamental economic value may prove incorrectand the price of the company’s stock may fall ormay not approach the value the subadviser hasplaced on it.
• For the Systematic Value Fund, “value” stocks arestocks of companies that the index providerbelieves are currently undervalued in themarketplace based on a combination of variables.The index provider’s calculation to identify aparticular security that is undervalued in relationto the company’s fundamental economic valuemay prove incorrect and the price of thecompany’s stock may fall.
Market Risk. The Fund’s share price can fall because ofweakness in the broad market, a particular industry, orspecific holdings. The market as a whole can decline formany reasons, including adverse political or economicdevelopments here or abroad, changes in investorpsychology, or heavy institutional selling and otherconditions or events (including, for example, militaryconfrontations, war, terrorism, disease/virus, outbreaksand epidemics). The prospects for an industry or companymay deteriorate because of a variety of factors, includingdisappointing earnings or changes in the competitiveenvironment. In addition, a Subadviser’s assessment ofcompanies held in the Fund may prove incorrect, resultingin losses or poor performance even in a rising market.Markets tend to move in cycles with periods of risingprices and periods of falling prices. Like markets generally,the investment performance of a Fund will fluctuate, so aninvestor may lose money over short or even long periods.
The coronavirus pandemic and the related governmentaland public responses have had and may continue to havean impact on the Fund’s investments and net asset valueand have led and may continue to lead to increasedmarket volatility and the potential for illiquidity in certainclasses of securities and sectors of the market.Preventative or protective actions that governments maytake in respect of pandemic or epidemic diseases mayresult in periods of business disruption, businessclosures, inability to obtain raw materials, supplies andcomponent parts, and reduced or disrupted operations forthe issuers in which the Fund invests. Government
intervention in markets may impact interest rates, marketvolatility and security pricing. The occurrence,reoccurrence and pendency of such diseases couldadversely affect the economies (including throughchanges in business activity and increasedunemployment) and financial markets either in specificcountries or worldwide.
Micro-Cap Company Risk. Micro-cap companies aregenerally subject to the same risks as small-capcompanies. However, the prices of micro-cap companiesare generally more volatile. In addition, because micro-cap securities tend to have significantly lower tradingvolumes, a Fund may have difficulty selling holdings ormay only be able to sell holdings at prices substantiallylower than the Subadviser believes they are worth.Therefore, a Fund may involve considerably more risk ofloss and its returns may differ significantly from fundsinvesting in larger-cap companies or other asset classes.For more information about the risks of investing in small-cap companies please see Small-Cap Company Risk.
Mid-Cap Company Risk. The risk that mid-capcompanies, which usually do not have as much financialstrength as very large companies, may not be able to doas well in difficult times. Investing in mid-cap companiesmay be subject to special risks associated with narrowerproduct lines, more limited financial resources, fewerexperienced managers, dependence on a few keyemployees, and a more limited trading market for theirstocks, as compared with larger companies.
Model Risk. The risk that the asset allocation model failsto produce the optimal allocation.
Mortgage-Backed Securities Risk. Mortgage-backedsecurities may be issued or guaranteed by the U.S.Government, its agencies or instrumentalities or may beissued by private issuers and as such are not guaranteedby the U.S. Government, its agencies or instrumentalities.Like other debt securities, changes in interest ratesgenerally affect the value of a mortgage-backed security.These securities are also subject to the risk that issuerswill prepay the principal more quickly or more slowly thanexpected, which could cause a Fund to invest theproceeds in less attractive investments or increase thevolatility of their prices. Additionally, some mortgage-backed securities may be structured so that they may beparticularly sensitive to interest rates. See also “LiquidityRisk for Mortgage- and Asset-Backed Securities.”
Mortgage-backed securities are subject to “prepaymentrisk” and “extension risk.” Prepayment risk is the risk that,when interest rates fall, certain types of obligations will bepaid off by the obligor more quickly than originally
INVESTMENT GLOSSARY
- 156 -
anticipated and a Fund may have to invest the proceedsin securities with lower yields. Extension risk is the riskthat, when interest rates rise, certain obligations will bepaid off by the obligor more slowly than anticipated,causing the value of these securities to fall. Smallmovements in interest rates (both increases anddecreases) may quickly and significantly reduce the valueof certain mortgage-backed securities. These securitiesalso are subject to risk of default on the underlyingmortgage, particularly during periods of economicdownturn.
Non-Diversification Risk. A Fund that is considered anon-diversified investment company may invest a largerportion of its assets in the stock of a single company thana diversified investment company, and thus can invest in asmaller number of securities. As a result, such Fund’svalue will be affected to a greater extent by theperformance of any one company than would be adiversified investment company.
Non-Mortgage Asset-Backed Securities Risk. Non-mortgage asset-backed securities represent interests in“pools” of assets, including consumer loans or receivablesheld in trust. Certain non-mortgage asset-backedsecurities are not issued or guaranteed by the U.S.Government or its agencies or government-sponsoredentities. In the event of a failure of these securities or ofmortgage related securities issued by private issuers topay interest or repay principal, the assets backing thesesecurities such as automobiles or credit card receivablesmay be insufficient to support the payments on thesecurities.
Participatory Notes Risk. Participatory notes are issuedby banks or broker-dealers and are designed to replicatethe performance of certain securities or markets.Participatory notes are a type of equity-linked derivativewhich generally are traded over-the-counter. Theperformance results of participatory notes will notreplicate exactly the performance of the securities ormarkets that the notes seek to replicate due to transactioncosts and other expenses. Investments in participatorynotes involve the same risks associated with a directinvestment in the shares of the companies the notes seekto replicate. Participatory notes constitute generalunsecured contractual obligations of the banks or broker-dealers that issue them, and a fund is relying on thecreditworthiness of such banks or broker-dealers and hasno rights under a participatory note against the issuers ofthe securities underlying such participatory notes.
“Passively Managed” Strategy Risk. An UnderlyingFund following a passively managed strategy will notdeviate from its investment strategy. In most cases, it will
involve a passively managed strategy utilized to achieveinvestment results that correspond to a particular marketindex. Such an Underlying Fund will not sell securities inits portfolio and buy different securities for other reasons,even if there are adverse developments concerning aparticular security, company or industry. There can be noassurance that the strategy will be successful.
Preferred Stock Risk. Unlike common stock, preferredstock generally pays a fixed dividend from a company’searnings and may have a preference over common stockon the distribution of a company’s assets in the event ofbankruptcy or liquidation. Preferred stockholders’liquidation rights are subordinate to the company’s debtholders and creditors. If interest rates rise, the fixeddividend on preferred stocks may be less attractive andthe price of preferred stocks may decline.
Price Volatility Risk. The Fund’s investment strategymay subject the Fund’s portfolio to increased volatility.Volatility may cause the value of the Fund’s portfolio tofluctuate significantly in the short term.
Privately Placed Securities Risk. Certain Funds’investments may also include privately placed securities,which are subject to resale restrictions. These securitieswill have the effect of increasing the level of Fund illiquidityto the extent a Fundmay be unable to sell or transfer thesesecurities due to restrictions on transfers or on the abilityto find buyers interested in purchasing the securities. Theilliquidity of the market, as well as the lack of publiclyavailable information regarding these securities, may alsoadversely affect the ability to arrive at a fair value forcertain securities at certain times and could make itdifficult for a Fund to sell certain securities.
Quantitative Investing Risk. The value of securitiesselected using quantitative analysis can react differently toissuer, political, market, and economic developments fromthe market as a whole or securities selected using onlyfundamental analysis. The factors used in quantitativeanalysis and the weight placed on those factors may notbe predictive of a security’s value. In addition, factors thataffect a security’s value can change over time and thesechanges may not be reflected in the quantitative model.
Real Estate Investments Risk. Real estate investmentsare subject to market risk, interest rate risk and credit risk.In addition, securities of companies in the real estateindustry are sensitive to factors such as changes in realestate values, property taxes, cash flow of underlying realestate assets, occupancy rates, government regulationsaffecting zoning, land use, and rents, and themanagement skill and creditworthiness of the issuer.Companies in the real estate industry may also be subject
INVESTMENT GLOSSARY
- 157 -

to liabilities under environmental and hazardous wastelaws, among others. Changes in underlying real estatevalues may have an exaggerated effect to the extent thatcompanies in the real estate industry concentrateinvestments in particular geographic regions or propertytypes.
Real Estate Sector Risk. Certain Funds may investsubstantially in securities related to the real estateindustry. Substantial investments in a particular industry orsector make such Fund’s performance more susceptibleto any single economic, market, political or regulatoryoccurrence affecting that particular industry, group ofindustries, or sector than a Fund that invests more broadly.
REITs Risk. Real Estate Investment Trusts (“REITs”) poolinvestors’ funds for investments primarily in commercialreal estate properties. Like mutual funds, REITs haveexpenses, including advisory and administration fees thatare paid by their shareholders. As a result, shareholderswill absorb an additional layer of fees when a Fund investsin REITs. The performance of any Fund’s REITs holdingsultimately depends on the types of real property in whichthe REITs invest and how well the property is managed. Ageneral downturn in real estate values also can hurt REITsperformance. When a REIT focuses its investments inparticular sub-sectors of the real estate industry orparticular geographic regions, the REIT’s performancewould be especially sensitive to developments thatsignificantly affected those particular sub-sectors orgeographic regions. Due to their dependence on themanagement skills of their managers, REITs mayunderperform if their managers are incorrect in theirassessment of particular real estate investments. Inaddition, REITs are subject to certain provisions underfederal tax law. The failure of a company to qualify as aREIT could have adverse consequences for a Fund,including significantly reducing the return to a Fund on itsinvestment in such company.
Risk of Conflict with Insurance Company Interests.Managing a Fund’s net equity exposure may serve toreduce the risk from equity market volatility to the affiliatedinsurance companies and facilitate their ability to provideguaranteed benefits associated with certain VariableContracts. While the interests of Fund shareholders andthe affiliated insurance companies providing guaranteedbenefits associated with the Variable Contracts aregenerally aligned, the affiliated insurance companies (andthe Adviser by virtue of its affiliation with the insurancecompanies) may face potential conflicts of interest. Inparticular, certain aspects of a Fund’s management havethe effect of mitigating the financial risks to which theaffiliated insurance companies are subjected by providing
those guaranteed benefits. In addition, a Fund’sperformance may be lower than similar Funds that do notseek to manage their equity exposure.
Risks of Investing in Inflation-Indexed Securities.Inflation-indexed securities are debt instruments whoseprincipal is indexed to an official or designated measure ofinflation, such as the Consumer Price Index (“CPI”) in theUnited States. Inflation-indexed securities issued by aforeign government or foreign corporation are adjusted toreflect a comparable inflation index, calculated by thatgovernment. Inflation-indexed securities are sensitive tochanges in the real interest rates, which is the nominalinterest rate minus the expected rate of inflation. The priceof an inflation-indexed security will increase if real interestrates decline, and decrease if real interest rates increase.If the interest rate rises for reasons other than inflation, thevalue of such instruments can be negatively impacted.Interest income will vary depending on changes to theprincipal amount of the security. In certain interest rateenvironments, such as when real interest rates are risingfaster than nominal interest rates, inflation-indexedsecurities may experience greater losses than other fixedincome securities with similar durations.
For U.S. tax purposes, both interest payments and inflationadjustments to principal are treated as interest incomesubject to taxation when received or accrued, and inflationadjustments to principal are subject to taxation when theadjustment is made and not when the instrument matures.
Repurchase Agreements Risk. Repurchaseagreements are agreements in which the seller of asecurity to the Fund agrees to repurchase that securityfrom the Fund at a mutually agreed upon price and date.Repurchase agreements carry the risk that thecounterparty may not fulfill its obligations under theagreement. This could cause the Fund’s income and thevalue of the Fund to decline.
Risks of Inflation Indexing Methodology. An inflationindex may not accurately measure the real rate of inflationin the prices of goods and services, whether for the U.S.or a foreign country. Market perceptions of adjustmenttimes or a lag between the time a security is adjusted forinflation and the time interest is paid can each adverselyaffect an inflation-indexed security, particularly duringperiods of significant, rapid changes in inflation.
Risks of Investing in Money Market Securities. Aninvestment in the Fund is subject to the risk that the valueof its investments in high-quality short-term obligations(“money market securities”) may be subject to changes ininterest rates, changes in the rating of any money market
INVESTMENT GLOSSARY
- 158 -

security and in the ability of an issuer to make paymentsof interest and principal.
Risks of Leverage. Certain ETFs, managed futuresinstruments, and some other derivatives the Fund buysinvolve a degree of leverage. Leverage occurs when aninvestor has the right to a return on an investment thatexceeds the return that the investor would be expected toreceive based on the amount contributed to theinvestment. The Fund’s use of certain economicallyleveraged futures and other derivatives can result in a losssubstantially greater than the amount invested in thefutures or other derivative itself. Certain futures and otherderivatives have the potential for unlimited loss,regardless of the size of the initial investment. When theFund uses futures and other derivatives for leverage, ashareholder’s investment in the Fund will tend to be morevolatile, resulting in larger gains or losses in response tothe fluctuating prices of the Fund’s investments.
Sector Risk. Companies with similar characteristics maybe grouped together in broad categories called sectors.Sector risk is the risk that securities of companies withinspecific sectors of the economy can perform differentlythan the overall market. This may be due to changes insuch things as the regulatory or competitive environmentor to changes in investor perceptions regarding a sector.Because a Fund may allocate relatively more assets tocertain sectors than others, a Fund’s performance may bemore susceptible to any developments which affect thosesectors emphasized by such a Fund.
At times, a Fund may have a significant portion of itsassets invested in securities of companies conductingbusiness in a broadly related group of industries within aneconomic sector. Companies in the same economic sectormay be similarly affected by economic or market events,making such a Fund more vulnerable to unfavorabledevelopments in that economic sector than funds thatinvest more broadly.
Substantial investments in a particular market, industry,group of industries, country, region, group of countries,asset class or sector make the Fund’s performance moresusceptible to any single economic, market, political orregulatory occurrence affecting that particular market,industry, group of industries, country, region, group ofcountries, asset class or sector than a fund that investsmore broadly.
Securities Lending Risk. Engaging in securities lendingcould increase the market and credit risk for Fundinvestments. The Fund may lose money if it does notrecover borrowed securities, the value of the collateralfalls, or the value of investments made with cash collateraldeclines. If the value of either the cash collateral or the
Fund’s investments of the cash collateral falls below theamount owed to a borrower, the Fund also may incurlosses that exceed the amount it earned on lending thesecurity. Securities lending also involves the risks of delayin receiving additional collateral or possible loss of rightsin the collateral if the borrower fails. Another risk ofsecurities lending is the risk that the loaned portfoliosecurities may not be available to the Fund on a timelybasis and a Fundmay therefore lose the opportunity to sellthe securities at a desirable price.
Short Sales Risk. Short Sales involve certain risks andspecial considerations. Possible losses from short salesdiffer from losses that could be incurred from a purchaseof a security because losses from short sales arepotentially unlimited, whereas losses from purchases canbe no greater than the total amount invested.
Small-Cap Company Risk. Investing in small companiesinvolves greater risk than is customarily associated withlarger companies. Stocks of small companies are subjectto more abrupt or erratic price movements than largercompany stocks. Small companies often are in the earlystages of development and have limited product lines,markets, or financial resources. Their managements maylack depth and experience. Such companies seldom paysignificant dividends that could cushion returns in a fallingmarket. In addition, these companies may be moreaffected by intense competition from larger companies,and the trading markets for their securities may be lessliquid and more volatile than securities of largercompanies. This means that a Fund could have greaterdifficulty selling a security of a small-cap issuer at anacceptable price, especially in periods of market volatility.Also, it may take a substantial period of time before a Fundrealizes a gain on an investment in a small-cap company,if it realizes any gain at all.
Social Criteria Risk. If a company stops meeting theFund’s social criteria after the Fund acquires it, the Fundwill sell these investments even if this means the Fundloses money. Also, if the Fund changes its social criteriaand the companies the Fund has already invested in nolonger meet the social criteria, the Fund will sell theseinvestments even if this means the Fund loses money.Social criteria screening will limit the availability ofinvestment opportunities for the Fund more than for fundshaving no such criteria. Therefore, adhering to the socialcriteria screening may affect the Fund’s performancerelative to similar funds that do not adhere to such criteria.
Special Situations Risk. Small companies and emerginggrowth companies are often involved in “specialsituations.” Securities of special situation companies maydecline in value and hurt the fund’s performance if the
INVESTMENT GLOSSARY
- 159 -

anticipated benefits of the special situation do notmaterialize.
Synthetic Securities Risk. Fluctuations in the values ofsynthetic securities may not correlate perfectly with theinstruments they are designed to replicate. Syntheticsecurities may be subject to interest rate changes, marketprice fluctuations, counterparty risk and liquidity risk.
Tax Risk. The use of certain derivatives may cause aFund to realize higher amounts of ordinary income orshort-term capital gain, to suspend or eliminate holdingperiods of positions, and/or to defer realized losses,potentially increasing the amount of taxable distributions,and of ordinary income distributions in particular. A Fund’suse of derivatives may be limited by the requirements fortaxation of a Fund as a regulated investment company.The tax treatment of derivatives may be affected bychanges in legislation, regulations or other legal authoritythat could affect the character, timing and amount of aFund’s taxable income or gains and distributions toshareholders.
Technology Sector Risk. Technology stocks historicallyhave experienced unusually wide price swings, both upand down. The potential for wide variation in performancereflects the special risks common to companies in therapidly changing field of technology. For example,products and services that at first appear promising maynot prove to be commercially successful or may becomeobsolete quickly. Earnings disappointments and intensecompetition for market share can result in sharp pricedeclines.
Risks associated with technology stocks include, but arenot limited to, the risks of short production cycles andrapid obsolescence of products and services, competitionfrom new and existing companies, significant losses and/or limited earnings, security price volatility, limitedoperating histories and management experience andpatent and other intellectual property considerations.
Unseasoned Issuer Risk. Unseasoned companies aregenerally considered more speculative and entail greater
risk than do investments in companies with an establishedoperating record. The level of risk will be increased to theextent that a Fund has significant exposure to smaller orunseasoned companies (generally those with less than athree-year operating history together with theirpredecessors and newly public companies). Thesecompanies may not have established products, moreexperienced management, or an earnings history andtheir stocks may lack liquidity and be very volatile.
U.S. Government Obligations Risk. U.S. Treasuryobligations are backed by the “full faith and credit” of theU.S. Government and are generally considered to havelow credit risk. Unlike U.S. Treasury obligations, securitiesissued or guaranteed by federal agencies or authoritiesand U.S. Government-sponsored instrumentalities orenterprises may or may not be backed by the full faith andcredit of the U.S. Government. For example, securitiesissued by the Federal Home Loan Mortgage Corporation,the Federal National Mortgage Association and theFederal Home Loan Banks are neither insured norguaranteed by the U.S. Government. These securitiesmay be supported by the ability to borrow from the U.S.Treasury or by the credit of the issuing agency, authority,instrumentality or enterprise and, as a result, are subjectto greater credit risk than securities issued or guaranteedby the U.S. Treasury.
Warrant Risk. A warrant entitles the holder to purchase aspecified amount of securities at a pre-determined price.Warrants may not track the value of the securities theholder is entitled to purchase and may expire worthless ifthe market price of the securities is below the exerciseprice of the warrant.
When-Issued and Delayed Delivery TransactionsRisk.When-issued and delayed delivery securities involvethe risk that the security a Fund buys will lose value priorto its delivery. There also is the risk that the security willnot be issued or that the other party to the transaction willnot meet its obligation. If this occurs, a Fund may loseboth the investment opportunity for the assets it set asideto pay for the security and any gain in the security’s price.
About the Indices
Unlike mutual funds, the indices do not incur expenses. If expenses were deducted, the actual returns of the indiceswould be lower.
The Bloomberg Barclays U.S. Aggregate Bond Indexis an unmanaged index that measures the investmentgrade, U.S. dollar-denominated, fixed-rate taxable bondmarket, including Treasuries, government-related andcorporate securities, mortgage- and asset-backedsecurities and commercial mortgage-backed securities.
The Bloomberg Barclays U.S. Government BondIndex is a market-value weighted index of U.S.Government and government agency securities (otherthan mortgage securities) with maturities of one year ormore.
INVESTMENT GLOSSARY
- 160 -

The Bloomberg Barclays U.S. Treasury Inflation-Protected Securities (TIPS) Index measures theperformance of fixed income securities with fixed-ratecoupon payments that adjust for inflation, as measured bythe Consumer Price Index for All Urban Consumers.
The FTSE World Government Bond Index (unhedged)(WGBI) is an unmanaged index of debt securities of majorforeign government bond markets.
The FTSE EPRA NAREIT Developed Index is a globalmarket capitalization weighted index composed of listedreal estate securities in the North American, Europeanand Asian real estate markets.
The FTSE Treasury Bill 3 Month Index measuresmonthly performance of 90-day U.S. Treasury Bills.
The JPMorgan Emerging Markets Bond Index (EMBI)Plus tracks total returns for traded external debtinstruments in the emerging markets. The instrumentsinclude external- currency-denominated Brady bonds,loans and Eurobonds, as well as U.S. dollar local marketsinstruments.
The JPMorgan EMBI Global Diversified Index trackstotal returns for U.S. dollar-denominated debt instruments(Eurobonds, loans, etc.) issued by emerging marketssovereign and quasi-sovereign entities. The EMBI GlobalDiversified is uniquely-weighted and limits the weights ofthe countries with larger debt stocks by only includingspecified portions of these countries’ eligible current faceamounts of debt outstanding.
The JPMorgan GBI Global Index (unhedged)measureslocal currency denominated fixed rate government debtissued in 13 developed markets countries. The developedmarkets consist of regularly traded, fixed rate, domesticgovernment bonds that are available to internationalinvestors. The index includes only the most liquiddeveloped markets and has been composed of 13countries since inception.
The MSCI ACWI Index (net)* is a free float-adjustedmarket capitalization weighted index that is designed tomeasure the equity market performance of developed andemerging markets. The MSCI ACWI consists of 49country indexes comprising 23 developed and 26emerging market country indexes. The developed marketcountry indexes included are: Australia, Austria, Belgium,Canada, Denmark, Finland, France, Germany, HongKong, Ireland, Israel, Italy, Japan, Netherlands, NewZealand, Norway, Portugal, Singapore, Spain, Sweden,Switzerland, the United Kingdom and the United States.
The emerging market country indexes included are:Argentina, Brazil, Chile, China, Colombia, CzechRepublic, Egypt, Greece, Hungary, India, Indonesia,Korea, Malaysia, Mexico, Pakistan, Peru, Philippines,Poland, Qatar, Russia, Saudi Arabia, South Africa,Taiwan, Thailand, Turkey and United Arab Emirates.
The MSCI ACWI ex USA Index (net)* is a free float-adjusted market capitalization weighted index designed tomeasure the equity market performance of developed andemerging markets, excluding the United States. The term“free float” represents the portion of shares outstandingthat are deemed to be available for purchase in the publicequity markets by investors. The performance of the Indexis listed in U.S. dollars and assumes reinvestment of netdividends.
The MSCI Emerging Markets Index (net)SM* is a freefloat-adjusted market capitalization index that is designedto measure equity market performance of emergingmarkets. The MSCI Emerging Markets Index consists ofthe following 26 emerging market country indexes:Argentina, Brazil, Chile, China, Colombia, CzechRepublic, Egypt, Greece, Hungary, India, Indonesia,Korea, Malaysia, Mexico, Pakistan, Peru, the Philippines,Poland, Qatar, Russia, Saudi Arabia, South Africa,Taiwan, Thailand, Turkey and United Arab Emirates.
The MSCI EAFE Index (Europe, Australasia, Far East)(net)* is a free float-adjusted market capitalization indexthat is designed to measure the equity marketperformance of developed markets, excluding the US &Canada. The MSCI EAFE Index consists of the following21 developed market country indexes: Australia, Austria,Belgium, Denmark, Finland, France, Germany, HongKong, Ireland, Israel, Italy, Japan, the Netherlands, NewZealand, Norway, Portugal, Singapore, Spain, Sweden,Switzerland, and the United Kingdom.
The Nasdaq-100® Index includes 100 of the largestdomestic and international non-financial securities listedon The NASDAQ Stock Market based on marketcapitalization. The Index reflects companies across majorindustry groups including computer hardware andsoftware, telecommunications, retail/wholesale trade andbiotechnology. It does not contain securities of financialcompanies including investment companies.
The Russell Midcap® Growth Index measures theperformance of those Russell Midcap® companies withhigher price-to-book ratios and higher forecasted growthvalues. The stocks are also members of the Russell1000® Growth Index.
INVESTMENT GLOSSARY
- 161 -

The Russell 1000® Index is a market capitalization-weighted benchmark index made up of the 1000 largestU.S. stocks in the Russell 3000® Index.
The Russell 1000® Growth Index measures theperformance of those Russell 1000® companies withhigher price-to-book ratios and higher forecasted growthvalues.
The Russell 1000® Value Index measures theperformance of those Russell 1000 companies with lowerprice-to-book ratios and lower forecasted growth values.
The Russell 2000® Growth Index measures theperformance of those Russell 2000 companies withhigher price-to-book ratios and higher forecasted growthvalues.
The Russell 2000® Index measures the performance ofthe 2,000 smallest companies in the Russell 3000® Index,which represents approximately 10% of the total marketcapitalization of the Russell 3000® Index.
The Russell 2500™ Growth Index measures theperformance of the small to mid-cap growth segment ofthe U.S. equity universe. It includes those Russell 2500companies with higher growth earning potential asdefined by Russell’s leading style methodology. TheRussell 2500™ Growth Index is constructed to provide acomprehensive and unbiased barometer of the small tomid-cap growth market.
The Russell 2000® Value Index measures theperformance of those Russell 2000 companies with lowerprice-to-book ratios and lower forecasted growth values.
The S&P MidCap 400® Index is an index of the stocks of400 domestic stocks chosen for market size, liquidity, and
industry group representation. It is a market-valueweighted index, with each stock’s percentage in the Indexin proportion to its market value.
The S&P 500® Index is an index of the stocks of 500major large-cap U.S. corporations, chosen for market size,liquidity, and industry group representation. It is a market-value weighted index, with each stock’s percentage in theIndex in proportion to its market value.
The S&P 500® Growth Index measures growth stocksusing three factors: sales growth, the ratio of earningschange to price, and momentum.
The S&P 500® Health Care Index is an unmanaged,market-capitalization weighted index consisting ofhealthcare companies in the S&P 500® Index and isdesigned to measure the performance of the healthcaresector.
The S&P® North American Technology Sector Indexmeasures the performance of U.S.-traded stocks oftechnology-related companies in the U.S. and Canada.The Index includes companies in the following categories:producers of sophisticated computer-related devices;communications equipment and internet services;producers of computer and internet software; consultantsfor information technology; providers of computerservices; and semiconductor equipment manufacturers.
* The net total return indexes reinvest dividends after thededuction of withholding taxes, using (for internationalindexes) a tax rate applicable to non-resident institutionalinvestors who do not benefit from double taxation treaties.
Additional Information about the Nasdaq-100® Index.The Nasdaq-100® Index Fund is not sponsored,endorsed, sold or promoted by the Nasdaq StockMarket Inc. (including its affiliates) (Nasdaq®, with itsaffiliates, are referred to as the “Corporations”). TheCorporations have not passed on the legality or suitabilityof, or the accuracy or adequacy of descriptions anddisclosures relating to, the Fund. The Corporations makeno representation or warranty, express or implied to theowners of the Fund or any member of the public regardingthe advisability of investing in securities generally or in theFund particularly, or the ability of the Nasdaq-100® Indexto track general stock market performance. The
Corporations’ only relationship to the VC I (Licensee) isthe licensing of the Nasdaq-100®, Nasdaq-100® Index,and Nasdaq® trademarks or service marks, and certaintrade names of the Corporations and the use of theNasdaq-100® Index which is determined, composed andcalculated by Nasdaq® without regard to Licensee or theFund. Nasdaq® has no obligation to take the needs of theLicensee or the owners of the Fund into consideration indetermining, composing or calculating the Nasdaq-100®
Index. The Corporations are not responsible for and havenot participated in the determination of the timing of,prices at, or quantities of the Fund to be issued or in thedetermination or calculation of the equation by which the
INVESTMENT GLOSSARY
- 162 -
Fund is to be converted into cash. The Corporations haveno liability in connection with the administration, marketingor trading of the Fund.
The Corporations do not guarantee the accuracy and/oruninterrupted calculation of the Nasdaq-100® Index orany data included herein. The Corporations make nowarranty, express or implied, as to results to be obtainedby Licensee, owners of the Fund, or any other person orentity from the use of the Nasdaq-100® Index or any dataincluded therein. The Corporations make no express orimplied warranties, and expressly disclaim all warrantiesof merchantability or fitness for a particular purpose oruse with respect to the Nasdaq-100® Index or any dataincluded therein. Without limiting any of the foregoing, inno event shall the Corporations have any liability for anylost profits or special, incidental, punitive, indirect, orconsequential damages, even if notified of the possibilityof such damages.
Additional Information About the Russell 2000® Index.The Russell 2000® Index is a trademark/service mark ofthe Frank Russell Trust Company. The Small Cap IndexFund is not promoted, sponsored or endorsed by, nor inany way affiliated with Frank Russell Company. FrankRussell Company is not responsible for and has notreviewed the Fund or any associated literature orpublications and makes no representation or warranty,express or implied, as to their accuracy, or completeness,or otherwise.
Additional Information About the S&P Indexes.“Standard & Poor’s®,” “S&P®,” “S&P 500®” and “S&PMidCap 400®” are trademarks of S&P. The Mid Cap IndexPPFund and Stock Index Fund are not sponsored, endorsed,sold or promoted by S&P, and S&P makes norepresentation regarding the advisability of investment insuch Funds.
INVESTMENT GLOSSARY
- 163 -

VC I Shares
VC I is an open-end management investment companyand may offer shares of the Funds for sale at any time.However, VC I offers shares of the Funds only toregistered and unregistered separate accounts of VALICand its affiliates and to qualifying retirement plans(previously defined as the “Plans”) and IRAs.
Buying and Selling Shares
As a participant in a Variable Contract, Plan, or IRA, youdo not directly buy shares of the Funds that make up VC I.Instead, you buy units in either a registered orunregistered separate account of VALIC or of its affiliatesor through a trust or custodial account under a Plan or anIRA. When you buy these units, you specify the Funds inwhich you want the separate account, trustee or custodianto invest your money. The separate account, trustee orcustodian in turn, buys the shares of the Funds accordingto your instructions. After you invest in a Fund, youparticipate in Fund earnings or losses in proportion to theamount of money you invest. When you provideinstructions to buy, sell, or transfer shares of the Funds,the separate account, trustee or custodian does not payany sales or redemption charges related to thesetransactions. The value of such transactions is based onthe next calculation of net asset value after the orders areplaced with the Fund.
For certain investors, there may be rules or proceduresregarding the following:
• any minimum initial investment amount and/orlimitations on periodic investments;
• how to purchase, redeem or exchange yourinterest in the Funds;
• how to obtain information about your account,including account statements; and
• any fees applicable to your account.
For more information on such rules or procedures, youshould review your Variable Contract prospectus, Plandocument or custodial agreement. The Funds do notcurrently foresee any disadvantages to participantsarising out of the fact that they may offer their shares toseparate accounts of various insurance companies toserve as the investment medium for their variable annuityand variable life insurance contracts. Nevertheless, theBoard of Directors intends to monitor events in order toidentify any material irreconcilable conflicts which maypossibly arise and to determine what action, if any, shouldbe taken in response to such conflicts. If such a conflictwere to occur, one or more insurance companies’separate accounts might be required to withdraw theirinvestments in the Funds and shares of another Fundmay
be substituted. This might force a Fund to sell portfoliosecurities at disadvantageous prices. In addition, VC Ireserves the right to refuse to sell shares of any Fund toany separate account, plan sponsor, trustee or custodian,or financial intermediary, or may suspend or terminate theoffering of shares of any Fund if such action is requiredby law or regulatory authority or is in the best interests ofthe shareholders of the Fund.
Execution of requests. VC I is open on those days whenthe New York Stock Exchange is open for regular trading.Buy and sell requests are executed at the next net assetvalue (“NAV”) to be calculated after the request isaccepted by VC I. If the order is received by VC I, or theinsurance company as its authorized agent, before VC I’sclose of business (generally 4:00 p.m., Eastern time), theorder will receive that day’s closing price. If the order isreceived after that time, it will receive the next businessday’s closing price.
Normally, VC I redeems Fund shares within seven dayswhen the request is received in good order, but maypostpone redemptions beyond seven days when: (i) theNew York Stock Exchange is closed for other thanweekends and customary holidays, or trading on theNew York Stock Exchange becomes restricted; (ii) anemergency exists making disposal or valuation of theFund’s assets not reasonably practicable; or (iii) the SEChas so permitted by order for the protection of VC I’sshareholders. For these purposes, the SEC determinesthe conditions under which trading shall be deemed to berestricted and an emergency shall be deemed to exist.The New York Stock Exchange is closed on the followingholidays: New Year’s Day, Martin Luther King, Jr. Day,Washington’s Birthday (observed), Good Friday, MemorialDay, Independence Day, Labor Day, Thanksgiving Dayand Christmas.
Your redemption proceeds typically will be sent withinthree business days after your request is submitted, but inany event, within seven days. Under normalcircumstances, VC I expects to meet redemption requestsby using cash or cash equivalents in a Fund’s portfolio orby selling portfolio assets to generate cash. Duringperiods of stressed market conditions, a Fund may bemore likely to limit cash redemptions and may determineto pay redemption proceeds by borrowing under a line ofcredit.
Frequent or Short-term Trading
The Funds, which are offered only through Contracts,Plans or IRAs, is intended for long-term investment andnot as a frequent short-term trading (“market timing”)vehicle. Accordingly, organizations or individuals that use
ACCOUNT INFORMATION
- 164 -

market timing investment strategies and make frequenttransfers or redemptions should not purchase shares ofthe Funds. The Board of Directors has adopted policiesand procedures with respect to market timing activity asdiscussed below. VC I believes that market timing activityis not in the best interest of the participants of the Funds.Due to the disruptive nature of this activity, it can adverselyimpact the ability of the Subadvisers to invest assets in anorderly, long-term manner. In addition, market timing candisrupt the management of the Fund and raise itsexpenses through: increased trading and transactioncosts; forced and unplanned portfolio turnover; and largeasset swings that decrease the Funds’ ability to providemaximum investment return to all participants. This in turncan have an adverse effect on Fund performance.
The Funds, directly or through certain Underlying Funds,may invest in foreign securities and/or high yield fixedincome securities (“junk bonds”), so it may be particularlyvulnerable to market timing. Market timing in a Fund thatinvests significantly in foreign securities may occurbecause of time zone differences between the foreignmarkets on which the Fund’s international portfoliosecurities trade and the time as of which the Fund’s netasset value is calculated. Market timing in a Fund thatinvests significantly in junk bonds may occur if marketprices are not readily available for a Fund’s junk bondholdings. Market timers might try to purchase shares ofthe Funds based on events occurring after foreign marketclosing prices are established but before calculation of theFund’s net asset value, or if they believe market prices forjunk bonds are not accurately reflected by the Fund. Oneof the objectives of VC I’s fair value pricing procedures isto minimize the possibilities of this type of market timing(see “How Shares are Valued”).
Shares of the Funds are generally held through insurancecompany separate accounts, Plans or through a trust orcustodial account (“Financial Intermediaries”). The abilityof VC I to monitor transfers made by the participants inseparate accounts or Plans maintained by financialintermediaries is limited by the institutional nature ofFinancial Intermediaries’ omnibus accounts. VC I’s policyis that the Funds will rely on the Financial Intermediariesto monitor market timing within the Funds to the extent thatVC I believes that each Financial Intermediary’s practicesare reasonably designed to detect and deter transactionsthat are not in the best interest of the Funds.
There is no guarantee that VC I will be able to detectmarket timing activity or the participants engaged in suchactivity, or, if it is detected, to prevent its recurrence.Whether or not VC I detects it, if market timing occurs,then you should anticipate that you will be subject to thedisruptions and increased expenses discussed above. In
situations in which VC I becomes aware of possiblemarket timing activity, it will notify the FinancialIntermediary in order to help facilitate the enforcement ofsuch entity’s market timing policies and procedures. VC Ihas entered into agreements with various FinancialIntermediaries that require such intermediaries to providecertain information to help identify frequent trading activityand to prohibit further purchases or exchanges by aparticipant identified as having engaged in frequenttrades. VC I reserves the right, in its sole discretion andwithout prior notice, to reject, restrict or refuse purchaseorders received from a Financial Intermediary, whetherdirectly or by transfer, including orders that have beenaccepted by a Financial Intermediary, that VC Idetermines not to be in the best interest of the Fund. Suchrejections, restrictions or refusals will be applied uniformlywithout exception.
You should review your Contract prospectus, Plandocument or custodial agreement for more informationregarding market timing, including any restrictions,limitations or fees that may be charged on trades madethrough a Contract, Plan or IRA. Any restrictions orlimitations imposed by the Contract, Plan or IRAmay differfrom those imposed by VC I.
Payments in Connection with Distribution
VALIC and its affiliates may receive revenue sharingpayments from certain Subadvisers to the Funds (otherthan SunAmerica, an affiliated investment adviser) inconnection with certain administrative, marketing andother servicing activities, which payments help offsetcosts for education, marketing activities and training tosupport sales of the Funds, as well as occasional gifts,entertainment or other compensation as incentives.Payments may be derived from investment managementfees received by the subadvisers.
Selective Disclosure of Portfolio Holdings
VC I’s policies and procedures with respect to thedisclosure of the Funds’ portfolio securities are describedin the SAI.
How Shares are Valued
The NAV for a Fund is determined each business day atthe close of regular trading on the New York StockExchange (generally 4:00 p.m., Eastern Time) by dividingthe net assets of the Fund by the number of outstandingshares. The NAV for each Fund also may be calculated onany other day in which there is sufficient liquidity in thesecurities held by the Fund. As a result, the value of theFund’s shares may change on days when you will not beable to purchase or redeem your shares. Investments for
ACCOUNT INFORMATION
- 165 -

which market quotations are readily available are valuedat their market price as of the close of regular trading onthe New York Stock Exchange for the day, unless, inaccordance with pricing procedures approved by theBoard of Directors, the market quotations are determinedto be unreliable. Securities and other assets for whichmarket quotations are unavailable or unreliable are valuedat fair value in accordance with pricing proceduresperiodically approved by the Board. There is no singlestandard for making fair value determinations, which mayresult in prices that vary from those of other funds. Inaddition, there can be no assurance that fair value pricingwill reflect actual market value and it is possible that thefair value determined for a security may differ materiallyfrom the value that could be realized upon the sale of thesecurity.
Investments in registered investment companies that donot trade on an exchange are valued at the end of the daynet asset value per share. Investments in registeredinvestment companies that trade on an exchange arevalued at the last sales price or official closing price as ofthe close of the customary trading session on theexchange where the security principally traded. Theprospectus for any such open-end funds should explainthe circumstances under which these funds use fair valuepricing and the effect of using fair value pricing.
As of the close of regular trading on the New York StockExchange, securities traded primarily on securityexchanges outside the United States are valued at the lastsale price on such exchanges on the day of valuation or ifthere is no sale on the day of valuation, at the last reportedbid price. If a security’s price is available from more thanone exchange, a Fund uses the exchange that is theprimary market for the security. However, depending onthe foreign market, closing prices may be up to 15 hoursold when they are used to price a Fund’s shares, and aFund may determine that certain closing prices do notreflect the fair value of a security. This determination willbe based on review of a number of factors, includingdevelopments in foreign markets, the performance of U.S.securities markets, and the performance of instrumentstrading in U.S. markets that represent foreign securitiesand baskets of foreign securities. If the Fund determinesthat closing prices do not reflect the fair value of thesecurities, the Fund will adjust the previous closing pricesin accordance with pricing procedures approved by theBoard of Directors to reflect what it believes to be the fairvalue of the securities as of the close of regular tradingon the New York Stock Exchange. The Fund may also fairvalue securities in other situations, for example, when aparticular foreign market is closed but the Fund is open.
For foreign equity securities and foreign equity futurescontracts, the Fund uses an outside pricing service toprovide it with closing market prices and information usedfor adjusting those prices.
Certain Funds may invest in securities that are primarilylisted on foreign exchanges that trade on weekends orother days when the Fund does not price its shares. As aresult, the value of such foreign securities may change ondays when the Funds are not open to purchases orredemptions. The securities held by the GovernmentMoney Market I Fund are valued at amortized cost, whichapproximates market value. The amortized cost methodinvolves valuing a security at its cost on the date ofpurchase and thereafter assuming a constantamortization to maturity of any discount or premium. Inaccordance with Rule 2a-7 under the 1940 Act, the Boardhas adopted procedures intended to stabilize theGovernment Money Market I Fund’s net asset value pershare at $1.00. These procedures include thedetermination, at such intervals as the Board deemsappropriate and reasonable in light of current marketconditions, of the extent, if any, to which the Fund’smarket-based net asset value per share deviates from theFund’s amortized cost per share. For purposes of thesemarket-based valuations, securities for which marketquotations are not readily available are fair valued, asdetermined pursuant to procedures adopted in good faithby the Board.
During periods of extreme volatility or market crisis, theFund may temporarily suspend the processing of sellrequests or may postpone payment of proceeds for up toseven business days or longer, or as allowed by federalsecurities laws.
Dividends and Capital Gains
Dividends from Net Investment IncomeFor each Fund, dividends from net investment income aredeclared and paid annually, except for the GovernmentMoney Market I Fund, which declares daily and paysdividends monthly. Dividends from net investment incomeare automatically reinvested for you into additional sharesof the Fund.
Distributions from Capital GainsWhen the Fund sells a security for more than it paid forthat security, a capital gain results. For each Fund,distributions from capital gains, if any, are normallydeclared and paid annually. Distributions from capitalgains are automatically reinvested for you into additionalshares of the Fund.
ACCOUNT INFORMATION
- 166 -
Tax Consequences
As the owner of a Variable Contract, a participant underyour employer’s Variable Contract or Plan or as an IRAaccount owner, you will not be directly affected by thefederal income tax consequences of distributions, sales orredemptions of Fund shares. You should consult yourVariable Contract prospectus, Plan document, custodialagreement or your tax professional for further informationconcerning the federal income tax consequences to youof investing in the Funds.
The Funds will annually designate certain amounts oftheir dividends paid as eligible for the dividend receiveddeduction. If the Funds incur foreign taxes, they will electto pass-through allowable foreign tax credits. Thesedesignations and elections will benefit VALIC, inpotentially material amounts, and will not beneficially oradversely affect you or the Funds. The benefits to VALICwill not be passed to you or the Funds.
ACCOUNT INFORMATION
- 167 -
Investment Adviser
VALIC is a stock life insurance company which has beenin the investment advisory business since 1960 and is theinvestment adviser for each of the Funds. VALIC is anindirect wholly-owned subsidiary of AmericanInternational Group, Inc. (“AIG”). AIG is a holdingcompany which through its subsidiaries is engaged in abroad range of insurance and insurance-related activitiesand financial services in the United States and abroad.
VALIC is located at 2929 Allen Parkway, Houston, Texas77019.
VALIC serves as investment adviser through anInvestment Advisory Agreement with VC I. As investmentadviser, VALIC oversees the day-to-day operations ofeach Fund and supervises the purchase and sale of Fundinvestments. VALIC employs investment subadvisers whomake investment decisions for the Funds.
The investment advisory agreement between VALIC andVC I provides for VC I to pay all expenses not specificallyassumed by VALIC. Examples of the expenses paid byVC I include transfer agency fees, custodial fees, the feesof outside legal and auditing firms, the costs of reports toshareholders and expenses of servicing shareholderaccounts. These expenses are allocated to each Fund ina manner approved by the Board of Directors. For moreinformation on these agreements, see the “InvestmentAdviser” section in the SAI.
Investment Subadvisers
VALIC works with investment subadvisers for each Fund.Subadvisers are financial services companies thatspecialize in certain types of investing. The subadviser’srole is to make investment decisions for the Fundaccording to each Fund’s investment objective andrestrictions. VALIC compensates the subadvisers out ofthe fees it receives from each Fund.
According to the agreements VALIC has with theSubadvisers, VALIC will receive investment advice foreach Fund. Under these agreements VALIC gives theSubadvisers the authority to buy and sell securities for thesubadvised Funds. However, VALIC retains theresponsibility for the overall management of these Funds.The Subadvisers may buy and sell securities for eachFund with broker-dealers and other financialintermediaries that they select. The Subadvisers mayplace orders to buy and sell securities of these Funds witha broker-dealer affiliated with the Subadvisers, as allowedby law. This could include any affiliated futurescommission merchants.
The 1940 Act permits the Subadvisers, under certainconditions, to place an order to buy or sell securities withan affiliated broker. One of these conditions is that thecommission received by the affiliated broker cannot begreater than the usual and customary brokers commissionif the sale was completed on a securities exchange. VC Ihas adopted procedures, as required by the 1940 Act,which provide that any commissions received by asubadviser’s affiliated broker may be consideredreasonable and fair if compared to the commissionreceived by other brokers for the same type of securitiestransaction.
The Securities Exchange Act of 1934 prohibits membersof national securities exchanges from effecting exchangetransactions for accounts that they or their affiliatesmanage, except as allowed under rules adopted by theSEC. VC I and the Subadvisers have entered into writtencontracts, as required by the 1940 Act, to allow thesubadviser’s affiliate to effect these types of transactionsfor commissions. The 1940 Act generally prohibits asubadviser or the subadviser’s affiliate, acting as principal,from engaging in securities transactions with a Fund,without an exemptive order from the SEC.
VALIC and the Subadvisers may enter into simultaneouspurchase and sale transactions for the Funds or affiliatesof the Funds.
In selecting the Subadvisers, the Board of Directorscarefully evaluated: (i) the nature and quality of theservices expected to be rendered to the Fund(s) by thesubadviser; (ii) the distinct investment objective andpolicies of the Fund(s); (iii) the history, reputation,qualification and background of the subadvisers’personnel and its financial condition; (iv) its performancetrack record; and (v) other factors deemed relevant. TheBoard of Directors also reviewed the fees to be paid byVALIC to each subadviser. The subadvisory fees are notpaid by the Funds. A discussion of the basis for the Boardof Directors’ approval of the investment subadvisoryagreements is available in VC I’s most recent semi-annualreport for the period ended November 30, 2019. Forinformation on obtaining an annual or semi-annual reportto shareholders, see the section “Interested in LearningMore.”
VC I relies upon an exemptive order from the SEC whichpermits VALIC, subject to certain conditions, to select newunaffiliated subadvisers or replace existing subadviserswith an unaffiliated subadviser without first obtainingshareholder approval for the change. The Board ofDirectors, including a majority of the independentDirectors, must approve each new subadvisory
MANAGEMENT
- 168 -

agreement. This allows VALIC to act more quickly tochange subadvisers when it determines that a change isbeneficial by avoiding the delay of calling and holdingshareholder meetings to approve each change. Inaccordance with the exemptive order, VC I will provideinvestors with information about each new subadviser andits subadvisory agreement within 90 days of hiring thenew subadviser. VALIC is responsible for selecting,monitoring, evaluating and allocating assets to thesubadvisers and oversees the subadvisers’ compliancewith the relevant Fund’s investment objective, policies andrestrictions.
The SAI provides information regarding the portfoliomanagers listed below, including other accounts theymanage, their ownership interest in the Fund(s) that theyserve as portfolio manager, and the structure and methodused by the subadviser to determine their compensation.
The Subadvisers are:
AllianceBernstein L.P.Allianz Global Investors U.S. LLCBlackRock Investment Management, LLCBridgeway Capital Management, Inc.Columbia Management Investment Advisers, LLCFranklin Advisers, Inc.Goldman Sachs Asset Management, L.P.Invesco Advisers, Inc.Janus Capital Management LLCJ.P. Morgan Investment Management Inc.Massachusetts Financial Services CompanyMorgan Stanley Investment Management Inc.PineBridge Investments LLCSunAmerica Asset Management, LLCT. Rowe Price Associates, Inc.Templeton Investment Counsel, LLCVictory Capital Management Inc.Wellington Management Company LLPWells Capital Management Incorporated
Dynamic Allocation Fund
AllianceBernstein L.P. (“AllianceBernstein”)
1345 Avenue of the AmericasNew York, NY 10105
AllianceBernstein is a Delaware limited partnership.AllianceBernstein is a leading global investmentmanagement firm. AllianceBernstein providesmanagement services for many of the largest U.S. publicand private employee benefit plans, endowments,foundations, public employee retirement funds, banks,insurance companies and high net worth individuals
worldwide. AllianceBernstein is also one of the largestmutual fund sponsors, with a diverse family of globallydistributed mutual fund portfolios.
As of May 31, 2020, AllianceBernstein had approximately$596.3 million in assets under management.
The Fund is managed by Joshua Lisser and Ben Sklar.Mr. Lisser joined AllianceBernstein in 1992 and iscurrently Chief Investment Officer of Index Strategies andmember of the Core/Blend Services investment team.Mr. Sklar joined AllianceBernstein in 2006 and is currentlya Portfolio Manager of Index Strategies.
Mid Cap Strategic Growth FundScience & Technology Fund
Allianz Global Investors U.S. LLC (“AllianzGI”)
1633 Broadway, New York, NY 10019
AllianzGI is an indirect wholly owned subsidiary of AllianzSE. As of June 30, 2020, AllianzGI had $106.5 billion intotal assets under management and advice.
A portion of the assets of the Mid Cap Strategic GrowthFund is managed by Steven Klopukh, CFA and TimMcCarthy, CFA. Mr. Klopukh has been with AllianzGIthrough a predecessor firm since 2002 and is a Directorand senior portfolio manager at AllianzGI. He has beenresponsible for managing U.S. mid-cap growth and coreequity portfolios for AllianzGI since 2004. Mr. McCarthy isa portfolio manager and Director with AllianzGI, which hejoined in 2003. He is responsible for managing mid-capportfolios for AllianzGI and focuses on the financial sectorand several industries within industrials, materials andenergy.
A portion of the assets of the Science & Technology Fundis managed by Walter C. Price, Jr., CFA, Huachen Chen,CFA and Michael A Seidenberg. Mr. Price, ManagingDirector and Portfolio Manager, joined AllianzGI through apredecessor firm in 1974 as a Senior Portfolio SecuritiesAnalyst and became a principal in 1978. Mr. Price hasanalytical responsibility for much of AllianzGI’stechnology area and has extensive experience inmanaging technology portfolios. Mr. Chen, ManagingDirector and Senior Portfolio Manager, joined AllianzGIthrough a predecessor firm in 1984 as a SecuritiesAnalyst. He became a principal in 1994 and currently hasresearch and money management responsibilities for thetechnology area. Since 1990, he has had extensiveportfolio responsibilities related to technology and capitalgoods stocks. Mr. Seidenberg is a portfolio manager, ananalyst and a director with AllianzGI, which he joined
MANAGEMENT
- 169 -

through a predecessor firm in 2009. He is a member of theGlobal Technology team in the US. Mr. Seidenbergentered the investment management industry in 2001.
Core Equity Fund
Dividend Value Fund
Growth Fund
BlackRock Investment Management, LLC(“BlackRock”)
1 University Square Drive, Princeton, NJ 08540
BlackRock is an indirect, wholly-owned subsidiary ofBlackRock, Inc. BlackRock and its affiliates offer a fullrange of equity, fixed income, cash management andalternative investment products with strong representationin both retail and institutional channels, in the U.S. and innon-U.S. markets. As of June 30, 2020, the assets undermanagement of BlackRock, Inc. (including itssubsidiaries) were $7.3 trillion.
The Core Equity Fund is managed by BlackRock’s U.S.Income & Value Team.
Todd Burnside, Director, is a member of the FundamentalActive Equity division of BlackRock’s Active EquitiesGroup. Mr. Burnside is a portfolio manager on the USIncome & Value Team. Previously, he had responsibility forfundamental research coverage of US large cap equities,with a focus on the Consumer Discretionary, Financialsand Telecommunications sectors. Mr. Burnside joinedBlackRock in 2008. Previously, he was an analyst withMorgan Stanley Investment Management from 2003 to2008, where he was responsible for covering US large capindustrials and consumer stocks. Prior to that, he was asoftware equity analyst with Prudential Securities from1999 to 2001. He began his career as an analyst withNasdaq-Amex in 1997. Mr. Burnside earned a BS degreein Finance fromPenn State University in 1997 and anMBAdegree in Finance from New York University in 2003.
Joseph Wolfe, CFA, CQF, FRM, Director is a member ofthe Fundamental Active Equity division of BlackRock’sActive Equities Group. Mr. Wolfe is a portfolio manager onthe US Income & Value Team. Previously, he was the LeadQuantitative Analyst for the Large Cap Series Team. Priorto this role, he served as the head of the QuantitativeAlpha Research Group. Before joining BlackRock in 2012,Mr. Wolfe was the head of Quantitative Active Research atNorthern Trust in Chicago where he directed quantitativeresearch across the active equity teams, developed ETFstrategies for FlexShares and co-managed several activemutual funds. Prior to joining Northern Trust in 2005,Mr. Wolfe was a senior quantitative analyst for the State
Teachers Retirement System of Ohio where he co-managed several quantitative strategies and served as arisk manager. Mr. Wolfe earned a BS degree in Economicsfrom Slippery Rock University and holds advanceddegrees in Economics from Kent State University and theOhio State University. He is also a Chartered FinancialAnalyst and Certified Financial Risk Manager, and hasobtained his Certificate in Quantitative Finance.
A portion of the assets of the Dividend Value Fund ismanaged by a team of BlackRock portfolio managerscomprised of Tony DeSpirito, David Zhao and FrancoTapia. Mr. DeSpirito is a Managing Director and portfoliomanager at BlackRock. Prior to joining BlackRock in2014, he was Managing Principal, a portfolio managerand member of the Executive Committee of PzenaInvestment Management for 5 years. Mr. Zhao is aManaging Director and portfolio manager at BlackRock.Prior to joining BlackRock in 2016, he was Global EquitySenior Research Analyst and Principal at PzenaInvestment Management for 11 years. Mr. Tapia is aManaging Director and portfolio manager at BlackRock.Prior to joining BlackRock in 2016, he was Global EquitySenior Research Analyst and Principal at PzenaInvestment Management for 11 years.
A portion of the assets of theGrowth Fund is managed byLawrence Kemp, CFA and Philip H. Ruvinsky, CFA.
Lawrence Kemp, CFA is a Managing Director and portfoliomanager, and is head of BlackRock’s Fundamental LargeCap Growth team. He is a member of the FundamentalEquity platform within the Fundamental Equity division ofBlackRock’s Alpha Strategies Group. Prior to joiningBlackRock, Mr. Kemp was at UBS Global AssetManagement, where he managed the Laudus GrowthInvestors U.S. Large Cap Select Growth Fund (LGILX), aswell as both diversified and concentrated U.S. large capgrowth institutional equity portfolios against the Russell1000 Growth and S&P 500 indexes. Mr. Kemp joined theGrowth Equity team at UBS Global Asset Management in2001, but his tenure with the firm dated back to 1992. Heheld various roles including chief investment strategist,co-head of fixed income and global head of high yieldresearch. Mr. Kemp holds a BA from Stanford Universityand an MBA from the University of Chicago.
Philip H. Ruvinsky, CFA, Managing Director, is a memberof the Fundamental Equity division of BlackRock’s AlphaStrategies Group. He is the portfolio manager of theBlackrock Mid-Cap Growth Equity Fund and a co-PM onBlackRock’s large cap growth strategies. Prior to joiningBlackRock in 2013, Mr. Ruvinsky was a sector head andresearch analyst at Sureview Capital LLC from 2010 to2013, where he was the sector head for the global
MANAGEMENT
- 170 -

internet, media and telecom sectors. He began hisinvestment career with UBS Global Asset Management in2002 where, most recently, he was a portfolio managerand investment analyst with primary researchresponsibility for internet, consumer and health caresectors. Mr. Ruvinsky started his career as an attorney forSkaden, Arps, Slate, Meagher & Flom. Mr. Ruvinskyreceived a BA degree in economics from the University ofTexas, a JD degree from the University of Michigan LawSchool and an MBA degree from Columbia BusinessSchool.
Small Cap Fund
Bridgeway Capital Management, Inc. (“Bridgeway”)
20 Greenway Plaza, Suite 450, Houston, Texas 77046
Bridgeway provides investment management services toinstitutions, registered investment companies (“mutualfunds” or “funds”), high net worth individuals, pension andprofit sharing plans, corporations, trusts, estates,charitable/non-profit organizations, collective investmenttrusts and government entities. As of May 31, 2020Bridgeway had approximately $5.011 billion in assetsunder management.
A portion of the assets of the Small Cap Fund is managedby a team of Bridgeway’s portfolio managers led by JohnMontgomery and including Elena Khoziaeva, MichaelWhipple and Christine L. Wang. All team members shareresponsibilities for portfolio management, investmentresearch and statistical modeling. Mr. Montgomery isfounder, Chief Investment Officer and Portfolio Managerof Bridgeway. Ms. Khoziaeva, CFA, is a Portfolio Managerand began working at Bridgeway in 1998. Mr. Whipple,CFA, is a Portfolio Manager and began working atBridgeway in 2002. Ms.Wang, CFA, is a Portfolio Managerand began working at Bridgeway in 2008.
Large Cap Core Fund
Columbia Management Investment Advisers, LLC(“Columbia”)
225 Franklin Street, Boston, MA 02110
Columbia is a registered investment adviser and a wholly-owned subsidiary of Ameriprise Financial, Inc. Columbia’smanagement experience covers all major asset classes,including equity securities, debt instruments and moneymarket instruments. In addition to serving as aninvestment adviser to traditional mutual funds, exchange-traded funds and closed-end funds, Columbia acts as an
investment manager for itself, its affiliates, individuals,corporations, retirement plans, private investmentcompanies and financial intermediaries. Columbiamanaged $342,859,767 million in assets as of June 30,2020.
The Large Cap Core Fund is managed by Guy W. Pope,CFA. Mr. Pope is a Senior Portfolio Manager and Head ofContrarian Core Strategy for Columbia. Mr. Pope beganhis investment career in 1993.
Global Strategy Fund
Franklin Advisers, Inc. (“Franklin Advisers”)
One Franklin Parkway, San Mateo, California 94403-1906
Franklin Advisers is a wholly-owned subsidiary of FranklinResources, Inc. (referred to as “Franklin TempletonInvestments”), a publicly owned company engaged in thefinancial services industry through its subsidiaries. As ofMay 31, 2020, Franklin Templeton Investments managedapproximately $617.6 billion in assets composed ofmutual funds and other investment vehicles for individuals,institutions, pension plans, trusts and partnerships in 128countries.
The team responsible for managing the debt portion of theFund is Michael Hasenstab and Christine Yuhui Zhu. Theteam responsible for managing the equity portion of theFund is Chandra Seethamraju and Sundaram Chettiapan.
Dr. Hasenstab first worked for Franklin Templeton from1995 to 1998, rejoining again in 2001 after a three-yearleave to obtain his Ph.D. Dr. Hasenstab is Executive VicePresident, Portfolio Manager and Chief Investment Officerfor Templeton Global Macro. He has primary responsibilityfor the debt investments of the Fund and has finalauthority over all aspects of the Fund’s debt investmentportfolio. The degree to which he may perform his dutiesmay change from time-to-time. Ms. Zhu is PortfolioManager, Vice President, Director of PortfolioConstruction and Quantitative Analysis for TempletonGlobal Macro. She focuses on portfolio construction,derivatives/quantitative strategies in global market,performance attribution and risk management. Ms. Zhujoined Franklin Templeton in 2007.
Dr. Seethamraju is the head of smart beta and overlaystrategies at Franklin SystematiQ, the quantitative hub ofFranklin Templeton Multi-Asset Solutions.Dr. Seethamraju joined Franklin Templeton Investments in
MANAGEMENT
- 171 -
2013. Mr. Chettiappan is a vice president and seniorresearch analyst for Franklin SystematiQ. Mr. Chettiappanjoined Franklin Templeton Investments in 2018.
Global Real Estate FundSmall-Mid Growth FundSystematic Core Fund
Goldman Sachs Asset Management, L.P. (“GSAM”)
200 West Street New York, NY 10282
GSAM has been registered as an investment adviser withthe SEC since 1990 and is an affiliate of Goldman Sachs& Co. LLC (“Goldman”). As of June 30, 2020, GSAM,including its investment advisory affiliates, had assetsunder management of approximately $1.8 trillion in totalassets under supervision. Assets under supervisioninclude assets under management and other client assetsfor which Goldman does not have full discretion.
GSAM manages the portion of the Global Real EstateFund that invests in international real estate securities.GSAM’s portion is managed by Frankie Chun Wah Leeand Abhinav Zutshi, CFA. Mr. Lee is a Vice President andPortfolio Manager on GSAM’s Real Estate Securitiesteam and has been with GSAM since 2010. Prior to joiningGSAM, Mr. Lee worked at Henderson Global Investorsfrom 2006 to 2010 where he managed the Asia-Pacificreal estate securities portfolio. Mr. Zutshi is a PortfolioManager on the Global Real Assets team and has beenwith GSAM since 2009. Prior to joining GSAM, Mr. Zutshiworked as a software consultant at Zensar Technologiesfor two years from 2005.
Mr. Steven M. Barry, Mr. Greg Tuorto and Ms. Jessica Katzmanage the Small-Mid Growth Fund. Mr. Barry, ManagingDirector, Chief Investment Officer and Co-Lead PortfolioManager, joined GSAM in 1999. Mr. Barry became ChiefInvestment Officer of Fundamental Equity U.S. Equity in2009. From 1988 to 1999, he was a portfolio manager atAlliance Capital. Mr. Tuorto has 26 years of investmentexperience and was most recently a portfolio manager atJ.P. Morgan Asset Management. Mr. Tuorto has extensivePPexpertise in small cap growth and technology portfolios,which he has managed in various roles throughout hiscareer. Ms. Katz, Vice President and Co-Lead PortfolioManager, joined GSAM in 2015. Ms. Katz has 13 years ofinvestment experience.
The team responsible for managing the Systematic CoreFund is Khalid (Kal) Ghayur, Ronan G. Heaney andStephen C. Platt.
Mr. Ghayur is the head of the ActiveBeta Equity Strategiesbusiness within GSAM’s Smart Beta Strategies Platform,
overseeing the team’s customized, factor-based equityportfolios. Mr. Ghayur joined GSAM as a ManagingDirector upon GSAM’s acquisition of Westpeak GlobalAdvisors (“Westpeak”) in June 2014. Prior to joiningGSAM, Mr. Ghayur was the Managing Partner and ChiefInvestment Officer of Westpeak, a pioneer in the smartbeta space with their patented ActiveBeta investmentmethodology.
Prior to joining Westpeak in 2007, Mr. Ghayur was theDirector of Research Policy at MSCI in New York, wherehe was a member of its Global Executive Committee andChairman of the MSCI Index Policy Committee. In thatcapacity, Mr. Ghayur was responsible for MSCI’s globalmarkets and benchmarking research and new productdevelopment. From 1994 to 2000, Mr. Ghayur was GlobalHead of Quantitative Research and Strategy for HSBCAsset Management in London, where he was responsiblefor the development and application of strategic andtactical asset allocation, fixed income modeling, stockselection techniques, portfolio construction and analysis,and risk management. From 1992 to 1994, Mr. Ghayurwas a Senior Quantitative Analyst at Credit LyonnaisAsset Management in Paris, and from 1987 to 1991, heheld the position of Portfolio Manager at Union NationalBank in Abu Dhabi, where he was responsible formanaging the bank’s UK and US investment portfolios.
Mr. Ghayur has served on the Board of Governors of theCFA Institute, the Board’s Nominating Committee, and asChairman of the Board’s External Relations and VolunteerInvolvement Committee. He is a former trustee of the CFAInstitute Research Foundation. Mr. Ghayur was a memberof the Editorial Board of Financial Analysts Journal andwas founding President of the UK Society of InvestmentProfessionals. Mr. Ghayur received an MBA in Financeand International Business from the École Nationale desPonts et Chaussées, Paris, and an MA and BA inEconomics from the University of Karachi. He is a CFAcharterholder, a member of the CFA Institute, and a Fellowof the Society of Investment Professionals (“FSIP”). He isalso a Diplomaed Associate of the Institute of BankersPakistan.
Mr. Heaney is the head of research for the ActiveBetaEquity Strategies business within GSAM’s Smart BetaStrategies Platform. He is responsible for investmentresearch activities, including improving quantitativeinvestment models and portfolio constructionmethodologies and identifying and testing new modelcomponents and implementation techniques. Mr. Heaneyjoined GSAM following GSAM’s acquisition of Westpeakin June 2014. Prior to joining GSAM, Mr. Heaney was theDirector of Research for Westpeak, pioneering
MANAGEMENT
- 172 -
Westpeak’s patent Methods and Systems for Building andManaging Portfolios based on Ordinal Ranks ofSecurities.
Prior to joining Westpeak in 1998, Mr. Heaney wasemployed by Multum Information Services in Denver,Colorado, as a Software Architect. From 1992 to 1996, heheld the position of Senior Software Developer at SwissBank Corporation in Chicago. Mr. Heaney received an MSin Computer Science from Purdue University, where hewas awarded a Fulbright Fellowship, and a BS in AppliedPhysics from Dublin University, Ireland.
Mr. Platt is a senior portfolio manager for the ActiveBetaEquity Strategies business within GSAM’s Smart BetaStrategies Platform. He is responsible for portfoliomanagement, including portfolio construction and riskmanagement of global developed and emerging marketequity portfolios and custom indexes. Mr. Platt joinedGSAM following GSAM’s acquisition of Westpeak in June2014. Prior to joining GSAM, Mr. Platt oversaw themanagement of $10 billion in client assets in a variety ofglobal quantitative investment strategies, includingdomestic and international long-only, enhanced index,active extension (130/30) and amarket neutral hedge fundat Westpeak.
Prior to joining Westpeak in 1999, Mr. Platt was cofounderand Senior Vice President of Cordillera AssetManagement in Denver, Colorado. Mr. Platt’s career in theinvestment industry began in 1989, and he has been aninstitutional quantitative equity portfolio manager since1992. Mr. Platt received a BS in Finance from theUniversity of Colorado, Boulder. He is a CFA charterholderand a member of the CFA Institute and the CFA Society ofColorado.
Global Real Estate Fund
Invesco Advisers, Inc. (“Invesco”)
1555 Peachtree Street, N.E., Atlanta, Georgia 30309
Invesco, as successor in interest to multiple investmentadvisers, has been an investment adviser since 1976 andis an indirect, wholly owned subsidiary of Invesco Ltd., apublicly traded company that, through its subsidiaries,engages in the business of investment management onan international basis. As of June 30, 2020, Invesco hadapproximately $1,145.2 billion in assets undermanagement.
Invesco Asset Management Limited (“IAML”) serves assub-subadvisor to the Fund, with its principal office atPerpetual Park, Perpetual Park Drive, Henley-on-Thames,Oxfordshire, RG9 1HH, United Kingdom. IAML is anaffiliate of Invesco and is compensated by Invesco at no
additional expense to the Trust. Day-to-day investmentmanagement decisions for the Fund are made by Invesco.The sub-Subadviser is responsible for choosing certaintypes of real estate securities for the Fund.
The following individuals are jointly responsible for theday-to-day management of the Global Real Estate Fund:Joe Rodriguez, Jr. (Co-Lead Portfolio Manager), MarkBlackburn, Paul Curbo, (Co-Lead Portfolio Manager),Ping-Ying Wang, Darin Turner, James Cowen and GrantJackson (Co-Lead Portfolio Manager).
Mr. Rodriguez, Co-Lead Portfolio Manager, has been CIOof Invesco’s Listed Real Assets Team since 1995 and hasbeen associated with Invesco and/or its affiliates since1990. Mr. Blackburn, Portfolio Manager, is a member ofInvesco’s Listed Real Assets Team and has beenassociated with Invesco and/or its affiliates since 1998.Mr. Curbo, Co-Lead Portfolio Manager, is a member ofInvesco’s Listed Real Assets Team and has beenassociated with Invesco and/or its affiliates since 1998.Ms. Wang, Portfolio Manager, is a member of Invesco’sListed Real Assets Team and has been associated withInvesco and/or its affiliates since 1998. Mr. Turner,Portfolio Manager, is a member of Invesco’s Listed RealAssets Team and has been associated with Invesco and/or its affiliates since 2005. Mr. Cowen, Portfolio Manager,has been associated with Invesco and/or its affiliatessince 2000. Mr. Grant Jackson, Co-Lead PortfolioManager, is a member of Invesco’s Listed Real AssetsTeam and has been associated with Invesco and/or itsaffiliates since 2005.
Mid Cap Strategic Growth Fund
Janus Capital Management LLC (“Janus”)
151 Detroit Street, Denver, CO 80206
Janus is an indirect subsidiary of Janus Henderson Groupplc., a publicly traded company with principal operations infinancial asset management businesses that hadapproximately $336.7 billion in assets under managementas of June 30, 2020. Janus (together with itspredecessors) has served as an investment adviser since1970.
Co-Portfolio Managers Brian Demain and Cody Wheatonare responsible for the day-to-day management of theFund. Mr. Demain, as lead Portfolio Manager, has theauthority to exercise final decision-making on the overallportfolio.
Brian Demain, CFA, is Executive Vice President and Co-Portfolio Manager of Enterprise Portfolio, which he hasmanaged or co-managed since November 2007.Mr. Demain is also Portfolio Manager of other Janus
MANAGEMENT
- 173 -

accounts. He joined Janus Capital in 1999 as a securitiesanalyst. Mr. Demain holds the Chartered Financial Analystdesignation.
Cody Wheaton, CFA, is Executive Vice President and Co-Portfolio Manager of Enterprise Portfolio, which he hasco-managed since July 2016. Mr. Wheaton is alsoPortfolio Manager of other Janus accounts and performsduties as a research analyst. He joined Janus Capital in2001 as a research analyst. Mr. Wheaton holds theChartered Financial Analyst designation.
Emerging Economies FundGovernment Securities Fund
Small Cap Fund
J.P. Morgan Investment Management Inc. (“JPMIM”)
270 Park Avenue, New York, NY 10017
JPMIM is an indirect wholly-owned subsidiary ofJPMorgan Chase & Co. As of June 30, 2020, JPMIM andits affiliates managed over $2,129 billion in assets.
The Emerging Economies Fund is managed by a team ledby Anuj Arora and Joyce Weng. Mr. Arora, a ManagingDirector and JPMIM employee since 2006, is the leadportfolio manager for the Fund and is primarilyresponsible for portfolio construction. Mr. Arora utilizes theresearch and insights of Ms. Weng. Ms. Weng is aportfolio manager covering the GEM Core strategieswithin the Emerging Markets and Asia Pacific (EMAP)Equities team based in New York. She was previously inthe U.S. Equity Behavioral Finance team at JPMorgan.Prior to joining the Firm in 2010, Ms. Weng worked as asenior analyst at Goldman Sachs Asset Management.Ms. Weng holds a B.A. in Economics (cum laude) and aM.A. in Statistics from Harvard University.
The Government Securities Fund is managed by a teamled by Michael Sais and Robert Manning. Mr. Sais,Managing Director and CFA charterholder, is a fixedincome fund manager for the Insurance AssetManagement Team responsible for managing investmentsconsistent with the unique Ultra Short-Term Bond Fundsince 1995 and Government Bond Products since 1996.Mr. Manning, Managing Director, is a portfolio manager forInsurance Solutions. Previously, he was a member of theFixed Income Portfolio Management Group that supportsMid-Institutional Portfolios. Mr. Manning joined the firm in1999.
The Small Cap Fund is managed by a team led by DonSan Jose and Dan Percella. Mr. San Jose, ManagingDirector and CFA charterholder, is the portfolio manager
of JPMIM’s Small Cap Active Core Strategy. A JPMIMemployee since 2000, Mr. San Jose was an analyst inJPMIM Securities’ equity research department coveringcapital goods companies before joining the small capgroup. Prior to joining JPMIM, Mr. San Jose was an equityresearch associate at ING Baring Furman Selz. Mr. SanJose holds a B.S. in finance from The Wharton School ofthe University of Pennsylvania and is a member of boththe New York Society of Security Analysts and the CFAInstitute. Mr. Percella, Managing Director and CFAcharterholder, is a co-portfolio manager and an analyst onJPMIM’s Small Cap Active Team. A JPMIM employeesince 2008, Mr. Percella was previously a member ofInstitutional Investor-ranked equity research teamscovering the transportation sector at Bear Stearns, Bankof America and Citigroup. Mr. Percella holds a B.S. ineconomics from Georgetown University’s Walsh School ofForeign Service and is a member of both the New YorkSociety of Security Analysts and the CFA Institute.
Large Capital Growth Fund
Massachusetts Financial Services Company (“MFS”)
111 Huntington Avenue, Boston, Massachusetts 02199
MFS is America’s oldest mutual fund organization and,with its predecessor organizations, has a history of moneymanagement dating from 1924 and the founding of thefirst mutual fund in the United States. Net assets undermanagement of the MFS organization wereapproximately $507 billion as of June 30, 2020.
The Large Capital Growth Fund is managed by JeffreyConstantino, an Investment Officer and Portfolio Manager,and Joseph Skorski, an Investment Officer and PortfolioManager of MFS. Mr. Constantino joined MFS in 2000 andhas served on the portfolio management team of theLarge Cap Growth strategy since 2006 and the portfoliomanagement team of the Global Growth strategies since2008. Mr. Skorski joined MFS in 2007 and has more thantwo decades of investment experience. During his tenureat the firm, he has had both equity research analyst andportfolio management responsibilities. He joined theportfolio management team of the MFS® Global GrowthEquity and MFS® Global Growth Concentrated Equitystrategies in 2018 and previously had portfoliomanagement responsibilities for the firm’s Japan Equitystrategy.
International Growth Fund
Morgan Stanley Investment Management Inc.(“MSIM”)
522 Fifth Avenue, New York, NY 10036
MANAGEMENT
- 174 -

MSIM is a subsidiary of Morgan Stanley and conducts aworldwide portfolio management business providing abroad range of services to customers in the United Statesand abroad. MSIM is located at 522 Fifth Avenue,New York, NY 10036. As of June 30, 2020, MSIM togetherwith its affiliated asset management companies hadapproximately $665 billion in assets under management.
The Fund is managed by members of the GlobalOpportunity team. The team consists of portfoliomanagers and analysts. Kristian Heugh is the leadportfolio manager and is primarily responsible for the day-to-day management of the Fund. Mr. Heugh has beenassociated with MSIM in an investment managementcapacity since 2001. Wendy Wang is a portfolio managerand is primarily responsible for day-to-day management ofthe Fund. Ms. Wang has been associated with MSIM in aninvestment capacity since 2012.
In rendering investment advisory services to the Fund,MSIM uses the portfolio management, research and otherresources of a foreign (non-U.S.) affiliate of MSIM that isnot registered under the Investment Advisers Act of 1940,as amended, and may provide services to the Fundthrough a “participating affiliate” arrangement, as thatterm is used in relief granted by the staff of the SECallowing U.S. registered investment advisers to useportfolio management or research resources of advisoryaffiliates subject to the regulatory supervision of theregistered investment adviser.
Asset Allocation FundCapital Conservation FundInternational Government Bond Fund
PineBridge Investments LLC (“PineBridge”)
Park Avenue Tower, 65 East 55th Street, New York,New York 10022
PineBridge is a Delaware limited liability company and isa wholly-owned subsidiary of PineBridge InvestmentsHoldings US LLC which is a wholly-owned subsidiary ofPineBridge Investments, L.P., a company owned by PacificPPCentury Group, an Asia based private investment group.Pacific Century Group is majority owned by Mr. Richard LiTzar Kai. PineBridge provides investment advice andmarkets asset management products and services toclients around the world. As of June 30, 2020, PineBridgemanaged approximately $104.4 billion.
Teams make decisions for the Funds, as noted below.Each team meets regularly to review portfolio holdingsand discuss purchase and sale activity.
Investment decisions for the Asset Allocation Fund aremade by a team including Kate Faraday, Michael Kelly,
Jose R. Aragon and Robert Vanden Assem. Ms. Faraday,Managing Director, and Portfolio Manager/Trader, isresponsible for portfolio management and trading on thegroup’s passive and research enhanced strategies.Ms. Faraday joined the firm in 2007. From 2004 to 2006,Ms. Faraday was an equity trader at KR Capital Advisors.Mr. Kelly, Managing Director, Global Head of Multi-Asset,joined PineBridge in 1999. In his current role, Mr. Kelly isresponsible for the development and management ofstructured equity products worldwide and the expansion ofPineBridge’s capabilities for institutional pension fundadvisory and retail orientated multi-asset vehicles and is amember of PineBridge’s Research Enhanced R&D Panel.Mr. Aragon joined PineBridge in 2003 and is currently aSenior Vice President and a Portfolio Manager forPineBridge’s Multi-Asset Team. Prior to assuming thisrole, Mr. Aragon managed PineBridge’s multi-strategyhedge fund and was a Quantitative Analyst in thePineBridge structured equity group. Mr. Vanden Assem,CFA, is a Managing Director and Head of InvestmentGrade Fixed Income, and joined PineBridge in 2001. Heis currently responsible for the portfolio management ofhigh grade institutional and retail portfolios.
Investment decisions for the Capital Conservation Fundare made by a team including Dana G. Burns and RobertVanden Assem. Mr. Burns is Managing Director andPortfolio Manager of Investment Grade Fixed Income.Mr. Burns joined PineBridge in 2007 and has over 10 yearsof investment experience. Prior to joining PineBridge,Mr. Burns was Vice President and co-manager of theFixed Income Separately Managed Account team atMorgan Stanley. Please see above for the biography ofMr. Vanden Assem.
Investment decisions for the International GovernmentBond Fund are made by a team including AndersFaergemann and Dmitri Savin. Mr. Faergemann joinedPineBridge in 2004 and is an Investment Manager with theEmerging Market Fixed Income Team. He focuses onportfolio management of local currency debt as well assovereign debt. Prior to this role Mr. Faergemann was anemerging market currency strategist. Mr. Faergemannbegan his investment career in 1998. Mr. Savin joined thefirm in 2000 and is a Senior Vice President and memberof the portfolio management team. Mr. Savin’sresponsibilities have included portfolio strategy, riskmanagement and development of various quantitativestrategies and applications of technical analysis. He hasalso held the role of Senior Analyst, focusing onsovereigns in the EMEA region. Prior to joiningPineBridge, Mr. Savin was Head of Research with FlemingUCB in Moscow, providing equity coverage on Russiancompanies, as well as macroeconomic research andequity strategy. Prior to that, he worked in Equity Research
MANAGEMENT
- 175 -

for Deutsche Morgan Grenfell and was Head ofOperations with United City Bank. He received a BSc withhonors in Mathematics from Moscow State University andan MBA from Indiana University. He holds the InvestmentManagement Certificate (IMC) and is a CFAcharterholder. He is an Associate of the CFA Institute, theCFA Society of the UK and is a member of the Society ofTechnical Analysts.
Dividend Value FundDynamic Allocation Fund
Government Money Market I Fund
Growth FundInternational Equities Index Fund
International Socially Responsible FundMid Cap Index FundNasdaq-100® Index FundSmall Cap Index FundStock Index Fund
SunAmerica Asset Management, LLC(“SunAmerica”)
Harborside 5
185 Hudson Street, Suite 3300Jersey City, New Jersey 07311
SunAmerica is organized as a Delaware limited liabilitycompany and is an indirect, wholly-owned subsidiary ofAIG. SunAmerica’s primary focus has been on themanagement, in either an advisory or subadvisorycapacity, of registered investment companies. As ofMay 31, 2020, SunAmerica managed, advised, and/oradministered more than $42.2 billion in assets.
A portion of the assets of the Dividend Value Fund ismanaged by a team consisting of Timothy Pettee, AndrewSheridan and Timothy Campion, with Mr. Pettee servingas team leader. Mr. Pettee, Senior Vice President andChief Investment Strategist, joined SunAmerica in 2003.Mr. Sheridan joined SunAmerica in 2003, and is SeniorPortfolio Manager. While at SunAmerica he also served asan equity research analyst. Prior to joining SunAmerica,he worked as an analyst in the research department atU.S. Trust and was in the market research division ofGreenwich Associates. Mr. Sheridan received his B.A.from St. Lawrence University and his M.B.A. from theAnderson School of Management at the University ofCalifornia at Los Angeles. His investment experiencedates from 1999. Mr. Campion is a Senior Vice Presidentand Portfolio Manager at SunAmerica. He is responsiblefor the management and trading of a wide variety ofdomestic equity index funds. Mr. Campion joined
SunAmerica in 2012. Prior to joining SunAmerica, he wasVice President and Portfolio Manager at PineBridgeInvestments LLC since 1999.
The Fund-of Funds Component of the Dynamic AllocationFund is managed by Douglas Loeffler, CFA and ManishaSingh, CFA. Mr. Loeffler joined AIG in 2007 as VicePresident of the Investment Product Management Group,based in Woodland Hills, CA. In this role, Mr. Loeffler ledthe manager review and oversight for affiliated variableannuity portfolios advised by SunAmerica, in addition tobeing responsible for AIG Variable Annuity’s separateaccount investments. In 2015, Mr. Loeffler became SeniorVice President and Senior Portfolio Manager for AssetAllocation for SunAmerica. Ms. Singh joined AIG in 2017as Vice President and Co-Portfolio Manager for AssetAllocation fund-of-funds. In 2020 Ms. Singh was promotedto Senior Vice President. Prior to joining AIG, Ms. Singhserved as Director, Manager Research team in WealthManagement at Ameriprise Financial Services, Inc. Shejoined Ameriprise in 2008, where she served as a portfoliomanager for a suite of asset allocation portfolios(discretionary wrap accounts), and a senior managerresearch analyst for unaffiliated mutual funds, exchangetraded funds and separately managed accounts.
The International Socially Responsible Fund is managedby a team consisting of Timothy Campion and ElizabethMauro with Mr. Campion serving as team leader.Ms. Mauro joined SunAmerica in 2017 and is a fixedincome trader and portfolio manager. Prior to joining thefirm, she held several capital markets positions at Bank ofNew York Mellon Corporation, with product coverage inthe Commercial Paper, Yankee CD, U.S. Treasuries,Agency Discount Notes, Bullets, and short-termCorporates categories. Ms. Mauro received a B.A. inGovernment from Smith College. Her investmentexperience dates back to 2011. Please see above for thebiography of Mr. Campion.
SunAmerica’s Fixed Income Investment Team isresponsible for management of the Government MoneyMarket I Fund.
The International Equities Index Fund, Mid Cap IndexFund, Nasdaq-100® Index Fund, Small Cap Index Fundand Stock Index Fund are managed by a team consistingof Timothy Campion, Andrew Sheridan, and Jane BayarAlgieri. Ms. Bayar Algieri joined SunAmerica in 2004 andis the Director of Research and a portfolio manager of thefirm’s rules-based portfolios. Prior to her current roles, sheserved as an investment analyst for both equity and fixedincome portfolios. Ms. Bayar received her B.A. fromBaruch College and her M.B.A. from Rutgers School ofBusiness. Her investment experience dates from 2004. .
MANAGEMENT
- 176 -

Please see above for the biographies of Messrs. Campionand Sheridan and Ms. Bayar Algieri. A portion of theassets of the Growth Fund is managed by a teamconsisting of Timothy Campion and Elizabeth Mauro, withMr. Campion serving as team leader. Please see above forthe biography of Mr. Campion and Ms. Mauro.
Blue Chip Growth FundHealth Sciences FundScience & Technology FundSmall Cap Fund
T. Rowe Price Associates, Inc. (“T. Rowe Price”)
100 East Pratt Street, Baltimore, Maryland 21202
T. Rowe Price, which was founded by Thomas Rowe Price,Jr. in 1937, is one of the pioneers of the growth stocktheory of investing. Its approach to managing money isbased on proprietary research and a strict investmentdiscipline developed over seven decades. The firm, whichis a wholly-owned subsidiary of T. Rowe Price Group, Inc.,a publicly owned financial services company, is one of thenation’s leading no-load fund managers. As of June 30,2020, T. Rowe Price and its affiliates had approximately$1.22 trillion in assets under management.
The Blue Chip Growth Fund is managed by an investmentadvisory committee, chaired by Larry J. Puglia, CFA. Thecommittee chairman has day-to-day responsibility formanaging the Fund and works with the committee indeveloping and executing the Fund’s investment program.Mr. Puglia has been the chairman of the investmentadvisory committee for the T. Rowe Price Blue ChipGrowth Fund since 1996. Mr. Puglia joined T. Rowe Pricein 1990 and his investment experience dates from 1989.
The Health Sciences Fund is managed by an investmentadvisory committee, chaired by Ziad Bakri, CFA, MD. Thecommittee chairman has day-to-day responsibility formanaging the Fund and works with the committee indeveloping and executing the Fund’s investment program.Mr. Bakri was elected chairman of the investment advisorycommittee for the T. Rowe Price Health Sciences Fund in2016. Mr. Bakri joined T. Rowe Price in 2011 and hisinvestment experience dates from 2005. Since joiningT. Rowe Price, he has served as an investment analystcovering the healthcare sector. Prior to joining T. RowePrice, he was an equity research analyst with Cowen andCompany and an investment banking analyst with MerrillLynch.
T. Rowe Price is responsible for sub-advising a portion ofthe Science & Technology Fund. This portion is managedby an investment advisory committee chaired by KennardW. Allen. As committee chairman, Mr. Allen has day-to-day
responsibility for managing the Fund and works with thecommittee in developing and executing the Fund’sinvestment program. Mr. Allen previously served as amember of the investment advisory committee. He joinedT. Rowe Price in 2000 and his investment experiencedates from that time.
T. Rowe Price is responsible for sub-advising a portion ofthe Small Cap Fund. This portion is managed by aninvestment advisory committee, chaired by Frank M.Alonso. The committee chairman has day-to-dayresponsibility for managing the Fund and works with thecommittee in developing and executing the Fund’sinvestment program. Mr. Alonso joined T. Rowe in 2000and his investment experience dates from that time.During the past five years, he has served as an equityresearch analyst and a portfolio manager (beginning in2013).
Small Cap Aggressive Growth Fund
Victory Capital Management Inc. (Victory Capital)
15935 La Cantera Parkway, San Antonio, Texas 78256
Victory Capital is a registered investment adviser. As ofMay 31, 2020, Victory had approximately $127.7 billion inassets under management or advisement. Victory Capitalis a diversified global asset manager comprised ofmultiple investment teams, referred to as investmentfranchises, each of which utilizes an independentapproach to investing. RS Investments, a Victory Capitalinvestment franchise, is responsible for the day-to-dayinvestment management of the Small Cap AggressiveGrowth Fund.
The Small Cap Aggressive Growth Fund is managed byan investment team comprised of D. Scott Tracy, CFA,Stephen J. Bishop, Melissa Chadwick-Dunn, ChristopherW. Clark, CFA and Paul Leung, CFA. Mr. Tracy has been amember of the Fund’s portfolio management team since2001. Mr. Bishop has been a member of the team thatmanages the Fund since 1996. Ms. Chadwick-Dunn hasbeen a member of the team since 2001. Mr. Clark hasbeen a member of the team since 2007. Mr. Leung hasbeen a member of the team since 2018. Messrs. Tracy,Clark and Leung are CFA charterholders. In connectionwith Victory Capital’s acquisition of RS Investments in2016, each of the portfolio managers became employeesof Victory Capital and are members of Victory Capital’sRS Investments Growth team. Mr. Tracy is the chiefinvestment officer of the team.
Inflation Protected FundScience & Technology Fund
MANAGEMENT
- 177 -
Systematic Value FundValue Fund
Wellington Management Company LLP (“WellingtonManagement”)
280 Congress Street, Boston, Massachusetts 02210
Wellington Management is a professional investmentcounseling firm which provides investment services toinvestment companies, employee benefit plans,endowments, foundations, and other institutions.Wellington Management and its predecessororganizations have provided investment advisory servicesfor over 80 years. Wellington Management is owned by thepartners of Wellington Management Group LLP, aMassachusetts limited liability partnership. As of June 30,2020, Wellington Management and its investmentaffiliates had investment management authority withrespect to approximately $1.121 trillion in assets.
The team responsible for managing the Inflation ProtectedFund is Joseph F. Marvan, CFA, Allan M. Levin, CFA,FRM, FSA, and Jeremy Forster.
Mr. Marvan, Senior Managing Director and Fixed IncomePortfolio Manager of Wellington Management, joined thefirm as an investment professional in 2003. Mr. Levin,Managing Director and Fixed Income Portfolio Manager ofWellington Management, joined the firm as an investmentprofessional in 2015. Mr. Forster, Managing Director andFixed Income Portfolio Manager of WellingtonManagement, joined the firm as an investmentprofessional in 2011.
A portion of the assets of the Science & Technology Fundis managed by Wellington Management’s GlobalTechnology Investment Team. The team is comprised ofJohn F. Averill, CFA, Bruce L. Glazer, Brian Barbetta,Eunhak Bae and Jeffrey S. Wantman. Each teammemberprovides portfolio management and securities analysisservices for Wellington Management’s portion of theFund’s assets.
Mr. Averill, Senior Managing Director and Global IndustryAnalyst of Wellington Management, joined the firm as aninvestment professional in 1994. Mr. Glazer, SeniorManaging Director and Global Industry Analyst ofWellington Management, joined the firm as an investmentprofessional in 1997. Mr. Barbetta, Senior ManagingDirector and Global Industry Analyst of WellingtonManagement, joined the firm in 2012. Ms. Bae, SeniorManaging Director and Global Industry Analyst ofWellington Management, joined the firm as an investmentprofessional in 2017. Mr. Wantman, Senior ManagingDirector and Global Industry Analyst of Wellington
Management, joined the firm as an investmentprofessional in 2010.
The Value Fund is managed by Mr. Adam H. Illfelder,CFA is a Managing Director and Equity Portfolio Managerof Wellington Management, and joined the firm as aninvestment professional in 2005. He has served asPortfolio Manager of the Value Fund since 2018. TheSystematic Value Fund is managed by Gregg R. Thomas,CFA and Thomas S. Simon, CFA, FRM. Mr. Thomas isSenior Managing Director and Director, InvestmentStrategy of the subadviser. Mr. Thomas joined thesubadviser in 1997 and has been an investmentprofessional since 1993. Mr. Simon is Senior ManagingDirector and portfolio manager of the subadviser.Mr. Simon joined the subadviser in 2009 and has been aninvestment professional since 2001.
International Value FundSmall Cap Special Values Fund
Wells Capital Management Incorporated(“WellsCap”)
525 Market Street, San Francisco, California 94105
WellsCap is a registered investment adviser that providesinvestment advisory services for registered mutual funds,company retirement plans, foundations, endowments,trust companies, and high net-worth individuals. As ofJune 30, 2020, WellsCap managed over $476 billion inassets.
WellsCap is responsible for managing the assets of theInternational Value Fund, which is managed by Dale A.Winner, CFA and Venkateshwar (Venk) Lal. Mr. Winner isthe lead portfolio manager for the EverKey Global Equityteam. He joined WellsCap in 2012. Prior to joiningWellsCap, Mr. Winner was a Partner and portfoliomanager at EverKey Global Partners, an investment firmhe co-founded in 2007. Mr. Winner has been in theinvestment industry since 1987. Mr. Lal is an associateportfolio manager and head of EverKey investment riskand strategy for the EverKey Global Equity team. Hejoined WellsCap in 2012. Prior to joining WellsCap, Mr. Lalwas a Partner and head of risk and trading at EverKeyGlobal Partners, an investment firm he co-founded in2007. Mr. Lal has been in the investment industry since1991.
WellsCap is responsible for managing the assets of theSmall Cap Special Values Fund, which is managed byJames M. Tringas, CFA, Bryant VanCronkhite, CFA, andBrian Martin, CFA. Mr. Tringas is a Managing Director andSenior Portfolio Manager with the Special Global Equityteam of WellsCap. He has been with WellsCap or one of
MANAGEMENT
- 178 -
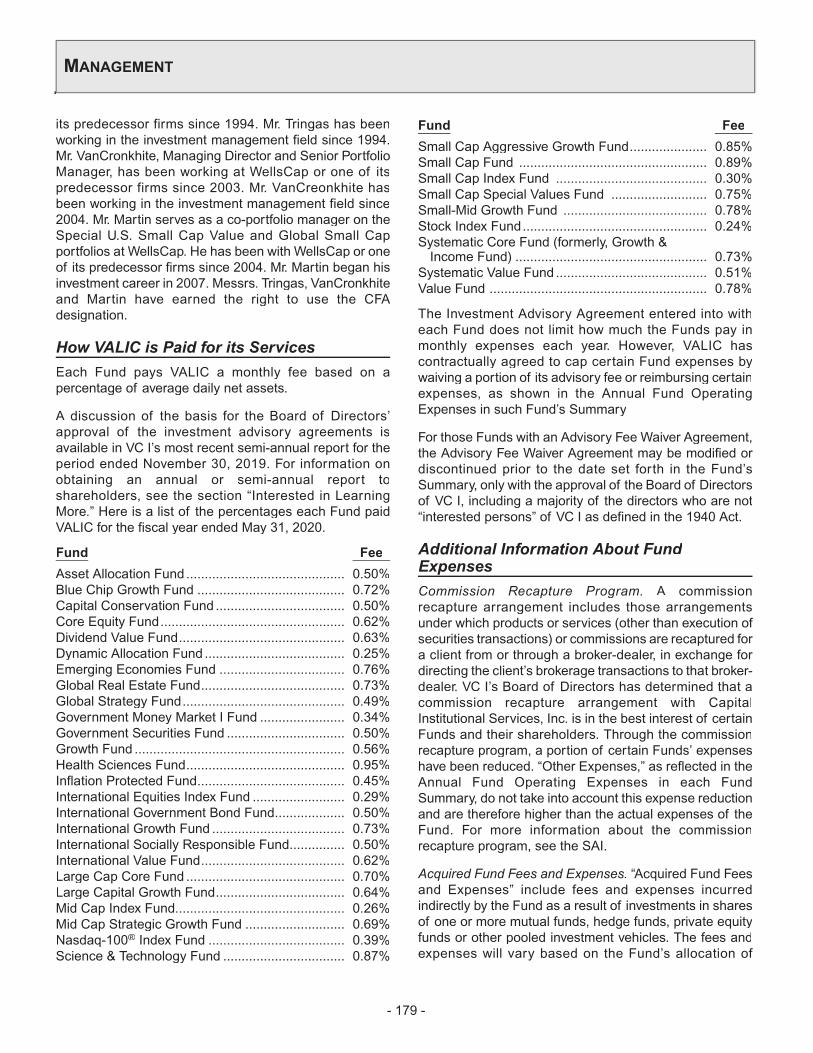
its predecessor firms since 1994. Mr. Tringas has beenworking in the investment management field since 1994.Mr. VanCronkhite, Managing Director and Senior PortfolioManager, has been working at WellsCap or one of itspredecessor firms since 2003. Mr. VanCreonkhite hasbeen working in the investment management field since2004. Mr. Martin serves as a co-portfolio manager on theSpecial U.S. Small Cap Value and Global Small Capportfolios at WellsCap. He has been with WellsCap or oneof its predecessor firms since 2004. Mr. Martin began hisinvestment career in 2007. Messrs. Tringas, VanCronkhiteand Martin have earned the right to use the CFAdesignation.
How VALIC is Paid for its Services
Each Fund pays VALIC a monthly fee based on apercentage of average daily net assets.
A discussion of the basis for the Board of Directors’approval of the investment advisory agreements isavailable in VC I’s most recent semi-annual report for theperiod ended November 30, 2019. For information onobtaining an annual or semi-annual report toshareholders, see the section “Interested in LearningMore.” Here is a list of the percentages each Fund paidVALIC for the fiscal year ended May 31, 2020.
Fund Fee
Asset Allocation Fund ........................................... 0.50%Blue Chip Growth Fund ........................................ 0.72%Capital Conservation Fund ................................... 0.50%Core Equity Fund.................................................. 0.62%Dividend Value Fund............................................. 0.63%Dynamic Allocation Fund ...................................... 0.25%Emerging Economies Fund .................................. 0.76%Global Real Estate Fund....................................... 0.73%Global Strategy Fund............................................ 0.49%Government Money Market I Fund ....................... 0.34%Government Securities Fund ................................ 0.50%Growth Fund ......................................................... 0.56%Health Sciences Fund........................................... 0.95%Inflation Protected Fund........................................ 0.45%International Equities Index Fund ......................... 0.29%International Government Bond Fund................... 0.50%International Growth Fund .................................... 0.73%International Socially Responsible Fund............... 0.50%International Value Fund....................................... 0.62%Large Cap Core Fund ........................................... 0.70%Large Capital Growth Fund................................... 0.64%Mid Cap Index Fund.............................................. 0.26%Mid Cap Strategic Growth Fund ........................... 0.69%Nasdaq-100® Index Fund ..................................... 0.39%Science & Technology Fund ................................. 0.87%
Fund Fee
Small Cap Aggressive Growth Fund..................... 0.85%Small Cap Fund ................................................... 0.89%Small Cap Index Fund ......................................... 0.30%Small Cap Special Values Fund .......................... 0.75%Small-Mid Growth Fund ....................................... 0.78%Stock Index Fund.................................................. 0.24%Systematic Core Fund (formerly, Growth &Income Fund) .................................................... 0.73%
Systematic Value Fund ......................................... 0.51%Value Fund ........................................................... 0.78%
The Investment Advisory Agreement entered into witheach Fund does not limit how much the Funds pay inmonthly expenses each year. However, VALIC hascontractually agreed to cap certain Fund expenses bywaiving a portion of its advisory fee or reimbursing certainexpenses, as shown in the Annual Fund OperatingExpenses in such Fund’s Summary
For those Funds with an Advisory Fee Waiver Agreement,the Advisory Fee Waiver Agreement may be modified ordiscontinued prior to the date set forth in the Fund’sSummary, only with the approval of the Board of Directorsof VC I, including a majority of the directors who are not“interested persons” of VC I as defined in the 1940 Act.
Additional Information About FundExpenses
Commission Recapture Program. A commissionrecapture arrangement includes those arrangementsunder which products or services (other than execution ofsecurities transactions) or commissions are recaptured fora client from or through a broker-dealer, in exchange fordirecting the client’s brokerage transactions to that broker-dealer. VC I’s Board of Directors has determined that acommission recapture arrangement with CapitalInstitutional Services, Inc. is in the best interest of certainFunds and their shareholders. Through the commissionrecapture program, a portion of certain Funds’ expenseshave been reduced. “Other Expenses,” as reflected in theAnnual Fund Operating Expenses in each FundSummary, do not take into account this expense reductionand are therefore higher than the actual expenses of theFund. For more information about the commissionrecapture program, see the SAI.
Acquired Fund Fees and Expenses. “Acquired Fund Feesand Expenses” include fees and expenses incurredindirectly by the Fund as a result of investments in sharesof one or more mutual funds, hedge funds, private equityfunds or other pooled investment vehicles. The fees andexpenses will vary based on the Fund’s allocation of
MANAGEMENT
- 179 -

assets to, and the annualized expenses of, the particularacquired fund.
Expense Limitations. VALIC has contractually agreed toreimburse the expenses of certain Funds throughSeptember 30, 2021 or 2022, so that the Funds’ TotalAnnual Fund Operation Expenses do not exceed the limitsset forth in the agreement. For the purposes of the waivedfee and reimbursed expense calculations, annual fundoperating expenses shall not include extraordinaryexpenses (i.e., expenses that are unusual in nature andinfrequent in occurrence, such as litigation), or acquiredfund fees and expenses, brokerage commissions andother transactional expenses relating to the purchase andsale of portfolio securities, interest, taxes andgovernmental fees, and other expenses not incurred in theordinary course of the Funds’ business. This agreementwill be renewed in terms of one year unless terminated bythe Board of Directors prior to any such renewal.
Total Annual Fund Operating Expenses of the followingFunds do not exceed the limitations set forth next to each
Fund: Blue Chip Growth Fund (0.85%), GovernmentMoney Market I Fund (0.55%) and Nasdaq-100® IndexFund (0.53%).
Voluntary Waivers and Reimbursements.Government Money Market I Fund. In order to avoid anegative yield, VALIC may waive fees or reimburseexpenses of the Government Money Market I Fund. Anysuch waiver or reimbursement would be voluntary andcould be discontinued at any time by VALIC. There is noguarantee that the Fund will be able to avoid a negativeyield.
Dynamic Allocation Fund. VALIC voluntarily agreed, untilfurther notice, to waive a portion of its advisory fee in anamount equal to the amount of any advisory feesvoluntarily waived by the Fund’s subadviser,AllianceBernstein (“AB”), in connection with the Fund’sinvestment in the AB Government Money Market Portfolio,a series of AB Fixed-Income Shares, Inc. managed byAllianceBernstein (the AB Fund Waiver“). The AB FundWaiver may be terminated at any time by the Adviser.
MANAGEMENT
- 180 -

The following Financial Highlights tables are intended to help you understand each Fund’s financial performance for thepast 5 years, or, if shorter, the period of the Fund’s operations. Certain information reflects financial results for a singleFund share. The total returns in each table represent the rate that an investor would have earned on an investment in aFund (assuming reinvestment of all dividends and distributions). Separate Account charges are not reflected in the totalreturns. If these amounts were reflected, returns would be less than those shown. This information has been audited byPricewaterhouseCoopers LLP, whose report, along with each Fund’s financial statements, is included in the Corporation’sPPAnnual Report to shareholders, which is available upon request.
Per share data assumes that you held each share from the beginning to the end of each fiscal year. Total return assumesthat you bought additional shares with dividends paid by the Fund. Total returns for periods of less than one year are notannualized.
Asset Allocation Fund Blue Chip Growth Fund
Year Ended May 31, Year Ended May 31,
2020 2019 2018 2017 2016 2020 2019 2018 2017 2016
PER SHARE DATA..............................Net asset value at beginning of period. $ 9.91 $ 11.33 $ 11.00 $ 10.39 $ 12.38 $ 19.18 $ 20.84 $ 17.27 $ 15.48 $ 17.96Income (loss) from investmentoperations: .......................................Net investment income (loss)(d) .... 0.14 0.18 0.16 0.16 0.23 (0.05) (0.01) (0.01) 0.01 (0.02)Net realized and unrealized gain(loss) on investments andforeign currencies ..................... (0.30) (0.55) 0.83 0.71 (0.66) 3.93 0.86 4.82 3.46 (0.24)
Total income (loss) frominvestment operations............... (0.16) (0.37) 0.99 0.87 (0.43) 3.88 0.85 4.81 3.47 (0.26)
Distributions from:.................................Net investment income ................. (0.12) (0.17) (0.18) (0.26) (0.24) – – (0.01) – –Net realized gain on securities...... (0.18) (0.88) (0.48) – (1.32) (2.26) (2.51) (1.23) (1.68) (2.22)Total distributions .......................... (0.30) (1.05) (0.66) (0.26) (1.56) (2.26) (2.51) (1.24) (1.68) (2.22)
Net asset value at end of period .......... $ 9.45 $ 9.91 $ 11.33 $ 11.00 $ 10.39 $ 20.80 $ 19.18 $ 20.84 $ 17.27 $ 15.48TOTAL RETURN(a) .............................. (1.46)% (3.42)% 8.91% 8.35% (2.16)% 21.77% 4.22% 27.87% 23.49% 0.17%RATIOS/SUPPLEMENTAL DATA.......Ratio of expenses to average netassets(b)............................................ 0.77% 0.76% 0.72% 0.70% 0.70% 0.83% 0.82% 0.83% 0.84% 0.84%
Ratio of expenses to average netassets(c)............................................ 0.77% 0.76% 0.72% 0.70% 0.70% 0.83% 0.82% 0.83% 0.84% 0.84%
Ratio of expense reductions toaverage net assets ........................... 0.00% 0.00% 0.00% 0.00% 0.00% – – 0.00% 0.00% 0.00%
Ratio of net investment income (loss)to averagenet assets(b)...................................... 1.39% 1.69% 1.40% 1.51% 2.00% (0.24)% (0.03)% (0.07)% 0.06% (0.09)%
Ratio of net investment income (loss)to averagenet assets(c)...................................... 1.39% 1.69% 1.40% 1.51% 2.00% (0.24)% (0.03)% (0.07)% 0.06% (0.09)%
Portfolio turnover rate ........................... 177% 113% 84% 161% 102% 27% 30% 24% 27% 30%Number of shares outstanding at endof period(000’s) ................................ 13,614 14,892 14,624 14,705 15,824 39,950 40,727 37,397 39,343 39,796
Net assets at end of period (000’s) ...... $128,629 $147,543 $165,665 $161,767 $164,358 $831,006 $781,236 $779,336 $679,516 $615,927
(a) Total return includes, if any, expense reimbursements and expense reductions. The effect of fees and charges incurred at the separate accountlevel are not reflected in these performance figures. If such expenses had been included, the total return would have been lower for each periodpresented.
(b) Includes, if any, expense reimbursement, but excludes, if any, expense reductions.(c) Excludes, if any, expense reimbursements and expense reductions.(d) The per share amounts are calculated using the average share method.
FINANCIAL HIGHLIGHTS
- 181 -

Capital Conservation Fund Core Equity Fund
Year Ended May 31, Year Ended May 31,
2020 2019 2018 2017 2016 2020 2019 2018 2017 2016
PER SHARE DATA..............................Net asset value at beginning of period. $ 9.88 $ 9.54 $ 9.85 $ 9.95 $ 9.92 $ 20.16 $ 23.18 $ 21.92 $ 19.51 $ 20.38Income (loss) from investmentoperations: .......................................Net investment income (loss)(d) .... 0.23 0.25 0.20 0.18 0.18 0.26 0.28 0.26 0.25 0.21Net realized and unrealized gain(loss) on investments andforeign currencies ..................... 0.71 0.32 (0.29) (0.04) 0.06 1.62 (0.16) 3.13 3.14 (0.87)
Total income (loss) frominvestment operations............... 0.94 0.57 (0.09) 0.14 0.24 1.88 0.12 3.39 3.39 (0.66)
Distributions from:.................................Net investment income ................. (0.32) (0.23) (0.19) (0.23) (0.19) (0.31) (0.28) (0.28) (0.24) (0.21)Net realized gain on securities...... – – (0.03) (0.01) (0.02) (1.93) (2.86) (1.85) (0.74) –Total distributions .......................... (0.32) (0.23) (0.22) (0.24) (0.21) (2.24) (3.14) (2.13) (0.98) (0.21)
Net asset value at end of period .......... $ 10.50 $ 9.88 $ 9.54 $ 9.85 $ 9.95 $ 19.80 $ 20.16 $ 23.18 $ 21.92 $ 19.51TOTAL RETURN(a) .............................. 9.55% 6.10% (0.94)% 1.45% 2.47% 10.04% 0.35% 15.42% 17.48% (3.07)%RATIOS/SUPPLEMENTAL DATA.......Ratio of expenses to average netassets(b)............................................ 0.64% 0.64% 0.64% 0.64% 0.64% 0.75% 0.74% 0.77% 0.80% 0.80%
Ratio of expenses to average netassets(c)............................................ 0.64% 0.64% 0.64% 0.64% 0.64% 0.93% 0.92% 0.93% 0.92% 0.92%
Ratio of expense reductions toaverage net assets ........................... – – – – – – – – 0.00% 0.00%
Ratio of net investment income (loss)to average net assets(b) .................... 2.23% 2.65% 2.10% 1.84% 1.77% 1.21% 1.20% 1.10% 1.19% 1.11%
Ratio of net investment income (loss)to average net assets(c) .................... 2.23% 2.65% 2.10% 1.84% 1.77% 1.03% 1.02% 0.94% 1.06% 0.99%
Portfolio turnover rate ........................... 74% 72% 53% 56% 71% 41% 29% 50% 36% 41%Number of shares outstanding at endof period(000’s) ................................ 26,395 24,991 26,729 23,866 23,716 11,267 11,329 10,911 11,023 11,771
Net assets at end of period (000’s) ...... $277,277 $246,896 $255,084 $235,063 $236,062 $223,066 $228,409 $252,961 $241,647 $229,637
(a) Total return includes, if any, expense reimbursements and expense reductions. The effect of fees and charges incurred at the separate accountlevel are not reflected in these performance figures. If such expenses had been included, the total return would have been lower for each periodpresented.
(b) Includes, if any, expense reimbursement, but excludes, if any, expense reductions.(c) Excludes, if any, expense reimbursements and expense reductions.(d) The per share amounts are calculated using the average share method.
FINANCIAL HIGHLIGHTS
- 182 -
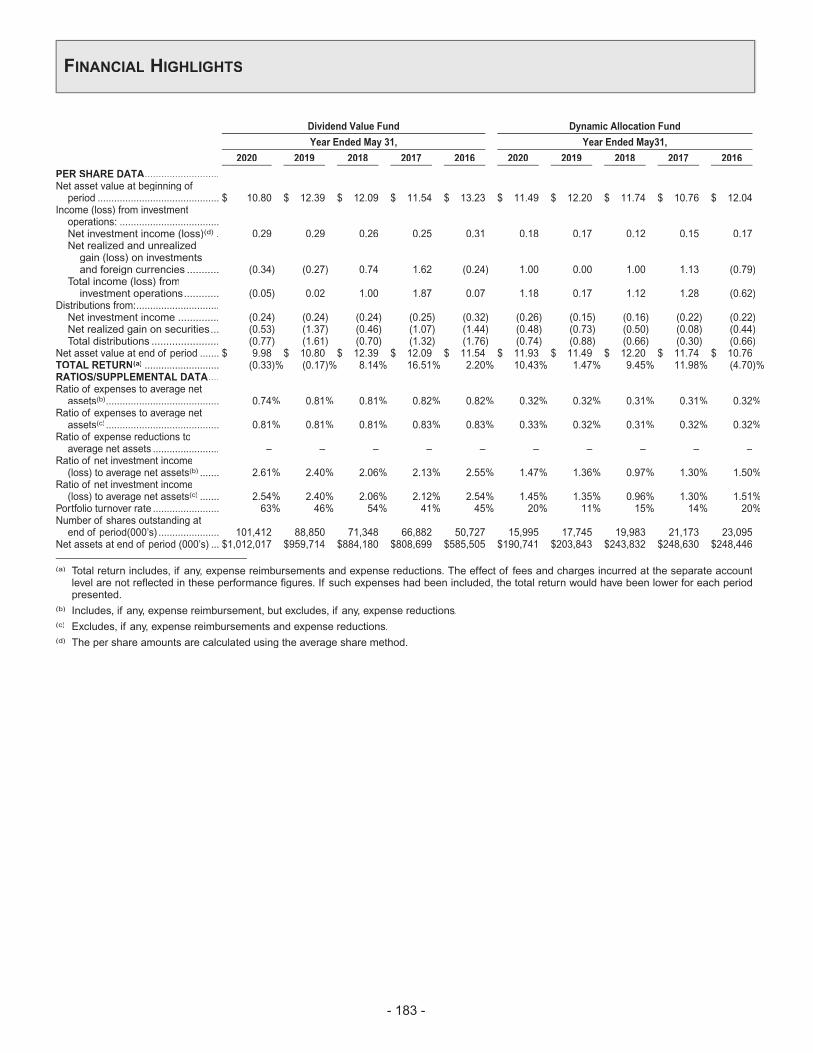
Dividend Value Fund Dynamic Allocation Fund
Year Ended May 31, Year Ended May31,
2020 2019 2018 2017 2016 2020 2019 2018 2017 2016
PER SHARE DATA...........................Net asset value at beginning ofperiod ............................................ $ 10.80 $ 12.39 $ 12.09 $ 11.54 $ 13.23 $ 11.49 $ 12.20 $ 11.74 $ 10.76 $ 12.04
Income (loss) from investmentoperations: ....................................Net investment income (loss)(d) . 0.29 0.29 0.26 0.25 0.31 0.18 0.17 0.12 0.15 0.17Net realized and unrealizedgain (loss) on investmentsand foreign currencies ........... (0.34) (0.27) 0.74 1.62 (0.24) 1.00 0.00 1.00 1.13 (0.79)
Total income (loss) frominvestment operations............ (0.05) 0.02 1.00 1.87 0.07 1.18 0.17 1.12 1.28 (0.62)
Distributions from:..............................Net investment income .............. (0.24) (0.24) (0.24) (0.25) (0.32) (0.26) (0.15) (0.16) (0.22) (0.22)Net realized gain on securities... (0.53) (1.37) (0.46) (1.07) (1.44) (0.48) (0.73) (0.50) (0.08) (0.44)Total distributions ....................... (0.77) (1.61) (0.70) (1.32) (1.76) (0.74) (0.88) (0.66) (0.30) (0.66)
Net asset value at end of period ....... $ 9.98 $ 10.80 $ 12.39 $ 12.09 $ 11.54 $ 11.93 $ 11.49 $ 12.20 $ 11.74 $ 10.76TOTAL RETURN(a) ........................... (0.33)% (0.17)% 8.14% 16.51% 2.20% 10.43% 1.47% 9.45% 11.98% (4.70)%RATIOS/SUPPLEMENTAL DATA....Ratio of expenses to average netassets(b)......................................... 0.74% 0.81% 0.81% 0.82% 0.82% 0.32% 0.32% 0.31% 0.31% 0.32%
Ratio of expenses to average netassets(c)......................................... 0.81% 0.81% 0.81% 0.83% 0.83% 0.33% 0.32% 0.31% 0.32% 0.32%
Ratio of expense reductions toaverage net assets ........................ – – – – – – – – – –
Ratio of net investment income(loss) to average net assets(b) ....... 2.61% 2.40% 2.06% 2.13% 2.55% 1.47% 1.36% 0.97% 1.30% 1.50%
Ratio of net investment income(loss) to average net assets(c) ....... 2.54% 2.40% 2.06% 2.12% 2.54% 1.45% 1.35% 0.96% 1.30% 1.51%
Portfolio turnover rate ........................ 63% 46% 54% 41% 45% 20% 11% 15% 14% 20%Number of shares outstanding atend of period(000’s) ...................... 101,412 88,850 71,348 66,882 50,727 15,995 17,745 19,983 21,173 23,095
Net assets at end of period (000’s) ... $1,012,017 $959,714 $884,180 $808,699 $585,505 $190,741 $203,843 $243,832 $248,630 $248,446
(a) Total return includes, if any, expense reimbursements and expense reductions. The effect of fees and charges incurred at the separate accountlevel are not reflected in these performance figures. If such expenses had been included, the total return would have been lower for each periodpresented.
(b) Includes, if any, expense reimbursement, but excludes, if any, expense reductions.(c) Excludes, if any, expense reimbursements and expense reductions.(d) The per share amounts are calculated using the average share method.
FINANCIAL HIGHLIGHTS
- 183 -

Emerging Economies Fund Global Real Estate Fund
Year Ended May 31, Year Ended May 31,
2020 2019 2018 2017 2016 2020 2019 2018 2017 2016
PER SHARE DATA..............................Net asset value at beginning of period. $ 7.71 $ 8.89 $ 7.94 $ 6.18 $ 7.84 $ 8.00 $ 7.68 $ 7.63 $ 8.02 $ 8.60Income (loss) from investmentoperations: .......................................Net investment income (loss)(d) .... 0.19 0.18 0.16 0.13 0.13 0.15 0.17 0.18 0.16 0.18Net realized and unrealized gain(loss) on investments andforeign currencies ..................... (0.47) (1.22) 0.92 1.74 (1.61) (0.94) 0.44 0.28 0.21 (0.14)
Total income (loss) frominvestment operations............... (0.28) (1.04) 1.08 1.87 (1.48) (0.79) 0.61 0.46 0.37 0.04
Distributions from:.................................Net investment income ................. (0.20) (0.14) (0.13) (0.11) (0.18) (0.24) (0.29) (0.31) (0.34) (0.26)Net realized gain on securities...... – – – – – (0.12) – (0.10) (0.42) (0.36)Total distributions .......................... (0.20) (0.14) (0.13) (0.11) (0.18) (0.36) (0.29) (0.41) (0.76) (0.62)
Net asset value at end of period .......... $ 7.23 $ 7.71 $ 8.89 $ 7.94 $ 6.18 $ 6.85 $ 8.00 $ 7.68 $ 7.63 $ 8.02TOTAL RETURN(a) .............................. (3.74)% (11.75)% 13.50% 30.41% (18.60)% (10.37)% 8.10% 6.19% 4.98% 1.53%RATIOS/SUPPLEMENTALDATA........Ratio of expenses to average netassets(b)............................................ 0.91% 0.93% 0.93% 0.94% 0.97% 0.85% 0.85% 0.86% 0.85% 0.85%
Ratio of expenses to average netassets(c)............................................ 0.91% 0.93% 0.93% 0.94% 0.97% 0.85% 0.85% 0.86% 0.85% 0.85%
Ratio of expense reductions toaverage net assets ........................... 0.00% 0.00% 0.00% 0.00% 0.00% – 0.00% 0.00% 0.00% 0.00%
Ratio of net investment income (loss)to average net assets(b) .................... 2.35% 2.29% 1.80% 1.85% 2.02% 1.84% 2.18% 2.34% 2.04% 2.18%
Ratio of net investment income (loss)to average net assets(c) .................... 2.35% 2.29% 1.80% 1.85% 2.02% 1.84% 2.18% 2.34% 2.04% 2.18%
Portfolio turnover rate ........................... 62% 72% 53% 69% 64% 78% 44% 50% 47% 71%Number of shares outstanding at endof period(000’s) ................................ 97,025 106,698 91,875 89,332 83,618 52,437 57,358 47,313 50,730 61,190
Net assets at end of period (000’s) ...... $701,471 $823,071 $817,232 $708,873 $517,011 $359,442 $458,620 $363,223 $387,137 $490,714
(a) Total return includes, if any, expense reimbursements and expense reductions. The effect of fees and charges incurred at the separate accountlevel are not reflected in these performance figures. If such expenses had been included, the total return would have been lower for each periodpresented.
(b) Includes, if any, expense reimbursement, but excludes, if any, expense reductions.(c) Excludes, if any, expense reimbursements and expense reductions.(d) The per share amounts are calculated using the average share method.
FINANCIAL HIGHLIGHTS
- 184 -

Global Strategy Fund Government Money Market I Fund
Year Ended May31, Year Ended May 31,
2020 2019 2018 2017 2016 2020 2019 2018 2017 2016
PER SHARE DATA..............................Net asset value at beginning of period. $ 10.24 $ 12.02 $ 11.63 $ 10.48 $ 13.58 $ 1.00 $ 1.00 $ 1.00 $ 1.00 $ 1.00Income (loss) from investmentoperations: .......................................Net investment income (loss)(d) .... 0.30 0.44 0.35 0.33 0.27 0.01 0.02 0.01 0.00 0.00Net realized and unrealized gain(loss) on investments andforeign currencies ..................... (0.41) (1.02) 0.20 1.14 (1.80) 0.00 0.00 0.00 0.00 0.00
Total income (loss) frominvestment operations............... (0.11) (0.58) 0.55 1.47 (1.53) 0.01 0.02 0.01 0.00 0.00
Distributions from:.................................Net investment income ................. (0.64) (0.26) – (0.10) (0.72) (0.01) (0.02) (0.01) (0.00) (0.00)Net realized gain on securities...... (0.64) (0.94) (0.16) (0.22) (0.85) – – – – –Total distributions .......................... (1.28) (1.20) (0.16) (0.32) (1.57) (0.01) (0.02) (0.01) (0.00) (0.00)
Net asset value at end of period .......... $ 8.85 $ 10.24 $ 12.02 $ 11.63 $ 10.48 $ 1.00 $ 1.00 $ 1.00 $ 1.00 $ 1.00TOTAL RETURN(a) .............................. (1.01)% (5.19)% 4.72% 14.16% (10.23)% 1.09% 1.69% 0.72%(e) 0.08% 0.01%(e)
RATIOS/SUPPLEMENTAL DATA.......Ratio of expenses to average netassets(b)............................................ 0.72% 0.66% 0.65% 0.66% 0.64% 0.45% 0.51% 0.51% 0.45% 0.26%
Ratio of expenses to average netassets(c)............................................ 0.73% 0.66% 0.65% 0.66% 0.64% 0.51% 0.51% 0.51% 0.53% 0.51%
Ratio of expense reductions toaverage net assets ........................... 0.00% 0.00% 0.00% 0.00% 0.00% – – – – –
Ratio of net investment income (loss)to average net assets(b) .................... 2.95% 3.78% 2.86% 2.94% 2.26% 1.05% 1.70% 0.71% 0.08% 0.01%
Ratio of net investment income (loss)to average net assets(c) .................... 2.94% 3.78% 2.86% 2.94% 2.26% 0.99% 1.70% 0.71% (0.00)% (0.24)%
Portfolio turnover rate ........................... 108% 30% 30% 35% 26% N/A N/A N/A N/A N/ANumber of shares outstanding at endof period(000’s) ................................ 31,935 31,615 32,421 36,070 41,208 415,212 395,196 311,723 330,780 343,490
Net assets at end of period (000’s) ...... $282,708 $323,702 $389,638 $419,325 $431,935 $415,201 $395,183 $311,708 $330,783 $343,490
(a) Total return includes, if any, expense reimbursements and expense reductions. The effect of fees and charges incurred at the separate accountlevel are not reflected in these performance figures. If such expenses had been included, the total return would have been lower for each periodpresented.
(b) Includes, if any, expense reimbursement, but excludes, if any, expense reductions.(c) Excludes, if any, expense reimbursements and expense reductions.(d) The per share amounts are calculated using the average share method.(e) The Fund’s performance figure was increased by less than 0.01% from the effect of payments by an affiliate.
FINANCIAL HIGHLIGHTS
- 185 -

Government Securities Fund Growth Fund
Year Ended May 31, Year Ended May 31,
2020 2019 2018 2017 2016 2020 2019 2018 2017 2016
PER SHARE DATA..................Net asset value at beginning ofperiod ................................... $ 10.57 $ 10.21 $ 10.63 $ 10.85 $ 10.82 $ 16.35 $ 17.36 $ 15.00 $ 13.47 $ 16.40
Income (loss) from investmentoperations: ...........................Net investment income(loss)(d) .......................... 0.23 0.23 0.23 0.21 0.22 0.03 0.06 0.07 0.10 0.12
Net realized andunrealized gain(loss) oninvestments and foreigncurrencies...................... 0.67 0.37 (0.37) (0.18) 0.08 4.22 0.38 3.02 2.56 (0.52)
Total income (loss) frominvestment operations ... 0.90 0.60 (0.14) 0.03 0.30 4.25 0.44 3.09 2.66 (0.40)
Distributions from:.....................Net investment income ...... (0.25) (0.24) (0.28) (0.25) (0.27) (0.07) (0.07) (0.10) (0.12) (0.10)Net realized gain onsecurities ....................... – – – – – (1.71) (1.38) (0.63) (1.01) (2.43)
Total distributions............... (0.25) (0.24) (0.28) (0.25) (0.27) (1.78) (1.45) (0.73) (1.13) (2.53)Net asset value at end ofperiod ................................... $ 11.22 $ 10.57 $ 10.21 $ 10.63 $ 10.85 $ 18.82 $ 16.35 $ 17.36 $ 15.00 $ 13.47
TOTAL RETURN(a) .................. 8.57% 5.98% (1.32)% 0.35% 2.74% 27.42% 2.65% 20.60% 20.48% (0.63)%RATIOS/SUPPLEMENTALDATA ...................................
Ratio of expenses to averagenet assets(b).......................... 0.66% 0.67% 0.66% 0.64% 0.64% 0.68% 0.74% 0.74% 0.76% 0.79%
Ratio of expenses to averagenet assets(c).......................... 0.66% 0.67% 0.66% 0.64% 0.64% 0.81% 0.79% 0.79% 0.81% 0.81%
Ratio of expense reductions toaverage net assets ............... – – – – – – – – – –
Ratio of net investment income(loss) to average netassets(b)................................ 2.08% 2.24% 2.12% 1.95% 2.02% 0.16% 0.34% 0.42% 0.71% 0.78%
Ratio of net investment income(loss) to average netassets(c)................................ 2.08% 2.24% 2.12% 1.95% 2.02% 0.03% 0.29% 0.37% 0.66% 0.77%
Portfolio turnover rate ............... 17% 17% 3% 15% 17% 219% 60% 58% 71% 102%Number of shares outstandingat end of period (000’s) ........ 13,225 13,559 11,890 13,689 14,278 72,176 64,185 69,279 66,758 70,537
Net assets at end of period(000’s) .................................. $148,338 $143,372 $121,425 $145,460 $154,987 $1,358,693 $1,049,181 $1,202,649 $1,001,261 $949,998
(a) Total return includes, if any, expense reimbursements and expense reductions. The effect of fees and charges incurred at the separate accountlevel are not reflected in these performance figures. If such expenses had been included, the total return would have been lower for each periodpresented.
(b) Includes, if any, expense reimbursement, but excludes, if any, expense reductions.(c) Excludes, if any, expense reimbursements and expense reductions.(d) The per share amounts are calculated using the average share method.
FINANCIAL HIGHLIGHTS
- 186 -

Health Sciences Fund Inflation Protected Fund
Year Ended May 31, Year Ended May 31,
2020 2019 2018 2017 2016 2020 2019 2018 2017 2016
PER SHARE DATA..............................Net asset value at beginning of period. $ 19.35 $ 20.47 $ 19.26 $ 19.88 $ 27.01 $ 11.07 $ 10.88 $ 11.07 $ 10.76 $ 10.92Income (loss) from investmentoperations: .......................................Net investment income (loss)(d) .... (0.04) (0.03) (0.05) (0.04) (0.09) 0.22 0.24 0.26 0.25 0.15Net realized and unrealized gain(loss) on investments andforeign currencies ..................... 4.92 0.72 3.86 1.80 (3.83) 0.32 0.14 (0.14) 0.10 (0.16)
Total income (loss) frominvestment operations............... 4.88 0.69 3.81 1.76 (3.92) 0.54 0.38 0.12 0.35 (0.01)
Distributions from:.................................Net investment income ................. – – – – – (0.27) (0.18) (0.21) (0.03) (0.13)Net realized gain on securities...... (1.59) (1.81) (2.60) (2.38) (3.21) – (0.01) (0.10) (0.01) (0.02)Total distributions .......................... (1.59) (1.81) (2.60) (2.38) (3.21) (0.27) (0.19) (0.31) (0.04) (0.15)
Net asset value at end of period .......... $ 22.64 $ 19.35 $ 20.47 $ 19.26 $ 19.88 $ 11.34 $ 11.07 $ 10.88 $ 11.07 $ 10.76TOTAL RETURN(a) .............................. 26.32% 3.09% 19.80% 9.37% (13.12)% 4.88% 3.51% 1.11% 3.29% (0.09)%RATIOS/SUPPLEMENTAL DATA.......Ratio of expenses to average netassets(b)............................................ 1.05% 1.05% 1.06% 1.07% 1.06% 0.57% 0.56% 0.57% 0.58% 0.59%
Ratio of expenses to average netassets(c)............................................ 1.09% 1.09% 1.09% 1.09% 1.09% 0.57% 0.56% 0.57% 0.58% 0.59%
Ratio of expense reductions toaverage net assets ........................... – – 0.00% 0.00% 0.00% – – – – –
Ratio of net investment income (loss)to average net assets(b) .................... (0.18)% (0.14)% (0.23)% (0.21)% (0.40)% 1.94% 2.27% 2.29% 2.33% 1.38%
Ratio of net investment income (loss)to average net assets(c) .................... (0.21)% (0.18)% (0.27)% (0.23)% (0.43)% 1.94% 2.27% 2.29% 2.33% 1.38%
Portfolio turnover rate ........................... 37% 33% 44% 30% 31% 38% 42% 34% 42% 33%Number of shares outstanding at endof period (000’s) ............................... 37,583 38,358 37,583 36,215 40,409 67,416 63,309 54,697 57,066 42,345
Net assets at end of period (000’s) ...... $850,757 $742,072 $769,233 $697,639 $803,402 $764,607 $700,574 $595,043 $631,552 $455,830
(a) Total return includes, if any, expense reimbursements and expense reductions. The effect of fees and charges incurred at the separate accountlevel are not reflected in these performance figures. If such expenses had been included, the total return would have been lower for each periodpresented.
(b) Includes, if any, expense reimbursement, but excludes, if any, expense reductions.(c) Excludes, if any, expense reimbursements and expense reductions.(d) The per share amounts are calculated using the average share method.
FINANCIAL HIGHLIGHTS
- 187 -

International Equities Index Fund International Government Bond Fund
Year Ended May 31, Year Ended May 31,
2020 2019 2018 2017 2016 2020 2019 2018 2017 2016
PER SHARE DATA..................Net asset value at beginning ofperiod ................................... $ 6.74 $ 7.41 $ 7.02 $ 6.22 $ 7.13 $ 11.82 $ 11.64 $ 11.71 $ 11.43 $ 11.26
Income (loss) from investmentoperations: ...........................Net investment income(loss)(d) .......................... 0.13 0.19 0.19 0.17 0.16 0.29 0.28 0.24 0.24 0.27
Net realized andunrealized gain (loss)on investments andforeign currencies.......... (0.36) (0.62) 0.35 0.81 (0.89) 0.24 0.09 (0.20) 0.04 0.23
Total income (loss) frominvestment operations ... (0.23) (0.43) 0.54 0.98 (0.73) 0.53 0.37 0.04 0.28 0.50
Distributions from:.....................Net investment income ...... (0.19) (0.24) (0.15) (0.18) (0.18) (0.21) (0.18) (0.11) – (0.29)Net realized gain onsecurities ....................... (0.13) – – – – – (0.01) – – (0.04)
Total distributions............... (0.32) (0.24) (0.15) (0.18) (0.18) (0.21) (0.19) (0.11) – (0.33)Net asset value at end ofperiod ................................... $ 6.19 $ 6.74 $ 7.41 $ 7.02 $ 6.22 $ 12.14 $ 11.82 $ 11.64 $ 11.71 $ 11.43
TOTAL RETURN(a) .................. (3.42)% (5.81)% 7.63% 15.98% (9.99)% 4.44% 3.26% 0.32% 2.45% 4.61%RATIOS/SUPPLEMENTALDATA ...................................
Ratio of expenses to averagenet assets(b).......................... 0.43% 0.43% 0.42% 0.44% 0.43% 0.65% 0.65% 0.65% 0.64% 0.64%
Ratio of expenses to averagenet assets(c).......................... 0.43% 0.43% 0.42% 0.44% 0.43% 0.65% 0.65% 0.65% 0.64% 0.64%
Ratio of expense reductions toaverage net assets ............... – – – – – – – – – –
Ratio of net investment income(loss) to average netassets(b)................................ 1.89% 2.72% 2.57% 2.62% 2.52% 2.34% 2.44% 2.04% 2.03% 2.45%
Ratio of net investment income(loss) to average netassets(c)................................ 1.89% 2.72% 2.57% 2.62% 2.52% 2.34% 2.44% 2.04% 2.03% 2.45%
Portfolio turnover rate ............... 10% 15% 17% 11% 4% 105% 94% 95% 70% 95%Number of shares outstandingat end of period (000’s) ........ 201,429 154,662 173,854 155,797 159,381 14,125 17,187 18,875 15,879 17,601
Net assets at end of period(000’s) .................................. $1,246,804 $1,041,727 $1,287,987 $1,093,865 $991,380 $171,444 $203,184 $219,748 $185,943 $201,253
(a) Total return includes, if any, expense reimbursements and expense reductions. The effect of fees and charges incurred at the separate accountlevel are not reflected in these performance figures. If such expenses had been included, the total return would have been lower for each periodpresented.
(b) Includes, if any, expense reimbursement, but excludes, if any, expense reductions.(c) Excludes, if any, expense reimbursements and expense reductions.(d) The per share amounts are calculated using the average share method.
FINANCIAL HIGHLIGHTS
- 188 -

International Growth Fund International Socially Responsible Fund
Year Ended May 31, Year Ended May 31,
2020 2019 2018 2017 2016 2020 2019 2018 2017 2016
PER SHARE DATA..............................Net asset value at beginning of period. $ 11.35 $ 15.01 $ 13.04 $ 11.63 $ 14.18 $ 25.91 $ 26.24 $ 23.78 $ 21.01 $ 22.11Income (loss) from investmentoperations: .......................................Net investment income (loss)(d) .... – 0.04 0.08 0.14 0.15 0.42 0.44 0.37 0.32 0.34Net realized and unrealized gain(loss) on investments andforeign currencies ..................... 1.13 (0.19) 2.29 1.45 (1.58) (0.96) (0.29) 2.52 2.84 (1.02)
Total income (loss) frominvestment operations............... 1.13 (0.15) 2.37 1.59 (1.43) (0.54) 0.15 2.89 3.16 (0.68)
Distributions from:.................................Net investment income ................. (0.01) (0.10) (0.19) (0.18) (0.17) (0.51) (0.48) (0.43) (0.39) (0.42)Net realized gain on securities...... – (3.41) (0.21) – (0.95) (0.89) – – – –Total distributions .......................... (0.01) (3.51) (0.40) (0.18) (1.12) (1.40) (0.48) (0.43) (0.39) (0.42)
Net asset value at end of period .......... $ 12.47 $ 11.35 $ 15.01 $ 13.04 $ 11.63 $ 23.97 $ 25.91 $ 26.24 $ 23.78 $ 21.01TOTAL RETURN(a) .............................. 10.00% (0.17)%(e) 18.38% 13.81% (9.20)% (2.05)% 0.57% 12.16% 15.15% (2.83)%RATIOS/SUPPLEMENTAL DATA.......Ratio of expenses to average netassets(b)............................................ 0.86% 0.89% 0.98% 1.01% 1.01% 0.63% 0.63% 0.62% 0.62% 0.63%
Ratio of expenses to average netassets(c)............................................ 1.06% 1.09% 1.08% 1.10% 1.06% 0.63% 0.63% 0.62% 0.62% 0.63%
Ratio of expense reductions toaverage net assets ........................... – – 0.00% 0.00% 0.00% – – – – –
Ratio of net investment income (loss)to average net assets(b) .................... (0.03)% 0.30% 0.58% 1.15% 1.21% 1.57% 1.67% 1.44% 1.47% 1.65%
Ratio of net investment income (loss)to average net assets(c) .................... (0.23)% 0.10% 0.47% 1.06% 1.16% 1.57% 1.67% 1.44% 1.47% 1.65%
Portfolio turnover rate ........................... 22% 35% 130% 39% 36% 68% 2% 5% 23% 0%Number of shares outstanding at endof period (000’s) ............................... 37,029 41,093 32,707 33,688 44,791 13,629 14,044 16,331 17,515 17,949
Net assets at end of period (000’s) ...... $461,774 $466,362 $490,921 $439,222 $521,012 $326,671 $363,818 $428,452 $416,564 $377,114
(a) Total return includes, if any, expense reimbursements and expense reductions. The effect of fees and charges incurred at the separate accountlevel are not reflected in these performance figures. If such expenses had been included, the total return would have been lower for each periodpresented.
(b) Includes, if any, expense reimbursement, but excludes, if any, expense reductions.(c) Excludes, if any, expense reimbursements and expense reductions.(d) The per share amounts are calculated using the average share method.(e) The Fund’s performance figure was increased by less than 0.01% from gains on the disposal of investments in violation of investment restrictions.
FINANCIAL HIGHLIGHTS
- 189 -

International Value Fund Large Cap Core Fund
Year Ended May31, Year Ended May 31,
2020 2019 2018 2017 2016 2020 2019 2018 2017 2016
PER SHARE DATA..............................Net asset value at beginning of period. $ 8.93 $ 10.67 $ 10.54 $ 8.78 $ 10.44 $ 11.00 $ 11.70 $ 11.35 $ 10.77 $ 13.74Income (loss) from investmentoperations: .......................................Net investment income (loss)(d) .... 0.18 0.20 0.21 0.20 0.18 0.11 0.12 0.11 0.12 0.12Net realized and unrealized gain(loss) on investments andforeign currencies ..................... (1.09) (1.66) 0.13 1.75 (1.64) 1.52 0.23 0.98 1.44 (0.25)
Total income (loss) frominvestment operations............... (0.91) (1.46) 0.34 1.95 (1.46) 1.63 0.35 1.09 1.56 (0.13)
Distributions from:.................................Net investment income ................. (0.23) (0.28) (0.21) (0.19) (0.20) (0.14) (0.11) (0.12) (0.11) (0.45)Net realized gain on securities...... (0.01) – – – – (0.83) (0.94) (0.62) (0.87) (2.39)Total distributions .......................... (0.24) (0.28) (0.21) (0.19) (0.20) (0.97) (1.05) (0.74) (0.98) (2.84)
Net asset value at end of period .......... $ 7.78 $ 8.93 $ 10.67 $ 10.54 $ 8.78 $ 11.66 $ 11.00 $ 11.70 $ 11.35 $ 10.77TOTAL RETURN(a) .............................. (10.17)% (13.83)% 3.19% 22.36% (13.72)% 15.53% 3.11% 9.46% 14.97% 1.84%RATIOS/SUPPLEMENTAL DATA.......Ratio of expenses to average netassets(b)............................................ 0.73% 0.77% 0.79% 0.80% 0.79% 0.85% 0.84% 0.84% 0.83% 0.83%
Ratio of expenses to average netassets(c)............................................ 0.80% 0.82% 0.79% 0.80% 0.79% 0.85% 0.84% 0.84% 0.83% 0.83%
Ratio of expense reductions toaverage net assets ........................... 0.00% 0.00% 0.00% 0.00% 0.00% 0.00% 0.01% 0.00% 0.01% 0.01%
Ratio of net investment income (loss)to average net assets(b) .................... 2.01% 1.97% 1.93% 2.04% 1.97% 0.91% 1.03% 0.88% 1.03% 0.93%
Ratio of net investment income (loss)to average net assets(c) .................... 1.94% 1.92% 1.93% 2.04% 1.97% 0.91% 1.03% 0.88% 1.03% 0.93%
Portfolio turnover rate ........................... 64% 136% 30% 40% 21% 49% 56% 59% 54% 53%Number of shares outstanding at endof period(000’s) ................................ 77,667 77,083 81,504 83,103 93,244 14,987 15,130 15,408 15,120 15,240
Net assets at end of period (000’s) ...... $604,123 $688,485 $869,416 $876,165 $818,993 $174,700 $166,428 $180,349 $171,627 $164,060
(a) Total return includes, if any, expense reimbursements and expense reductions. The effect of fees and charges incurred at the separate accountlevel are not reflected in these performance figures. If such expenses had been included, the total return would have been lower for each periodpresented.
(b) Includes, if any, expense reimbursement, but excludes, if any, expense reductions.(c) Excludes, if any, expense reimbursements and expense reductions.(d) The per share amounts are calculated using the average share method.
FINANCIAL HIGHLIGHTS
- 190 -

Large Capital Growth Fund Mid Cap Index Fund
Year Ended May 31, Year Ended May 31,
2020 2019 2018 2017 2016 2020 2019 2018 2017 2016
PER SHARE DATA...............Net asset value at beginningof period............................ $ 15.68 $ 15.01 $ 13.66 $ 12.21 $ 12.75 $ 23.52 $ 28.04 $ 26.43 $ 24.87 $ 28.52
Income (loss) frominvestment operations: ......Net investment income(loss)(d) ....................... 0.08 0.13 0.10 0.10 0.09 0.30 0.32 0.35 0.30 0.32
Net realized andunrealized gain (loss)on investments andforeign currencies....... 2.50 1.71 2.09 1.87 0.04 (0.70) (1.86) 3.45 3.91 (1.06)
Total income (loss) frominvestment operations. 2.58 1.84 2.19 1.97 0.13 (0.40) (1.54) 3.80 4.21 (0.74)
Distributions from:..................Net investment income ... (0.13) (0.10) (0.09) (0.09) (0.11) (0.36) (0.37) (0.32) (0.34) (0.34)Net realized gain onsecurities .................... (1.31) (1.07) (0.75) (0.43) (0.56) (2.01) (2.61) (1.87) (2.31) (2.57)
Total distributions............ (1.44) (1.17) (0.84) (0.52) (0.67) (2.37) (2.98) (2.19) (2.65) (2.91)Net asset value at end ofperiod ................................ $ 16.82 $ 15.68 $ 15.01 $ 13.66 $ 12.21 $ 20.75 $ 23.52 $ 28.04 $ 26.43 $ 24.87
TOTAL RETURN(a) ............... 17.08% 12.50% 16.00% 16.50% 1.73% (1.25)% (5.76)% 14.51% 16.94% (0.69)%RATIOS/SUPPLEMENTALDATA ................................
Ratio of expenses to averagenet assets(b)....................... 0.75% 0.75% 0.75% 0.75% 0.75% 0.36% 0.36% 0.35% 0.36% 0.36%
Ratio of expenses to averagenet assets(c)....................... 0.75% 0.75% 0.75% 0.75% 0.75% 0.36% 0.36% 0.35% 0.36% 0.36%
Ratio of expense reductionsto average net assets ........ 0.00% – 0.00% 0.00% 0.00% – – – – –
Ratio of net investmentincome (loss) to averagenet assets(b)....................... 0.45% 0.81% 0.70% 0.76% 0.73% 1.28% 1.20% 1.25% 1.14% 1.23%
Ratio of net investmentincome (loss) to averagenet assets(c)....................... 0.45% 0.81% 0.70% 0.76% 0.73% 1.28% 1.20% 1.25% 1.14% 1.23%
Portfolio turnover rate ............ 37% 26% 21% 23% 24% 14% 14% 15% 14% 15%Number of sharesoutstanding at end ofperiod (000’s) .................... 31,185 30,448 29,613 30,427 32,186 131,740 123,200 122,466 128,379 119,786
Net assets at end of period(000’s) ............................... $524,630 $477,301 $444,633 $415,566 $393,063 $2,734,114 $2,897,313 $3,434,089 $3,392,738 $2,979,477
(a) Total return includes, if any, expense reimbursements and expense reductions. The effect of fees and charges incurred at the separate accountlevel are not reflected in these performance figures. If such expenses had been included, the total return would have been lower for each periodpresented.
(b) Includes, if any, expense reimbursement, but excludes, if any, expense reductions.(c) Excludes, if any, expense reimbursements and expense reductions.(d) The per share amounts are calculated using the average share method.
FINANCIAL HIGHLIGHTS
- 191 -

Mid Cap Strategic Growth Fund Nasdaq-100® Index Fund
Year Ended May 31, Year Ended May 31,
2020 2019 2018 2017 2016 2020 2019 2018 2017 2016
PER SHARE DATA..............................Net asset value at beginning of period. $ 15.49 $ 15.85 $ 13.92 $ 12.58 $ 15.35 $ 14.08 $ 13.97 $ 12.11 $ 9.92 $ 10.36Income (loss) from investmentoperations: .......................................Net investment income (loss)(d) .... (0.00) 0.00 0.01 0.02 0.00 0.08 0.12 0.06 0.07 0.08Net realized and unrealized gain(loss) on investments andforeign currencies ..................... 1.89 1.13 2.66 2.24 (0.82) 4.72 0.26 2.48 2.73 (0.02)
Total income (loss) frominvestment operations............... 1.89 1.13 2.67 2.26 (0.82) 4.80 0.38 2.54 2.80 0.06
Distributions from:.................................Net investment income ................. – (0.00) (0.01) – – (0.14) (0.06) (0.07) (0.08) (0.07)Net realized gain on securities...... (0.88) (1.49) (0.73) (0.92) (1.95) (0.45) (0.21) (0.61) (0.53) (0.43)Total distributions .......................... (0.88) (1.49) (0.74) (0.92) (1.95) (0.59) (0.27) (0.68) (0.61) (0.50)
Net asset value at end of period .......... $ 16.50 $ 15.49 $ 15.85 $ 13.92 $ 12.58 $ 18.29 $ 14.08 $ 13.97 $ 12.11 $ 9.92TOTAL RETURN(a) .............................. 12.76% 7.45% 19.17% 18.43% (2.91)% 34.71% 2.76% 20.94% 28.88% 1.18%RATIOS/SUPPLEMENTAL DATA.......Ratio of expenses to average netassets(b)............................................ 0.81% 0.81% 0.82% 0.82% 0.83% 0.53% 0.53% 0.53% 0.53% 0.53%
Ratio of expenses to average netassets(c)............................................ 0.81% 0.81% 0.82% 0.82% 0.83% 0.53% 0.54% 0.54% 0.55% 0.56%
Ratio of expense reductions toaverage net assets ........................... 0.00% 0.00% 0.00% 0.00% 0.01% – – – – –
Ratio of net investment income (loss)to average net assets(b) .................... (0.03)% (0.02)% 0.03% 0.12% 0.00% 0.49% 0.85% 0.49% 0.67% 0.80%
Ratio of net investment income (loss)to average net assets(c) .................... (0.03)% (0.02)% 0.03% 0.12% 0.00% 0.49% 0.84% 0.48% 0.66% 0.78%
Portfolio turnover rate ........................... 25% 31% 40% 38% 95% 8% 6% 3% 4% 8%Number of shares outstanding at endof period(000’s) ................................ 19,079 19,581 18,404 18,691 19,764 34,045 35,447 33,891 32,558 32,164
Net assets at end of period (000’s) ...... $314,845 $303,288 $291,655 $260,170 $248,619 $622,519 $499,269 $473,513 $394,400 $319,222
(a) Total return includes, if any, expense reimbursements and expense reductions. The effect of fees and charges incurred at the separate accountlevel are not reflected in these performance figures. If such expenses had been included, the total return would have been lower for each periodpresented.
(b) Includes, if any, expense reimbursement, but excludes, if any, expense reductions.(c) Excludes, if any, expense reimbursements and expense reductions.(d) The per share amounts are calculated using the average share method.
FINANCIAL HIGHLIGHTS
- 192 -

Science & Technology Fund Small Cap Aggressive Growth Fund
Year Ended May 31, Year Ended May 31,
2020 2019 2018 2017 2016 2020 2019 2018 2017 2016
PER SHARE DATA..................Net asset value at beginning ofperiod ................................... $ 25.95 $ 31.14 $ 26.00 $ 21.30 $ 26.68 $ 14.06 $ 16.44 $ 12.25 $ 10.17 $ 14.56
Income (loss) from investmentoperations: ...........................Net investment income(loss)(d) .......................... 0.05 (0.10) (0.09) (0.01) (0.02) (0.10) (0.09) (0.09) (0.04) (0.03)
Net realized andunrealized gain (loss)on investments andforeign currencies.......... 7.31 0.94 7.89 6.56 (0.71) 1.57 (0.13) 4.68 2.67 (2.61)
Total income (loss) frominvestment operations ... 7.36 0.84 7.80 6.55 (0.73) 1.47 (0.22) 4.59 2.63 (2.64)
Distributions from:.....................Net investment income ...... – – – – – – – – – –Net realized gain onsecurities ....................... (3.43) (6.03) (2.66) (1.85) (4.65) (1.98) (2.16) (0.40) (0.55) (1.75)
Total distributions............... (3.43) (6.03) (2.66) (1.85) (4.65) (1.98) (2.16) (0.40) (0.55) (1.75)Net asset value at end ofperiod ................................... $ 29.88 $ 25.95 $ 31.14 $ 26.00 $ 21.30 $ 13.55 $ 14.06 $ 16.44 $ 12.25 $ 10.17
TOTAL RETURN(a) .................. 30.60%(e) 3.04% 30.08% 31.82% 0.39% 12.33% (0.89)% 37.58% 26.17% (16.21)%RATIOS/SUPPLEMENTALDATA ...................................
Ratio of expenses to averagenet assets(b).......................... 0.97% 0.98% 0.97% 0.99% 0.99% 0.99% 0.99% 0.99% 0.99% 0.99%
Ratio of expenses to averagenet assets(c).......................... 0.97% 0.98% 0.97% 0.99% 0.99% 1.01% 1.00% 1.00% 1.02% 1.01%
Ratio of expense reductions toaverage net assets ............... 0.01% 0.00% 0.00% 0.01% 0.01% 0.00% 0.01% 0.00% 0.00% –
Ratio of net investment income(loss) to average netassets(b)................................ 0.19% (0.35)% (0.33)% (0.06)% (0.07)% (0.71)% (0.61)% (0.61)% (0.33)% (0.24)%
Ratio of net investment income(loss) to average netassets(c)................................ 0.19% (0.35)% (0.33)% (0.06)% (0.07)% (0.73)% (0.63)% (0.62)% (0.36)% (0.26)%
Portfolio turnover rate ............... 98% 89% 84% 92% 107% 87% 94% 74% 82% 101%Number of shares outstandingat end of period (000’s) ........ 54,314 53,666 45,064 43,461 43,694 11,850 11,517 9,560 9,176 10,084
Net assets at end of period(000’s) .................................. $1,623,083 $1,392,834 $1,403,433 $1,130,159 $930,756 $160,527 $161,912 $157,170 $112,391 $102,540
(a) Total return includes, if any, expense reimbursements and expense reductions. The effect of fees and charges incurred at the separate accountlevel are not reflected in these performance figures. If such expenses had been included, the total return would have been lower for each periodpresented.
(b) Includes, if any, expense reimbursement, but excludes, if any, expense reductions.(c) Excludes, if any, expense reimbursements and expense reductions.(d) The per share amounts are calculated using the average share method.(e) The Fund’s performance figure was increased by 0.04% from gains on the disposal of investments in violation of investment restrictions.
FINANCIAL HIGHLIGHTS
- 193 -

Small Cap Fund Small Cap Index Fund
Year Ended May 31, Year Ended May 31,
2020 2019 2018 2017 2016 2020 2019 2018 2017 2016
PER SHARE DATA.....................Net asset value at beginning ofperiod ...................................... $ 10.30 $ 11.54 $ 11.59 $ 10.96 $ 14.18 $ 18.76 $ 22.81 $ 20.23 $ 17.91 $ 21.23
Income (loss) from investmentoperations: ..............................Net investment income(loss)(d) ............................. 0.04 0.05 0.05 0.03 0.04 0.17 0.22 0.22 0.21 0.24
Net realized and unrealizedgain (loss) on investmentsand foreign currencies...... 0.14 (0.27) 1.97 1.58 (1.17) (0.99) (2.25) 3.85 3.43 (1.86)
Total income (loss) frominvestment operations ...... 0.18 (0.22) 2.02 1.61 (1.13) (0.82) (2.03) 4.07 3.64 (1.62)
Distributions from:........................Net investment income......... (0.04) (0.05) (0.04) (0.04) (0.03) (0.32) (0.24) (0.22) (0.23) (0.25)Net realized gain onsecurities .......................... (0.90) (0.97) (2.03) (0.94) (2.06) (2.54) (1.78) (1.27) (1.09) (1.45)
Total distributions ................. (0.94) (1.02) (2.07) (0.98) (2.09) (2.86) (2.02) (1.49) (1.32) (1.70)Net asset value at end of period . $ 9.54 $ 10.30 $ 11.54 $ 11.59 $ 10.96 $ 15.08 $ 18.76 $ 22.81 $ 20.23 $ 17.91TOTAL RETURN(a) ..................... 2.27% (1.94)% 17.95% 14.64% (5.20)% (3.87)% (9.23)% 20.42% 20.25% (6.05)%RATIOS/SUPPLEMENTALDATA ......................................
Ratio of expenses to average netassets(b)................................... 0.93% 0.93% 0.93% 0.93% 0.93% 0.44% 0.40% 0.40% 0.41% 0.42%
Ratio of expenses to average netassets(c)................................... 1.03% 1.03% 1.03% 1.02% 1.01% 0.44% 0.40% 0.40% 0.41% 0.42%
Ratio of expense reductions toaverage net assets .................. 0.00% 0.00% 0.00% 0.00% 0.00% – – – – –
Ratio of net investment income(loss) to average net assets(b) . 0.34% 0.33% 0.40% 0.27% 0.29% 0.94% 1.01% 0.99% 1.07% 1.26%
Ratio of net investment income(loss) to average net assets(c) . 0.24% 0.23% 0.31% 0.18% 0.21% 0.94% 1.01% 0.99% 1.07% 1.26%
Portfolio turnover rate .................. 25% 25% 25% 82% 29% 13% 16% 17% 12% 13%Number of shares outstanding atend of period (000’s) ............... 27,730 27,569 27,836 26,815 27,431 59,576 53,944 56,750 59,190 55,029
Net assets at end of period(000’s) ..................................... $264,495 $284,018 $321,236 $310,704 $300,734 $898,557 $1,012,040 $1,294,430 $1,197,209 $985,833
(a) Total return includes, if any, expense reimbursements and expense reductions. The effect of fees and charges incurred at the separate accountlevel are not reflected in these performance figures. If such expenses had been included, the total return would have been lower for each periodpresented.
(b) Includes, if any, expense reimbursements, but excludes, if any, expense reductions.(c) Excludes, if any, expense reimbursements and expense reductions.(d) The per share amounts are calculated using the average share method.
FINANCIAL HIGHLIGHTS
- 194 -
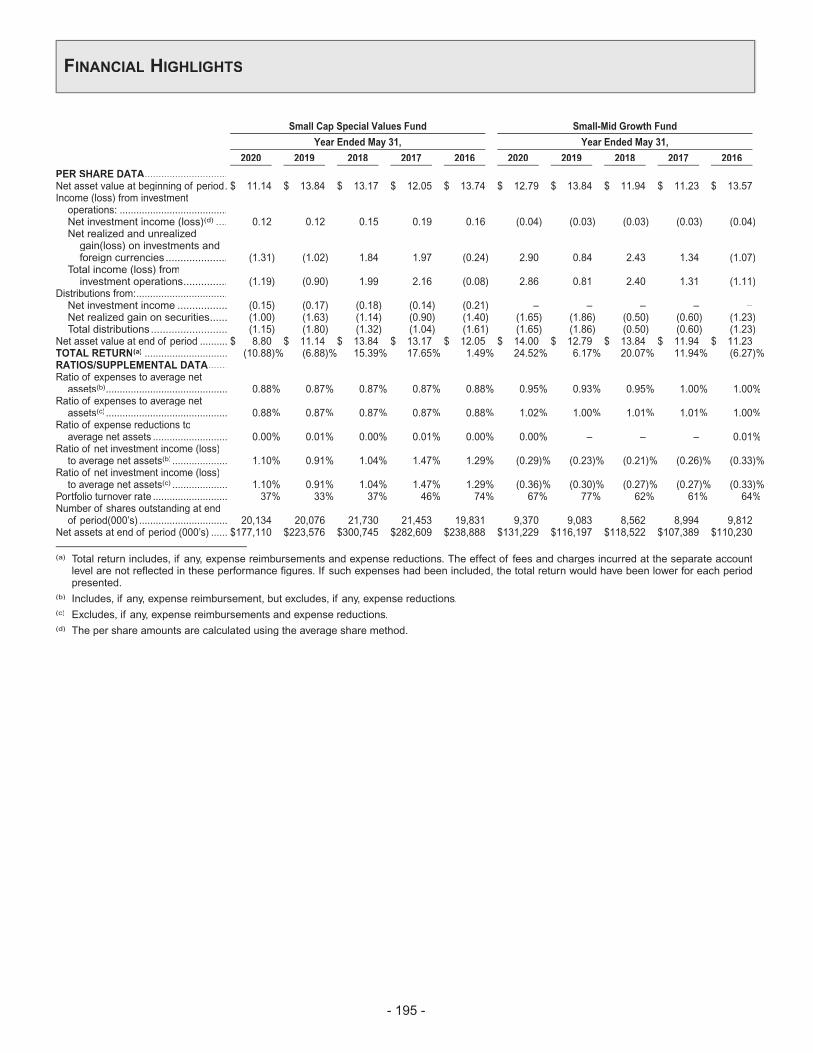
Small Cap Special Values Fund Small-Mid Growth Fund
Year Ended May 31, Year Ended May 31,
2020 2019 2018 2017 2016 2020 2019 2018 2017 2016
PER SHARE DATA..............................Net asset value at beginning of period. $ 11.14 $ 13.84 $ 13.17 $ 12.05 $ 13.74 $ 12.79 $ 13.84 $ 11.94 $ 11.23 $ 13.57Income (loss) from investmentoperations: .......................................Net investment income (loss)(d) .... 0.12 0.12 0.15 0.19 0.16 (0.04) (0.03) (0.03) (0.03) (0.04)Net realized and unrealizedgain(loss) on investments andforeign currencies ..................... (1.31) (1.02) 1.84 1.97 (0.24) 2.90 0.84 2.43 1.34 (1.07)
Total income (loss) frominvestment operations............... (1.19) (0.90) 1.99 2.16 (0.08) 2.86 0.81 2.40 1.31 (1.11)
Distributions from:.................................Net investment income ................. (0.15) (0.17) (0.18) (0.14) (0.21) – – – – –Net realized gain on securities...... (1.00) (1.63) (1.14) (0.90) (1.40) (1.65) (1.86) (0.50) (0.60) (1.23)Total distributions .......................... (1.15) (1.80) (1.32) (1.04) (1.61) (1.65) (1.86) (0.50) (0.60) (1.23)
Net asset value at end of period .......... $ 8.80 $ 11.14 $ 13.84 $ 13.17 $ 12.05 $ 14.00 $ 12.79 $ 13.84 $ 11.94 $ 11.23TOTAL RETURN(a) .............................. (10.88)% (6.88)% 15.39% 17.65% 1.49% 24.52% 6.17% 20.07% 11.94% (6.27)%RATIOS/SUPPLEMENTAL DATA.......Ratio of expenses to average netassets(b)............................................ 0.88% 0.87% 0.87% 0.87% 0.88% 0.95% 0.93% 0.95% 1.00% 1.00%
Ratio of expenses to average netassets(c)............................................ 0.88% 0.87% 0.87% 0.87% 0.88% 1.02% 1.00% 1.01% 1.01% 1.00%
Ratio of expense reductions toaverage net assets ........................... 0.00% 0.01% 0.00% 0.01% 0.00% 0.00% – – – 0.01%
Ratio of net investment income (loss)to average net assets(b) .................... 1.10% 0.91% 1.04% 1.47% 1.29% (0.29)% (0.23)% (0.21)% (0.26)% (0.33)%
Ratio of net investment income (loss)to average net assets(c) .................... 1.10% 0.91% 1.04% 1.47% 1.29% (0.36)% (0.30)% (0.27)% (0.27)% (0.33)%
Portfolio turnover rate ........................... 37% 33% 37% 46% 74% 67% 77% 62% 61% 64%Number of shares outstanding at endof period(000’s) ................................ 20,134 20,076 21,730 21,453 19,831 9,370 9,083 8,562 8,994 9,812
Net assets at end of period (000’s) ...... $177,110 $223,576 $300,745 $282,609 $238,888 $131,229 $116,197 $118,522 $107,389 $110,230
(a) Total return includes, if any, expense reimbursements and expense reductions. The effect of fees and charges incurred at the separate accountlevel are not reflected in these performance figures. If such expenses had been included, the total return would have been lower for each periodpresented.
(b) Includes, if any, expense reimbursement, but excludes, if any, expense reductions.(c) Excludes, if any, expense reimbursements and expense reductions.(d) The per share amounts are calculated using the average share method.
FINANCIAL HIGHLIGHTS
- 195 -
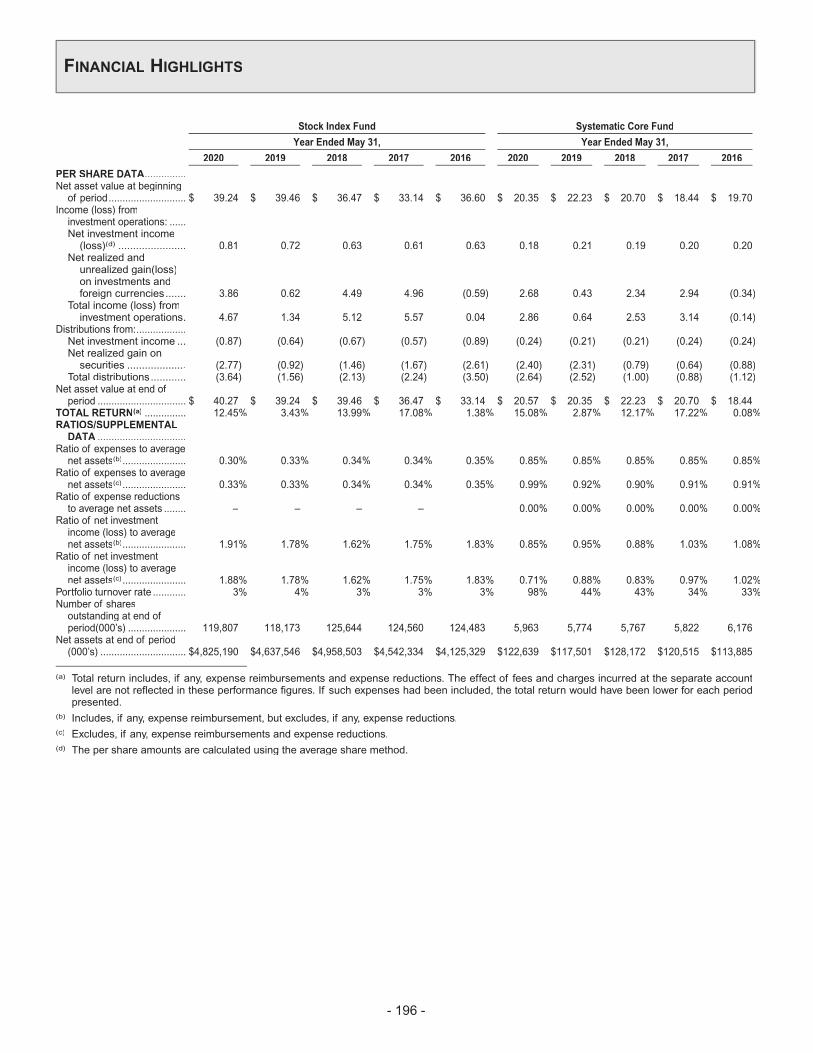
Stock Index Fund Systematic Core Fund
Year Ended May 31, Year Ended May 31,
2020 2019 2018 2017 2016 2020 2019 2018 2017 2016
PER SHARE DATA...............Net asset value at beginningof period............................ $ 39.24 $ 39.46 $ 36.47 $ 33.14 $ 36.60 $ 20.35 $ 22.23 $ 20.70 $ 18.44 $ 19.70
Income (loss) frominvestment operations: ......Net investment income(loss)(d) ....................... 0.81 0.72 0.63 0.61 0.63 0.18 0.21 0.19 0.20 0.20
Net realized andunrealized gain(loss)on investments andforeign currencies....... 3.86 0.62 4.49 4.96 (0.59) 2.68 0.43 2.34 2.94 (0.34)
Total income (loss) frominvestment operations. 4.67 1.34 5.12 5.57 0.04 2.86 0.64 2.53 3.14 (0.14)
Distributions from:..................Net investment income ... (0.87) (0.64) (0.67) (0.57) (0.89) (0.24) (0.21) (0.21) (0.24) (0.24)Net realized gain onsecurities .................... (2.77) (0.92) (1.46) (1.67) (2.61) (2.40) (2.31) (0.79) (0.64) (0.88)
Total distributions............ (3.64) (1.56) (2.13) (2.24) (3.50) (2.64) (2.52) (1.00) (0.88) (1.12)Net asset value at end ofperiod ................................ $ 40.27 $ 39.24 $ 39.46 $ 36.47 $ 33.14 $ 20.57 $ 20.35 $ 22.23 $ 20.70 $ 18.44
TOTAL RETURN(a) ............... 12.45% 3.43% 13.99% 17.08% 1.38% 15.08% 2.87% 12.17% 17.22% 0.08%RATIOS/SUPPLEMENTALDATA ................................
Ratio of expenses to averagenet assets(b)....................... 0.30% 0.33% 0.34% 0.34% 0.35% 0.85% 0.85% 0.85% 0.85% 0.85%
Ratio of expenses to averagenet assets(c)....................... 0.33% 0.33% 0.34% 0.34% 0.35% 0.99% 0.92% 0.90% 0.91% 0.91%
Ratio of expense reductionsto average net assets ........ – – – – – 0.00% 0.00% 0.00% 0.00% 0.00%
Ratio of net investmentincome (loss) to averagenet assets(b)....................... 1.91% 1.78% 1.62% 1.75% 1.83% 0.85% 0.95% 0.88% 1.03% 1.08%
Ratio of net investmentincome (loss) to averagenet assets(c)....................... 1.88% 1.78% 1.62% 1.75% 1.83% 0.71% 0.88% 0.83% 0.97% 1.02%
Portfolio turnover rate ............ 3% 4% 3% 3% 3% 98% 44% 43% 34% 33%Number of sharesoutstanding at end ofperiod(000’s) ..................... 119,807 118,173 125,644 124,560 124,483 5,963 5,774 5,767 5,822 6,176
Net assets at end of period(000’s) ............................... $4,825,190 $4,637,546 $4,958,503 $4,542,334 $4,125,329 $122,639 $117,501 $128,172 $120,515 $113,885
(a) Total return includes, if any, expense reimbursements and expense reductions. The effect of fees and charges incurred at the separate accountlevel are not reflected in these performance figures. If such expenses had been included, the total return would have been lower for each periodpresented.
(b) Includes, if any, expense reimbursement, but excludes, if any, expense reductions.(c) Excludes, if any, expense reimbursements and expense reductions.(d) The per share amounts are calculated using the average share method.
FINANCIAL HIGHLIGHTS
- 196 -

Systematic Value Fund Value Fund
Year Ended May 31, Year Ended May 31,
2020 2019 2018 2017 2016 2020 2019 2018 2017 2016
PER SHARE DATA........................................Net asset value at beginning of period........... $ 13.93 $ 15.91 $ 15.64 $ 13.97 $ 16.03 $ 17.50 $ 17.87 $ 16.62 $ 14.93 $ 15.46Income (loss) from investment operations:.....Net investment income (loss)(d).............. 0.23 0.34 0.20 0.24 0.22 0.31 0.29 0.26 0.25 0.26Net realized and unrealized gain(loss)on investments and foreigncurrencies .......................................... (0.52) (0.61) 1.45 2.16 (1.11) (0.16) (0.41) 1.27 1.72 (0.57)
Total income (loss) from investmentoperations .......................................... (0.29) (0.27) 1.65 2.40 (0.89) 0.15 (0.12) 1.53 1.97 (0.31)
Distributions from:...........................................Net investment income........................... (0.39) (0.22) (0.28) (0.24) (0.21) (0.34) (0.25) (0.28) (0.28) (0.22)Net realized gain on securities ............... (1.46) (1.49) (1.10) (0.49) (0.96) (1.66) – – – –Total distributions ................................... (1.85) (1.71) (1.38) (0.73) (1.17) (2.00) (0.25) (0.28) (0.28) (0.22)
Net asset value at end of period .................... $ 11.79 $ 13.93 $ 15.91 $ 15.64 $ 13.97 $ 15.65 $ 17.50 $ 17.87 $ 16.62 $ 14.93TOTAL RETURN(a) ........................................ (2.34)% (1.84)% 10.34% 17.25% (4.47)% 1.18% (0.71)% 9.15% 13.22% (1.80)%RATIOS/SUPPLEMENTAL DATA.................Ratio of expenses to average net assets(b) .... 0.80% 0.85% 0.85% 0.85% 0.85% 0.85% 0.85% 0.85% 0.85% 0.85%Ratio of expenses to average net assets(c) .... 1.16% 0.93% 0.92% 0.92% 0.92% 0.95% 0.94% 0.94% 0.94% 0.93%Ratio of expense reductions to average netassets......................................................... 0.00% 0.00% 0.00% 0.01% 0.00% 0.00% 0.00% 0.00% 0.00% 0.00%
Ratio of net investment income (loss) toaverage net assets(b) .................................. 1.64% 2.14% 1.20% 1.57% 1.49% 1.70% 1.63% 1.47% 1.54% 1.78%
Ratio of net investment income (loss) toaverage net assets(c) .................................. 1.27% 2.06% 1.13% 1.49% 1.42% 1.60% 1.53% 1.38% 1.46% 1.69%
Portfolio turnover rate ..................................... 265% 28% 24% 20% 26% 44% 46% 19% 15% 15%Number of shares outstanding at end ofperiod(000’s) .............................................. 3,751 3,676 3,742 3,603 4,104 7,219 6,749 6,461 6,640 7,241
Net assets at end of period (000’s) ................ $44,233 $51,212 $59,532 $56,339 $57,330 $112,970 $118,127 $115,474 $110,333 $108,136
(a) Total return includes, if any, expense reimbursements and expense reductions. The effect of fees and charges incurred at the separate accountlevel are not reflected in these performance figures. If such expenses had been included, the total return would have been lower for each periodpresented.
(b) Includes, if any, expense reimbursement, but excludes, if any, expense reductions.(c) Excludes, if any, expense reimbursements and expense reductions.(d) The per share amounts are calculated using the average share method.
FINANCIAL HIGHLIGHTS
- 197 -

VALIC Company I
FundInvestmentObjective
PrincipalInvestmentStrategy Principal Risk Factors
Principal InvestmentTechniques
Blue ChipGrowth Fund
Long-term CapitalGrowth, andSecondarilyIncome
Growth • Management Risk The Fund pursues long-termcapital appreciation byinvesting, under normalcircumstances, at least 80% ofnet assets in the commonstocks of large- and mid-capblue chip growth companies.
• Equity Securities Risk• Growth Style Risk• Large- and Mid-CapCompanies Risk
• Market Risk• Securities Lending Risk• Technology Sector Risk
CapitalConservationFund
High Total Return Total Return • Management Risk The Fund invests ininvestment grade bonds toseek to provide you with thehighest possible total returnfrom current income andcapital gains while preservingyour investment.
• Call or Prepayment Risk• Credit Risk• Currency Risk• Interest Rate Risk• Foreign Investment Risk• Market Risk• Mortgage- and Asset-Backed Securities Risk
• Risk of Investing in MoneyMarket Securities
• Active Trading Risk• Securities Lending Risk• U.S. GovernmentObligations Risk
APPENDIX A
- 215 -
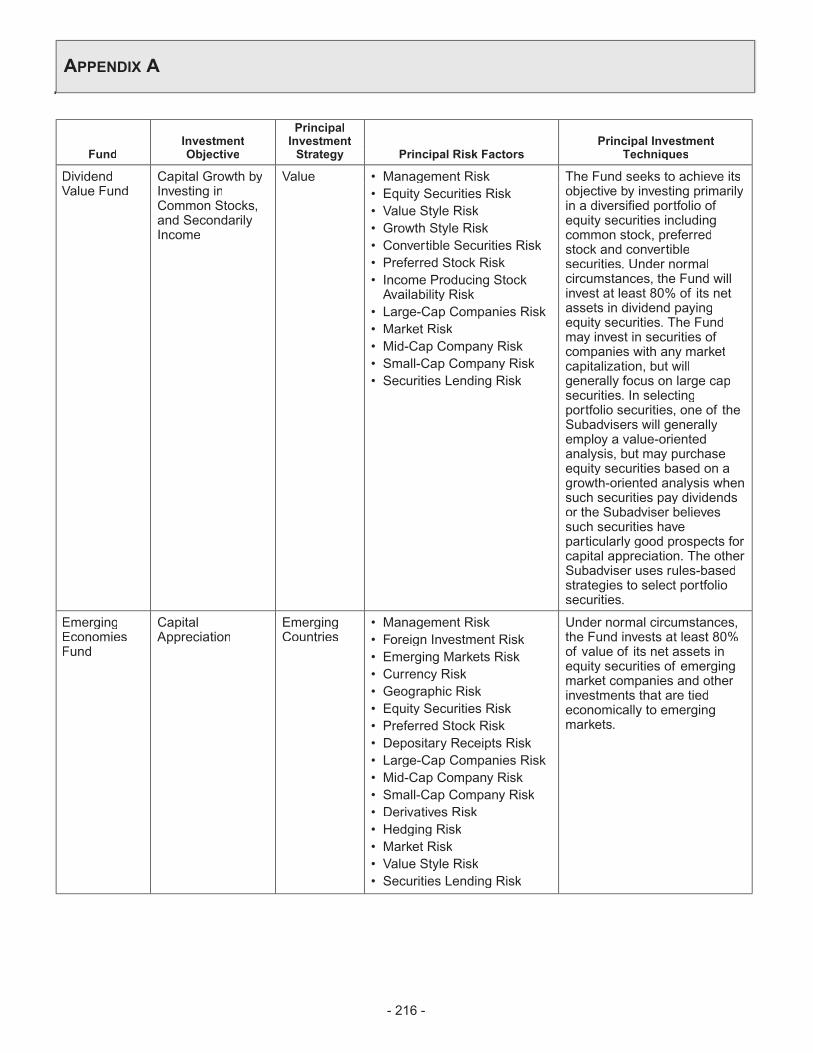
FundInvestmentObjective
PrincipalInvestmentStrategy Principal Risk Factors
Principal InvestmentTechniques
DividendValue Fund
Capital Growth byInvesting inCommon Stocks,and SecondarilyIncome
Value • Management Risk The Fund seeks to achieve itsobjective by investing primarilyin a diversified portfolio ofequity securities includingcommon stock, preferredstock and convertiblesecurities. Under normalcircumstances, the Fund willinvest at least 80% of its netassets in dividend payingequity securities. The Fundmay invest in securities ofcompanies with any marketcapitalization, but willgenerally focus on large capsecurities. In selectingportfolio securities, one of theSubadvisers will generallyemploy a value-orientedanalysis, but may purchaseequity securities based on agrowth-oriented analysis whensuch securities pay dividendsor the Subadviser believessuch securities haveparticularly good prospects forcapital appreciation. The otherSubadviser uses rules-basedstrategies to select portfoliosecurities.
• Equity Securities Risk• Value Style Risk• Growth Style Risk• Convertible Securities Risk• Preferred Stock Risk• Income Producing StockAvailability Risk
• Large-Cap Companies Risk• Market Risk• Mid-Cap Company Risk• Small-Cap Company Risk• Securities Lending Risk
EmergingEconomiesFund
CapitalAppreciation
EmergingCountries
• Management Risk Under normal circumstances,the Fund invests at least 80%of value of its net assets inequity securities of emergingmarket companies and otherinvestments that are tiedeconomically to emergingmarkets.
• Foreign Investment Risk• Emerging Markets Risk• Currency Risk• Geographic Risk• Equity Securities Risk• Preferred Stock Risk• Depositary Receipts Risk• Large-Cap Companies Risk• Mid-Cap Company Risk• Small-Cap Company Risk• Derivatives Risk• Hedging Risk• Market Risk• Value Style Risk• Securities Lending Risk
APPENDIX A
- 216 -

FundInvestmentObjective
PrincipalInvestmentStrategy Principal Risk Factors
Principal InvestmentTechniques
Global RealEstate Fund
High Total Returnthrough Long-Term Growth ofCapital andCurrent Income
Real Estateand RealEstate-RelatedSecurities
• Management Risk The Fund invests, undernormal circumstances, at least80% of its net assets in adiversified portfolio of equityinvestments in real estate andreal estate-related companies.
• Real Estate InvestmentsRisk
• REITs Risk• Equity Securities Risk• Currency Risk• Emerging Markets Risk• Foreign Investment Risk• Geographic risk• Market risk• Mid-cap company risk• Small-cap company risk• Synthetic securities risk• Securities lending risk
GovernmentMoneyMarket I Fund
Liquidity,Protection ofCapital andCurrent incomethroughInvestments inShort-Term MoneyMarket Instruments
MoneyMarketInstruments
• Credit risk The Fund invests at least99.5% of its total assets incash, U.S. Governmentsecurities, and/or repurchaseagreements that arecollateralized by cash and/orU.S. Government securities. Inaddition, under normalcircumstances, the Fundinvests at least 80% of its netassets in U.S. Governmentsecurities and/or repurchaseagreements that arecollateralized by U.S.Government securities.
• Interest rate risk• Repurchase agreementsrisk
• U.S. government obligationsrisk
GovernmentSecuritiesFund
High CurrentIncome andProtection ofCapital throughInvestments inIntermediate andLong-term U.S.Government DebtSecurities
U.S.GovernmentObligations
• U.S. government obligationsrisk
The Fund invests at least 80%of net assets in intermediate-and long-term U.S.Government and governmentsponsored debt securities.
• Credit risk• Interest rate risk• Call or prepayment risk• Currency risk• Foreign investment risk• Market risk• Mortgage- and Asset-backed securities risk
• Securities lending risk• Risks of investing in moneymarket securities
• Repurchase agreementsrisk
APPENDIX A
- 217 -

FundInvestmentObjective
PrincipalInvestmentStrategy Principal Risk Factors
Principal InvestmentTechniques
Growth Fund Long-Term CapitalGrowth
Growth • Index risk The Fund attempts to achieveits investment objective byinvesting primarily in commonstock of companies that areselected based on suchfactors as strong earnings,strong sales and revenuegrowth and capitalappreciation potential. TheFund will emphasize commonstock of companies with mid-to large-stock marketcapitalizations; however, theFund also may invest in thecommon stock of smallcompanies. The Fundgenerally invests at least 65%of its total assets in equitysecurities. Equity securitiesconsist of common stock andAmerican Depositary Receipts(“ADRs”). The Fund mayinvest without limitation in thesecurities of foreigncompanies in the form ofADRs. In addition to ADRs,the Fund may also invest up to20% of its total assets insecurities of foreigncompanies, includingcompanies located inemerging markets.
• Failure to Match IndexPerformance Risk
• Management Risk• Equity Securities Risk• Currency Risk• Foreign Investment Risk• Depositary Receipts Risk• Emerging Markets Risk• Focused Fund Risk• Growth Style Risk• Large- and Mid-CapCompany Risk
• Small-Cap Company Risk• Market Risk• Price Volatility Risk• Securities Lending Risk• Sector Risk
APPENDIX A
- 218 -
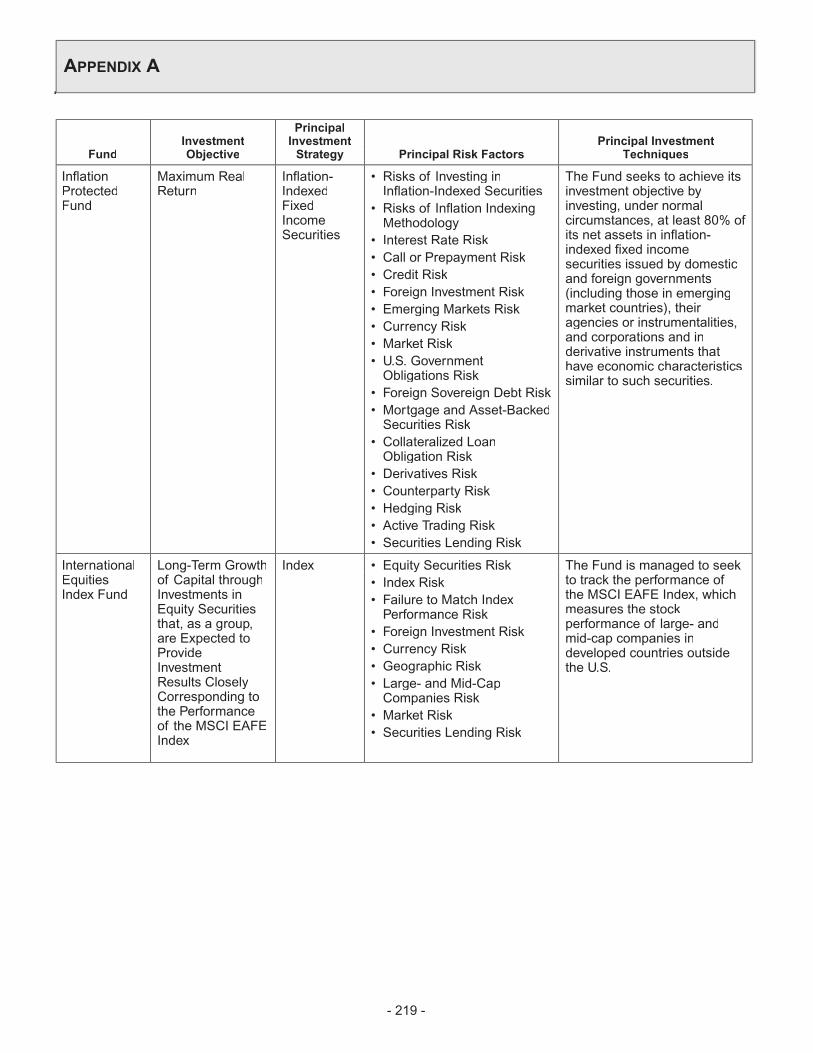
FundInvestmentObjective
PrincipalInvestmentStrategy Principal Risk Factors
Principal InvestmentTechniques
InflationProtectedFund
Maximum RealReturn
Inflation-IndexedFixedIncomeSecurities
• Risks of Investing inInflation-Indexed Securities
The Fund seeks to achieve itsinvestment objective byinvesting, under normalcircumstances, at least 80% ofits net assets in inflation-indexed fixed incomesecurities issued by domesticand foreign governments(including those in emergingmarket countries), theiragencies or instrumentalities,and corporations and inderivative instruments thathave economic characteristicssimilar to such securities.
• Risks of Inflation IndexingMethodology
• Interest Rate Risk• Call or Prepayment Risk• Credit Risk• Foreign Investment Risk• Emerging Markets Risk• Currency Risk• Market Risk• U.S. GovernmentObligations Risk
• Foreign Sovereign Debt Risk• Mortgage and Asset-BackedSecurities Risk
• Collateralized LoanObligation Risk
• Derivatives Risk• Counterparty Risk• Hedging Risk• Active Trading Risk• Securities Lending Risk
InternationalEquitiesIndex Fund
Long-Term Growthof Capital throughInvestments inEquity Securitiesthat, as a group,are Expected toProvideInvestmentResults CloselyCorresponding tothe Performanceof the MSCI EAFEIndex
Index • Equity Securities Risk The Fund is managed to seekto track the performance ofthe MSCI EAFE Index, whichmeasures the stockperformance of large- andmid-cap companies indeveloped countries outsidethe U.S.
• Index Risk• Failure to Match IndexPerformance Risk
• Foreign Investment Risk• Currency Risk• Geographic Risk• Large- and Mid-CapCompanies Risk
• Market Risk• Securities Lending Risk
APPENDIX A
- 219 -

FundInvestmentObjective
PrincipalInvestmentStrategy Principal Risk Factors
Principal InvestmentTechniques
InternationalGovernmentBond Fund
High CurrentIncome throughInvestmentsPrimarily inInvestment GradeDebt SecuritiesIssued orGuaranteed byForeignGovernments
ForeignGovernmentFixedIncomeSecurities
• Call or Prepayment Risk The Fund aims to provideforeign investmentopportunities primarily ininvestment grade governmentand government sponsoreddebt securities. Under normalcircumstances, at least 80% ofnet assets of the Fund mustbe government issued,sponsored or guaranteed.
• Credit Risk• Currency Risk• Derivatives Risk• Hedging Risk• Emerging Markets Risk• Foreign Investment Risk• Foreign Sovereign Debt Risk• Interest Rate Risk• Junk Bond Risk• Market Risk• Non-Diversification Risk• Risks of Investing in MoneyMarket Securities
• U.S. GovernmentObligations Risk
• Securities Lending Risk
InternationalGrowth Fund
CapitalAppreciation
InternationalGrowth
• Management Risk Under normal marketconditions, the Fund’sSubadviser seeks to achievethe Fund’s objective byinvesting primarily inestablished companies on aninternational basis, withcapitalizations, within therange of companies includedin the MSCI ACWI ex USAIndex.
• Foreign Investment Risk• Focused Fund Risk• Currency Risk• Depositary Receipts Risk• Emerging Markets Risk• Equity Securities Risk• Large-Cap Companies Risk• Mid-Cap Company Risk• Small Cap Company Risk• Growth Style Risk• Liquidity Risk• Market Risk• Securities Lending Risk
APPENDIX A
- 220 -

FundInvestmentObjective
PrincipalInvestmentStrategy Principal Risk Factors
Principal InvestmentTechniques
InternationalValue Fund
Long-Term Growthof Capital
InternationalValue
• Management Risk Under normal marketconditions, the Fund invests atleast 80% of its net assets inequity securities of foreignissuers. The Fund may alsoinvest up to 30% of its totalassets in emerging marketequity securities. The Fund willinvest in securities of at leastthree different countries,including the United States.The Fund normally invests incommon stock, preferredstock, rights, warrants andAmerican Depository Receipts(ADRs).
• Equity Securities Risk• Derivatives Risk• Large-Cap Companies Risk• Mid-Cap Company Risk• Small-Cap Company Risk• Hedging Risk• Warrant Risk• Emerging Markets Risk• Foreign Investment Risk• Currency Risk• Depository Receipts Risk• Georaphic Risk• Market Risk• Value Style Risk• Securities Lending Risk
Large CapCore Fund
Capital growthwith the potentialfor current income
Core • Sector Risk The Fund invests, undernormal circumstances, at least80% of its net assets in thecommon stocks of large-capU.S. companies. The Fundinvests in equity securities ofU.S. companies that havelarge market capitalization(generally over $2 billion) thatthe Subadviser believes areundervalued and have thepotential for long-term growthand current income.
• Management Risk• Equity Securities Risk• Currency Risk• Foreign Investment Risk• Growth Stock Risk• Large-Cap Companies Risk• Market Risk• Securities Lending Risk• Value Style Risk
Large CapitalGrowth Fund
Long-Term Growthof Capital
Growth • Management Risk The Fund seeks to meet itsobjective by investing,normally, at least 80% of itsnet assets in securities oflarge-cap companies. Incomplying with this 80%investment requirement, theFund will invest primarily incommon stocks.
• Equity Securities Risk• Currency Risk• Focused Fund Risk• Foreign Investment Risk• Large-Cap Companies Risk• Growth Stock Risk• Market Risk• Securities Lending Risk
APPENDIX A
- 221 -

FundInvestmentObjective
PrincipalInvestmentStrategy Principal Risk Factors
Principal InvestmentTechniques
Mid CapIndex Fund
Growth of CapitalthroughInvestmentsPrimarily in aDiversifiedPortfolio ofCommon Stocksthat, as a Group,are Expected toProvideInvestmentResults CloselyCorresponding tothe Performanceof the S&P MidCap 400® Index
Index • Securities Lending Risk The Fund is managed to seekto track the performance ofthe S&P Mid Cap 400® Index,which measures theperformance of the mid-capitalization sector of theU.S. equity market. Undernormal circumstances, at least80% of the Fund’s net assetsare invested in stocks that arein the Index.
• Index Risk• Failure to Match IndexPerformance Risk
• Equity Securities Risk• Market Risk• Mid-Cap Company Risk
Mid CapStrategicGrowth Fund
Long-Term CapitalGrowth
Growth • Securities Lending Risk The Subadvisers seek long-term capital growth byinvesting primarily in growth-oriented equity securities ofU.S. domestic and foreign mid-cap companies. Under normalcircumstances, at least 80% ofthe Fund’s net assets will beinvested in common stocks ofmid-cap companies.
• Management Risk• Currency Risk• Equity Securities Risk• Foreign Investment Risk• Emerging Markets Risk• Growth Style Risk• Market Risk• Privately Placed SecuritiesRisk
• Mid-Cap Company Risk
Small CapAggressiveGrowth Fund
Capital Growth Growth • Small-Cap Company Risk The Fund normally invests atleast 80% of its net assets insmall-cap companies. TheFund typically invests most ofits assets in securities of U.S.companies but may also investa portion of its assets inforeign securities (up to 10%of net assets).
• Management Risk• Active Trading Risk• Currency Risk• Equity Securities Risk• Growth Style Risk• Foreign Investment Risk• Market Risk• Securities Lending Risk
Small CapFund
Long-Term CapitalGrowth byInvesting Primarilyin the Stocks ofSmall Companies
Growth andValue
• Small-Cap Company Risk The Fund normally invests atleast 80% of net assets instocks of small companies.Stock selection may reflect agrowth or a value investmentapproach or a combination ofboth.
• Management Risk• Equity Securities Risk• Market Risk• Securities Lending Risk• Growth Style rRisk• Value Style Risk
APPENDIX A
- 222 -

FundInvestmentObjective
PrincipalInvestmentStrategy Principal Risk Factors
Principal InvestmentTechniques
Small CapIndex Fund
Growth of CapitalthroughInvestmentPrimarily in aDiversifiedPortfolio ofCommon Stocksthat, as a Group,the SubadviserBelieves MayProvideInvestmentResults CloselyCorresponding tothe Russell 2000®
Index
Index • Management Risk The Fund is managed to seekto track the performance ofthe Russell 2000® Index,which measures theperformance of those Russell2000 companies with higherprice-to-book ratios and higherforecasted growth values.TheFund invests under normalcircumstances at least 80% ofnet assets in stocks that are inthe Index.
• Small-Cap Company Risk• Micro-Cap Company Risk• Equity Securities Risk• Market Risk• Securities Lending Risk• Growth Style Risk• Value Style Risk
Small CapSpecialValues Fund
Growth of Capitalby InvestingPrimarily inCommon Stocks
Value • Management Risk Under normal marketconditions, the Fund invests atleast 80% of its net assets incommon stocks of domesticsmall-cap companies. TheSubadvisers look forsignificantly undervaluedcompanies that they believehave the potential for above-average appreciation withbelow-average risk.
• Equity Securities Risk• Small-Cap Company Risk• Value Style Risk• Market Risk• Securities Lending Risk
Stock IndexFund
Long-Term CapitalGrowth throughInvestment inCommon Stocksthat, as a Group,are Expected toProvideInvestmentResults closelyCorresponding tothe Performanceof the S&P 500Index
Index • Management Risk The Fund is managed to seekto track the performance ofthe S&P 500® Index, whichmeasures the stockperformance of 500 large- andmid-cap companies and isoften used to indicate theperformance of the overallstock market.The Fundinvests, under normalcircumstances, at least 80% ofnet assets in stocks that are inthe Index.
• Index Risk• Failure to Match IndexPerformance Risk
• Equity Securities Risk• Large-and Mid-CapCompany Risk
• Market Risk• Securitites Lending Risk
APPENDIX A
- 223 -

FundInvestmentObjective
PrincipalInvestmentStrategy Principal Risk Factors
Principal InvestmentTechniques
SystematicCore Fund(formerly,Growth &Income Fund)
Long-Term Growthof Capital
Growth • Disciplined Strategy Risk The Fund seeks to achieve ahigher risk-adjustedperformance than the Russell1000® Index over the longterm through a proprietaryselection process employed bythe Fund’s Subadviser. TheSubadviser uses a rules-based methodology thatemphasizes quantitatively-based stock selection andportfolio construction andefficient implementation. TheFund seeks to capturecommon sources of activeequity returns, including thefollowing factors: value (i.e.,how attractively a stock ispriced relative to its“fundamentals,” such as bookvalue and free cash flow),momentum (i.e., whether acompany’s share price istrending up or down), quality(i.e., profitability) and lowvolatility (i.e., a relatively lowdegree of fluctuation in acompany’s share price overtime)
• Equity Securities Risk• Factor-Based Investing Risk• Large-Cap Companies Risk• Management Risk• Securities Lending Risk
SystematicValue Fund
Total Returnthrough CapitalAppreciation andSecondarily,Income
Value • Management Risk The Fund seeks to achieve itsinvestment objective byinvesting primarily in equitysecurities of U.S. large- andmid-cap companies.Companies are determined tobe large- or mid-cap based onthe inclusion of their equitysecurities in the MSCI USAValue Index, whoseconstituents are companiesthat exhibit certain valuequalities, as defined by theindex provider, such as lowerprice-to-book ratios, lowerprices relative to forecastedearnings, and higher dividendyields. Generally, thesecompanies will have a marketcapitalization of at least$2 billion. The equitysecurities in which the Fundinvests include common stock,preferred stock, convertiblesecurities, rights and warrants.
• Equity Securities Risk• Preferred Stock Risk• Convertible Securities Risk• Warrant Risk• Large and Mid-CapCompany Risk
• Market Risk• Value Style Risk• Quantitative Investing Risk• Sector Risk• Active Trading Risk• Securities Lending Risk
APPENDIX A
- 224 -
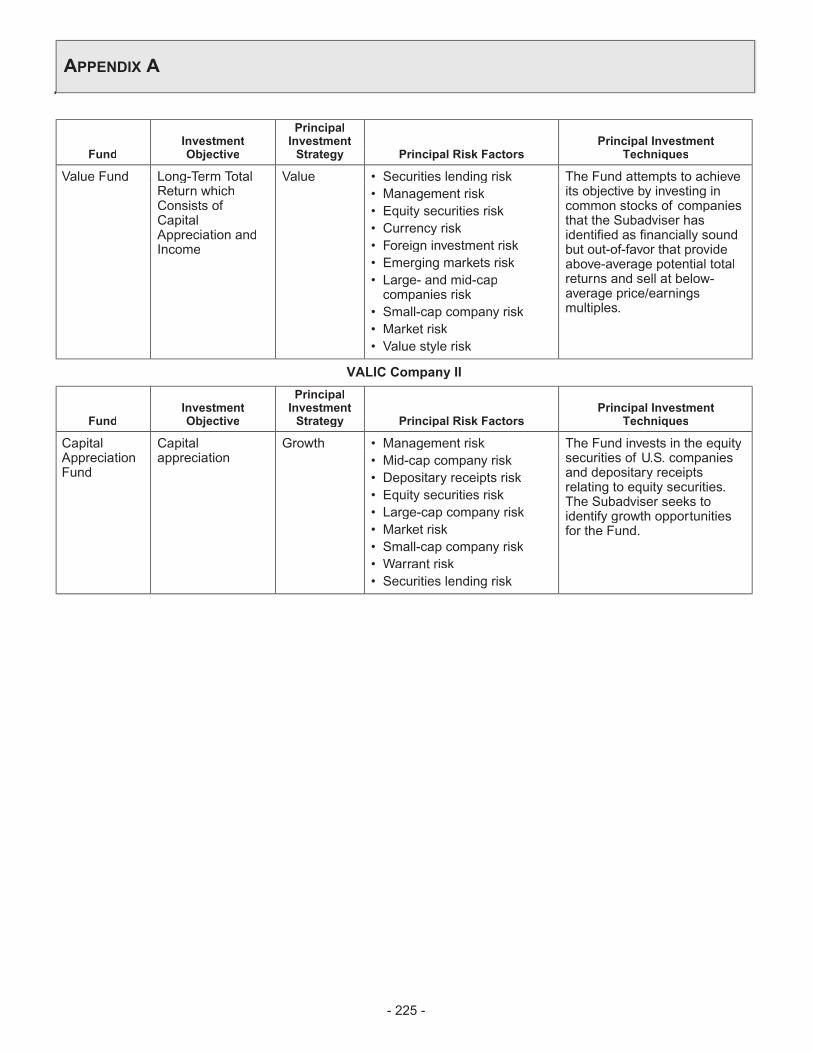
FundInvestmentObjective
PrincipalInvestmentStrategy Principal Risk Factors
Principal InvestmentTechniques
Value Fund Long-Term TotalReturn whichConsists ofCapitalAppreciation andIncome
Value • Securities lending risk The Fund attempts to achieveits objective by investing incommon stocks of companiesthat the Subadviser hasidentified as financially soundbut out-of-favor that provideabove-average potential totalreturns and sell at below-average price/earningsmultiples.
• Management risk• Equity securities risk• Currency risk• Foreign investment risk• Emerging markets risk• Large- and mid-capcompanies risk
• Small-cap company risk• Market risk• Value style risk
VALIC Company II
FundInvestmentObjective
PrincipalInvestmentStrategy Principal Risk Factors
Principal InvestmentTechniques
CapitalAppreciationFund
Capitalappreciation
Growth • Management risk The Fund invests in the equitysecurities of U.S. companiesand depositary receiptsrelating to equity securities.The Subadviser seeks toidentify growth opportunitiesfor the Fund.
• Mid-cap company risk• Depositary receipts risk• Equity securities risk• Large-cap company risk• Market risk• Small-cap company risk• Warrant risk• Securities lending risk
APPENDIX A
- 225 -

FundInvestmentObjective
PrincipalInvestmentStrategy Principal Risk Factors
Principal InvestmentTechniques
Core BondFund
Hightotal return
Fixedincome
• Management risk The Fund invests, undernormal circumstances, at least80% of net assets in medium-to high-quality fixed incomesecurities, including corporatedebt securities of domesticand foreign companies, or insecurities issued orguaranteed by the U.S.Government, mortgage-backed or asset-backedsecurities. A significant portionof the Fund’s U.S. governmentsecurities may be issued orguaranteed by the FederalNational Mortgage Association(“FNMA”), the Federal HomeLoan Mortgage Corporation(“FHLMC”) or the GovernmentNational Mortgage Association(“GNMA”).Although the Fund investsprimarily in medium- to high-quality fixed income securities,which are consideredinvestment-grade, up to 20%of its net assets may beinvested in lower-quality fixedincome securities (oftenreferred to as “junk bonds”),which are considered belowinvestment-grade.
• Active trading risk• Credit risk• Foreign investment risk• Interest rate risk• Junk bond risk• Market risk• Mortgage-backed securitiesrisk
• Non-mortgage asset-backedsecurities risk
• Call or prepayment risk• Emerging markets risk• Currency risk• U.S. government obligationsrisk
• Securities lending risk
High YieldBond Fund
High totalreturn andincome
Fixedincome
• Junk bond risk At least 80% of the Fund’s netassets are invested, undernormal circumstances, in high-yield, below-investment gradefixed income securities (oftenreferred to as “junk bonds”).The Fund may also invest upto 20% of its net assets inbelow-investment gradeforeign fixed incomesecurities.
• Management risk• Call or prepayment risk• Credit risk• Foreign investment risk• Interest rate risk• Market risk• Securities lending risk
APPENDIX A
- 226 -
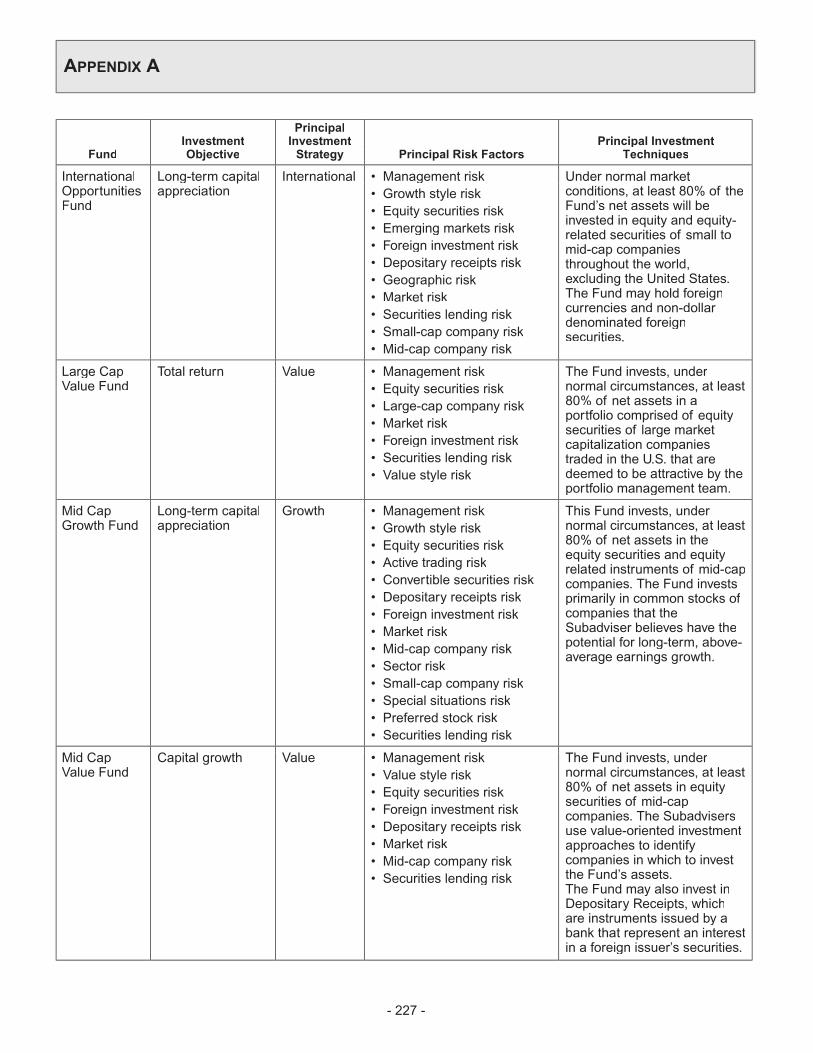
FundInvestmentObjective
PrincipalInvestmentStrategy Principal Risk Factors
Principal InvestmentTechniques
InternationalOpportunitiesFund
Long-term capitalappreciation
International • Management risk Under normal marketconditions, at least 80% of theFund’s net assets will beinvested in equity and equity-related securities of small tomid-cap companiesthroughout the world,excluding the United States.The Fund may hold foreigncurrencies and non-dollardenominated foreignsecurities.
• Growth style risk• Equity securities risk• Emerging markets risk• Foreign investment risk• Depositary receipts risk• Geographic risk• Market risk• Securities lending risk• Small-cap company risk• Mid-cap company risk
Large CapValue Fund
Total return Value • Management risk The Fund invests, undernormal circumstances, at least80% of net assets in aportfolio comprised of equitysecurities of large marketcapitalization companiestraded in the U.S. that aredeemed to be attractive by theportfolio management team.
• Equity securities risk• Large-cap company risk• Market risk• Foreign investment risk• Securities lending risk• Value style risk
Mid CapGrowth Fund
Long-term capitalappreciation
Growth • Management risk This Fund invests, undernormal circumstances, at least80% of net assets in theequity securities and equityrelated instruments of mid-capcompanies. The Fund investsprimarily in common stocks ofcompanies that theSubadviser believes have thepotential for long-term, above-average earnings growth.
• Growth style risk• Equity securities risk• Active trading risk• Convertible securities risk• Depositary receipts risk• Foreign investment risk• Market risk• Mid-cap company risk• Sector risk• Small-cap company risk• Special situations risk• Preferred stock risk• Securities lending risk
Mid CapValue Fund
Capital growth Value • Management risk The Fund invests, undernormal circumstances, at least80% of net assets in equitysecurities of mid-capcompanies. The Subadvisersuse value-oriented investmentapproaches to identifycompanies in which to investthe Fund’s assets.The Fund may also invest inDepositary Receipts, whichare instruments issued by abank that represent an interestin a foreign issuer’s securities.
• Value style risk• Equity securities risk• Foreign investment risk• Depositary receipts risk• Market risk• Mid-cap company risk• Securities lending risk
APPENDIX A
- 227 -

FundInvestmentObjective
PrincipalInvestmentStrategy Principal Risk Factors
Principal InvestmentTechniques
Small CapGrowth Fund
Long-termcapital growth
Growth • Management risk Under normal marketconditions, the Fund invests atleast 80% of net assets in theequity securities of small capcompanies. Typically, the Fundinvests in securities ofcompanies with a history ofabove-average growth, as wellas companies expected tohave above-average growth.
• Growth style risk• Equity securities risk• Market risk• Small-cap company risk• Securities lending risk
Small CapValue Fund
Maximum longterm return
Value • Management risk The Fund invests, undernormal circumstances, at least80% of its net assets in equitysecurities of small-capcompanies. The Subadviserswill use a value-orientedapproach. Companies will beselected based upon valuationcharacteristics such as price-to-cash flow ratios which areat a discount to marketaverages.
• Value style risk• Equity securities risk• Market risk• Small-cap company risk• Securities lending risk
APPENDIX A
- 228 -

FundInvestmentObjective
PrincipalInvestmentStrategy Principal Risk Factors
Principal InvestmentTechniques
U.S. SociallyResponsibleFund
Growthof capital
SpecialtyGrowth
• Equity securities risk The Fund invests, undernormal circumstances, at least80% of its net assets in theequity securities of U.S.companies meeting the Fund’ssocial criteria. The Fund doesnot invest in companies thatare significantly engaged in:• the manufacture ordistribution of civilianfirearms, military weaponsor weapons deliverysystems;
• the manufacture ordistribution of alcoholicbeverages or tobaccoproducts;
• the operation of gambling-related businesses;
• the production of nuclearenergy;
• have a history of poor labor-management relations;
• engage in businesses orhave products that have aseverely negative impact onthe environment;
• have significant businessoperations in countrieswhose governments posehuman rights concerns;operate businesses thathave a significantly adverseimpact on the communitiesin which they are located;
• engage in businesses orhave products that have aseverely negative impact ontheir customers, which mayinclude companies that haveproducts that pose safety orhealth concerns, engage inpractices that are anti-competitive or havemarketing that isinappropriate or misleading;and
• have a history of poorbusiness ethics, which mayinclude companies that haveincidents of bribery or fraud,or poor governancestructures.
• Preferred stock risk• Convertible securities risk• Foreign investment risk• Market risk• Social criteria risk• Securities lending risk
APPENDIX A
- 229 -

FundInvestmentObjective
PrincipalInvestmentStrategy Principal Risk Factors
Principal InvestmentTechniques
StrategicBond Fund
High totalreturn andincome
Fixedincome
• Management risk The Fund invests, undernormal circumstances, at least80% of its net assets in abroad range of fixed incomesecurities. Up to 50% of theFund’s total assets may beinvested in foreign securities.Up to 25% of the Fund’s totalassets may be invested inforeign emerging market debt(both U.S. and non-U.S. dollardenominated), including, bothsovereign and corporate debtrated C or higher by Moody’sor CC or higher by S&P or ofPPcomparable quality if unrated.
• Active trading risk• Call or prepayment risk• Credit risk• Emerging markets risk• Foreign investment risk• Interest rate risk• Loan risk• Junk bond risk• Market risk• Mortgage-backed securitiesrisk
• non-mortgage asset-backedsecurities risk
• U.S. government obligationsrisk
• Securities lending risk
APPENDIX A
- 230 -

The Statement of Additional Information (“SAI”) incorporated by reference into this prospectus contains additionalinformation about VC I’s operations.
Further information about the Funds’ investments is available in VC I’s annual and semi-annual reports to shareholders.VC I’s annual report discusses market conditions and investment strategies that significantly affected the Funds’performance results during their last fiscal year.
The Variable Annuity Life Insurance Company (“VALIC”) can provide you with a free copy of these materials or otherinformation about VC I. You may reach VALIC by calling 1-800-448-2542 or by writing to PO. Box 15648, Amarillo, TexasPP79105-5648. VC I’s prospectus, SAI, and shareholder reports are available online at https://www.valic.com/prospectus-and-reports/mutual-funds.
The Securities and Exchange Commission (“SEC”) maintains copies of these documents, which are available on theEDGAR Database on the SEC’s web site at http://www.sec.gov. You may also request a paper copy from the SECelectronically at [email protected]. A duplicating fee will be assessed for all copies provided by the SEC.
INTERESTED IN LEARNING MORE?
Investment Company Act filing number 811-03738

[THIS PAGE INTENTIONALLY LEFT BLANK]

[THIS PAGE INTENTIONALLY LEFT BLANK]


VALIC Company IP.O. Box 3206Houston, TX 77252-3206
VC 9017-ST (10/2020) J534803