Valence Band XPS-Study of Fe(100) at Finite … · test of models of metallic ferromagnetism at...
31
SLAC - PUB - 3512(REV.) July 1985 M Valence Band XPS-Study of Fe(100) at Finite Temperatures* R.E. KIRBY, E. KISKER t F.K. KING, D. GURR, AND E.L. GARWIN Stanford Linear Accelerator Center Stanford University, Stanford, California, 94905 ABSTRACT Measuring the valence band density of states (DOS) of Fe provides a stringent test of models of metallic ferromagnetism at finite temperatures. The density of states of Fe above the Curie temperature T,, as obtained by self-consistent calculations in the disordered local moment (DLM) picture by Oguchi et al(l) and by Pindor et a1c2) differs strongly from the T=O DOS calculated by Moruzzi et al(“) between the Fermi energy and 2 eV binding energy, i.e. the relatively broad peak in the T=O DOS around 1 eV binding energy is of much smaller amplitude in the T>T, DOS. This effect should be observable by valence band XPS on Fe as a 30% decrease of intensity at about 1 eV binding energy with a typical energy resolution of about 0.8 eV. We have measured the valence band XPS of Fe(lOO) at room temperature and temperatures above T,. The predicted intensity decrease has not been observed. Presented at the 30th Annual Conference on Magnetism and Magnetic Materials, San Diego, CA, Nov. 27-30, 1984. * Work supported by the Department of Energy, contract DE - AC03 - 76SF00515. t present address: KFA, Institut fur Festkorperforschung, Postfach 1913, D-5170 Jiilich, West Germany
Transcript of Valence Band XPS-Study of Fe(100) at Finite … · test of models of metallic ferromagnetism at...
SLAC - PUB - 3512(REV.) July 1985 M
Valence Band XPS-Study of Fe(100) at Finite Temperatures*
R.E. KIRBY, E. KISKER t F.K. KING, D. GURR, AND E.L. GARWIN
Stanford Linear Accelerator Center
Stanford University, Stanford, California, 94905
ABSTRACT
Measuring the valence band density of states (DOS) of Fe provides a stringent
test of models of metallic ferromagnetism at finite temperatures. The density
of states of Fe above the Curie temperature T,, as obtained by self-consistent
calculations in the disordered local moment (DLM) picture by Oguchi et al(l)
and by Pindor et a1c2) differs strongly from the T=O DOS calculated by Moruzzi
et al(“) between the Fermi energy and 2 eV binding energy, i.e. the relatively
broad peak in the T=O DOS around 1 eV binding energy is of much smaller
amplitude in the T>T, DOS. This effect should be observable by valence band
XPS on Fe as a 30% decrease of intensity at about 1 eV binding energy with a
typical energy resolution of about 0.8 eV. We have measured the valence band
XPS of Fe(lOO) at room temperature and temperatures above T,. The predicted
intensity decrease has not been observed.
Presented at the 30th Annual Conference on Magnetism
and Magnetic Materials, San Diego, CA, Nov. 27-30, 1984.
* Work supported by the Department of Energy, contract DE - AC03 - 76SF00515. t present address: KFA, Institut fur Festkorperforschung, Postfach 1913, D-5170 Jiilich, West
Germany
1. Introduction
A long standing question is on the microscopic nature of the ferromagnetic
to paramagnetic phase transition of the Sd-transition metals Fe, Co, and Ni.
Although there is no doubt that long-range ferromagnetic order ceases to ex-
ist above T,, it is a problem to reconcile this in a microscopic theory. There
are several. prominent models for explaining the loss of the magnitude of the
spontaneous magnetization: the Stoner mode1(415), the disordered-local moment
picture (DLM)QJ) and a model based on disordering of some sort of magnetic
clusters of size of lo-30 A, which commonly is referred to as the fluctuating
band picture(61. Also, spin-spiral configurations have been used for modeling the
magnetic structure above T,.c71 The Stoner model assumes that the exchange
splitting decreases proportionally to the spontaneous magnetization, with other
thermal effects modeled by broadening the DOS.(5) In the DLM model, randomly
oriented magnetic moments are assumed to exist on the lattice sites above T,.
Within the DLM framework, the electronic structure has been calculated recently
self-consistently(2) and, it turned out that for Fe, the magnetic moment per site
remains nearly constant up to T,.
The electronic structure of Fe on which we will concentrate in this work has
been previously studied by electron spectroscopic methods such as photoemission(8),
spin-polarized photoemission( and x-ray photoelectron spectroscopy(lO), and
-also, temperature effects have been studied.(l’) Experimental angle-resolved pho-
toemission measurements have been successfully compared with theoretical dif-
ferential calculations (such as the bandstructure) at low temperatures with good
agreement. However, comparison at elevated temperatures is complicated by the
lack of electron- and spin-phonon coupling in the theory.
X-ray photoelectron spectroscopy (XPS) measures the density-of-states, rather
than the band structure, as is known experimentally.(12) This has been explained
as caused by a lack of electron-phonon coupling(13) or as being due to a loss of
momentum conservation.(14) Therefore, the interpretation is easier since it is the
2

DOS which is measured at any temperature. Changes in the angular distribu-
tion which may occur in UPS due to electron-phonon coupling are absent in XPS,
since even at room temperature, we effectively average already over the angular
distribution.
Recently, the DOS of Fe above T, has been calculated in two models, i.e. in
the DLM picture,(lp2) and in the Stoner model(5) with broadening effects involved.
We might expect that in a “cluster” model, the DOS should be the more similar
to the low temperature DOS the larger the range of correlation is. Since the
predicted effects on the DOS can be measured with XPS, we have performed this
experiment for temperatures up to 1.03 T, and we compare the data with the
theoretical predications. Valence band UPS of Fe at elevated temperatures (but
<T,) has been measured previously,(g) but the conclusion was that no change is
observed in the energy distribution curve (EDC) with increasing temperature.
2. Experiment
2.1 SAMPLE PREPARATION
The cr-Fe(lOO) sample was a .6 cm diameter x .02 cm thick disk which was
polished mechanically with 0.5 p diamond paste, degreased and chemically pol-
ished. The sample was cleaned in situ by repeated cycles of argon ion sputtering
(1000 eV) and annealing (825-875 K). Th e sample was demagnetized prior to
insertion into vacuum and by raising it above the Curie temperature (1043 K) in
vacua prior to the experimental data taken and presented here.
2.2 VACUUM SYSTEM
Measurements were made in a baked ultrahigh vacuum (P < 3 x lo-lo torr)
system pumped by a combination of ion, sublimation and, during heating to
the Curie temperature, cryo pumps. The maximum pressure during the heating
experiments was < 2 X 10e8 torr.

2.3 XPS, AES SPECTROMETER
The surface cleanliness of the sample was checked using AES and XPS. The
analyzer was a Vacuum Generators Ltd. CLAM ESCA 3 unit incorporating a
150’ electrostatic spherical sector with a magnification one transfer lens at its
input. The analyzer entrance and exit slits are variable. For this experiment two
slit sizes were used, 2 x 4mm2 and 4 x 4mm2. The x-ray source was a Mg anode
(KcY~J. = 1253.6 eV) operated at 240 watts. The combined x-ray source-analyzer
resolution (hereafter referred to as “the instrument resolution”) was measured
using the Pd Fermi edge (B.E. = 0) which gave 1 eV FWHM and 0.8 eV FWHM
for the 4 and 2mm slits, respectively. The analyzer pass energy was constant at
20 eV. The angle of the source and analyzer to the sample surface normal was
18.5’ and 15O, respectively.
AES measurements were made using the same analyzer and an electron gun
operating at 4.9 KeV with a beam current density of 2 x 10A3A/m2 and a rastered
beam current of 50 nA.
System control and data acquisition is under computer control (LSI 11 mi-
crocomputer). Data in pulse count form is collected from the analyzer channel-
electron-multiplier via a pulse height amplifier and scaler and is stored on hard
disk for later analysis. Data can be collected in both multipass (e.g. for AES anal-
ysis) or profile mode (e.g. Fe XPS valence band during temperature increase, as
a function of time).
Data runs were made at room temperature during which the Fe XPS spec-
trum was measured in the range -1.9 to 120 eV(Fe 3s,3p) or -1.9 to 14 eV(Fe
valence band) binding energy. Four valence band runs were made while heating
the Fe to above the Curie temperature. After cleaning at room temperature,
the AES background subtracted peak height ratio averages obtained in the en-
ergy distribution mode for impurity elements were: S(146 eV)/Fe(700) = 0.10,
C(263)/Fe(700) = 0.05, N(375)/Fe(700) = 0.04. Roughly estimating the average
contamination levels that these numbers represent (using a commercially avail-
4

able AES sensitivity listing) (15) gives: S/Fe = 0.03, C/Fe = 0.08 and N/Fe =
0.04. AES was also done on two of the heating runs while near the Curie tem-
perature. There the only surface contaminant was S; the peak height ratios were
S/Fe = 0.076 and 0.23. This would be, after sensitivity adjustment, S/Fe = 0.065
and 0.214. The heating data consistently gave the same shape and peak height
results for the valence band of Fe independent of these residual S levels.
2.4 HEATING AND TEMPERATURE MEASUREMENT
For ease of handling, the Fe sample was mounted into a Nb disk sample holder
with a closed back. The Fe surface was coplanar with the Nb surface.
The back of the Nb holder was heated by electron bombardment from an en-
closed, bifilar-wound W filament. The Nb and surrounding surfaces were main-
tained at ground potential during the heating and the Fe crystal was heated by
conduction from the Nb.
The Fe temperature was measured with an infrared pyrometer which was cal-
ibrated after the valence band data was taken by comparison to a chromel-alumel
thermocouple, spot-welded directly to the Fe. The calibrated pyrometer readings
were used to determine the Fe emissivity as a function of true temperature. The
emissivity versus true Fe temperature data was fitted to a polynomial which was
then used to obtain the Fe temperatures used in the valence band data.
During valence band data acquisition the Fe could not be viewed directly;
however, the sample temperature was monitored using a W 5% Re - W 26% Re
thermocouple which was spot-welded to the sample clip that held the Nb disk.
The response of this thermocouple was calibrated prior to the actual data run
by comparison to pyrometer readings of the directly viewed Fe surface.
To ensure that the current flowing in the heated filament was not producing
a magnetic field effect, the current was run up quickly while the valence band
spectrum was monitored and before the sample achieved a significant temperature
rise (due to the lag between the heated rear surface of the Nb and the Fe). No
5

effect on the shape or intensity was observed. In addition an identical filament
was set up external to the system and the magnetic field with current flowing was
determined using a Hall effect gauss meter. At the maximum heating current used
to achieve the highest sample temperature the field component at the Fe surface
position is 0.18 gauss for the parallel and 0.93 gauss for the normal components.
These measurements were made in the absence of ferromagnetic material.
To ensure that the proximity of the heated Fe was not untowardly affecting
the analyzer, in one experiment the sample was heated to above T, away from
the analyzer and shifted to it for valence band measurement. No effect of sample
temperature on the analyzer could be observed.
2.5 DATA ANALYSIS
The XPS analyzer accepted photoelectrons generated from a sample area
somewhat larger than the Fe crystal, for both the 4 x 4 and 2 x 4mm2 slits.
The XPS spectrum of the Nb sample holder was measured from -1.9 to 120 eV
B.E. at 295K and 1080K for each of the slit sizes and the Nb contribution has
been removed from the data presented here. No change in the valence band of
Nb was detected at these two temperatures and thus this procedure is believed
to be valid. The Nb contribution to the peak signal intensity of the 2 and 4mm
slits as a percentage of the Fe intensity was (prior to its removal) 28% and 40%,
respectively. The area1 signal contribution from -1.9 to 14.1 eV B.E. for the 2
and 4mm slits was 22% and 31%, respectively.
Smoothing of the data was accomplished using a spline smoothing technique.
We used the I.M.S.L.(161 routine ISCCSU which is based on the algorithm given
by Reinsch.(17) This method uses variational methods to find the smoothest func-
tion consistent with the data. The ISCCSU routine requires two variables, a
global parameter S to control the amount of smoothing done and a vector of
weights assigned to the data points. However, the values suggested by Reinsch
were not suitable. Instead, we assigned equal weights to the data points and
6

determined the value of the global smoothing parameter by first smoothing the
data using a B-spline(18) smooth and estimating the noise present. These val-
ues were then held constant for the smoothing of the data taken under similar
experimental conditions.
3.1 ROOM TEMPERATURE
3. Results
Figure 1 is a room temperature (295 K) survey of Fe(lOO) up to 120eV binding
energy. The shapes and peak ratios for the 3s and 3p states agree well with the
work of Fadley and Shirley(l’) for hydrogen-annealed Fe.
Figure 2 shows our measured valence band XPS for Fe at room tempera-
ture. An attempt was made to curve fit this experimental data using several ap-
proaches. These were: 1) convolution of the spin-summed T=O DOS by Moruzzi
et a1t3) with th e instrument resolution (see Section 2.3) where a Shirley back-
ground (lg) is added to the result; 2) same as case number 1 except the spin-
summed DOS of Ohnishi et a1(20) ( center layers only, explained below) is used;
3) same as case number 2 except one surface plus seven center layers; 4) same as
case number 2 except two surface plus six center layers; 5) same as case number
1 with lifetime broadening and matrix element correction included.
We treat each of these cases in turn. When the fits are done, a constant back-
ground level due to bremsstrahlung processes is added to whatever background
is present in the fit. This bremsstrahlung background level is equal to the count
rate at BE < 0 and is assumed to be constant over the BE range of -16eV that
the experimental data is taken.
1) Moruzzi et a1c3) convolution:
Figure 3 shows the result of convolving the sum of the ferromagnetic spin-
majority and minority T=O DOS’s of Moruzzi, Janak and Williams c3) with the
7

instrument resolution and adding a Shirley background( The Shirley back-
ground models the inelastic-electron background signal by assuming that the
background at a particular binding energy is proportional to the integrated in-
tensity of unscattered electrons at lower binding (higher kinetic) energies with
the proviso that the calculated background matches the experimental background
outside the peak region.
The shape of the fit in Figure 3 is obviously rather poor. The peak locations
are well reproduced at 1, 3 and 5eV. However, there seems to be a substantial
broadening effect which has not been taken into account or, alternatively, the
shape of the Moruzzi et a1c3) DOS is incorrect.
2) Ohnishi et a1c201 convolution, center layers only:
A recent T=O ferromagnetic DOS calculation for Fe(lOO) by Ohnishi, Free-
man and Weinertc20) includes, as a parameter, the variation of the ferromagnetic
charge as a function of distance from the surface. The various layers are consid-
ered as surface or center (bulk) layers. The DOS, based on center layers only,
should be similar to the Moruzzi et a1c3) DOS considered above, although the dif-
ferent calculational methods used might be expected to yield minor disagreement
between the two DOS’s.
Figure 4 shows the result of convolving the spin-summed center-only DOS
with the instrument resolution and adding the appropriate Shirley background.
As in the Moruzzi et al fit of Figure 3, the peak positions are correct and, in
addition, the ratio of the 1 to 3eV peak intensities is much improved. However,
despite a difference in the DOS due to calculational method, there is still a
significant amount of missing broadening and/or states evident above 2eV.
3) and 4) Ohnishi et a1(201 convolution, mixture of surface and center layers:
In this convolution is included the effect of the reduced ferromagnetic surface
charge used to calculate the DOS. Ohnishi et a1(20) present DOS’s for center layers
and surface layers individually. The inelastic mean free path for our 1250eV
8

photoelectrons is about eight layers(21). We have scaled and added together the
surface and center layer DOS’s to give the equivalent of a one surface-seven center
layer (Figure 5) and a two surface-six center layer (Figure 6) convolution with
the instrument resolution (with Shirley background added to each calculation).
The result shows that, even with increased surface contribution, the agreement
with experiment is still poor for EB greater than 2eV. This suggests that the
source of the broadening is not included in either of these DOS’s.
5) Moruzzi et a1c3) DOS with lifetime broadening:
Good agreement with experiment has been obtained by several workers(22-25)
for various materials by including the effects of photohole lifetime broadening
and matrix element modulation. The lifetime broadening is expected to be more
prominent lower in the band (higher binding energy) and small near the Fermi
level. The broadening of the individual states is usually assumed(24j25) to be
proportional to the square of the binding energy. On the other hand, the matrix
element (photoexcitation cross-section) modulates the photoelectron intensity in
cGband metals by a factor usually assumed to be of the form (1 + XE)-1 where E
is the binding energy measured with respect to the center of the &band (located
at 1eV for Fe) and X is an adjustable parameter(22B23).
These two effects have been included in Figure 7 where a good visual fit
was obtained by energy-broadening the individual states of the Moruzzi et a1(13)
DOS using a broadening function having the form AE o 0.9 Eg. The close fit
obtained supports the necessity of adding the above two effects when comparing
the theoretical DOS with experiment. The same broadening function is used
below when comparing the high temperature Fe valence band measurements to
the various DOS calculations for Fe above T,.
3.2 ELEVATED TEMPERATURES
Figures 8-10 are for the measured valence band at elevated temperatures.
Tables I-IV contain calculated parameters from these curves. The variation in
data dispersion between figures is due to two factors: 1) transmission variation
with slit size and 2) the need to acquire the data before there was substantial
surface segregation of 5. Table III represents data acquired by ramping the sample
temperature as quickly as possible with data taken in narrow binding energy
windows for the background and the valence band intensity maximum.
Count totals in the tables are presented for those cases in which the number of
passes at each temperature were the same, otherwise count rates are given. Note,
for example in Figure 10, that although the count rates are similar, the number
of passes was very different, as evidenced by the difference in data dispersion.
Examination of Figures 8-10 shows that there is probably a negligible differ-
ence (with respect to relative intensity and shape) between the fast-temperature
ramp spectra of Figures 9 and 10 and the slow-ramp improved-statistics data of
Figure 8. A discussion of difference spectra based on Figure 8 and the combined
1.034 T, data of Figure 9 and 10 was presented previously(26), the conclusions of
which are the following:
1) the intensity remains relatively constant (“invariant points”) with temper-
ature at binding energies where the spin polarization of Fe is zero at room
temperature;
2) temperature-induced shifts observed in the spectra near EF can be at-
tributed to the temperature-smearing of the Fermi distribution function
and;
3) the high-temperature valence band XPS data presented above disagrees
with any of the predicted DOS’s for Fe above T,.
A comparison of the high temperature DOS’s with the data was done in
Figure 3 of reference 26 without the broadening introduced in Figure 7 of this
10

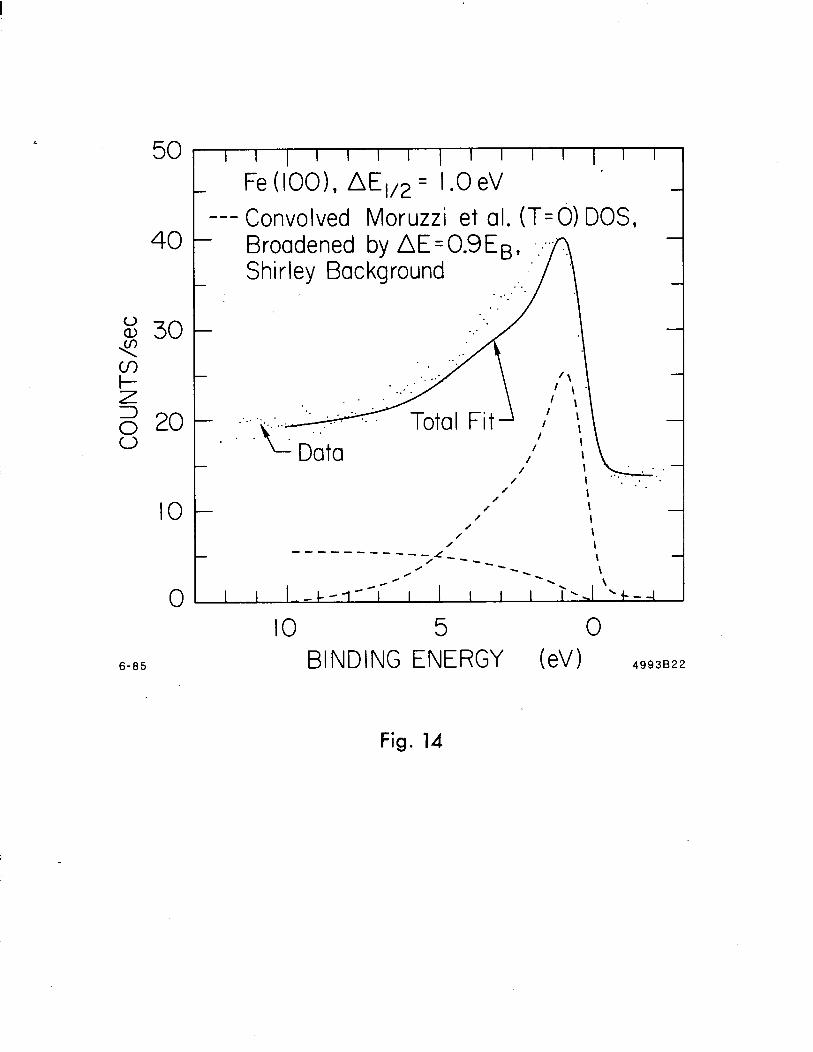
paper. Figures 11-14 show the results of that broadening for the theoretical
DOS’s discussed in reference 26. The relative intensity scale was determined
for each of the theoretical DOS’s by comparing each with the calculation of
Moruzzi et a1c31 used in Figure 2. The instrument resolution used for convolution
in Figures 11-14 included a FWHM of l.OeV reflecting the use of 4mm slits in
the experimental data of Figure 8. The matrix-element correction and lifetime
broadening-function used was the same as that of Figure 7. The experimental
data used in Figures 11-14 is the T=0.964 T, curve of Figure 8 (because of its
better statistics).
Figure 14 shows the T=O DOS of Moruzzi et a1c3) calculated in Figure 7 for
comparison purposes. Figures 11-13 predict a decrease of about 30% in the major
peak around 1eV binding energy. In addition, there is a strong change in the
DOS shape predicted for each of the high temperature DOS’s. Clearly, the data
shows that there is little change in the valence band measurement between room
temperature and T,.
4. Summary
We have measured the XPS valence band of Fe(lOO) at both room tem-
perature and up to temperatures exceeding the Curie temperature, T,. Good
agreement between theory and the room temperature data can be obtained by
convolving the ferromagnetic DOS of Moruzzi et a1c31 with the instrument reso-
lution, broadening the individual DOS states (with hole lifetime broadening and
photoexcitation cross-section modulation) and adding an appropriate inelastic
electron (Shirley) background to the result. This procedure is in agreement
with the results of others(22-251.
The results at elevated temperatures are different. The observed change
in the measured valence band is much less than predicted(1*2,51, even with the
aforementioned broadening effects included in the theoretical T>T, DOS’s.
11

5. References
1. T. Oguchi, K. Terakura and N. Hamada, J. Phys. F 13, 145 (1983).
2. A. J. Pindor, J. Staunton, G.M. Stocks and H. Winter, J. Phys. F 13, 979
(1983).
3. V.C. Moruzzi, J.F. Janak and A.R. Williams, CuZcuZated Electronic Prop-
erties -of Metals, Pergamon, N.Y. (1978).
4. E.P. Wohlfahrt, Rev. Mod. Phys. 25, 211 (1953).
5. T. Jarlborg and M. Peter, J. Magnetism and Mag. Mat. 42, 89 (1984).
6. V. Korenman, J. Murray and R.E. Prange, Phys. Rev. m, 4032 (1977).
7. M.V. You and V. Heine, J. Phys. F l2, 177 (1982).
8. A.M. Turner and J.L. Erskine, Phys. Rev. m, 1983 (1982).
9. E. Kisker, K. Schrijder, M. Campagna and W. Gudat, Phys. Rev. Lett.
52, 2285 (1984).
10. C.S. Fadley and D.A. Shirley, Phys. Rev. A2, 1109 (1970).
11. C.S. Fadley and D.A. Shirley, Phys. Rev. Lett.21, 980(1968).
12. H. Hachst, P. Steiner and S. Hiifner, Z. Phys. m, 145 (1978).
13. P.J. Feibelmann and D.E. Eastman, Phys. Rev. m, 4932 (1974).
14. N.J. Shevchik, Phys. Rev. U, 3428 (1977).
15. L.C. Davis, N.C. MacDonald, P.W. Palmberg, G.E. Riach and R.E. Weber,
Handbook of Auger Electron Spectoscopy, Physical Electronics Ind., 2nd ed.,
(1976).
16. International Mathematical and Statistical Libraries, Inc., Houston, Texas.
17. C.H. Reinsch, Numerische Mathematik 10, 177 (1967).
18. C. de Boor, A Practical Guide To Splines, Applied Mathematical Sciences
Series, Vol. 27, Springer-Verlag, N.Y.(1978).
12
19. D.A. Shirley, Phys. Rev. B5, 4709 (1972).
20. S. Ohnishi, A.J. Freeman and M. Weinert, Phys. Rev. m, 6741 (1983).
21. M.P. Seah and W.A. Dench, Surface Inter. Anal. 1,2(1979).
22. H. HGchst, S. Hiifner and A. Goldmann, Physics Letters m, 265(1976)
(Fe, Co, Pd, Pt).
23. H. HEjchst, S. Hiifner and A. Goldmann, Solid State Comm. l9, 899(1976)
(NbsSn, Nb, Sn).
24. P. Steiner, H. HGchst, J. Schneider, S. Hiifner and C. Politis, Z. Physik
m, 241(1979) (Hf, HfC,N,O, compounds).
25. T. Jarlborg and P.O. Nilsson, J. Phys. C l2, 265 (1979) (Al5 compounds).
26. R.E. Kirby, E. Kisker, F.K. King and E.L. Garwin, SLAC-PUB-3576.
13
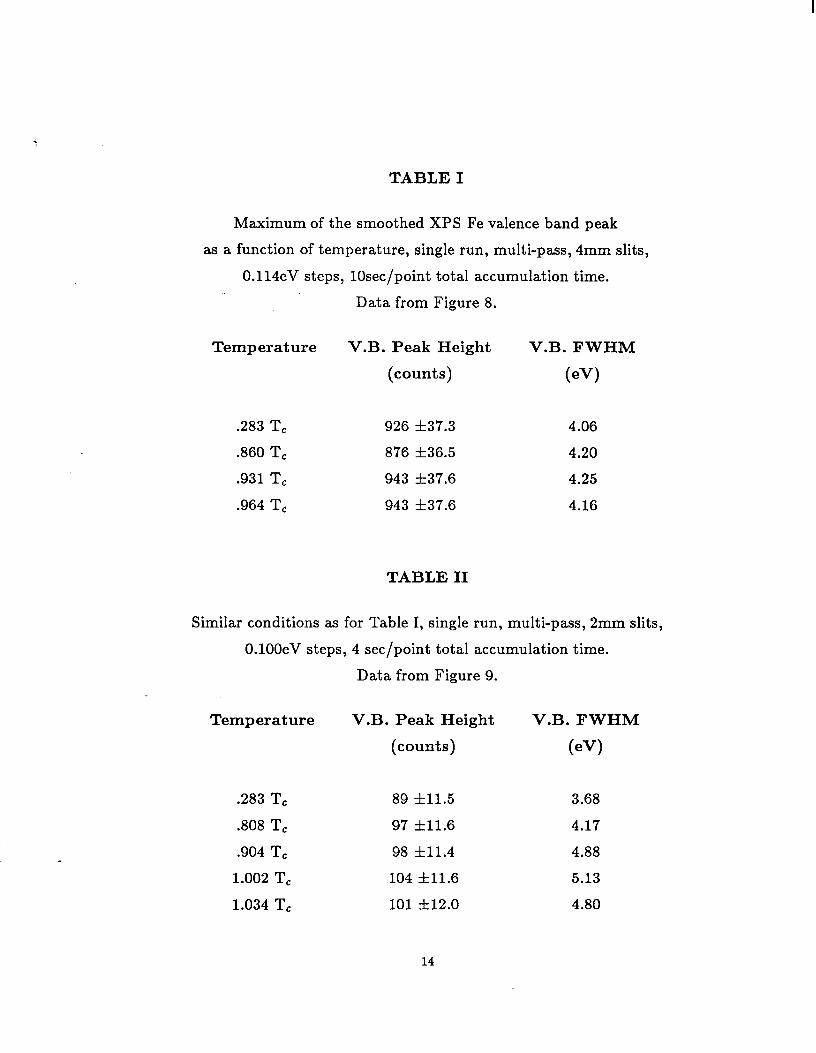
TABLE I
Temperature V.B. Peak Height V.B. FWHM
(counts) w
.283 T, 926 337.3 4.06
.860 T, 876 536.5 4.20
.931 T, 943 f37.6 4.25
.964 T, 943 f37.6 4.16
Maximum of the smoothed XPS Fe valence band peak
as a function of temperature, single run, multi-pass, 4mm slits,
0.114eV steps, lOsec/point total accumulation time.
Data from Figure 8.
TABLE II
Similar conditions as for Table I, single run, multi-pass, 2mm slits,
O.lOOeV steps, 4 set/point total accumulation time.
Data from Figure 9.
Temperature
.283 T,
.808 T,
.904 T,
1.002 T,
1.034 T,
V.B. Peak Height
(counts)
V.B. FWHM
w
89 f11.5 3.68
97 f11.6 4.17
98 f11.4 4.88
104 f11.6 5.13
101 f12.0 4.80
14

TABLE III
Maximum of the smoothed XPS Fe valence band peak
during a fast temperature ramp of 1.36 K set-l,
single run, multi-pass profile, 2mm slits, O.lOOeV step.
Temperature Range V.B. Peak Height
(Count Rate)
.3-.4 T, 21.1 f3.3 Hz (3 set/point)
.4-.9 T, 19.3 f3.6 Hz (2.5 set/point)
.9-1.01 T, 22.7 f3.7 Hz(2.5 set/point)
1.01-1.03 T, 21.0 f2.5 Hz(5 set/point)
TABLE IV
Similar conditions as for Table I, single run, multi-pass, 2mm slits, O.lOOev step.
Data from Figure 10.
Temperature V.B. Peak Height
(Count Rate)
V.B. FWHM
W)
.283 T, 25.5 f1.3 Hz (22.5 set/point) 1.3
1.034 T, 25.35 f4.2 Hz (2 set/point) 4.2
15
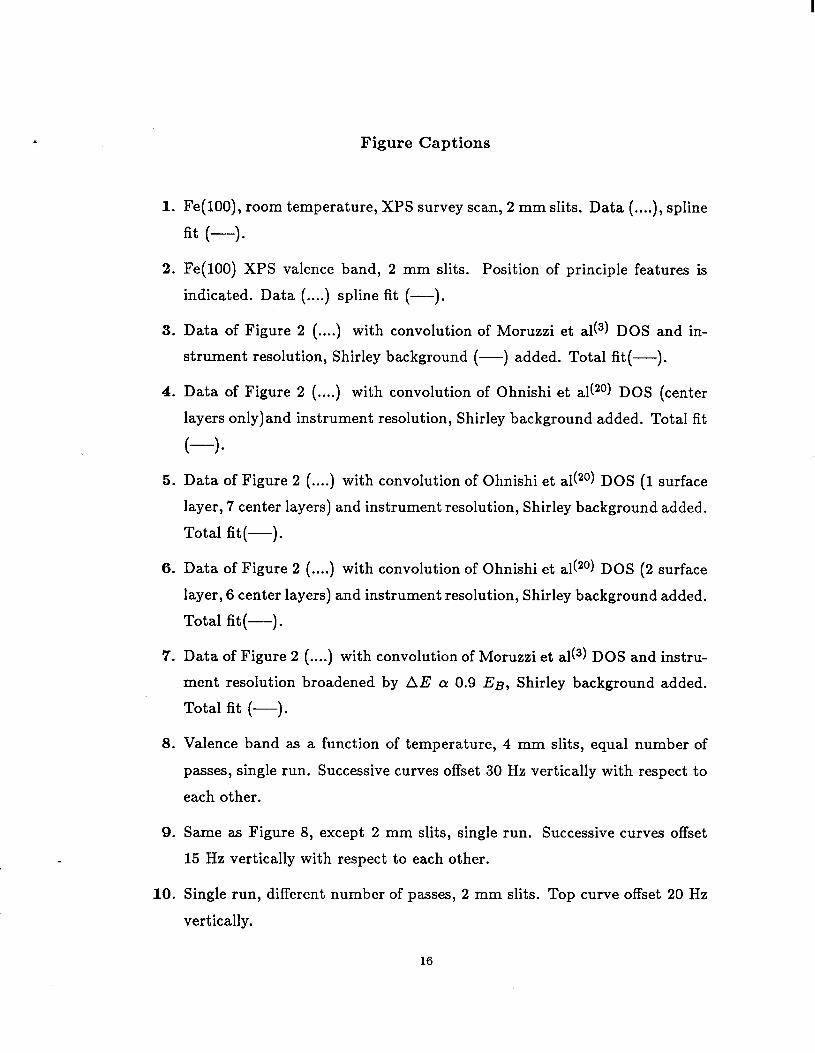
Figure Captions
1. Fe(lOO), room temperature, XPS survey scan, 2 mm slits. Data (....), spline
fit (-).
2. Fe(lOO) XPS valence band, 2 mm slits. Position of principle features is
indicated. Data -(....) spline fit (--).
3. Data of Figure 2 (....) with convolution of Moruzzi et a1c3) DOS and in-
strument resolution, Shirley background (- ) added. Total fit(-).
4. Data of Figure 2 (....) with convolution of Ohnishi et a1(20) DOS (center
layers only)and instrument resolution, Shirley background added. Total fit
(-3
5. Data of Figure 2 (....) with convolution of Ohnishi et a1(20) DOS (1 surface
layer, 7 center layers) and instrument resolution, Shirley background added.
Total fit (-).
6. Data of Figure 2 (....) with convolution of Ohnishi et a1(20) DOS (2 surface
layer, 6 center layers) and instrument resolution, Shirley background added.
Total fit (-).
7. Data of Figure 2 (....) with convolution of Moruzzi et al(“) DOS and instru-
ment resolution broadened by AE c\! 0.9 EB, Shirley background added.
Total fit (-).
8. Valence band as a function of temperature, 4 mm slits, equal number of
passes, single run. Successive curves offset 30 Hz vertically with respect to
each other.
9. Same as Figure 8, except 2 mm slits, single run. Successive curves offset
15 Hz vertically with respect to each other.
10. Single run, different number of passes, 2 mm slits. Top curve offset 20 Hz
vertically.
16
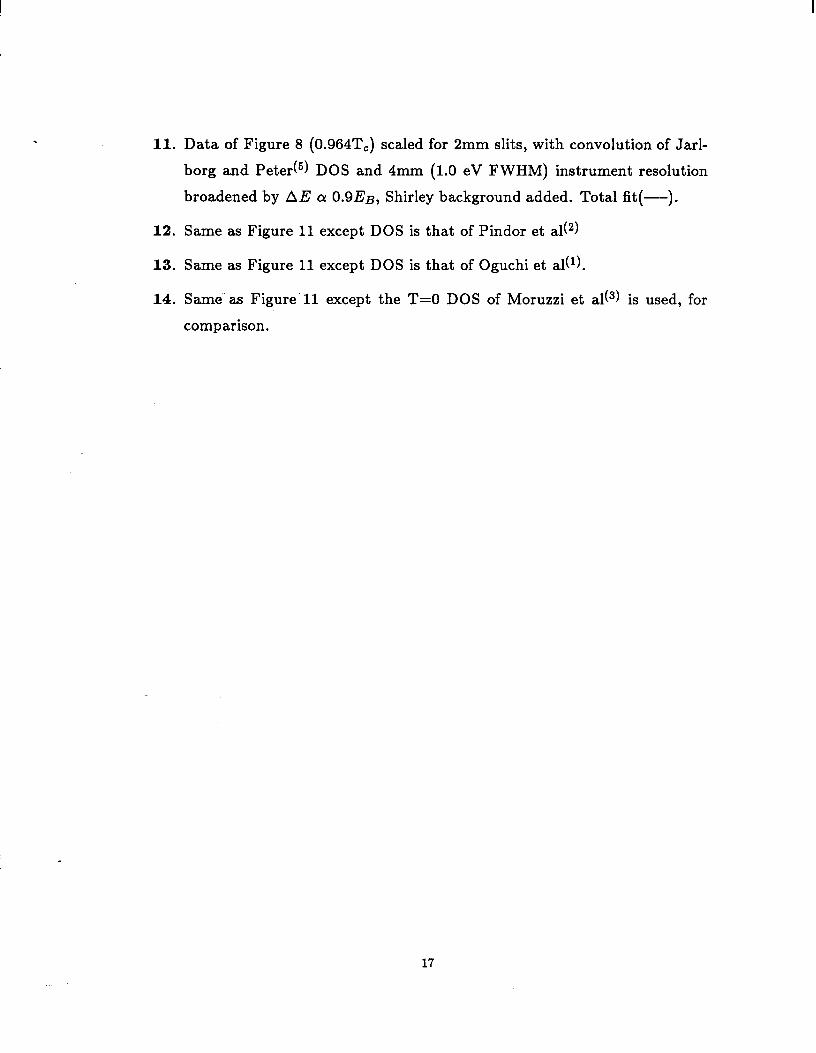
11. Data of Figure 8 (0.964TC) scaled for 2mm slits, with convolution of Jarl-
borg and Peterc5) DOS and 4mm (1.0 eV FWHM) instrument resolution
broadened by AE CY 0.9EB, Shirley background added. Total fit(-).
12. Same as Figure 11 except DOS is that of Pindor et a1c2)
13. Same as Figure 11 except DOS is that of Oguchi et al(l).
14. Same- as Figure- 11 except the T=O DOS of Moruzzi et a1c3) is used, for
comparison.
17

150
g 100 s I- 7 3 00 50
0
12-84
I I I I I
Fe(lOO), T=295 K _ nE1/2 = 0.8 eV
100 50 BINDING ENERGY (eV)
0 499381
Fig. 1

40
30
ts m p 20 Z I> 8
IO
0
12-84
I I I I I I I I I I I’ I ‘I’ I I I
t
1 1 .I. I .I'
Fe(lOO),T=295K 1 1 ! A AE,Q =-0.8 eV
I I 1 I I I I I I I 1 I
I I I I I I I I II I I I I I
IO 5 0 BINDING ENERGY (eV) 499382
Fig. 2

50
40
IO
0
12-84
I I I I I I I I I I I I I I I
- Fe (1001, AE 112 = 0.8 eV --- Convolved Moruzzi et al. . .
DOS, Shirley Background .‘*” n-. -
I / / , / / / -------___ -,- _ -- / -. -4’ - - N. \ . I I -- -- I I \ . -1
IO 5 0- BINDING ENERGY (eV) 4993B9
Fig. 3

50
40
z
I
m 30
? Z
6 20 0
IO
0
1-85
I I I I I I I I I I I I I
Fe(lOO), AEI12= 0.8 eV --- Convolved Ohnishi et al. DOS,
Center Layers Only, Shirley Background ... . .
.A _’
I I . :. . . . . . ., : I I / I
/ / I
_____-------------- -P-, \
IO 5 0 BINDING ENERGY (eV) 4993810
Fig. 4

50
40
IO
0
l-85
I 1 I I I I I I I I I I I I
Fe(lOO), AEl/z= 0.8 eV * ---Convolved Ohnishi et al. DOS,
1 Surface + 7 Center Layers, Shirley Background
/ -
\ . \ I I 1 . I \ I /- / I \ ‘.. I I I L.. ..‘. ..,. - I I / I
/ \ _-------------------- T---2 \
/ -. \ / -. . \
I I I I I I I/I / I I \ . ‘- 1
IO 5 0 BI NDI NG ENERGY (eV> 4993811
Fig. 5

1-85
50
40
30
20
IO
0
I I I I I I I I I I I I I I I I I I I I I I I I I I I I I I
Fe(lOO), AEli = 0.8 eV Fe(lOO), AEli = 0.8 eV ---Convolved Ohnishi et al. DOS, ---Convolved Ohnishi et al. DOS,
2 Surface + 6 Center 2 Surface + 6 Center Layers, Layers, Shirley Backgr
Data 1 ,_ ,,_, :.. ,..” . . .,;;. ‘._.....’ . . . ,._ ,, ;:.,“‘.. .‘,
Total Fit’
IO 5 0 BINDING ENERGY (eV> 4993812
Fig. 6

6-85
50
40
30
20
IO
0
I I I I I I I I I I I I I I I
Fe (IOO), AE l/2 = 0.8 eV ---Convolved Moruzzi et al.
DOS, Broadened by AEcr: O.?EB, Shirley Background .
A
-
- - : / I. - . . .
Tota I Fit
/ I --a--___ -- -,1-- -- \ , -\ . -. \
#-/ .
I I \ \ I I l--T I I I . .
Id- 4
5 0 BINDING ENERGY (eV > 4993818
Fig. 7

250
: 200 cn 3; t- 7 I50 2 o 100
50
12-84
I I I I I I I I I I
-
-
-
Fe 000) Al! l/2 = l.OeV
O.gEc!l T-
0 : 0
6 I I I I I I I I I I
IO 5 0 BINDING ENERGY (eV>
-
4993B3
Fig. 8

I25
100
z 75
F 7
s 50 0
25
0
12-84
Fe (100) AEi,z= 0.8 eV
I .002
0.904 . . _. . Y-p/’ . . .
\\ : . . . .
0.808
0.283 +
.
. . \ .
b . . I I I I I I I I I I I I I I J
IO 5 0 BINDING ENERGY (eV) 499386
Fig. 9

60
t- z, 6 20 0
0
1-85
I I I I I I I I I I I I I I I I I I I I I I I I
Fe (100) . Fe (100) .
. . . . . . . . . .
. . . .
r r I I I I I I I I I I I I I I I I I
IO 5 0 BINDING ENERGY (eV) 499385
Fig. 10
.

6-85
40
30
20
IO
0
--- Convolved Jarlborg 8 Peter (T>T,) DOS , Broadened by x.‘..
-
AEi0.9E8, - .’ Sh i r ley Sh i r ley Bat kground Bat kground .?. ”
. . . . . . . . :;:.:2&/ /-‘L, ,,~ / / \ ..‘.,., ‘. / \ / \ / \ / \ / \ ----------- -/- - _ \ / -\ / -. \ // -. C-( \
I I I ,I -- I I I ---- -
IO 5 0 BINDING ENERGY (eV> 4993819
Fig. 11

6-85 BINDING ENERGY (eV> 4993820
I I I I I I I I I I I I I I
Fe(100),AE1,2 = LOeV --- Convolved hndor et al. (T>Tc 1
-
DOS, Broadened by AE a 0.9&,
. ?. . .
Sh i rley Background :j *. .
/ \ / \
/ / \
/ \ / \
---------- 0
, V-m- \
-- / -\ \
Fig. 12
.

6-85
I I I I I I I I I I I
Fe(lOO), AEli = I .OeV ---Convolved Oguchi et al. (T>T,)
DOS , Broadened by Y”.. - AEa: o.gEB, .’
. . ._.. .
IUIUI t-n- /- \ / \ L ‘. . / . . . /
/ \ . ..‘. \ /
/ \ / \
/ \ / \ / I ------a--_ ---c,- / -- \ / -\
~4 -- \
I I I 1 HH _--- I I -N -2- \ -I
IO 5 0 BINDING ENERGY (eV) 499382 1
Fig. 13
.
50
40
0
6-85
I I I I I I I I I I I I I
Fe (IOO), AE,,, = I .O eV ’ --- Convolved Moruzzi et al. (T=d) DOS,
-
-
-
-
Broadened by AE= 0.9EB, Shirley Background
: ‘, ../
L Data
---------- -,l - -- \ , --
/ --- \ HH -\ . \
I I tic - - I I I I . I .+ ,
IO 5 0 BINDING ENERGY (eV> 4993822
Fig. 14