Va Tech Wabag - Rakesh...
15
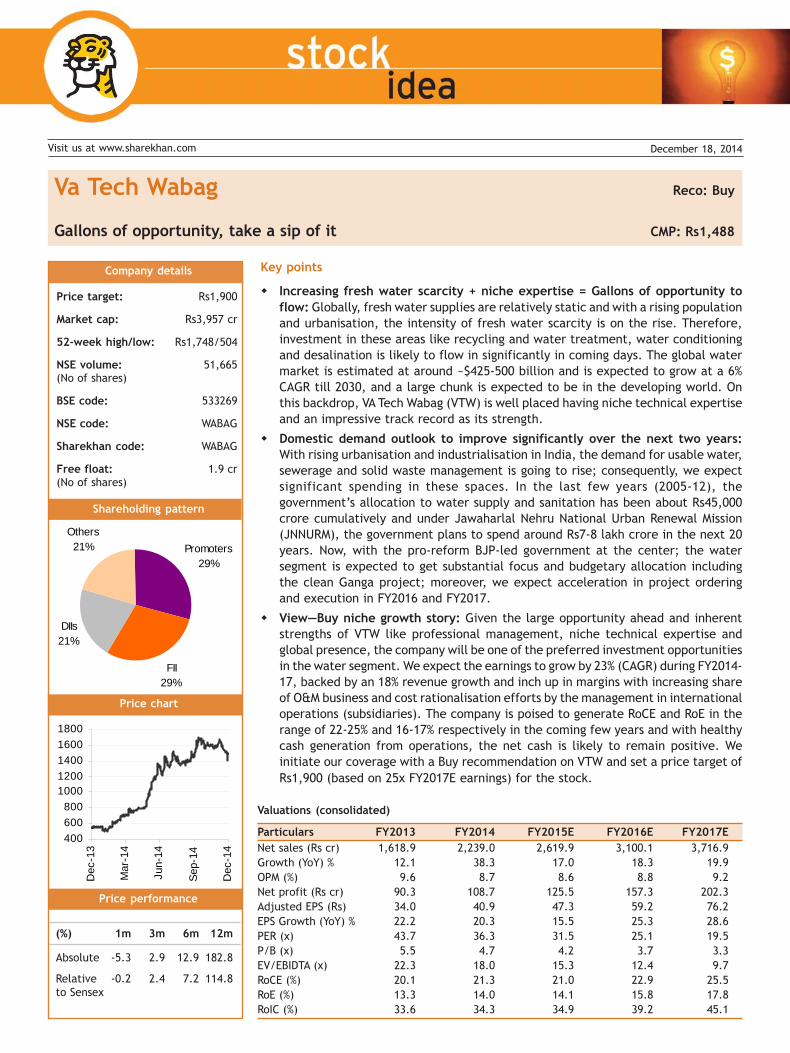
400 600 800 1000 1200 1400 1600 1800 Dec-13 Mar-14 Jun-14 Sep-14 Dec-14 Promoters 29% FII 29% DIIs 21% Others 21% December 18, 2014 Visit us at www.sharekhan.com Va Tech Wabag Reco: Buy Gallons of opportunity, take a sip of it CMP: Rs1,488 Company details Price target: Rs1,900 Market cap: Rs3,957 cr 52-week high/low: Rs1,748/504 NSE volume: 51,665 (No of shares) BSE code: 533269 NSE code: WABAG Sharekhan code: WABAG Free float: 1.9 cr (No of shares) Price performance (%) 1m 3m 6m 12m Absolute -5.3 2.9 12.9 182.8 Relative -0.2 2.4 7.2 114.8 to Sensex Price chart Shareholding pattern Key points Increasing fresh water scarcity + niche expertise = Gallons of opportunity to flow: Globally, fresh water supplies are relatively static and with a rising population and urbanisation, the intensity of fresh water scarcity is on the rise. Therefore, investment in these areas like recycling and water treatment, water conditioning and desalination is likely to flow in significantly in coming days. The global water market is estimated at around ~$425-500 billion and is expected to grow at a 6% CAGR till 2030, and a large chunk is expected to be in the developing world. On this backdrop, VA Tech Wabag (VTW) is well placed having niche technical expertise and an impressive track record as its strength. Domestic demand outlook to improve significantly over the next two years: With rising urbanisation and industrialisation in India, the demand for usable water, sewerage and solid waste management is going to rise; consequently, we expect significant spending in these spaces. In the last few years (2005-12), the government’s allocation to water supply and sanitation has been about Rs45,000 crore cumulatively and under Jawaharlal Nehru National Urban Renewal Mission (JNNURM), the government plans to spend around Rs7-8 lakh crore in the next 20 years. Now, with the pro-reform BJP-led government at the center; the water segment is expected to get substantial focus and budgetary allocation including the clean Ganga project; moreover, we expect acceleration in project ordering and execution in FY2016 and FY2017. View—Buy niche growth story: Given the large opportunity ahead and inherent strengths of VTW like professional management, niche technical expertise and global presence, the company will be one of the preferred investment opportunities in the water segment. We expect the earnings to grow by 23% (CAGR) during FY2014- 17, backed by an 18% revenue growth and inch up in margins with increasing share of O&M business and cost rationalisation efforts by the management in international operations (subsidiaries). The company is poised to generate RoCE and RoE in the range of 22-25% and 16-17% respectively in the coming few years and with healthy cash generation from operations, the net cash is likely to remain positive. We initiate our coverage with a Buy recommendation on VTW and set a price target of Rs1,900 (based on 25x FY2017E earnings) for the stock. Valuations (consolidated) Particulars FY2013 FY2014 FY2015E FY2016E FY2017E Net sales (Rs cr) 1,618.9 2,239.0 2,619.9 3,100.1 3,716.9 Growth (YoY) % 12.1 38.3 17.0 18.3 19.9 OPM (%) 9.6 8.7 8.6 8.8 9.2 Net profit (Rs cr) 90.3 108.7 125.5 157.3 202.3 Adjusted EPS (Rs) 34.0 40.9 47.3 59.2 76.2 EPS Growth (YoY) % 22.2 20.3 15.5 25.3 28.6 PER (x) 43.7 36.3 31.5 25.1 19.5 P/B (x) 5.5 4.7 4.2 3.7 3.3 EV/EBIDTA (x) 22.3 18.0 15.3 12.4 9.7 RoCE (%) 20.1 21.3 21.0 22.9 25.5 RoE (%) 13.3 14.0 14.1 15.8 17.8 RoIC (%) 33.6 34.3 34.9 39.2 45.1
Transcript of Va Tech Wabag - Rakesh...
400
600
800
10001200
1400
1600
1800
Dec
-13
Mar
-14
Jun-
14
Sep
-14
Dec
-14
Promoters29%
FII29%
DIIs21%
Others21%
December 18, 2014Visit us at www.sharekhan.com
Va Tech Wabag Reco: Buy
Gallons of opportunity, take a sip of it CMP: Rs1,488
Company details
Price target: Rs1,900
Market cap: Rs3,957 cr
52-week high/low: Rs1,748/504
NSE volume: 51,665(No of shares)
BSE code: 533269
NSE code: WABAG
Sharekhan code: WABAG
Free float: 1.9 cr(No of shares)
Price performance
(%) 1m 3m 6m 12m
Absolute -5.3 2.9 12.9 182.8
Relative -0.2 2.4 7.2 114.8
to Sensex
Price chart
Shareholding pattern
Key points
� Increasing fresh water scarcity + niche expertise = Gallons of opportunity to
flow: Globally, fresh water supplies are relatively static and with a rising populationand urbanisation, the intensity of fresh water scarcity is on the rise. Therefore,investment in these areas like recycling and water treatment, water conditioningand desalination is likely to flow in significantly in coming days. The global watermarket is estimated at around ~$425-500 billion and is expected to grow at a 6%CAGR till 2030, and a large chunk is expected to be in the developing world. Onthis backdrop, VA Tech Wabag (VTW) is well placed having niche technical expertiseand an impressive track record as its strength.
� Domestic demand outlook to improve significantly over the next two years:
With rising urbanisation and industrialisation in India, the demand for usable water,sewerage and solid waste management is going to rise; consequently, we expectsignificant spending in these spaces. In the last few years (2005-12), thegovernment’s allocation to water supply and sanitation has been about Rs45,000crore cumulatively and under Jawaharlal Nehru National Urban Renewal Mission(JNNURM), the government plans to spend around Rs7-8 lakh crore in the next 20years. Now, with the pro-reform BJP-led government at the center; the watersegment is expected to get substantial focus and budgetary allocation includingthe clean Ganga project; moreover, we expect acceleration in project orderingand execution in FY2016 and FY2017.
� View—Buy niche growth story: Given the large opportunity ahead and inherentstrengths of VTW like professional management, niche technical expertise andglobal presence, the company will be one of the preferred investment opportunitiesin the water segment. We expect the earnings to grow by 23% (CAGR) during FY2014-17, backed by an 18% revenue growth and inch up in margins with increasing shareof O&M business and cost rationalisation efforts by the management in internationaloperations (subsidiaries). The company is poised to generate RoCE and RoE in therange of 22-25% and 16-17% respectively in the coming few years and with healthycash generation from operations, the net cash is likely to remain positive. Weinitiate our coverage with a Buy recommendation on VTW and set a price target of
Rs1,900 (based on 25x FY2017E earnings) for the stock.
Valuations (consolidated)
Particulars FY2013 FY2014 FY2015E FY2016E FY2017E
Net sales (Rs cr) 1,618.9 2,239.0 2,619.9 3,100.1 3,716.9
Growth (YoY) % 12.1 38.3 17.0 18.3 19.9
OPM (%) 9.6 8.7 8.6 8.8 9.2
Net profit (Rs cr) 90.3 108.7 125.5 157.3 202.3
Adjusted EPS (Rs) 34.0 40.9 47.3 59.2 76.2
EPS Growth (YoY) % 22.2 20.3 15.5 25.3 28.6
PER (x) 43.7 36.3 31.5 25.1 19.5
P/B (x) 5.5 4.7 4.2 3.7 3.3
EV/EBIDTA (x) 22.3 18.0 15.3 12.4 9.7
RoCE (%) 20.1 21.3 21.0 22.9 25.5
RoE (%) 13.3 14.0 14.1 15.8 17.8
RoIC (%) 33.6 34.3 34.9 39.2 45.1
2 December 2014Sharekhan
stock idea Va Tech Wabag
� Working capital intensive business, but well managed
by VTW: Though the business model of VTW is asset light,
it is highly working capital intensive. Majority of its
revenues come from EPC in nature and municipalities
are the major clients; hence, traditionally, receivable
days are high (200-250 days). However, the company has
also managed well high payable days in the range of 200-
250 days. Hence, the net working capital days should not
be a matter of concern unless any specific receivable
account turns sticky. Further, we expect a share of
industrial order book to rise, where receivable days are
relatively lower compared with municipalities.
Investment arguments
Increasing water scarcity + Expertise in niche segment
= Gallons of opportunity to flow
Sustainable water scarcity throws gallons of
opportunity: It’s a well know fact that water is one ofthe scare resource of the world now. Industry reportssuggest that out of the total water reserve available onEarth only 2.5% of that is considered as ‘fresh’, and lessthan 1% of that is accessible as surface water. Whilefresh water supplies are relatively static, population ison the rise (now around 7 billion and adding 1 billion ineach 12-13 years currently) and it is likely to growcontinuously on an average rate of 1-3% annually,intensifying water scarcity. A report published by theWater Resource Group suggests that by 2030 if noefficiency gains are assumed, the global demand foraccessible and reliable water could outstrip supply by40% (which is around 2,800 billion m3).
Such an alarming situation throws huge opportunity forthe water industry as across the globe there will be asignificant emphasis to ensure adequate drinkable andusable water for the society. The global water markettoday stands at a massive ~$450-500 billion as estimatedby various agencies and it is expected to grow at a 6%compounded annual growth rate (CAGR) till 2030. Thisimplies a $25-30 billion of opportunity being added everyyear globally. A large chunk of the incremental demandshould come from the developing nations, where demandis expected to grow by 8-10% annually. Growingurbanisation and industrialisation are going to pull thewater demand (power generation is one of the highest
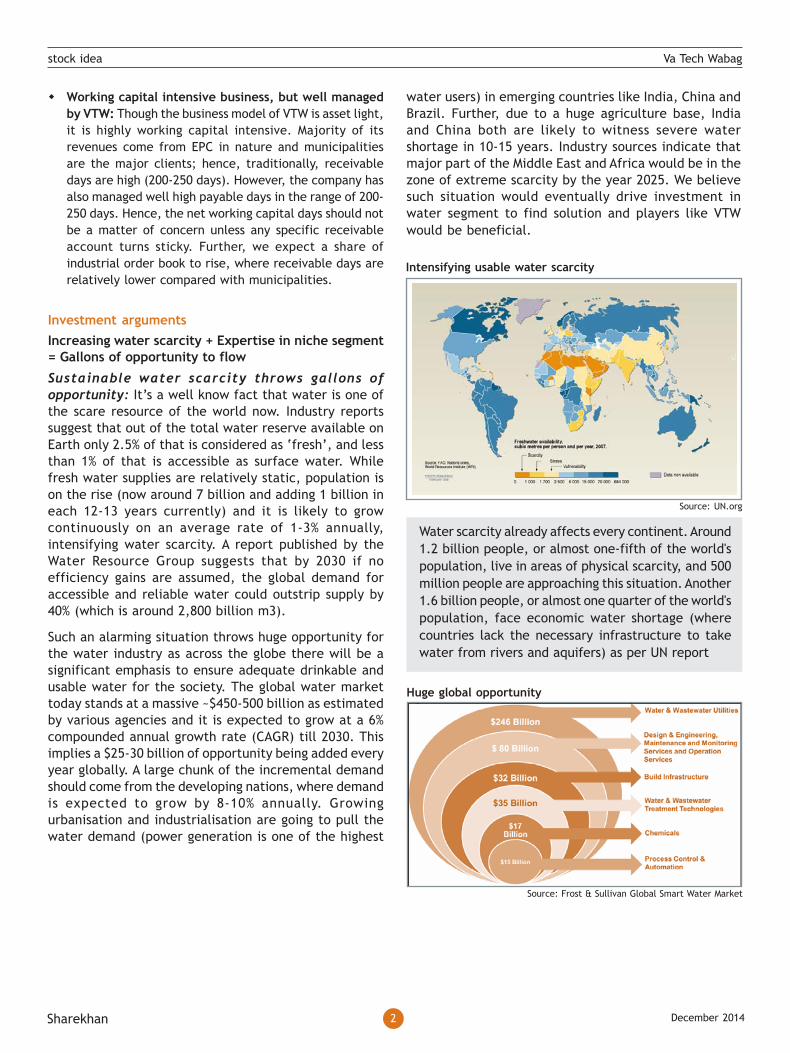
water users) in emerging countries like India, China andBrazil. Further, due to a huge agriculture base, Indiaand China both are likely to witness severe watershortage in 10-15 years. Industry sources indicate thatmajor part of the Middle East and Africa would be in thezone of extreme scarcity by the year 2025. We believesuch situation would eventually drive investment inwater segment to find solution and players like VTW
would be beneficial.
Intensifying usable water scarcity
Source: UN.org
Water scarcity already affects every continent. Around
1.2 billion people, or almost one-fifth of the world's
population, live in areas of physical scarcity, and 500
million people are approaching this situation. Another
1.6 billion people, or almost one quarter of the world's
population, face economic water shortage (where
countries lack the necessary infrastructure to take
water from rivers and aquifers) as per UN report
Huge global opportunity
Source: Frost & Sullivan Global Smart Water Market

3 December 2014Sharekhan
stock idea Va Tech Wabag
Deep expertise in a niche area–a unique offering from
VTW: We believe the water treatment business is a niche
area and it is technology driven. Hence, expertise in this
area is an inherent strength for VTW, which will continue
to put the company in advantageous position and help in
grabbing sizeable share of the upcoming opportunities in
this space, both in domestic as well as global markets.
VTW offers technical know-how of the niche area of water
treatment with superior project management capabilities.
The company designs and plans the entire project
judiciously, selecting the most suitable equipments and
process; and with rich experience in planning and
designing it could manage to deliver cost effective and
efficient solutions to customers. Moreover, off late they
have gained significant traction in grabbing operational
and management projects from various customers and
many of them are projects build by competitors, which
also boasts about their operations and maintenance (O&M)
service credibility. The company has a long history (its
previous promoter, Austrian company, VA Tech acquired
Wabag name since 1999) and rich pedigree which helps
them to retain businesses globally. We believe, given the
positives and increasing opportunities in India and other
parts of the world, VTW should be a preferred bet to play
the sunrise water industry.
Indian opportunity promising; could be the new growth driver
India is one of the major drivers of rising water demand
along with China. We expect a significant spending in
water infrastructure in coming days, given the rising
urbanisation and industrialisation in India, which will
derive demand for usable water, sewerage and solid waste
management in future. The government has already
initiated to focus on water space by investing through
JNNURM. More so now, with the pro-reform BJP-led
government at the center; the water segment is expected
to get substantial focus and budgetary allocation including
the clean Ganga project; moreover, we expect
acceleration in project ordering and execution in FY2016
and FY2017.
Source: Company
A complete range of solutions in water space…from VTW
The company offers water treatment solutions across segments of water, sewer, industrial water, industrial effluents,
desalination and recycling of water.

4 December 2014Sharekhan
stock idea Va Tech Wabag
Under the JNNURM scheme, during 2006-12, the
government had approved total projects to the tune of
Rs70,000 crore and allocated Rs45,000 crore in water,
sewerage and drainage segment. As per the High Powered
Expert Committee (HPEC), the new improved JNNURM
proposes a capital expenditure of Rs39 lakh crore over
the next 20 years and around 20% of that would be towards
water and sewerage. Hence, even the domestic market
is huge and likely to witness a healthy growth.
We believe with abnormal rise of water in intensive energy
sector in the recent past, opportunities from the industries
are expected to jump substantially. Apart from expanding
opportunities in engineering, procurement and
construction (EPC) projects, the opportunity pie for O&M
projects is going to grow substantially in the domestic
market with an increasing requirement of water related
facilities of several industries, with environmental
regulations getting stringent gradually. This could be a
budding and recurring opportunity.
We believe among other social infrastructures, water
sector is one of the key focus areas of the new government
in India. Hence, we expect substantial focus and budgetary
allocation including the clean Ganga project in coming
days. Moreover, we expect acceleration in project ordering
and execution in FY2016 and FY2017. VTW has a ~15%
market share in the highly fragmented water and
wastewater treatment industry in India.
Professional management talks about management quality
After management buyout in 2005, the company is managed
professionally by the promoters who are holding nearly 30%
stake in the company. The current management of the
company is highly professional with rich experience in water
industry, with an average experience of 25 years in the field.
Financial
Healthy order book with fine execution to percolate
into an 18% sales growth
Currently, the company is having a healthy order book of
Rs5,240 crore (2.3x its FY2014 revenue) and there are
frame work contracts (which have a high potential to
convert into order book) of Rs1,670 crore. The
management expects order inflow of around Rs3,200-
Rs3,400 crore in FY2015. Going forward we expect the
order inflow growth momentum could remain in 15-20%
during the next three years, given the expected
acceleration in domestic ordering. We also expect a built-
in order inflow of around Rs4,000-Rs5,000 crore over
FY2016-17E. Based on the historical average execution
cycle (which factors in book to bill ratio of 2.4x) and
expect a revenue growth of 18% CAGR for FY2014-17E.
Multiple levers to sustain margin; potential to inch up
rather
The company is currently having an operating margin of
around 8.6% and the management expects to improve their
margin gradually in the next two to three years, with an
increasing share of O&M business and efforts to rationalise
the cost in international (subsidiaries) operations. We have
factored in the marginal step up in operating profit margin
(OPM) during FY2015-17.
0
500
1000
1500
2000
2500
3000
3500
4000
FY11 FY12 FY13 FY14 FY15E FY16E FY17E
0
1000
2000
3000
4000
5000
6000
7000
8000
9000
10000
Order Book (Rs cr) Revenue (Rs cr)
Healthy order book and revenue traction
0
500
1000
1500
2000
2500
3000
3500
4000
FY11 FY12 FY13 FY14 FY15E FY16E FY17E
0
5
10
15
20
25
30
35
40
45
Revenue (Rs cr) Grow th (%)
Revenue to grow at 18% CAGR
0.0
50.0
100.0
150.0
200.0
250.0
300.0
350.0
400.0
FY11 FY12 FY13 FY14 FY15E FY16E FY17E
8.0
8.2
8.4
8.6
8.8
9.0
9.2
9.4
9.6
9.8
OP (Rs cr) OPM (%)
Sustainable margin ….likely to inch up

5 December 2014Sharekhan
stock idea Va Tech Wabag
Looking at lucrative opportunities, the competition is
obvious from global players; however, we believe VTW
has got some levers which could be supportive to improve
the overall margin. The levers that could play favourably
for VTW are; (1) consciously increasing share of O&M
businesses which are relatively better in terms of margin
and recurring in nature, and (2) ongoing efforts by the
management to rationalise the cost through higher
localisation and consolidation of overhead centers globally.
Moreover, being a veteran in the niche area, backed by
deep expertise and well supportive track record, there is
a fair chance to stand out.
Hence, the same would reflect positively on the overall
margin of the company in future.
Marging composition
OPM FY12 FY13 FY14 FY15E FY16E FY17E
Domestic 11.5 13.1 12.2 12.3 12.5 12.6
Overseas 2.9 2.8 5.9 5.3 5.4 6.2
Blended 9.0 9.6 8.7 8.6 8.8 9.2
Earnings to deliver 23% CAGR over the next three years
As the company is asset light and net cash positive, most
of the benefit from operating level percolates to net profit
level. We expect the earnings to record a CAGR of 23%
during FY2014-17E, backed by an 18% revenue traction
and margin improvement in OPM. We estimate profit after
tax (PAT) of Rs126 crore for FY2015, Rs157 crore for FY2016
and Rs202 crore for FY2017.
0%
10%
20%
30%
40%
50%
60%
70%
80%
FY
08
FY
09
FY
10
FY
11
FY
12
FY
13
FY
14
FY
15E
FY
16E
FY
17E
EPC OB O&M OB
O&M order book to improve gradually
Decentralise international operations and localise
resources to improve margin: VTW’s international
business is currently having lower margin, which is
dragging the overall margin to some extent. In cognisance
of the same, the management of VTW is taking some
measures to improve the margin of its international
business, like decentralise operations and localise
resources to bring down the overhead cost.
Currently, most of the international operations are
controlled and monitored from Austria where the
overheads are significantly high and burdensome. Hence,
the management plans to cut down overheads in Austria.
As part of this exercise, they plan to allocate Indian
resources especially in the regions having growth
potential. We believe most part of the European market
is matured so they want to allocate resources only on
selective countries or regions having growth potential.
Moreover, they plan to allocate local resources in the other
parts of the world, especially in the Middle East, Asia
Pacific, China and Africa, which are having higher growth
potential. As a result of decentralising international
operations and localising resources across the globe, the
margins of international business would start rising.
0
50
100
150
200
250
FY11 FY12 FY13 FY14 FY15E FY16E FY17E
0
5
10
15
20
25
30
35
40
45
Net prof it (Rs cr) Grow th (%)
Strong earnings growth…
Working capital intensive business, but well managed
by VTW
Though the business model of VTW is asset light, yet it is
highly working capital intensive. Bulk (~60-70%) of the
total capital employed by the company is deployed in
working capital only. Majority of its revenues come from
EPC in nature and municipalities are the major clients;
hence, traditionally, receivable days are high (200-250
days). However, the company has also managed well high
payable days in the range of 200-250 days. Hence, the
net working capital days should not be a matter of concern
unless any specific receivable turns sticky.
The management seems confident to manage the working
capital requirement gap in the future too, as they believe
its inherent nature of the business and the payable and
receivable cycle is managed in synergy. We believe it’s
quite challenging to maintain judiciously the spread of

6 December 2014Sharekhan
stock idea Va Tech Wabag
receivable and payable; hence, the ability of the company
to maintain the same is commendable. Further, we expect
a share of industrial order book to rise, where receivable
days are relatively lower compared with municipalities.
cash balance in the company’s books above Rs370 crore
would give enough cushion for the gap of net working capital
requirement if at all any. We ran a sensitivity analysis and
found that even if the spread is widened with higher
receivable days and lower payable days, the existing high
cash in its books would give adequate support and the net
working capital requirement are unlikely to cross that of
cash in the books even in an extreme condition.
Working capital is quasi capex for VTW; concern could
rise only if receivable turns sticky: In a way we can
look at the company which is funding its growth by funding
its working capital requirement as there is hardly any
capital expenditure (capex) requirement in the company.
So, we opine that high working capital days are visible on
the face of it but it should not be a matter of concern
unless any receivable turns sticky. Till date the company
has not experienced any sticky receivable issue. We have
learned from the management that delay in receivable
days is not a usual pattern in the industry in contrasts to
other utilities like power, as normally the average bill of
water utilities are significantly low compared with power
utilities, hence municipalities are comfortable to pay off.
Moreover it’s a very basic utility, which would be delayed
or avoided.
Higher share of industrial revenue could turn
favourable on the receivable days front: The share of
industrial order book is rising in the total order book of
the company. Going forward we expect the share to go
up further with an enhanced focus from the management
and by default rising industrialisation and environmental
norms getting stringent.
We believe the trend will also mirror on sales pattern,
which has already moved from 25% kind of share in FY2011
to 36% in FY2014 and is expected to go up to 42% by
FY2017. Higher share of industrial revenue would be
favourable as receivable days are relatively lower in
industrial business compared with that of municipalities.
-50.0
-40.0
-30.0
-20.0
-10.0
0.0
10.0
20.0
FY09 FY10 FY11 FY12 FY13 FY14 FY15E FY16EFY17E
Gap betw een debtors & creditors days
Receivable and payable spread
Sensitivity analysis
Base case
Particulars FY12 FY13 FY14 FY15E FY16E FY17E
Receivable days 276 250 226 230 230 230
Payable days 261 247 240 245 245 245
Net WC days 31 13 -8 -5 -5 -5
Net cash (Rs cr) 213 204 212 248 315 392
EPS (Rs) 28 34 41 47 59 76
RoE (%) 12 13 14 14 16 18
Bull case
Particulars FY12 FY13 FY14 FY15E FY16E FY17E
Receivable days 276 250 226 210 200 190
Payable days 261 247 240 250 245 240
Net WC days 31 13 -8 -30 -35 -40
Net cash (Rs cr) 213 204 212 422 570 756
EPS (Rs) 28 34 41 52 64 85
RoE (%) 12 13 14 15 17 19
Bear case
Particulars FY12 FY13 FY14 FY15E FY16E FY17E
Receivable days 276 250 226 240 250 260
Payable days 261 247 240 235 230 225
Net WC days 31 13 -8 15 30 45
Net cash (Rs cr) 213 204 212 112 29 -104
EPS (Rs) 28 34 41 46 57 71
RoE (%) 12 13 14 14 15 17
Adequate cushion from existing cash on books: We have
maintained the current spread of receivable days and
payable days in our estimates. Moreover, the existing high
0%10%20%30%40%50%60%70%80%90%
FY
08
FY
09
FY
10
FY
11
FY
12
FY
13
FY
14
FY
15E
FY
16E
FY
17E
Muncipal Sales Industrial Sales
Increasing share of industrial revenue

7 December 2014Sharekhan
stock idea Va Tech Wabag
Eyeing to improve share of O&M business; beneficial
for margin as well as working capital: We believe the
company has enhanced its focus towards O&M service
which is a better margin and low working capital intensive
segment. Moreover, O&M service gives better visibility of
the future earnings as usually they are recurring in nature,
hence the payments are regular that eventually translate
into lower receivable days. Therefore, we believe with
increasing share of O&M order in the total order book of
the company will be helpful.
Healthy returns ratio sustainable
The company is expected to generate a healthy return on
capital employed (RoCE) in the range of 20-21%, which is
likely to move up to 22-24%. Also, on the return on equity
(RoE) front, it is expected to generate returns in the range
of 15-16% on a sustainable basis. Due to its asset light
model and net cash position, the return on invested capital
(RoIC) should continue to be impressive at 35-40%.
View–Buy niche growth story
We believe the company is having a huge growth
potential being a technology driven niche player in a
highly unserved market, water. Increasing spending in
water space across the globe and especially in
developing nations would continue to expand
opportunities. The domestic opportunities could add
growth lever with higher focus of the new government
in clean water related area. Given the large opportunity
ahead and inherent strengths of VTW like professional
management, niche technical expertise and global
presence, the company will be one of the preferred
investment opportunities in the water segment. We
expect the earnings to grow by 23% (CAGR) during
FY2014-17, backed by an 18% revenue growth and inch
up in margin with increasing share of O&M business and
cost rationalisation efforts by the management in
international operations (subsidiaries). We expect its
RoCE to be around 21-24% and RoE to be in the range of
15-17% for the next two to three years. Moreover, with
a healthy cash generation from operations, the net is
likely to remain positive in future too. We initiate our
coverage with a Buy recommendation on VTW and set
a price target of Rs1,900 (based on 25x FY2017E
earnings) for the stock.
Investment concerns
Balancing working capital spread remains as a major
challenge
As discussed above, VTW’s business model is highly working
capital intensive. The company has been managing in the
past judiciously the gap between receivable and payable.
However, due to any reason if receivable and payable
days could not be managed and any specific receivable
turns sticky in future, it could adversely affect the cash
flow, balance sheet and earnings of the company. We have
built-in our model receivable and payable days
conservatively.
International presence puts currency and competition
as challenge
VTW has a wide exposure to multiple currencies which
could bear some exchange rate volatility affecting its
earnings. We believe while the opportunity pie of water
business is growing globally, it would inherently attract
competition from the global players. However, the
technical expertise and resource management skill
(localisation) set of the company should help to face the
competition.
0
10
20
30
40
50
60
FY11 FY12 FY13 FY14 FY15E FY16E FY17E
RoCE (%) RoE (%) RoIC (%)
Healthy returns ratio
Net cash positive-balance sheet with a healthy free cash
flow; sustainable dividend
VTW is having a very healthy balance sheet with a net cash
position of around Rs212 crore (gross cash of Rs370 crore
and debt of Rs158 crore). The surplus cash of the company
would be a big advantage to manage the high working
capital intensive business. In the meanwhile the company
has started generating healthy cash from operations of
around Rs50 and Rs115 crore in FY2013 and FY2014
respectively, which should remain intact in the coming
years. We expect operating cash flow of around Rs300 crore
in the next three years. Further, being an asset-light
business model (with hardly any requirement of capex in
the future), almost all cash generated from operations,
flows down to free cash for the firm. Further, having
professional management at the top, the dividend payout
ratio should remain healthy and consistent in future too.

8 December 2014Sharekhan
stock idea Va Tech Wabag
Company background
German company, WABAG, started as a water division of
Deutsche Babcock in 1996 and was acquired by the Austrian
group VA Tech in 1999. Subsequently, Siemens acquired VA
Tech in July 2005, following in September 2005 a trustee of
India Advantage Funds acquired a majority stake in India
along with the current promoters, in effect of a management
buyout. In November 2007, the company acquired 100% of
WABAG Austria, its former parent company, from Siemens.
The new company went public in October 2010.
Source: Company
Management buyout
In July 2005, VA Tech Wabag worldwide was acquired by
Siemens. Soon after in September 2005, the company had
a management buyout with 20% of the shares with the
management team and 60% of the shares with ICICI
Ventures and the rest with Siemens. In November 2007,
VTW acquired 100% stake in its erstwhile parent company,
VA Tech Wabag GmbH, Vienna through its wholly owned
subsidiary VA Tech Wabag (Singapore) Pte Limited.
Source: Company

9 December 2014Sharekhan
stock idea Va Tech Wabag
Source: Company
Company snapshot
Chennai based VA Tech Wabag is one of the world’s leading
companies in the water treatment field. VTW has eight
decades of plant building experience and its key
competence lies in planning, completion and operation
of drinking water and wastewater plants for both the
municipal and industrial sectors. The company provides
a wide variety of solutions for customers through a
comprehensive range of services and innovative
technologies. VTW’s plants facilitate environmentally
compatible wastewater disposal and secure access to
clean drinking water for an increasing number of people.
This allows it to make an important contribution to
environmental protection and enhanced quality of life. It is
headquartered in Chennai and conducts its global operations
through its subsidiaries and representative offices.
Offering a complete range of solutions in water space:
The company offers water treatment solutions across
segments of water, sewer, industrial water, industrial
effluents, desalination and recycling of water.
Operates in many geographies across the world but is
dominant in the domestic market: Inherently, VTW being
an international company its main area of operation
remains in the Indian market. This can be observed by its
consolidated order backlog which is split between the
domestic (66%) and international continents (34%).
In the domestic market it caters to clients like municipal
corporations and companies in the infrastructure sector
such as power, steel, chemical and oil & gas companies.
In the international market it extents majorly across the
Middle East and North Africa (MENA), Central and Eastern
Europe, and Near East countries. It is also focusing on
growing markets such as Saudi, Qatar, Turkey and China.
Projects under execution across geographies and segments
Project Details Rs cr
Nemmeli, Chennai - 100 MLD Desalination O&M 451
Ulhasnagar, Mumbai - 195 MLD WTP with O&M 330
Istanbul, Turkey O&M 283
OWSSB, Orissa - 100 MLD STP 276
DAWASA, Tanzania – 130 MLD WTP 200
BWSSB, Bellandur - 90 MLD WWTP 1,88
Melamchi, Nepal – 85 MLD WTP 136
Ilugin, Philippines–100 MLD STP 124
Al Ghubra, Oman - 191MLD SWRO 110
Izmir, Turkey – 360 MLD WTP 87
Source: Company
Type of contracts offered by company

10 December 2014Sharekhan
stock idea Va Tech Wabag
Strategic alliance to understand local market better:
VA Tech Wabag has entered into joint ventures and alliance
in the past, both at strategic and project-specific level,
Management profile
Name Designation Experience
Rajiv Mittal Promoter - Managing Director � +27 years of experience in the water industry
� Previously worked with Wabag Water Engineering Ltd, the UK, as
a Deputy Director - International Sales
Shiv Narayan Saraf Promoter - Head of Operations � +39 years experience in the water industry; worked previously
with Ion Exchange India Ltd
� Responsible for construction management of all SBUs
Amit Sengupta Promoter - Executive Director - � +33 years experience; worked previously with Kirloskar AAF
Corporate Strategy � Responsible for devising and implementing strategies for growth,
technology acquisitions, licensing and synergising strengths
S Varadarajan Promoter - CFO � +25 years experience; worked previously with PL Agro
Technologies Ltd as Finance Manager and Company Secretary
� In charge of finance, commercial, legal, secretarial, IT, income
tax and general administration functions
Rahul Jaiswal Head of International Business � +31 years experience in EPC industry including the last 20 years
Group SBU in water treatment in Australia
� Extensive experience in membrane technology
� Responsible for the Middle East, South Asia and Asia Pacific
regions
Erik P Gothlin CEO, Wabag Austria � +19 years experience
� Previously held various management positions in Westermo
Teleindustri, Sweden, ABB and Chromalox
Group as Managing Director - International for the UK, France
and China
Source: Company
JV partner
Particular Purpose
Sumitomo Corp Alliance with Sumitomo Corp will help VA Tech Wabag to expand more into concession type business, where
the projects are capital intensive and de-risk the company’s balance sheet.
Tecpro and Gammon India VTW has partnered with Tecpro Systems and Gammon India to bid for balance of plant (BOP) projects for
power plants.
Zawawi VTW has entered into a joint venture agreement with Zawawi Trading Company, a well known business
group in Sultanate of Oman, to tap the operations and maintenance bus}iness in the water space in Oman.
Source: Company
to gain prequalification for the bids and for technology
references which will eventually help VTW to understand
and enter the local markets better.

11 December 2014Sharekhan
stock idea Va Tech Wabag
Industry overview
Industry overview: Of the total water available on Earth’s
surface only ~3% water is fit for human consumption, while
the rest being unfit as it is in oceans, saline lakes and saline
ground water where the salt content is high. Most of the
fresh water available on Earth is stored in glaciers and ice
caps (~69%) difficult to utilise aptly. The only water source
available for us is the ground water and surface water,
which accounts to 31% of the total fresh water, effectively
0.8% of total global water which is usable by human beings.
“A little water is a sea to an ant”-Anonymous: This
proverb should speak it all and it is crystal clear that water
being a scarce resource should be used judiciously as there
is already a scarcity problem visible across the globe.
Water scarcity already affects every continent. Around
1.2 billion people or almost one-fifth of the world's
population, live in areas of physical scarcity and 500
million people are approaching this situation. Another
1.6 billion people, or almost one quarter of the world's
population, face economic water shortage (where
countries lack the necessary infrastructure to take
water from rivers and aquifers) as per the UN report.
As per Grail Research – “Water-The India Story”, India and
China which were water scarce in the year 2000, by 2025
these countries would be more water scarce country. Major
parts of the Middle East and Africa would be in the zone of
extreme scarcity zone by the year 2025 providing huge
opportunity for players in water business across the globe.
Distribution of Earth's water
Global Per Capita Water Availability (2000)
Water scarcity as per UN report
Source: UN.org

12 December 2014Sharekhan
stock idea Va Tech Wabag
Global Per Capita Water Availability (2025)
Forces behind water scarcity: Demographic growth,
economic development, urbanisation and pollution
are putting pressure on renewable water resources,
especially in the semi-arid and arid regions. In
addition, growth rate of population is higher than
the growth rate in water availability leading to
intense scarcity in the world. Climate change and
bio-energy demands give a further bend to the
already complex relationship between development
and water demand.
Factors affecting the supply of water
� Variability of rainfall: Variability of rainfall
translates into variability in river flow and
groundwater recharge, the two main sources of
water. But, due to erratic nature and change in
rainfall pattern both these sources are turning
unviable.
� Water quality: This is also relevant as increasing
re-use and recirculation of water tends to
deteriorate water quality. Natural contaminants
such as fluoride and arsenic linked to groundwater
also affect the quality of water in some regions.
� Environmental balance: It is essential to maintain
the ecological balance in the current changing
global environment where stringent policies are
present to protect the aquatic ecosystem thus
affecting the availability of fresh water supply.
� Human intervention: Interventions by human
beings can increase the volume of water available
for use like water storage development. It involves
transferring water from high-precipitation regions
to low-precipitation regions. In the past, the most
obvious and most common response to this
problem has been to store surface water behind
dams, but underground water storage has been
increasingly resorted to as a convenient
alternative in recent decades.
� Water control measure: Water control through the
construction of reservoirs, decreases exposure to
seasonal or inter-annual variations of flows and
increases the volume of water available on a
regular basis.
Factors affecting demand of water
� Increase in population: During the 20th century
the world population tripled—while water used for
human purposes multiplied six fold. The demand
for water in developing countries like India and
China is expected to rise steadily, largely due to
the increase in population.
� Rise in income level affects water consumption:
As income rises, pressure on water consumption
also rises. Household water demand as well as
municipal demand increases, along with the
growth in demand for industrial and agriculture
products. Higher income leads to rise in per capita
demand for food. People tend to eat more meat
and dairy products, the production of which
requires more water than a diet based on staple
crop products.
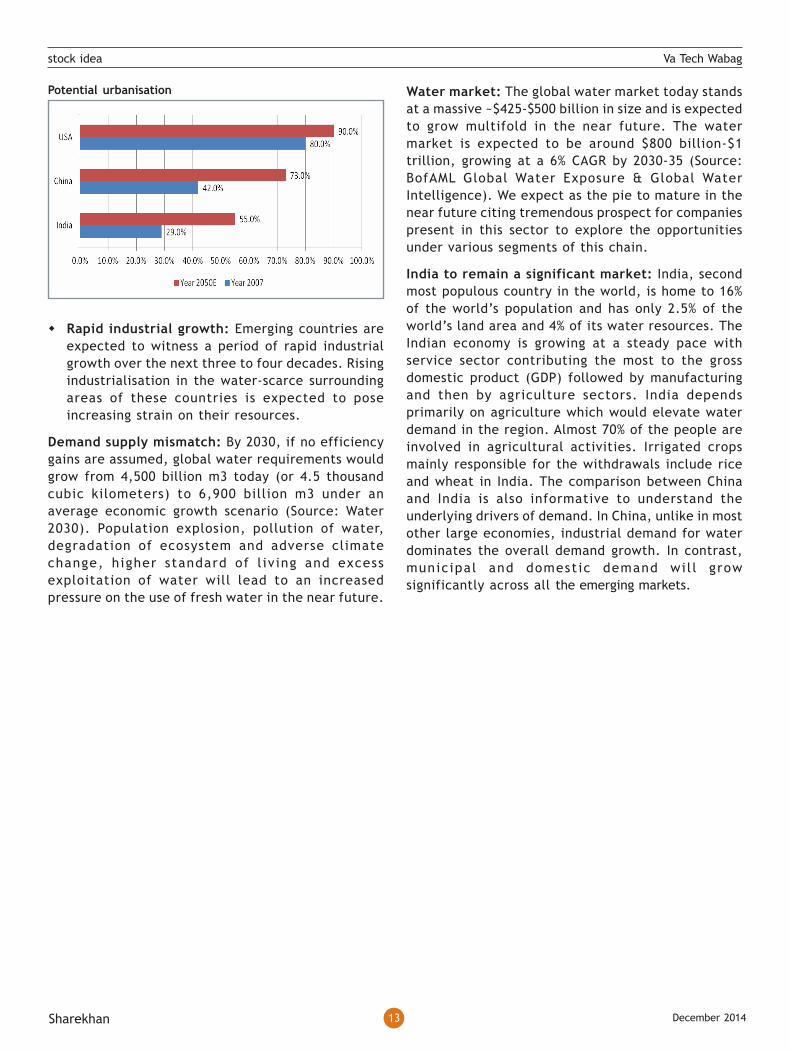
� Urbanisation: The urban population in India is
expected by the United Nations (UN) to grow from
29.2% of the total population in 2007 to 55.2% by
2050, while that of China is set to increase from
42% in 2007 to 73% in 2050.
13 December 2014Sharekhan
stock idea Va Tech Wabag
Potential urbanisation
� Rapid industrial growth: Emerging countries are
expected to witness a period of rapid industrial
growth over the next three to four decades. Rising
industrialisation in the water-scarce surrounding
areas of these countries is expected to pose
increasing strain on their resources.
Demand supply mismatch: By 2030, if no efficiency
gains are assumed, global water requirements would
grow from 4,500 billion m3 today (or 4.5 thousand
cubic kilometers) to 6,900 billion m3 under an
average economic growth scenario (Source: Water
2030). Population explosion, pollution of water,
degradation of ecosystem and adverse climate
change, higher standard of l iv ing and excess
exploitation of water will lead to an increased
pressure on the use of fresh water in the near future.
Water market: The global water market today stands
at a massive ~$425-$500 billion in size and is expected
to grow multifold in the near future. The water
market is expected to be around $800 billion-$1
trillion, growing at a 6% CAGR by 2030-35 (Source:
BofAML Global Water Exposure & Global Water
Intelligence). We expect as the pie to mature in the
near future citing tremendous prospect for companies
present in this sector to explore the opportunities
under various segments of this chain.
India to remain a significant market: India, second
most populous country in the world, is home to 16%
of the world’s population and has only 2.5% of the
world’s land area and 4% of its water resources. The
Indian economy is growing at a steady pace with
service sector contributing the most to the gross
domestic product (GDP) followed by manufacturing
and then by agriculture sectors. India depends
primarily on agriculture which would elevate water
demand in the region. Almost 70% of the people are
involved in agricultural activities. Irrigated crops
mainly responsible for the withdrawals include rice
and wheat in India. The comparison between China
and India is also informative to understand the
underlying drivers of demand. In China, unlike in most
other large economies, industrial demand for water
dominates the overall demand growth. In contrast,
municipal and domestic demand wil l grow
significantly across all the emerging markets.

14 December 2014Sharekhan
stock idea Va Tech Wabag
Profit & Loss account (consolidated) Rs cr
Particulars FY13 FY14 FY15E FY16E FY17E
Net sales (Rs cr) 1,619 2,239 2,620 3,100 3,717
Y-o-Y growth (%) 12.1 38.3 17.0 18.3 19.9
Total cost 1,464 2,045 2,395 2,827 3,374
Operating profit 155 194 225 273 342
Total other income 13 13 16 19 22
EBITDA 168 207 241 292 365
Depreciation 11 15 18 19 21
Interest 22 25 35 40 44
PBT 135 167 188 233 300
Tax 46 53 62 77 99
PAT 90 114 126 156 201
Reported PAT 90 114 126 157 202
Adjusted PAT 90 109 126 157 202
Y-o-Y growth (%) 22.2 20.3 15.5 25.3 28.6
Effective tax rate (%) 33.7 31.6 33.0 33.0 33.0
EPS (Rs) 34.0 42.9 47.3 59.2 76.2
Adjusted EPS 34.0 40.9 47.3 59.2 76.2
Y-o-Y growth (%) 22.2 20.3 15.5 25.3 28.6
Balance Sheet (consolidated) Rs cr
Particulars FY13 FY14 FY15E FY16E FY17E
Share capital 5 5 5 5 5
Reserves & surplus 710 836 932 1,053 1,209
Total shareholder's funds 715 841 938 1,058 1,214
Total debt 82 158 178 198 218
Minority interest 2 3 3 3 3
Total Liabilities 799 1,002 1,119 1,259 1,435
Gross block 114 175 195 210 230
Less: depreciation 63 56 74 92 113
Net block 51 119 122 118 117
CWIP 48 69 39 42 46
Investments 3 23 23 23 23
- Inventories 41 35 72 85 102
- Sundry debtors 1,109 1,387 1,651 1,953 2,342
- Cash and bank 287 370 426 513 610
- Loans and advances 116 100 183 217 260
Other current assets 92 123 157 186 223
Current assets 1,644 2,016 2,489 2,955 3,537
Current liablities 932 1,256 1,497 1,773 2,121
Provisions 159 173 262 310 372
Net current assets 553 586 731 872 1,045
Net deferred tax asset 11 7 7 7 7
Other assets 133 197 197 197 197
Total assets 799 1,002 1,119 1,259 1,435
Financials
Cash flow statement (consolidated) Rs cr
Particulars FY13 FY14 FY15E FY16E FY17E
PAT 90.3 113.8 125.5 157.3 202.3
Depreciation 10.9 15.0 17.6 18.9 20.7
Change in WC (52.7) (14.1) (88.5) (53.8) (76.3)
Operating CF 48.6 114.7 54.6 122.4 146.7
Capex (37.2) (82.1) 9.9 (18.0) (24.0)
Investments 0.3 (19.9) - - -
Others (0.9) 18.3 0.4 - 1.0
Investing CF (37.8) (83.7) 10.3 (18.0) (23.0)
Dividends (21.7) (24.9) (29.4) (36.8) (47.3)
Debt (42.6) 76.1 20.0 20.0 20.0
Equity 1.9 1.3 0.0 0.0 0.0
Financing CF (62.4) 52.5 (9.4) (16.8) (27.3)
Net change (51.6) 83.6 55.6 87.6 96.4
Opening cash 338.3 286.7 370.2 425.8 513.4
Closing cash 286.7 370.2 425.8 513.4 609.8
Closing cash & bank 286.7 370.2 425.8 513.4 609.8
Key ratios (consolidated)
Particulars FY13 FY14 FY15E FY16E FY17E
Sales growth 12.1% 38.3% 17.0% 18.3% 19.9%
Order book growth 14.7% 26.1% 15.1% 18.5% 21.1%
Operating margin (%) 9.6% 8.7% 8.6% 8.8% 9.2%
PAT Margin (%) 5.6% 5.1% 4.8% 5.1% 5.4%
Price/Earnings (x) 43.7 36.3 31.5 25.1 19.5
EV/EBITDA (x) 22.3 18.0 15.3 12.4 9.7
EV/sales (x) 2.3 1.7 1.4 1.2 1.0
Book value/share 269 317 353 399 457
Price/book value (x) 5.5 4.7 4.2 3.7 3.3
Net cash per share 77 80 93 119 147
CEPS 38.1 48.5 53.9 66.4 84.0
P/CEPS 39.0 30.7 27.6 22.4 17.7
Debt/equity (x) 0.1 0.2 0.2 0.2 0.2
Inventory days 10 6 10 10 10
Debtor days 250 226 230 230 230
Creditors days 247 240 245 245 245
Book to bill (x) 2.7 2.4 2.4 2.4 2.4
Sharekhan Limited, its analyst or dependant(s) of the analyst might be holding or having a position in the companies mentioned in the article.

15 December 2014Sharekhan
stock idea Va Tech Wabag
Disclaimer
This document has been prepared by Sharekhan Ltd.(SHAREKHAN) This Document is subject to changes without prior notice and is intended only for the person or entity to which it is addressed to and may contain confidential and/orprivileged material and is not for any type of circulation. Any review, retransmission, or any other use is prohibited. Kindly note that this document does not constitute an offer or solicitation for the purchase or sale of any financialinstrument or as an official confirmation of any transaction.
Though disseminated to all the customers simultaneously, not all customers may receive this report at the same time. SHAREKHAN will not treat recipients as customers by virtue of their receiving this report.
The information contained herein is from publicly available data or other sources believed to be reliable. While we would endeavour to update the information herein on reasonable basis, SHAREKHAN, its subsidiaries and associatedcompanies, their directors and employees (“SHAREKHAN and affiliates”) are under no obligation to update or keep the information current. Also, there may be regulatory, compliance, or other reasons that may prevent SHAREKHAN andaffiliates from doing so. We do not represent that information contained herein is accurate or complete and it should not be relied upon as such. This document is prepared for assistance only and is not intended to be and must not alonebetaken as the basis for an investment decision. The user assumes the entire risk of any use made of this information. Each recipient of this document should make such investigations as it deems necessary to arrive at an independentevaluation of an investment in the securities of companies referred to in this document (including the merits and risks involved), and should consult its own advisors to determine the merits and risks of such an investment. The investmentdiscussed or views expressed may not be suitable for all investors. We do not undertake to advise you as to any change of our views. Affiliates of Sharekhan may have issued other reports that are inconsistent with and reach differentconclusion from the information presented in this report.
This report is not directed or intended for distribution to, or use by, any person or entity who is a citizen or resident of or located in any locality, state, country or other jurisdiction, where such distribution, publication, availability oruse would be contrary to law, regulation or which would subject SHAREKHAN and affiliates to any registration or licensing requirement within such jurisdiction. The securities described herein may or may not be eligible for sale in alljurisdictions or to certain category of investors. Persons in whose possession this document may come are required to inform themselves of and to observe such restriction.
SHAREKHAN & affiliates may have used the information set forth herein before publication and may have positions in, may from time to time purchase or sell or may be materially interested in any of the securities mentioned or relatedsecurities. SHAREKHAN may from time to time solicit from, or perform investment banking, or other services for, any company mentioned herein. Without limiting any of the foregoing, in no event shall SHAREKHAN, any of its affiliatesor any third party involved in, or related to, computing or compiling the information have any liability for any damages of any kind. Any comments or statements made herein are those of the analyst and do not necessarily reflect thoseof SHAREKHAN.
For Private Circulation only
Regd Add: Sharekhan Limited, 10th Floor, Beta Building, Lodha iThink Techno Campus, Off. JVLR, Opp. Kanjurmarg Railway Station, Kanjurmarg (East),
Mumbai – 400042, Maharashtra. Tel: 022 - 61150000. Fax: 67481899; E-mail: [email protected]; Website: www.sharekhan.com; CIN:
U99999MH1995PLC087498. Sharekhan Ltd.: SEBI Regn. Nos. BSE- INB/INF011073351 ; CD-INE011073351; NSE– INB/INF231073330 ; CD-INE231073330;
MCX Stock Exchange- INB/INF261073333 ; CD-INE261073330; DP-NSDL-IN-DP-NSDL-233-2003 ; CDSL-IN-DP-CDSL-271-2004 ; PMS-INP000000662 ; Mutual
Fund-ARN 20669 ; Commodity trading through Sharekhan Commodities Pvt. Ltd.: MCX-10080 ; (MCX/TCM/CORP/0425) ; NCDEX-00132 ; (NCDEX/TCM/
CORP/0142) ; NCDEX SPOT-NCDEXSPOT/116/CO/11/20626; For any complaints email at [email protected] ; Disclaimer: Client should read the Risk
Disclosure Document issued by SEBI & relevant exchanges and Do’s & Don’ts by MCX & NCDEX and the T & C on www.sharekhan.com before investing.


![Josef Lahnsteiner, VA TECH WABAG - gpw. · PDF filePlant Raw Water Capacity Start-up [m 3/day] ... Supplier Chennai/Nemmeli, India Sea water 100,000 2012 X-Flow Cudrefin ... the diagram](https://static.fdocuments.in/doc/165x107/5ab6f3017f8b9a0f058e6fc9/josef-lahnsteiner-va-tech-wabag-gpw-raw-water-capacity-start-up-m-3day-.jpg)