V2X Communication in Heterogeneous Networks · of V2X communication technology in the following...
148
V2X Communication in Heterogeneous Networks vorgelegt von Master of Science Robert Protzmann geb. in Bad Salzungen von der Fakultät IV - Elektrotechnik und Informatik der Technische Universität Berlin zur Erlangung des akademischen Grades Doktor der Ingenieurwissenschaften - Dr.-Ing. - genehmigte Dissertation Promotionsausschuss: Vorsitzender: Prof. Dr. Odej Kao Gutachter: Prof. Dr. Dr. h.c. Radu Popescu-Zeletin Prof. Alexey Vinel, Ph.D Prof. Dr. Manfred Hauswirth Tag der wissenschaftlichen Aussprache: 12. März 2018 Berlin 2018
Transcript of V2X Communication in Heterogeneous Networks · of V2X communication technology in the following...
V2X Communication in HeterogeneousNetworks
vorgelegt vonMaster of ScienceRobert Protzmann
geb. in Bad Salzungen
von der Fakultät IV - Elektrotechnik und Informatikder Technische Universität Berlin
zur Erlangung des akademischen Grades
Doktor der Ingenieurwissenschaften- Dr.-Ing. -
genehmigte Dissertation
Promotionsausschuss:Vorsitzender: Prof. Dr. Odej KaoGutachter: Prof. Dr. Dr. h.c. Radu Popescu-Zeletin
Prof. Alexey Vinel, Ph.DProf. Dr. Manfred Hauswirth
Tag der wissenschaftlichen Aussprache: 12. März 2018
Berlin 2018


Acknowledgements
At this point, I want to express my gratitude to all people who have contributedto this work. A fundamental characteristic of the radio signal reception is thatthe signal experiences contributions from multiple paths. A fundamental designprinciple of communicating vehicular applications is to gather information frommany sources and senders in the surrounding. Both pattern are really close towhat I experienced with me and my thesis. Accordingly, I am pleased to saythat I could all the time rely on input in many different - direct and indirect - ways.
Especially, I would like to thank the following people:My first advisor Prof. Radu Popescu-Zeletin for providing the opportunity to
approach this area of research at his chair. I particularly appreciated the academicfreedom of choice for the subject matter.
My second advisor Prof. Alexey Vinel for reviewing my thesis as a dedicatedexpert in vehicular communication. I’m pleased to get to know you in a conferenceyou were organizing and I’m pleased to contribute to a book you were co-editing.
My third advisor Prof. Manfred Hauswirth for your time being part of theexamination committee and ensuring the scientific quality in our research field ofopen communication systems and open distributed systems.
My colleagues and managers at the department for permanent help and alsofor the enjoyable time at work. I particularly thank Ilja Radusch for helpfuldiscussions and feedback regarding the thesis but also regarding the daily work asresearcher.
Finally, my family and friends who helped me with their encouragement andwith their support whenever I needed it. Special thanks also go to the formerfriends, I used to keep a very intensive relationship, but came apart over the timeof writing this thesis. In the end, all these relations and experiences connectedto the people were important for me to go the long and demanding way and toactually realize where and who I really am.
Thank you so much! Vielen Dank euch allen!
i


Abstract
Future intelligent transport systems will be based on digital networking of vehiclesand infrastructure for mutual information exchange. This will enable many newapplications to increase traffic safety and efficiency as well as new comfort services.How digital networking should look in concrete terms is now being researchedfrom different directions. The basis will be wireless communication systems. Somuch is clear. However, there are mainly the two possibilities of ad hoc networkswith purely decentralized communication as well as cellular mobile networks withexisting infrastructure. The present paper examines heterogeneous solutions inwhich both communication systems exist. Accordingly, it is possible for the twocommunication systems to complement each other sensibly in certain scenarios inorder to fill corresponding technological gaps.
In principle, the various applications also have different characteristics andrequirements for communication technology. For example, in traffic safety andefficiency applications there is an information exchange between many endpoints,while personal comfort applications are generally limited to two points, the clientand the server. Tolerable communication latencies are more strict for securitythan for efficiency applications and so on. For these reasons, this work beginswith a classification of planned “Day One” applications and current applicationtrends. In addition, a technical assessment metric is introduced, in particular toenable the comparison of the mobility-related applications.
The main part of this thesis deals with the simulative comparison of hetero-geneous ad hoc and cellular communication approaches. The V2X SimulationRuntime Infrastructure (VSimRTI) is improved and expanded in different ways.Since the modeling of the radio signal propagation has a great influence on thecommunication characteristics for ad hoc networks, the simulation environment isextended. On the one hand, an approach to the deterministic simulation of build-ings and their shading effects is developed. On the other hand, advanced modelsare presented which statistically model the relevant fading and shadowing effects.An approach is also being developed for the modeling of cellular communication,namely a completely new simulator VSimRTI_Cell. A complete mobile network
iii
iv ABSTRACT
can be very complex. Therefore, a simulation setup that models each individualnode of the system individually would quickly reach its limits in larger vehiclescenarios. For this reason, VSimRTI_Cell offers an efficient abstraction for themodeling of an entire mobile network, i.e. both the radio access network and thecore network.
The last part of this work combines the previous work packages in a simulationstudy. This study analyzes reference applications for the most important classesof traffic safety and efficiency applications using the proposed assessment metricCCP. The applications are not only investigated in isolated scenarios, but aresimulated together in a heterogeneous scenario to investigate the interactions ofad hoc and cellular communication technologies.
Zusammenfassung
Zukünftige intelligente Transportsysteme werden auf der digitalen Vernetzung vonFahrzeugen und Infrastruktur zum gegenseitigen Informationsaustausch basieren.Dadurch werden viele neue Anwendungen zur Steigerung von Verkehrssicherheitund Effizienz, aber auch neuen Komfortdienste ermöglicht. Wie die digitaleVernetzung konkret aussehen soll, wird heutzutage aus verschiedenen Richtungenerforscht. Die Grundlage werden drahtlose Kommunikationssysteme bilden. Sovielist klar. Jedoch gibt es hier vor allem die beiden Möglichkeiten von Ad-hoc-Netzwerken mit rein dezentraler Kommunikation sowie zellulare Mobilfunknetzemit existierender Infrastruktur. Die vorliegende Arbeit untersucht heterogeneLösungen, bei denen beide Kommunikationssysteme existieren. Dementsprechendist es möglich, dass sich die beiden Kommunikationssysteme in bestimmtenSzenarien sinnvoll ergänzen, um entsprechende technologische Lücken zu füllen.
Grundsätzlich weisen die verschiedenen Anwendungen auch unterschiedlicheEigenschaften und Anforderungen an die Kommunikationstechnik auf. Beispiel-sweise gibt es bei Verkehrssicherheits- und Effizienzanwendungen ein Informa-tionsaustausch zwischen vielen Endpunkten, während persönliche Komfortanwen-dungen in der Regel auf zwei Punkte, den Client und den Server, beschränktsind. Tolerierbare Kommunikationslatenzen sind für die Sicherheit strenger alsfür Effizienzanwendungen. Aus diesen Gründen beginnt diese Arbeit mit einerKlassifizierung geplanten “Tag Eins”–Anwendungen und aktuellen Applikation-strends. Darüber hinaus wird eine technische Bewertungsmetrik eingeführt, uminsbesondere den Vergleich der mobilitätsbezogenen Anwendungen zu ermöglichen.
Der Hauptteil dieser Arbeit befasst sich damit den simulativen Vergleich vonheterogenen Ad-hoc- und zellularen Kommunikationsansätzen zu ermöglichen.Dafür wird die V2X Simulation Runtime Infrastructure (VSimRTI) auf unter-schiedliche Weise verbessert und erweitert. Weil für Ad-hoc-Netze besonders dieModellierung der Funksignalausbreitung einen großen Einfluss auf die Kommu-nikationseigenschaften hat, wird die Simulationsumgebung dahingehend erweitert.Zum einen wird ein Ansatz zur deterministischen Simulation von Gebäuden undihren Abschattungseffekten entwickelt. Zum anderen werden erweiterte Modelle
v
vi ZUSAMMENFASSUNG
vorgestellt, welche die relevanten Fading- und Shadowing-Effekte statistisch mod-ellieren. Auch für die Modellierung von zellularer Kommunikation wird ein Ansatzentwickelt, und zwar ein neuer Simulator VSimRTI_Cell. Ein komplettes Mobil-funknetz kann sehr komplex sein. Deshalb würde ein Simulationsaufbau, der jedeneinzelnen Knoten des Systems einzeln modelliert, in größeren Fahrzeugszenar-ien schnell seine Grenzen erreichen. Deswegen bietet der VSimRTI_Cell eineeffiziente Abstraktion zur Modellierung eines gesamten Mobilfunknetzes, alsosowohl Zugangsnetz als auch Kernnetz.
Der letzte Teil dieser Arbeit vereint die vorangegangenen Arbeitspakete ineiner Simulationsstudie. Diese Studie analysiert Referenzanwendungen für diewichtigsten Klassen von Verkehrssicherheits- und Effizienz-Anwendungen unterVerwendung der vorgeschlagenen Bewertungsmetrik CCP. Die Anwendungen wer-den nicht nur in isolierten Szenarien untersucht, sondern zusammen in einemheterogenen Szenario simuliert, um die Wechselwirkungen von Ad-hoc- und zellu-laren Kommunikationstechnologien zu erforschen.

Contents
Acknowledgements i
Abstract iii
Zusammenfassung v
Contents vii
List of Figures x
List of Tables xii
1 Introduction 11.1 Motivation . . . . . . . . . . . . . . . . . . . . . . . . . . . . . . . 11.2 Contribution . . . . . . . . . . . . . . . . . . . . . . . . . . . . . . 71.3 Thesis Structure . . . . . . . . . . . . . . . . . . . . . . . . . . . . 8
2 System Overview 112.1 Envisioned Applications . . . . . . . . . . . . . . . . . . . . . . . . 11
2.1.1 Existing Classifications . . . . . . . . . . . . . . . . . . . . 122.1.2 Application Selection . . . . . . . . . . . . . . . . . . . . . . 14
2.2 Communication Metrics . . . . . . . . . . . . . . . . . . . . . . . . 162.2.1 Classical Communication Metrics . . . . . . . . . . . . . . . 162.2.2 Application Layer Metrics . . . . . . . . . . . . . . . . . . . 18
2.3 Standardized Architectures . . . . . . . . . . . . . . . . . . . . . . 212.3.1 Individual Subsystems . . . . . . . . . . . . . . . . . . . . . 212.3.2 ETSI TC ITS . . . . . . . . . . . . . . . . . . . . . . . . . . 232.3.3 IEEE WAVE . . . . . . . . . . . . . . . . . . . . . . . . . . 30
2.4 Summary of System Overview . . . . . . . . . . . . . . . . . . . . . 33
3 Communication Technologies 35
vii

viii CONTENTS
3.1 Radio Channel . . . . . . . . . . . . . . . . . . . . . . . . . . . . . 353.2 Ad Hoc Communication . . . . . . . . . . . . . . . . . . . . . . . . 39
3.2.1 IEEE 802.11p . . . . . . . . . . . . . . . . . . . . . . . . . . 393.2.2 Alternative Access . . . . . . . . . . . . . . . . . . . . . . . 45
3.3 Cellular Communication Networks . . . . . . . . . . . . . . . . . . 473.3.1 System Architecture . . . . . . . . . . . . . . . . . . . . . . 473.3.2 UMTS-HSPA Family . . . . . . . . . . . . . . . . . . . . . . 503.3.3 LTE (Advanced) Family . . . . . . . . . . . . . . . . . . . . 553.3.4 Suitability for V2X Communication . . . . . . . . . . . . . 58
3.4 Summary of Communication Technologies . . . . . . . . . . . . . . 63
4 Simulation Environment 654.1 Existing Framework . . . . . . . . . . . . . . . . . . . . . . . . . . 654.2 Site-specific Propagation Models . . . . . . . . . . . . . . . . . . . 68
4.2.1 Modeling Approaches . . . . . . . . . . . . . . . . . . . . . 694.2.2 Developed Models . . . . . . . . . . . . . . . . . . . . . . . 724.2.3 Simulation Study . . . . . . . . . . . . . . . . . . . . . . . . 754.2.4 Summary . . . . . . . . . . . . . . . . . . . . . . . . . . . . 80
4.3 Advanced Statistical Communication Models . . . . . . . . . . . . 804.3.1 Qualification . . . . . . . . . . . . . . . . . . . . . . . . . . 814.3.2 Implementation . . . . . . . . . . . . . . . . . . . . . . . . . 814.3.3 Validation . . . . . . . . . . . . . . . . . . . . . . . . . . . . 844.3.4 Evaluation . . . . . . . . . . . . . . . . . . . . . . . . . . . 874.3.5 Summary . . . . . . . . . . . . . . . . . . . . . . . . . . . . 90
4.4 Simulation of Cellular Networks . . . . . . . . . . . . . . . . . . . . 904.4.1 Motivation . . . . . . . . . . . . . . . . . . . . . . . . . . . 904.4.2 Architecture . . . . . . . . . . . . . . . . . . . . . . . . . . 924.4.3 Simulation Study . . . . . . . . . . . . . . . . . . . . . . . . 994.4.4 Summary . . . . . . . . . . . . . . . . . . . . . . . . . . . . 106
4.5 Summary of Simulation Environment . . . . . . . . . . . . . . . . . 107
5 Simulation Analysis 1095.1 Evaluation Metrics . . . . . . . . . . . . . . . . . . . . . . . . . . . 109
5.1.1 Safety metric . . . . . . . . . . . . . . . . . . . . . . . . . . 1095.1.2 Efficiency metric . . . . . . . . . . . . . . . . . . . . . . . . 111
5.2 Simulation Setup . . . . . . . . . . . . . . . . . . . . . . . . . . . . 1115.2.1 Traffic Simulation . . . . . . . . . . . . . . . . . . . . . . . 1125.2.2 Application Simulation . . . . . . . . . . . . . . . . . . . . 1135.2.3 Communication Simulation . . . . . . . . . . . . . . . . . . 1145.2.4 Simulation Variations . . . . . . . . . . . . . . . . . . . . . 114
5.3 Simulation Results . . . . . . . . . . . . . . . . . . . . . . . . . . . 1155.3.1 Safety Metric . . . . . . . . . . . . . . . . . . . . . . . . . . 115

CONTENTS ix
5.3.2 Efficiency Metric . . . . . . . . . . . . . . . . . . . . . . . . 1185.4 Summary of Simulation Analysis . . . . . . . . . . . . . . . . . . . 120
6 Conclusion 1216.1 Summary . . . . . . . . . . . . . . . . . . . . . . . . . . . . . . . . 1216.2 Outlook . . . . . . . . . . . . . . . . . . . . . . . . . . . . . . . . . 123
Bibliography 125

List of Figures
1.1 Innovation space for the improvement of Traffic Safety and Efficiency . 41.2 Scenario for an overtaking assistant with two alternative solutions . . 51.3 Structure of this thesis as V-model . . . . . . . . . . . . . . . . . . . . 9
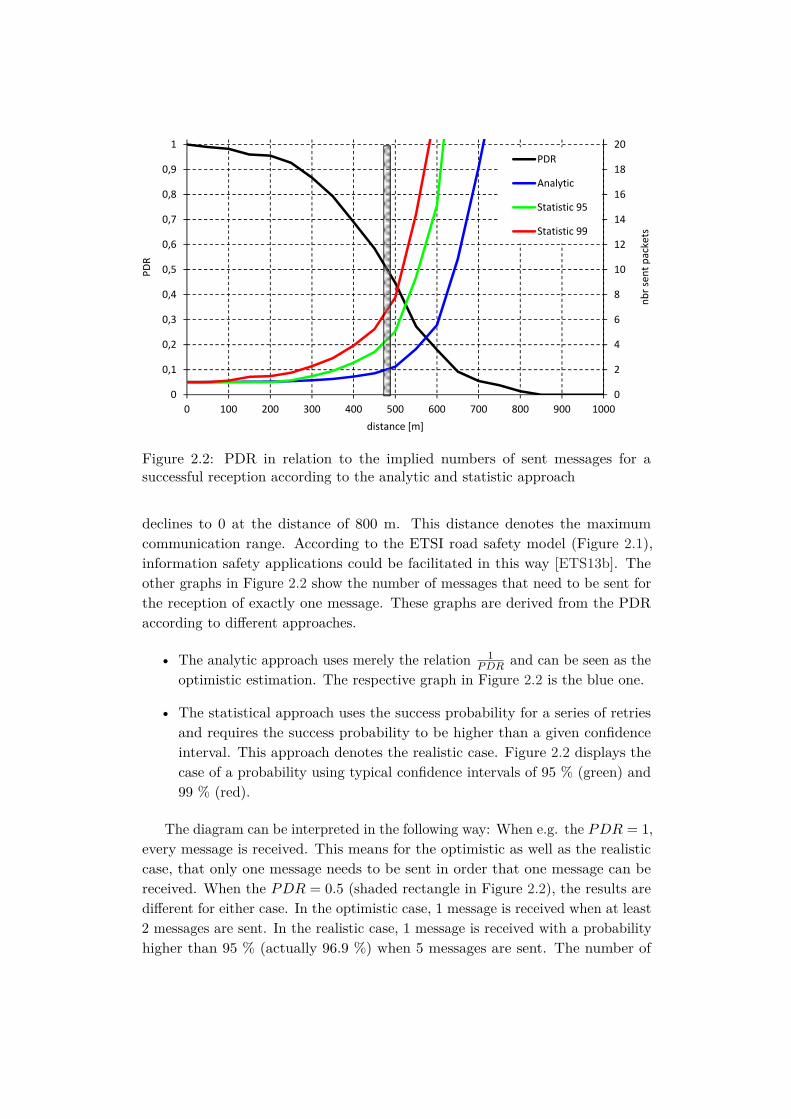
2.1 Zones of the road safety application model (based on [ETS13b]) . . . . 132.2 PDR in relation to the implied numbers of sent messages for a successful
reception according to the analytic and statistic approach . . . . . . . 172.3 ITS station reference architecture by ETSI TC ITS [ETS10a] . . . . . 252.4 Functionalities of the ETSI TC ITS Facilities layer [ETS09] . . . . . . 262.5 Architectural framework of the IEEE WAVE standards [IEE14] . . . . 302.6 Channel access options according to [IEE11]: (a) continuous, (b)
alternating, (c) immediate, and (d) extended . . . . . . . . . . . . . . 32
3.1 Multipath propagation scenario in the vehicular environment . . . . . 363.2 Simplified multicarrier spectrum allocation . . . . . . . . . . . . . . . 383.3 IFS relationships for IEEE 802.11 access timing ([IEE16]) . . . . . . . 423.4 The Hidden Terminal Problem in different scenarios . . . . . . . . . . 443.5 Typical structure of a cellular network compared to a single unidirec-
tional transmitter . . . . . . . . . . . . . . . . . . . . . . . . . . . . . . 473.6 Reference architecture of the UMTS network (Rel-99) . . . . . . . . . 513.7 Protocol stack of UMTS (Rel-99) for packet data transmission . . . . 523.8 Reference architecture of the LTE network (Rel-8) . . . . . . . . . . . 56
4.1 Ray tracing constellation of the three Propagation Models, underlyingvisualization based on map from OpenStreetMap [Ope14] . . . . . . . 74
4.2 Simulation scenarios for the evaluation of an AEV warning application(left: inner-city, right: suburban), visualization based on map fromOSM [Ope14] . . . . . . . . . . . . . . . . . . . . . . . . . . . . . . . . 78
4.3 Percentage of successfully informed vehicles in the inner-city setting . 79
x

LIST OF FIGURES xi
4.4 Percentage of vehicles with successful message reception in the subur-ban environment . . . . . . . . . . . . . . . . . . . . . . . . . . . . . . 79
4.5 Partition of the communication stack between OMNeT++ and CCMSim 824.6 Extract of the system architecture coupling of OMNeT++ and CCM-
Sim to the simulation environment VSimRTI . . . . . . . . . . . . . . 834.7 Comparison of the PDR for OMNeT++ and CCMSim in single access
and multi-access case . . . . . . . . . . . . . . . . . . . . . . . . . . . . 864.8 Simulated scenarios with oncoming traffic, visualization based on
satellite map from Google Earth [Goo12]) . . . . . . . . . . . . . . . . 874.9 Comparison of the RSS for OMNeT++ (Rayleigh Fading) and CCM-
Sim in urban and highway scenarios . . . . . . . . . . . . . . . . . . . 894.10 Comparison of the PDR for OMNeT++ (Rayleigh Fading) and CCM-
Sim in urban and highway scenarios . . . . . . . . . . . . . . . . . . . 904.11 Black box assumption for the cellular system for V2X communication 924.12 Architecture of the VSimRTI_Cell simulator . . . . . . . . . . . . . . 934.13 Different definition possibilities for cellular regions in VSimRTI_Cell,
visualization based on map from OpenStreetMap [Ope15] . . . . . . . 954.14 Probability distribution of the gammaSpeed delay at different speeds . 964.15 Region definition and vehicular routes in the simulated scenario for
the media streaming use case, visualization based on map from GoogleMaps [Goo13] . . . . . . . . . . . . . . . . . . . . . . . . . . . . . . . . 101
4.16 Simulation results for the playback buffer level, compared for the threeprefetching algorithms - (top) Greedy, (mid) Constant, (bottom) Smart104
4.17 Simulation results for the buffer underrun localization, visualizationbased on map from Google Maps [Goo13] . . . . . . . . . . . . . . . . 105
4.18 Simulation results for duration of buffer underrun incidents . . . . . . 106
5.1 Simulation scenario with routes of individual vehicles and cellularregions, visualization based on map from OpenStreetMap [Ope15] . . 112
5.2 Results for safety metric STR for the ad hoc variation . . . . . . . . . 1165.3 Results for safety metric STR for the cellular variation . . . . . . . . . 1175.4 Results for safety metric STR for the hybrid variation . . . . . . . . . 1185.5 Results for efficiency metric MSE for different equipment settings . . . 1195.6 Perceived speed information in the LDM Grid for one vehicle, underly-
ing visualization based on map from OpenStreetMap [Ope15] . . . . . 120

List of Tables
2.1 Example of the sender and receiver message relation for an optimisticand realistic scenario with the same PDR . . . . . . . . . . . . . . . . 19
3.1 Comparison of the Physical Layer parameters of IEEE 802.11a andIEEE 802.11p ([IEE07]) . . . . . . . . . . . . . . . . . . . . . . . . . . 40
3.2 Key features of the 3GPP UMTS and LTE specification releases [3GP17] 49
4.1 Simulation parameters for the study on an AEV use case to comparethe Log-n Shadowing - and the site-specific propagation models . . . . 78
4.2 Physical Layer Parameters for validation and evaluation of the ad-vanced communication models . . . . . . . . . . . . . . . . . . . . . . 85
4.3 Simulation parameterization for the different regions in the mediastreaming scenario . . . . . . . . . . . . . . . . . . . . . . . . . . . . . 102
4.4 Simulation results for the three presented prefetching algorithms . . . 103
5.1 Simulation parameters for the application modules . . . . . . . . . . . 1145.2 Simulation parameters for the communication properties . . . . . . . . 115
xii
Chapter 1
Introduction
This chapter gives an introduction to this document. Initially, the motivation forthe work is presented. Afterwards, the contributions and the scope of this thesisare stated. The final section of this chapter outlines the general structure of thedocument.
1.1 Motivation
Over the last decades, electronics and information technologies emerged to be thekey factor for innovation in the automotive world. The Vehicle-to-Vehicle (V2V)and Vehicle-to-Infrastructure (V2I) communication, which is overall referred to asVehicle-to-X (V2X) communication or Inter-Vehicle Communication (IVC), is aresearch area of particular interest. A great number of envisioned use cases raisehigh expectations for the introduction of this technology in future generationsof vehicles. The terms Intelligent Transportation Systems (ITS), respectivelyCooperative ITS (C-ITS), are also often used in relation with communicatingvehicles. These terms especially refer to the use cases that will help to increasethe safety and efficiency of road transport. From a holistic view, many otherdigital functions, which are e.g. connected with Internet based services, can alsobe applied in the vehicles.
Essentially, the research in V2X communication faces two areas of challenges,stemming from
1. the nature of the use cases themselves and
2. the physical characteristics of the vehicular environment.
First, the responsible stakeholders for the introduction of the V2X communi-cation technology to the daily life are mainly interested in the potential use cases.
1
2 CHAPTER 1. INTRODUCTION
Today, the integration of mobile devices like smartphones decouples the differentdevelopment cycles in consumer and automotive electronics. Hence, many com-munication use cases, which keep the human in the loop like e-mailing, browsingor media streaming, are already available in vehicles. Moreover, location-basedservices are of special interest due to a major intention of vehicles, which is movingfrom one location to another. All these use cases base on the conventional commu-nication pattern with a direct connection between two nodes. In contrast, the usecases that rely on communication of machine to machine (M2M) cause completelynew paradigms. Such use cases would not address only a single communicationpartner, but multiple ones in the local neighborhood. From the related field ofrobotics, it is known that control loops exhibit tight real-time constraints. Inthis manner, the information of the parameters to be processed in such loops israther small (measured in bits), but needs to arrive in time. The same appliesfor M2M-communication use cases. Due to the dynamic changes of the vehiculardriving situations, the information becomes outdated and needs to be periodicallyrefreshed, which means periodically retransmitted. In fact, M2M-communicationuse cases are promised to have the highest potential to shape the future situationin the automotive transport. Particularly, these use cases can improve trafficsafety and efficiency. Vehicles that communicate with their neighbors are ableto anticipate critical traffic situations and inform their drivers earlier. Moreover,vehicles can feed the received information to their assistant systems to facilitatesafe driving maneuvers based on cooperation.
Nevertheless, the introduction of M2M-communication based use cases to thevehicles is a difficult task. It is different from others as it needs a minimum ofnetworking partners to communicate. Especially, early customers will need towait upon a certain market penetration until they can perceive the functionality,they have paid for. Instead, the traditional way since introduction of the earliestelectronic components to vehicles realizes new safety features locally in the vehicle,mainly with more sophisticated sensors. For example, electronic stability controluses gyroscopes; adaptive cruise control relies on radar to extend the view of thesystem. Sensor technology for the emerging field of autonomous driving relies onan integrated setup of radars, 3D lidars and (stereo)-cameras. Besides the directlyarising benefits, this way keeps another considerable advantage for the automotiveengineers that influenced their mindset to a great extent. When they assure thatthe own sensors work correctly, they can trust the gathered information and do notneed to care about information security. In contrast, external information alwaysincludes the potential to originate from defect components of the other participantsor even being intentionally manipulated. For the drivers, communicating vehiclesmight imply less privacy as somebody can track their vehicles and routes.
Second, the wireless communication engineers meet other challenging problemswhen they approach the topic from their perspective. The vehicular environment

1.1. MOTIVATION 3
possesses very special communication characteristics. It is very heterogeneous,ranging from urban scenarios, with dense building development to shadow thesignal propagation, to rural areas without these so-called scatterers. The possiblyhigh relative speeds of the vehicles induce physical distortions of the informationsignal. Moreover, the mostly different routes of the vehicles lead to continuouslychanging neighbors. In the early stage of introduction as well as in low trafficperiods, there will be few communication partners and sparse connections. Incontrast, there will be high densities on major roads in rush hour periods. Innetworking terms, these characteristics lead to continuously changing connec-tions and communication partner densities. In other words, scalability of thecommunication system is a very important issue.
Anyway, despite certain concerns, cooperation using V2X communicationtechnology is definitely a further step for new innovations in safety and efficiencythat cannot be achieved with standalone technologies. Security and privacy needto be considered for sure. Moreover, it helps to prove that V2X communicationreally outperforms relying only upon local sensors to gain acceptance from thestakeholders. Therefore, Figure 1.1 sketches the individual landmarks in theinnovation space for improvement of traffic safety and efficiency. Please note, thatsafety and efficiency depend on and mutually facilitate each other. More efficiencyreduces the stress for the drivers, and accordingly the probability of disorder.The avoidance of accidents due to more safety leads to higher efficiency. Theinnovation space spans from the current situation (Now) to the limitations of thevehicles’ brakes, engines or tires and so on (Physical Optimum). Certainly, thislimit can be shifted in the direction to increase safety and efficiency with betterphysical components. However, this is out of scope what the communicationtechnology can contribute. Assuming all information is available and meets thetiming constraints of the control-loops, there might be still inevitable accidents.This landmark (Ideal Knowledge) can probably be shifted in the direction ofthe physical optimum with better processing in the actuators, but is the limitfor the information system. Assuming the vehicular environment with a certaincommunication channel, where information can be delayed or even never reachthe destination at all, sets the Information Theoretical Limit. Finally, the successdepends on applications and protocols of the V2X communication technology.
It is a difficult task to localize this particular landmark in the innovation spaceas it implies a multidisciplinary discussion with security engineers, traffic experts,and psychologists and so on. When insufficiently designed, V2X communicationtechnology can be still worse than the realization with perfect local sensors,especially when wrong information is disseminated.
A commendable approach tries to tackle the problem of proving the impactof V2X communication technology in the following way. It starts with therequirements of use cases and derives, from this point, the properties for the

4 CHAPTER 1. INTRODUCTION
Physical Optimum
More Safety and Efficiency
Now
Figure 1.1: Innovation space for the improvement of Traffic Safety and Efficiency
design of the communication system. This approach is sometimes referred toas top-down to distinguish it from starting with the communication channel,protocols and algorithms - in this context known as bottom-up. The bottom-upapproach is the traditional way communication engineers have designed today’sinformation network systems. However, the sole top-down approach still exhibitscertain problems. Initially, the exact functionalities and requirements of the usecases need to exist. Today, there are already many use cases envisioned with manydifferent requirements. Moreover, there are often many ways and applications toimplement a use case. In this manner, the use cases need to be classified to avoidgoing the top-down approach many times. As the case, design indications maybe too imprecise when fewer details are considered for the categories. Moreover,derived design indications can be contradicting for different applications or evenbe impossible to realize.
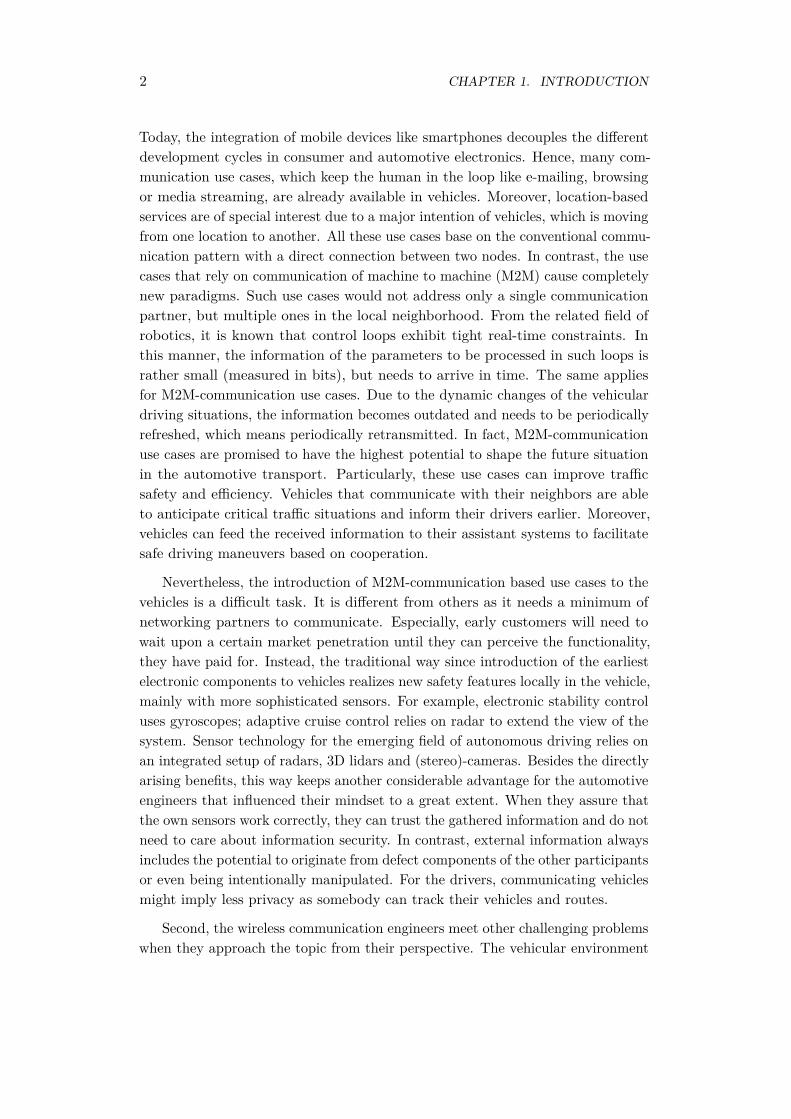
The example of a V2X supported overtaking assist, depicted in Figure 1.2,should serve as an illustration. In this case, a driver in the Ego vehicle should beassisted for safe overtaking of a larger Truck, which obstructs the view towardspossibly opposing traffic (vehicle Opp). Even advanced sensors like cameras orlidars would not be able to determine oncoming objects as early as communicatingvehicles can. Two different solutions with different communication properties canbe imagined immediately. Certainly, there are many more.
1. The Opp vehicle is equipped with a satellite navigation system (e.g. GPS)and V2X communication technology and sends information about its positionvector, including the position, heading and speed. The Ego vehicle, whichalso uses GPS and V2X, receives this information. With the own and thereceived trajectories, it can calculate whether the overtaking maneuver is safeor not. Afterwards, it can inform the driver or initiate the maneuver in case
1.1. MOTIVATION 5
Ego
TruckOpp
Frontview Video
Position Vector1.
2.
Figure 1.2: Scenario for an overtaking assistant with two alternative solutions
of autonomous driving. In this solution, the information to be exchangedis relatively small when it comes to bits. However, the information needsto arrive at Ego in time, which means at least before Ego on its own cansee Opp. Otherwise, the driver would not perceive an additional benefitfrom the V2X communication technology. However, the critical issue inthis implementation is that Ego cannot be sure that there is no one in theoncoming traffic, when it does not receive the information. In such a usecase, a false negative error - meaning there is an oncoming vehicle but noindication - cannot be accepted. Hence, the solution is only safe when defacto all vehicles are equipped with the V2X communication technologyAND the information from the relevant vehicles definitely arrives at Ego.
2. The Truck uses a front view camera and streams the captured video overV2X communication. Upon reception, Ego can either directly display thevideo for the driver or computationally analyze the video for oncomingvehicles. In this way, Egos view extents compared to local camera sensors.This solution also requires in-time transmission and short delays for the videoto be accepted. Moreover, the video should exhibit a certain resolution todistinguish a possibly oncoming vehicle from other objects in the setting. Thesize of the video would definitely exceed the size of the position vector fromsolution 1). For many participants, such a resource intensive solution wouldpossibly lead to a bottleneck of the communication channel. Nonetheless,the solution already works from the beginning for every equipped truck.It can be introduced gradually, even if there are still unequipped trucksremaining.
The example shows several aspects for the sphere, where the V2X communica-

6 CHAPTER 1. INTRODUCTION
tion system is designed. First, several application solutions can address the sameuse case. The different solutions exhibit very different communication properties.A possible top-down investigation would suppose different design directions forthe underlying system. Second, one of the most important aspects is that certainsolutions enable a nearly immediate benefit for early adopters, while others needa minimum penetration rate of communicating partners to work. For solution 1)from the example, the minimum penetration rate is even 100%.
The evolution of V2X communication technology will take a similar way asalready seen at the other communication systems, e.g. recently the mobile Internetaccess in connection with smart devices. Back then, when the third generationbroadband wireless networks were developed, communication engineers thoughtdeeply about must-have use cases that justify the capable specifications. Now,when the communication systems have a mature stage and open interfaces forexperts from other domains, the variety of use cases has grown tremendously.When the communication facilities are available, applications will follow andprobably turn out different regarding the requirements, than estimated today. Ofcourse, the communication system needs to be flexible enough to be tuned forthe use case requirements. This means that the top-down approach to derivethe requirements for the system and the bottom-up approach to develop thecapabilities need to go hand in hand.
From technical perspective, two alternatives are currently envisioned to re-alize the V2X communication system. Each alternative exhibits its individualadvantages but also disadvantages compared to the other one. First, there is theconcept of ad hoc networks. This alternative has a long relevance in the academiccommunity. The term VANETS (vehicular ad hoc networks) was and still is aprominent synonym for V2X communication. VANETS are based on wirelessLANs with communication in the ad hoc mode. This approach already offersmany advantages for the specific needs of the M2M-communication use cases.The direct communication allows short latencies and short messages. Moreover,the direct exploitation of the broadcast-characteristics of the wireless channel ispossible. However, the scalability is a big challenge in this approach, due to thelimited communication range. For spanning longer distances, messages need tobe relayed. On the one hand, in sparse network situations, no communicationwould be possible. This would be the case in the early stage of the marketpenetration, as well as in areas or at times with low traffic. On the other hand,too many participants are a problem as well, when the communication mediumgets congested. After intensive efforts, researchers have found solutions to manyproblems and have tailored protocols to meet the specific characteristics. Fieldtrials were set up to show the maturity of the system. Still, the landmark whereV2X communication technology is localized in the innovation space (Figure 1.1) isnot convincingly positioned, especially for the Day One situation with view partic-
1.2. CONTRIBUTION 7
ipants. The second alternative uses infrastructure based cellular networks not onlyfor Internet services, but also for traffic safety and efficiency matters. Cellularnetworks exhibit the major advantage of a nearly unlimited communication range,due to the architecture with only a short wireless part between the mobile deviceand the base station and the wired part through the backbone. However, thecurrent generations are not primarily designed for the specific needs of vehicularuse cases with the M2M-communication pattern. The systems are optimized forhigh data rates without real-time requirements. Moreover, a partial technicalproblem arises due to the different cellular networks by different operators.
Even though, the situation appears to be dominated by a competition of thefactions, which favor either ad hoc or cellular based technologies. This thesis willalso investigate the cases when both approaches complement one another. Theintroduction of V2X communication will not be a uniform process. It will includeone part of users to decide first equip their vehicles with a cellular solution andone part with an ad hoc solution. In this way, this thesis proposes the statementthat heterogeneous vehicular networks are important to leverage use cases forcommunicating vehicles.
1.2 Contribution
This thesis aims to answer the question of the benefit to focus on heterogeneousconcepts for the development of V2X communication applications in the followingway.
First, it will investigate the currently envisioned use cases and applicationtrends for connected vehicles to derive the requirements of the V2X applicationsfor the underlying communication systems regarding important parameters astransmission latencies, packet errors, amount of data and so on. Certainly, due tothe diversity of the applications, the requirements would also turn out differently.For instance, use cases that require a higher communication horizon typicallyexhibit less critical performance for the transmission latencies. For this reason,this thesis will establish a classification of the applications for the later evaluation.This part of the thesis comes close to the mentioned top-down approach.
The second major objective of the thesis concerns the identification of thetechnical capabilities of the communication systems to approach the topic fromthe bottom-up perspective. Moreover, it aims to adapt and extend a simulationenvironment to model the relevant aspects of the different access technologies. Thebasis is the V2X Simulation Runtime Infrastructure (VSimRTI), which was devel-oped in a previous work at the department. To allow comprehensive investigationsof vehicular communication scenarios, VSimRTI couples state-of-the-art simula-tors from different domains such as traffic, wireless communication and vehicularapplications. However, with the specific focus on communication characteristics
8 CHAPTER 1. INTRODUCTION
and, more precisely, on heterogeneous networks, the simulation environment needsto be extended. The ad hoc communication simulator will receive advanced modelsto regard for important aspects of the radio propagation, such as fading andshadowing on buildings. For cellular communication, a completely new simulator,which incorporates the wireless as well as the wired part of a cellular network,will be developed. The new features will be presented with individual simulationsstudies. Actually, this part denotes the core work of the thesis.
Finally, the thesis compares the advantages and disadvantages of the ad hocand cellular communication approach with a concluding simulation study. Theresults will be evaluated with communication metrics that regard especially for thepresented envisioned applications. Moreover, the applications and communicationtechnologies will not be investigated in isolated scenarios, but the simulatedtogether in one scenario to explore the interdependencies. A hybrid approach thatuses both communication technologies, will benefit from the low latencies of thead hoc path and the robust and high-range communication of the cellular path.
1.3 Thesis Structure
The content of the individual chapters in this thesis is given as follows.
• This Chapter 1 already introduced the general sphere of the present workand stated the objectives, which are to be pursued.
• Chapter 2 provides an overview of the V2X communication system. It startswith the envisioned applications which should be introduced from day oneto select a subset of applications, which are evaluated later in Chapter 5.Moreover, the standardized systems for V2X communication are introduced.
• Chapter 3 presents a comprehensive overview on the underlying wirelesscommunication technologies. From bottom-up, it starts with the radiochannel and afterwards discusses the characteristics of ad hoc as well ascellular systems.
• Chapter 4 describes the modeling and implementation efforts to simulatethe previously introduced communication characteristics. This work enablesthe simulation analysis in the following Chapter 5.
• Chapter 5 performs a simulation study to evaluate the previously selectedapplications regarding the benefits of a hybrid ad hoc and cellular approachin an integrated scenario.
• Finally, this treatment is concluded in Chapter 6 with respect to the initiallystated aims. The outlook identifies open research questions for future workin the area.

1.3. THESIS STRUCTURE 9
Introduction 1.
Simulation Environment
4.
Conclusion 6.
System Overview
2. Simulation Analysis
5.
Chapter Details Details
Communication Technologies
3.
- V2X Applications for Safety, Efficiency, Comfort
- Communication Characteristics and Metrics
- ETSI TC ITS, IEEE WAVE
- Radio Channel Characteristics
- Ad hoc Standards (IEEE 1609, IEEE 802.11p)
- Cellular Systems (UMTS, LTE)
- Site-specific and Statistical Propagation Models for Ad hoc communication
- Cellular Simulation (Delays, Losses, Data Rates)
- Hybrid Application (Ad hoc/ Cellular)
- Information Handling (Local Dynamic Map)
- Performance Evaluation
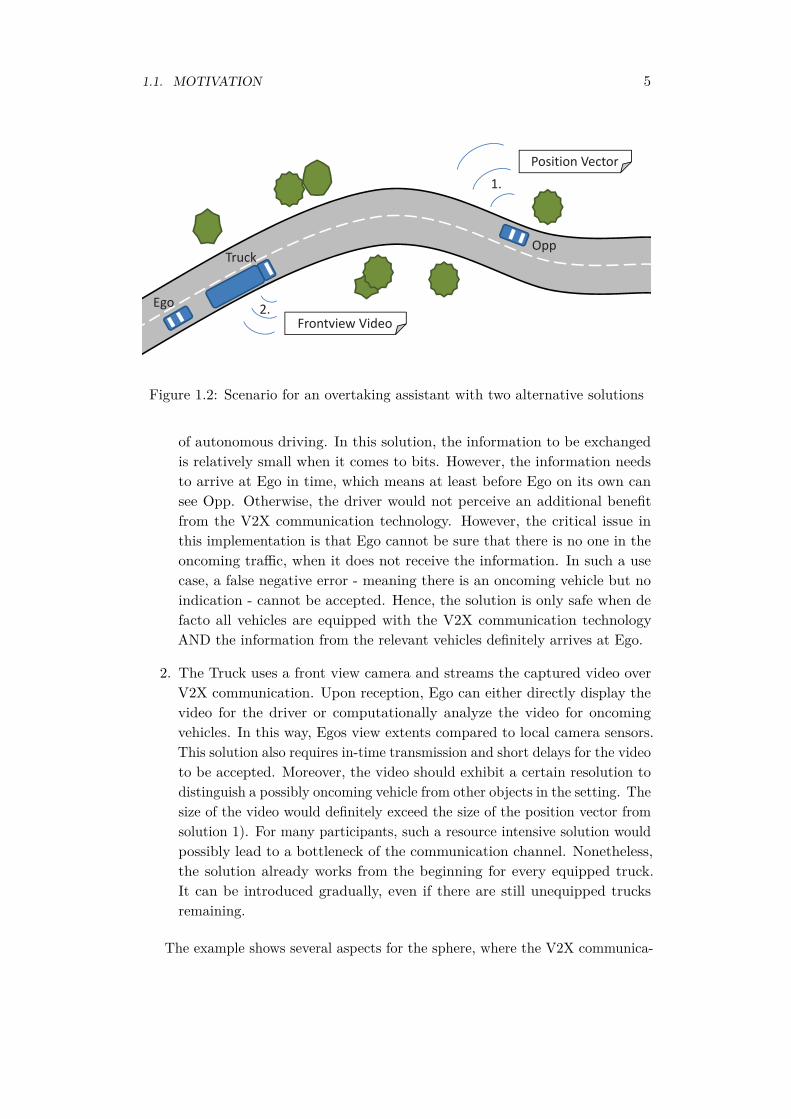
Figure 1.3: Structure of this thesis as V-model
Figure 1.3 illustrates the structure of this thesis and the correlation betweenthe individual chapters. The V-model is a very popular process model in theautomotive system and software development. Although, this model originallydescribes a slightly different context of tests to verify specifications, it also suitshere for the relationship of the thesis chapters. Consequently, the development inChapter 4 applies to the introduced principles of communication technologies inChapter 3. The evaluation in Chapter 5 particularly refers to the applications andthe system architecture from Chapter 2. Finally, Chapter 6 resumes the objectivesthat are stated previously in this Chapter 1.

Chapter 2
System Overview
This chapter introduces the basic principles and architectures for vehicular com-munication. It starts from the perspective of the applications and describes theirspecific requirements towards the underlying communication system. Afterwards,a suitable metric is derived that accounts especially for the requirements of safetyapplications. Finally, this chapter presents the most suitable systems that are cur-rently being developed by the major standardization bodies as well as the researchcommunity.
2.1 Envisioned Applications
As mentioned in the introduction, the usage of communication in the automotiveenvironment enables a huge number of different use cases and applications. Today,the ITS working group from the ETSI (European Telecommunications StandardsInstitute) maintains the most recognized catalog of application specificationsfor the introduction of V2X communication technology [ETS09, ETS10b]. Thespecifications are also known as the basic set of applications. They received con-tributions from the Car-to-Car Communication Consortium (C2C CC) [CAR07]and especially from the European research project PRE-DRIVE C2X [PRE08].Altogether, the ETSI documents list more than fifty (namely 53) use cases fordifferent aims. Some of them keep the human in the loop. Most of them baseon M2M communication. Hence, the classification of applications is necessary tofocus the work on the important issues and reduce the set of regarded applicationsin the later evaluation.
11
12 CHAPTER 2. SYSTEM OVERVIEW
2.1.1 Existing Classifications
The most common application classification in the literature divides the use casesinto three major categories with respect to their intended purpose [CAR07].
1. The first class of applications aims to warn and assist the driver in certainmaneuver situations and increase the traffic safety in this way.
2. The second class informs the driver in a slightly longer perspective and canimprove the traffic efficiency.
3. In the third class, there are comfort applications that are not directlyrelated to the vehicles’ mobility, but are part of today’s digital life style.Another aspect of this group is that these applications can be realized onindividual basis and not rely on cooperative M2M information exchange.These applications are also referred to as infotainment applications.
A second classification is even located one step prior to that, and rather takesthe perspective of a car manufacturer [KSSB12]. There, the class of vehicle-related applications establishes the connection to certain components of thevehicle over different wireless and even wired communication technologies. Exam-ples include Ethernet-based connections for remote management of control unitsfor failure diagnosis or software updates. Moreover, the connection of mobilephones and devices to the audio and navigation onboard unit via Bluetooth orNear Field Communication (NFC) or even USB are regarded. The second class ofpassenger-related applications conforms most to the comfort category from thefirst classification and includes, amongst others, information provisioning servicesas E-mail, personalized entertainment as media streaming or convenience servicesfor wireless payment. Both categories have in common that their applicationshave no direct impact on the vehicular traffic situation. In contrast, the thirdclass of driving-related applications exchanges and provides the informationfor the driver or the assistance systems to influence the vehicle’s driving state.This class covers all use cases of the safety and efficiency classes from the firstclassification.
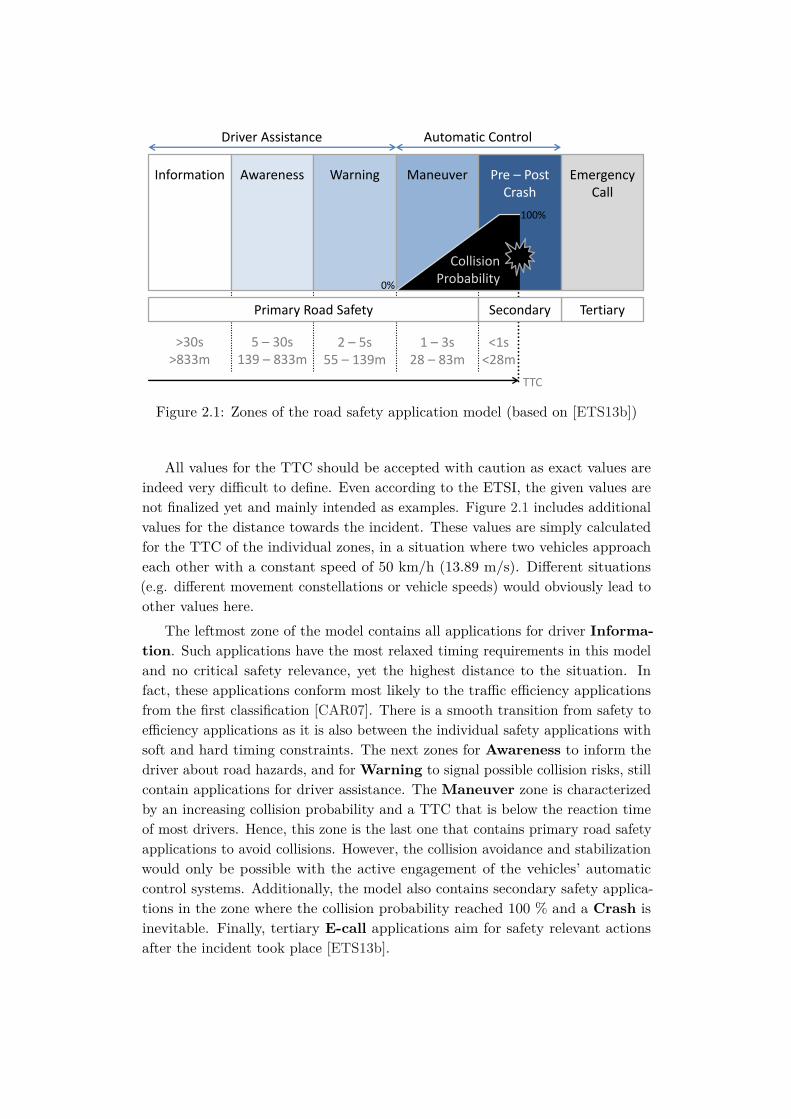
A third view according to the road safety application model from the ETSI canserve particularly to illustrate the characteristics of the driving-related safety andefficiency applications [ETS13b]. Figure 2.1 depicts the position of the differentinformation zones in relation to the time to a possible incident, using the metric ofthe TTC (time to collision) according to the equation of motion (Equation (2.1))with ~r as the location and ~̇r as the derivation of the location (namely the speed)of two related nodes i and i− 1.
TTCi = ~ri−1(t)− ~ri(t)~̇ri(t)− ~̇ri−1(t)
→ d = |~ri−1(t)− ~ri(t)| =(~̇ri(t)− ~̇ri−1(t)
)TTCi (2.1)
2.1. ENVISIONED APPLICATIONS 13
5 – 30s139 – 833m
>30s>833m
1 – 3s28 – 83m
2 – 5s55 – 139m
<1s<28m
Information Awareness Warning Maneuver Pre – PostCrash
Emergency Call
0%
100%
Primary Road Safety Tertiary
Driver Assistance Automatic Control
TTC
CollisionProbability
Secondary
Figure 2.1: Zones of the road safety application model (based on [ETS13b])
All values for the TTC should be accepted with caution as exact values areindeed very difficult to define. Even according to the ETSI, the given values arenot finalized yet and mainly intended as examples. Figure 2.1 includes additionalvalues for the distance towards the incident. These values are simply calculatedfor the TTC of the individual zones, in a situation where two vehicles approacheach other with a constant speed of 50 km/h (13.89 m/s). Different situations(e.g. different movement constellations or vehicle speeds) would obviously lead toother values here.
The leftmost zone of the model contains all applications for driver Informa-tion. Such applications have the most relaxed timing requirements in this modeland no critical safety relevance, yet the highest distance to the situation. Infact, these applications conform most likely to the traffic efficiency applicationsfrom the first classification [CAR07]. There is a smooth transition from safety toefficiency applications as it is also between the individual safety applications withsoft and hard timing constraints. The next zones for Awareness to inform thedriver about road hazards, and for Warning to signal possible collision risks, stillcontain applications for driver assistance. The Maneuver zone is characterizedby an increasing collision probability and a TTC that is below the reaction timeof most drivers. Hence, this zone is the last one that contains primary road safetyapplications to avoid collisions. However, the collision avoidance and stabilizationwould only be possible with the active engagement of the vehicles’ automaticcontrol systems. Additionally, the model also contains secondary safety applica-tions in the zone where the collision probability reached 100 % and a Crash isinevitable. Finally, tertiary E-call applications aim for safety relevant actionsafter the incident took place [ETS13b].
14 CHAPTER 2. SYSTEM OVERVIEW
2.1.2 Application Selection
The already existing classifications are convenient to provide a first overview ofthe different applications. In a broader sense, all three classifications agree to thepartition of applications to the categories of safety, efficiency and comfort. Whenemployed for the 53 candidates from the ETSI basic set of applications, there are23 safety, 11 efficiency and 19 comfort applications. When concentrating only onthe ITS related safety and efficiency applications, all safety and 7 from 11 efficiencyapplications rely on a very characteristic communication pattern with regularinformation exchange to inform multiple neighbors in the vicinity. Exceptions fromthis pattern apply to the two connected V2V use cases of cooperative adaptivecruise control and platooning, as well as to the V2I use cases of enhanced routeguidance and navigation, and electronic toll collect. These use cases would requirea session-based information exchange [PRE08]. The remaining 30 applicationscan be further distinguished with the following additional classifiers.
The Situation Duration indicates whether the information exchange needsto occur permanently as long as the vehicles participate in the trafficsituation, or is temporary limited to a certain time span. According to thisdefinition, the situation would also regard to a vehicles’ state and position.All efficiency applications and particular safety applications, which enablecooperative awareness, usually involve a permanent information exchange.In contrast, certain safety applications rely on time limited communicateto give notifications about specific events. The ETSI distinguishes applica-tions with this classifier according to the message content of CooperativeAwareness Messages (CAM) [ETS14a] for permanent and DecentralizedEnvironmental Notification Messages (DENM) [ETS14b] for temporaryinformation dissemination.
The Situation Location ranges from stationary to moving. The definitionof the stationarity of the situation depends on the vehicle speed. For instance,the end of a traffic jam actually also moves, but compared to the vehicleswith a significantly lower speed. The information about locally stationarysituations needs to be received only once at a specific distance for a drivingvehicle to be acceptable for a successful use case. Moving situations typicallyregard for awareness updates of individual vehicles and demand a regularinformation refresh, whereas the update period is connected with the movingspeed of the according vehicle.
The Reporters can be either a single one or multiple nodes. When infor-mation from a single reporter is important for the successful use case, thereception quality and the communication latency for the single messagesare crucial issues. When multiple reporters inform about the same situation
2.1. ENVISIONED APPLICATIONS 15
from their perception, the individual reporter is of minor importance andsingle messages can arrive delayed at the potential receivers or even get lost,as there would still be the feasibility to receive similar information fromanother reporter.
After employing the classifiers to the remaining 30 applications, the followingconclusions can be stated.
• In all 7 efficiency applications, single stationary infrastructure nodes perma-nently report about the current state of the traffic situation. This regardsfor long-term or even unchanging situations as regulatory speed limits, butalso for short-term situations as the signal phases of traffic lights in the usecase of the green light optimal speed advisory. The critical requirement ofthese applications regards for a high range of information dissemination.
• In 13 safety applications, moving vehicles permanently report their currentstate information matched to their location to create cooperative awareness.For instance, the emergency vehicle warning use case is also part of thiscategory, whereas the emergency vehicle is a special vehicle that could alsotake part in the traffic without informing other about its priority state.Compared to efficiency applications, these applications exhibit time-criticalcommunication requirements. Still, the speed and direction information inthe exchanged position vectors allow for the bridging of certain time spanswithout reception and information refresh.
• In 5 safety applications, vehicles report state information for a limitedtime span when a certain event is detected. An example is the detectionof a hard braking event for an emergency electronic brake light warning.Regarding the communication requirements, these applications conform toa large extent to the previously mentioned safety applications with onesignificant difference of the instant need for communication without priornotice and thus without the feasibility of prior tracking by the receivers.As similarity, the 5 and 13 safety applications are not suited for storingand re-transmitting the information about the moving vehicles as this getsconstantly outdated.
• In 4 safety applications, vehicles as well as stationary nodes report aboutstationary situations for a limited time span. The use cases of the stationaryvehicle - and the roadworks warning are initially specified with only a singlereporting node. Due to the stationarity of the location, these use cases alsoqualify well to be extended that multiple reporters forward the informationas it is the case with the other two use cases of hazardous location - andtraffic condition warning, in this category. At a price of increasing the

16 CHAPTER 2. SYSTEM OVERVIEW
data traffic, this approach would extend the robustness of a use case as thedissemination of redundant information allows for individual losses.
• Finally, the last application of decentralized Floating Car Data (FCD)aims to identify certain traffic situations from the permanently receivedinformation of multiple moving reporters. The use case can be the basis forother safety use cases, e.g. when a traffic jam is identified. In this way, italso enables efficiency use cases. Consequently, the FCD application shouldbe of interest for the final simulation study in this thesis.
In summary, the application selection presented that the most importantcommunication paradigm for ITS related safety and efficiency application baseson regular information dissemination from individual traffic participants to theirneighbors. When use cases regard for a stationary situation, the reception ofa single one out of multiple messages from the reporter is sufficient. Moreover,these use cases can be extended that multiple reporters increase the redundancy.When such stationary situations should be combined with efficiency, the possiblyhigh range of information dissemination would be the critical parameter for theunderlying communication system. The applications with a single moving reporterrequire a short delay and regular refresh of information as contrasting parameter.Hence, the specific architectures to enable V2X communication use cases needto account for these challenges. Prior to the introduction of the communicationsystems, the appropriate communication metrics should be presented to measurethe two requirements.
2.2 Communication Metrics
2.2.1 Classical Communication Metrics
The classical approach to evaluate the quality of information exchange bases onthe Packet Delivery Ratio (PDR). This metric defines the number of successfullyreceived messages out of all sent messages [Rap02]. Depending on the application,either all or a certain percentage of sent messages can be required to be receivedthat the applications can work sufficiently. In fact, for successful operation ofmost V2X communication use cases, not every sent message needs to be received,as messages can contain similar information.
The PDR as a function of the distance already contains valuable information,which should be explained at the following example. Assume the PDR trendfor a typical wireless ad hoc communication link according to the IEEE 802.11pstandard, as presented in Figure 2.2 (black graph). The displayed PDR stemsfrom a scenario that already includes the typical impairments found in realisticvehicular communication environments, as a fading radio channel and messagecollisions due to uncoordinated medium access by multiple nodes. The PDR
2.2. COMMUNICATION METRICS 17
0
2
4
6
8
10
12
14
16
18
20
0
0,1
0,2
0,3
0,4
0,5
0,6
0,7
0,8
0,9
1
0 100 200 300 400 500 600 700 800 900 1000
nbr sen
t packets
PDR
distance [m]
PDR
Analytic
Statistic 95
Statistic 99
Figure 2.2: PDR in relation to the implied numbers of sent messages for asuccessful reception according to the analytic and statistic approach
declines to 0 at the distance of 800 m. This distance denotes the maximumcommunication range. According to the ETSI road safety model (Figure 2.1),information safety applications could be facilitated in this way [ETS13b]. Theother graphs in Figure 2.2 show the number of messages that need to be sent forthe reception of exactly one message. These graphs are derived from the PDRaccording to different approaches.
• The analytic approach uses merely the relation 1PDR and can be seen as the
optimistic estimation. The respective graph in Figure 2.2 is the blue one.
• The statistical approach uses the success probability for a series of retriesand requires the success probability to be higher than a given confidenceinterval. This approach denotes the realistic case. Figure 2.2 displays thecase of a probability using typical confidence intervals of 95 % (green) and99 % (red).
The diagram can be interpreted in the following way: When e.g. the PDR = 1,every message is received. This means for the optimistic as well as the realisticcase, that only one message needs to be sent in order that one message can bereceived. When the PDR = 0.5 (shaded rectangle in Figure 2.2), the results aredifferent for either case. In the optimistic case, 1 message is received when at least2 messages are sent. In the realistic case, 1 message is received with a probabilityhigher than 95 % (actually 96.9 %) when 5 messages are sent. The number of
18 CHAPTER 2. SYSTEM OVERVIEW
sent messages for the reception success increases to 7 in the more stringent caseof 99 % accordingly. When the draconian success probability of exactly 100 % ofmessage reception would be required, the number of sent messages would tend toinfinity in the case where the PDR is unequal to 1.
When a certain sending rate fs, equivalent to periodical CAMs, is assumed, thenumber of sent messages implies a timing constraint. The actual communicationcharacteristics are then located in the corridor between the optimistic and therealistic case. Nonetheless, this corridor between optimistic and realistic case canbe very large, which implies a limited informative value of the PDR. A previousstudy employed the PDR to measure the influence of communication propertieson a navigation application [PSR11]. For different applied propagation models,the PDR also turned out different. In contrast, the application was not sensitiveto these differences, as multiple messages with similar content could be received.Accordingly, in this case the PDR is not powerful enough to find the certainsituation where the application performance changes.
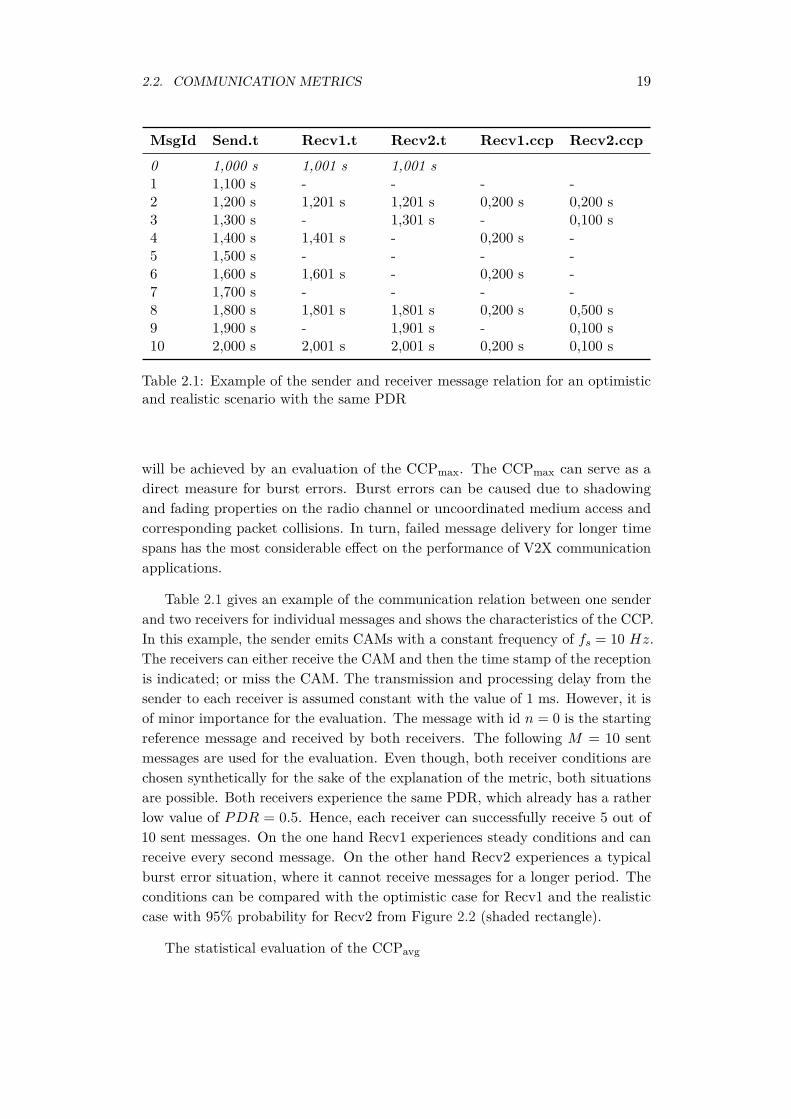
Another classical communication metric that can cover timing properties isthe transmission latency. It defines the delay from the message sending attemptto the reception. However, this metric is only useful to a limited extent forcommunication modes where packet reception and losses can be acknowledged.This would be the case in managed cellular systems and ad hoc communication inthe unicast mode. Yet, for V2X applications, the more interesting case employsthe broadcast mode to concurrently inform all neighbors in the vicinity with onemessage as a CAM. Especially, this mode involves the probability of unnoticedpacket losses. Hence, the transmission latency and the PDR need to be combinedfor a more significant measure, which is the Consecutive CAM Period (CCP)[PSR14b].
2.2.2 Application Layer Metrics
Basically, the Consecutive CAM Period (CCP) is the time between two successfullyreceived CAMs, which are the messages that are permanently reported to createcooperative awareness. The CCP can be represented in the following Equation2.2, where n− 1 and n are the ids of two subsequently received message and tr isthe time of reception.
CCP (n) = tr(n)− tr(n− 1) (2.2)
In the first instance, the CCP is only a metric for the relation of two individualreceived CAMs. It needs to be set into a statistical context for further evaluation.However, the evaluation of the simple arithmetic mean value CCPavg will notalways deliver the most interesting outcome. When a constant sending rate isassumed, the CCPavg is directly related to the PDR and the frequency of sentmessages fs, as shown in the following example. The more significant result
2.2. COMMUNICATION METRICS 19
MsgId Send.t Recv1.t Recv2.t Recv1.ccp Recv2.ccp0 1,000 s 1,001 s 1,001 s1 1,100 s - - - -2 1,200 s 1,201 s 1,201 s 0,200 s 0,200 s3 1,300 s - 1,301 s - 0,100 s4 1,400 s 1,401 s - 0,200 s -5 1,500 s - - - -6 1,600 s 1,601 s - 0,200 s -7 1,700 s - - - -8 1,800 s 1,801 s 1,801 s 0,200 s 0,500 s9 1,900 s - 1,901 s - 0,100 s10 2,000 s 2,001 s 2,001 s 0,200 s 0,100 s
Table 2.1: Example of the sender and receiver message relation for an optimisticand realistic scenario with the same PDR
will be achieved by an evaluation of the CCPmax. The CCPmax can serve as adirect measure for burst errors. Burst errors can be caused due to shadowingand fading properties on the radio channel or uncoordinated medium access andcorresponding packet collisions. In turn, failed message delivery for longer timespans has the most considerable effect on the performance of V2X communicationapplications.
Table 2.1 gives an example of the communication relation between one senderand two receivers for individual messages and shows the characteristics of the CCP.In this example, the sender emits CAMs with a constant frequency of fs = 10 Hz.The receivers can either receive the CAM and then the time stamp of the receptionis indicated; or miss the CAM. The transmission and processing delay from thesender to each receiver is assumed constant with the value of 1 ms. However, it isof minor importance for the evaluation. The message with id n = 0 is the startingreference message and received by both receivers. The following M = 10 sentmessages are used for the evaluation. Even though, both receiver conditions arechosen synthetically for the sake of the explanation of the metric, both situationsare possible. Both receivers experience the same PDR, which already has a ratherlow value of PDR = 0.5. Hence, each receiver can successfully receive 5 out of10 sent messages. On the one hand Recv1 experiences steady conditions and canreceive every second message. On the other hand Recv2 experiences a typicalburst error situation, where it cannot receive messages for a longer period. Theconditions can be compared with the optimistic case for Recv1 and the realisticcase with 95% probability for Recv2 from Figure 2.2 (shaded rectangle).
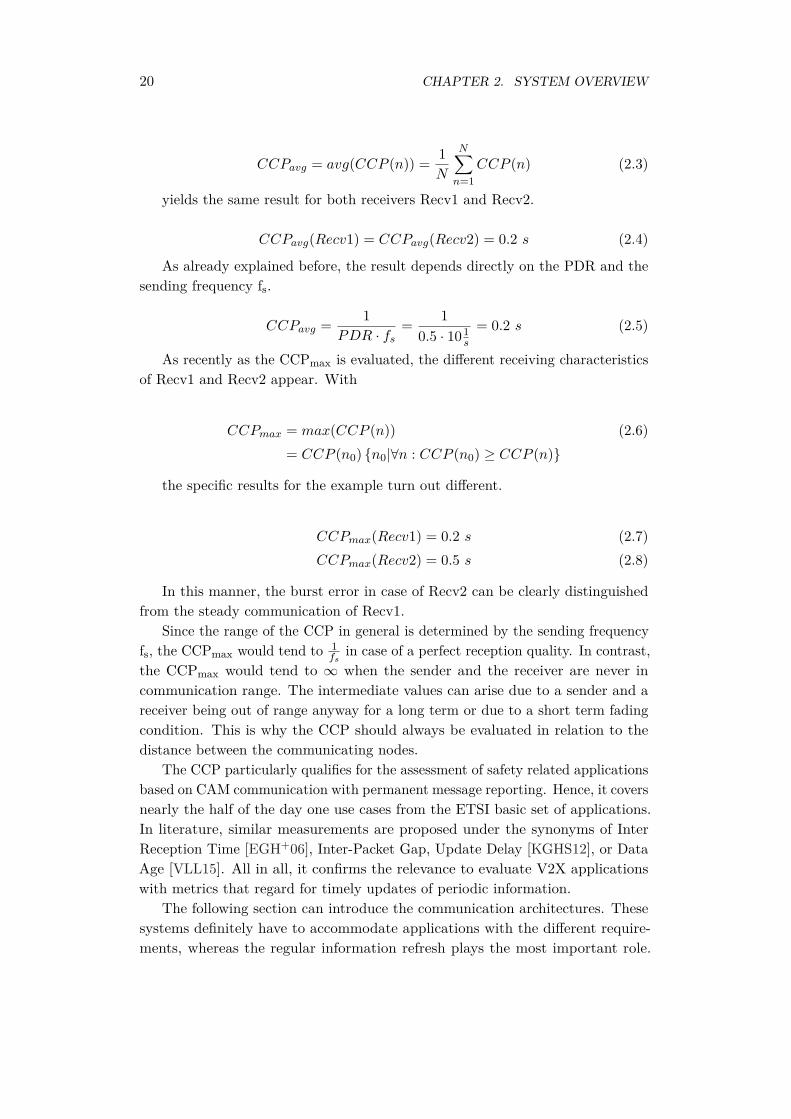
The statistical evaluation of the CCPavg
20 CHAPTER 2. SYSTEM OVERVIEW
CCPavg = avg(CCP (n)) = 1N
N∑n=1
CCP (n) (2.3)
yields the same result for both receivers Recv1 and Recv2.
CCPavg(Recv1) = CCPavg(Recv2) = 0.2 s (2.4)
As already explained before, the result depends directly on the PDR and thesending frequency fs.
CCPavg = 1PDR · fs
= 10.5 · 101
s
= 0.2 s (2.5)
As recently as the CCPmax is evaluated, the different receiving characteristicsof Recv1 and Recv2 appear. With
CCPmax = max(CCP (n)) (2.6)= CCP (n0) {n0|∀n : CCP (n0) ≥ CCP (n)}
the specific results for the example turn out different.
CCPmax(Recv1) = 0.2 s (2.7)CCPmax(Recv2) = 0.5 s (2.8)
In this manner, the burst error in case of Recv2 can be clearly distinguishedfrom the steady communication of Recv1.
Since the range of the CCP in general is determined by the sending frequencyfs, the CCPmax would tend to 1
fsin case of a perfect reception quality. In contrast,
the CCPmax would tend to ∞ when the sender and the receiver are never incommunication range. The intermediate values can arise due to a sender and areceiver being out of range anyway for a long term or due to a short term fadingcondition. This is why the CCP should always be evaluated in relation to thedistance between the communicating nodes.
The CCP particularly qualifies for the assessment of safety related applicationsbased on CAM communication with permanent message reporting. Hence, it coversnearly the half of the day one use cases from the ETSI basic set of applications.In literature, similar measurements are proposed under the synonyms of InterReception Time [EGH+06], Inter-Packet Gap, Update Delay [KGHS12], or DataAge [VLL15]. All in all, it confirms the relevance to evaluate V2X applicationswith metrics that regard for timely updates of periodic information.
The following section can introduce the communication architectures. Thesesystems definitely have to accommodate applications with the different require-ments, whereas the regular information refresh plays the most important role.
2.3. STANDARDIZED ARCHITECTURES 21
The second essential factor needs to consider an eligible communication range forthe sender to reach the relevant neighbors in the vicinity.
2.3 Standardized Architectures
Several initiatives from the context of Intelligent Transportation Systems (ITS)addressed the realization of the driving-related safety and efficiency use cases.These initiatives were and are driven by various research projects with possiblydifferent focus (e.g. on road safety, on communication infrastructure, on fieldoperational tests). Furthermore, industry consortia and standardization bodies areinvolved in the process. As a result, several systems were developed and presented.Depending on the objectives of the initiative, the systems have a different grade ofdetail and also different architectures. Accordingly, harmonization activities aremandatory. The standardization arena comprises mainly three players. First, thetechnical committee TC 204 from the International Standardization Organization(ISO) works on the initiative named Communications Access for Land Mobiles(CALM) [ISO14]. This work is conducted together with the TC 278 at theCEN (European Committee for Standardization). Second, the IEEE as theworld’s leading professional association contributes the family of standards for theWireless Access in Vehicular Environments (WAVE) [IEE14]. Third, the ETSITC ITS together with the CEN accepted to work on the standardization relatedto the European Commission Mandate M/453 on Cooperative ITS. Moreover,the industry forum Car-2-Car Communication Consortium (C2C CC) works veryclosely together with the ETSI TC ITS [ETS13c].
Two different views are important in the standardization and specificationof ITS. The first view regards the individual subsystems for the whole system.The subsystems connect with each other in a dedicated communication domain.The second view specifies the architecture of the subsystems. More precisely, thesecond view specifies the communication stack and the access to the communicationdomain to connect to the other subsystems.
2.3.1 Individual Subsystems
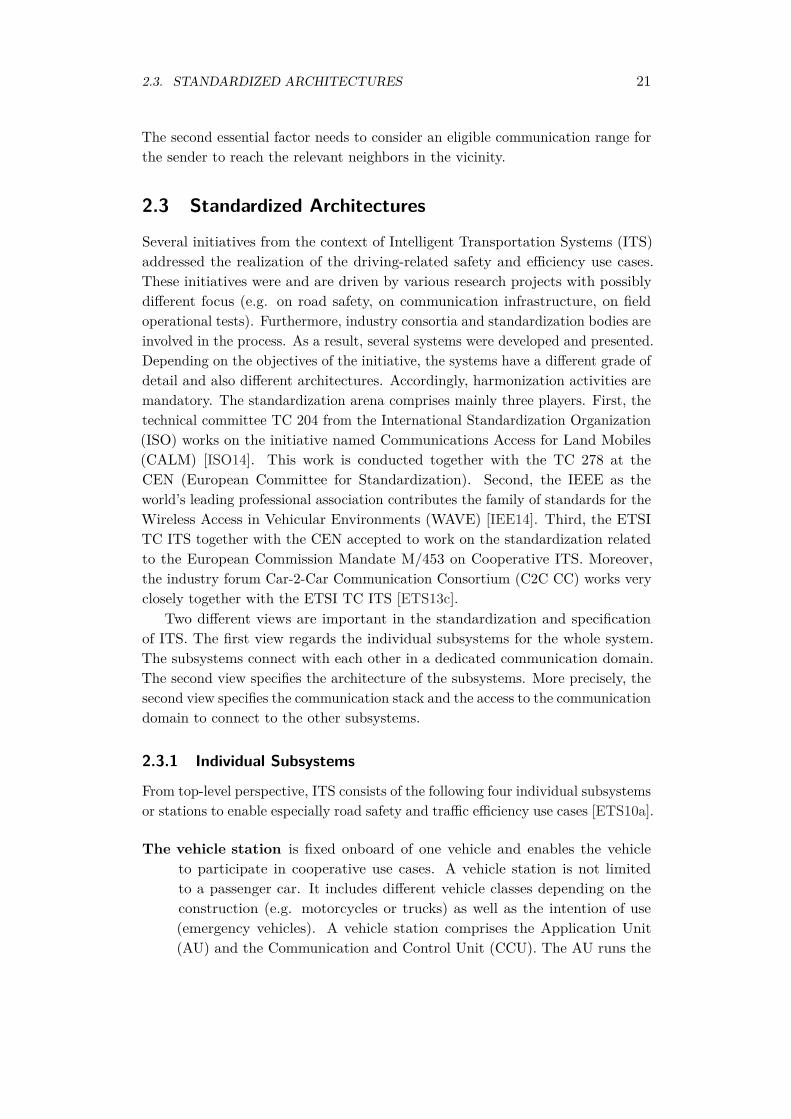
From top-level perspective, ITS consists of the following four individual subsystemsor stations to enable especially road safety and traffic efficiency use cases [ETS10a].
The vehicle station is fixed onboard of one vehicle and enables the vehicleto participate in cooperative use cases. A vehicle station is not limitedto a passenger car. It includes different vehicle classes depending on theconstruction (e.g. motorcycles or trucks) as well as the intention of use(emergency vehicles). A vehicle station comprises the Application Unit(AU) and the Communication and Control Unit (CCU). The AU runs the

22 CHAPTER 2. SYSTEM OVERVIEW
ITS application and exchanges information with the CCU. Moreover, theAU has an interface to the driver, usually in form of a human-machine-interface (HMI), to accept input or present the ITS information. The CCUconnects to the vehicles’ sensor and actuator hardware, usually via theController Area Network (CAN bus). Furthermore, the CCU communicatesto external ITS stations from possibly different types. The CCU providesinformation to the AU from the own sensors and the other subsystemsand distributes information to the own vehicle controllers and the othersubsystems. In a practical implementation, the car manufacturer developsthe AU in-house and buys the CCU in addition from the suppliers. Thisway, the manufacturer can account for the unique selling proposition of itscars, especially with the HMI. However, according to standardization, theseparation of AU and CCU on different hardware is not mandatory andopen to the stakeholders. Due to the vehicle mobility, the communicationdomain towards the other subsystems always requires wireless access for anydriving-related ITS use case. Certain vehicle-related use cases can also relyon wired communication access. For example a mobile device or a diagnosisdevice can connect via USB or Ethernet.
The roadside station also known as RoadSide Unit (RSU) or Intelligent Road-side Station (IRS), comprises the infrastructure components to operate aroad. Roadside stations can be deployed at traffic lights, variable messagesigns or other fixed components at road sensors, construction sites etc. Incontrast to the vehicles, the roadside stations always have a fixed position, atleast for a dedicated amount of time, e.g. for the duration of the construction.Besides the exchange of sensor or traffic light information, roadside stationscan act as a relay between vehicle stations to increase the communicationrange. Due to the fixed installation, roadside stations can be additionallyequipped with a wired communication interface and act as a gateway to thewired data network, i.e. the Internet. In this way, roadside stations connectthe wireless vehicle communication domain with the wired infrastructuredomain, where the central stations are located.
The central station is an entity that runs centrally managed ITS applicationsand services. For example a traffic management center, a fleet managementservice center, or an advertisement company operate a central station.Central stations are usually servers in the Internet. For information exchange,the central station connects to the vehicle stations via two ways. The firstway is the wired communication to the roadside stations, which forwardthe information with wireless access to the vehicle stations. The secondway uses cellular communication infrastructure. This way also includesa wired part to the according cellular base station and the wireless part
2.3. STANDARDIZED ARCHITECTURES 23
to the mobile user equipment in the vehicle station. The next Chapter 3gives a detailed overview and comparison of the different communicationtechnologies. Already now it should be noted that the communication viathe infrastructure domain includes several forwarding hops, which inducean additional transmission delay. Due to this, time critical safety use casesare typically not realized with the participation of central stations. Rather,delay tolerant traffic efficiency or other location-based services make use ofthis kind of central subsystem.
The personal station represents a mobile consumer device, which is typicallyassigned to a person. Such a device can be a mobile phone or any otherhandheld device. These devices offer several communication interfaces andcan serve for a variety of ITS applications. The personal station has aspecific characteristic for different multimodal ITS scenarios, depending onthe role of the person. A pedestrian or a cyclist can use the personal stationas standalone unit. Moreover, the personal station can be connected to avehicle station via e.g. Bluetooth or USB to extend the capabilities of theHMI and the communication interfaces. In this case, the personal stationshould be considered as a part of the vehicle station. Finally, personalstations may play an important role for the deployment of ITS. Since mobilephones are already very popular and widespread today, an according strategyto retrofit existing vehicles for personal station integration may acceleratethe market penetration of communicating ITS participants. This wouldreduce the initial phase where customers perceive only minor benefits. Suchan approach again highlights the need to think of ITS not only basing on asingle communication technology, but on multiple ones to form heterogeneousvehicular networks.
2.3.2 ETSI TC ITS
The ETSI works on ITS standardization since 2007 and got input from severalresearch projects as well as from other consortia. The COMeSafety projectcontributed with a specific support action [COM10] that got introduced in theETSI standards. Amongst others, the European projects PRE-DRIVE C2X[PRE10], DRIVE C2X [DRI14] and the German project simTD [sim09b] for fieldoperational test consulted during the preparation of the ETSI standardization.Furthermore, the Car-to-Car Communication Consortium also works close togetherwith the ETSI. In addition to the previously introduced subsystem specification,the ETSI works in many areas to define ITS. The recently published technicalreport TR 101 067 - ITS Release 1 [ETS13c] bundles all current specifications onthe topic.
As the group with the longest history in ITS standardization, the TC 204 at
24 CHAPTER 2. SYSTEM OVERVIEW
the ISO specifies the CALM standard. This work resulted in comprehensive set ofpublished documents for the individual aspects of ITS. The architecture initiallybased on the CALM communication kernel to regard for CALM-aware applications- meaning ITS applications - and non-CALM-aware applications for general purposeapplications. The additional CALM services layer provides functionalities that areshared between all applications. Moreover, the standard considers security aspects.In the original specification, the standard varies significantly from the ETSI TCITS architecture. However, after a harmonization process the ISO published thelatest release of the CALM architecture ISO 21217:2014 [ISO14], which adoptsthe same concept of the ITS station from the ETSI. The ISO document statesthat this “edition cancels and replaces the first edition (ISO 21217:2010) whichhas been technically revised” [ISO14].
In the manifesto from 2007 [CAR07], the C2C CC also addresses a layeredcommunication stack with one part for C2C applications and one part for non C2Capplications. Later on, the C2C CC fostered a very close cooperation with thestandardization activities by the ETSI. This fact explains that the C2C CCarchitecture itself has not experienced any updates for a long time and lacks someimportant features that are state-of-the-art today.
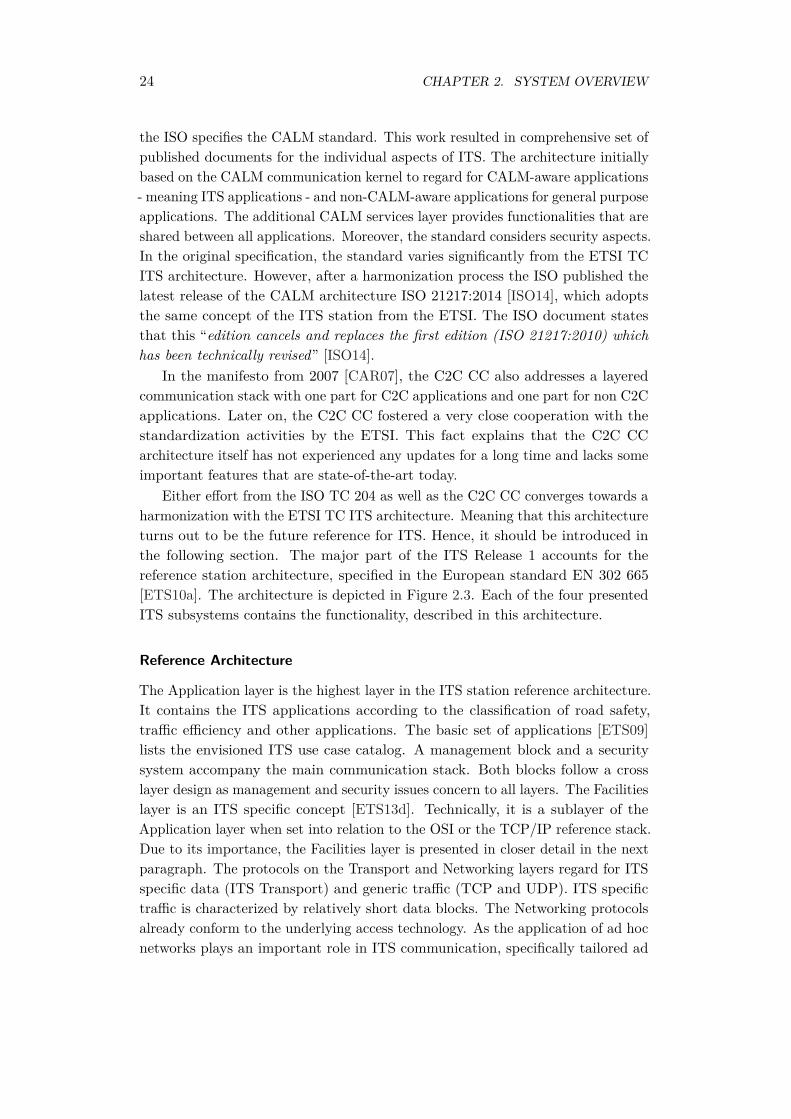
Either effort from the ISO TC 204 as well as the C2C CC converges towards aharmonization with the ETSI TC ITS architecture. Meaning that this architectureturns out to be the future reference for ITS. Hence, it should be introduced inthe following section. The major part of the ITS Release 1 accounts for thereference station architecture, specified in the European standard EN 302 665[ETS10a]. The architecture is depicted in Figure 2.3. Each of the four presentedITS subsystems contains the functionality, described in this architecture.
Reference Architecture
The Application layer is the highest layer in the ITS station reference architecture.It contains the ITS applications according to the classification of road safety,traffic efficiency and other applications. The basic set of applications [ETS09]lists the envisioned ITS use case catalog. A management block and a securitysystem accompany the main communication stack. Both blocks follow a crosslayer design as management and security issues concern to all layers. The Facilitieslayer is an ITS specific concept [ETS13d]. Technically, it is a sublayer of theApplication layer when set into relation to the OSI or the TCP/IP reference stack.Due to its importance, the Facilities layer is presented in closer detail in the nextparagraph. The protocols on the Transport and Networking layers regard for ITSspecific data (ITS Transport) and generic traffic (TCP and UDP). ITS specifictraffic is characterized by relatively short data blocks. The Networking protocolsalready conform to the underlying access technology. As the application of ad hocnetworks plays an important role in ITS communication, specifically tailored ad
2.3. STANDARDIZED ARCHITECTURES 25
MI
Management Information Base (MIB)
MN
MI
MN
MF
Management
MF
Security
SI
SI
SN
SN
SF
SF
Security Management Information Base (S-MIB)
(Identity, crypto-key and certificate managment)
MS
MS
Authentication, authorization, profile management
Firewall and Intrusion management
Regulatory
management
Cross-layer
management
Application
management
Station
management
Figure 2.3: ITS station reference architecture by ETSI TC ITS [ETS10a]
hoc routing protocols can be found. For this purpose, GeoRouting protocols usethe geographical position information of a station rather than topologies and IPaddresses to route the data packets. Finally, the ITS reference architecture definesthe possible access technologies. The access technologies allow the connectionof personal stations and vehicle stations (e.g. via Bluetooth or Ethernet), theconnection of station-internal interfaces for sensors (e.g. GPS) and station-externalinterfaces for external communication. The main ways for external communicationare cellular access technologies (referenced as 2G/3G/...) and the ad hoc accesstechnology via ETSI ITS G5. The G5 specification [ETS13a] defines the access inmultiple channels in the allocated European frequency band for ITS in the rangeof 5.9 GHz and bases as the IEEE WAVE on the IEEE 802.11p standard. Thetwo important communication principles towards external stations via ad hoc andcellular communication are presented in the next Chapter 3.

26 CHAPTER 2. SYSTEM OVERVIEW
.
Facilities Layer
Facilities Layer Management
Application support
Communication support
FA-SAP
NF-SAP
MF-SA
P
Stationpositioning
Service Management
Message Management
LDMmanagement
Mobile station
dynamics
Station state monitoring
Security access
management
Timemanagement
Information support
SF-SAP
LDMdatabase
Data presentation
Location referencing
Station type/ capabilities
Addressing mode
Session support
Mobility management
GEONET support
Figure 2.4: Functionalities of the ETSI TC ITS Facilities layer [ETS09]
Facilities
The Facilities layer provides different functionalities that can be shared betweendifferent applications and their assigned use cases. All currently identified applica-tions are listed in [ETS09]. The functional requirements for the different facilitiesare listed in [ETS13d]. Figure 2.4 depicts the major facilities. The facilities aredivided into the three different groups:
1. Application Support
2. Information Support
3. Communication Support
In general, facilities can either support applications or other facilities. Theapplication support facilities on top account for the specific domains of ITSfunctionality. In turn, they use the information support and communicationsupport facilities. Furthermore, several facilities may be applicable only to certainsubsystems or even special types of stations.
Station Positioning This application support facility provides the positioningvector of the ITS station from available navigation system data (e.g. GPS,GLONASS). Certain use cases require a very high precision of the position,especially for vehicle stations. In this case, dead reckoning mechanismsimprove the position accuracy by the fusion of positioning and additionalodometry data, as the yaw velocity, the steering angle and others. Forthis purpose, the Station Positioning uses the information provided by theMobile Station Dynamics facility.
2.3. STANDARDIZED ARCHITECTURES 27
Mobile Station Dynamics This application support facility is only applicableto vehicle stations. It maintains information about kinematic parametersfrom the odometer (e.g. the yaw velocity, the longitudinal and lateralacceleration, the stability control status and more) for applications as wellas other facilities (e.g. the Station Positioning).
Station State Monitoring This application support facility is similar to theprevious one. Analogical, it also monitors the state of parameters, in thiscase with static characteristics. At the example of a passenger car vehiclestation, the wiper speed or light status are such parameters. Additionalparameters for special vehicle stations may be supported. For example, anemergency vehicle also maintains the siren and light bar states.
Services Management This application support facility manages the servicecapabilities and related software updates of a station. Accordingly, thisfacility maintains the information to be shared with other stations in ser-vice announcement messages. The stations can identify whether certain(cooperative) use cases are possible by the use of service announcements.
LDM Management This application facility manages the continuous update ofthe Local Dynamic Map information. The LDM is a very important conceptin ITS [ETS14c]. In brief, the LDM references gathered ITS informationto a specific location on a digital road map. The information can be eitherreceived by internal sensors or by external stations via V2X communication.Beside the spatial attribute, ITS information also has a certain attributefor the time period to be valid. According to this time period, informationcan be static (the road network), semi static (landmarks for references),dynamic (road situations) or highly-dynamic (awareness data from the ownsensors as well as surrounding vehicles).
Message Management This application support facility is responsible for gen-erating, formatting, sending, and also receiving ITS application messages.Currently, two message types are of utmost importance. CAMs are sentpermanently with a specific period to enable the essential information dis-semination towards all vehicles in the surrounding [ETS14a]. DENMs aresent repeatedly within a limited time frame upon specific road events tosignalize them [ETS14b]. The message management uses the services fromnearly all other facilities for generating the content and determining theparticular sending time of the ITS messages. For instance, ETSI rules definethe CAM sending frequency depending on the change of the position, theheading and the speed for vehicle stations [ETS14a].
Security Access Management This application support facility provides aninterface between the applications, the Facilities layer and the security
28 CHAPTER 2. SYSTEM OVERVIEW
entities. It enables the communication according to the appropriate securitypolicy.
Time Management This application support facility maintains a global timereference that is used for all time stamped data elements in V2X messagesas well as in applications.
Information Support These facilities provide the elements and processing meth-ods for static and dynamic information that is used by the Facilities layerand accessed by the applications. It contains the LDM Data Base as reposi-tory for the LDM, the Location Referencing methods to associate the LDMcontent with a geographic position, the Data Representation of the CAM andDENM content, encoded according to the ASN.1 format, and the StationType/Capabilities to register information about the station.
Communication Support This group of facilities provides the capabilities tomanage various communication modes and sessions. It contains the Ad-dressing Mode in connection with the GeoNet Support to determine thedissemination modes of messages, for ad hoc communication (e.g. uni-cast, broadcast or geocast in a certain geographic area) as well as cellularcommunication. Moreover, it provides the Session Support and MobilityManagement for stations that are attached to the Internet.
Communication Paradigms
As aforementioned, the ETSI specification includes geographic networking androuting concepts to support the nature of safety and traffic efficiency use cases toaddress the vehicles in the local environment. Stations with georouting protocolsmaintain neighborhood tables that are continuously updated through beaconmessages. When a station wants to send a packet to a geographic area, there areusually two modes. When the sender station itself is not located in the geographicarea, it applies line forwarding. This means, it sends a unicast message to theneighbor, which has the shortest distance to the destined geographic area. Lineforwarding is performed until the sender node is also located in the area. Then,area forwarding is applied. Area forwarding usually comprises a simple flooding,where every station again rebroadcasts the packet once. This packet-centricapproach follows the conventional approach of packet switched communicationnetworks. However, it may introduce a high channel load in certain situationswith large geographic areas and many stations, also known as the broadcast stormproblem. For instance, when many vehicles detect the end of a traffic jam andinform the following vehicles. As a consequence, congestion control mechanismsneed to be applied to mitigate the problem [ETS11c].
One step ahead, the information-centric approach departs from the conven-tional forwarding semantic that resides on the networking layer [CAR07]. The
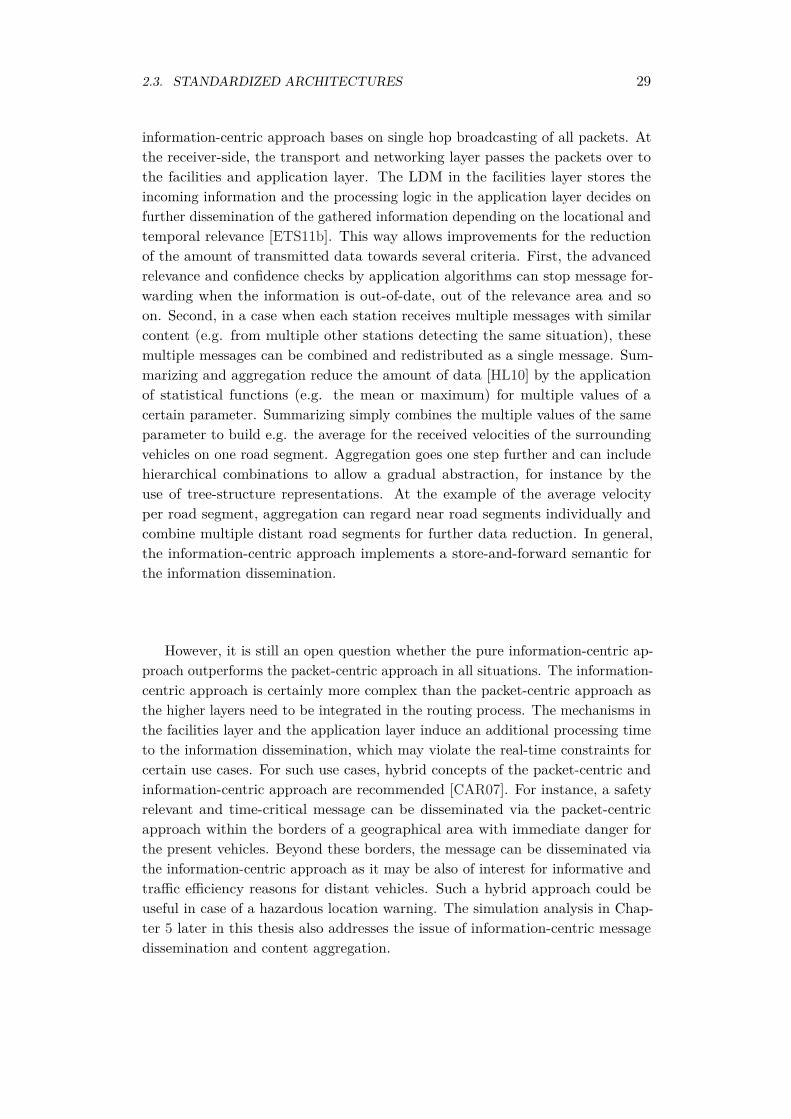
2.3. STANDARDIZED ARCHITECTURES 29
information-centric approach bases on single hop broadcasting of all packets. Atthe receiver-side, the transport and networking layer passes the packets over tothe facilities and application layer. The LDM in the facilities layer stores theincoming information and the processing logic in the application layer decides onfurther dissemination of the gathered information depending on the locational andtemporal relevance [ETS11b]. This way allows improvements for the reductionof the amount of transmitted data towards several criteria. First, the advancedrelevance and confidence checks by application algorithms can stop message for-warding when the information is out-of-date, out of the relevance area and soon. Second, in a case when each station receives multiple messages with similarcontent (e.g. from multiple other stations detecting the same situation), thesemultiple messages can be combined and redistributed as a single message. Sum-marizing and aggregation reduce the amount of data [HL10] by the applicationof statistical functions (e.g. the mean or maximum) for multiple values of acertain parameter. Summarizing simply combines the multiple values of the sameparameter to build e.g. the average for the received velocities of the surroundingvehicles on one road segment. Aggregation goes one step further and can includehierarchical combinations to allow a gradual abstraction, for instance by theuse of tree-structure representations. At the example of the average velocityper road segment, aggregation can regard near road segments individually andcombine multiple distant road segments for further data reduction. In general,the information-centric approach implements a store-and-forward semantic forthe information dissemination.
However, it is still an open question whether the pure information-centric ap-proach outperforms the packet-centric approach in all situations. The information-centric approach is certainly more complex than the packet-centric approach asthe higher layers need to be integrated in the routing process. The mechanisms inthe facilities layer and the application layer induce an additional processing timeto the information dissemination, which may violate the real-time constraints forcertain use cases. For such use cases, hybrid concepts of the packet-centric andinformation-centric approach are recommended [CAR07]. For instance, a safetyrelevant and time-critical message can be disseminated via the packet-centricapproach within the borders of a geographical area with immediate danger forthe present vehicles. Beyond these borders, the message can be disseminated viathe information-centric approach as it may be also of interest for informative andtraffic efficiency reasons for distant vehicles. Such a hybrid approach could beuseful in case of a hazardous location warning. The simulation analysis in Chap-ter 5 later in this thesis also addresses the issue of information-centric messagedissemination and content aggregation.
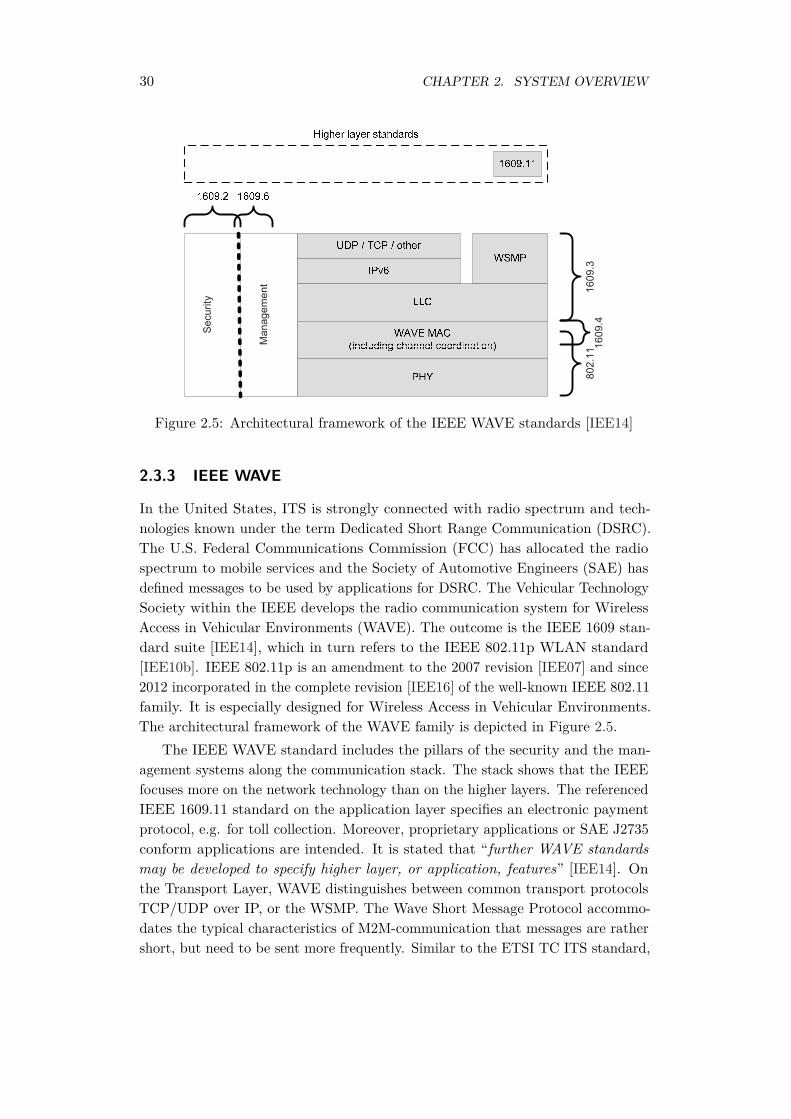
30 CHAPTER 2. SYSTEM OVERVIEW
Figure 2.5: Architectural framework of the IEEE WAVE standards [IEE14]
2.3.3 IEEE WAVE
In the United States, ITS is strongly connected with radio spectrum and tech-nologies known under the term Dedicated Short Range Communication (DSRC).The U.S. Federal Communications Commission (FCC) has allocated the radiospectrum to mobile services and the Society of Automotive Engineers (SAE) hasdefined messages to be used by applications for DSRC. The Vehicular TechnologySociety within the IEEE develops the radio communication system for WirelessAccess in Vehicular Environments (WAVE). The outcome is the IEEE 1609 stan-dard suite [IEE14], which in turn refers to the IEEE 802.11p WLAN standard[IEE10b]. IEEE 802.11p is an amendment to the 2007 revision [IEE07] and since2012 incorporated in the complete revision [IEE16] of the well-known IEEE 802.11family. It is especially designed for Wireless Access in Vehicular Environments.The architectural framework of the WAVE family is depicted in Figure 2.5.
The IEEE WAVE standard includes the pillars of the security and the man-agement systems along the communication stack. The stack shows that the IEEEfocuses more on the network technology than on the higher layers. The referencedIEEE 1609.11 standard on the application layer specifies an electronic paymentprotocol, e.g. for toll collection. Moreover, proprietary applications or SAE J2735conform applications are intended. It is stated that “further WAVE standardsmay be developed to specify higher layer, or application, features” [IEE14]. Onthe Transport Layer, WAVE distinguishes between common transport protocolsTCP/UDP over IP, or the WSMP. The Wave Short Message Protocol accommo-dates the typical characteristics of M2M-communication that messages are rathershort, but need to be sent more frequently. Similar to the ETSI TC ITS standard,

2.3. STANDARDIZED ARCHITECTURES 31
this architecture aims for the support of the three V2X application categoriesof safety and efficiency as well as infotainment applications. However, the mostimportant parts of this architecture regard to the comprehensive specificationof the MAC and PHY layer. In contrast to the other architectures, WAVE onlyspecifies one access technology according to IEEE 802.11p. However, 802.11paccess is the de facto solutions for ad hoc communication between vehicles. TheIEEE 802.11p standard for general ad hoc communication will be referenced againin the next Chapter 3.2 when it comes to closer details about the communicationtechnologies.
The IEEE 1609.4 part [IEE11] specifies an important extension to the IEEE802.11p MAC layer for multi-channel operations. It introduces the channel routingentity, which uses one dedicated MAC sublayer entity from IEEE 802.11p foreach channel. The channel routing directs messages from the upper LLC layer tothe designated channel and sets the according parameters (e.g. for transmissionpower). For instance, the US as well as the European spectrum definition containsup to seven channels for V2X communication in the band around 5.9 GHz. Morespecifically, ETSI ITS [ETS13a] defines one CCH (Control Channel) and twoSCHs (Service Channels) in the ITS-G5A band and additional 4 SCHs in furtherG5 bands. Multichannel operation intends primarily to support safety criticalcommunication in the separate CCH and non-safety communication in the SCHsto avoid interferences between these message classes. The general concept ofthe IEEE 1609.4 bases on a time division scheme for the channel switching.According to this, time based on UTC (Coordinated Universal Time) is separatedinto Sync intervals of 100 ms. One Sync interval comprises one CCH intervalfollowed by one SCH interval, which are 50 ms each. A further guard interval atthe beginning of each channel interval (CCH interval or SCH interval) accountsfor robust switching between the channels. The guard interval consists of theSync_tolerance of 2 ms and the Max_Ch_Switch_time also of 2 ms. TheSync_tolerance describes the differences of the internal clocks of the stationstowards UTC. The Max_Ch_Switch_time represents the time for tuning theradio hardware to the other channel. During the guard interval, no transmissionis allowed.
Figure 2.6 illustrates the different options for the channel access. Thesemethods are in the first instance specified for stations with a single-radio device.A dedicated access option may be used only for certain time span. Typically, thecontinuous and alternating access will take turns when the situation demands theaccording option. The immediate - and extended access are additional options.
Continuous access requires no channel coordination. The station tunes all thetime to one dedicated channel. Basically, it is envisioned that the stationpermanently uses the CCH to take part in applications with safety-criticalcommunication.
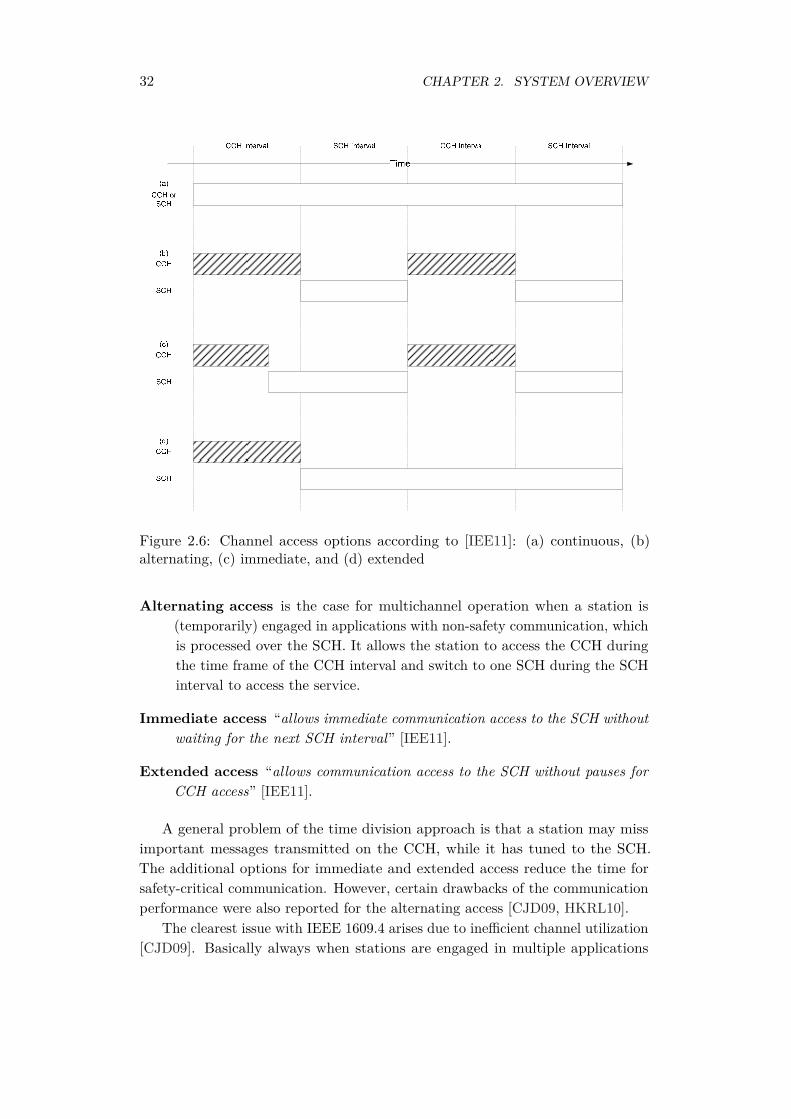
32 CHAPTER 2. SYSTEM OVERVIEW
Figure 2.6: Channel access options according to [IEE11]: (a) continuous, (b)alternating, (c) immediate, and (d) extended
Alternating access is the case for multichannel operation when a station is(temporarily) engaged in applications with non-safety communication, whichis processed over the SCH. It allows the station to access the CCH duringthe time frame of the CCH interval and switch to one SCH during the SCHinterval to access the service.
Immediate access “allows immediate communication access to the SCH withoutwaiting for the next SCH interval” [IEE11].
Extended access “allows communication access to the SCH without pauses forCCH access” [IEE11].
A general problem of the time division approach is that a station may missimportant messages transmitted on the CCH, while it has tuned to the SCH.The additional options for immediate and extended access reduce the time forsafety-critical communication. However, certain drawbacks of the communicationperformance were also reported for the alternating access [CJD09, HKRL10].
The clearest issue with IEEE 1609.4 arises due to inefficient channel utilization[CJD09]. Basically always when stations are engaged in multiple applications
2.4. SUMMARY OF SYSTEM OVERVIEW 33
with safety-critical and non-safety communication and switch between the CCHand SCH, all other stations in the neighborhood that stay on the CCH for thewhole time may be forced to limit their communication to the CCH interval.Only this way allows ensuring that important safety-critical messages are notlost for the switching stations. Moreover, the needed guard interval reduces theeffective time span when safety-critical messages can be communicated to less thanthe half of the available time. The second issue arises due to the queued safetymessages during the SCH interval. At the start of the CCH interval, the accordingsending attempts of these messages increase the probability of message collisions.The medium access procedures of IEEE 802.11p are presented in closer detail inthe next Chapter 3.2. However, already now, it can be stated that the unevenconcentration of sending attempts decreases the communication performance. Athird issue is the missing migration path towards stations with multi-radio devices.
The co-existent deployment of single-radio and multi-radio stations will impairthe capabilities of the multi-radio stations as they need to limit their safety-criticalcommunication to the CCH interval [HKRL10]. A proposed multichannel safetyapproach with an intentional bit to signal the channel switching improves theperformance for the case of a continuous CCH for a certain time span [HKRL10].Still, the best performance would be achieved with a dedicated safety radioapproach. Single-radio stations would always use the CCH for communication.Multi-radio stations would tune one radio always to the CCH and could use theother radio to switch between the SCHs according to the used services. Fromprotocol design, this approach is also favorable due to its simplicity.
2.4 Summary of System Overview
This chapter introduced the different groups of applications and presented themost prominent architectures to realize the V2X communication system. Themajor part of safety and efficiency applications bases on a characteristic M2Mcommunication pattern with periodic message exchange to inform the neighbors inthe vicinity. Main aspects to distinguish the applications include the duration andmobility of a situation to be informed as well as the possible number of reporters.From this follow different communication range and timing constraints. The CCPis a suitable metric to measure these requirements. From the existing systems,especially the ETSI TC ITS reference architecture accounts for the diversity ofapplications. With the Facilities Layer, it specifies several valuable utilities. Forinstance, the LDM introduces a concept to enable applications with less criticaltiming requirements but an extended horizon. The IEEE WAVE architecturedefines one particular access technology. Nonetheless, it also aims to supportdifferent application requirements, e.g. with the multi-channel design. In thisway, applications with different constraints regarding latency and communication

34 CHAPTER 2. SYSTEM OVERVIEW
range could be separated on different channels. The main objective of this thesisgoes one step further and proposes to separate different applications not only ondifferent channels, but even on different access technologies. The next Chapter 3will present a detailed discussion about the two major concepts of ad hoc andcellular systems. These technologies will be briefly evaluated on a theoreticalbasis with the help of the CCP. Later, Chapter 5 will analyze the communicationexchange by simulation. The applications will implement the relevant featureslike the ETSI facilities and communicate according to the presented pattern ofregular updates, which was the basis of most safety and efficiency use cases.

Chapter 3
Communication Technologies
The first section of this chapter presents the fundamental characteristics of theradio channel to provide a basis for the later description of the communicationtechnologies themselves. Second, the ad hoc communication mode according to theIEEE 802.11p standard is presented and important amendments are introduced.Third, the different cellular families of UMTS and LTE, specified by the 3GPP,are introduced in the cellular communication networks section.
3.1 Radio Channel
The radio channel is a physical transmission medium with particularly challengingcharacteristics. The fundamental transmission principle of the radio channel isdescribed by the propagation of the electromagnetic waves through the openspace [Max73]. The information reception in the radio channel relies on thesuccessful distinction of the signal from the noise [Sha48], as in all communicationsystems based on electromagnetic waves - so in guided wired media. However, theopen space transmission leads to multipath propagation and time variation of thechannel [HM04]. Multiple paths arise by the phenomena of reflection, diffraction orscattering of the electromagnetic waves on the objects, also known as the scatterers,in the environment of the transmitter and receiver. The channel properties varyover time due to the mobility of all objects - including the communicating nodes.The relation of the scatterers and the phenomena is displayed in Figure 3.1. Thefigure includes two additional paths. The Line-Of-Sight (LOS) path is thedirect path between the transmitter and the receiver. It does not experience anydeflections from the scatterers and arrives at the receiver with the shortest delayand the highest amplitude. In contrast, the Shadowed path is deflected in sucha way that it never reaches the receiver at all.
35
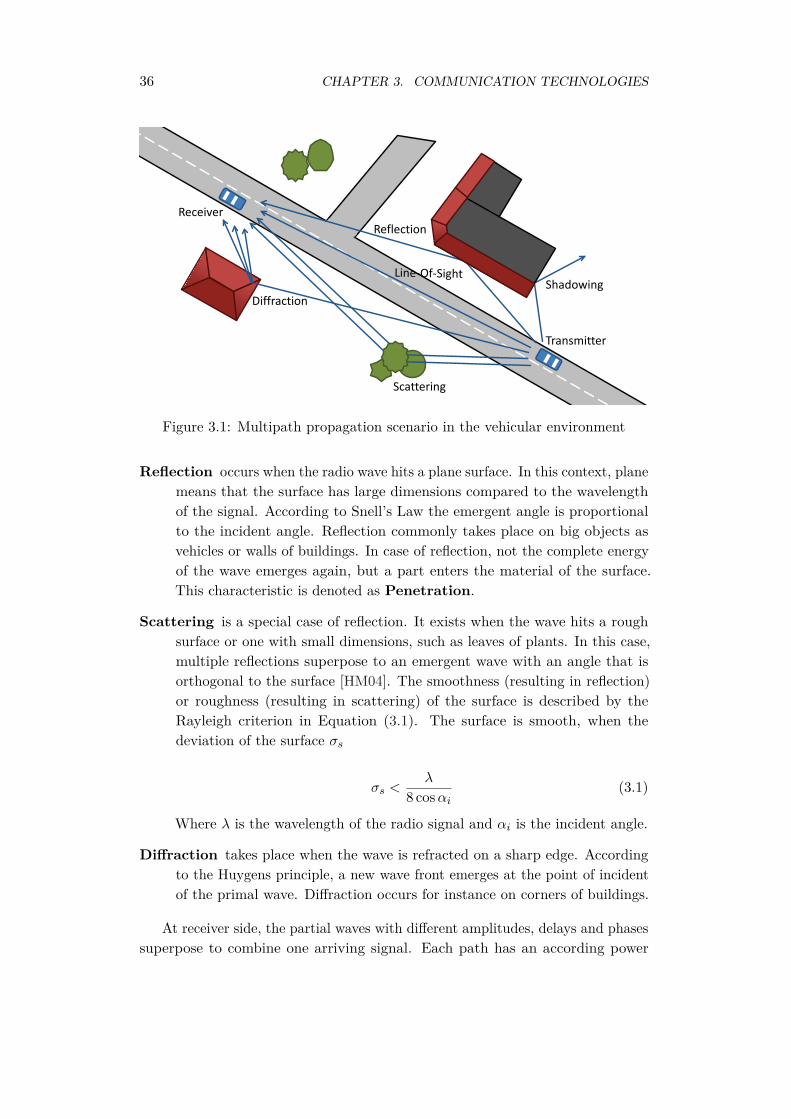
36 CHAPTER 3. COMMUNICATION TECHNOLOGIES
Transmitter
Receiver
Shadowing Diffraction
Reflection
Scattering
Figure 3.1: Multipath propagation scenario in the vehicular environment
Reflection occurs when the radio wave hits a plane surface. In this context, planemeans that the surface has large dimensions compared to the wavelengthof the signal. According to Snell’s Law the emergent angle is proportionalto the incident angle. Reflection commonly takes place on big objects asvehicles or walls of buildings. In case of reflection, not the complete energyof the wave emerges again, but a part enters the material of the surface.This characteristic is denoted as Penetration.
Scattering is a special case of reflection. It exists when the wave hits a roughsurface or one with small dimensions, such as leaves of plants. In this case,multiple reflections superpose to an emergent wave with an angle that isorthogonal to the surface [HM04]. The smoothness (resulting in reflection)or roughness (resulting in scattering) of the surface is described by theRayleigh criterion in Equation (3.1). The surface is smooth, when thedeviation of the surface σs
σs <λ
8 cosαi(3.1)
Where λ is the wavelength of the radio signal and αi is the incident angle.
Diffraction takes place when the wave is refracted on a sharp edge. Accordingto the Huygens principle, a new wave front emerges at the point of incidentof the primal wave. Diffraction occurs for instance on corners of buildings.
At receiver side, the partial waves with different amplitudes, delays and phasessuperpose to combine one arriving signal. Each path has an according power

3.1. RADIO CHANNEL 37
delay profile. The channel impulse response h in Equation (3.2) describes thisprocess as the sum of Dirac delta impulses of different amplitude ai, phase shiftθi and delay τi from the ith multipath [Rap02]. The time difference between theshortest (earliest) and the latest path is referred to as maximum excess delay.
h(τ) =N∑i=1
aiejθiδ(τ − τi) (3.2)
The amplitude of the radio signal at the receiver side, also written as Pr,depends on the transmission power Pt and the Path Loss Lp for each one ofthe multiple paths (with Pr = LpPt). The path loss describes the decreaseof the amplitude of the radio wave during the transmission. The amplitudecan particularly decrease for any deflection of the wave, when a part of theenergy penetrates a surface. However, the amplitude also decreases during thepropagation through the free space. According to Equation (3.3), the freespacepath loss Lfs is proportional to the frequency of the radio wave (reciprocal to thewavelength λ) and also depends on the distance d from the transmitter [Fri46].The decibel notation on the right side of Equation (3.3) is a typical notation forderived radio propagation models.
Lfs =(4πd
λ
)2↔ Lfs[dB] = 2 · 10log
(4πdλ
)(3.3)
Therefore, communication systems at a higher carrier frequency exhibit ahigher path loss. The amplitude decreases with higher distances until it is notcapable of being differentiated from the noise floor. Additionally, the constructiveand destructive superposition of the partial waves leads to fading with significanteffects. Fading can be divided into large scale and small scale fading. Large scalefading mainly arises due to large shadowing objects. Small scale fading occursdue to small movements of the communicating nodes and the scatterers in theenvironment.
The effects of fading attribute to the dispersion of the radio signal. Forthe radio channel, two kinds of dispersion exist - time dispersion and frequencydispersion [Rap02]. Dispersion is generally known as the dependency of a physicalvariable on the wavelength. In optics, it would be the wavelength of light. For theradio channel, it is the wavelength of the transmitted radio waves. The principleof dispersion can be well explained with a basic concept of the informationtransmission. The information signal commonly gets modulated on a sinusoidalcarrier wave at a certain frequency. Multiple carrier waves are arranged adjacentlyin the frequency spectrum, according to national frequency plans. Figure 3.2depicts such a spectrum setup. Additionally, it includes a time component toaccount for subsequent transmission of the carriers. Even though, newer radio airinterfaces as WCDMA and OFDMA apply a slightly different concept than the

38 CHAPTER 3. COMMUNICATION TECHNOLOGIES
frequency
time
power
Figure 3.2: Simplified multicarrier spectrum allocation
sinusoidal carriers (as explained later), the simplified model serves well for theexplanation of dispersion.
First, Time Dispersion is the shift and spread of the modulated data signalalong the time. It is a result of the frequency selective properties of radio channel,which are in turn caused by the multipath phenomena of the wave propagation.Frequency selectivity means that signal parts of different frequencies experiencedifferent changes through the channel. For instance, the occurrence of reflectionversus scattering at a given surface according to the Rayleigh scattering criterionin Equation (3.1) depends on the wavelength of the incident wave. Reflection leadsto different behavior of the emergent wave compared to scattering. The importantmeasure to characterize if the existence of time dispersion has a disturbing effectis the coherence bandwidth. The coherence bandwidth specifies the part of thefrequency band where the behavior of all frequency components can be assumedas equal over the time. If a modulated signal occupies a larger bandwidth than thecoherence bandwidth, the time dispersion delays different frequencies of a signaldifferently. In other words, the channel impulse response from Equation (3.2) hasmultiple versions of that signal with different attenuations at different delays. Theresulting interference effect is commonly referred to as Inter Symbol Interference(ISI). As a general rule, broadband radio systems are more vulnerable to thedisturbance of time dispersion than narrowband systems. The described contextis named and modeled as frequency selective fading [Rap02].
The second dispersion of radio channel is the Frequency Dispersion. It isthe result of relative mobility of communicating participants and obstacles andconnected with the Doppler Effect [HM04]. The Doppler Effect causes a shiftor spread of frequency components of the signal. The analogous measure is thecoherence time, which specifies the time span where the channel can be assumedas constant. The coherence time depends on the length of the radio wave and alsoon the relative speed of the communicating nodes. A high coherence time means
3.2. AD HOC COMMUNICATION 39
that the channel changes less often and stays constant for longer periods. Thisbehavior is referred to as slow fading. If the coherence time is smaller than thesymbol rate, it is possible that the channel conditions change within one symbolperiod. This effect is called fast fading. Fast fading can lead to deep fades forshort periods of time, where the information signal cannot be sensed at all.
As a consequence of the described characteristics, the radio channel exhibitsrather adverse prerequisites for successful information transmission. Moreover,there is no way for improving the medium itself as it is in wired media withcable shielding, impedance balancing or line termination. In fact, the Bit ErrorRate (BER) of the communication systems based on copper or fiber is in theorder of 10−12 to 10−15, while the wireless channel achieves merely 10−3. Anotherimportant difference to wired systems arise of the fact that the radio channel "hasneither absolute nor readily observable boundaries" and is therefore "unprotectedfrom other signals that are sharing the medium" [IEE16]. This aspect is especiallyimportant when the access of multiple nodes to the medium needs to be regarded.On this account, two categories of channel access methods play an important rolein the design of wireless systems. Scheduled channel access methods based onmultiplexing usually need a central coordination instance. In the cellular systems,the infrastructure components as base stations control the transmission to preventmessage collisions. Cellular systems are presented in Section 3.3. In decentralizedsystems, every node itself applies access methods that base on contention. Thenext Section 3.2 about ad hoc communication addresses this kind of system.
3.2 Ad Hoc Communication
From the beginning, vehicular communication networks are considered as a specialtype of wireless local networks with moving vehicles and fixed RSUs communicatingin an ad hoc fashion. Hence, the term VANET is still a prominent synonym. Thetechnical basis for VANETs is formed by the IEEE 802.11 WLAN standard family.The IEEE 802.11p amendment particularly regards for vehicular environments[IEE10b].
3.2.1 IEEE 802.11p
The main content of the IEEE 802.11 standard covers medium access procedures(MAC) and physical layer signaling techniques (PHY) for wireless local networks.Moreover, it defines the operation at different frequency bands, the spectrum.
Spectrum
IEEE 802.11p operates in the frequency bands around 5.9 GHz. More specifically,in Europe the spectrum of 5.855 - 5.925 GHz is available. The FCC in the US
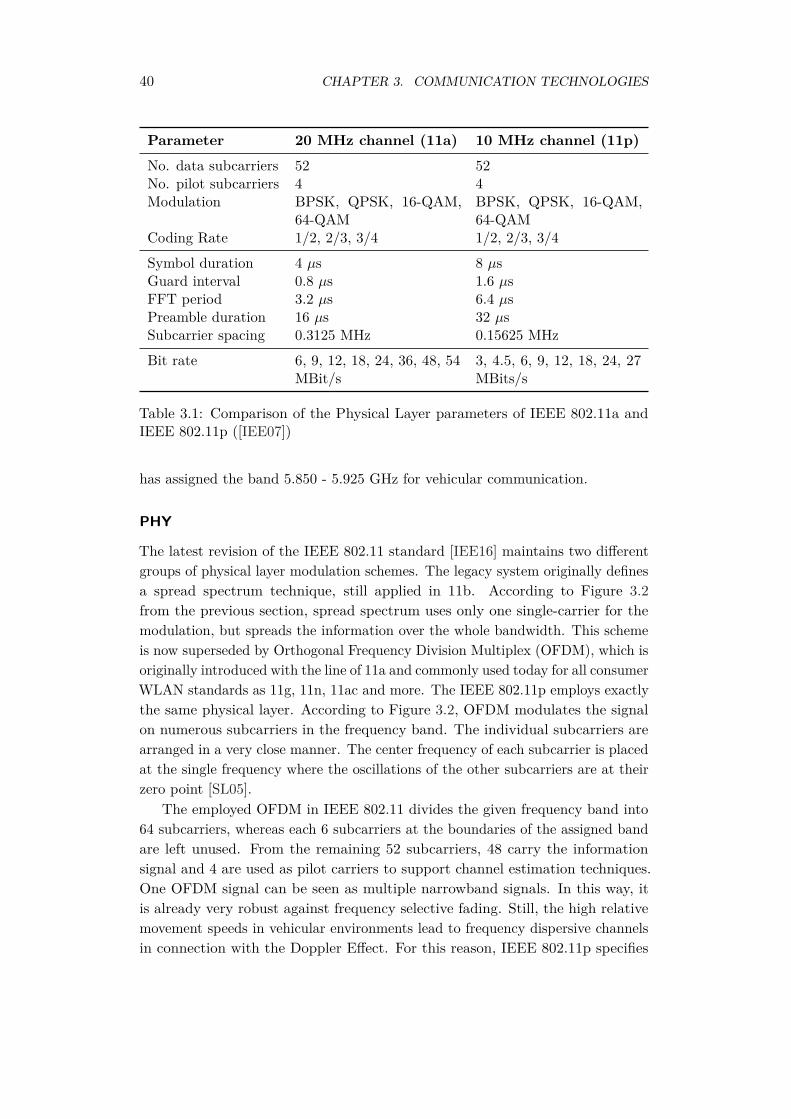
40 CHAPTER 3. COMMUNICATION TECHNOLOGIES
Parameter 20 MHz channel (11a) 10 MHz channel (11p)No. data subcarriers 52 52No. pilot subcarriers 4 4Modulation BPSK, QPSK, 16-QAM,
64-QAMBPSK, QPSK, 16-QAM,64-QAM
Coding Rate 1/2, 2/3, 3/4 1/2, 2/3, 3/4
Symbol duration 4 µs 8 µsGuard interval 0.8 µs 1.6 µsFFT period 3.2 µs 6.4 µsPreamble duration 16 µs 32 µsSubcarrier spacing 0.3125 MHz 0.15625 MHz
Bit rate 6, 9, 12, 18, 24, 36, 48, 54MBit/s
3, 4.5, 6, 9, 12, 18, 24, 27MBits/s
Table 3.1: Comparison of the Physical Layer parameters of IEEE 802.11a andIEEE 802.11p ([IEE07])
has assigned the band 5.850 - 5.925 GHz for vehicular communication.
PHY
The latest revision of the IEEE 802.11 standard [IEE16] maintains two differentgroups of physical layer modulation schemes. The legacy system originally definesa spread spectrum technique, still applied in 11b. According to Figure 3.2from the previous section, spread spectrum uses only one single-carrier for themodulation, but spreads the information over the whole bandwidth. This schemeis now superseded by Orthogonal Frequency Division Multiplex (OFDM), which isoriginally introduced with the line of 11a and commonly used today for all consumerWLAN standards as 11g, 11n, 11ac and more. The IEEE 802.11p employs exactlythe same physical layer. According to Figure 3.2, OFDM modulates the signalon numerous subcarriers in the frequency band. The individual subcarriers arearranged in a very close manner. The center frequency of each subcarrier is placedat the single frequency where the oscillations of the other subcarriers are at theirzero point [SL05].
The employed OFDM in IEEE 802.11 divides the given frequency band into64 subcarriers, whereas each 6 subcarriers at the boundaries of the assigned bandare left unused. From the remaining 52 subcarriers, 48 carry the informationsignal and 4 are used as pilot carriers to support channel estimation techniques.One OFDM signal can be seen as multiple narrowband signals. In this way, itis already very robust against frequency selective fading. Still, the high relativemovement speeds in vehicular environments lead to frequency dispersive channelsin connection with the Doppler Effect. For this reason, IEEE 802.11p specifies
3.2. AD HOC COMMUNICATION 41
expanded timing parameters to countervail the arising fast fading properties.Therefore, the standard defines the half-clocked operation. In contrast to theregular operation, the half-clocked mode uses only the half of the channel spacingof 10 MHz, with the result of doubled timing parameters. The doubled symbolduration and particularly the doubled guard interval ensure a more robust signal.Table 3.1 summarizes the most important properties of the half-clocked 10 MHzchannel of 11p in comparison to the regular 20 MHz channel as for instanceemployed in 11a. As a consequence, the half-clocked operation in 11p improvesthe signal robustness at the prize of the halved bit rate for the data payload. Theassigned spectrum in Europe of 5.855 - 5.925 GHz accommodates seven 10 MHzchannels for multichannel access.
MAC
Besides the PHY layer specification, the MAC layer is the other important partof the IEEE 802.11 standard. Three different access scheduling mechanisms aredefined.
• Point Coordination Function (PCF)
• Distributed Coordination Function (DCF)
• Hybrid Coordination Function (HCF)
The PCF is employed when a central instance like a wireless Access Point (AP)coordinates the communication. It is not of interest for vehicular communication.The more important function is the DCF as protocol for access scheduling inad hoc networks. The HCF is a new coordination function that supports twoenhanced channel access methods. It is introduced to the IEEE 802.11 familywith the 11e standard. While HCF Controlled Channel Access (HCCA) worksa similar to the PCF, the Enhanced Distributed Channel Access (EDCA) is avariant of the DCF to incorporate Quality of Service (QoS).
DCF and EDCA use a form of the Carrier Sense Multiple Access mechanismwith Collision Avoidance (CSMA/CA). In other words, each station employs the“listen before talk” principle for every packet transmission. IEEE 802.11 supportsunicast as well as broadcast communication. For unicast communication withone dedicated addressee, each packet can be acknowledged with an ACK controlpacket upon successful reception. Otherwise, the packet can be considered as lostand as a consequence being retransmitted. Moreover, sender and receiver can vir-tually reserve a free communication slot with the request-to-send / clear-to-send(RTS/CTS) hand shake. However, these mechanisms are not possible or reason-able for broadcast communication with multiple receivers of a possibly unknownnumber. In the case of an unknown number of receivers, the sender would not
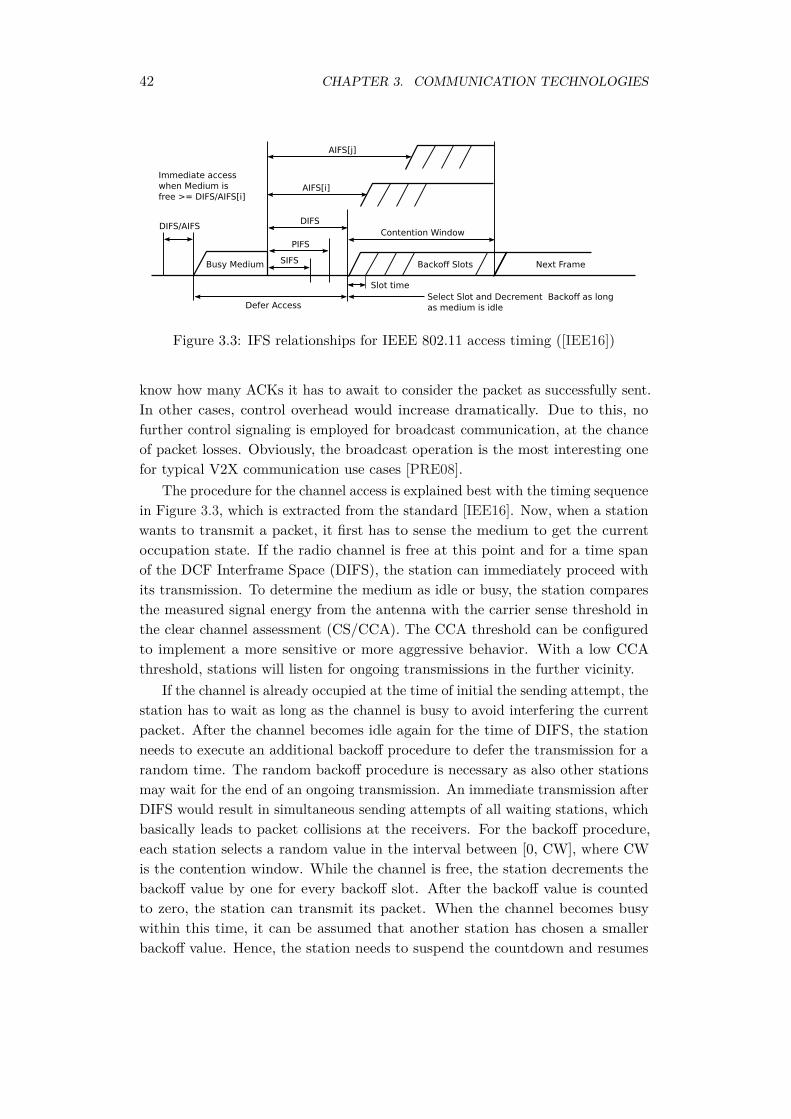
42 CHAPTER 3. COMMUNICATION TECHNOLOGIES
Figure 3.3: IFS relationships for IEEE 802.11 access timing ([IEE16])
know how many ACKs it has to await to consider the packet as successfully sent.In other cases, control overhead would increase dramatically. Due to this, nofurther control signaling is employed for broadcast communication, at the chanceof packet losses. Obviously, the broadcast operation is the most interesting onefor typical V2X communication use cases [PRE08].
The procedure for the channel access is explained best with the timing sequencein Figure 3.3, which is extracted from the standard [IEE16]. Now, when a stationwants to transmit a packet, it first has to sense the medium to get the currentoccupation state. If the radio channel is free at this point and for a time spanof the DCF Interframe Space (DIFS), the station can immediately proceed withits transmission. To determine the medium as idle or busy, the station comparesthe measured signal energy from the antenna with the carrier sense threshold inthe clear channel assessment (CS/CCA). The CCA threshold can be configuredto implement a more sensitive or more aggressive behavior. With a low CCAthreshold, stations will listen for ongoing transmissions in the further vicinity.
If the channel is already occupied at the time of initial the sending attempt, thestation has to wait as long as the channel is busy to avoid interfering the currentpacket. After the channel becomes idle again for the time of DIFS, the stationneeds to execute an additional backoff procedure to defer the transmission for arandom time. The random backoff procedure is necessary as also other stationsmay wait for the end of an ongoing transmission. An immediate transmission afterDIFS would result in simultaneous sending attempts of all waiting stations, whichbasically leads to packet collisions at the receivers. For the backoff procedure,each station selects a random value in the interval between [0, CW], where CWis the contention window. While the channel is free, the station decrements thebackoff value by one for every backoff slot. After the backoff value is countedto zero, the station can transmit its packet. When the channel becomes busywithin this time, it can be assumed that another station has chosen a smallerbackoff value. Hence, the station needs to suspend the countdown and resumes
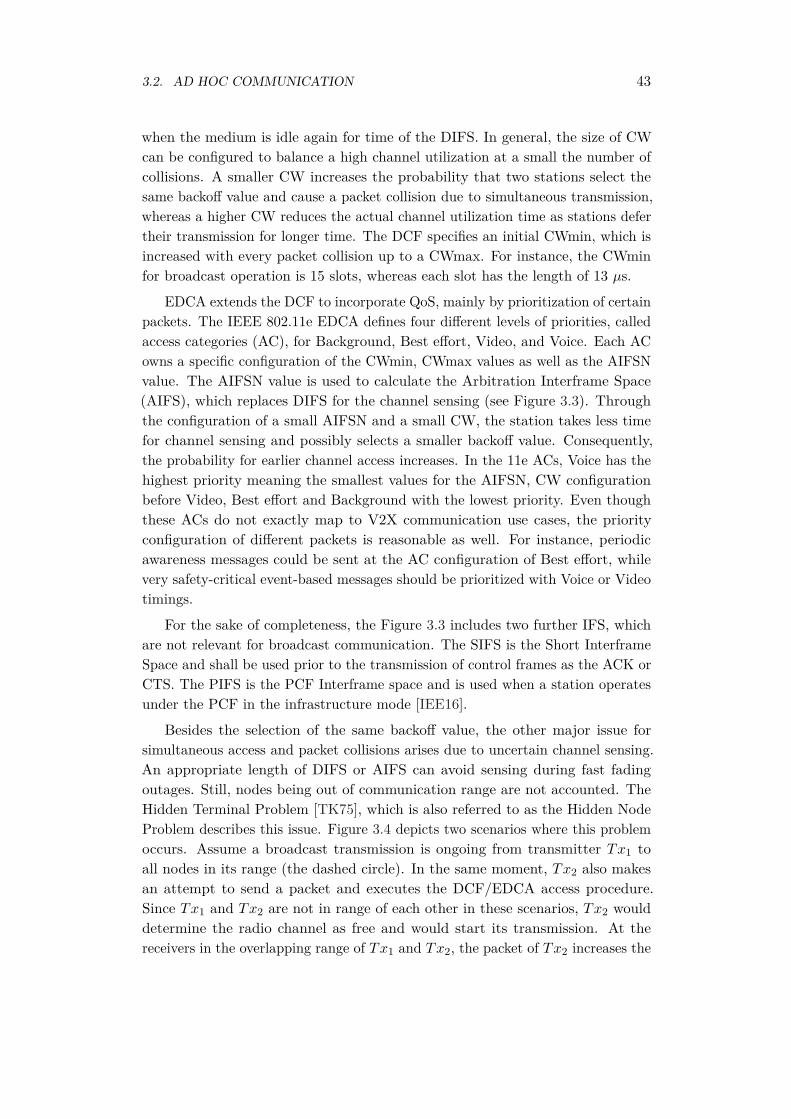
3.2. AD HOC COMMUNICATION 43
when the medium is idle again for time of the DIFS. In general, the size of CWcan be configured to balance a high channel utilization at a small the number ofcollisions. A smaller CW increases the probability that two stations select thesame backoff value and cause a packet collision due to simultaneous transmission,whereas a higher CW reduces the actual channel utilization time as stations defertheir transmission for longer time. The DCF specifies an initial CWmin, which isincreased with every packet collision up to a CWmax. For instance, the CWminfor broadcast operation is 15 slots, whereas each slot has the length of 13 µs.
EDCA extends the DCF to incorporate QoS, mainly by prioritization of certainpackets. The IEEE 802.11e EDCA defines four different levels of priorities, calledaccess categories (AC), for Background, Best effort, Video, and Voice. Each ACowns a specific configuration of the CWmin, CWmax values as well as the AIFSNvalue. The AIFSN value is used to calculate the Arbitration Interframe Space(AIFS), which replaces DIFS for the channel sensing (see Figure 3.3). Throughthe configuration of a small AIFSN and a small CW, the station takes less timefor channel sensing and possibly selects a smaller backoff value. Consequently,the probability for earlier channel access increases. In the 11e ACs, Voice has thehighest priority meaning the smallest values for the AIFSN, CW configurationbefore Video, Best effort and Background with the lowest priority. Even thoughthese ACs do not exactly map to V2X communication use cases, the priorityconfiguration of different packets is reasonable as well. For instance, periodicawareness messages could be sent at the AC configuration of Best effort, whilevery safety-critical event-based messages should be prioritized with Voice or Videotimings.
For the sake of completeness, the Figure 3.3 includes two further IFS, whichare not relevant for broadcast communication. The SIFS is the Short InterframeSpace and shall be used prior to the transmission of control frames as the ACK orCTS. The PIFS is the PCF Interframe space and is used when a station operatesunder the PCF in the infrastructure mode [IEE16].
Besides the selection of the same backoff value, the other major issue forsimultaneous access and packet collisions arises due to uncertain channel sensing.An appropriate length of DIFS or AIFS can avoid sensing during fast fadingoutages. Still, nodes being out of communication range are not accounted. TheHidden Terminal Problem [TK75], which is also referred to as the Hidden NodeProblem describes this issue. Figure 3.4 depicts two scenarios where this problemoccurs. Assume a broadcast transmission is ongoing from transmitter Tx1 toall nodes in its range (the dashed circle). In the same moment, Tx2 also makesan attempt to send a packet and executes the DCF/EDCA access procedure.Since Tx1 and Tx2 are not in range of each other in these scenarios, Tx2 woulddetermine the radio channel as free and would start its transmission. At thereceivers in the overlapping range of Tx1 and Tx2, the packet of Tx2 increases the

44 CHAPTER 3. COMMUNICATION TECHNOLOGIES
Tx1
Tx2Rx1Rx3
Rx2
(a) Rural
Tx2
Tx1Rx2
Rx1
Rx3
(b) Urban
Figure 3.4: The Hidden Terminal Problem in different scenarios
interference term of the SNIR. When the signal from Tx1 is not significantly higherthan the signal from Tx2, both packets cannot be decoded and get lost. TheHidden Terminal Problem is considered to reduce the communication performancedramatically [TK75]. Indeed, in an AP based topology where all communicationgoes through the AP, it leads to a major degradation. In decentralized networksas VANETs, primarily the communication range decreases. In the Rural scenariowithout scatterers in the vicinity, only Rx3 is concerned of a collision and notable to receive the packet from Tx1 (Figure 3.4a). However, as a result of thepresented radio propagation effects, hidden terminals can appear much closer.Due to shadowing in the Urban scenario, Rx2 and Rx3 are affected by a collision,whereas the distant Rx1 receives the packet from Tx1 (Figure 3.4b). In practice,the number of collisions caused by the Hidden Terminal Problem depends on thenumber of nodes and their location, the propagation environment, the transmissionpower, and also the amount of transmitted data.
The solution to the Hidden Terminal Problem is the already mentionedRTS/CTS handshake. For AP based topologies or in general for unicast communi-cation, this solution is usually employed. However, for broadcast communicationwith multiple receivers - as the case for V2X communication - it is not applicable.
Consequently, the CSMA/CA based medium access is regarded to exhibitreliability problems for real-time communication, especially in situations with ahigh channel load [BUS10, SBL+11]. In this case, high packet losses and highmedium access delays can occur. The adjustment of the CCA threshold for channelsensing can mitigate the problem [SBL+11]. However, alternative time slottedaccess approaches promise to outperform the random approach from CSMA/CA.Next section briefly introduces the two candidates.

3.2. AD HOC COMMUNICATION 45
3.2.2 Alternative Access
Self-Organizing Time Division Multiple Access (STDMA) [BUS10] and MobileSlotted Aloha (MS-Aloha) [CSCB09] are not only presented on academic basis,but also investigated for applicability for V2X communication by a working groupof the ETSI ITS TC [ETS11a, ETS12].
STDMA is already in commercial use for communication between ships in theAutomatic Identification System (AIS). In AIS, ships are required to regularlytransmit their position information for localization. This concept is similar toexchange of periodic messages that should provide cooperative awareness in V2Xcommunication use cases. For access scheduling, STDMA divides the time intoframes and further into a fixed number of time slots with a fixed duration. Forinstance, in AIS, a frame has a duration of 60 s and starts with every new minuteaccording to UTC. Each time slot is dimensioned in the way to accommodateone packet. A node (i.e. a ship) that wants to take part in the communicationperforms the following procedure [BUS10]. After initialization in the network, thenode listens to the radio channel for the duration of one frame and determinesthe current slot occupation. With the heartbeat rate of the own messages and theframe duration, the node calculates the nominal increment of time slots betweeneach heartbeat. Afterwards, the node draws a random selection interval of slotsfrom which it reserves a free slot for the own transmission. If no slots are freein the selection interval, the node reuses the slot that is already reserved by thenode the furthest away from itself. This procedure is performed for each nominalincrement in the frame. To account for network changes - e.g. due to nodemobility - each node reapplies the reservation mechanism after 3 to 8 frames.
Similar to CSMA/CA, STDMA employs a self-organizing protocol withoutoverhead for control information. In high load situations without free transmissionslots, STDMA still facilitates the transmission to nodes in the close vicinity atthe price of collisions at distant nodes. Especially for V2X communication usecases, this is regarded as fair, as the regular information updates on the proximatesituation are an important object. In high load scenarios, STDMA performs bettercompared to the DCF-based MAC for the packet reception of close nodes andthe channel access delay [ETS12]. Moreover, the channel access delay in STDMAexhibits a deterministic upper bound in contrast to the random delay in the DCF.
As the name says, MS-Aloha also bases on time division into frames andslots. It extends the latest version of the Reliable Reservation Aloha scheme(RR-Aloha+) to manage mobility issues [CSCB09]. As the main principle in theMS-Aloha protocol, every transmitting node appends the Frame Information (FI)to each transmitted data packet. Amongst other information, FI contains thestatus for each slot in the frame as perceived by the node. The status can be busy,free or collision. In the case of a collision, the slot is free for usage in the nextframe. With the own channel sensing and the received FIs from the other nodes,

46 CHAPTER 3. COMMUNICATION TECHNOLOGIES
each node obtains a diversified perception of the channel state for the accordingtime slots. With the feedback from the other nodes in their FIs, MS-Aloha iseven able to mitigate the Hidden Terminal Problem and unintentional collisions.Still, MS-Aloha allows intentional collision mechanisms when all slots are reserved.To reuse a slot for the own transmission, a node can ignore the busy indicationof one slot when the received power falls below a certain threshold. Similar toSTDMA, this approach prefers the transmission to nodes in the proximity, whileincreasing the collision probability at distant nodes. Moreover, MS-Aloha supportspreemption, which is managed through the priority state field in the FI. For anown high-priority transmission, a node can initiate a collision in a busy slot atlower priority to claim the slot for itself in the next frame.
With a limited amount of control information, MS-Aloha introduces severalsuitable features. Similar to STDMA, MS-Aloha supports deterministic chan-nel access to meet the real-time requirements of V2X communication use cases[ETS12]. With the use of the FI, MS-Aloha includes a decentralized handshakemechanism to mitigate the Hidden Terminal Problem. Especially in urban sce-narios with shadowing characteristics (as in Figure 3.4b), it can yield excellentresults [CSCB09]. Finally, the preemption mechanism provides scalable access fordifferent priority levels of data traffic.
Even though the first simulative investigations on the time slotted approachesdelivered promising results, there are also some concerns about the drawbacks.First, the reservation of time slots can also turn into a problem of increased packetcollisions. Especially, due to the high mobility and frequent topology changes,nodes may get into communication or interference range and slot states getoutdated. Even the feedback information in FI cannot prevent collisions, but onlyinform the nodes for the upcoming frame. Second, the time slotted approachesassume that all packets need to have the same length and each packet needs to fitinto one slot. This limits the flexibility and may lead to a waste of the channelresources for packets with varying lengths. Third, a very practical issue arisesdue to the requirement of time synchronization between all nodes. In the realworld, the local clocks will always exhibit uncertainties and misalignment towardsthe other nodes. Moreover, the frame structure needs to consider propagationdelays for different distances between the nodes. As a solution to these twoissue, an adequate guard interval between two consecutive slots needs to beintroduced [ETS11a]. Such a guard interval will probably have an impact on thecommunication performance.
In summary, the time slotted access approaches offer an interesting alternativeto the CSMA/CA mechanism. However, due to several open questions regardingthe definite design of the alternative protocols, further investigations in this thesiswill keep with the standardized IEEE 802.11 specification.
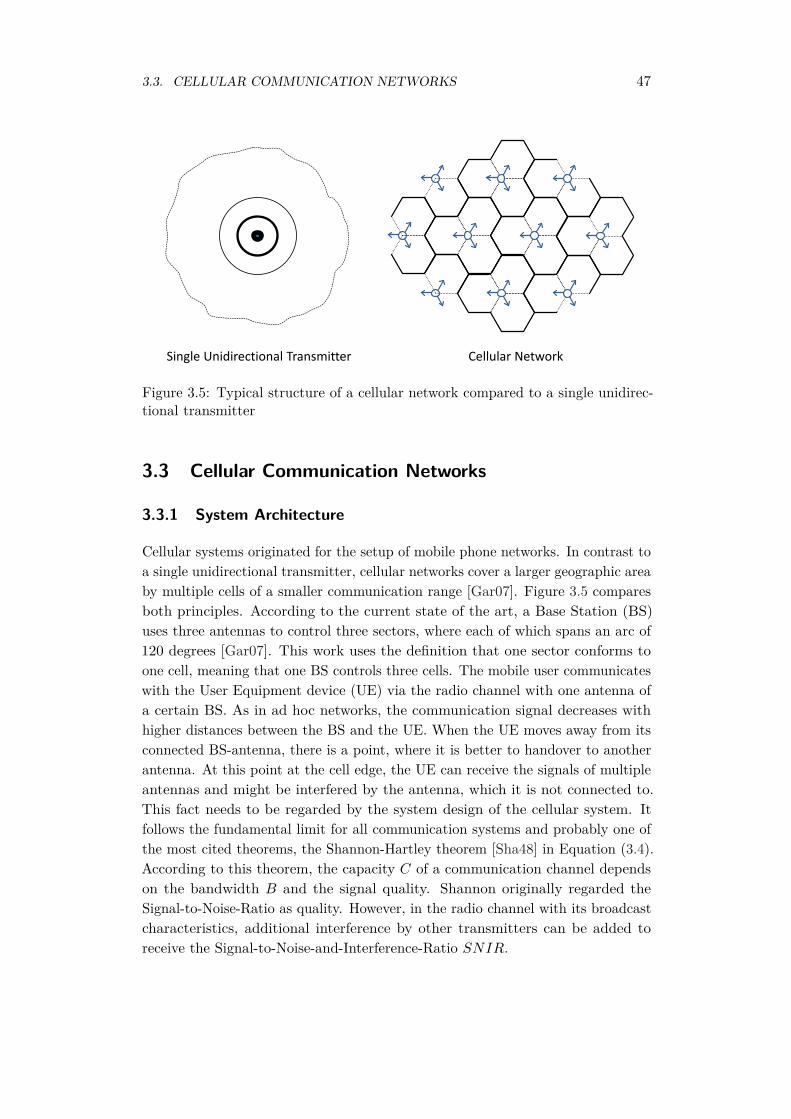
3.3. CELLULAR COMMUNICATION NETWORKS 47
Single Unidirectional Transmitter Cellular Network
Figure 3.5: Typical structure of a cellular network compared to a single unidirec-tional transmitter
3.3 Cellular Communication Networks
3.3.1 System Architecture
Cellular systems originated for the setup of mobile phone networks. In contrast toa single unidirectional transmitter, cellular networks cover a larger geographic areaby multiple cells of a smaller communication range [Gar07]. Figure 3.5 comparesboth principles. According to the current state of the art, a Base Station (BS)uses three antennas to control three sectors, where each of which spans an arc of120 degrees [Gar07]. This work uses the definition that one sector conforms toone cell, meaning that one BS controls three cells. The mobile user communicateswith the User Equipment device (UE) via the radio channel with one antenna ofa certain BS. As in ad hoc networks, the communication signal decreases withhigher distances between the BS and the UE. When the UE moves away from itsconnected BS-antenna, there is a point, where it is better to handover to anotherantenna. At this point at the cell edge, the UE can receive the signals of multipleantennas and might be interfered by the antenna, which it is not connected to.This fact needs to be regarded by the system design of the cellular system. Itfollows the fundamental limit for all communication systems and probably one ofthe most cited theorems, the Shannon-Hartley theorem [Sha48] in Equation (3.4).According to this theorem, the capacity C of a communication channel dependson the bandwidth B and the signal quality. Shannon originally regarded theSignal-to-Noise-Ratio as quality. However, in the radio channel with its broadcastcharacteristics, additional interference by other transmitters can be added toreceive the Signal-to-Noise-and-Interference-Ratio SNIR.

48 CHAPTER 3. COMMUNICATION TECHNOLOGIES
C = B log2(1 + SNIR) (3.4)
The theorem shows the major advantage of a cellular system compared to asingle transmitter that the capacity counts for every cell. The theorem furthershows that the highest capacity is only possible at close distances, where the SNIRis high enough. A downsizing of the range and increase of the number of cellsimproves the overall capacity. However, it would reach a limit, as it also impliesan increase of the interference between the cells. Another alternative would bethe increase of the bandwidth. Yet, a higher bandwidth also means a higher noiselevel. Besides, national spectrum allocation plans typically limit the availablefrequency bands. The following concrete specifications for cellular networks willexplain how engineers increase the capacity of the systems by mainly making moreefficient usage of the available SNIR. In this way, they allow a higher spectralefficiency. Coming back to the problem of interference between cells, the simplestsolution - as applied in GSM - is to use only a subset of the available frequencybands and change the frequencies with each cell [Gar07]. The same frequency canbe reused again at a distant cell where the interference can be neglected. However,this approach leaves parts of the spectrum unused. The current systems of UMTSand LTE specify more sophisticated approaches [Sau13, Cox14].
The transmission delay is another important performance metric for the com-munication capabilities of cellular systems. The transmission delay is influencedby various factors, as the network topology and the protocols to handle the infor-mation transmissions as well as the mobility of the participants. The availablecapacity also has an effect on the latency as a high capacity means that moreinformation can be transmitted within the same time.
Standardization
Today, the most common realizations of cellular networks are specified by the ThirdGeneration Partnership Project (3GPP). Historically, the 3GPP was founded in1998 to take over the evolution of GSM, the Global System for Mobile Communi-cations. Before 3GPP, the European ETSI was responsible for the specificationof GSM. Since then, ETSI is one important partner in the 3GPP-collaboration.Up to now, 3GPP designed two new systems with different architectures, namelyUMTS (Universal Mobile Telecommunications System) and LTE (Long Term Evo-lution). As these systems are very comprehensive, 3GPP manages 17 specificationseries (21-37) with more than 2000 technical documents. This work is structuredand published in releases [3GP17]. Table 3.2 outlines the release history withimportant features that are addressed later in this section. All administeredfamilies - GSM, UMTS and LTE - still receive updates with each release.
Due to historical reasons, there also exist different standard families for cellularsystems which are not administered by the 3GPP. The CDMA2000 family from
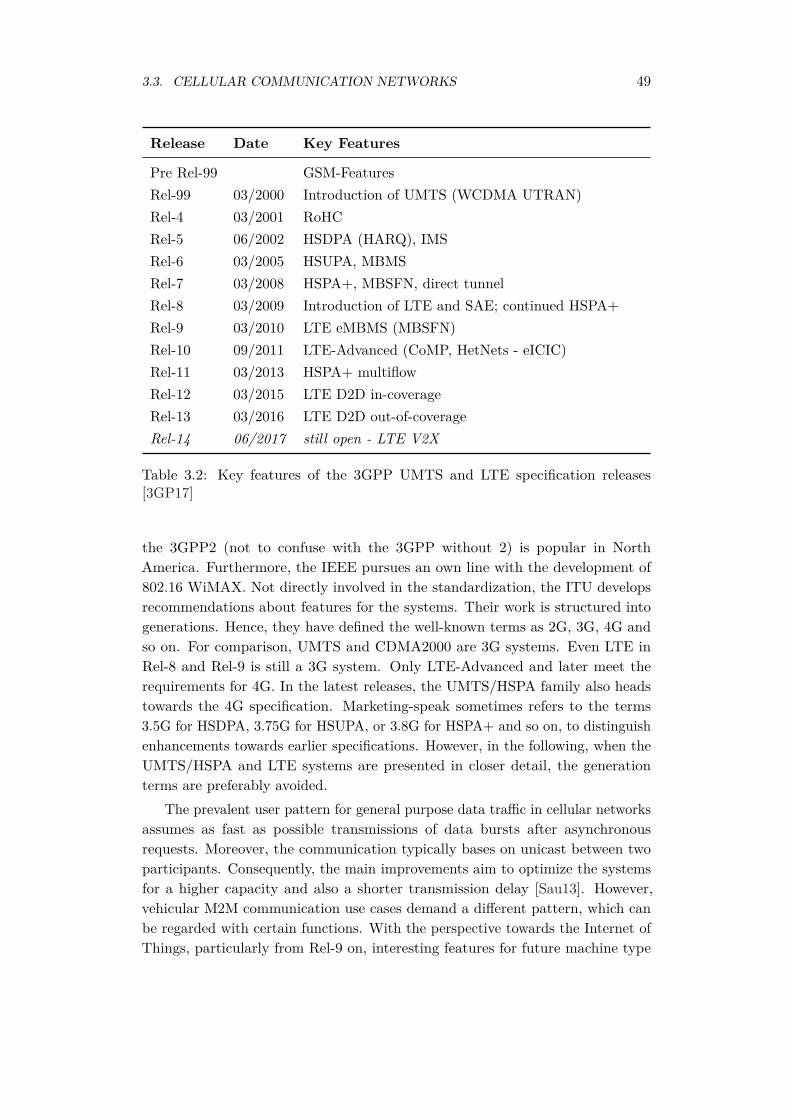
3.3. CELLULAR COMMUNICATION NETWORKS 49
Release Date Key Features
Pre Rel-99 GSM-FeaturesRel-99 03/2000 Introduction of UMTS (WCDMA UTRAN)Rel-4 03/2001 RoHCRel-5 06/2002 HSDPA (HARQ), IMSRel-6 03/2005 HSUPA, MBMSRel-7 03/2008 HSPA+, MBSFN, direct tunnelRel-8 03/2009 Introduction of LTE and SAE; continued HSPA+Rel-9 03/2010 LTE eMBMS (MBSFN)Rel-10 09/2011 LTE-Advanced (CoMP, HetNets - eICIC)Rel-11 03/2013 HSPA+ multiflowRel-12 03/2015 LTE D2D in-coverageRel-13 03/2016 LTE D2D out-of-coverageRel-14 06/2017 still open - LTE V2X
Table 3.2: Key features of the 3GPP UMTS and LTE specification releases[3GP17]
the 3GPP2 (not to confuse with the 3GPP without 2) is popular in NorthAmerica. Furthermore, the IEEE pursues an own line with the development of802.16 WiMAX. Not directly involved in the standardization, the ITU developsrecommendations about features for the systems. Their work is structured intogenerations. Hence, they have defined the well-known terms as 2G, 3G, 4G andso on. For comparison, UMTS and CDMA2000 are 3G systems. Even LTE inRel-8 and Rel-9 is still a 3G system. Only LTE-Advanced and later meet therequirements for 4G. In the latest releases, the UMTS/HSPA family also headstowards the 4G specification. Marketing-speak sometimes refers to the terms3.5G for HSDPA, 3.75G for HSUPA, or 3.8G for HSPA+ and so on, to distinguishenhancements towards earlier specifications. However, in the following, when theUMTS/HSPA and LTE systems are presented in closer detail, the generationterms are preferably avoided.
The prevalent user pattern for general purpose data traffic in cellular networksassumes as fast as possible transmissions of data bursts after asynchronousrequests. Moreover, the communication typically bases on unicast between twoparticipants. Consequently, the main improvements aim to optimize the systemsfor a higher capacity and also a shorter transmission delay [Sau13]. However,vehicular M2M communication use cases demand a different pattern, which canbe regarded with certain functions. With the perspective towards the Internet ofThings, particularly from Rel-9 on, interesting features for future machine type
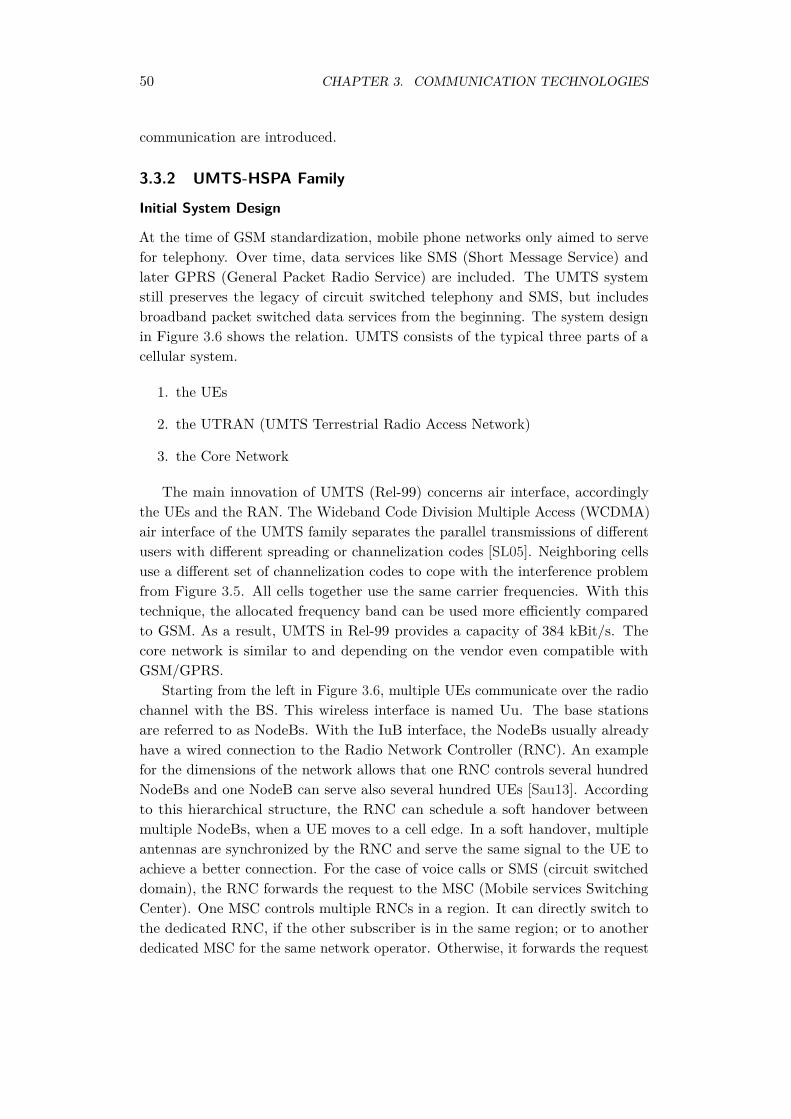
50 CHAPTER 3. COMMUNICATION TECHNOLOGIES
communication are introduced.
3.3.2 UMTS-HSPA Family
Initial System Design
At the time of GSM standardization, mobile phone networks only aimed to servefor telephony. Over time, data services like SMS (Short Message Service) andlater GPRS (General Packet Radio Service) are included. The UMTS systemstill preserves the legacy of circuit switched telephony and SMS, but includesbroadband packet switched data services from the beginning. The system designin Figure 3.6 shows the relation. UMTS consists of the typical three parts of acellular system.
1. the UEs
2. the UTRAN (UMTS Terrestrial Radio Access Network)
3. the Core Network
The main innovation of UMTS (Rel-99) concerns air interface, accordinglythe UEs and the RAN. The Wideband Code Division Multiple Access (WCDMA)air interface of the UMTS family separates the parallel transmissions of differentusers with different spreading or channelization codes [SL05]. Neighboring cellsuse a different set of channelization codes to cope with the interference problemfrom Figure 3.5. All cells together use the same carrier frequencies. With thistechnique, the allocated frequency band can be used more efficiently comparedto GSM. As a result, UMTS in Rel-99 provides a capacity of 384 kBit/s. Thecore network is similar to and depending on the vendor even compatible withGSM/GPRS.
Starting from the left in Figure 3.6, multiple UEs communicate over the radiochannel with the BS. This wireless interface is named Uu. The base stationsare referred to as NodeBs. With the IuB interface, the NodeBs usually alreadyhave a wired connection to the Radio Network Controller (RNC). An examplefor the dimensions of the network allows that one RNC controls several hundredNodeBs and one NodeB can serve also several hundred UEs [Sau13]. Accordingto this hierarchical structure, the RNC can schedule a soft handover betweenmultiple NodeBs, when a UE moves to a cell edge. In a soft handover, multipleantennas are synchronized by the RNC and serve the same signal to the UE toachieve a better connection. For the case of voice calls or SMS (circuit switcheddomain), the RNC forwards the request to the MSC (Mobile services SwitchingCenter). One MSC controls multiple RNCs in a region. It can directly switch tothe dedicated RNC, if the other subscriber is in the same region; or to anotherdedicated MSC for the same network operator. Otherwise, it forwards the request

3.3. CELLULAR COMMUNICATION NETWORKS 51
RNC
MSC
SGSN
PSTN
PDN
RNC
UTRAN
GERAN
Core Network PS Domain
CS Domain NodeB UE
GGSN
GMSC
Gi Gn
IuR
IuPS
IuB
IuB Uu
Uu
UE
UE
NodeB
HLR
VLR
Figure 3.6: Reference architecture of the UMTS network (Rel-99)
via the MSC at the edge of the core network - the Gateway MSC (GMSC) - to thePublic Switched Telephone Network (PSTN). All subscribers of one operator arestored in the Home Location Register (HLR). The knowledge about the subscriberposition can be queried from the Visitor Location Register (VLR). The circuitswitching functionality depends even on more components for authentication,billing etc., which also have been improved with later releases. A major innovationis the change to all-IP connections as the basis for the IP Multimedia Subsystem(IMS) in Rel-5. Due to clarity reasons, these components are not included in thefigure. For vehicular use cases, the packet switching functionality is anyway theinteresting one.
The procedure to exchange packets in UMTS shows the historical backgroundof telephone engineering. A UE attaches to the network at power on. After thisattach, the UE though can receive and send SMS or CS calls, but no packets. Still,it does not have an IP address. It needs to set up a UMTS bearer with the PacketData Protocol (PDP) context as one important building block. A PDP context isa tunnel, extending from the RNC via the Serving GPRS Support Node (SGSN)through the PS domain of the core network to the Gateway GPRS Support Node(GGSN). In the establishment procedure, the SGSN and GGSN determine thesubscriber settings as e.g. the maximum transfer rate from the HLR. The GGSNthen assigns a dynamic IP-address and creates the tunnel. The SGSN maintains asignaling connection in the control-plane to the UE and changes the RNC addressor even switches to another SGSN depending on the UEs mobility.
Figure 3.7 shows the protocol stack and the according interfaces for a typicaluser-plane packet transmission from an application on an Internet server - with
52 CHAPTER 3. COMMUNICATION TECHNOLOGIES
PDCP
RLC
MAC
GTP-U
UDP
IP
L2
L1
GTP-U
UDP
IP
L2
L1
GTP-U
UDP
IP
L2
L1
IP
GTP-U
UDP
IP
L2
L1
IP
L2
L1
UDP/TCP
L2
L1
App
UDP/TCP
IP
PDCP
RLC
MAC
PHY
MAC
PHY
UE NodeB RNC SGSN GGSN Server
Uu IuB IuPS Gn Gi
App
IP
UTRAN Core Network
Figure 3.7: Protocol stack of UMTS (Rel-99) for packet data transmission
the Internet as a synonym for all connected Public Data Networks (PDN) - to theUE [Sau13]. The server on the right side of the figure has the typical TCP/IPprotocol stack and always routes to the GGSN. The GGSN encapsulates the IPpacket via the GPRS Tunneling Protocol (GTP) and forwards it to the SGSN.The SGSN tunnels this packet again to the RNC. The RNC decapsulates the GTPpacket and uses the Packet Data Convergence Protocol (PDCP) for IP headercompression and the Radio Link Control (RLC) to ensure the reliable packettransmission to the UE. RLC basically uses Automatic Repeat reQuest (ARQ) toacknowledge the packets. Finally, the MAC protocol schedules the resources onthe radio channel jointly with the NodeB.
Communication Performance
The presented system design for UMTS induces an intrinsic latency for eachtransmission. For a similar constellation, a Round Trip Time (RTT) of 70-180 mscan be measured without the additional delay for the route through the Internet[SGV+09]. With 65-115 ms or 60-90 %, the RNC to UE connection contributesmost to this delay. The latency results either from the network topology or fromthe technology of the signaling and protocols.
In some topologies where cabling is too expensive NodeBs connect via possiblymulti-hop microwave direct antennas to each other and the network. This deploy-ment is still common as can be seen at the typical round antennas at a NodeBsite. Nevertheless, it is very delay expensive with the worst case RTT of 115 ms[SGV+09]. Traditional connections are specified via Asynchronous Transfer Mode(ATM) and fixed lines. Since ATM connections are limited to a capacity of2 MBit/s, they possibly can become the bottleneck for more capable air interfaces.
3.3. CELLULAR COMMUNICATION NETWORKS 53
The available capacity on a communication path is limited by the link with thelowest capacity. Today, ATM deployments decline in favor of all-IP networkswith 100 MBit/s or GBit/s Ethernet or even fiber optic links. In Figure 3.7,the layers L2 and L1 for the Gi-, Gn- and Iu-interfaces though can be eitherATM or Ethernet. Connection updates not only bring capacity improvementsbut also latency reduction. A reduction in the high range of single digit ms foreach interface is reported, making all together more than 20 ms [SGV+09]. Thisarrangement accounts for a similar improvement as the co-location of certainnetwork elements as 1) the RNC and the SGSN or 2) the SGSN and the GGSN,for faster routing.
Rel-7 publishes a further topology related update. The direct tunnel featureallows the SGSN to remove itself from the transmission chain in the user-planewhile still being in line in the control-plane. It creates one tunnel from the GGSNdirectly to the RNC and merely forwards the packets like a usual IP router.
Many improvements are related to the technology of the UTRAN. Rel-4introduces Robust Header Compression (RoHC) for the PDCP reduce the UDPand IP header size from 40/60 Byte to 1/3 Bytes for IPv4/v6. This featureaddresses particularly the header to payload ratio for smaller packets that aresent frequently, as vehicular CAMs.
With HSDPA in Rel-5, more intelligence for medium access scheduling isshifted to the NodeB. The introduced Hybrid ARQ (HARQ) supports the RLC-based ARQ approach for more direct and very fast packet reliability. According tomeasurements [SGV+09], the introduction of HSDPA results in nearly the half ofthe latency in the UTRAN. In general, the HSPA line, starting with HSDPA, is oneof the most important features ever specified for the UMTS family. It improvedthe system substantially, to the capability that is known today. WCDMA makesuse of channelization codes with different lengths to control the bearer data ratefor each user. The codes are derived from a code tree with orthogonal branches toreceive a length of 2 up to 512 in downlink and up to 256 in uplink. Shorter codesallow a higher data rate, but invalidate the remaining longer codes of their branch.Rel-99 specifies the shortest code length of 8 for one user. This length is in linewith the highest available user data rate of 384 kBit/s. The code length for a useris allocated in the bearer establishment phase. Theoretically, this static allocationscheme limits the number of users to eight to use the bearer with the highest datarate, practically to an even smaller number as the codes are shared with voice users.The dedicated channel lays waste in times when no packets are sent. HSDPA verymuch improves the allocation flexibility with the reduction of the TransmissionTime Interval (TTI) and the introduction of shared channels in downlink [Sau13]The TTI is the interval of a data block, which is channel-encoded and interleavedfor transmission. For this interval, the transmission parameters can be adjusted.A longer TTI improves the decoding possibilities of burst errors. A shorter TTI
54 CHAPTER 3. COMMUNICATION TECHNOLOGIES
allows for faster link response. The minimal TTI is 10 ms since UMTS Rel-99 and2 ms in HSDPA. Shared channels, as the name says, can be shared by multipleusers, where each user gets a scheduled time slot for its transmission. Thus,HSDPA allows a way faster adaption to the dynamics of the radio channel. Thetime spans with high SNIR values can be used more efficiently to increase thetransmission capacity according to Equation (3.4). For good SNIRs, HSDPAallows the utilization of higher order modulation. While UMTS specified QPSKto transmit 2 Bits with one symbol, HSDPA Rel-5 additionally allows 16-QAM(4 Bits/symbol) and 64-QAM (6 Bits/symbol) for good conditions. Due to theimprovements, HSDPA supports already 14.4 MBit/s peak data rates in downlinkfor the best radio channel conditions. HSUPA in Rel-6 enables similar featuresfor higher uplink rates.
Another step further is the introduction of Multiple Input Multiple Output(MIMO) antenna techniques. For example, 2x2 MIMO in Rel-7 uses two transmit-ter antennas and two receiver antennas to transmit two independent data streamssimultaneously, using the same carriers. The data rate increases with the numberof antennas, whereas 2x2 MIMO denotes a doubled rate.
Rel-8 specifies the carrier aggregation feature to utilize a higher bandwidthfor increased capacity - Equation (3.4). The initial method, known as dual cell,bundles two adjacent 5 MHz UMTS standard carriers for a 10 MHz band. TheHSPA+ multiflow feature in Rel-11 bases also on carrier aggregation. It revivesa feature that is omitted with the introduction of HSDPA. Due to the shift ofscheduling decisions to the NodeBs in HSPDA, soft handover between two cellsis not possible anymore as the scheduler coordination over the RNC would taketoo much time. Multiflow allows the aggregation of multiple independent datastreams on the same frequency carrier from two adjacent cells. Accordingly, itaims to improve the throughput at the edge of cells. Additionally, it can help tobalance uneven loaded cells as unused resources from the adjacent sectors can beassigned to the UEs in the handover region.
The presented features aim for the typical pattern where independent usersasynchronously request their own data transmissions. Furthermore, the MulticastBroadcast Multimedia Service (MBMS), which is already specified in Rel-6, deliversdata transmissions more efficiently to multiple users. MBMS is primary intendedto serve streaming and download use cases for UEs that signal interest in suchservices to the RNC. When the RNC receives a MBMS transmission, it employsthe counting mechanism for the number of interested UEs to determine whetherit is more economic to set up either multiple Point-To-Point (PTP) bearers orone Point-To-Multipoint (PTM) bearer. PTP bearers are transmitted alongsidewith other unicast traffic in the dedicated or shared channels, while PTM bearersuse the separate Forward Access Channel (FACH). For few recipients, the setupof multiple PTP bearers is more efficient as it allows HARQ feedback and link
3.3. CELLULAR COMMUNICATION NETWORKS 55
adaption to the respective UE, though it means a replication of the packets. Formore recipients, PTM bearers directly exploit the broadcast nature of the radiochannel that all UEs in the cell overhear the signal anyway. Nonetheless, PTMbearers need to employ a lower and more robust modulation to increase thepossibility of successful packet decoding at UEs with a low SNIR, which are e.g.at the cell edges. PTM bearers still include the chance of packet losses as it canmerely use Forward Error Correction. PTM bearers get a channelization codethat is shared for decoding by all addressed UEs. Rel-7 specifies an even moreadvanced MBMS version referred to as Multicast Broadcast Single FrequencyNetwork (MBSFN). UMTS/HSPA already has a frequency reuse factor of one,which means that all NodeBs operate at the same frequencies. In the MBSFNmode, all participating NodeBs in the area use the same channelization codes andsynchronize their packet scheduling for simultaneous transmission of the samePTM bearer. In this way, the UEs at the cell edges can benefit from multipleMBSFN signals to improve the packet delivery and avoid drops.
3.3.3 LTE (Advanced) Family
System Overview
Despite all improvements of the UMTS family with the introduction of the HSPAline, the change in the usage of mobile phone networks towards more data intensiveapplications raised the need for another major step to increase the system capacityand reduce the transmission delay. Therefore, the newly designed Evolved PacketSystem (EPS) envisions the evolution of the UTRAN and the core network[Cox14]. The activities for the Evolved UTRAN (eUTRAN) are named LongTerm Evolution (LTE). The activities for the Evolved Packet Core (EPC) arenamed System Architecture Evolution (SAE). However, marketing-speak earlypromoted the enhancements under the LTE labeling, which now has become thesynonym for the new overall system rather than EPS. Figure 3.8 displays thearchitecture of the new system.
The eUTRAN mainly improves two things. It introduces more spectrumefficient techniques to the air interface and it follows the HSPA approach to shiftmore intelligence (e.g. HARQ processing) to the evolved NodeB (eNodeB) to amajor extent.
Topologically, the eNodeB now combines the tasks of the NodeB and the RNC,so that the RNC is removed completely from the system. The eNodeBs use a newX2 interface to connect to each other and the S1 interface to connect to the EPC.Due to this topology change, all handovers have to be performed as hard handoversas there is no central scheduling instance anymore. Nevertheless, LTE-Advancedin the later releases specifies more sophisticated mechanisms to facilitate goodconnections for users at the cell edge. This work item is referred to as Coordinated
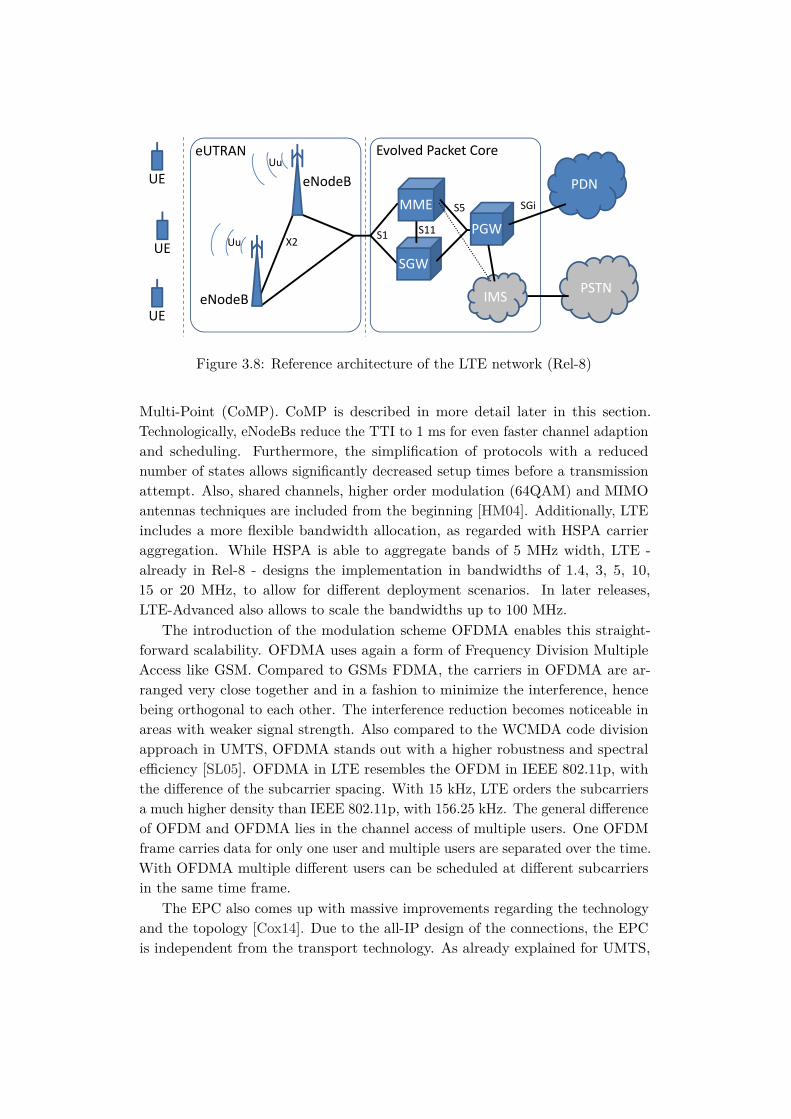
56 CHAPTER 3. COMMUNICATION TECHNOLOGIES
eUTRAN
eNodeB
X2
Uu
Uu
eNodeB
Evolved Packet Core
SGiS5
S1
SGW
MME
PGWS11
UE
PSTN
PDN
IMS
UE
UE
Figure 3.8: Reference architecture of the LTE network (Rel-8)
Multi-Point (CoMP). CoMP is described in more detail later in this section.Technologically, eNodeBs reduce the TTI to 1 ms for even faster channel adaptionand scheduling. Furthermore, the simplification of protocols with a reducednumber of states allows significantly decreased setup times before a transmissionattempt. Also, shared channels, higher order modulation (64QAM) and MIMOantennas techniques are included from the beginning [HM04]. Additionally, LTEincludes a more flexible bandwidth allocation, as regarded with HSPA carrieraggregation. While HSPA is able to aggregate bands of 5 MHz width, LTE -already in Rel-8 - designs the implementation in bandwidths of 1.4, 3, 5, 10,15 or 20 MHz, to allow for different deployment scenarios. In later releases,LTE-Advanced also allows to scale the bandwidths up to 100 MHz.
The introduction of the modulation scheme OFDMA enables this straight-forward scalability. OFDMA uses again a form of Frequency Division MultipleAccess like GSM. Compared to GSMs FDMA, the carriers in OFDMA are ar-ranged very close together and in a fashion to minimize the interference, hencebeing orthogonal to each other. The interference reduction becomes noticeable inareas with weaker signal strength. Also compared to the WCMDA code divisionapproach in UMTS, OFDMA stands out with a higher robustness and spectralefficiency [SL05]. OFDMA in LTE resembles the OFDM in IEEE 802.11p, withthe difference of the subcarrier spacing. With 15 kHz, LTE orders the subcarriersa much higher density than IEEE 802.11p, with 156.25 kHz. The general differenceof OFDM and OFDMA lies in the channel access of multiple users. One OFDMframe carries data for only one user and multiple users are separated over the time.With OFDMA multiple different users can be scheduled at different subcarriersin the same time frame.
The EPC also comes up with massive improvements regarding the technologyand the topology [Cox14]. Due to the all-IP design of the connections, the EPCis independent from the transport technology. As already explained for UMTS,
3.3. CELLULAR COMMUNICATION NETWORKS 57
the traditional ATM connections can become the bottleneck instead of the airinterface. In later releases, this improvement is also introduced to the UMTS corenetwork. Today, all connections are usually deployed with fast Ethernet or fiberoptic transport. The major topological update of the EPC is the sole facilitationof packet switched services. The complete CS domain from the previous corenetwork is omitted. The other evolution arises from the strong separation betweenthe user-plane and the control-plane. Basically, the user-plane incorporates theprotocols and functionalities to carry the actual network traffic, while the control-plane carries signaling traffic. In the UMTS direct tunnel feature, the SGSNfollows a similar concept to avoid one IP tunnel for user traffic forwarding. In theEPC, the functionality of the SGSN splits into two logical entities, the MobilityManagement Entity (MME) and the Serving Gateway (Serving-GW or simplySGW). Both components can be implemented on the same physical hardware.The MME is responsible for the control-plane. Consequently, it fulfills the tasks ofUE location tracking and bearer establishment. As the EPC is optimized for solepacket switched services, the bearer establishment is much simplified compared toUMTS. When a UE attaches at the EPC, it directly gets an IP address assigned.The bearer establishment now mainly selects the right gateway to the Internetand instructs the SGW about this selection. The user-plane responsibility of theSGW means mainly forwarding of IP packets to this gateway. This gateway to theInternet is referred to as PDN Gateway (PDN-GW or simply PGW) and basicallyfulfills the same task as the GGSN in UMTS. Similar to the GGSN functionality,the PGW hides the UE mobility to the attached Internet routers and administersthe IP address pool for address assignments to the registered UEs. As tunnelingprotocol, GTP is reused from the previous core network. In the EPC, the tunnelterminates directly at the eNodeB. The advantage of the new EPC architectureis a major reduction of the user-plane latency, which arrives in the single digitrange [SGV+09].
Feature Improvements
Similar to UMTS, the specifications in later LTE releases concern further latencyreductions and capacity enhancements. However, the high peak data rates can berealized only in good conditions and at locations close to the eNodeB [Cox14]. Thesignal quality at cell edges still exhibits impairments, due to the signal decrease athigher distances and the interference from adjacent cells. Thus, new features alsoconcern more efficient mechanisms to maintain a good signal at cell edges. CoMPaddresses any type of coordination between the radio communications in nearbycells. In the first instance, CoMP applies to the Downlink transmission. CoMPfeatures intend different levels of coordination. In a simple scenario, a singlethree-antenna eNodeB can coordinate the three schedulers for each cell. A moresophisticated scenario coordinates multiple eNodeBs via the X2 interface. Such
58 CHAPTER 3. COMMUNICATION TECHNOLOGIES
coordination allows the deployment of heterogeneous cellular networks (HetNets)with different cell sizes. In this way, HetNets use typical macro-NodeBs to havethe general coverage and deploy pico-NodeBs with smaller coverage inside thisnetwork to offload data at certain hot spots. The handover mechanisms betweenthis kind of cells is referred to as enhanced Inter-Cell Interference Coordination(eICIC). The standard specifies several varieties of CoMP. The main intention isan intelligent scheduling of user resource blocks to the appropriate frequenciesfor interference reduction. A variety named Joint Processing transmits the samedata from different locations, similar to the soft handover in UMTS. CoordinatedMIMO uses different data streams from different locations in a spatial multiplexing[HM04]. This feature is similar to HSPA+ multiflow.
The CoMP approaches basically address unicast communication. However,the intelligent coordination can also be applied for broadcast communication[Cox14]. In fact, eMBMS (enhanced MBMS) makes also use of coordinatedand synchronized transmissions from multiple eNodeBs for the MBSFN variety.The general concept of eMBMS and MBSFN is similar to the one which ispresented for the UMTS/HSPA family. Additionally, LTE introduces severalimprovements regarding the available bandwidths and the scheduling flexibility.LTE multiplexes both PTP and PTM bearers into the regular subframes of 1 msin the downlink shared channel, whereas it allows assigning up to 6 subframes(60 % of the resources) for MBMS. Hence, even PTM bearers can benefit fromHARQ feedback for a small the number of MBMS users in a cell. The feedbackaccordingly enables link adaption to the present radio conditions. For instance,LTE provides modulation schemes up to 64-QAM for good conditions. Regardingthe integration of MBSFN, LTE specifies subframes with an extended cyclic prefixto cope with different delay spreads when the same signal is sent from multipleeNodeBs. Finally, an eNodeB can schedule its MBMS subframes in a way to bepart of multiple MBSFN areas for an even more flexible integration of broadcastingservices.
3.3.4 Suitability for V2X Communication
The main features for the standardized cellular architectures are designed toaccommodate for a general purpose communication scheme. This scheme mainlyconsists of an unicast communication pattern on a managed channel. Before datatransmission can be carried out, the channel needs to be established initially.Then, the central NodeB schedules the up- and downlink for all registered UEs inthe cell. In this manner, the communication is contention-free. Accordingly, thedevelopment of cellular systems followed, for a long time, the three principles:
• Unicast communication pattern
• High data rates

3.3. CELLULAR COMMUNICATION NETWORKS 59
• Low latency, but tolerable connection setup delays
When compared to the application categories from Section 2.1, comfort andinfotainment use cases suite very well to this optimized user pattern for cellularsystems. However, M2M use cases for improvement of safety and traffic efficiencyexhibit different requirements.
The typical approach to concurrently inform all stations in a certain geographicarea would be realized with the help of one or multiple central servers, whichare located in the Internet. Several research projects as CoCar, simTD andCONVERGE implement a similar architecture. CoCar defines three components,namely the Reflector, the Geocast Manager, and the Aggregator [De09]. In simTD,the services for Reflection, Aggregation, Geocast Management, and Access areconsolidated in the GeoServer [sim09a]. CONVERGE introduces the latest andmost advanced concept. The architecture defines the Service Providers, connectedto the Geo Messaging Proxy, which in turn connects to multiple Geo MessagingServers [CON15]. This design allows the dissemination of information generatedand managed by stationary central stations (i.e. the service providers) as wellas the information exchange between the mobile stations (personal and vehiclestations).
For the exchange of typical CAMs and DENMs, the originating mobile stationtransmits the message with a specific geographical destination address to the GeoMessaging Server. Afterwards, the reflector component in the Geo MessagingServer delivers the message to all relevant stations in the designated area. Con-sequently, the transmission includes an uplink as well as a downlink part. Theuplink part is always a point-to-point connection, while the downlink part can berealized as point-to-point or point-to-multipoint. The single sent message typicallyaddresses to multiple receivers. It needs to be either replicated multiple times formultiple unicast connections or transmitted using the broadcast characteristics ofthe radio channel. Each of the directions can limit the communication performanceunder certain circumstances. The following sections discuss the different aspectswith the focus on latency and capacity limitations. Prior to that, the next sectionsreview the most important communication channels, which are in scope of thisevaluation.
Considered Physical Channels
In UMTS/HSPA and LTE, the traffic for signaling as well as user data is exchangedover different channels. All channels exhibit a limited capacity and can getcongested in certain cases.
PDSCH and PUSCH : The Physical Downlink Shared Channel (PDSCH) and,its counterpart, the Physical Uplink Shared Channel (PUSCH) carry the
60 CHAPTER 3. COMMUNICATION TECHNOLOGIES
user data for the according direction of the transmission. Obviously, thecongestion of these channels would limit the communication performance.
PDCCH : The Physical Downlink Control Channel is the most important controlchannel as it carries all management information from the NodeB to the UEs.The different types include mainly the downlink scheduling information, butalso instructions for uplink power control and, especially important, theuplink grants. Besides, random access responses and paging information aretransmitted over the PDCCH.
PUCCH : The Physical Uplink Control Channel has the purpose to carryuplink signaling information. To stay in the connected state, the UEperiodically sends Channel Quality Indications (CQI) to the NodeB forchannel estimation and link adaption. Additionally, the UE can acknowledgedownlink transmission for the HARQ protocol. Moreover, the UE uses thePUCCH for SRs (Scheduling Requests) when it wants to send own user datain the PUSCH.
PRACH : For the establishment of the connection from the idle state, UMTS aswell as LTE provide the Random Access Channels (RACH), each based on atime-slotted Physical RACH. More specifically, in UMTS the UE performsan open loop power control, which means that it repeatedly transmits apreamble with increasing transmission power until the acquisition is indicatedby the BS. In the following 10 ms or 20 ms frame, the UE can transmit asmall packet in the order of 20 to 80 Bytes, depending on the used spreadingfactor and frame length [BMA11]. UMTS allows up to 16 RACH to beconfigured by the network operators, but commonly only 1 RACH is used.The LTE procedure differs from the UMTS design, and already enablescollision resolution of the preambles. This concept allows reducing thelatency for the connection establishment.
Uplink Communication
For V2X use cases, the uplink communication performance can be limited forconnection latency and capacity requirements in the following ways.
Regarding the issues of latency, it is argued that the connection establishmentmay take too long, especially for safety-critical messages. Hence, reusing thePRACH for faster information transmission is suggested several times [BMA11,MKH10]. Nevertheless, the restriction of the maximum packet length on thePRACH in UMTS may be an issue even for the small data amounts in V2Xawareness messages. Longer packets than 80 bytes must be split up, involvingthe need for performing the RACH procedure for every part. LTE allows abetter scalability for longer packets, as the concept turns away from the dedicated
3.3. CELLULAR COMMUNICATION NETWORKS 61
transmission resources [MKH10]. For the transmission of event based informationin DENMs, the flexibility of fast random access may be preferable, at the pricethat only small amounts of data could be sent. In contrast, for the periodicaltransmission of awareness information in CAMs, the previous establishment of aconnection and regular signaling on the PUCCH could be the better alternative.
As a result of the small amounts of data for V2X messages, the transmissionin the PUSCH would be limited rather due to interference than capacity reasons[PRS11]. The interference increases with the number of vehicles to be servedin one cell. Yet, the main bottleneck for the uplink transmission of many smallpackets is the PDCCH when it cannot sufficiently carry all uplink grants. Witha message rate of 10 Hz, in LTE, the PDCCH limitation can be observed atapproximately 125 vehicles in one cell [PRS11].
Downlink Communication
The downlink communication is mainly challenged by the number of targetedrecipients. The traditional strategy of individual downlink unicast to everyrecipient would early lead to a highly loaded or even overloaded PDSCH whenthe number of vehicles increases [Vin12]. With a message rate of 10 Hz, in LTE,“the Downlink is limiting for already 50 vehicles per cell” [PRS11].
In contrast, the exploitation of broadcast features definitely increases theefficiency and reduces the load for such scenarios [ACC+13]. Still, in UMTS,MBMS offers low flexibility and response to the channel conditions. It comesat the price of the highest TTIs of 40 ms or 80 ms to provide a more robustsignal against fading characteristics. For the originally intended purposes of mediadelivery sessions or big file downloads, which are characterized by a constant datastream over a longer time, such TTIs are perfectly acceptable. In contrast, forthe relatively short safety-critical V2X message, an additional latency of 80 mswould be a considerable impairment and probably not tolerable. Moreover, thelatency introduced by the TTI includes only the RAN part. The way throughthe core network and the processing in the geo server would contribute for anadditional delay. On the other hand, LTE specifies massive improvements for theintegration of broadcasting services. The multiplex of PTM bearers alongsidewithin unicast bearers in the regular subframe with 1 ms TTIs provides the bestpossible flexibility for MBMS transmissions. Up to now, a very limited number ofcommercial networks are featured with MBMS. Media broadcasting over cellularnetworks is probably not the application of the greatest demand. Geographicalmessaging for V2X use cases is undoubtedly a reasonable use case to leverage thedeployment.
Another important aspect for the communication performance originatesfrom the implementation of the geo messaging server. Intelligent algorithms foraggregation and duplicate filtering before reflection can considerably reduce the
62 CHAPTER 3. COMMUNICATION TECHNOLOGIES
data amount for the downlink transmission chain [PRS11, ACC+13].
Sidelink Communication
Obviously, direct communication between the mobile stations, also known assidelink, allows the most considerable latency reduction, instead of going all the wayin the uplink and downlink. With the emergence of the Internet of Things, machinetype communication becomes more important and standardization activities of the3GPP accelerate in this direction. Under the feature name LTE-direct, the latestRel-12 includes aspects of Device-2-Device (D2D) communication [DRW+09]. Theinitial study is about D2D proximity services mainly focusing on public safetyuse cases [LAGR14]. One scenario envisions the mutual detection of a directservice. Additionally, the possibly offloading of data traffic between the devicesto other wireless technologies as Bluetooth or even WLAN. However, servicediscovery for D2D communication in Rel-12 operates only in the band of theserving NodeBs. Moreover, it allows only for limited mobility. Rel-13 adds theoption for serving UEs outside of the eNodeBs coverage area with a relay UEto forward the messages. This relay mode also enables service continuity forhigher mobility scenarios. Finally, Rel-14 will directly address V2X scenarioswith a feature set called LTE-V2X [LKK+16]. Rel-14 and LTE-V2X is still awork-in-progress feasibility study. However, it will need to answer very importantquestions such as the operation in in-coverage and out-of-coverage scenarios,different communication paths using either D2D sidelink or uplink and eNodeBbroadcasting via eMBMS mechanisms, as well as the direct communication betweendifferent mobile operator networks.
Conclusion
All in all, for the end-to-end latency of V2X messages in LTE, round trip timesthat are considerably below 100 ms seem possible [WCML07, MKH10, PRS11].Regarding capacity issues, LTE should be able to handle a sufficient number ofvehicles. In contrast, UMTS would use a non-negligible amount of resources andwould lead to quite high latencies of up to 350 ms on average [MKH10, BMA11].In comparison, for 802.11p round trip times of 10 ms are commonly assumed.
A high traffic load in the cell for V2X communication would also have aneffect on the other users with smartphones and surf sticks, which need to sharethe resources. Finally, the presented features of MBMS and D2D are of interestto improve the efficiency for V2X communication use cases. Nevertheless, forpractical use, an important formal issue needs to be solved in advance. A solutionneeds to be found for the fact that different stations may be in contract withdifferent network operators. Actually, every network operator has a separatedinfrastructure deployed, which is not compatible for scheduling of MBMS or D2Dframes with other networks.

3.4. SUMMARY OF COMMUNICATION TECHNOLOGIES 63
In contrast to ad hoc communication over WLANs, the operation of UMTS orLTE networks is not for free. Hence, suitable business models need to be developedto encourage the use of cellular networks for V2X applications [ACC+13]. Besidesthe already established comfort use cases, probably, traffic efficiency use cases withmore relaxed timings are the first to be implemented with cellular communicationbefore the safety-critical use cases.
3.4 Summary of Communication Technologies
With the unmanaged ad hoc communication according to IEEE 802.11p and theinfrastructure based cellular systems of UMTS and LTE, this chapter discussedthe two prevalent access technologies for V2X communication. Each technologyhas its own advantages and disadvantages. A principle of ad hoc communicationis the exploitation of the broadcast characteristics of the radio channel. This goeswell in line with the communication pattern of most V2X applications and resultsin typically low transmission delays. Unfavorably, the standard medium accesscoordination of IEEE 802.11p is not always reliable and can lead to recurringpacket losses. Regular messages would accordingly need a higher sending periodto compensate this drawback and achieve timely information refresh. Anotherdisadvantage is the limited communication range. For the aspects of reliability andcommunication range, cellular systems exhibit significant advantages. Nonetheless,current systems of UMTS and also LTE introduce a notable transmission delaydue to the possibly large wired backbone system. For these reasons, a feasiblesolution would implement time-critical applications with ad hoc access, whileapplications that require a higher dissemination area could be realized with cellularsystems. The simulation study in Chapter 5 will evaluate if this approach to relyon heterogeneous networks proves beneficial. Before this investigation could bestarted, the simulation environment will be prepared, whereas the emphasis lieson the communication characteristics of the ad hoc and cellular technologies. Thenecessary implementations are discussed in the next Chapter 4.

Chapter 4
Simulation Environment
This chapter gives an overview about the work to set up the environment for thesimulation of heterogeneous vehicular communication use cases. The work bases onthe existing simulation framework VSimRTI, which is introduced in the first section.The second and the third part present a site-specific as well a statistic approachwith the emphasis on more detailed radio propagation, which regard particularlyfor the ad hoc communication. Finally, a new dedicated simulator for the mostrelevant aspects of cellular communication is introduced. For all extensions on theenvironment, a dedicated simulation study presents the improvements, which canbe achieved by modeling the additional aspects.
4.1 Existing Framework
Generally, the simulation of ITS incorporates different domains. In this thesis,the simulation study on ITS primarily regards for the investigation of V2Xcommunication protocols and applications. For such purposes, the academicresearch community employs and develops discrete event simulators to coverthe major aspects. Today, the most prominent representatives are ns-2 and itssuccessor ns-3 [HLR+08], OMNeT++ [VH08] and even JiST/SWANS [BHvR05].These communication simulators are designed for different fields of communicationresearch. For instance, they allow the investigation on the different layers ofthe communication stack. Moreover, they can be applied in different scenariosfrom small-scale to large-scale, where several hundreds or thousands of nodes areaccounted.
However, meaningful investigations of ITS also need to incorporate realisticvehicular mobility patterns [HL10]. The state-of-the-art communication simula-tors as ns-3 or OMNeT++ already include basic mobility models with randomwaypoints or linear movements. One step further goes the offline generation of
65
66 CHAPTER 4. SIMULATION ENVIRONMENT
vehicular traces with dedicated traffic simulators before the actual simulation ofthe communication scenario. The academic SUMO [KEBB12] and the commercialVISSIM [FV01] are well-known instances for microscopic traffic simulators, wherethe movement of each vehicle is regarded individually. Still, this kind of sharingtraffic patterns with the communication simulators is isolated and does not allowa further interaction between the communication and the traffic simulator [HL10].More comprehensive simulation studies demand the interaction of the differentsimulators at runtime. For instance, the event when a vehicle receives informationover V2X communication as a result of the communication simulation and dynam-ically adapts to this particular situation with slowing down or changing its routeneeds to be fed back into the traffic simulation. The following two interactionconcepts enable such scenarios [HL10].
The Direct (Embedded) architecture intends to embed either a traffic sim-ulator in a communication simulator or vice versa. This approach actuallybases on a bi-directional coupling of the two simulators, where each simulatorstill preserves the own event processing mechanisms. One simulator acts asthe master for the information exchange and time synchronization. It needsto ensure that all events in both simulators are processed in the correctorder.
The Federated architecture bases on a central Runtime Infrastructure (RTI)that connects to each federated simulator via an ambassador interface. Thisapproach is not limited to the coupling of two simulators, but allows theintegration of multiple ones. The simulators only exchange information withthe RTI. The RTI handles all further management tasks as for the informa-tion distribution towards the other simulators and the time synchronizationof the simulation events.
Today, several multi-domain simulation environments exist for ITS evaluation.The following four tools are the most prominent ones.
• Veins [SYGD08]
• VISSIM-VCOM [KSEH+07]
• iTETRIS [HCK+11]
• VSimRTI [QSR08]
The Veins framework follows the direct interaction concept. It uses thecommunication simulator OMNeT++ as the master and synchronizes the trafficsimulator SUMO at regular time steps. According to the Veins concept, theITS application logic is implemented in OMNeT++ as a module on top of the
4.1. EXISTING FRAMEWORK 67
communication stack. The VISSIM-VCOM also employs the embedded approach,whereas it interchanges the roles of the simulators. With the VCOM module, thetraffic simulator VISSIM embeds a basic communication simulator and supportsfundamental applications.
The iTETRIS project developed an architecture with a hybrid interactionconcept. It supports the connection of the communication simulator ns-3, thetraffic simulator SUMO, and multiple ITS applications to the iTETRIS ControlSystem (iCS). The iCS handles the interaction between the simulators and theapplications. Besides the simulation control, the iCS also implements applicationfacilities according to the ETSI ITS standards.
VSimRTI is a development from previous work at the department [QSR08].The architecture follows the federated interaction approach with VSimRTI as theruntime infrastructure. More specifically, it uses the most important concepts fromthe IEEE standard for Modeling and Simulation (M&S) High Level Architecture(HLA) [IEE10a]. According to this specification, all participating simulators areencapsulated in a federate and connect via an ambassador interface with thecentral management entity, which is the RTI. VSimRTI implements the followingthree core components from the complete set of interface categories in HLA.
The Federation management: VSimRTI controls the lifecycle of all connectedfederates in the simulation. It starts, joins and stops the individual simulatorsin the configured time frame.
The Interaction management: VSimRTI coordinates the message interac-tions between the federates. All federates only communicate with VSimRTIin the first instance. VSimRTI then distributes the messages to the federates,which have subscribed to the according information.
The Time management: VSimRTI regulates the synchronization between theindependent processes of the simulation federates. In a joint procedure withthe federates, VSimRTI grants the time advances for the local events thatare either originated by a simulator itself or generated remotely by the othersimulators in the federation.
Today, VSimRTI is vitally used for the evaluation of ITS applications toimprove safety and efficiency in road traffic [SWR10] and enhanced with furtherfeatures [Sch11]. During the time of this thesis, a comprehensive set of simulatorsand related components from specific domains is coupled to VSimRTI. Dependingon the investigated scenario, the simulators can be exchanged flexibly. Thefollowing fields are covered with individual simulators:
• Traffic simulators: SUMO, VISSIM
• Ad hoc communication simulators: JiST/SWANS, ns-3, OMNeT++
68 CHAPTER 4. SIMULATION ENVIRONMENT
• Cellular communication simulator: VSimRTI_Cell
• Application simulator: VSimRTI_App
• Environment event generators
• Electricity simulators: VSimRTI_BattSim, VSimRTI_Charge, OpenDSS
• Configuration and visualization tools
VSimRTI is the basis of the simulation investigations in this thesis. Partic-ularly, OMNeT++ for ad hoc communication and VSimRTI_Cell for cellularcommunication simulation received substantial enhancements from the researchand development that is connected with this thesis.
The following three sections accordingly refer to this work. Each sectionintroduces a new feature set and illustrates the extensions on the basis of anexemplary simulation study.
4.2 Site-specific Propagation Models
Especially in urban environments, the presence of buildings leads to shadowingproperties of the radio signal. In traditional propagation models, these propertiesare described with stochastic processes. However, for the evaluation of warninguse cases where every individual message is important, stochastic models maybe too simplistic. Shadowing due to buildings leads to a low reception qualityin particular constellations of transmitter, receiver and buildings (see the hiddenterminal scenario in Figure 3.4b).
This section introduces site-specific propagation models to account especiallyfor such scenarios [PSR14a]. The models base on efficient ray tracing techniquesto identify the locations of buildings in the surrounding of the transmitter. Theyconsider the effects of shadowing, penetration and diffraction to achieve a moreaccurate result. The following simulation analysis for the use case of the warningof Approaching Emergency Vehicles (AEV) compares the developed propagationmodels with a commonly used stochastic model. The AEV warning stands repre-sentative for the class of safety applications where moving vehicles permanentlycommunicate their current state. According to the ETSI road safety model, theAEV warning addresses the information zone, which means a high range commu-nication range with medium critical timing requirements. The simulation willshow that the stochastic model leads to overoptimistic propagation conditions inthe investigated scenario. In contrast, a more credible result for the performanceof the AEV warning can be achieved when the site-specific models are applied.Before this, the next part briefly resumes the prevalent approaches for propagationmodeling.
4.2. SITE-SPECIFIC PROPAGATION MODELS 69
4.2.1 Modeling Approaches
As stated in the previous Chapter 3.1, the possibility for successful reception ofthe radio signal depends on the signal power and the spread of the individualmultipath components towards frequency and time. Hence, propagation modelscommonly regard at least for the path loss of the signal. More detailed modelsalso consider the fading characteristics. The prevalent approaches for modelingcan be divided into the following categories [Rap02, MTKM09].
• Analytical models
• Stochastic models
• Empirical or Statistical models
• Ray Optical models
Free Space Propagation Model
The Free Space Propagation Model is the most simplified analytical model. Itbases on the assumption of a clear and unobstructed LOS path between thetransmitter and the receiver. With the free space path loss Lp = Lfs fromEquation (3.3) this model calculates the received power Pr as
Pr = PtGtGrλ2
(4π)2d2Lo(4.1)
where Pt is the transmitted power. Gt and Gr are the antenna gains oftransmitter and receiver respectively. The free space path loss depends on thewavelength λ of propagating wave and the distance d between transmitting andreceiving node. Other losses which may be not directly related to propagation areexpressed with Lo. This equation is commonly known for a long time as the Friisequation [Fri46].
For link budget calculation, Equation (4.1) is usually written in the decibelnotation. One gets the following form.
Pr[dB] = Pt[dB] +Gt[dB] +Gr[dB]− Lo[dB]− Lfs[dB] (4.2)
The link budget notation in Equation (4.2) is also typical for empirical propa-gation models. Moreover, it will be used for the presentation of the developedsite-specific models later in this section.
Two Ray Ground Reflection Model
The slightly more detailed analytical Two Ray Ground Reflection Model considersthe superposition of the direct path from the Free Space Model and a second path,

70 CHAPTER 4. SIMULATION ENVIRONMENT
which is reflected from the ground. The important factor for the reception qualityis the phase shift as a result of the length difference between the both paths. Thefollowing Equation (4.3) represents the general notation on the left side and thenotation after the application of a Taylor series approximation on the right side.
Pr = PtGtGrLoLp
sin2(2πhthr
λd
)2→ Pr = PtGtGr
(hthrd2
)2(4.3)
The Two Ray Ground Reflection Model additionally depends on the antennaheights ht and hr of the transmitter and the receiver towards the ground.
Rayleigh and Rice Fading Models
The Rayleigh and the Rice Fading Models are the best known models to accountfor fast fading characteristics. These stochastic models understand fading as arandom process and apply the Rayleigh or Rice probability distribution.
Rayleigh Fading occurs when the multipath components at the receiver exhibitnearly the same amplitude, but different delays. In other words, Rayleigh Fadingregards for conditions without a strong LOS path. The characterizing probabilitydensity function f for the according Rayleigh distribution depends on the distanced between the transmitter and the receiver and the local power σ at the receiver.
f(d) = d
σ2 e− d2
2σ2 (4.4)
Rice Fading is basically a generalization of Rayleigh Fading and considers alsoLOS conditions. More specifically, it accounts for one strong direct signal andmultiple NLOS signals with weaker contribution. This assumption goes well alongwith the general understanding that (1) partial signal energy from indirect pathsis absorbed through reflection and (2) a longer reflected path implies a higherattenuation. The Ricean K-factor defines the relation between the dominant LOSpath and the additional NLOS paths. The distribution is given as follows.
f(d) = d
σ2 e−(d2+K2
2σ2
)I0
(Kd
σ2
)(4.5)
The special case K = 0 implies that no LOS path exists. With the Besselfunction I0(0) = 1, Equation (4.5) transforms into Equation (4.4) in this case.Hence, Rice Fading transforms into Rayleigh Fading, which is usually applied forNLOS conditions.
Log-Normal Shadowing Model
The Log-Normal Shadowing Model in Equation (4.6) is a stochastic model, par-ticularly suited for slow fading or shadowing characteristics.

4.2. SITE-SPECIFIC PROPAGATION MODELS 71
Lp(d)[dB] = Lp(d0) + 10nlog(d
d0
)+Xσ (4.6)
This model bases on a calculated or measured reference path loss at thedistance d0 and a more generalized log-distance path loss with the exponent n(e.g. with n = 2 in free space). Moreover, it introduces a Gaussian distributedrandom variable Xσ with the standard deviation of σ to account for the severityof shadowing conditions.
Empirical Models
Empirical or statistical models are derived from real world measurements of exem-plary communication processes with equipment referred to as Channel Sounders.As an advantage, the measurement approach accounts for all characteristics ofthe radio channel. Even aspects that are not entirely understood or analyticallymodeled can be considered. Thus, empirical models are able to outperform theprior models, which always abstracted from particular details. However, empiricalmodels need to respect that the channel characteristics depend highly on proper-ties as the antenna design, the transmission frequency, the investigated terrainprofiles and others. Due to this, the particular models usually exhibit a limitedrange of application for specific scenarios.
The Okumura-Hata model is a widely known empirical model. It bases ona measurement campaign, performed by Okumura et al. in the urban area ofTokyo [OOKF68]. From these measurement recordings, Hata derived three linkbudget equations for the median path loss in the environments of typical urban,suburban and open areas [Hat80]. The European Cooperation in Science andTechnology (COST), which has a strong background in propagation modeling,developed and published a variety of suitable models. The COST Hata modelas an extension to the Okumura-Hata model is probably one of the most citedmodels from the COST action 231 [DCe96]. Furthermore, the ITU-R maintains aseries of recommendations for propagation modeling, which also includes empiricalmodels [ITU13].
The advanced propagation models, introduced to the simulation framework inSection 4.3, are statistical models as well.
Ray Optical Models
Ray Tracing has its origin in the area of computer graphics for image or scenerendering. Moreover, the approach can be applied for the simulation of electromag-netic field propagation. The propagation itself is described by multiple rays or raytubes, which are launched from the transmitter node in a dedicated angle, withan initial strength of the electromagnetic field. This method even allows modelingparticular antenna characteristics. For instance, an omnidirectional antenna can
72 CHAPTER 4. SIMULATION ENVIRONMENT
launch 36 rays in the interval of 10 degrees with equal field strength. A higherresolution can be achieved with more rays, at the price of higher computation costs.In a fully fletched ray tracing model, each ray is traced through a binary treeduring the propagation [LB98]. Depending on the implementation, geometricalmethods or even approximations for Maxwell’s equations are used to calculate thephenomena of the radio propagation. Reflection is represented as a node in thistree, with a reflected and penetrating part. The direction of the emergent ray iscalculated with Snell’s law. Diffraction leads to the generation of a set of new raytubes, according to Huygens’ law. In particular, diffraction leads to a recursiveprocess with the result of a high computational load in according environments.The ray tracing procedure finishes either when the ray arrives at a receiver; a rayleaves the simulation area or when the electromagnetic field strength falls below acertain threshold (e.g. the noise floor).
Ray tracing requires a detailed description of the scenario with the accordingscatterers to show its strength. Otherwise, it could be simply displaced with moresimplified models, which are computationally less demanding.
The developed propagation models in this section find a solution to thechallenges of ray tracing in larger scale scenarios. With an efficient environmentrepresentation and a reduced number of launched rays, they exhibit the accuracyadvantages of ray tracing at low computational complexity.
4.2.2 Developed Models
As already mentioned, one key prerequisite for ray tracing is the detailed descrip-tion of the scatterers in the scenario. Prior to the presentation of the propagationmodels themselves, a brief introduction should be given particularly about therepresentation of buildings in the simulation environment.
Building Representation
The source for all map data in the simulation is OpenStreetMap (OSM) [HW08,Ope14]. The map data includes certainly the street network for the vehiclemovement simulation as well as buildings, which are employed as the scatterers forthe radio propagation simulation. OSM basically implements a two-tier conceptto represent the location and the shape of any map object.
1. It locates Nodes on the earth’s surface with a defined position using geo-graphic latitude and longitude coordinates.
2. It defines Ways by referencing an ordered list of nodes. Ways can definepolylines to represent linear objects as roads, and polygons to representareas.
4.2. SITE-SPECIFIC PROPAGATION MODELS 73
The third basic elements in OSM - Relations - specify the correlation betweenmultiple basic elements and can be used for multiple purposes, as the definition ofturn-restrictions or bus routes. However, for the building definition, only Nodesand Ways are needed. In particular, for buildings the first and the last entry of theordered list of nodes refer to the same node to complete the loop for the polygonthat represents the area of the building. The accordingly defined ways correspondto the walls of the building, while the used nodes are basically the corners.This representation is directly adopted for the site-specific simulation models.Furthermore, the building information is augmented with a so-called abstractedarea. The abstracted area can be seen as a rectangle with the maximum expansionof the building. When the propagation models need to calculate the signalreception, they initially fetch all buildings in the vicinity of the communicatingnodes. More specifically, they query all buildings where the abstracted area iswithin the area between the transmitter and the receiver.
The existing data are structured into a database with three tables.
• Corners: contains the 2-dimensional position information for each corner
• Walls: contains the reference corners as well as the corresponding building
• Buildings: contains the abstracted area information of the building
The vector based representation of the building and map geometries allow asignificant reduction of the number of rays for the models. Hence, the impacton the computing effort is still within reasonable limits. The Shadowing and thePenetration Model will actually need only one ray. The Diffraction Model willneed to launch multiple rays to determine the according diffraction corners of thebuildings.
Shadowing Model
The Shadowing Model is the simplest one of the presented site-specific models.After the first step of fetching all buildings according to their abstracted area,it draws one single ray between the transmitter and possible the receiver. Thistechnique is also referred to as Primary Ray Tracing [Rap02]. In geometricalsense, it calculates a line segment [TxRxn] between the current positions of thetransmitter and the receiver.
The actual determination of the reception consists of a nested loop over allwalls of all fetched buildings in the vicinity. When an intersection of the linesegment [TxRxn] and an according wall is calculated, the signal is consideredas shadowed. For this reason, the Shadowing model returns the most restrictivereception conditions. The advantage of the Shadowing Model lies in its computingefficiency. When the first intersecting wall is found, the nested loop can break and
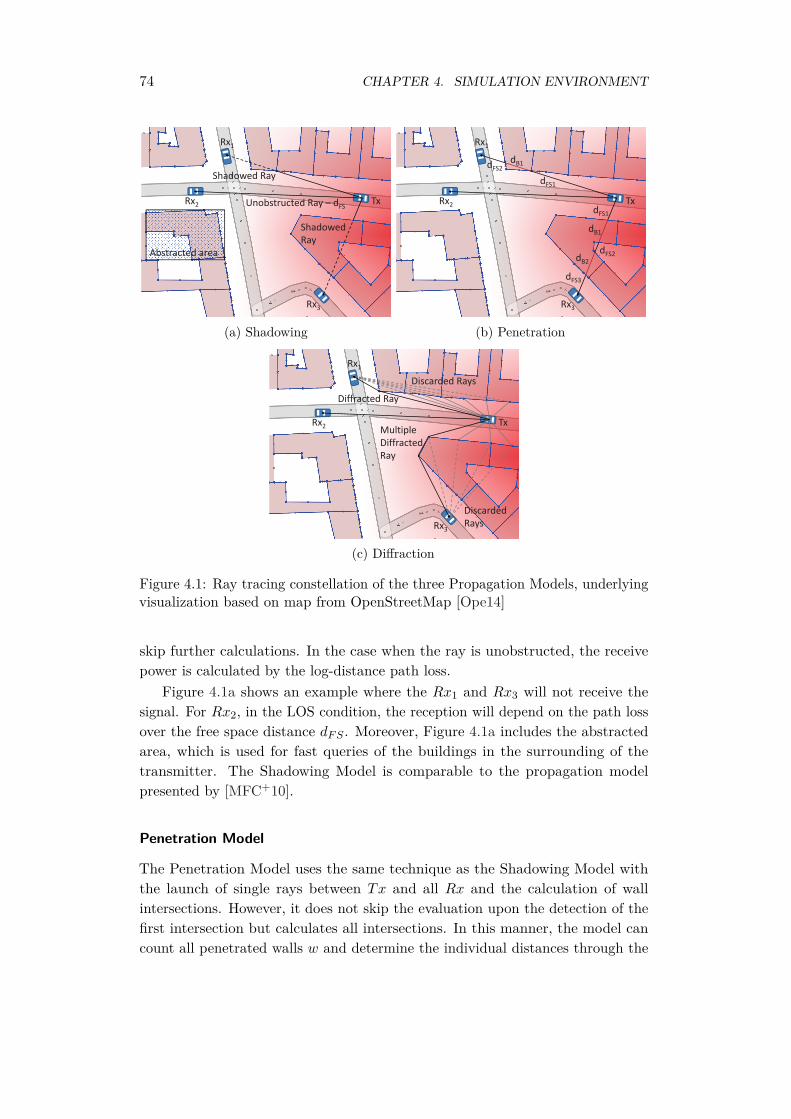
74 CHAPTER 4. SIMULATION ENVIRONMENT
Abstracted area
Tx
Rx1
Rx2
Rx3
Shadowed Ray
Unobstructed Ray – dFS
ShadowedRay
(a) Shadowing
Tx
Rx1
Rx2
Rx3
dFS1
dB1dFS2
dFS1
dB1
dB2dFS2
dFS3
(b) Penetration
Rx1
Rx2
Rx3
Tx
Diffracted Ray
Discarded Rays
DiscardedRays
MultipleDiffractedRay
(c) Diffraction
Figure 4.1: Ray tracing constellation of the three Propagation Models, underlyingvisualization based on map from OpenStreetMap [Ope14]
skip further calculations. In the case when the ray is unobstructed, the receivepower is calculated by the log-distance path loss.
Figure 4.1a shows an example where the Rx1 and Rx3 will not receive thesignal. For Rx2, in the LOS condition, the reception will depend on the path lossover the free space distance dFS . Moreover, Figure 4.1a includes the abstractedarea, which is used for fast queries of the buildings in the surrounding of thetransmitter. The Shadowing Model is comparable to the propagation modelpresented by [MFC+10].
Penetration Model
The Penetration Model uses the same technique as the Shadowing Model withthe launch of single rays between Tx and all Rx and the calculation of wallintersections. However, it does not skip the evaluation upon the detection of thefirst intersection but calculates all intersections. In this manner, the model cancount all penetrated walls w and determine the individual distances through the
4.2. SITE-SPECIFIC PROPAGATION MODELS 75
buildings db. Accordingly, dfs is the distance the signal travels through the freespace (see Figure 4.1b). The Penetration Model bases on the path loss equationfor link budget calculation. The formula is extended to sum up all partial lossesalong the primary ray and turns out like Equation (4.7).
Lp(d)[dB] = Lp(d0) + 10nlog(dfsd0
)+∑
(αdb + βw) (4.7)
Compared to the restrictive Shadowing Model, the Penetration Model includesmore physical details, yet it is computationally still inexpensive. In fact, thismodel yields very accurate results, when the attenuation factors α (signal lossper meter of the building interior) and β (signal loss at one building wall) areselected appropriately [Rap02]. It already exists a wide range of attenuationfactors, measured at different frequencies [Rap02]. Even for the preferable rangeat 5.85 GHz, detailed measurement campaigns for further collections are realized[DRX98]. The Penetration Model shows similarities to the model presented by[SEGD11], with a slightly different usage of the attenuation factors.
Diffraction Model
The Diffraction Model is already more complex. The Fresnel geometry of diffrac-tion requires multiple rays to determine the diffraction corner when the direct pathbetween transmitter and receiver is obstructed (see Figure 4.1c). The Huygensprinciple states that a new wave source originates at the point of diffraction.According to this, the Diffraction Model assumes a tuple of an initial ray fromthe Tx to the building corner and a second ray from the corner to the Rx for allpotential corners in the setting. Most of the ray tuples can be discarded at thisstep as they would end in an obstruction again. The remaining tuples are usedto calculate the Fresnel-Kirchhoff diffraction parameter v [Rap02]. The v-valueis then applied to the Knife-Edge Diffraction Model provided by Lee to receivethe diffraction loss Ld for the individual corner [Lee97]. Finally, the path withthe smallest diffraction losses on the way is selected to be applied in the modifiedpath loss Equation (4.8).
Ld(d)[dB] = Lp(d0) + 10nlog(dfsd0
)+∑
Ld(v) (4.8)
4.2.3 Simulation Study
In the following section, the three developed propagation models are appliedfor the investigation of the V2X communication use case for an ApproachingEmergency Warning (AEV). The focus of this investigation lies on the comparisonof the developed site-specific propagation models with a stochastic modelingapproach, represented by the Log-Normal Shadowing Model. This study usesmainly the following three simulators.

76 CHAPTER 4. SIMULATION ENVIRONMENT
• The Communication Simulator (OMNeT++ with INETMANET), includingall needed propagation models.
• The Application Simulator (VSimRTI_App) for the applications on theroad user vehicles as well as the emergency vehicle (EV). The applicationsare explained in the first part of this section.
• The Traffic Simulator (SUMO) to create a realistic traffic situation. Thescenarios are presented in the second part of this section.
Applications
The AEV warning use case comprises two different groups of actors, namely theEV itself as a sender and the other vehicles to be informed about the EV asreceivers [BSKW09]. When an emergency vehicle needs to inform others about itsright-of-way, the sequence of action includes four steps. The EV (1) prepares therelevant information and (2) disseminates the warning messages. Upon reception,the other vehicles (3) determine their relation to the EV and (4) possibly informor warn the driver. On the side of the road user vehicles, a fifth step would includethe message forwarding to further vehicles. This step is not used in the currentstudy as the evaluation focuses the influences of the propagation models on theeffectiveness of the warning application. The investigated applications implementthe following algorithms:
The Emergency Vehicle (1) prepares a cooperative awareness message (CAM)and includes the information of the own position, the current speed andthe heading in the warning message. Optionally, it can include its drivingroute. However, with the additional route information, the message lengthwould increase accordingly and thus the probability of a message collision.For this reason, as well as privacy issues, it is proposed to include only apartial route [BSKW09]. Finally, the need for the right-of-way is included todistinguish the warning message from regular CAMs. (2) The messages aresent periodically via the ETSI ITS CAM sending mechanism with regularlyupdated values of the included information [ETS14a].
The Road User Vehicles (3) first calculate the own area in relation to theEV. More specifically, the vehicles compare the trajectories of the receivedinformation from the EV and the own current state to calculate a time-to-approach (TTA). As the trajectory comparison can contain deviations,the algorithm includes a tolerance margin, particularly for the speed andheading component. This means, that a set of slightly different trajectoriesis compared to calculate a safe TTA. Obviously, with smaller distances and ahigher frequency of message receptions from the EV, the differences betweenthe alternative trajectories also decrease and the TTA calculation gets very
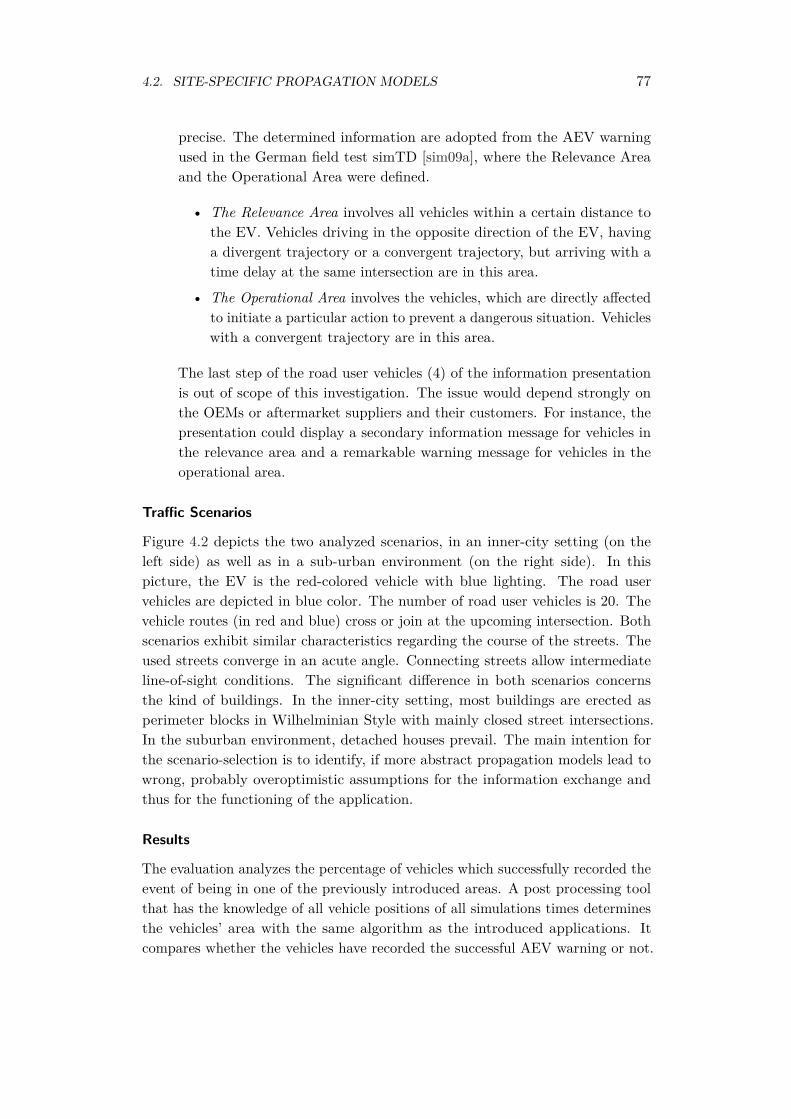
4.2. SITE-SPECIFIC PROPAGATION MODELS 77
precise. The determined information are adopted from the AEV warningused in the German field test simTD [sim09a], where the Relevance Areaand the Operational Area were defined.
• The Relevance Area involves all vehicles within a certain distance tothe EV. Vehicles driving in the opposite direction of the EV, havinga divergent trajectory or a convergent trajectory, but arriving with atime delay at the same intersection are in this area.
• The Operational Area involves the vehicles, which are directly affectedto initiate a particular action to prevent a dangerous situation. Vehicleswith a convergent trajectory are in this area.
The last step of the road user vehicles (4) of the information presentationis out of scope of this investigation. The issue would depend strongly onthe OEMs or aftermarket suppliers and their customers. For instance, thepresentation could display a secondary information message for vehicles inthe relevance area and a remarkable warning message for vehicles in theoperational area.
Traffic Scenarios
Figure 4.2 depicts the two analyzed scenarios, in an inner-city setting (on theleft side) as well as in a sub-urban environment (on the right side). In thispicture, the EV is the red-colored vehicle with blue lighting. The road uservehicles are depicted in blue color. The number of road user vehicles is 20. Thevehicle routes (in red and blue) cross or join at the upcoming intersection. Bothscenarios exhibit similar characteristics regarding the course of the streets. Theused streets converge in an acute angle. Connecting streets allow intermediateline-of-sight conditions. The significant difference in both scenarios concernsthe kind of buildings. In the inner-city setting, most buildings are erected asperimeter blocks in Wilhelminian Style with mainly closed street intersections.In the suburban environment, detached houses prevail. The main intention forthe scenario-selection is to identify, if more abstract propagation models lead towrong, probably overoptimistic assumptions for the information exchange andthus for the functioning of the application.
Results
The evaluation analyzes the percentage of vehicles which successfully recorded theevent of being in one of the previously introduced areas. A post processing toolthat has the knowledge of all vehicle positions of all simulations times determinesthe vehicles’ area with the same algorithm as the introduced applications. Itcompares whether the vehicles have recorded the successful AEV warning or not.
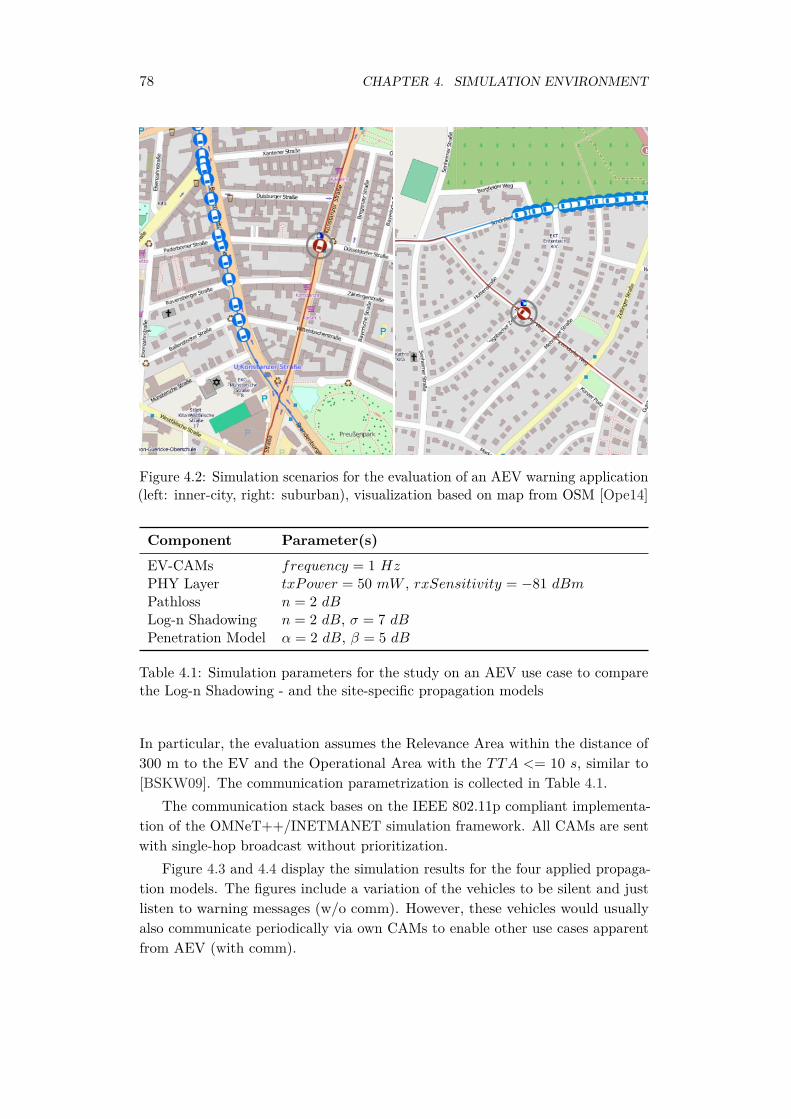
78 CHAPTER 4. SIMULATION ENVIRONMENT
Figure 4.2: Simulation scenarios for the evaluation of an AEV warning application(left: inner-city, right: suburban), visualization based on map from OSM [Ope14]
Component Parameter(s)EV-CAMs frequency = 1 HzPHY Layer txPower = 50 mW , rxSensitivity = −81 dBmPathloss n = 2 dBLog-n Shadowing n = 2 dB, σ = 7 dBPenetration Model α = 2 dB, β = 5 dB
Table 4.1: Simulation parameters for the study on an AEV use case to comparethe Log-n Shadowing - and the site-specific propagation models
In particular, the evaluation assumes the Relevance Area within the distance of300 m to the EV and the Operational Area with the TTA <= 10 s, similar to[BSKW09]. The communication parametrization is collected in Table 4.1.
The communication stack bases on the IEEE 802.11p compliant implementa-tion of the OMNeT++/INETMANET simulation framework. All CAMs are sentwith single-hop broadcast without prioritization.
Figure 4.3 and 4.4 display the simulation results for the four applied propaga-tion models. The figures include a variation of the vehicles to be silent and justlisten to warning messages (w/o comm). However, these vehicles would usuallyalso communicate periodically via own CAMs to enable other use cases apparentfrom AEV (with comm).
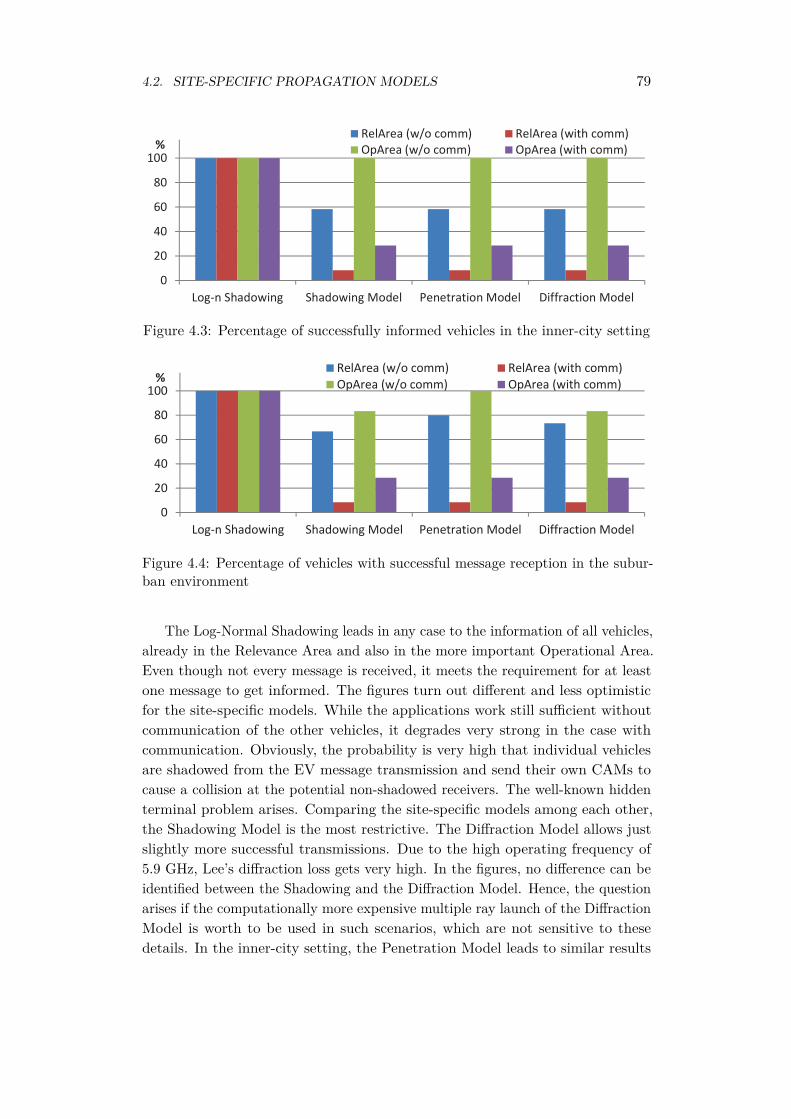
4.2. SITE-SPECIFIC PROPAGATION MODELS 79
0
20
40
60
80
100
Log n Shadowing Shadowing Model Penetration Model Diffraction Model
%RelArea (w/o comm) RelArea (with comm)OpArea (w/o comm) OpArea (with comm)
Figure 4.3: Percentage of successfully informed vehicles in the inner-city setting
0
20
40
60
80
100
Log n Shadowing Shadowing Model Penetration Model Diffraction Model
%RelArea (w/o comm) RelArea (with comm)OpArea (w/o comm) OpArea (with comm)
Figure 4.4: Percentage of vehicles with successful message reception in the subur-ban environment
The Log-Normal Shadowing leads in any case to the information of all vehicles,already in the Relevance Area and also in the more important Operational Area.Even though not every message is received, it meets the requirement for at leastone message to get informed. The figures turn out different and less optimisticfor the site-specific models. While the applications work still sufficient withoutcommunication of the other vehicles, it degrades very strong in the case withcommunication. Obviously, the probability is very high that individual vehiclesare shadowed from the EV message transmission and send their own CAMs tocause a collision at the potential non-shadowed receivers. The well-known hiddenterminal problem arises. Comparing the site-specific models among each other,the Shadowing Model is the most restrictive. The Diffraction Model allows justslightly more successful transmissions. Due to the high operating frequency of5.9 GHz, Lee’s diffraction loss gets very high. In the figures, no difference can beidentified between the Shadowing and the Diffraction Model. Hence, the questionarises if the computationally more expensive multiple ray launch of the DiffractionModel is worth to be used in such scenarios, which are not sensitive to thesedetails. In the inner-city setting, the Penetration Model leads to similar results
80 CHAPTER 4. SIMULATION ENVIRONMENT
as the Diffraction Model with regard to the individual message transmission.The penetration loss through the buildings is many times too high, due to theperimeter block development. Consequently, no difference can be identified for themetric of informed or warned vehicles. In contrast, in the suburban-scenario theprobability of message reception is high enough to be visible with the presentedmetric. It is still far less optimistic compared to the Log-Normal Shadowing.
4.2.4 Summary
This section discussed how the site-specific modeling of radio propagation effects ofshadowing, penetration and diffraction influences the functioning of the approach-ing emergency vehicle warning. The models base on a ray tracing method with areduced number of rays for faster computational performance. The locations ofscatterers, especially buildings, in the environment can be imported from OSMdata and used for larger scale scenarios. Compared to the stochastic considerationof buildings in the Log-Normal Shadowing Model, the results are less optimisticwith site-specific models and reveal certain shortcomings of the application itself.For instance, the presented application is prone to the hidden terminal problem.It could be improved with a component that forwards the warning informationto other shadowed vehicles. Although the simulation study concentrated on thespecific application of the AEV warning, the conclusion should be that morerealistic propagation models are important for investigations on V2X applicationsin general. Especially in urban environments, shadowing is a significant aspectthat influences the communication performance of V2X applications.
4.3 Advanced Statistical Communication Models
The previous section about site-specific propagation models confirmed that thedetailed consideration of the communication properties on the lower layers iscrucial to achieve a correct result for applications. Nonetheless, the presentedmodels still include several abstractions. For instance, they do not consider thevehicle speed dependency and thus the Doppler Effect with connected fadingcharacteristics. As mentioned, statistical models can account also for such aspects.In recent times, more appropriate measurement based vehicular channel modelswere proposed [MTKM09]. The integration of these advanced statistical modelsinto the vehicular simulation environment is a desirable objective. For instance, aninitiative improved the ns-3 Physical Layer with a detailed signal-processing chainincluding OFDM modulation and convolutional coding [MPHS11]. Furthermore,it includes more sophisticated models for the radio channel effects.
The following section presents another way to include detailed models forboth the radio propagation and the signal processing on the Physical Layerin the simulation of V2X communication. According to this approach, a new
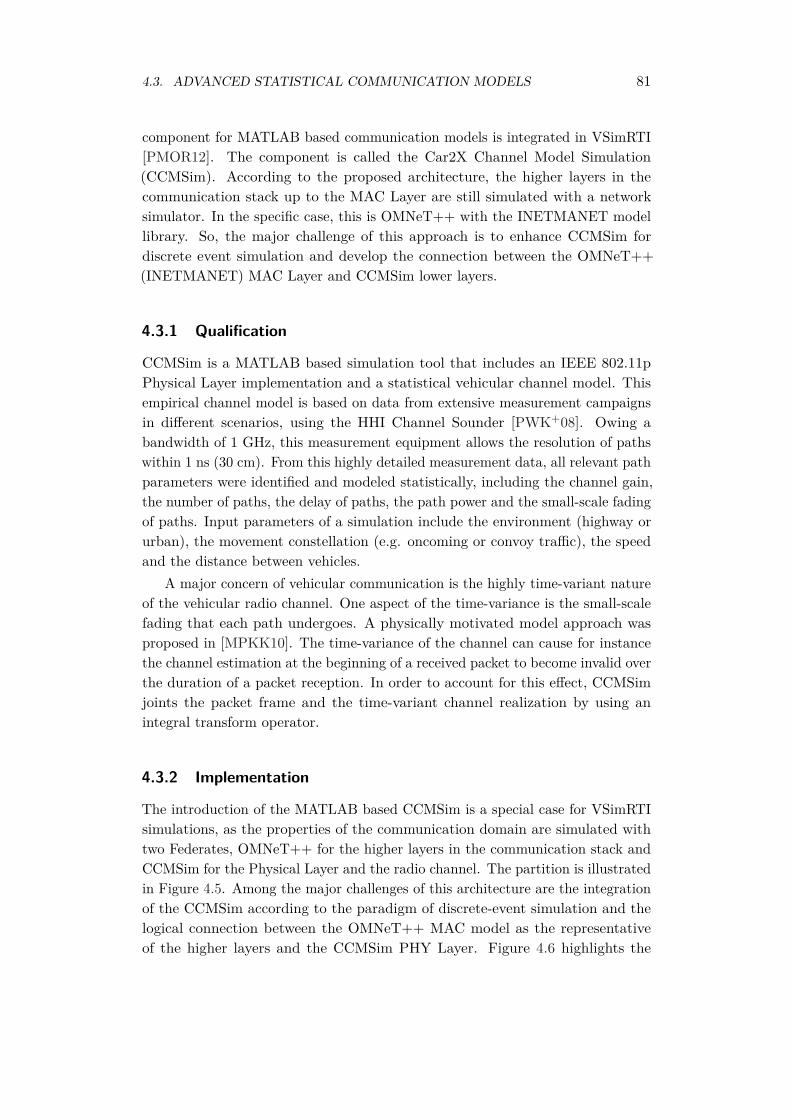
4.3. ADVANCED STATISTICAL COMMUNICATION MODELS 81
component for MATLAB based communication models is integrated in VSimRTI[PMOR12]. The component is called the Car2X Channel Model Simulation(CCMSim). According to the proposed architecture, the higher layers in thecommunication stack up to the MAC Layer are still simulated with a networksimulator. In the specific case, this is OMNeT++ with the INETMANET modellibrary. So, the major challenge of this approach is to enhance CCMSim fordiscrete event simulation and develop the connection between the OMNeT++(INETMANET) MAC Layer and CCMSim lower layers.
4.3.1 Qualification
CCMSim is a MATLAB based simulation tool that includes an IEEE 802.11pPhysical Layer implementation and a statistical vehicular channel model. Thisempirical channel model is based on data from extensive measurement campaignsin different scenarios, using the HHI Channel Sounder [PWK+08]. Owing abandwidth of 1 GHz, this measurement equipment allows the resolution of pathswithin 1 ns (30 cm). From this highly detailed measurement data, all relevant pathparameters were identified and modeled statistically, including the channel gain,the number of paths, the delay of paths, the path power and the small-scale fadingof paths. Input parameters of a simulation include the environment (highway orurban), the movement constellation (e.g. oncoming or convoy traffic), the speedand the distance between vehicles.
A major concern of vehicular communication is the highly time-variant natureof the vehicular radio channel. One aspect of the time-variance is the small-scalefading that each path undergoes. A physically motivated model approach wasproposed in [MPKK10]. The time-variance of the channel can cause for instancethe channel estimation at the beginning of a received packet to become invalid overthe duration of a packet reception. In order to account for this effect, CCMSimjoints the packet frame and the time-variant channel realization by using anintegral transform operator.
4.3.2 Implementation
The introduction of the MATLAB based CCMSim is a special case for VSimRTIsimulations, as the properties of the communication domain are simulated withtwo Federates, OMNeT++ for the higher layers in the communication stack andCCMSim for the Physical Layer and the radio channel. The partition is illustratedin Figure 4.5. Among the major challenges of this architecture are the integrationof the CCMSim according to the paradigm of discrete-event simulation and thelogical connection between the OMNeT++ MAC model as the representativeof the higher layers and the CCMSim PHY Layer. Figure 4.6 highlights the
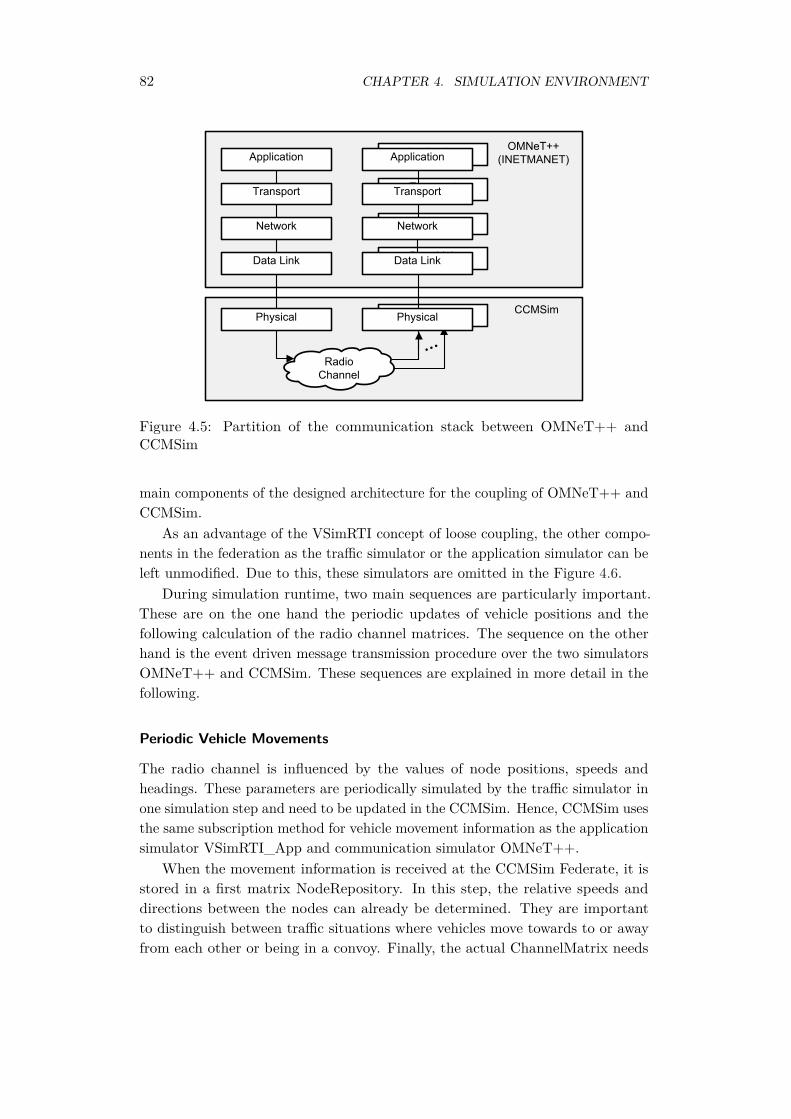
82 CHAPTER 4. SIMULATION ENVIRONMENT
CCMSim
OMNeT++(INETMANET)Application
Transport
Network
Data Link
Physical
Application
Transport
Network
Data Link
Physical
Application
Transport
Network
Data Link
Radio Channel
Physical
Figure 4.5: Partition of the communication stack between OMNeT++ andCCMSim
main components of the designed architecture for the coupling of OMNeT++ andCCMSim.
As an advantage of the VSimRTI concept of loose coupling, the other compo-nents in the federation as the traffic simulator or the application simulator can beleft unmodified. Due to this, these simulators are omitted in the Figure 4.6.
During simulation runtime, two main sequences are particularly important.These are on the one hand the periodic updates of vehicle positions and thefollowing calculation of the radio channel matrices. The sequence on the otherhand is the event driven message transmission procedure over the two simulatorsOMNeT++ and CCMSim. These sequences are explained in more detail in thefollowing.
Periodic Vehicle Movements
The radio channel is influenced by the values of node positions, speeds andheadings. These parameters are periodically simulated by the traffic simulator inone simulation step and need to be updated in the CCMSim. Hence, CCMSim usesthe same subscription method for vehicle movement information as the applicationsimulator VSimRTI_App and communication simulator OMNeT++.
When the movement information is received at the CCMSim Federate, it isstored in a first matrix NodeRepository. In this step, the relative speeds anddirections between the nodes can already be determined. They are importantto distinguish between traffic situations where vehicles move towards to or awayfrom each other or being in a convoy. Finally, the actual ChannelMatrix needs
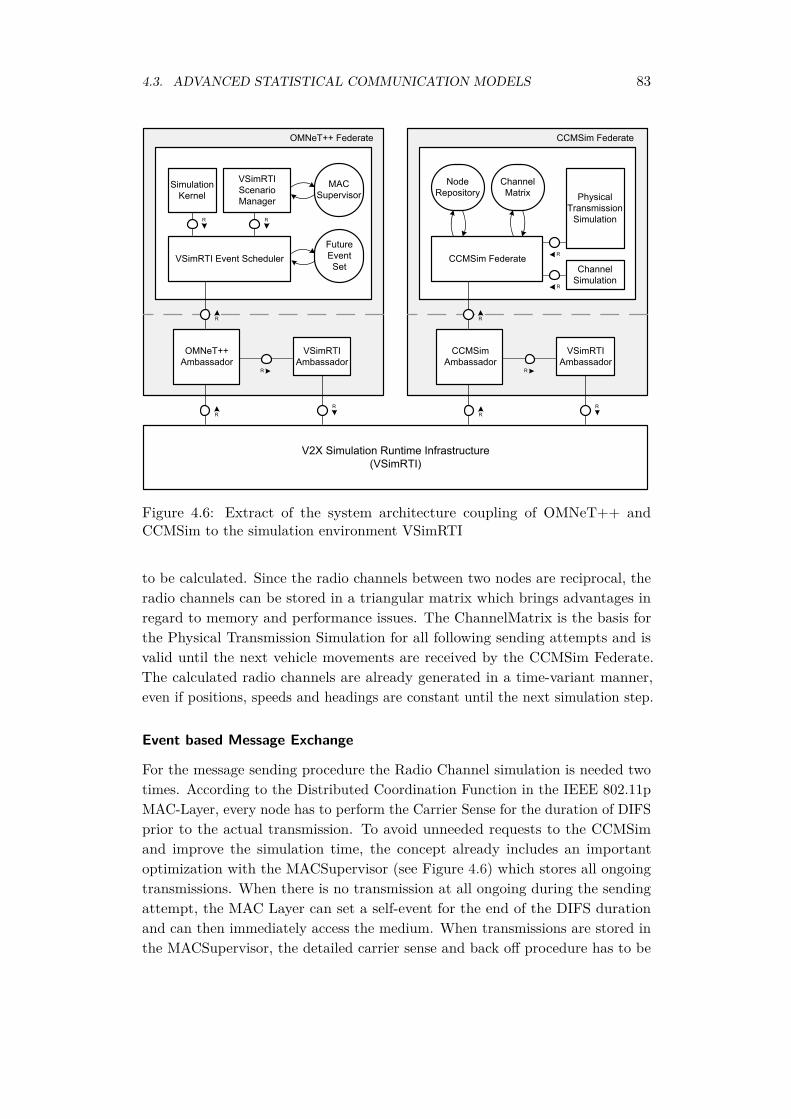
4.3. ADVANCED STATISTICAL COMMUNICATION MODELS 83
OMNeT++ Federate
SimulationKernel
VSimRTIScenarioManager
VSimRTI Event Scheduler
V2X Simulation Runtime Infrastructure(VSimRTI)
RR
OMNeT++Ambassador
VSimRTI Ambassador
R
R
R R
MACSupervisor
CCMSim Federate
PhysicalTransmission
Simulation
CCMSim Federate
RR
CCMSimAmbassador
VSimRTI Ambassador
R
R
R
NodeRepository
ChannelMatrix
ChannelSimulation
RFutureEventSet
Figure 4.6: Extract of the system architecture coupling of OMNeT++ andCCMSim to the simulation environment VSimRTI
to be calculated. Since the radio channels between two nodes are reciprocal, theradio channels can be stored in a triangular matrix which brings advantages inregard to memory and performance issues. The ChannelMatrix is the basis forthe Physical Transmission Simulation for all following sending attempts and isvalid until the next vehicle movements are received by the CCMSim Federate.The calculated radio channels are already generated in a time-variant manner,even if positions, speeds and headings are constant until the next simulation step.
Event based Message Exchange
For the message sending procedure the Radio Channel simulation is needed twotimes. According to the Distributed Coordination Function in the IEEE 802.11pMAC-Layer, every node has to perform the Carrier Sense for the duration of DIFSprior to the actual transmission. To avoid unneeded requests to the CCMSimand improve the simulation time, the concept already includes an importantoptimization with the MACSupervisor (see Figure 4.6) which stores all ongoingtransmissions. When there is no transmission at all ongoing during the sendingattempt, the MAC Layer can set a self-event for the end of the DIFS durationand can then immediately access the medium. When transmissions are stored inthe MACSupervisor, the detailed carrier sense and back off procedure has to be

84 CHAPTER 4. SIMULATION ENVIRONMENT
performed, using the CCMSim.When the node sends the message over the radio channel, it first sets the
transmission notification in the MACSupervisor for the following nodes whichmay also attempt to send a message. In the second step, the transmission isprocessed by CCMSim. This simulation part determines every node where thereceived signal strength is above the threshold of channel noise. Afterwards, thePHY Layer computes a BER for each node that could receive the message. TheCCMSim PHY includes a detailed MATLAB signal processing chain of the IEEE802.11p standard. If this BER is zero, CCMSim reports the correctly receivedmessage for each node back to OMNeT++, which in turn processes the messageupwards in the communication stack and finally hands it over to the applicationsimulator VSimRTI_App.
4.3.3 Validation
At first, it shall be validated that the coupling of the OMNeT++ MAC Layerand the CCMSim PHY Layer is working as expected. The coupling required theintroduction of specific modifications in the process sequence of the original MACLayer model. For instance, the concept with the MACSupervisor to reduce theunnecessary communication overhead between OMNeT++ and CCMSim in caseof no previous transmission is one point which needs to be tested for correctness.Certainly, the whole implementation was already tested on module level, but itshould be presented here in a larger scale.
Methodology
This validation experiment compares the setup of using only OMNeT++ on theone hand with the combination of OMNeT++ and CCMSim on the other hand.It is based on the metric of the Packet Delivery Rate (PDR), which is one of themost important metrics for MAC Layer assessment. The simulation comprises twodistinctive cases, 1) the single access when only one sender is present and the DCFprotocol can schedule the medium access directly and 2) the multi-access whenmore than one node have to compete for the medium-access. In either situation,the simulation shall deliver equal results for both simulator setups. Since a directcomparison between the common propagation models and the simplified PHYLayer in OMNeT++ would always produce different results as the detailed Car2XCommunication Models and the PHY Layer signal processing chain in CCMSim,equal models needed to be applied. Due to this fact, the Freespace Model isimplemented in MATLAB for CCMSim and is used as the propagation model inthis study. In fact, the Freespace Model fits very well in the CCMSim concept.This model includes a single time-invariant radio channel with a static propagationloss according to the equation of Friis. The PHY Layer models are left unmodified.
4.3. ADVANCED STATISTICAL COMMUNICATION MODELS 85
PHY Layer Parameter ValueCarrier Frequency 5.9 GHzBitrate 6 MBpsFrame Length 200 ByteTX Power 100 mW (20 dBm)Noise Power -94 dBmRX Threshold -82 dBm
Table 4.2: Physical Layer Parameters for validation and evaluation of the advancedcommunication models
Accordingly, the simplified model in OMNeT++ and the signal-processing chainin CCMSim are applied.
In the whole simulation study, the communication is generally established inthe way that there is one specific application (for sending messages with 10 Hz aswell as for receiving). Furthermore, there is UDP used as Transport protocol, andSingle-Hop Broadcasting is applied on the Network Layer to have a transparenthigher layer configuration. For the lower layers, the specific models accordingto the IEEE 802.11p standard are used and, as already mentioned, the radiochannel is simulated with the Freespace Model. Table 4.2 contains the essentialparameters for the Physical Layer simulation.
Simulation Scenario
The simulation scenario bases on a straight road. Due to the introduction of theFreespace model, this straight road is in the first instance independent of themeasurement campaign for CCMSim. Nevertheless, the Kantstrasse in Berlin isselected (see Figure 4.8a), which is the same scenario where the measurements forurban environments were made, and which is also analyzed in the second part ofthe simulation study. In the scenario, the PDR is measured for two probe vehicles,one sender and one receiver. The sender emits 10 messages per second and thereceiver knows in advance when it has to expect a message from the sender. Inthis way, the receiver can calculate the PDR as the ratio of the received and theexpected messages. As depicted in Figure 4.8a, there are two groups of each 21vehicles approaching each other. The first group with the blue route starts onthe eastern end of the Kantstrasse and includes the probe vehicle for sending.The second group with the red route starts at the opposite end and includes thereceiving probe vehicle. The probe vehicles are always the central vehicles of theirgroup.
In the single access case, only the sending vehicle is actively broadcastingmessages, the receiving vehicle is receiving and all other vehicles have turned offtheir communication unit. In the multi-access case, the other vehicles produce

86 CHAPTER 4. SIMULATION ENVIRONMENT
0
0,2
0,4
0,6
0,8
1
0 200 400 600 800 1000 1200 1400
PD
R
distance in m
OMNeT++ Single Access
OMNeT++ Multi Access
CCMSim Single Access
CCMSim Multi Access
Figure 4.7: Comparison of the PDR for OMNeT++ and CCMSim in single accessand multi-access case
additional traffic on the broadcast medium. Altogether, 40 vehicles producebackground traffic with each 10 messages per second.
Results
Figure 4.7 shows the results for the initial validation simulation. The dashedgraphs depict the simulation results for the original OMNeT++ and the full linedgraphs belong to the new implementation with the combination of OMNeT++and CCMSim. The single access case is colored blue and the multi-access casered.
In the single access case, both simulator setups produced completely congruentresults. The Packet Delivery Rate is 100 % up to a fixed distance of circa 509 m,which is a result of the applied Freespace model and the dedicated PHY Layerconfiguration from Table 4.2. At this distance, the PDR drops directly to 0 %.Obviously, it was expected to obtain exactly these results, as it is straightforwardto control all parameters for this reference single access case.
In the multi-access case, the PDR contains further dependencies. The com-munication behavior is additionally influenced by the DCF in the MAC Layer,where the number and the position of the vehicles have a major effect. Certainly,the influences of the Hidden Terminal Effect turn out different in a case where

4.3. ADVANCED STATISTICAL COMMUNICATION MODELS 87
(a) Scenario Kantstrasse (urban) (b) Scenario Dreilinden (highway)
Figure 4.8: Simulated scenarios with oncoming traffic, visualization based onsatellite map from Google Earth [Goo12])
all nodes are equally distributed in the communication range compared to thescenario where two groups of vehicles are approaching each other. Nonetheless,the results of both simulator setups are once again identical. The minor deviationsresult from the simplified PHY Layer in OMNeT++ and the detailed PHY Layerin CCMSim. All in all, the results prove that the implementation works correctlyin either case, the single and the multi-access.
4.3.4 Evaluation
The second part of the study evaluates the influences of the detailed CCM on thegeneral communication properties compared to the common propagation modelswhich are already included in all network simulators.
Methodology
As in the previous study for the validation of the implementation effort, a com-parison between OMNeT++ only and the new environment with OMNeT++ andCCMSim is presented. In this comparison, the focus is set on the differences,which can be modeled. To point out particularly the influences of the new chan-nel models and the PHY signal chain, only the single access case is simulated.However, two scenarios in different environments are analyzed.
Again, the PDR is used as evaluation metric for the comparison. Additionally,the Received Signal Strength (RSS) is presented as a second important metric,since different propagation models result at first in a different received signal,which is then decoded by the PHY Layer and leads to the according PDR. For thePHY Layer chain in CCMSim, the RSS is only one parameter amongst others (e.g.
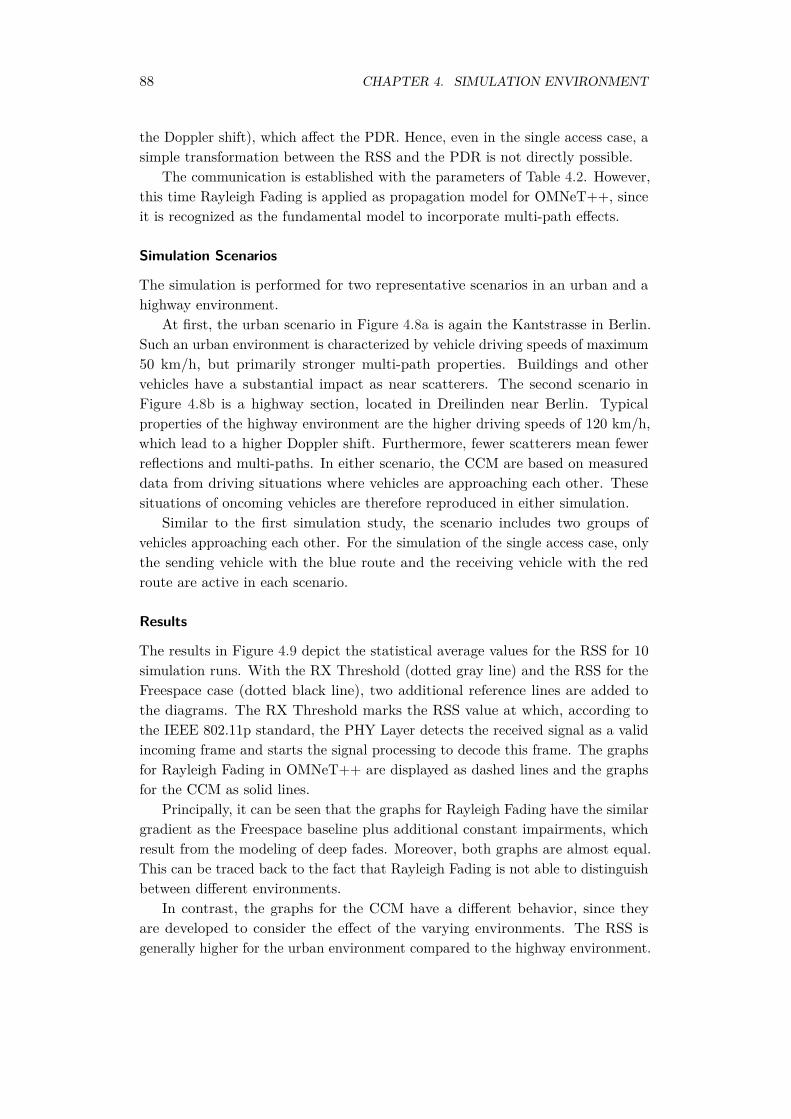
88 CHAPTER 4. SIMULATION ENVIRONMENT
the Doppler shift), which affect the PDR. Hence, even in the single access case, asimple transformation between the RSS and the PDR is not directly possible.
The communication is established with the parameters of Table 4.2. However,this time Rayleigh Fading is applied as propagation model for OMNeT++, sinceit is recognized as the fundamental model to incorporate multi-path effects.
Simulation Scenarios
The simulation is performed for two representative scenarios in an urban and ahighway environment.
At first, the urban scenario in Figure 4.8a is again the Kantstrasse in Berlin.Such an urban environment is characterized by vehicle driving speeds of maximum50 km/h, but primarily stronger multi-path properties. Buildings and othervehicles have a substantial impact as near scatterers. The second scenario inFigure 4.8b is a highway section, located in Dreilinden near Berlin. Typicalproperties of the highway environment are the higher driving speeds of 120 km/h,which lead to a higher Doppler shift. Furthermore, fewer scatterers mean fewerreflections and multi-paths. In either scenario, the CCM are based on measureddata from driving situations where vehicles are approaching each other. Thesesituations of oncoming vehicles are therefore reproduced in either simulation.
Similar to the first simulation study, the scenario includes two groups ofvehicles approaching each other. For the simulation of the single access case, onlythe sending vehicle with the blue route and the receiving vehicle with the redroute are active in each scenario.
Results
The results in Figure 4.9 depict the statistical average values for the RSS for 10simulation runs. With the RX Threshold (dotted gray line) and the RSS for theFreespace case (dotted black line), two additional reference lines are added tothe diagrams. The RX Threshold marks the RSS value at which, according tothe IEEE 802.11p standard, the PHY Layer detects the received signal as a validincoming frame and starts the signal processing to decode this frame. The graphsfor Rayleigh Fading in OMNeT++ are displayed as dashed lines and the graphsfor the CCM as solid lines.
Principally, it can be seen that the graphs for Rayleigh Fading have the similargradient as the Freespace baseline plus additional constant impairments, whichresult from the modeling of deep fades. Moreover, both graphs are almost equal.This can be traced back to the fact that Rayleigh Fading is not able to distinguishbetween different environments.
In contrast, the graphs for the CCM have a different behavior, since theyare developed to consider the effect of the varying environments. The RSS isgenerally higher for the urban environment compared to the highway environment.
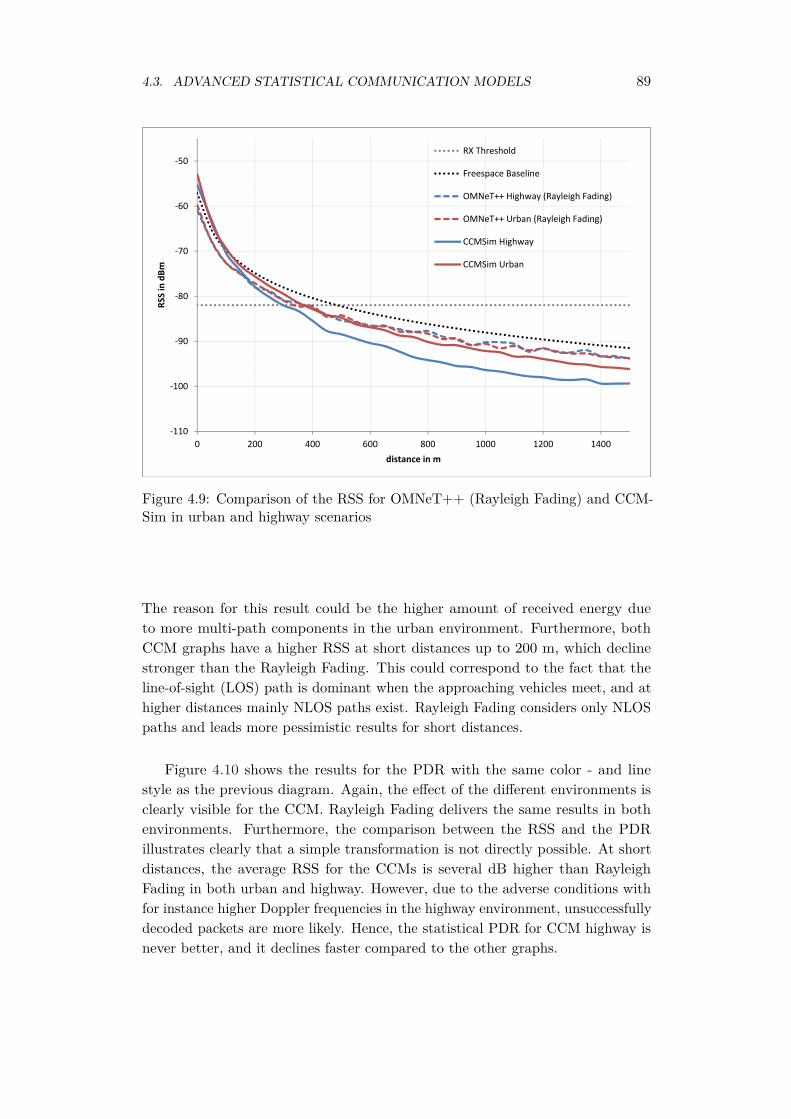
4.3. ADVANCED STATISTICAL COMMUNICATION MODELS 89
‐110
‐100
‐90
‐80
‐70
‐60
‐50
0 200 400 600 800 1000 1200 1400
RSS in
dBm
distance in m
RX Threshold
Freespace Baseline
OMNeT++ Highway (Rayleigh Fading)
OMNeT++ Urban (Rayleigh Fading)
CCMSim Highway
CCMSim Urban
Figure 4.9: Comparison of the RSS for OMNeT++ (Rayleigh Fading) and CCM-Sim in urban and highway scenarios
The reason for this result could be the higher amount of received energy dueto more multi-path components in the urban environment. Furthermore, bothCCM graphs have a higher RSS at short distances up to 200 m, which declinestronger than the Rayleigh Fading. This could correspond to the fact that theline-of-sight (LOS) path is dominant when the approaching vehicles meet, and athigher distances mainly NLOS paths exist. Rayleigh Fading considers only NLOSpaths and leads more pessimistic results for short distances.
Figure 4.10 shows the results for the PDR with the same color - and linestyle as the previous diagram. Again, the effect of the different environments isclearly visible for the CCM. Rayleigh Fading delivers the same results in bothenvironments. Furthermore, the comparison between the RSS and the PDRillustrates clearly that a simple transformation is not directly possible. At shortdistances, the average RSS for the CCMs is several dB higher than RayleighFading in both urban and highway. However, due to the adverse conditions withfor instance higher Doppler frequencies in the highway environment, unsuccessfullydecoded packets are more likely. Hence, the statistical PDR for CCM highway isnever better, and it declines faster compared to the other graphs.
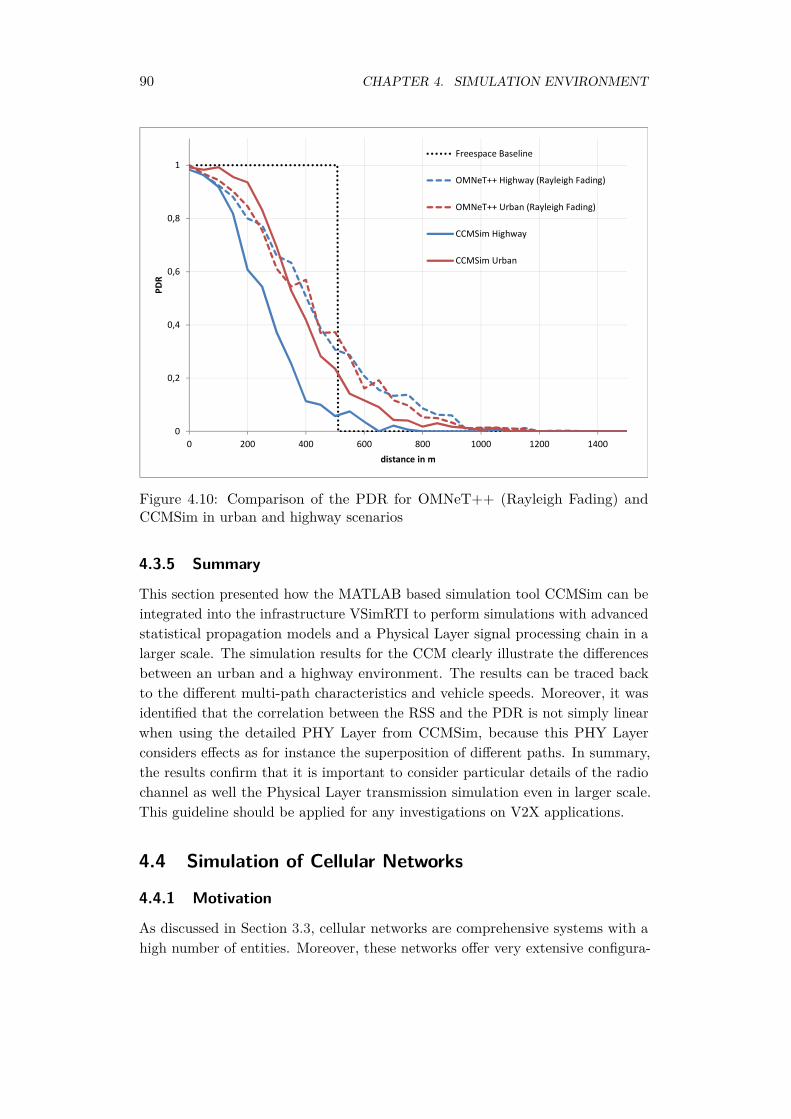
90 CHAPTER 4. SIMULATION ENVIRONMENT
0
0,2
0,4
0,6
0,8
1
0 200 400 600 800 1000 1200 1400
PDR
distance in m
Freespace Baseline
OMNeT++ Highway (Rayleigh Fading)
OMNeT++ Urban (Rayleigh Fading)
CCMSim Highway
CCMSim Urban
Figure 4.10: Comparison of the PDR for OMNeT++ (Rayleigh Fading) andCCMSim in urban and highway scenarios
4.3.5 Summary
This section presented how the MATLAB based simulation tool CCMSim can beintegrated into the infrastructure VSimRTI to perform simulations with advancedstatistical propagation models and a Physical Layer signal processing chain in alarger scale. The simulation results for the CCM clearly illustrate the differencesbetween an urban and a highway environment. The results can be traced backto the different multi-path characteristics and vehicle speeds. Moreover, it wasidentified that the correlation between the RSS and the PDR is not simply linearwhen using the detailed PHY Layer from CCMSim, because this PHY Layerconsiders effects as for instance the superposition of different paths. In summary,the results confirm that it is important to consider particular details of the radiochannel as well the Physical Layer transmission simulation even in larger scale.This guideline should be applied for any investigations on V2X applications.
4.4 Simulation of Cellular Networks
4.4.1 Motivation
As discussed in Section 3.3, cellular networks are comprehensive systems with ahigh number of entities. Moreover, these networks offer very extensive configura-

4.4. SIMULATION OF CELLULAR NETWORKS 91
tion opportunities to match the requirements of the according operator. Thesefacts lead to very different characteristics of the particular systems. Hence, thesimulation of cellular networks with the perspective from the applications is achallenging task.
The simulation of cellular networks is commonly divided into two differentperspectives which have a different stage of abstraction. On the one hand, the linklevel simulation comprises the lower layers (MAC, PHY) and the radio channel.In this way, it models for instance the radio link between a NodeB to the UE.On the other hand, the system level simulation focuses on the higher layers andis used for the network view. This level considers e.g. a set of NodeBs and theassociated UEs.
Nowadays, different system level simulation frameworks are proposed, con-centrating on LTE cellular systems. The longest standing open source LTEsystem level simulator bases on MATLAB [IWR10]. In the original version, itis limited to the downlink and does not consider several important features asbroadcast. The C++ based framework LTE-Sim is already very feature-rich[PGB+11]. It supports uplink, downlink, several schedulers, handover and more.The well-established communication simulator OMNeT++ is used to build upthe end-to-end system SimuLTE [VSN14]. The latter concept is appealing, asOMNeT++ is already coupled to the existing simulation infrastructure. Eventhough some of these approaches have a detailed model base, they have severalshortcomings for larger scale scenarios, which need to be addressed in this work.The simulators are more or less tied to one access technology, namely LTE. Moresignificantly, while for simple ad hoc communication, the direct modeling approachis sufficient, for larger scale scenarios of cellular system simulation, the given simu-lators are too complex to configure and the detailed simulation is computationallytoo expensive. In contrast, trace-based cellular simulation is another promisingapproach that claims to be much faster than system level simulation [GKMG14].Similar to the empirical radio propagation modeling, the trace-based techniquederives models from real-world measurements. Hence, it works without particularassumptions for the network setup and configuration.
With the new simulator VSimRTI_Cell, this section presents a way, whichintroduces a similar grade of abstraction for cellular networks as the trace-basedsimulation. The core models even base on a dedicated measurement campaign.The developed simulation tool is lightweight and fast enough for larger scalescenarios. However, particularly from vehicular application perspective, thesimulator also models important features, which are not regarded in the otherframeworks [PMR14a, PMR14b]. The conceptual design of the VSimRTI_Cellsimulator particularly regards for the following key aspects.
Technology VSimRTI_Cell is independent from the actual releases of stan-dardized cellular access technologies such as UMTS-HSPA, LTE or even
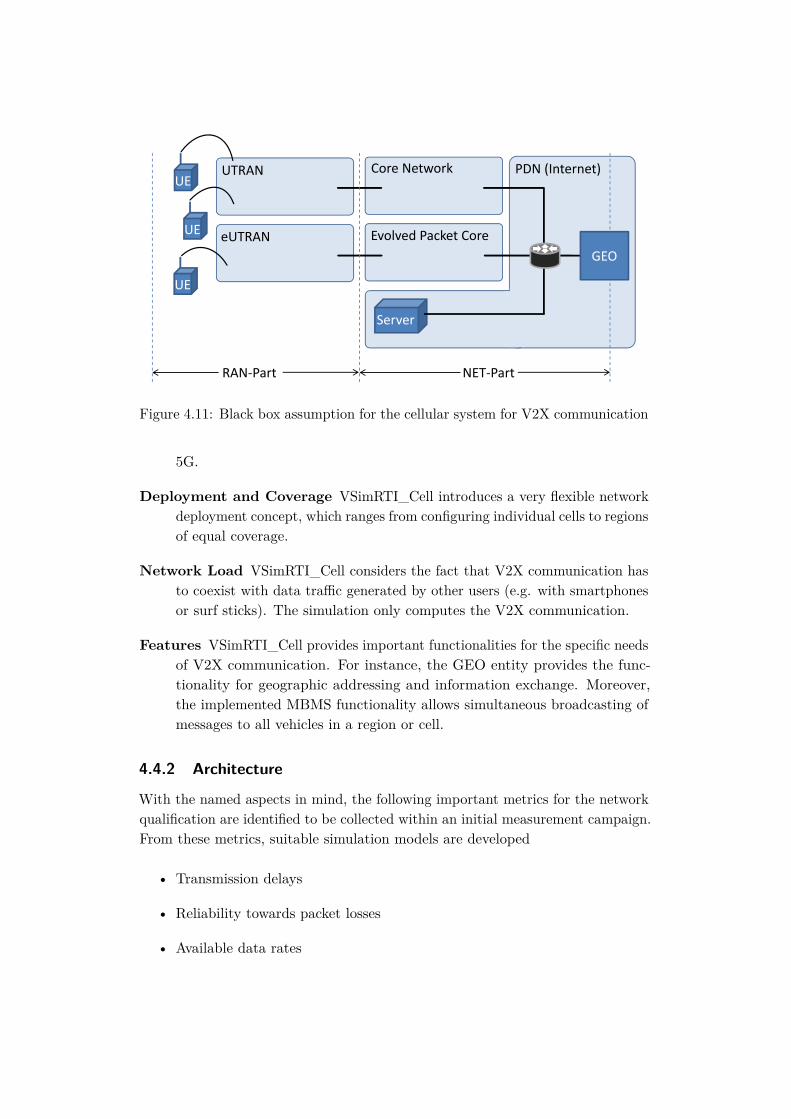
92 CHAPTER 4. SIMULATION ENVIRONMENT
UTRAN Core Network PDN (Internet)
eUTRAN Evolved Packet Core
NET‐PartRAN‐Part
GEO
Server
UE
UE
UE
Figure 4.11: Black box assumption for the cellular system for V2X communication
5G.
Deployment and Coverage VSimRTI_Cell introduces a very flexible networkdeployment concept, which ranges from configuring individual cells to regionsof equal coverage.
Network Load VSimRTI_Cell considers the fact that V2X communication hasto coexist with data traffic generated by other users (e.g. with smartphonesor surf sticks). The simulation only computes the V2X communication.
Features VSimRTI_Cell provides important functionalities for the specific needsof V2X communication. For instance, the GEO entity provides the func-tionality for geographic addressing and information exchange. Moreover,the implemented MBMS functionality allows simultaneous broadcasting ofmessages to all vehicles in a region or cell.
4.4.2 Architecture
With the named aspects in mind, the following important metrics for the networkqualification are identified to be collected within an initial measurement campaign.From these metrics, suitable simulation models are developed
• Transmission delays
• Reliability towards packet losses
• Available data rates
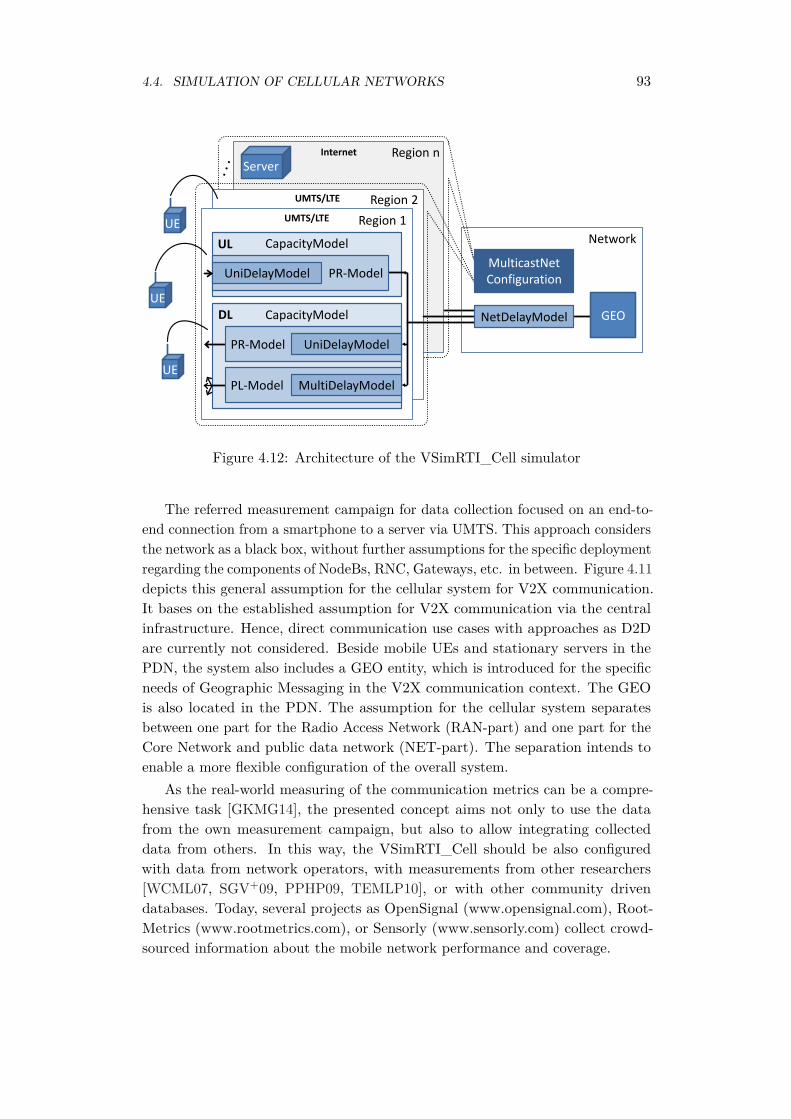
4.4. SIMULATION OF CELLULAR NETWORKS 93
Region n
Region 2
UE
UE
UE
GEO
Region 1
CapacityModel DL
Network CapacityModel UL
NetDelayModel
PR-Model UniDelayModel
PR-Model UniDelayModel
PL-Model MultiDelayModel
MulticastNet Configuration
Server
UMTS/LTE
UMTS/LTE
Internet
GEO
Figure 4.12: Architecture of the VSimRTI_Cell simulator
The referred measurement campaign for data collection focused on an end-to-end connection from a smartphone to a server via UMTS. This approach considersthe network as a black box, without further assumptions for the specific deploymentregarding the components of NodeBs, RNC, Gateways, etc. in between. Figure 4.11depicts this general assumption for the cellular system for V2X communication.It bases on the established assumption for V2X communication via the centralinfrastructure. Hence, direct communication use cases with approaches as D2Dare currently not considered. Beside mobile UEs and stationary servers in thePDN, the system also includes a GEO entity, which is introduced for the specificneeds of Geographic Messaging in the V2X communication context. The GEOis also located in the PDN. The assumption for the cellular system separatesbetween one part for the Radio Access Network (RAN-part) and one part for theCore Network and public data network (NET-part). The separation intends toenable a more flexible configuration of the overall system.
As the real-world measuring of the communication metrics can be a compre-hensive task [GKMG14], the presented concept aims not only to use the datafrom the own measurement campaign, but also to allow integrating collecteddata from others. In this way, the VSimRTI_Cell should be also configuredwith data from network operators, with measurements from other researchers[WCML07, SGV+09, PPHP09, TEMLP10], or with other community drivendatabases. Today, several projects as OpenSignal (www.opensignal.com), Root-Metrics (www.rootmetrics.com), or Sensorly (www.sensorly.com) collect crowd-sourced information about the mobile network performance and coverage.
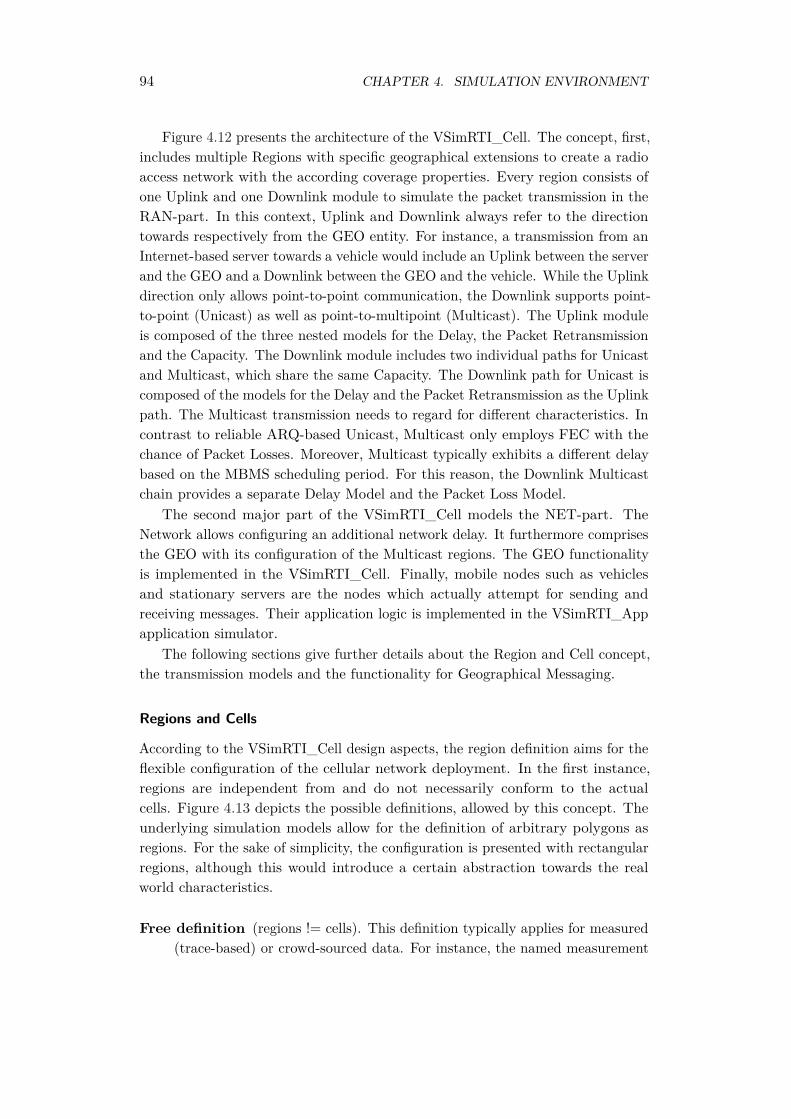
94 CHAPTER 4. SIMULATION ENVIRONMENT
Figure 4.12 presents the architecture of the VSimRTI_Cell. The concept, first,includes multiple Regions with specific geographical extensions to create a radioaccess network with the according coverage properties. Every region consists ofone Uplink and one Downlink module to simulate the packet transmission in theRAN-part. In this context, Uplink and Downlink always refer to the directiontowards respectively from the GEO entity. For instance, a transmission from anInternet-based server towards a vehicle would include an Uplink between the serverand the GEO and a Downlink between the GEO and the vehicle. While the Uplinkdirection only allows point-to-point communication, the Downlink supports point-to-point (Unicast) as well as point-to-multipoint (Multicast). The Uplink moduleis composed of the three nested models for the Delay, the Packet Retransmissionand the Capacity. The Downlink module includes two individual paths for Unicastand Multicast, which share the same Capacity. The Downlink path for Unicast iscomposed of the models for the Delay and the Packet Retransmission as the Uplinkpath. The Multicast transmission needs to regard for different characteristics. Incontrast to reliable ARQ-based Unicast, Multicast only employs FEC with thechance of Packet Losses. Moreover, Multicast typically exhibits a different delaybased on the MBMS scheduling period. For this reason, the Downlink Multicastchain provides a separate Delay Model and the Packet Loss Model.
The second major part of the VSimRTI_Cell models the NET-part. TheNetwork allows configuring an additional network delay. It furthermore comprisesthe GEO with its configuration of the Multicast regions. The GEO functionalityis implemented in the VSimRTI_Cell. Finally, mobile nodes such as vehiclesand stationary servers are the nodes which actually attempt for sending andreceiving messages. Their application logic is implemented in the VSimRTI_Appapplication simulator.
The following sections give further details about the Region and Cell concept,the transmission models and the functionality for Geographical Messaging.
Regions and Cells
According to the VSimRTI_Cell design aspects, the region definition aims for theflexible configuration of the cellular network deployment. In the first instance,regions are independent from and do not necessarily conform to the actualcells. Figure 4.13 depicts the possible definitions, allowed by this concept. Theunderlying simulation models allow for the definition of arbitrary polygons asregions. For the sake of simplicity, the configuration is presented with rectangularregions, although this would introduce a certain abstraction towards the realworld characteristics.
Free definition (regions != cells). This definition typically applies for measured(trace-based) or crowd-sourced data. For instance, the named measurement
4.4. SIMULATION OF CELLULAR NETWORKS 95
(c) Intra-cell definition
(a) Free definition (b) Exact definition
Figure 4.13: Different definition possibilities for cellular regions in VSimRTI_Cell,visualization based on map from OpenStreetMap [Ope15]
campaign collected the points for the metrics of the latency, the packet lossand the data rates mainly in connection to their position. The measuringpoints with equal or similar values are aggregated to the different regions.A further mapping to a certain base station is not performed.
Exact definition (1 region == 1 cell). This definition applies when networkoperator data about the individual base station positions and their coverageareas are available.
Intra-cell definition (n regions == 1 cell). For more detailed investigationsof different coverage areas inside a single cell, the region definition alsoallows to e.g. configure a central region with a more capable parameter setcompared to the regions at the cell edges.

96 CHAPTER 4. SIMULATION ENVIRONMENT
0
0,02
0,04
0,06
0,08
0,1
0,12
0,14
0,16
0,18
0,2
0 100 200 300 400 500 600 700 800
Pro
bab
ility
[1
]
Transmission Delay [ms]
0
5
10
15
20
25
30
35
40
45
50
Node Speed [m/s]
Figure 4.14: Probability distribution of the gammaSpeed delay at different speeds
For practical reasons, the region configurations need to regard for two specificsituations. First, not the whole scenario area may be covered with a particularregion definition, but nodes may move to an uncovered location. In this case,the global region always defines a default configuration. Second, multiple regiondefinitions may be configured to overlap for certain locations. In this case,the configuration of the smallest region is always selected for the transmissioncalculation.
Delay Models
The Delay models, regardless of the employment as UniDelayModel, MultiDelay-Model or NetDelayModel, always constitute the core component for the simulatedpacket transmission. They support four different basic delay types to simulatethe transmission time for every packet statistically.
constant is the most basic delay type of VSimRTI_Cell. It always yields thesame configured delay for every sent packet. This more synthetic model ismainly intended to be used for debugging or primary clarifications. Moreover,it can model a constant offset for the NetDelayModel.
simpleRandom extents the constant delay type. It defines a minimum andmaximum bound for the delay (minDelay, maxDelay) and a possible
4.4. SIMULATION OF CELLULAR NETWORKS 97
number of discrete steps (n). With this configuration, the simpleRandomtype randomly generates n different uniformly distributed delays in theinterval [minDelay,maxDelay].
gammaRandom addresses the particular characteristics of the RAN-part. Themeasurement campaign identified that the distribution of the transmissiondelays in a real-world environment sufficiently conforms to the Gammadistribution. This delay type allows to configure the minimum and theexpectation value of the delay (minDelay, expDelay).
gammaSpeed is the most sophisticated delay type. It bases on the gammaRan-dom type and also includes impairments for higher vehicle speeds accordingto a fitting of the measurements from the campaign. Figure 4.14 displays theprobability distribution for the gammaSpeed delay type at different speedswith the measured values of minDelay = 40 ms and expDelay = 80 ms fora representative set of HSPA transmissions. According to this diagram mostpackets have a delay between 50 ms and 200 ms. However, this is only onepossible parameterization and this type also qualifies for the modeling ofother mobile network generations as HSPA+, LTE or even 5G.
PR-Model and PL-Model
The PR- and the PL-Model address the effect of individual packet transmissionimpairments between the node and the base station due to inappropriate signalcoverage. However, when a reliable connection with ARQ is assumed, no packetis effectively lost, but retransmitted. This is in turn connected with an additionaldelay. Hence, the Packet Retransmission Model is particularly employed forthe reliable Unicast transmissions in Up- and Downlink. For the Broadcastcommunication in Downlink, where only FEC can be applied, the Packet LossModel simulates complete packet drops.
The configuration of the coverage quality parameter between 0 and 1 determinesthe probability of a retransmission (PR-Model) or a packet loss (PL-Model) for eachtransmission attempt. In case of a packet loss with or without retransmission, thepacket will always occupy the channel resources even for unsuccessful transmissions.The parameter value of 0 implies an unimpaired transmission for each model. Avalue smaller 1 gives the probability of loss or retransmission in percent. A valueof exactly 1 leads to a packet drop in each model. This behavior can be employedto account for entirely disconnected regions in tunnels or shadowed urban canyons.However, the PR-Model optionally reports a packet drop notification to the sendernode to consider a reliable transport protocol such as TCP.
98 CHAPTER 4. SIMULATION ENVIRONMENT
Capacity Model
The Capacity Model considers the channel load of a region and calculates thefinal delay for the individual packets. With the configuration parameter of themaximum available capacity for all simulated nodes, it allows investigations whichare independent of the family and the generation of the mobile access technology.Furthermore, it respects static data traffic caused by other mobile users withsmartphones, surf sticks, broadband cards. This is an important feature as V2Xcommunication needs to share the resources with other applications. For thesereasons, the region definition is particularly important for this model. For example,assume a network deployment with equal capacities in different cells. When thisdeployment is configured with regions of different size, the capacity needs to beadapted to the region size.
The second parameter for this model is the maximum user bit rate, whichresembles the peak speed from the according user data plan. It is still possibleto serve more simulated nodes in a certain region than the ratio of the availablecapacity divided by the maximum user bit rate. When every user demands itsmaximum bit rate, the result would be that the network gets congested locally andnot every sender can transmit directly. Exactly this effect is modeled, when thesending user reserves the resources for the packet over the time of the transmission.
The Capacity Model maintains a resource map where all reservations areaccumulated for their time span. When a new sent packet exceeds either themaxNodeBitrate (the data plan limit is reached) or the available capacity (thenetwork is congested in this region), the packet needs to be queued and thusfurther delayed until the channel is free again.
Topological and Geographical Messaging
The GEO entity in the Net-part of the VSimRTI_Cell provides functionalitiesfor different addressing schemes. In a real core network deployment, these func-tionalities would be distributed over several entities, as for instance in LTE theMME for node mobility management. The GEO is connected to all regionsvia the NetDelayModel to simulate an additional delay through the Net-part(Core Network and PDN). During simulation runtime, the GEO follows the nodemobility. It maintains a table with the node positions and the mapping to thecorresponding region. Every sent message in the Uplink goes through the GEO,which distributes the message in Downlink either for point or multipoint reception.
For conventional data traffic, the addressing between the nodes is realizedby IP and involves multiple entities in the core network. The simulation canabstract from several aspects of a real core network. However, the user mobilityand the router functionality, which are covered by the SGSN in UMTS or theMME and SGW in LTE, need to be regarded at least. On that account, theGEO uses the knowledge of the current node positions to forward the messages
4.4. SIMULATION OF CELLULAR NETWORKS 99
into the Downlink transmission chain of the according region of the destinationnode. Many V2X communication use cases envision geographic messaging overcellular networks, similar to geographic ad hoc routing. For this purpose, the IPaddress is extended with the definition of the geographic destination area. TheGEO translates the address to direct the packet to the according nodes.
Moreover, many V2X communication use cases demand the dissemination ofthe same information to multiple nodes in the area. Hence, they are a primeexample for the utilization of MBMS and eMBMS (MBSFN) features to allowefficient and resource saving broadcast transmission. Depending on the Multicast-Net configuration, the GEO provides transmission modes similar to MBMS andMBSFN. The MulticastNet configuration defines which regions together form acompound for broadcasting or multicasting a packet. The GEO replicates thepacket to be sent in every region compound covered by the destination area.
4.4.3 Simulation Study
The investigation of automotive media streaming applications is a prime exampleto demonstrate a broad set of the introduced features of VSimRTI_Cell. Therising popularity of music on demand and media cloud storage services pushesautomotive manufactures efforts to provide decent music streaming capabilitiesin vehicles. However, with the increasing usage of music streaming services incars, it is getting harder for the service providers to balance the network load.This issue arises from the fact, that the mobile network will be easily exhaustedin crowded areas with many users listening music in their cars and so users willexperience certain usability drawbacks. Another important issue that needs tobe addressed in order to ensure music streaming quality in cars is implied bymovement characteristics of cars. Especially in urban environments, cars needto pass areas of bad reception imposed by the street infrastructure like tunnels,underpasses, or street canyons, which might lead to network interruptions. Onhighways, due to the high traveling speed, frequent handover between cells maylead to connectivity interruptions. In rural areas, totally disconnected regions cancause network loss for longer periods.
Media Streaming Applications
The two issues, network overload on the one hand and network interruptions onthe other hand, need to be addressed for music streaming in cars in the future.Smart prefetching algorithms enable the reduction of the download overhead andthe reasonable allocation of the network capacity. Relevant information that canbe used to implement such prefetching is only known to the music streamingclients inside the cars. This information includes:
100 CHAPTER 4. SIMULATION ENVIRONMENT
Music content The order, the length, and the size of music titles the user mostlikely wants to listen to, which can be e.g. derived from personal playlists.
Dead zones The locations of bad reception imposed by the road infrastructure,e.g. tunnels, which are located on the current route the vehicle is drivingon.
Crowded zones The information regarding areas of regularly low availablecapacity due to heavy network load, derived from crowd sourced data. Thisdata can be empirically collected by sharing connectivity and coverageinformation among users.
What smart prefetching basically needs to achieve is to use these informationsources in order to: First, determine which music titles the user is likely to requestat which point in time and so estimate when this title needs to be downloadedcompletely. Second, estimate the available capacity along the current drivingroute considering all dead and crowded zones, and schedule the download requestsaccordingly. In this way, crowded areas are relieved, dead zones are bridged, anddownload overhead is minimized.
The prefetching strategies run in a decentralized manner on the individualvehicles. Yet, the goal of such algorithms cannot be achieved in a way of selfishoptimizing, but by aiming on the global optimization. The simulation withVSimRTI_Cell qualifies to assess the effect of the algorithms on a large amountof users, their mutual influence, and the impact on the global network usage.In the presented simulation study, the developed Smart Prefetching approach iscompared with two well-known streaming algorithms referred to as Greedy andConstant Buffering.
Greedy Buffering always buffers as much as possible, which grants a high bufferlevel to bridge large dead zones, however has a high impact on the availablecapacity and the download overhead.
Constant Buffering buffers up to a defined limited buffer size in order to reducethe amount of downloaded data and have a low impact on the availablecapacity, however grants a low buffer size to bridge dead zones. The evaluatedimplementation always maintains a buffer for 30 s in advance.
Smart Prefetching requests content according to the assumed user needs, whichis expected to have a lower impact on the capacity and download overhead,while still provide enough buffer size to bridge dead zones.
Greedy Buffering and Constant Buffering are very basic approaches, which arewell-known in the field of multimedia streaming. Smart Prefetching introduces thenew aspect of improving the buffering approach by using situational information
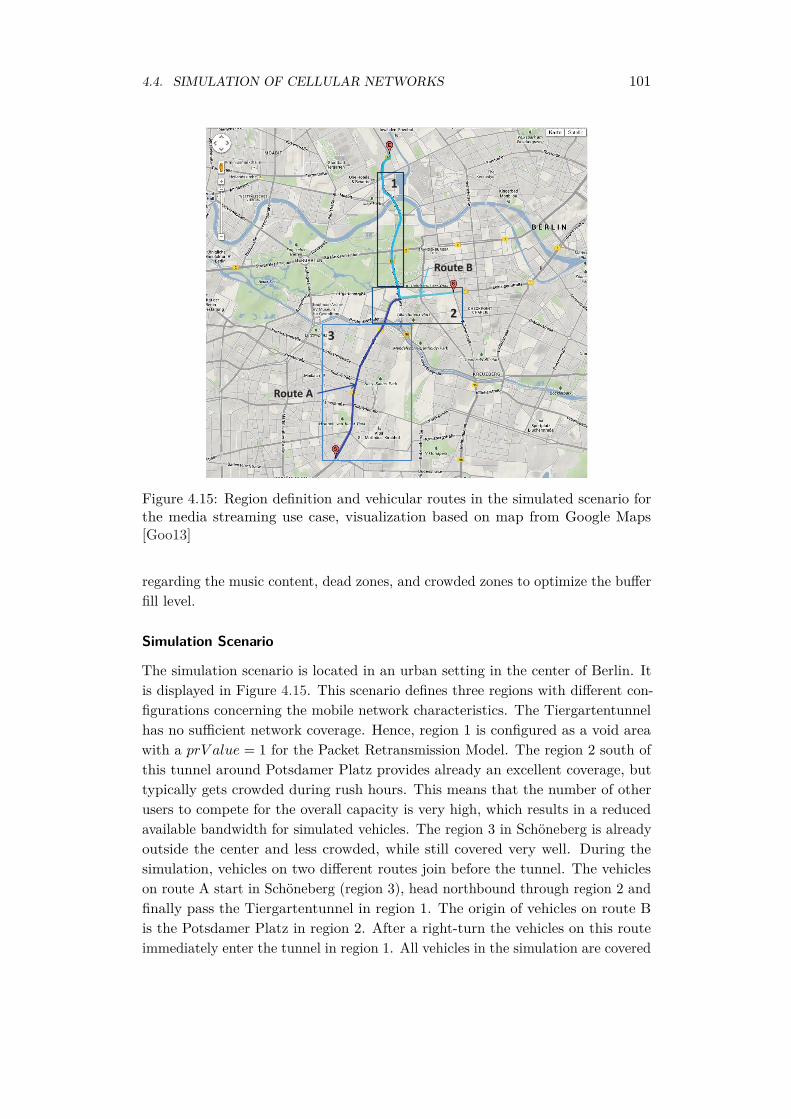
4.4. SIMULATION OF CELLULAR NETWORKS 101
1
3
Route A
Route B
2
Figure 4.15: Region definition and vehicular routes in the simulated scenario forthe media streaming use case, visualization based on map from Google Maps[Goo13]
regarding the music content, dead zones, and crowded zones to optimize the bufferfill level.
Simulation Scenario
The simulation scenario is located in an urban setting in the center of Berlin. Itis displayed in Figure 4.15. This scenario defines three regions with different con-figurations concerning the mobile network characteristics. The Tiergartentunnelhas no sufficient network coverage. Hence, region 1 is configured as a void areawith a prV alue = 1 for the Packet Retransmission Model. The region 2 south ofthis tunnel around Potsdamer Platz provides already an excellent coverage, buttypically gets crowded during rush hours. This means that the number of otherusers to compete for the overall capacity is very high, which results in a reducedavailable bandwidth for simulated vehicles. The region 3 in Schöneberg is alreadyoutside the center and less crowded, while still covered very well. During thesimulation, vehicles on two different routes join before the tunnel. The vehicleson route A start in Schöneberg (region 3), head northbound through region 2 andfinally pass the Tiergartentunnel in region 1. The origin of vehicles on route Bis the Potsdamer Platz in region 2. After a right-turn the vehicles on this routeimmediately enter the tunnel in region 1. All vehicles in the simulation are covered
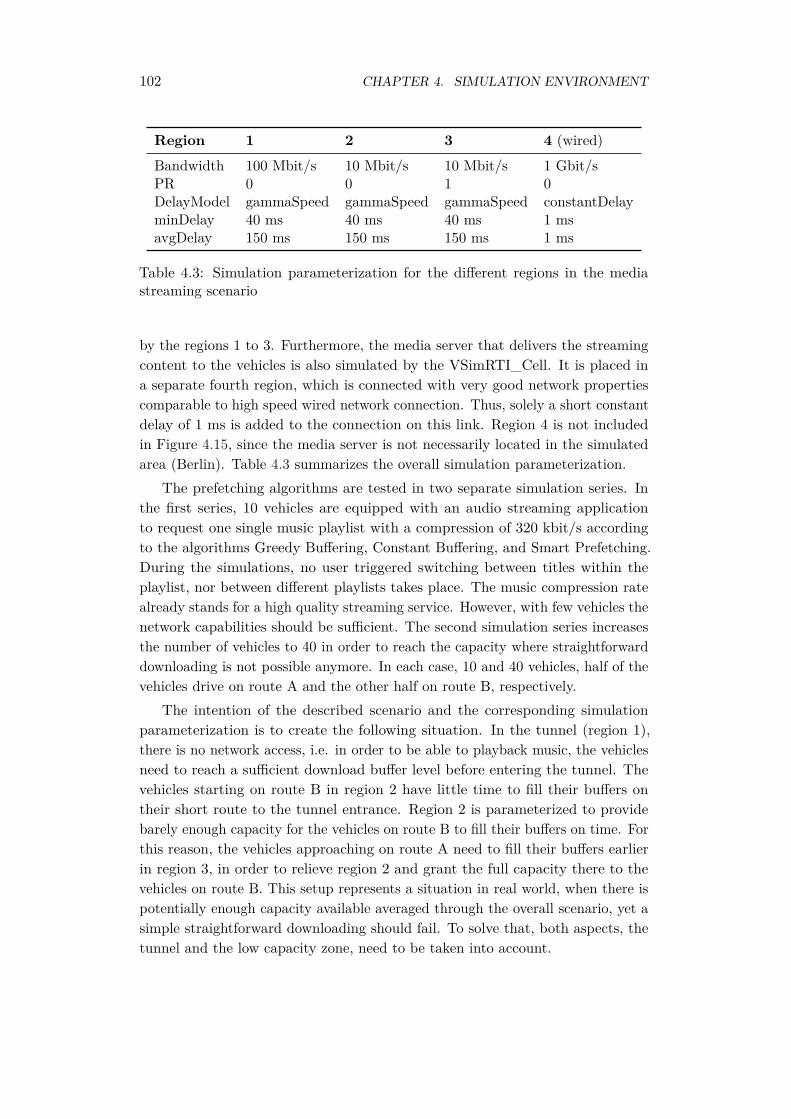
102 CHAPTER 4. SIMULATION ENVIRONMENT
Region 1 2 3 4 (wired)
Bandwidth 100 Mbit/s 10 Mbit/s 10 Mbit/s 1 Gbit/sPR 0 0 1 0DelayModel gammaSpeed gammaSpeed gammaSpeed constantDelayminDelay 40 ms 40 ms 40 ms 1 msavgDelay 150 ms 150 ms 150 ms 1 ms
Table 4.3: Simulation parameterization for the different regions in the mediastreaming scenario
by the regions 1 to 3. Furthermore, the media server that delivers the streamingcontent to the vehicles is also simulated by the VSimRTI_Cell. It is placed ina separate fourth region, which is connected with very good network propertiescomparable to high speed wired network connection. Thus, solely a short constantdelay of 1 ms is added to the connection on this link. Region 4 is not includedin Figure 4.15, since the media server is not necessarily located in the simulatedarea (Berlin). Table 4.3 summarizes the overall simulation parameterization.
The prefetching algorithms are tested in two separate simulation series. Inthe first series, 10 vehicles are equipped with an audio streaming applicationto request one single music playlist with a compression of 320 kbit/s accordingto the algorithms Greedy Buffering, Constant Buffering, and Smart Prefetching.During the simulations, no user triggered switching between titles within theplaylist, nor between different playlists takes place. The music compression ratealready stands for a high quality streaming service. However, with few vehicles thenetwork capabilities should be sufficient. The second simulation series increasesthe number of vehicles to 40 in order to reach the capacity where straightforwarddownloading is not possible anymore. In each case, 10 and 40 vehicles, half of thevehicles drive on route A and the other half on route B, respectively.
The intention of the described scenario and the corresponding simulationparameterization is to create the following situation. In the tunnel (region 1),there is no network access, i.e. in order to be able to playback music, the vehiclesneed to reach a sufficient download buffer level before entering the tunnel. Thevehicles starting on route B in region 2 have little time to fill their buffers ontheir short route to the tunnel entrance. Region 2 is parameterized to providebarely enough capacity for the vehicles on route B to fill their buffers on time. Forthis reason, the vehicles approaching on route A need to fill their buffers earlierin region 3, in order to relieve region 2 and grant the full capacity there to thevehicles on route B. This setup represents a situation in real world, when there ispotentially enough capacity available averaged through the overall scenario, yet asimple straightforward downloading should fail. To solve that, both aspects, thetunnel and the low capacity zone, need to be taken into account.
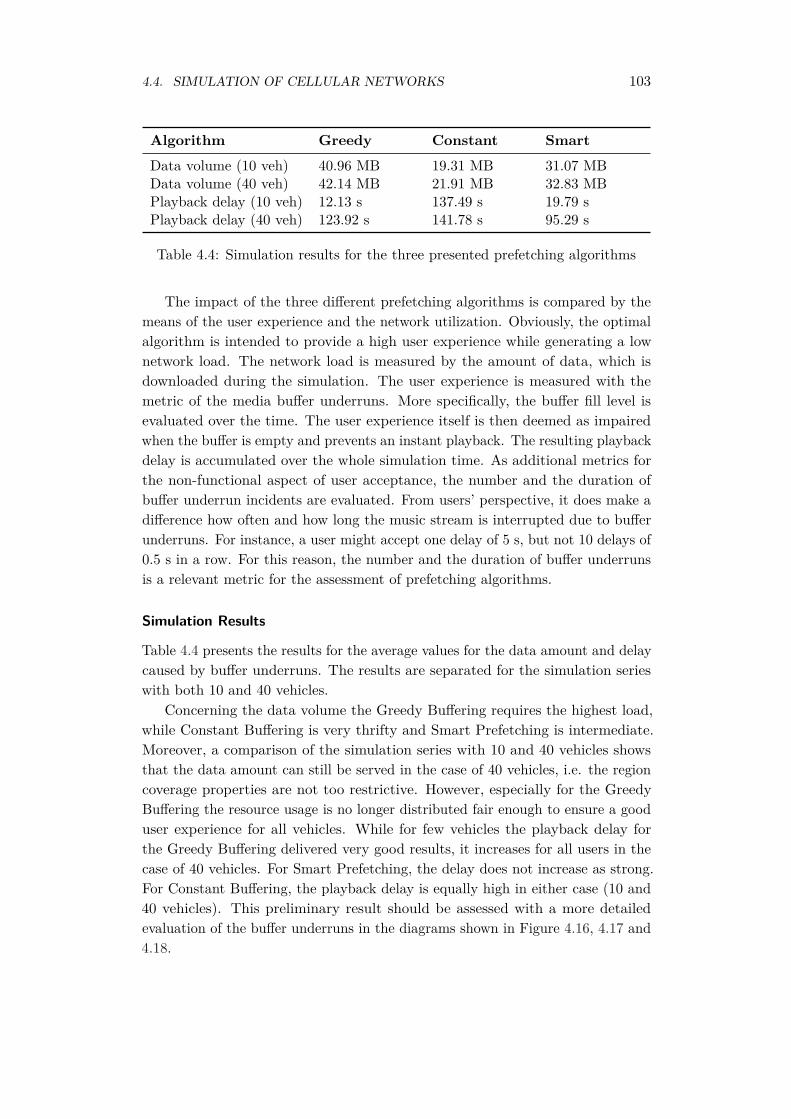
4.4. SIMULATION OF CELLULAR NETWORKS 103
Algorithm Greedy Constant SmartData volume (10 veh) 40.96 MB 19.31 MB 31.07 MBData volume (40 veh) 42.14 MB 21.91 MB 32.83 MBPlayback delay (10 veh) 12.13 s 137.49 s 19.79 sPlayback delay (40 veh) 123.92 s 141.78 s 95.29 s
Table 4.4: Simulation results for the three presented prefetching algorithms
The impact of the three different prefetching algorithms is compared by themeans of the user experience and the network utilization. Obviously, the optimalalgorithm is intended to provide a high user experience while generating a lownetwork load. The network load is measured by the amount of data, which isdownloaded during the simulation. The user experience is measured with themetric of the media buffer underruns. More specifically, the buffer fill level isevaluated over the time. The user experience itself is then deemed as impairedwhen the buffer is empty and prevents an instant playback. The resulting playbackdelay is accumulated over the whole simulation time. As additional metrics forthe non-functional aspect of user acceptance, the number and the duration ofbuffer underrun incidents are evaluated. From users’ perspective, it does make adifference how often and how long the music stream is interrupted due to bufferunderruns. For instance, a user might accept one delay of 5 s, but not 10 delays of0.5 s in a row. For this reason, the number and the duration of buffer underrunsis a relevant metric for the assessment of prefetching algorithms.
Simulation Results
Table 4.4 presents the results for the average values for the data amount and delaycaused by buffer underruns. The results are separated for the simulation serieswith both 10 and 40 vehicles.
Concerning the data volume the Greedy Buffering requires the highest load,while Constant Buffering is very thrifty and Smart Prefetching is intermediate.Moreover, a comparison of the simulation series with 10 and 40 vehicles showsthat the data amount can still be served in the case of 40 vehicles, i.e. the regioncoverage properties are not too restrictive. However, especially for the GreedyBuffering the resource usage is no longer distributed fair enough to ensure a gooduser experience for all vehicles. While for few vehicles the playback delay forthe Greedy Buffering delivered very good results, it increases for all users in thecase of 40 vehicles. For Smart Prefetching, the delay does not increase as strong.For Constant Buffering, the playback delay is equally high in either case (10 and40 vehicles). This preliminary result should be assessed with a more detailedevaluation of the buffer underruns in the diagrams shown in Figure 4.16, 4.17 and4.18.
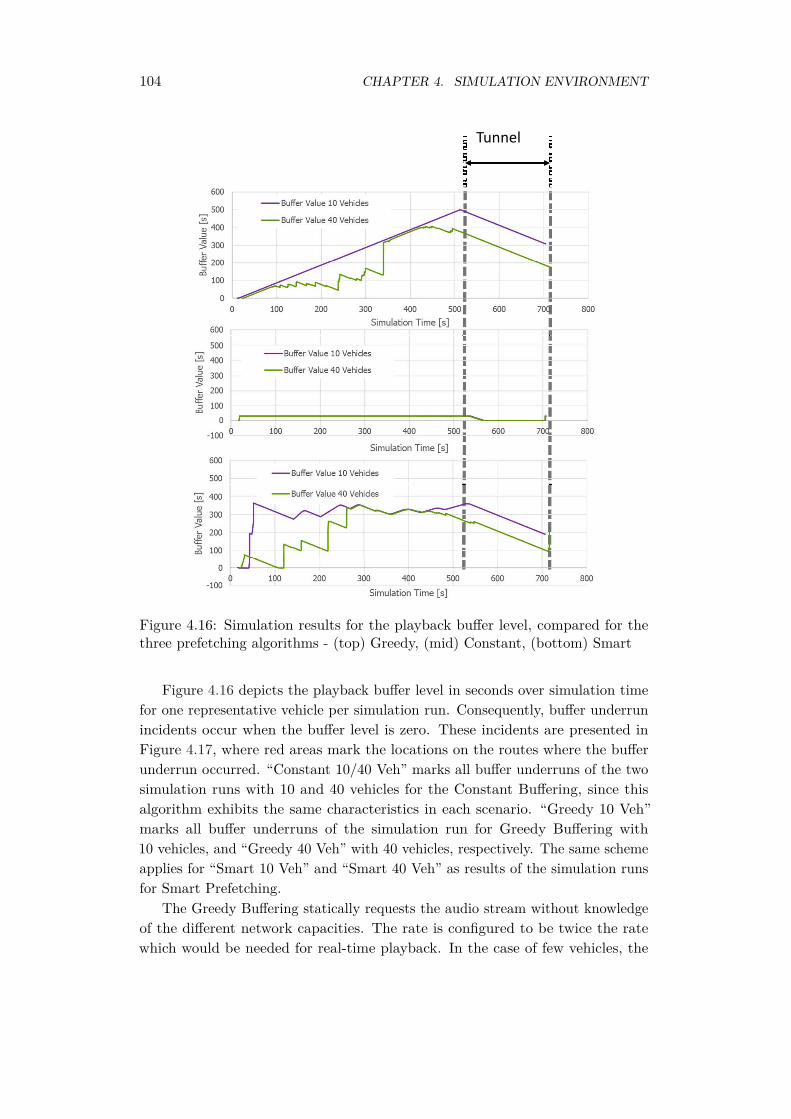
104 CHAPTER 4. SIMULATION ENVIRONMENT
Figure 4.16: Simulation results for the playback buffer level, compared for thethree prefetching algorithms - (top) Greedy, (mid) Constant, (bottom) Smart
Figure 4.16 depicts the playback buffer level in seconds over simulation timefor one representative vehicle per simulation run. Consequently, buffer underrunincidents occur when the buffer level is zero. These incidents are presented inFigure 4.17, where red areas mark the locations on the routes where the bufferunderrun occurred. “Constant 10/40 Veh” marks all buffer underruns of the twosimulation runs with 10 and 40 vehicles for the Constant Buffering, since thisalgorithm exhibits the same characteristics in each scenario. “Greedy 10 Veh”marks all buffer underruns of the simulation run for Greedy Buffering with10 vehicles, and “Greedy 40 Veh” with 40 vehicles, respectively. The same schemeapplies for “Smart 10 Veh” and “Smart 40 Veh” as results of the simulation runsfor Smart Prefetching.
The Greedy Buffering statically requests the audio stream without knowledgeof the different network capacities. The rate is configured to be twice the ratewhich would be needed for real-time playback. In the case of few vehicles, the
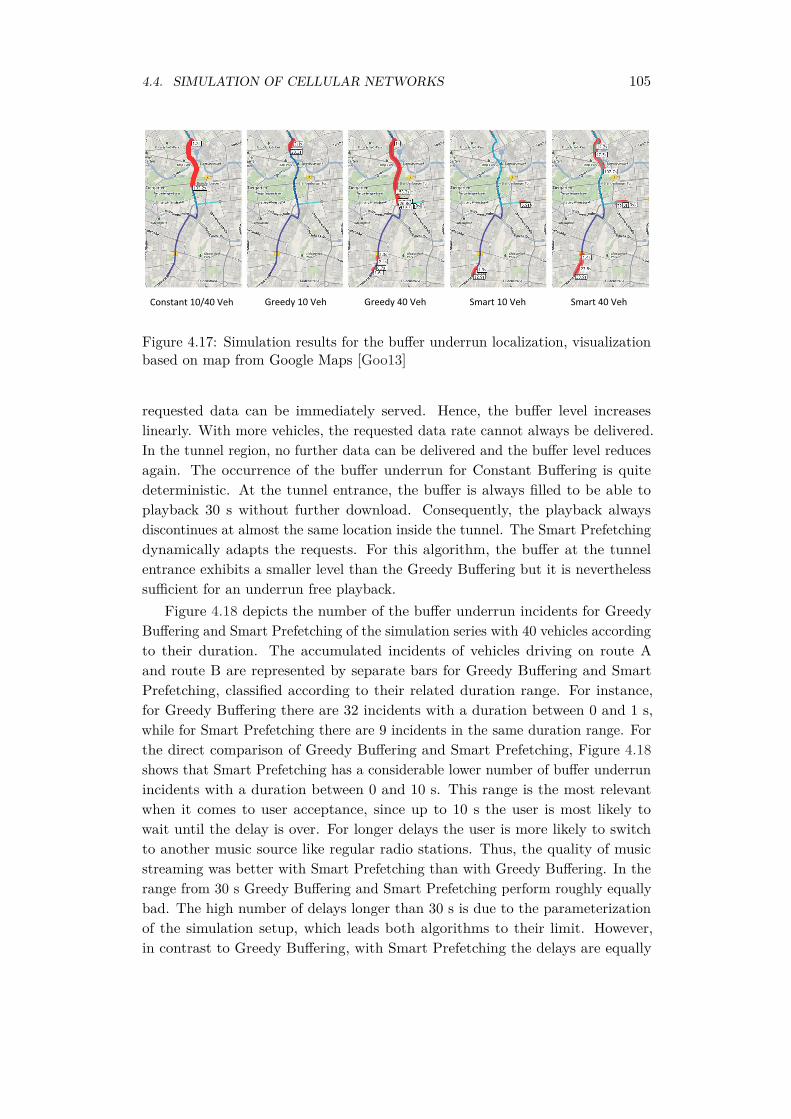
4.4. SIMULATION OF CELLULAR NETWORKS 105
Constant 10/40 Veh Greedy 10 Veh Greedy 40 Veh Smart 40 VehSmart 10 Veh
Figure 4.17: Simulation results for the buffer underrun localization, visualizationbased on map from Google Maps [Goo13]
requested data can be immediately served. Hence, the buffer level increaseslinearly. With more vehicles, the requested data rate cannot always be delivered.In the tunnel region, no further data can be delivered and the buffer level reducesagain. The occurrence of the buffer underrun for Constant Buffering is quitedeterministic. At the tunnel entrance, the buffer is always filled to be able toplayback 30 s without further download. Consequently, the playback alwaysdiscontinues at almost the same location inside the tunnel. The Smart Prefetchingdynamically adapts the requests. For this algorithm, the buffer at the tunnelentrance exhibits a smaller level than the Greedy Buffering but it is neverthelesssufficient for an underrun free playback.
Figure 4.18 depicts the number of the buffer underrun incidents for GreedyBuffering and Smart Prefetching of the simulation series with 40 vehicles accordingto their duration. The accumulated incidents of vehicles driving on route Aand route B are represented by separate bars for Greedy Buffering and SmartPrefetching, classified according to their related duration range. For instance,for Greedy Buffering there are 32 incidents with a duration between 0 and 1 s,while for Smart Prefetching there are 9 incidents in the same duration range. Forthe direct comparison of Greedy Buffering and Smart Prefetching, Figure 4.18shows that Smart Prefetching has a considerable lower number of buffer underrunincidents with a duration between 0 and 10 s. This range is the most relevantwhen it comes to user acceptance, since up to 10 s the user is most likely towait until the delay is over. For longer delays the user is more likely to switchto another music source like regular radio stations. Thus, the quality of musicstreaming was better with Smart Prefetching than with Greedy Buffering. In therange from 30 s Greedy Buffering and Smart Prefetching perform roughly equallybad. The high number of delays longer than 30 s is due to the parameterizationof the simulation setup, which leads both algorithms to their limit. However,in contrast to Greedy Buffering, with Smart Prefetching the delays are equally
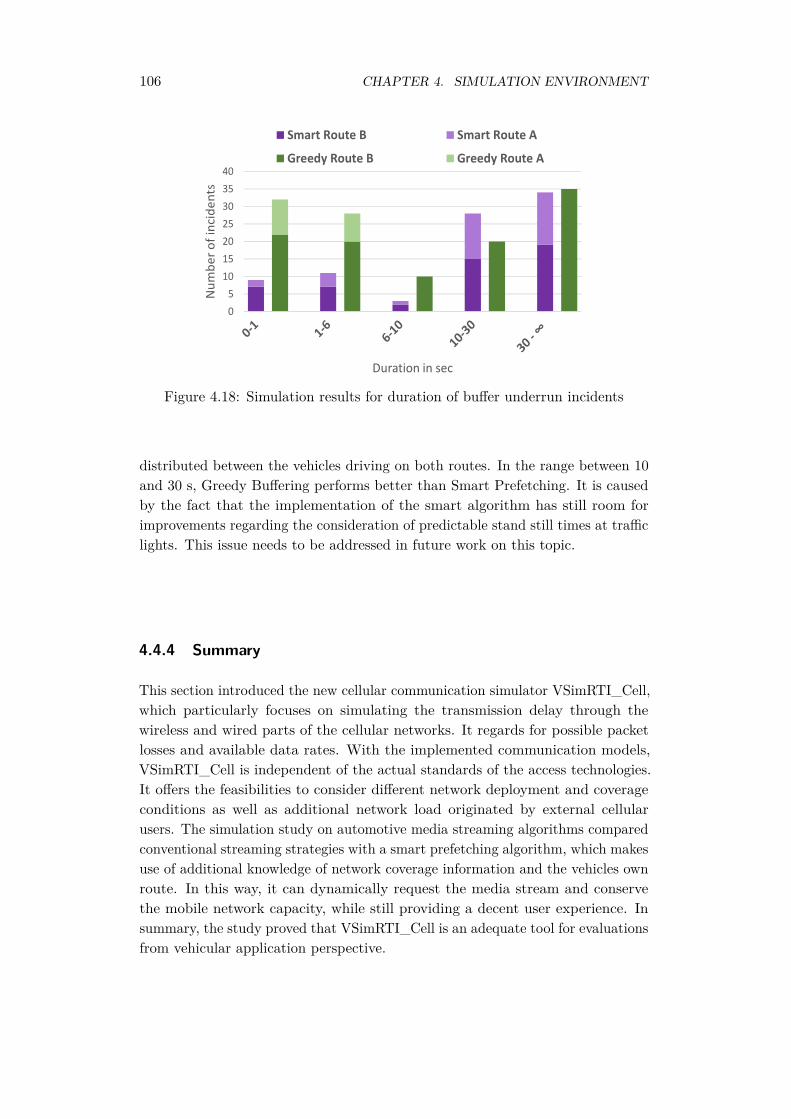
106 CHAPTER 4. SIMULATION ENVIRONMENT
Figure 4.18: Simulation results for duration of buffer underrun incidents
distributed between the vehicles driving on both routes. In the range between 10and 30 s, Greedy Buffering performs better than Smart Prefetching. It is causedby the fact that the implementation of the smart algorithm has still room forimprovements regarding the consideration of predictable stand still times at trafficlights. This issue needs to be addressed in future work on this topic.
4.4.4 Summary
This section introduced the new cellular communication simulator VSimRTI_Cell,which particularly focuses on simulating the transmission delay through thewireless and wired parts of the cellular networks. It regards for possible packetlosses and available data rates. With the implemented communication models,VSimRTI_Cell is independent of the actual standards of the access technologies.It offers the feasibilities to consider different network deployment and coverageconditions as well as additional network load originated by external cellularusers. The simulation study on automotive media streaming algorithms comparedconventional streaming strategies with a smart prefetching algorithm, which makesuse of additional knowledge of network coverage information and the vehicles ownroute. In this way, it can dynamically request the media stream and conservethe mobile network capacity, while still providing a decent user experience. Insummary, the study proved that VSimRTI_Cell is an adequate tool for evaluationsfrom vehicular application perspective.

4.5. SUMMARY OF SIMULATION ENVIRONMENT 107
4.5 Summary of Simulation Environment
All in all, this chapter presented the necessary extensions for the simulationenvironment VSimRTI to be prepared for the simulation study on V2X communi-cation in heterogeneous networks in the next Chapter 5. The model improvementsof the radio propagation and Physical Layer characteristics for ad hoc commu-nication are important for more realistic simulations. It was proved that themost prominent challenges for the operation of V2X applications result from thelimited communication range and the lack of deterministic quality of service of theunderlying ad hoc system. The information transmission over cellular networkswith its distinctive benefits could complement the ad hoc approach. However, thehigh complexity and configurability of cellular networks poses certain difficultiesfor the simulation modeling. The novel simulator VSimRTI_Cell overcomes theseissues as it introduces a suitable grade of abstraction for the cellular network.This tool is lightweight and fast enough for larger scale simulations. Moreover, itsupports particular features as Geo addressing and MBMS, which are importantfor many V2X applications. As a result of all implementation efforts presented inthis chapter, the VSimRTI simulation framework does not only allow to simulateeither ad hoc or cellular networks in isolated scenarios. It actually enables theinvestigations where both technologies are combined in an intelligent way in anintegrated scenario. Such a simulation study will be performed in the followingChapter 5.

Chapter 5
Simulation Analysis
This chapter consolidates the findings from the previous parts and presents the finalsimulation analysis. The first part will describe the application specific metrics.The setup will be presented in the second part. Finally, the simulation results arediscussed.
This simulation study shows one solution where ad hoc and cellular communi-cation will be combined in one scenario to support the information exchange ofV2X applications over heterogeneous networks. The possible solutions for furtherdevelopment and employment of the technologies are co-existence, where data ex-change is strictly separated to different technologies by services, and convergence,where both technologies are integrated into one network. Convergence in turn,could be enabled on different levels and on different layers of the communicationstack. The presented solution aims for convergence on the application layer[PSR17]. To regard for a general statement on the communication performance,this evaluate will not only address a single application. Therefore, the usedmetrics are application layer metrics, which are significant for a broad spectrumof applications.
5.1 Evaluation Metrics
The application - and hence the communication performance in the simulationscenario should be evaluated with two distinct metrics.
5.1.1 Safety metric
For safety use cases, it is particularly relevant that the periodically transmittedinformation (in CAMs) reach the destined receivers in time. The Consecutive
109
110 CHAPTER 5. SIMULATION ANALYSIS
CAM Period (CCP), which was introduced as communication metric in Section 2.2in Equation 2.2, is able to measure exactly this requirement during individual sit-uations with dynamic changes regarding the communication properties [PSR14b].
According to this definition the CCP depends initially on the sending rate fsof the CAMs and the communication quality, which is actually the property thatshould be measured. In case of ad hoc communication with single hop broadcastof messages to the neighbors in the communication range, packet losses due tofading or shadowing would lead to an increased CCP compared to the sending rate.Hence, the CCP is qualified to measure burst errors. In case of communication overa cellular network, packet losses are mitigated through methods of (hybrid) ARQwith message retransmissions on the different layers. However, higher transmissionlatencies than the sending rate may be the result and in turn out-of-order deliveryfor the individual packets. The CCP is also qualified to measure this case, whichleads to an increased CCP as only the freshest updates are useful for the safetyapplications.
With the given definition, the sole CCP inhibits some minor drawbacks. First,the range of the CCP is in the interval of [ 1
fs,∞). Particularly the case of
high values of the CCP, when the potential receiver never receives updates fromthe sender, could have two reasons. It could either depict critical burst errors.However, the two nodes could also be located far away from each other to beanyway out of communication range and thus most probably also out of mutualrelevance. Second, the CCP actually measures the supported real-time capabilityfor the certain use cases and the use cases could have very different requirementstowards this reaction time.
Hence, the evaluation of the CCP should primarily consider all CCP timespans tccp where the node i is in the relevance area tR of a regarded sender andwhere the tccp is smaller or equal than the real-time requirement τ plus a shorttime difference δt. This short time difference accounts for tolerable jitters in themessage transmission. The Safe Time Ratio (STR) results when this value isnormalized with the time span where the nodes are in the relevance area. It isdescribed in (Equation 5.1).
STRi(τ) =∑{tccp(i)|tccp(i) ∈ tR ∧ tccp(i) ≤ τ + δt}∑
tR(5.1)
The name Safe Time Ratio (STR) was also coined in related work [SBJ+14].With the definition of the STR to regard all measures less or equal than a specificvalue it shows similarities to the calculation of cumulative distribution function(CDF) of the distribution of the CCP. Actually, the complementary CDF is usedin literature for the measurement of unreliable periods [KGHS12]. Furthermore,the T-window reliability gives the probability that at least one message fromthe considered neighbor is received during a tolerance time window T [BK06].Accordingly, T indicates the delay requirement of the given CAM based safety
5.2. SIMULATION SETUP 111
application. For the identification of unreliable periods, the complementary CDFcan be used [KGHS12].
Besides, the regular information refresh can also be measured with a slightlydifferent metric, the number of Invisible Neighbors [LP11]. It is the number ofnodes that are in the vicinity of an ego-node, but their periodic messages havenot been received within a certain time-frame. According to this principle, theAwareness Quality calculates the ratio of visible neighbors to all neighbors [SL11].
5.1.2 Efficiency metric
Due to a higher distance horizon towards the traffic situation, efficiency use caseshave more delay tolerant characteristics. The quality of information receptioncould be calculated with a mean squared error metric regarding the receivedinformation, according to Equation 5.2. This metric considers the deviation of theperceived information data D̂(i) at the individual vehicle node i in comparison tothe data of the actual reference situation D. For better scalability, the MSE isnormalized with the norm of the reference data D.
MSEi = E[
1‖D‖2
∥∥∥D̂(i)−D∥∥∥2]
(5.2)
For the simulated applications, the current speed from the transmitted CAMsas well as Floating Car Data (FCD) messages as represent the parameter of theinformation. For the simulation, the reference data D directly depends on thegenerated mobility pattern from the traffic simulator.
5.2 Simulation Setup
One particular aim of the simulation is the presentation of the features of ourintroduced cellular simulator VSimRTI_Cell [PMR14a]. Thus, this simulator ispart of the simulation setup. In general, the setup includes the following simulatorsfor the different domains:
Traffic The microscopic traffic simulator SUMO [KEBB12] simulates a realisticmobility pattern for the vehicles in the scenario.
Application The VSimRTI internal simulator VSimRTI_App serves as a datagenerator for the communication messages and hosts the application logicfor message reception and maintaining of a local dynamic map (LDM).
Ad hoc communication The network simulator OMNeT++ simulates theIEEE 802.11p based communication stack and realistic radio propagationwith fading and shadowing characteristics, introduced in Section 4.2.
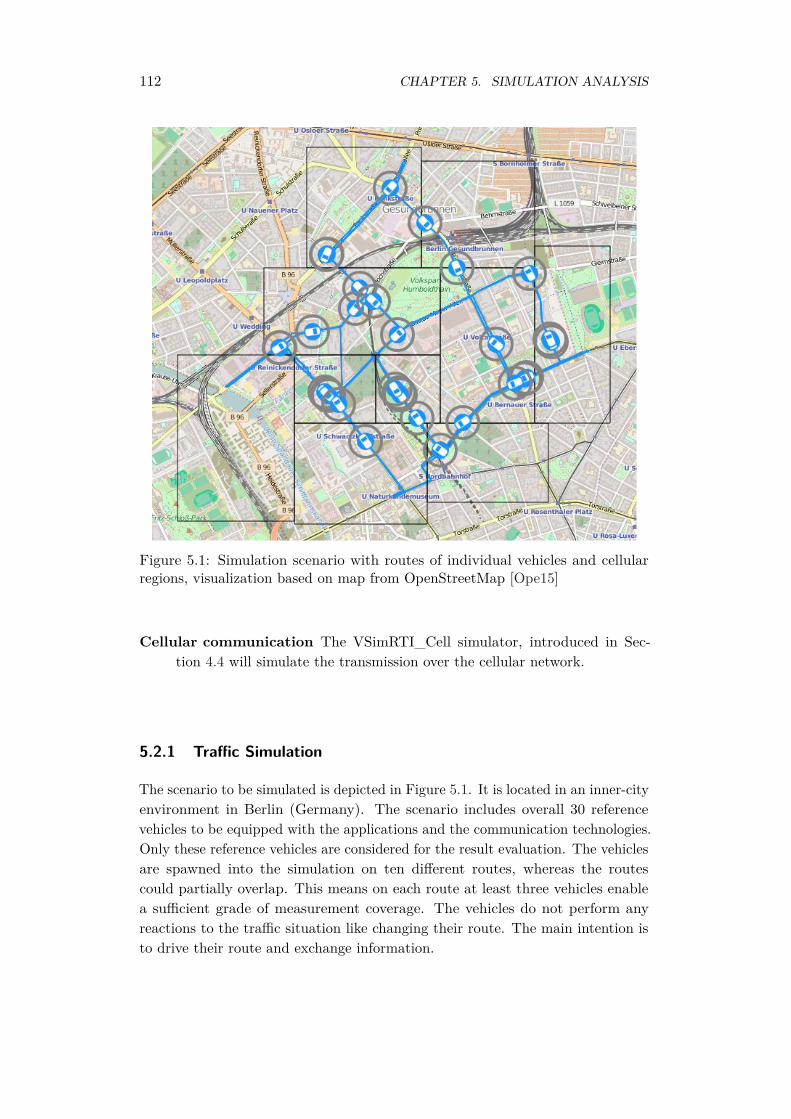
112 CHAPTER 5. SIMULATION ANALYSIS
Figure 5.1: Simulation scenario with routes of individual vehicles and cellularregions, visualization based on map from OpenStreetMap [Ope15]
Cellular communication The VSimRTI_Cell simulator, introduced in Sec-tion 4.4 will simulate the transmission over the cellular network.
5.2.1 Traffic Simulation
The scenario to be simulated is depicted in Figure 5.1. It is located in an inner-cityenvironment in Berlin (Germany). The scenario includes overall 30 referencevehicles to be equipped with the applications and the communication technologies.Only these reference vehicles are considered for the result evaluation. The vehiclesare spawned into the simulation on ten different routes, whereas the routescould partially overlap. This means on each route at least three vehicles enablea sufficient grade of measurement coverage. The vehicles do not perform anyreactions to the traffic situation like changing their route. The main intention isto drive their route and exchange information.

5.2. SIMULATION SETUP 113
5.2.2 Application Simulation
The application logic is separated into three individual parts to be deployed on thevehicles and one application for a traffic efficiency server in the internet. However,the simulated applications will not influence the traffic behavior with active routechanging or similar actions.
VehicleMainModule implements the basic application facilities and should beequipped on the vehicle in every variation. It collects the sensor and location,speed, heading data to be included in the CAMs. Moreover, it maintainsthe LDM from sensor data as well as received messages from the ad hoc andcellular network. More specifically, the LDM implements a data matchingof the information to a grid with geographic pixels. The LDM facility isfirst the entity that enables the transfer of periodically updated information(e.g. to support safety use cases) into time tolerant information (e.g. tosupport use cases with a greater overview). Second, the LDM is the pivotalpoint to connect the information from ad hoc and cellular communication.
VehicleAdhocModule uses the data from the VehicleMainModule and commu-nicates the data via IEEE 802.11p. It implements two different messagesto be periodically disseminated. The CAMs only include the freshest localsensor data. The FCD messages summarize the information in the LDM andmap them to the central point of a geographic pixel before dissemination.Thus, it has two main parameters for the regular sending period of theCAMs and the FCD messages.
VehicleCellModule is the analogous component to the VehicleAdhocModule tocommunicate over the cellular network. This module supports an additionalconfiguration for the local CAM destination area to be processed by theGEO in the cellular network. Moreover, it additionally sends CAMs perunicast to the Traffic Server. However, this application does not send FCDmessages as they are management centrally by the ServerModule.
ServerModule is the application on the server and maintains a central mapwith the same configuration as the LDM. It collects traffic information ofthe CAMs from the registered vehicles and periodically disseminates FCDmessages back to the vehicles.
Table 5.1 outlines the specific configurations for the most important parametersof the individual application modules. Some parameters apply for multipleapplication modules.

114 CHAPTER 5. SIMULATION ANALYSIS
Parameter Application Module ValueLDM Grid Size VehicleMainModule, ServerModule 20x20 pixelsLDM Pixel Sidelength VehicleMainModule, ServerModule 200 mCAM Interval VehicleAdhocModule, VehicleCellModule 100 msCAM GeoRadius VehicleCellModule 695 mCAM2ServerInterval VehicleCellModule 1 sFCD Interval VehicleAdhocModule, ServerModule 10 s
Table 5.1: Simulation parameters for the application modules
5.2.3 Communication Simulation
The communication networks are simulated by OMNeT++ (ad hoc) and VSim-RTI_Cell (cellular).
OMNeT++ uses the advanced communication models for the site-specific prop-agation, particularly shadowing characteristics [PSR14a]. Moreover, OMNeT++simulates the IEEE 802.11p based communication stack with the parametriza-tion from Table 5.2. The given models for MAC and PHY layer respect for allimportant aspects as hidden terminals.
VSimRTI_Cell simulates the different cellular regions, depicted as blackrectangles in Figure 5.1. The region locations and expansions conform to data fromOpenCellID (http://opencellid.org). All regions possess equal parametrizationsfor the communication properties. The configuration is presented in Table 5.2. Itassumes an up-to-date HSPA network with capacity and delay properties to bein-line with recent measurements [SGV+09, PPHP09, TEMLP10]. The TrafficServer is located in a specific region with the properties of the overall network tosimulate a well-connected Internet server.
5.2.4 Simulation Variations
The subsequent simulation series investigates three different scenarios where allreference vehicles in the simulation are equipped with a variation of the applicationmodules.
ad hoc VehicleMainModule + VehicleAdhocModule
cellular VehicleMainModule + VehicleCellModule
hybrid VehicleMainModule + VehicleAdhocModule + VehicleCellModule
The Internet based traffic server is equipped in all scenarios with the Server-Module. In the given assumption, however, it is only able to receive and sendmessages over the cellular network. Hence, the traffic server could only interactwith the vehicles with the VehicleCellModule.
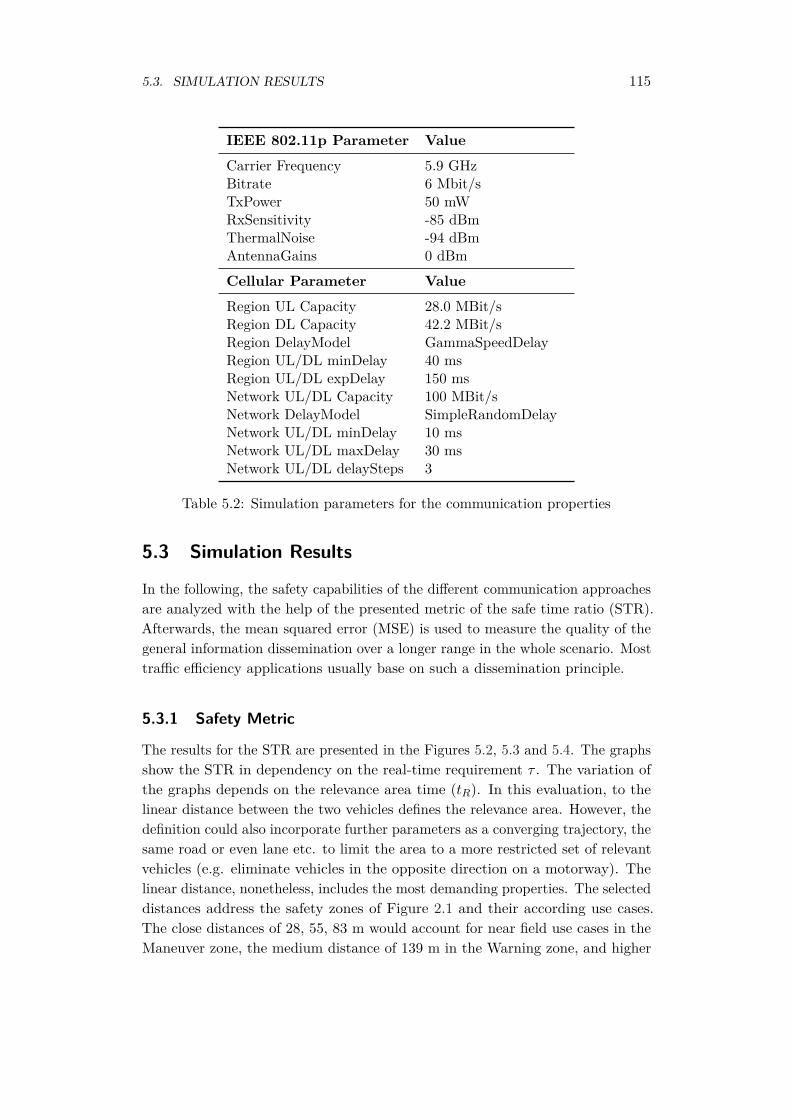
5.3. SIMULATION RESULTS 115
IEEE 802.11p Parameter ValueCarrier Frequency 5.9 GHzBitrate 6 Mbit/sTxPower 50 mWRxSensitivity -85 dBmThermalNoise -94 dBmAntennaGains 0 dBm
Cellular Parameter ValueRegion UL Capacity 28.0 MBit/sRegion DL Capacity 42.2 MBit/sRegion DelayModel GammaSpeedDelayRegion UL/DL minDelay 40 msRegion UL/DL expDelay 150 msNetwork UL/DL Capacity 100 MBit/sNetwork DelayModel SimpleRandomDelayNetwork UL/DL minDelay 10 msNetwork UL/DL maxDelay 30 msNetwork UL/DL delaySteps 3
Table 5.2: Simulation parameters for the communication properties
5.3 Simulation Results
In the following, the safety capabilities of the different communication approachesare analyzed with the help of the presented metric of the safe time ratio (STR).Afterwards, the mean squared error (MSE) is used to measure the quality of thegeneral information dissemination over a longer range in the whole scenario. Mosttraffic efficiency applications usually base on such a dissemination principle.
5.3.1 Safety Metric
The results for the STR are presented in the Figures 5.2, 5.3 and 5.4. The graphsshow the STR in dependency on the real-time requirement τ . The variation ofthe graphs depends on the relevance area time (tR). In this evaluation, to thelinear distance between the two vehicles defines the relevance area. However, thedefinition could also incorporate further parameters as a converging trajectory, thesame road or even lane etc. to limit the area to a more restricted set of relevantvehicles (e.g. eliminate vehicles in the opposite direction on a motorway). Thelinear distance, nonetheless, includes the most demanding properties. The selecteddistances address the safety zones of Figure 2.1 and their according use cases.The close distances of 28, 55, 83 m would account for near field use cases in theManeuver zone, the medium distance of 139 m in the Warning zone, and higher

116 CHAPTER 5. SIMULATION ANALYSIS
0,7
0,75
0,8
0,85
0,9
0,95
1
0 200 400 600 800 1000
STR [1]
τ [ms]
28 m (1 s)
55 m (2 s)
83 m (3 s)
139 m (5 s)
278 m (10 s)
416 m (15 s)
Figure 5.2: Results for safety metric STR for the ad hoc variation
distances of 278 and 416 m in the Awareness zone. For instance, the IntersectionCollision Warning would operate in close distances in the Maneuver zone, theElectronic Brake Light Warning in the medium area in the Warning zone and usecases with a slightly longer horizon, such as the Approaching Emergency VehicleWarning would operate in the Awareness zone. Use cases in the Information zonewould be better evaluated with the MSE as discussed later.
The results in Figure 5.2 show for the ad hoc case in the near field relevanceareas (28, 55, 83 m) that the STR already starts with sufficiently high values of 98to 99 % even for the most demanding τ of 100 ms. It quickly converges towards100 % with a more relaxed τ . This is a result from the good communicationproperties of the direct IEEE 802.11p broadcasting with very short delays in theorder of low ms and the low packet losses in close distances. The performancedecreases for increasing distances of the relevance area. Actually, the highestpresented distance of 416 m should be still well limits of the communication rangefor the given IEEE 802.11p configuration (with the parameters of transmissionpower, receiver sensitivity etc. see Table 5.2). However, the results reveal theknown PHY Layer issues of increased packet loss due fading, shadowing and alsoMAC layer coordination issues as collisions due to the Hidden Terminal Problem.Even in this moderate scenario, burst errors of spans longer than 7 consecutiveCAMs result in convergence of the STR graph towards 100 % not until a τ of700 ms. For higher relevance areas, the figures would turn out even more critical.
For the cellular case in Figure 5.3, all STR graphs show an equal trend, whichis independent from the relevance distance. Actually, this reflects the expectation

5.3. SIMULATION RESULTS 117
0,7
0,75
0,8
0,85
0,9
0,95
1
0 200 400 600 800 1000
STR [1]
τ [ms]
28 m (1 s)
55 m (2 s)
83 m (3 s)
139 m (5 s)
278 m (10 s)
416 m (15 s)
Figure 5.3: Results for safety metric STR for the cellular variation
value of the underlying models of the regions with sufficient capacities to deliverall transmitted CAMs with the given delay distribution. One can see that thereis a certain probability that messages are received out-of-order when particularmessages e.g. take a longer way through the network with a higher latency. Asthe considered safety use cases mainly require the freshest updates of the CAMsonly, older messages are dropped and neglected for the CCP and STR evaluation.That means even when the data throughput of cellular networks is acceptable, thedelay limits the performance the use cases with real-time requirements less than400 ms. This could be critical especially for use cases in the near relevance area of28 or 55 m, where ad hoc communication shows its advantages of short latencies.When the future 5th generation of cellular networks can reduce latencies to therequired scale, they could be a serious alternative for safety use cases.
For now, the hybrid approach to send CAMs via ad hoc and cellular networkscould be used as a migration path. The hybrid approach shows a similar trendas the cellular approach for the highest presented relevance distance of 416 m tosupport use cases with a τ of 400 ms fully with 100 %. It even starts at slightlyhigher figures for the most demanding τ of 100 ms as the reception of short-delayad hoc messages improves the performance. With decreasing distance for therelevance area, the ad hoc transmission appears to be dominating. Due to this,the hybrid approach delivers the equal result compared to the ad hoc approach.
Hence, it could be stated that the hybrid approach incorporates the advantagesof short latencies the ad hoc approach in the near field and also supports higherdistances as the cellular approach.
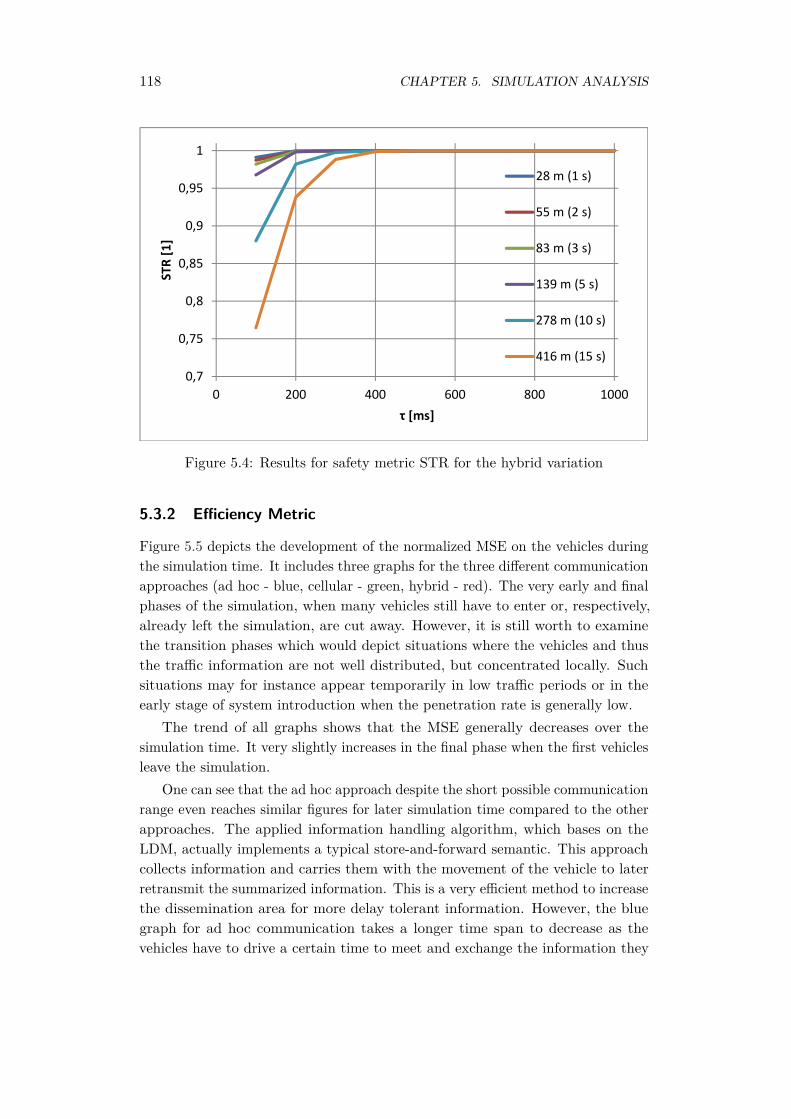
118 CHAPTER 5. SIMULATION ANALYSIS
0,7
0,75
0,8
0,85
0,9
0,95
1
0 200 400 600 800 1000
STR [1]
τ [ms]
28 m (1 s)
55 m (2 s)
83 m (3 s)
139 m (5 s)
278 m (10 s)
416 m (15 s)
Figure 5.4: Results for safety metric STR for the hybrid variation
5.3.2 Efficiency Metric
Figure 5.5 depicts the development of the normalized MSE on the vehicles duringthe simulation time. It includes three graphs for the three different communicationapproaches (ad hoc - blue, cellular - green, hybrid - red). The very early and finalphases of the simulation, when many vehicles still have to enter or, respectively,already left the simulation, are cut away. However, it is still worth to examinethe transition phases which would depict situations where the vehicles and thusthe traffic information are not well distributed, but concentrated locally. Suchsituations may for instance appear temporarily in low traffic periods or in theearly stage of system introduction when the penetration rate is generally low.
The trend of all graphs shows that the MSE generally decreases over thesimulation time. It very slightly increases in the final phase when the first vehiclesleave the simulation.
One can see that the ad hoc approach despite the short possible communicationrange even reaches similar figures for later simulation time compared to the otherapproaches. The applied information handling algorithm, which bases on theLDM, actually implements a typical store-and-forward semantic. This approachcollects information and carries them with the movement of the vehicle to laterretransmit the summarized information. This is a very efficient method to increasethe dissemination area for more delay tolerant information. However, the bluegraph for ad hoc communication takes a longer time span to decrease as thevehicles have to drive a certain time to meet and exchange the information they
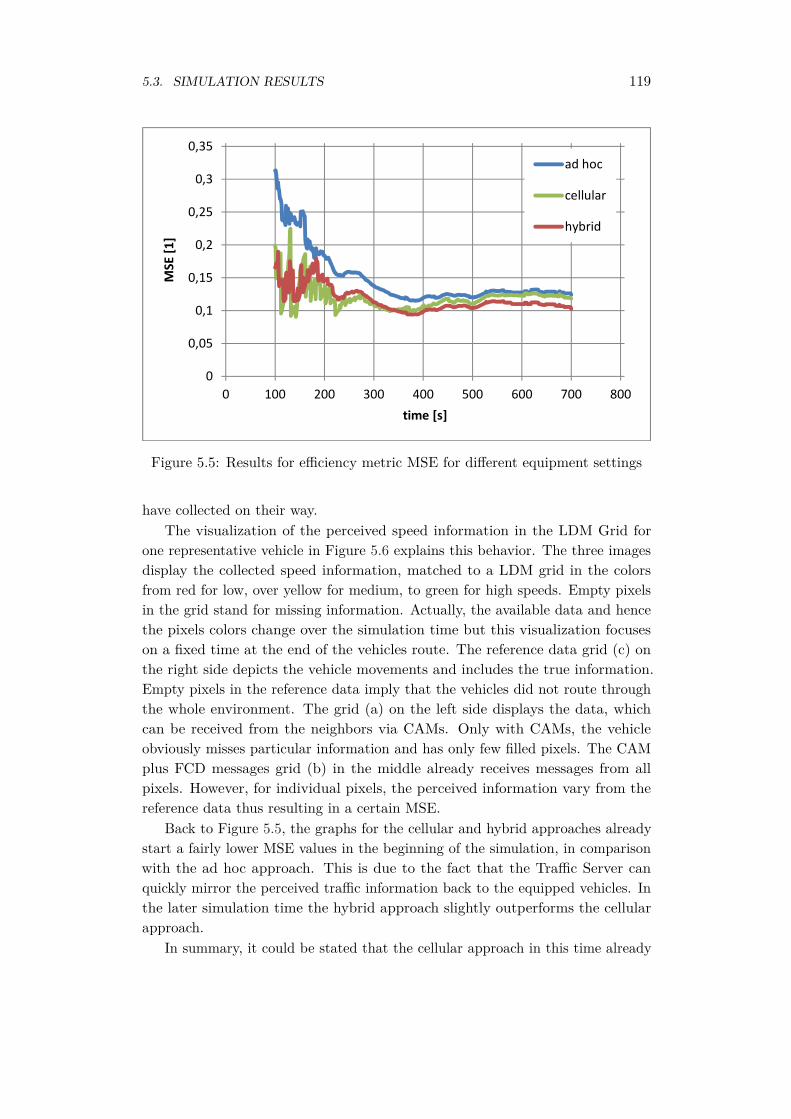
5.3. SIMULATION RESULTS 119
0
0,05
0,1
0,15
0,2
0,25
0,3
0,35
0 100 200 300 400 500 600 700 800
MSE [1]
time [s]
ad hoc
cellular
hybrid
Figure 5.5: Results for efficiency metric MSE for different equipment settings
have collected on their way.The visualization of the perceived speed information in the LDM Grid for
one representative vehicle in Figure 5.6 explains this behavior. The three imagesdisplay the collected speed information, matched to a LDM grid in the colorsfrom red for low, over yellow for medium, to green for high speeds. Empty pixelsin the grid stand for missing information. Actually, the available data and hencethe pixels colors change over the simulation time but this visualization focuseson a fixed time at the end of the vehicles route. The reference data grid (c) onthe right side depicts the vehicle movements and includes the true information.Empty pixels in the reference data imply that the vehicles did not route throughthe whole environment. The grid (a) on the left side displays the data, whichcan be received from the neighbors via CAMs. Only with CAMs, the vehicleobviously misses particular information and has only few filled pixels. The CAMplus FCD messages grid (b) in the middle already receives messages from allpixels. However, for individual pixels, the perceived information vary from thereference data thus resulting in a certain MSE.
Back to Figure 5.5, the graphs for the cellular and hybrid approaches alreadystart a fairly lower MSE values in the beginning of the simulation, in comparisonwith the ad hoc approach. This is due to the fact that the Traffic Server canquickly mirror the perceived traffic information back to the equipped vehicles. Inthe later simulation time the hybrid approach slightly outperforms the cellularapproach.
In summary, it could be stated that the cellular approach in this time already
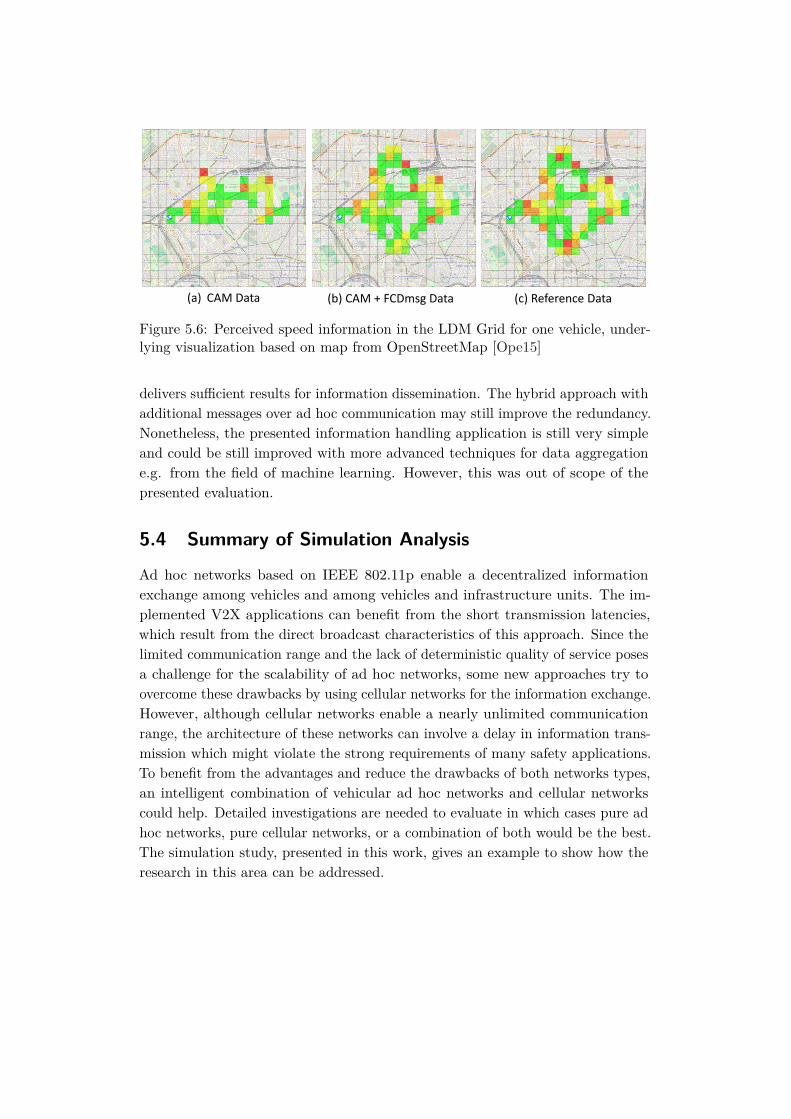
120 CHAPTER 5. SIMULATION ANALYSIS
(a) CAM Data (b) CAM + FCDmsg Data (c) Reference Data
Figure 5.6: Perceived speed information in the LDM Grid for one vehicle, under-lying visualization based on map from OpenStreetMap [Ope15]
delivers sufficient results for information dissemination. The hybrid approach withadditional messages over ad hoc communication may still improve the redundancy.Nonetheless, the presented information handling application is still very simpleand could be still improved with more advanced techniques for data aggregatione.g. from the field of machine learning. However, this was out of scope of thepresented evaluation.
5.4 Summary of Simulation Analysis
Ad hoc networks based on IEEE 802.11p enable a decentralized informationexchange among vehicles and among vehicles and infrastructure units. The im-plemented V2X applications can benefit from the short transmission latencies,which result from the direct broadcast characteristics of this approach. Since thelimited communication range and the lack of deterministic quality of service posesa challenge for the scalability of ad hoc networks, some new approaches try toovercome these drawbacks by using cellular networks for the information exchange.However, although cellular networks enable a nearly unlimited communicationrange, the architecture of these networks can involve a delay in information trans-mission which might violate the strong requirements of many safety applications.To benefit from the advantages and reduce the drawbacks of both networks types,an intelligent combination of vehicular ad hoc networks and cellular networkscould help. Detailed investigations are needed to evaluate in which cases pure adhoc networks, pure cellular networks, or a combination of both would be the best.The simulation study, presented in this work, gives an example to show how theresearch in this area can be addressed.
Chapter 6
Conclusion
The final chapter of this thesis recapitulates the presented work in a brief wayand gives an outlook for future work and improvements which are based on thegathered experiences.
6.1 Summary
Today, the many advantages of V2X communication use cases on future intelli-gent transportation systems are well-known. However, it is still unclear whichunderlying communication technologies will exhibit the potential to enable theimplemented applications. There are mainly the two possibilities of wireless adhoc network with decentralized communication as well as cellular networks withdeployed infrastructure in the back end. This thesis investigates on heterogeneoussolutions where both communication stacks will exist. Accordingly, it is possiblethat the two communication systems complement each other in certain scenariosin a meaningful way in order to fill respective technological gaps.
In principle, the different applications exhibit different characteristics andrequirements towards the communication technology. For instance, traffic safetyand efficiency applications rely on the information exchange between many endpoints, while personal comfort applications are typically limited to two points,the client and the server. Tolerable communication latencies are more strictfor safety than for efficiency applications, and so on. For these reasons, thisthesis started with a classification of conditions in several dimensions for allenvisioned applications for day one of the introduction and current applicationtrends. Additionally, it introduced the Consecutive CAM Period (CCP) as anawareness metric to address especially the comparison of the mobility-relatedapplications, as they might have the highest benefit for future transport.
121
122 CHAPTER 6. CONCLUSION
The main part of this thesis focused on enabling the investigation and com-parison of the heterogeneous ad hoc and cellular communication approach bysimulation. Therefore, the V2X Simulation Runtime Infrastructure (VSimRTI)was improved and extended in different ways. For ad hoc networks, it was, consis-tent with other research, identified that especially the modeling of the radio signalpropagation has a major impact on the communication properties. Commonsimulation models do not take into account all aspects of the highly mobile vehic-ular environments. Notable examples are characteristics as the Doppler Effect,which arises due to high vehicular speeds or the time-varying shadowing effects,which appear especially in urban settings due to the buildings. Consequently, thisthesis presented two approaches for improvements of current propagation models.The deterministic simulation of site-specific communication models accountedfor buildings as shadowing objects. The advanced statistical modeling, basedon a measurement campaign, considered all fading and shadowing effects fordifferent vehicular movement constellations and speeds in different urban andrural environments. As a result, certain applications were strongly influenced bythe communication capabilities. The other part of heterogeneous networks con-cerns cellular systems. Again, the wireless characteristics are of high importance.Additionally, these systems include a significant portion in the wired backbonenetwork. The modeling of each individual node of the whole cellular system wouldreach its limits in larger scale vehicular scenarios. On that account, this thesisintroduced a new simulator VSimRTI_Cell as solution to cover all importantaspects of the cellular networks as the radio access and the core network andvarious advanced features, e.g. (e)MBMS to enable cell-broadcast approaches.VSimRTI_Cell regards for the most important parameters such as communi-cation latencies, packet losses and cell capacities. It enables the simulation ofcommunication in local to wide-area networks with different coverage properties.
The final part of this thesis connected the preliminary working packages ina simulation study. This study analyzed reference applications for the classes oftraffic safety and efficiency with the use of the proposed evaluation metrics. Theapplications were not investigated in isolated scenarios, but simulated together inone heterogeneous scenario to explore the interdependencies of applications andad hoc and cellular communication technologies. In general, the direct ad hoccommunication could deliver lower latencies for safety critical applications in theclose range. For delay-tolerant applications, the applications used a model of aLocal Dynamic Map (LDM) for location-based data storage as the pivotal point ofinformation handling. The LDM actually enables a store-carry-forward pattern tofacilitate information exchange. Hence, the LDM increased the information rangesubstantially also for the case of decentralized ad hoc communication. However,it partially carried outdated data for distant locations. The cellular path to acentral server complemented this drawback. Finally, it could be stated that the

6.2. OUTLOOK 123
equipment of vehicles with both stacks is also more robust as it also works inareas without cellular coverage. Yet, these advantages may come at the price ofboth physical hardware for the ETSI ITS and e.g. the LTE modems.
6.2 Outlook
Certainly, this thesis could only cover a limited area of research. During the timeof working for this thesis, the Local Dynamic Map was discovered as particularlyimportant for data handling, enabling hybrid information exchange and facilitateV2X applications. Moreover, the advent of new concepts of LTE-V2X to enabledirect communication is a very interesting a relevant building block for the systemdesign of V2X communication.
The LDM is not an entirely new concept. The LDM facility to store location-based information is already specified in the ETSI ITS standard. In the meanwhile,there are different architectures for the LDM with slightly varying details, from asimple white board pattern to a layered LDM with layers parameters of differenttime dynamics. The LDM needs highly efficient algorithms for data fusion andaggregation from different input data, and extrapolation mechanisms to servedata for consuming module with different time scales. For autonomous drivingapplications, the data amount will definitely increase compared to driver assistantapplications. Therefore, filtering mechanisms could reduce the handled dataamount. For instance, an electronic horizon would limit the data topologically tothe predicted route of the vehicle. Data synchronization with Cloud or mobileedge servers would complete the concepts of a distributed system.
LTE-V2X was published in 3GPP Release 14 in June 2017, just slightly beforethe thesis completion. LTE-V2X is based on the specifications for LTE-D2D,which adds a sidelink for direct communication between UEs to the typical up-and downlink from UEs to eNodeB. For medium access control, LTE-V2X relieson Semi-persistent scheduling (SPS), a MAC approach that aims for periodictransmission attempts, similar to the alternative access approaches of STDMA andMS-ALOHA. LTE-V2X supports different modes of operation. Mode 4 specifies adistributed resource scheduling. It works without subscription to an eNodeB, thusalso in out-of-coverage scenarios. Mode 3 improves the spectral efficiency. In thismode, the transmission is still direct, e.g. from vehicle to vehicle, but the mediaaccess is managed centrally via the eNodeB, to which the vehicles are subscribed.Hence, mode 3 requires a connection with an MNO, also generates correspondingefforts for the MNOs and would not be for free. Preliminary simulation studiessee slight advantages compared to the IEEE 802.11p standardized DCF or EDCAMAC. However, these conclusions might result from the scenario assumptions ofpure periodic traffic. It would be very interesting to reproduce such simulationswith VSimRTI.

Bibliography
[3GP17] 3GPP. 3GPP TS 21.101: Technical Specification Group Services and SystemAspects; Technical Specifications and Technical Reports for a UTRAN-based3GPP system (Release 14). Technical Specification V14.0.0, 3rd GenerationPartnership Project, 03 2017. [cited at p. xii, 48, 49]
[ACC+13] Giuseppe Araniti, Claudia Campolo, Massimo Condoluci, Antonio Iera, andAntonella Molinaro. Lte for vehicular networking: a survey. CommunicationsMagazine, IEEE, 51(5):148–157, 2013. [cited at p. 61, 62, 63]
[BHvR05] Rimon Barr, Zygmunt J Haas, and Robbert van Renesse. Jist: An efficientapproach to simulation using virtual machines. Software: Practice andExperience, 35(6):539–576, 2005. [cited at p. 65]
[BK06] F. Bai and H. Krishnan. Reliability analysis of dsrc wireless communica-tion for vehicle safety applications. In Intelligent Transportation SystemsConference, 2006. ITSC’06. IEEE, pages 355–362. IEEE, 2006. [cited at p. 110]
[BMA11] Alessandro Bazzi, Barbara M Masini, and Oreste Andrisano. On the frequentacquisition of small data through rach in umts for its applications. VehicularTechnology, IEEE Transactions on, 60(7):2914–2926, 2011. [cited at p. 60, 62]
[BSKW09] Andreas Buchenscheit, Florian Schaub, Frank Kargl, and Michael Weber.A vanet-based emergency vehicle warning system. In Vehicular NetworkingConference (VNC), 2009 IEEE, pages 1–8. IEEE, 2009. [cited at p. 76, 78]
[BUS10] Katrin Bilstrup, Elisabeth Uhlemann, and Erik G Strom. Scalability issuesof the mac methods stdma and csma of ieee 802.11 p when used in vanets.In Communications Workshops (ICC), 2010 IEEE International Conferenceon, pages 1–5. IEEE, 2010. [cited at p. 44, 45]
[CAR07] CAR 2 CAR Communication Consortium. C2C-CC Manifesto - Overviewof the C2C-CC System. version 1.1, 8 2007. [cited at p. 11, 12, 13, 24, 28, 29]
[CJD09] Qi Chen, Daniel Jiang, and Luca Delgrossi. Ieee 1609.4 dsrc multi-channeloperations and its implications on vehicle safety communications. In Ve-hicular Networking Conference (VNC), 2009 IEEE, pages 1–8. IEEE, 2009.[cited at p. 32]
125

126 BIBLIOGRAPHY
[COM10] COMeSafety Project Partners. European ITS Communication Architecture- Overall Framework, Proof of Concept Implementation. Specific SupportAction 3.0, Information Society Technologies, 2 2010. [cited at p. 23]
[CON15] CONVERGE consortium. COmmunication Network VEhicle Road GlobalExtension - Deliverable D4.3 Architecture of the Car2X Systems Network.Version number 1.1, 01 2015. [cited at p. 59]
[Cox14] Christopher Cox. An Introduction to LTE: LTE, LTE-Advanced, SAE,VoLTE and 4G Mobile Communications (Second Edition). Wiley, 2 edition,7 2014. [cited at p. 48, 55, 56, 57, 58]
[CSCB09] Hector Agustin Cozzetti, Riccardo M Scopigno, Luca Casone, and GiuseppeBarba. Comparative analysis of ieee 802.11 p and ms-aloha in vanet scenarios.In Services Computing Conference, 2009. APSCC 2009. IEEE Asia-Pacific,pages 64–69. IEEE, 2009. [cited at p. 45, 46]
[DCe96] Eraldo Damosso and Luis M Correia (ed.). COST 231 - Digital mobile radiotowards future generation systems. final report, 4 1996. [cited at p. 71]
[De09] Ulrich Dietz (ed.). CoCar Feasibility Study: Technology, Business andDissemination. Public report, CoCar Consortium, 5 2009. [cited at p. 59]
[DRI14] DRIVE C2X consortium. Driving implementation and evaluation of c2xcommunication technology in europe - Deliverable D11.6 Final Report.Version 1.0, 07 2014. [cited at p. 23]
[DRW+09] Klaus Doppler, Mika Rinne, Carl Wijting, Cássio B Ribeiro, and Klaus Hugl.Device-to-device communication as an underlay to lte-advanced networks.Communications Magazine, IEEE, 47(12):42–49, 2009. [cited at p. 62]
[DRX98] Greg Durgin, Theodore S Rappaport, and Hao Xu. Measurements andmodels for radio path loss and penetration loss in and around homes andtrees at 5.85 ghz. Communications, IEEE Transactions on, 46(11):1484–1496,1998. [cited at p. 75]
[EGH+06] Tamer ElBatt, Siddhartha K Goel, Gavin Holland, Hariharan Krishnan, andJayendra Parikh. Cooperative collision warning using dedicated short rangewireless communications. In Proceedings of the 3rd international workshopon Vehicular ad hoc networks, pages 1–9. ACM, 2006. [cited at p. 20]
[ETS09] ETSI. ETSI TR 102 638: Intelligent Transport Systems (ITS); VehicularCommunications; Basic Set of Applications; Definitions. Technical Re-port Ver 1.1.1, European Telecommunications Standards Institute, 06 2009.[cited at p. x, 11, 24, 26]
[ETS10a] ETSI. ETSI EN 302 665: Intelligent Transport Systems (ITS); Commu-nications Architecture. European Standard (Telecommunications series)Ver 1.1.1, European Telecommunications Standards Institute, 09 2010.[cited at p. x, 21, 24, 25]
BIBLIOGRAPHY 127
[ETS10b] ETSI. ETSI TS 102 637-1: Intelligent Transport Systems (ITS); VehicularCommunications; Basic Set of Applications; Part 1: Functional Requirements.Technical Specification Ver 1.1.1, European Telecommunications StandardsInstitute, 09 2010. [cited at p. 11]
[ETS11a] ETSI. ETSI TR 102 862: Intelligent Transport Systems (ITS); PerformanceEvaluation of Self-Organizing TDMA as Medium Access Control MethodApplied to ITS; Access Layer Part. Technical Report Ver 1.1.1, EuropeanTelecommunications Standards Institute, 05 2011. [cited at p. 45, 46]
[ETS11b] ETSI. ETSI TR 102 863: Intelligent Transport Systems (ITS); VehicularCommunications; Basic Set of Applications; Local Dynamic Map (LDM);Rationale for and guidance on standardization. Technical Report Ver 1.1.1,European Telecommunications Standards Institute, 06 2011. [cited at p. 29]
[ETS11c] ETSI. ETSI TS 102 687: Intelligent Transport Systems (ITS); DecentralizedCongestion Control Mechanisms for Intelligent Transport Systems operatingin the 5 GHz range; Access layer part. Technical Specification Ver 1.1.1,European Telecommunications Standards Institute, 07 2011. [cited at p. 28]
[ETS12] ETSI. ETSI TR 102 861: Intelligent Transport Systems (ITS); STDMArecommended parameters and settings for cooperative ITS; Access LayerPart. Technical Report Ver 1.1.1, European Telecommunications StandardsInstitute, 01 2012. [cited at p. 45, 46]
[ETS13a] ETSI. ETSI EN 302 663: Intelligent Transport Systems (ITS); Access layerspecification for Intelligent Transport Systems operating in the 5 GHz fre-quency band. European Standard Ver 1.2.1, European TelecommunicationsStandards Institute, 07 2013. [cited at p. 25, 31]
[ETS13b] ETSI. ETSI TR 101 539-3: Intelligent Transport Systems (ITS); V2XApplications; Part 3: Longitudinal Collision Risk Warning (LCRW) applica-tion requirements specification. Technical Specification Ver 1.1.1, EuropeanTelecommunications Standards Institute, 11 2013. [cited at p. x, 12, 13, 17]
[ETS13c] ETSI. ETSI TR 101 607: Intelligent Transport Systems (ITS); CooperativeITS (C-ITS); Release 1. Technical Report Ver 1.1.1, European Telecommu-nications Standards Institute, 05 2013. [cited at p. 21, 23]
[ETS13d] ETSI. ETSI TS 102 894-1: Intelligent Transport Systems (ITS); Usersand applications requirements; Part 1: Facility layer structure, functionalrequirements and specifications. Technical Specification Ver 1.1.1, EuropeanTelecommunications Standards Institute, 08 2013. [cited at p. 24, 26]
[ETS14a] ETSI. ETSI EN 302 637-2: Intelligent Transport Systems (ITS); VehicularCommunications; Basic Set of Applications; Part 2: Specification of Coop-erative Awareness Basic Service. European Standard Ver 1.3.2, EuropeanTelecommunications Standards Institute, 11 2014. [cited at p. 14, 27, 76]
[ETS14b] ETSI. ETSI EN 302 637-3: Intelligent Transport Systems (ITS); Vehicu-lar Communications; Basic Set of Applications; Part 3: Specifications of
128 BIBLIOGRAPHY
Decentralized Environmental Notification Basic Service. European Stan-dard Ver 1.2.2, European Telecommunications Standards Institute, 11 2014.[cited at p. 14, 27]
[ETS14c] ETSI. ETSI EN 302 895: Intelligent Transport Systems (ITS); VehicularCommunications; Basic Set of Applications; Local Dynamic Map (LDM).European Standard Ver 1.1.1, European Telecommunications StandardsInstitute, 09 2014. [cited at p. 27]
[Fri46] Harald T Friis. A note on a simple transmission formula. proc. IRE,34(5):254–256, 1946. [cited at p. 37, 69]
[FV01] Martin Fellendorf and Peter Vortisch. Validation of the microscopic trafficflow model vissim in different real-world situations. In TransportationResearch Board 80th Annual Meeting, 2001. [cited at p. 66]
[Gar07] Vijay Garg. Wireless Communications & Networking (The Morgan Kauf-mann Series in Networking). Morgan Kaufmann, 1 edition, 6 2007.[cited at p. 47, 48]
[GKMG14] Norbert Goebel, Markus Koegel, Martin Mauve, and Kalman Graffi. Trace-based simulation of c2x-communication using cellular networks. In WirelessOn-demand Network Systems and Services (WONS), 2014 11th AnnualConference on, pages 108–115. IEEE, 2014. [cited at p. 91, 93]
[Goo12] Google Inc. Google Earth, Map of Berlin and surroundings. https://www.google.com/earth/, 2012. [cited at p. xi, 87]
[Goo13] Google Inc. Google Maps, Map of Berlin. https://www.google.com/maps/,2013. [cited at p. xi, 101, 105]
[Hat80] M Hata. Empirical formula for propagation loss in land mobile radioservices. Vehicular Technology, IEEE Transactions on, 29(3):317–325, 1980.[cited at p. 71]
[HCK+11] Jérôme Härri, Pasquale Cataldi, Daniel Krajzewicz, Robbin J Blokpoel,Yoann Lopez, Jeremie Leguay, Christian Bonnet, and Laura Bieker. Modelingand simulating its applications with itetris. In Proceedings of the 6th ACMworkshop on Performance monitoring and measurement of heterogeneouswireless and wired networks, pages 33–40. ACM, 2011. [cited at p. 66]
[HKRL10] Kezhu Hong, John B Kenney, Vinuth Rai, and Kenneth P Laberteaux.Evaluation of multi-channel schemes for vehicular safety communications.In Vehicular Technology Conference (VTC 2010-Spring), 2010 IEEE 71st,pages 1–5. IEEE, 2010. [cited at p. 32, 33]
[HL10] Hannes Hartenstein and Kenneth Laberteaux, editors. VANET: Vehicu-lar Applications and Inter-Networking Technologies (Intelligent TransportSystems). John Wiley & Sons, 1 edition, 2 2010. [cited at p. 29, 65, 66]
[HLR+08] Thomas R Henderson, Mathieu Lacage, George F Riley, C Dowell, andJB Kopena. Network simulations with the ns-3 simulator. SIGCOMMdemonstration, 15:17, 2008. [cited at p. 65]
BIBLIOGRAPHY 129
[HM04] Simon O. Haykin and Michael Moher. Modern Wireless Communications.Prentice Hall, 3 2004. [cited at p. 35, 36, 38, 56, 58]
[HW08] Mordechai Haklay and Patrick Weber. Openstreetmap: User-generatedstreet maps. Pervasive Computing, IEEE, 7(4):12–18, 2008. [cited at p. 72]
[IEE07] IEEE. IEEE Std 802.11-2007 (Revision of IEEE Std 802.11-1999): IEEEStandard for Information technology– Telecommunications and informationexchange between systems– Local and metropolitan area networks– Specificrequirements– Part 11: Wireless LAN Medium Access Control (MAC) andPhysical Layer (PHY) Specifications. Std, IEEE Computer Society, 12 2007.[cited at p. xii, 30, 40]
[IEE10a] IEEE. IEEE Std 1516-2010 (Revision of IEEE Std 1516-2000): IEEE Stan-dard for Modeling and Simulation (M&S) High Level Architecture (HLA)–Framework and Rules. Std, IEEE Computer Society, 8 2010. [cited at p. 67]
[IEE10b] IEEE. IEEE Std 802.11p-2010 (Amendment to IEEE Std 802.11-2007): IEEEStandard for Information technology– Telecommunications and informationexchange between systems– Local and metropolitan area networks– Specificrequirements– Part 11: Wireless LAN Medium Access Control (MAC)and Physical Layer (PHY) Specifications Amendment 6: Wireless Access inVehicular Environments. Std, IEEE Computer Society, 07 2010. [cited at p. 30,39]
[IEE11] IEEE. IEEE Std 1609.4-2010 (Revision of IEEE Std 1609.4-2006): IEEEStandard for Wireless Access in Vehicular Environments (WAVE)– Multi-channel Operation. Std, IEEE Vehicular Technology Society, 02 2011.[cited at p. x, 31, 32]
[IEE14] IEEE. IEEE Std 1609.0-2013: IEEE Guide for Wireless Access in VehicularEnvironments (WAVE)– Architecture. Std, IEEE Vehicular TechnologySociety, 03 2014. [cited at p. x, 21, 30]
[IEE16] IEEE. IEEE Std 802.11-2016 (Revision of IEEE Std 802.11-2012): IEEEStandard for Information technology– Telecommunications and informationexchange between systems– Local and metropolitan area networks– Specificrequirements Part 11: Wireless LAN Medium Access Control (MAC) andPhysical Layer (PHY) Specifications. Std, IEEE Computer Society, 12 2016.[cited at p. x, 30, 39, 40, 42, 43]
[ISO14] ISO TC 204. ISO 21217:2014 Intelligent transport systems – Communicationsaccess for land mobiles (CALM) – Architecture. Stage 60.60, InternationalStandardization Organization, 3 2014. [cited at p. 21, 24]
[ITU13] ITU-R Radiocommunication Sector. Recommendation ITU-R P.1411-7:Propagation data and prediction methods for the planning of short-rangeoutdoor radiocommunication systems and radio local area networks in thefrequency range 300 MHz to 100 GHz. P series, 09 2013. [cited at p. 71]

130 BIBLIOGRAPHY
[IWR10] Josep Colom Ikuno, Martin Wrulich, and Markus Rupp. System levelsimulation of lte networks. In Vehicular Technology Conference (VTC2010-Spring), 2010 IEEE 71st, pages 1–5. IEEE, 2010. [cited at p. 91]
[KEBB12] Daniel Krajzewicz, Jakob Erdmann, Michael Behrisch, and Laura Bieker.Recent development and applications of sumo–simulation of urban mobility.International Journal On Advances in Systems and Measurements, 5(3 and4):128–138, 2012. [cited at p. 66, 111]
[KGHS12] Bernhard Kloiber, CR Garcia, Jérôme Härri, and Thomas Strang. Updatedelay: A new information-centric metric for a combined communication andapplication level reliability evaluation of cam based safety applications. InITS World Congress, 2012. [cited at p. 20, 110, 111]
[KSEH+07] Moritz Killat, Felix Schmidt-Eisenlohr, Hannes Hartenstein, Christian Rössel,Peter Vortisch, Silja Assenmacher, and Fritz Busch. Enabling efficient andaccurate large-scale simulations of vanets for vehicular traffic management.In Proceedings of the fourth ACM international workshop on Vehicular adhoc networks, pages 29–38. ACM, 2007. [cited at p. 66]
[KSSB12] Timo Kosch, Christoph Schroth, Markus Strassberger, and Marc Bechler.Automotive Inter-networking (Intelligent Transport Systems). John Wiley &Sons, 1 edition, 4 2012. [cited at p. 12]
[LAGR14] Xingqin Lin, Jeffrey Andrews, Amitabha Ghosh, and Rapeepat Ratasuk.An overview of 3gpp device-to-device proximity services. CommunicationsMagazine, IEEE, 52(4):40–48, 2014. [cited at p. 62]
[LB98] George Liang and Henry L Bertoni. A new approach to 3-d ray tracingfor propagation prediction in cities. Antennas and Propagation, IEEETransactions on, 46(6):853–863, 1998. [cited at p. 72]
[Lee97] William C. Y. Lee. Mobile Communications Engineering: Theory andApplications. McGraw-Hill Professional, 2 edition, 10 1997. [cited at p. 75]
[LKK+16] Juho Lee, Younsun Kim, Yongjun Kwak, Jianzhong Zhang, Aris Papasakel-lariou, Thomas Novlan, Chengjun Sun, and Yingyang Li. Lte-advanced in3gpp rel-13/14: an evolution toward 5g. IEEE Communications Magazine,54(3):36–42, 2016. [cited at p. 62]
[LP11] Hongsheng Lu and Christian Poellabauer. Analysis of application-specificbroadcast reliability for vehicle safety communications. In Proceedings of theEighth ACM international workshop on Vehicular inter-networking, pages67–72. ACM, 2011. [cited at p. 111]
[Max73] James Clerk Maxwell. A Treatise on Electricity and Magnetism, volume 1.Clarendon Press, 1873. [cited at p. 35]
[MFC+10] Francisco J Martinez, Manuel Fogue, Manuel Coll, J-C Cano, Carlos TCalafate, and Pietro Manzoni. Assessing the impact of a realistic radiopropagation model on vanet scenarios using real maps. In Network Computingand Applications (NCA), 2010 9th IEEE International Symposium on, pages132–139. IEEE, 2010. [cited at p. 74]
BIBLIOGRAPHY 131
[MKH10] Thomas Mangel, Timo Kosch, and Hannes Hartenstein. A comparisonof umts and lte for vehicular safety communication at intersections. InVehicular Networking Conference (VNC), 2010 IEEE, pages 293–300. IEEE,2010. [cited at p. 60, 61, 62]
[MPHS11] J. Mittag, S. Papanastasiou, H. Hartenstein, and E.G. Ström. Enabling accu-rate cross-layer phy/mac/net simulation studies of vehicular communicationnetworks. Proceedings of the IEEE, (99):1–16, 2011. [cited at p. 80]
[MPKK10] K. Mahler, P. Paschalidis, A. Kortke, and W. Keusgen. Modeling andsimulation of small-scale fading for vehicle-to-vehicle communication. InVehicular Networking Conference (VNC), 2010 IEEE, pages 72–77. IEEE,2010. [cited at p. 81]
[MTKM09] A. Molisch, F. Tufvesson, J. Karedal, and C. Mecklenbrauker. A survey onvehicle-to-vehicle propagation channels. Wireless Communications, IEEE,16(6):12–22, 2009. [cited at p. 69, 80]
[OOKF68] Yoshihisa Okumura, Eiji Ohmori, Tomihiko Kawano, and Kaneharu Fukuda.Field strength and its variability in vhf and uhf land-mobile radio service. Rev.Electrical Communication Laboratory, 16(9):825–873, 1968. [cited at p. 71]
[Ope14] OpenStreetMap contributors. Planet dump retrieved fromhttps://planet.osm.org. https://www.openstreetmap.org, 2014.[cited at p. x, 72, 74, 78]
[Ope15] OpenStreetMap contributors. Planet dump retrieved fromhttps://planet.osm.org. https://www.openstreetmap.org, 2015.[cited at p. xi, 95, 112, 120]
[PGB+11] Giuseppe Piro, Luigi Alfredo Grieco, Gennaro Boggia, Francesco Capozzi,and Pietro Camarda. Simulating lte cellular systems: an open-sourceframework. Vehicular Technology, IEEE Transactions on, 60(2):498–513,2011. [cited at p. 91]
[PMOR12] Robert Protzmann, Kim Mahler, Konstantin Oltmann, and Ilja Radusch.Extending the v2x simulation environment vsimrti with advanced communi-cation models. In ITS Telecommunications (ITST), 2012 12th InternationalConference on, pages 683–688. IEEE, 2012. [cited at p. 81]
[PMR14a] Robert Protzmann, Kay Massow, and Ilja Radusch. An evaluation environ-ment and methodology for automotive media streaming applications. In In-novative Mobile and Internet Services in Ubiquitous Computing (IMIS), 2014Eighth International Conference on, pages 297–304. IEEE, 2014. [cited at p. 91,111]
[PMR14b] Robert Protzmann, Kay Massow, and Ilja Radusch. On performance esti-mation of prefetching algorithms for streaming content in automotive envi-ronments. In Wireless On-demand Network Systems and Services (WONS),2014 11th Annual Conference on, pages 147–147. IEEE, 2014. [cited at p. 91]
132 BIBLIOGRAPHY
[PPHP09] Jarmo Prokkola, Pekka HJ Perälä, Mikko Hanski, and Esa Piri. 3g/hspaperformance in live networks from the end user perspective. In Communica-tions, 2009. ICC’09. IEEE International Conference on, pages 1–6. IEEE,2009. [cited at p. 93, 114]
[PRE08] PRE-DRIVE C2X consortium. Preparation of driving implementation andevaluation of c2x communication technology - Deliverable D4.1 Detaileddescription of selected use-cases and corresponding technical requirements.Version 1.1, 10 2008. [cited at p. 11, 14, 42]
[PRE10] PRE-DRIVE C2X consortium. Preparation of driving implementation andevaluation of c2x communication technology - Deliverable D0.3 Final Report.Version 1.0, 09 2010. [cited at p. 23]
[PRS11] Mai-Anh Phan, Rene Rembarz, and Sabine Sories. A capacity analysisfor the transmission of event and cooperative awareness messages in ltenetworks. In 18th ITS World Congress, 2011. [cited at p. 61, 62]
[PSR11] Robert Protzmann, Björn Schünemann, and Ilja Radusch. The influences ofcommunication models on the simulated effectiveness of v2x applications.Communications Magazine, IEEE, 49(11):149–155, 2011. [cited at p. 18]
[PSR14a] Robert Protzmann, Björn Schünemann, and Ilja Radusch. On site-specificpropagation models for the evaluation of v2x applications. In CommunicationTechnologies for Vehicles (Nets4Cars-Fall), 2014 7th International Workshopon, pages 35–39. IEEE, 2014. [cited at p. 68, 114]
[PSR14b] Robert Protzmann, Björn Schünemann, and Ilja Radusch. A sensitivemetric for the assessment of vehicular communication applications. InAdvanced Information Networking and Applications (AINA), 2014 IEEE28th International Conference on, pages 697–703. IEEE, 2014. [cited at p. 18,110]
[PSR17] Robert Protzmann, Björn Schünemann, and Ilja Radusch. Simulation ofconvergent networks for intelligent transport systems with vsimrti. In BenoitHilt, Marion Berbineau, Alexey Vinel, and Alain Pirovano, editors, Network-ing Simulation for Intelligent Transportation Systems: High Mobile WirelessNodes, chapter 1, pages 1–28. John Wiley & Sons, 2017. [cited at p. 109]
[PWK+08] P. Paschalidis, M. Wisotzki, A. Kortke, W. Keusgen, and M. Peter. Awideband channel sounder for car-to-car radio channel measurements at 5.7ghz and results for an urban scenario. In Vehicular Technology Conference,2008. VTC 2008-Fall. IEEE 68th, pages 1–5. IEEE, 2008. [cited at p. 81]
[QSR08] Tobias Queck, Björn Schünemann, and Ilja Radusch. Runtime infrastructurefor simulating vehicle-2-x communication scenarios. In Proceedings of thefifth ACM international workshop on VehiculAr Inter-NETworking, pages78–78. ACM, 2008. [cited at p. 66, 67]
[Rap02] Theodore S. Rappaport. Wireless Communications: Principles and Practice(2nd Edition). Prentice Hall, 2 edition, 1 2002. [cited at p. 16, 37, 38, 69, 73, 75]

BIBLIOGRAPHY 133
[Sau13] Martin Sauter. 3G, 4G and Beyond: Bringing Networks, Devices and theWeb Together. Wiley, 2 edition, 2 2013. [cited at p. 48, 49, 50, 52, 53]
[SBJ+14] Michele Segata, Bastian Bloessl, Stefan Joerer, Christoph Sommer, MarioGerla, Renato Cigno, and Falko Dressler. Towards inter-vehicle communica-tion strategies for platooning support. In Communication Technologies forVehicles (Nets4Cars-Fall), 2014 7th International Workshop on, pages 1–6.IEEE, 2014. [cited at p. 110]
[SBL+11] Robert K Schmidt, Achim Brakemeier, Tim Leinmüller, Frank Kargl, andGünter Schäfer. Advanced carrier sensing to resolve local channel congestion.In Proceedings of the Eighth ACM international workshop on Vehicularinter-networking, pages 11–20. ACM, 2011. [cited at p. 44]
[Sch11] Björn Schünemann. V2x simulation runtime infrastructure vsimrti: Anassessment tool to design smart traffic management systems. ComputerNetworks, 55(14):3189–3198, 2011. [cited at p. 67]
[SEGD11] C. Sommer, D. Eckhoff, R. German, and F. Dressler. A computationallyinexpensive empirical model of ieee 802.11 p radio shadowing in urbanenvironments. In Wireless On-Demand Network Systems and Services(WONS), 2011 Eighth International Conference on, pages 84–90. IEEE,2011. [cited at p. 75]
[SGV+09] Clara Serrano, Beatriz Garriga, Julia Velasco, Julio Urbano, Santiago Teno-rio, and Manuel Sierra. Latency in broad-band mobile networks. In VehicularTechnology Conference, 2009. VTC Spring 2009. IEEE 69th, pages 1–7. IEEE,2009. [cited at p. 52, 53, 57, 93, 114]
[Sha48] Claude E. Shannon. A mathematical theory of communication. Bell SystemTechnical Journal, The, 27(3):379–423, 07 1948. [cited at p. 35, 47]
[sim09a] simTD consortium. Sichere Intelligente Mobilität Testfeld Deutschland -Deliverable D21.2 Konsolidierter Systemarchitekturentwurf (ConsolidatedSystem Architecture Design). Version 3.0, 10 2009. [cited at p. 59, 77]
[sim09b] simTD consortium. Sichere Intelligente Mobilität Testfeld Deutschland -Deliverable D21.4 Spezifikation der Kommunikationsprotokolle (Specificationof Communication Protocols). Version 1.0, 09 2009. [cited at p. 23]
[SL05] Henrik Schulze and Christian Lüders. Theory and Applications of OFDMand CDMA: Wideband Wireless Communications. Wiley, 1st edition, 9 2005.[cited at p. 40, 50, 56]
[SL11] R.K. Schmidt and T. Leinmüller. A spatio-temporal metric for the evaluationof cooperative awareness. In 18th World Congress on Intelligent TransportSystems, 2011. [cited at p. 111]
[SWR10] B Schunemann, J Wedel, and Ilja Radusch. V2x-based traffic congestionrecognition and avoidance. Tamkang Journal of Science and Engineering,13(1):63–70, 2010. [cited at p. 67]

134 BIBLIOGRAPHY
[SYGD08] Christoph Sommer, Zheng Yao, Reinhard German, and Falko Dressler.On the need for bidirectional coupling of road traffic microsimulation andnetwork simulation. In Proceedings of the 1st ACM SIGMOBILE workshopon Mobility models, pages 41–48. ACM, 2008. [cited at p. 66]
[TEMLP10] Santiago Tenorio, Kyriakos Exadaktylos, Brendan McWilliams, and YannickLe Pezennec. Mobile broadband field network performance with hspa+.In Wireless Conference (EW), 2010 European, pages 269–273. IEEE, 2010.[cited at p. 93, 114]
[TK75] Fouad A Tobagi and Leonard Kleinrock. Packet switching in radio channels:Part ii–the hidden terminal problem in carrier sense multiple-access and thebusy-tone solution. Communications, IEEE Transactions on, 23(12):1417–1433, 1975. [cited at p. 43, 44]
[VH08] András Varga and Rudolf Hornig. An overview of the omnet++ simulationenvironment. In Proceedings of the 1st international conference on Simulationtools and techniques for communications, networks and systems & workshops,page 60. ICST (Institute for Computer Sciences, Social-Informatics andTelecommunications Engineering), 2008. [cited at p. 65]
[Vin12] Alexey Vinel. 3gpp lte versus ieee 802.11 p/wave: which technology is able tosupport cooperative vehicular safety applications? Wireless CommunicationsLetters, IEEE, 1(2):125–128, 2012. [cited at p. 61]
[VLL15] Alexey Vinel, Lin Lan, and Nikita Lyamin. Vehicle-to-vehicle communicationin c-acc/platooning scenarios. IEEE Communications Magazine, 53(8):192–197, 2015. [cited at p. 20]
[VSN14] Antonio Virdis, Giovanni Stea, and Giovanni Nardini. Simulte - a mod-ular system-level simulator for lte/lte-a networks based on omnet++. InSimulation and Modeling Methodologies, Technologies and Applications (SI-MULTECH), 2014 International Conference on, pages 59–70, 08 2014.[cited at p. 91]
[WCML07] Christian Wewetzer, Murat Caliskan, Klaus Meier, and Andreas Luebke.Experimental evaluation of umts and wireless lan for inter-vehicle communi-cation. In Telecommunications, 2007. ITST’07. 7th International Conferenceon ITS, pages 1–6. IEEE, 2007. [cited at p. 62, 93]