V2V Safety Communication Scalability Based on the...
10
- 1 - V2V Safety Communication Scalability Based on the SAE J2945/1 Standard Ali Rostami WINLAB, Rutgers University, North Brunswick, New Jersey, USA Hariharan Krishnan General Motors, Warren, Michigan, USA Marco Gruteser WINLAB, Rutgers University, North Brunswick, New Jersey, USA Abstract Vehicle-to-Vehicle (V2V) communication provides the ability to transmit and receive Basic Safety Messages (BSMs) between vehicles, which enables a wide range of safety applications. The Society of Automotive Engineers (SAE) J2945/1 standard provides the minimum performance requirements for V2V safety communication. The V2V safety communication standard needs to ensure that safety application performance is effective, even when the number of communicating vehicles on the roadway is high. Thus, one of the challenges in V2V safety communication is the ability to support communication scalability as the number of communicating vehicles increases. The SAE J2945/1 standard for V2V safety communication includes a congestion control algorithm that supports communication scalability. This paper investigates the congestion control algorithm in the SAE J2945/1 standard via implementation of the standard in a calibrated ns-3 simulator. It compares the performance of the DSRC-based V2V safety communication with the congestion control algorithm against a baseline without congestion control, that is BSM’s are transmitted at a constant 10 Hz message rate with a transmit power of 20 dBm. The simulation results show that the scalability with the congestion control algorithm improves over the baseline algorithm. KEYWORDS: DSRC, V2V Scalability, Congestion Control, SAE J2945/1 Introduction Dedicated Short Range Communications (DSRC) uses IEEE 802.11p as the lower-layer wireless technology and is designed to operate in the 5.850-5.925 GHz band. IEEE 802.11p uses Carrier-Sense Multiple Access with Collision Avoidance (CSMA/CA) as the medium access protocol. IEEE 802.11p uses the Orthogonal Frequency-Division Multiplexing (OFDM) which is designed to operate in channels with 10 and 20 MHz bandwidth. The SAE J2945/1 standard [1] provides minimum performance requirements for V2V safety communication. In V2V safety communication, as the number of communication vehicles becomes high, the channel may reach saturation. A saturated channel negatively affects the performance of safety applications. Therefore, the SAE J2945/1 standard includes a congestion control algorithm that is part of the minimum performance requirements. The channel congestion control algorithm runs locally on each On-Board Equipment (OBE), and via adaptation of the transmission power and Inter-Transmission Time (ITT) of generated BSMs, tries to ensure that channel utilization remains below the saturation level while trying to support the performance requirements of V2V safety applications. Recently, Hsu et al. [2] reviewed J2945/1 in detail and proposed a testing methodology for the primary functions of the congestion control algorithm in the standard. This paper, however, examines the performance of V2V safety communication by implementing the congestion control algorithm presented in the SAE J2945/1 standard and conducting a number of simulations based on various levels of traffic with both controlled and realistic scenarios. Summary of the Congestion Control Standard The SAE J2945/1 standard provides V2V safety communication minimum performance requirements. This section summarizes the primary details of the congestion control algorithm that includes adaptive functions for calculation of Inter-Transmission Time (ITT) and transmission power (TxPower) for BSMs. Inter-Transmission Time is the time interval between two consecutive BSMs transmitted by an OBE on the channel. Every , the Host Vehicle (HV) counts the number of vehicles within a 100 meter radius around the vehicle and keeps a smoothed value over time. Eq. (1) is used to update the smoothed number of vehicles in 100 m range.
Transcript of V2V Safety Communication Scalability Based on the...
- 1 -
V2V Safety Communication Scalability Based on the SAE J2945/1 Standard
Ali Rostami WINLAB, Rutgers University, North Brunswick, New Jersey, USA
Hariharan Krishnan General Motors, Warren, Michigan, USA
Marco Gruteser WINLAB, Rutgers University, North Brunswick, New Jersey, USA
Abstract Vehicle-to-Vehicle (V2V) communication provides the ability to transmit and receive Basic Safety Messages (BSMs) between vehicles, which enables a wide range of safety applications. The Society of Automotive Engineers (SAE) J2945/1 standard provides the minimum performance requirements for V2V safety communication. The V2V safety communication standard needs to ensure that safety application performance is effective, even when the number of communicating vehicles on the roadway is high. Thus, one of the challenges in V2V safety communication is the ability to support communication scalability as the number of communicating vehicles increases. The SAE J2945/1 standard for V2V safety communication includes a congestion control algorithm that supports communication scalability. This paper investigates the congestion control algorithm in the SAE J2945/1 standard via implementation of the standard in a calibrated ns-3 simulator. It compares the performance of the DSRC-based V2V safety communication with the congestion control algorithm against a baseline without congestion control, that is BSM’s are transmitted at a constant 10 Hz message rate with a transmit power of 20 dBm. The simulation results show that the scalability with the congestion control algorithm improves over the baseline algorithm. KEYWORDS: DSRC, V2V Scalability, Congestion Control, SAE J2945/1 Introduction Dedicated Short Range Communications (DSRC) uses IEEE 802.11p as the lower-layer wireless technology and is designed to operate in the 5.850-5.925 GHz band. IEEE 802.11p uses Carrier-Sense Multiple Access with Collision Avoidance (CSMA/CA) as the medium access protocol. IEEE 802.11p uses the Orthogonal Frequency-Division Multiplexing (OFDM) which is designed to operate in channels with 10 and 20 MHz bandwidth. The SAE J2945/1 standard [1] provides minimum performance requirements for V2V safety communication. In V2V safety communication, as the number of communication vehicles becomes high, the channel may reach saturation. A saturated channel negatively affects the performance of safety applications. Therefore, the SAE J2945/1 standard includes a congestion control algorithm that is part of the minimum performance requirements. The channel congestion control algorithm runs locally on each On-Board Equipment (OBE), and via adaptation of the transmission power and Inter-Transmission Time (ITT) of generated BSMs, tries to ensure that channel utilization remains below the saturation level while trying to support the performance requirements of V2V safety applications. Recently, Hsu et al. [2] reviewed J2945/1 in detail and proposed a testing methodology for the primary functions of the congestion control algorithm in the standard. This paper, however, examines the performance of V2V safety communication by implementing the congestion control algorithm presented in the SAE J2945/1 standard and conducting a number of simulations based on various levels of traffic with both controlled and realistic scenarios. Summary of the Congestion Control Standard The SAE J2945/1 standard provides V2V safety communication minimum performance requirements. This section summarizes the primary details of the congestion control algorithm that includes adaptive functions for calculation of Inter-Transmission Time (ITT) and transmission power (TxPower) for BSMs. Inter-Transmission Time is the time interval between two consecutive BSMs transmitted by an OBE on the channel. Every 𝑣𝑇𝑥𝑅𝑎𝑡𝑒𝐶𝑛𝑡𝑟𝑙𝐼𝑛𝑡, the Host Vehicle (HV) counts the number of vehicles within a 100 meter radius around the vehicle and keeps a smoothed value over time. Eq. (1) is used to update the smoothed number of vehicles in 100 m range.
- 2 -
(1) 𝑁. 𝑡 = 𝜆×𝑁 𝑡 + 1 − 𝜆 ×𝑁. 𝑡 − 1
Where 𝑁. is the smoothed number of vehicles in 100 m range of HV, 𝑁 is the number of vehicles in 100 m range of HV, and 𝜆 is the smooth weight factor. The calculated 𝑁. is further used to calculate inter-transmission time through Eq. (2)
(2) 𝑀𝑎𝑥𝐼𝑇𝑇 𝑡 =
100𝑁.(𝑡) ≤ 𝐵100×<=(>)
?𝐵 < 𝑁. 𝑡 < ABCDEFF
GHH×𝐵
𝑣𝑀𝑎𝑥𝐼𝑇𝑇 ABCDEFFGHH
×𝐵 ≤ 𝑁.(𝑡)
Where 𝑀𝑎𝑥𝐼𝑇𝑇 is the calculated ITT for BSM transmission, 𝑣𝑀𝑎𝑥𝐼𝑇𝑇 is an upper bound value for 𝑀𝑎𝑥𝐼𝑇𝑇, and 𝐵 is a parameter, the density coefficient. Likewise, transmission power of each outgoing BSM is set based on the Channel Busy Percentage (CBP). CBP measurements are done every 𝑣𝐶𝐵𝑃𝑀𝑒𝑎𝑠𝐼𝑛𝑡 regardless of transmissions. When a scheduled BSM is generated, the system calculates transmission power using Eq. (3)-(5).
(3) 𝑓(𝐶𝐵𝑃) = 𝑣𝑅𝑃𝑀𝑎𝑥𝐶𝐵𝑃 ≤ 𝑣𝑀𝑖𝑛𝐶𝑈𝑣𝑅𝑃𝑀𝑎𝑥 − ANOBCDPANOBQR
ABCDSTPABQRST× 𝐶𝐵𝑃 − 𝑣𝑀𝑖𝑛𝐶𝑈 𝑣𝑀𝑖𝑛𝐶𝑈 < 𝐶𝐵𝑃 < 𝑣𝑀𝑎𝑥𝐶𝑈
𝑣𝑅𝑃𝑀𝑖𝑛𝐶𝐵𝑃 ≥ 𝑣𝑀𝑎𝑥𝐶𝑈
(4) 𝑅𝑃(𝑡) = 𝑅𝑃(𝑡 − 1) + 𝑣𝑆𝑈𝑃𝑅𝐴𝐺𝑎𝑖𝑛×(𝑓(𝐶𝐵𝑃)– 𝑅𝑃(𝑡 − 1))
(5) 𝑇𝑥𝑃𝑜𝑤𝑒𝑟 = 𝑅𝑃(𝑡)– 𝑀𝑖𝑛𝑆𝑒𝑐𝑡𝑜𝑟𝐴𝑛𝑡𝐺𝑎𝑖𝑛 + 𝐶𝐿𝑜𝑠s
Where 𝑣𝑅𝑃𝑀𝑖𝑛 and 𝑣𝑅𝑃𝑀𝑎𝑥 are the lower bound and the upper bound for Radiated Power (RP), respectively. 𝑣𝑀𝑖𝑛𝐶𝑈 and 𝑣𝑀𝑎𝑥𝐶𝑈 are the lowest and the highest thresholds for the CBP, 𝑣𝑆𝑈𝑃𝑅𝐴𝐺𝑎𝑖𝑛 is the Stateful Utilization-based Power Adaptation (SUPRA) gain, and 𝐶𝐿𝑜𝑠𝑠 is the total cable and connector losses. In the first round, 𝑅𝑃(𝑡) is initialized with 𝑣𝑅𝑃. To improve situational awareness in the cases where the vehicle is manoeuvring with significant vehicle dynamics, e.g. changing lane or accelerating/decelerating, the congestion control algorithm keeps track of the error between the position of the Host Vehicle (HV) from HV’s perspective, and position of HV from Remote Vehicle (RV) perspective. The Tracking Error (TE) will increase with transmission latencies and packet loss. To calculate TE, each HV estimates its own position using the generated kinematic data. HV also estimates its position from perspective of RVs by considering the impact of channel quality on packet delivery at RVs. Tracking error is the 2D distance between the two calculated positions. HV uses Eq. (6) to decide if an extra BSM is needed to be transmitted before a scheduled BSM calculated using 𝑀𝑎𝑥𝐼𝑇𝑇.
(6) 𝑝 𝑡 = 1 − 𝑒𝑥𝑝 −𝛼× 𝑇𝐸 𝑡 − 𝑣𝑇𝐸𝑀𝑖𝑛 b 𝑣𝑇𝐸𝑀𝑖𝑛 ≤ 𝑇𝐸 𝑡 < 𝑣𝑇𝐸𝑀𝑎𝑥1𝑇𝐸 𝑡 ≥ 𝑣𝑇𝐸𝑀𝑎𝑥0𝑜𝑡ℎ𝑒𝑟𝑤𝑖𝑠𝑒.
Where 𝑝 is the probability of an extra transmission because of 𝑇𝐸 at time 𝑡, 𝑣𝑇𝐸𝑀𝑖𝑛 and 𝑣𝑇𝐸𝑀𝑎𝑥 are the lowest and the highest tracking error thresholds, 𝑇𝐸 is the calculated tracking error, 𝛼 is the error sensitivity. The reader is referred to the SAE J2945/1 standard [1] for further details on the congestion control algorithm for V2V safety communication. Table 1 provides the parameter values used in the congestion control algorithm from the SAE J2945/1 standard. Methodology This paper investigates the performance of DSRC-based V2V safety communication scalability based on the SAE J2945/1 standard with the congestion control algorithm specified in the standard, and compares the achieved performance with respect to a baseline algorithm without congestion control, i.e. 10 Hz BSM transmission at 20 dBm. The methodology uses simulations from both a controlled, free-space scenario and a realistic freeway scenario. In this section, we first briefly introduce different metrics which are used in the performance comparison and measurements in different layers of the protocol stack. Then, we provide the scenarios that we used for the simulations, and finally,
- 3 -
present the results that compare the performance of the congestion control algorithm with that of the baseline algorithm. Simulation Scenarios To compare the performance of the congestion control algorithm with the baseline, we have generated two different set of scenarios where the cars move in different patterns.
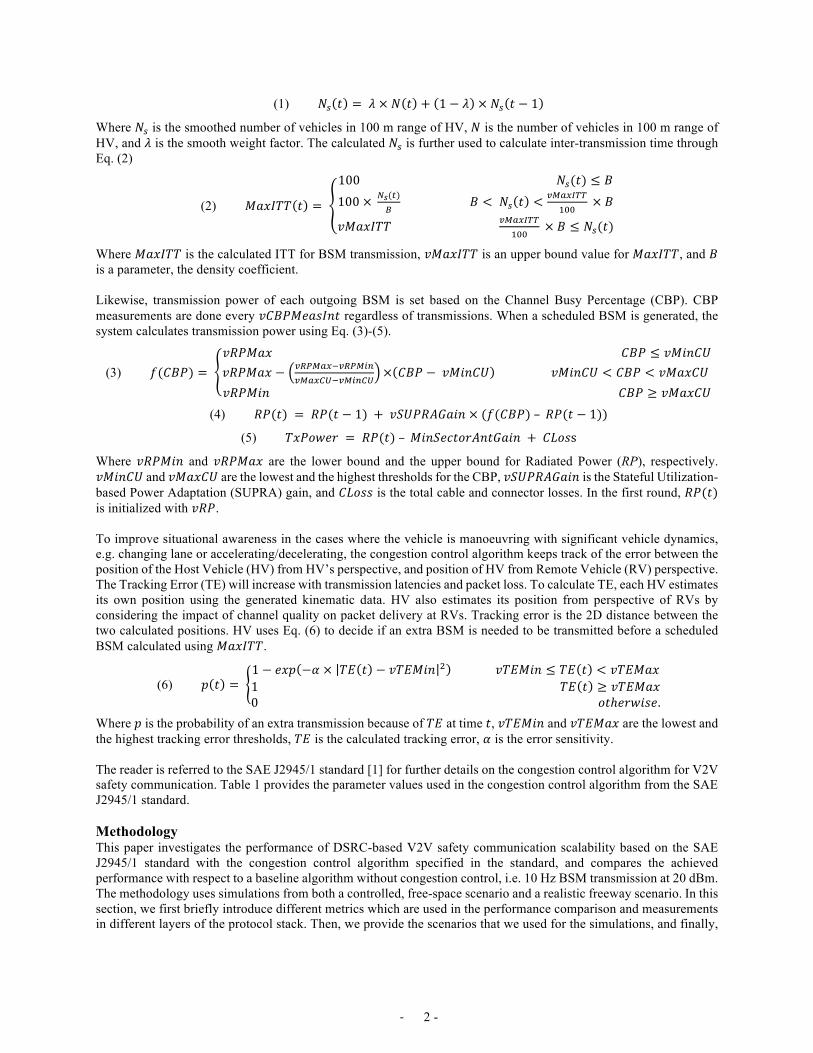
Figure 1 - Scenario A: Highway with free-space environment
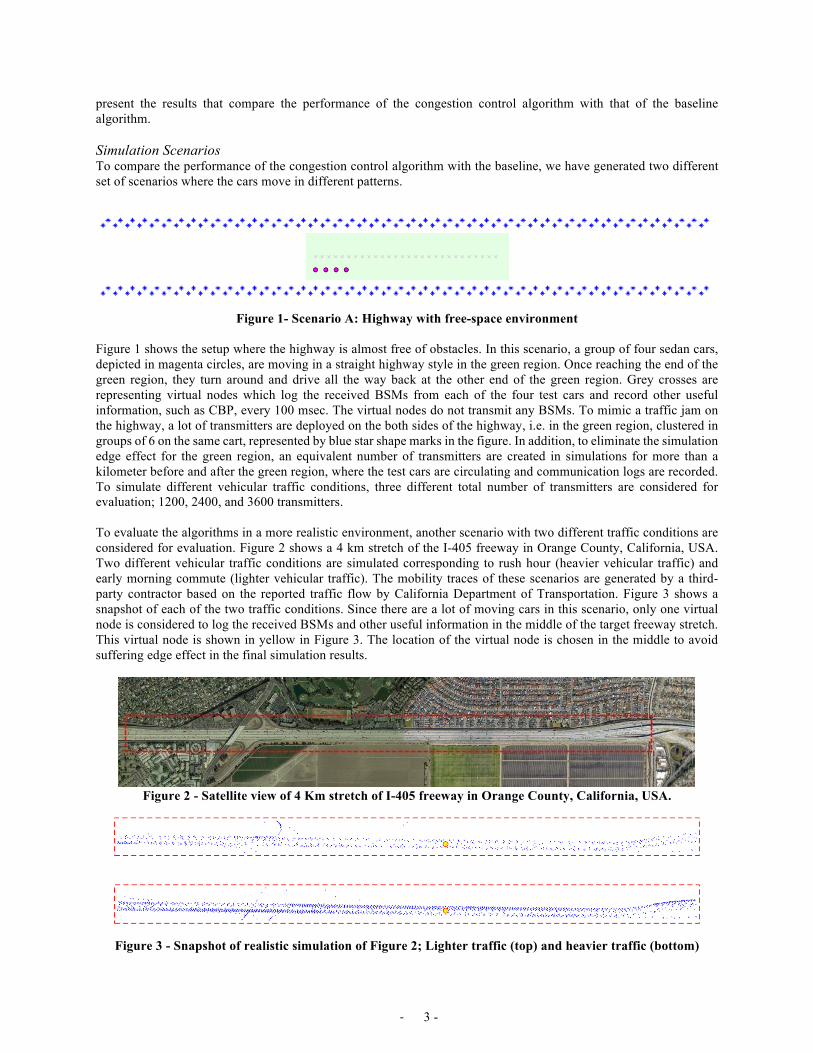
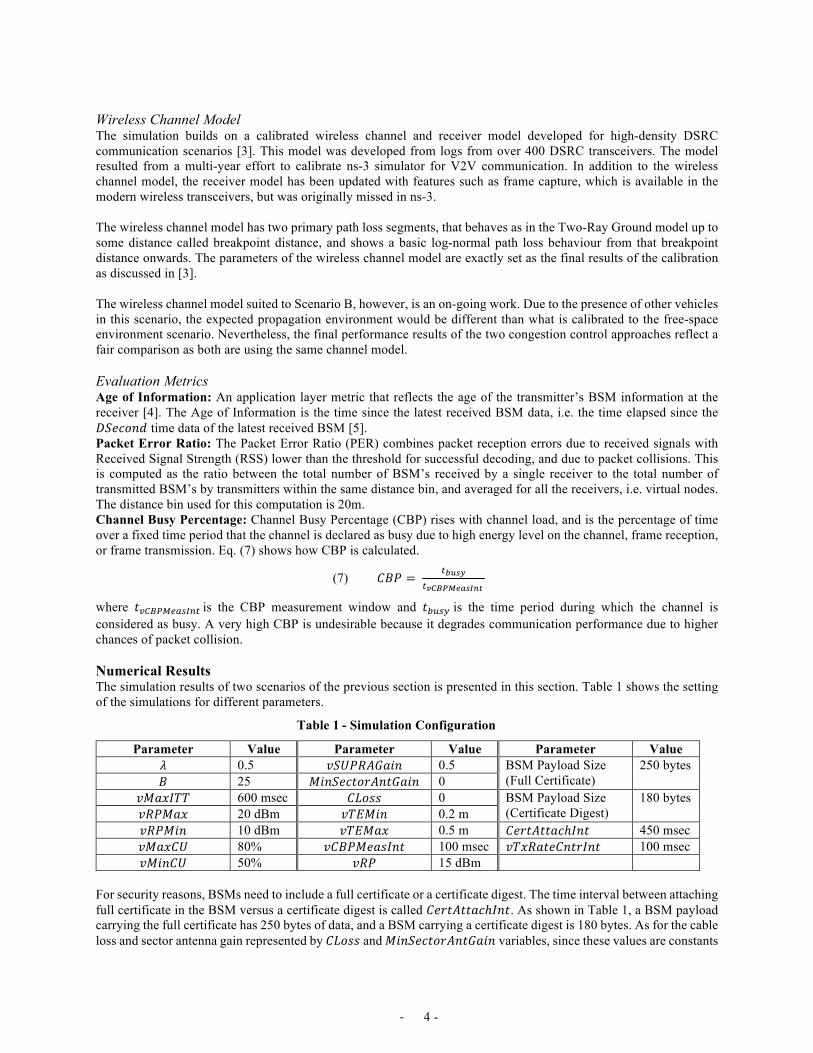
Figure 1 shows the setup where the highway is almost free of obstacles. In this scenario, a group of four sedan cars, depicted in magenta circles, are moving in a straight highway style in the green region. Once reaching the end of the green region, they turn around and drive all the way back at the other end of the green region. Grey crosses are representing virtual nodes which log the received BSMs from each of the four test cars and record other useful information, such as CBP, every 100 msec. The virtual nodes do not transmit any BSMs. To mimic a traffic jam on the highway, a lot of transmitters are deployed on the both sides of the highway, i.e. in the green region, clustered in groups of 6 on the same cart, represented by blue star shape marks in the figure. In addition, to eliminate the simulation edge effect for the green region, an equivalent number of transmitters are created in simulations for more than a kilometer before and after the green region, where the test cars are circulating and communication logs are recorded. To simulate different vehicular traffic conditions, three different total number of transmitters are considered for evaluation; 1200, 2400, and 3600 transmitters. To evaluate the algorithms in a more realistic environment, another scenario with two different traffic conditions are considered for evaluation. Figure 2 shows a 4 km stretch of the I-405 freeway in Orange County, California, USA. Two different vehicular traffic conditions are simulated corresponding to rush hour (heavier vehicular traffic) and early morning commute (lighter vehicular traffic). The mobility traces of these scenarios are generated by a third-party contractor based on the reported traffic flow by California Department of Transportation. Figure 3 shows a snapshot of each of the two traffic conditions. Since there are a lot of moving cars in this scenario, only one virtual node is considered to log the received BSMs and other useful information in the middle of the target freeway stretch. This virtual node is shown in yellow in Figure 3. The location of the virtual node is chosen in the middle to avoid suffering edge effect in the final simulation results.
Figure 2 - Satellite view of 4 Km stretch of I-405 freeway in Orange County, California, USA.
Figure 3 - Snapshot of realistic simulation of Figure 2; Lighter traffic (top) and heavier traffic (bottom)
- 4 -
Wireless Channel Model The simulation builds on a calibrated wireless channel and receiver model developed for high-density DSRC communication scenarios [3]. This model was developed from logs from over 400 DSRC transceivers. The model resulted from a multi-year effort to calibrate ns-3 simulator for V2V communication. In addition to the wireless channel model, the receiver model has been updated with features such as frame capture, which is available in the modern wireless transceivers, but was originally missed in ns-3. The wireless channel model has two primary path loss segments, that behaves as in the Two-Ray Ground model up to some distance called breakpoint distance, and shows a basic log-normal path loss behaviour from that breakpoint distance onwards. The parameters of the wireless channel model are exactly set as the final results of the calibration as discussed in [3]. The wireless channel model suited to Scenario B, however, is an on-going work. Due to the presence of other vehicles in this scenario, the expected propagation environment would be different than what is calibrated to the free-space environment scenario. Nevertheless, the final performance results of the two congestion control approaches reflect a fair comparison as both are using the same channel model. Evaluation Metrics Age of Information: An application layer metric that reflects the age of the transmitter’s BSM information at the receiver [4]. The Age of Information is the time since the latest received BSM data, i.e. the time elapsed since the 𝐷𝑆𝑒𝑐𝑜𝑛𝑑 time data of the latest received BSM [5]. Packet Error Ratio: The Packet Error Ratio (PER) combines packet reception errors due to received signals with Received Signal Strength (RSS) lower than the threshold for successful decoding, and due to packet collisions. This is computed as the ratio between the total number of BSM’s received by a single receiver to the total number of transmitted BSM’s by transmitters within the same distance bin, and averaged for all the receivers, i.e. virtual nodes. The distance bin used for this computation is 20m. Channel Busy Percentage: Channel Busy Percentage (CBP) rises with channel load, and is the percentage of time over a fixed time period that the channel is declared as busy due to high energy level on the channel, frame reception, or frame transmission. Eq. (7) shows how CBP is calculated.
(7) 𝐶𝐵𝑃 = >gh=i
>jklmnop=qrs
where 𝑡AS?OBtC.ER>is the CBP measurement window and 𝑡uv.wis the time period during which the channel is considered as busy. A very high CBP is undesirable because it degrades communication performance due to higher chances of packet collision. Numerical Results The simulation results of two scenarios of the previous section is presented in this section. Table 1 shows the setting of the simulations for different parameters.
Table 1 - Simulation Configuration
Parameter Value Parameter Value Parameter Value 𝜆 0.5 𝑣𝑆𝑈𝑃𝑅𝐴𝐺𝑎𝑖𝑛 0.5 BSM Payload Size
(Full Certificate) 250 bytes
𝐵 25 𝑀𝑖𝑛𝑆𝑒𝑐𝑡𝑜𝑟𝐴𝑛𝑡𝐺𝑎𝑖𝑛 0 𝑣𝑀𝑎𝑥𝐼𝑇𝑇 600 msec 𝐶𝐿𝑜𝑠𝑠 0 BSM Payload Size
(Certificate Digest) 180 bytes
𝑣𝑅𝑃𝑀𝑎𝑥 20 dBm 𝑣𝑇𝐸𝑀𝑖𝑛 0.2 m 𝑣𝑅𝑃𝑀𝑖𝑛 10 dBm 𝑣𝑇𝐸𝑀𝑎𝑥 0.5 m 𝐶𝑒𝑟𝑡𝐴𝑡𝑡𝑎𝑐ℎ𝐼𝑛𝑡 450 msec 𝑣𝑀𝑎𝑥𝐶𝑈 80% 𝑣𝐶𝐵𝑃𝑀𝑒𝑎𝑠𝐼𝑛𝑡 100 msec 𝑣𝑇𝑥𝑅𝑎𝑡𝑒𝐶𝑛𝑡𝑟𝐼𝑛𝑡 100 msec 𝑣𝑀𝑖𝑛𝐶𝑈 50% 𝑣𝑅𝑃 15 dBm
For security reasons, BSMs need to include a full certificate or a certificate digest. The time interval between attaching full certificate in the BSM versus a certificate digest is called 𝐶𝑒𝑟𝑡𝐴𝑡𝑡𝑎𝑐ℎ𝐼𝑛𝑡. As shown in Table 1, a BSM payload carrying the full certificate has 250 bytes of data, and a BSM carrying a certificate digest is 180 bytes. As for the cable loss and sector antenna gain represented by 𝐶𝐿𝑜𝑠𝑠 and 𝑀𝑖𝑛𝑆𝑒𝑐𝑡𝑜𝑟𝐴𝑛𝑡𝐺𝑎𝑖𝑛 variables, since these values are constants
- 5 -
and measurable for a given set up, the transmission power could be linearly adjusted to give the same desirable Radiated Power (𝑅𝑃) as for the case that in the simulator. Stability Examination of Channel Load One of the aspects of channel resource management is the stability of channel load. An ideal channel congestion control approach distributes channel access over time so the load is always kept at a reasonable level at any given time. In this paper, stability examination of both approaches is done for Scenario A. To examine the stability of the congestion control algorithm, CBP is measured every 100 msec during the simulation. Moreover, inter-transmission time samples and every chosen transmission power of the transmitted BSMs are recorded and shown in the following figures. The results of Scenario B would be hard to interpret as the environment is uncontrolled and the density of vehicles in the area is non-uniform due to realistic vehicle mobility.
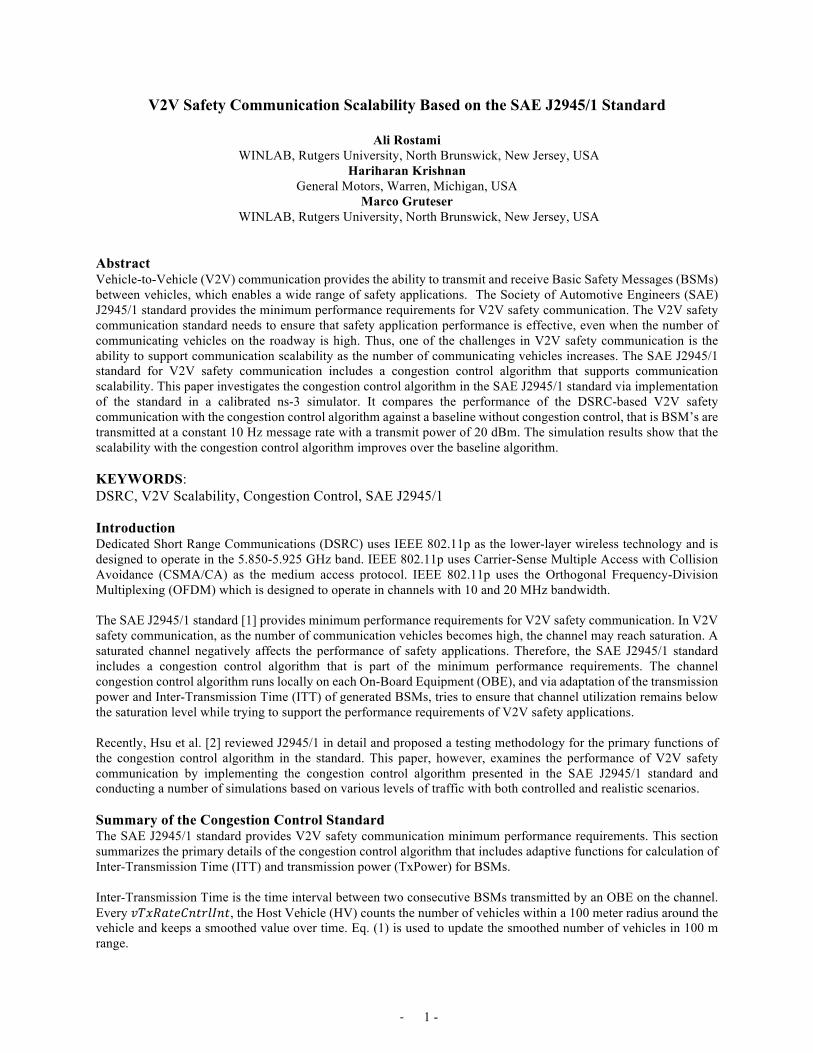
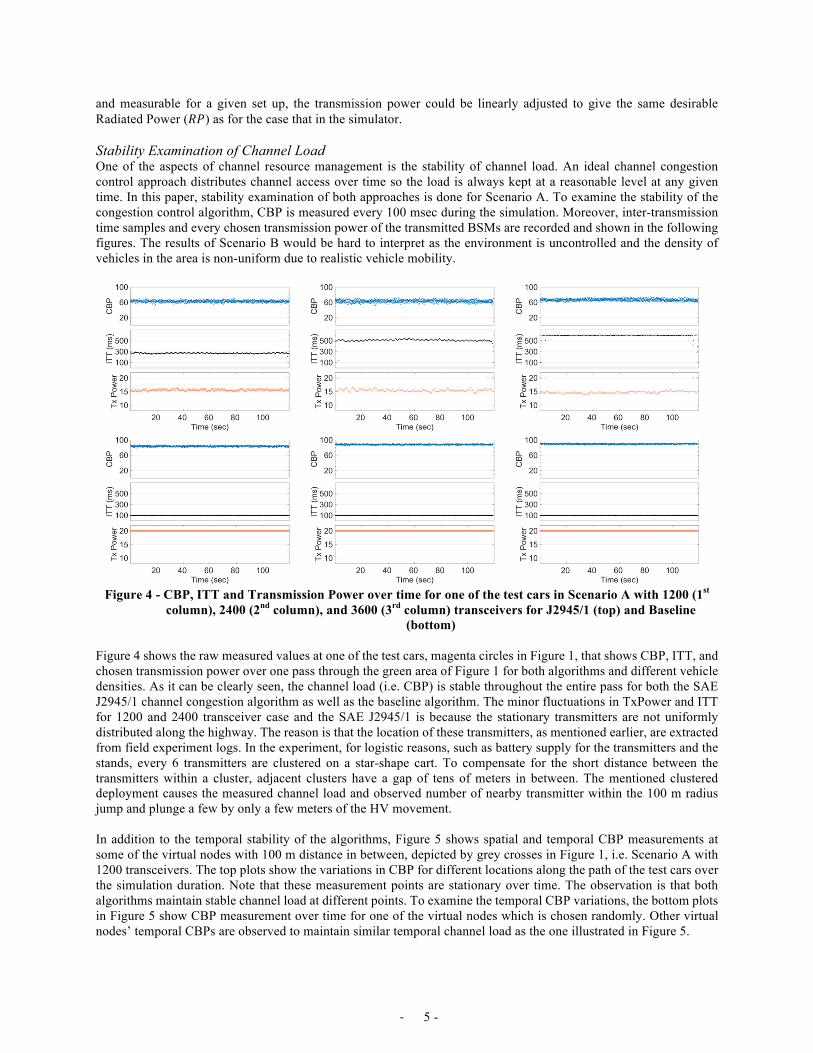
Figure 4 - CBP, ITT and Transmission Power over time for one of the test cars in Scenario A with 1200 (1st
column), 2400 (2nd column), and 3600 (3rd column) transceivers for J2945/1 (top) and Baseline (bottom)
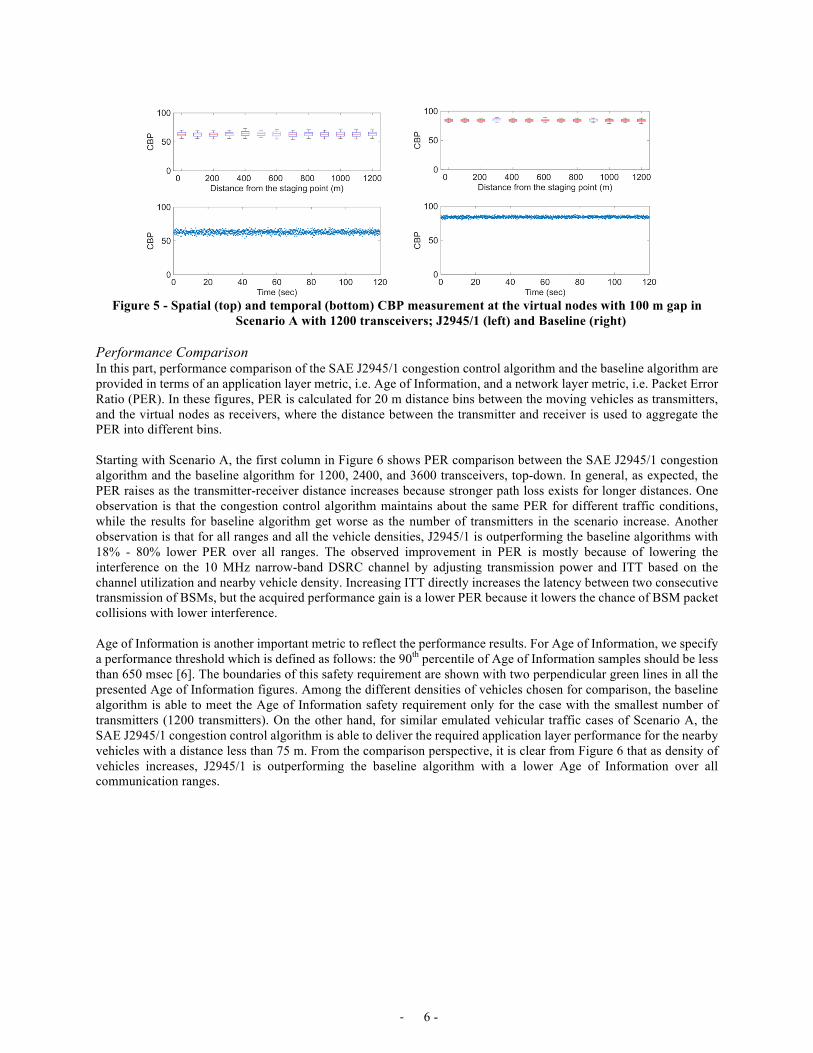
Figure 4 shows the raw measured values at one of the test cars, magenta circles in Figure 1, that shows CBP, ITT, and chosen transmission power over one pass through the green area of Figure 1 for both algorithms and different vehicle densities. As it can be clearly seen, the channel load (i.e. CBP) is stable throughout the entire pass for both the SAE J2945/1 channel congestion algorithm as well as the baseline algorithm. The minor fluctuations in TxPower and ITT for 1200 and 2400 transceiver case and the SAE J2945/1 is because the stationary transmitters are not uniformly distributed along the highway. The reason is that the location of these transmitters, as mentioned earlier, are extracted from field experiment logs. In the experiment, for logistic reasons, such as battery supply for the transmitters and the stands, every 6 transmitters are clustered on a star-shape cart. To compensate for the short distance between the transmitters within a cluster, adjacent clusters have a gap of tens of meters in between. The mentioned clustered deployment causes the measured channel load and observed number of nearby transmitter within the 100 m radius jump and plunge a few by only a few meters of the HV movement. In addition to the temporal stability of the algorithms, Figure 5 shows spatial and temporal CBP measurements at some of the virtual nodes with 100 m distance in between, depicted by grey crosses in Figure 1, i.e. Scenario A with 1200 transceivers. The top plots show the variations in CBP for different locations along the path of the test cars over the simulation duration. Note that these measurement points are stationary over time. The observation is that both algorithms maintain stable channel load at different points. To examine the temporal CBP variations, the bottom plots in Figure 5 show CBP measurement over time for one of the virtual nodes which is chosen randomly. Other virtual nodes’ temporal CBPs are observed to maintain similar temporal channel load as the one illustrated in Figure 5.
- 6 -
Figure 5 - Spatial (top) and temporal (bottom) CBP measurement at the virtual nodes with 100 m gap in
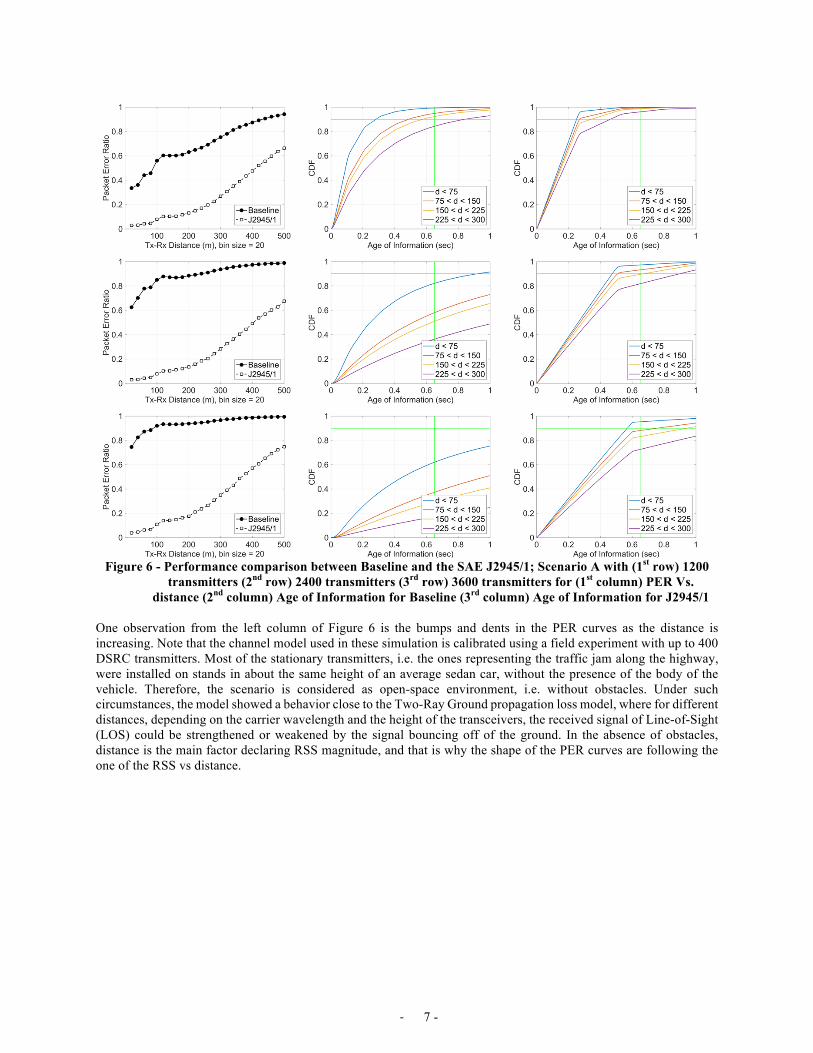
Scenario A with 1200 transceivers; J2945/1 (left) and Baseline (right) Performance Comparison In this part, performance comparison of the SAE J2945/1 congestion control algorithm and the baseline algorithm are provided in terms of an application layer metric, i.e. Age of Information, and a network layer metric, i.e. Packet Error Ratio (PER). In these figures, PER is calculated for 20 m distance bins between the moving vehicles as transmitters, and the virtual nodes as receivers, where the distance between the transmitter and receiver is used to aggregate the PER into different bins. Starting with Scenario A, the first column in Figure 6 shows PER comparison between the SAE J2945/1 congestion algorithm and the baseline algorithm for 1200, 2400, and 3600 transceivers, top-down. In general, as expected, the PER raises as the transmitter-receiver distance increases because stronger path loss exists for longer distances. One observation is that the congestion control algorithm maintains about the same PER for different traffic conditions, while the results for baseline algorithm get worse as the number of transmitters in the scenario increase. Another observation is that for all ranges and all the vehicle densities, J2945/1 is outperforming the baseline algorithms with 18% - 80% lower PER over all ranges. The observed improvement in PER is mostly because of lowering the interference on the 10 MHz narrow-band DSRC channel by adjusting transmission power and ITT based on the channel utilization and nearby vehicle density. Increasing ITT directly increases the latency between two consecutive transmission of BSMs, but the acquired performance gain is a lower PER because it lowers the chance of BSM packet collisions with lower interference. Age of Information is another important metric to reflect the performance results. For Age of Information, we specify a performance threshold which is defined as follows: the 90th percentile of Age of Information samples should be less than 650 msec [6]. The boundaries of this safety requirement are shown with two perpendicular green lines in all the presented Age of Information figures. Among the different densities of vehicles chosen for comparison, the baseline algorithm is able to meet the Age of Information safety requirement only for the case with the smallest number of transmitters (1200 transmitters). On the other hand, for similar emulated vehicular traffic cases of Scenario A, the SAE J2945/1 congestion control algorithm is able to deliver the required application layer performance for the nearby vehicles with a distance less than 75 m. From the comparison perspective, it is clear from Figure 6 that as density of vehicles increases, J2945/1 is outperforming the baseline algorithm with a lower Age of Information over all communication ranges.
- 7 -
Figure 6 - Performance comparison between Baseline and the SAE J2945/1; Scenario A with (1st row) 1200
transmitters (2nd row) 2400 transmitters (3rd row) 3600 transmitters for (1st column) PER Vs. distance (2nd column) Age of Information for Baseline (3rd column) Age of Information for J2945/1
One observation from the left column of Figure 6 is the bumps and dents in the PER curves as the distance is increasing. Note that the channel model used in these simulation is calibrated using a field experiment with up to 400 DSRC transmitters. Most of the stationary transmitters, i.e. the ones representing the traffic jam along the highway, were installed on stands in about the same height of an average sedan car, without the presence of the body of the vehicle. Therefore, the scenario is considered as open-space environment, i.e. without obstacles. Under such circumstances, the model showed a behavior close to the Two-Ray Ground propagation loss model, where for different distances, depending on the carrier wavelength and the height of the transceivers, the received signal of Line-of-Sight (LOS) could be strengthened or weakened by the signal bouncing off of the ground. In the absence of obstacles, distance is the main factor declaring RSS magnitude, and that is why the shape of the PER curves are following the one of the RSS vs distance.
- 8 -
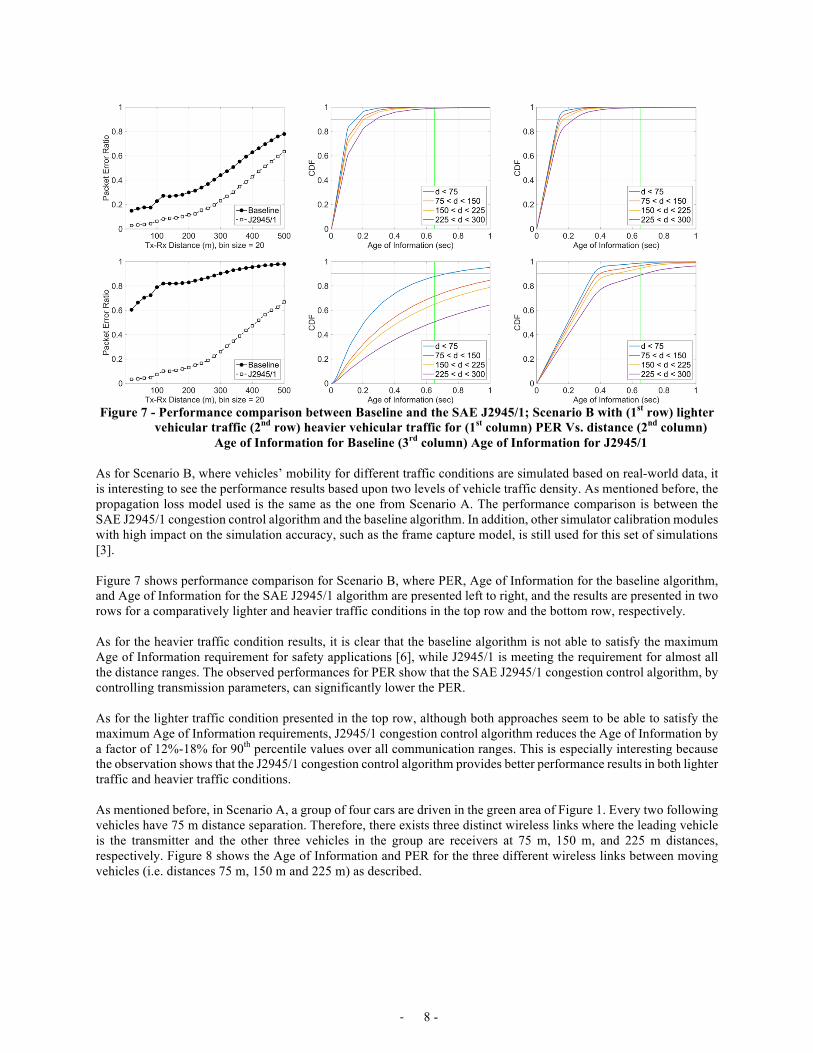
Figure 7 - Performance comparison between Baseline and the SAE J2945/1; Scenario B with (1st row) lighter
vehicular traffic (2nd row) heavier vehicular traffic for (1st column) PER Vs. distance (2nd column) Age of Information for Baseline (3rd column) Age of Information for J2945/1
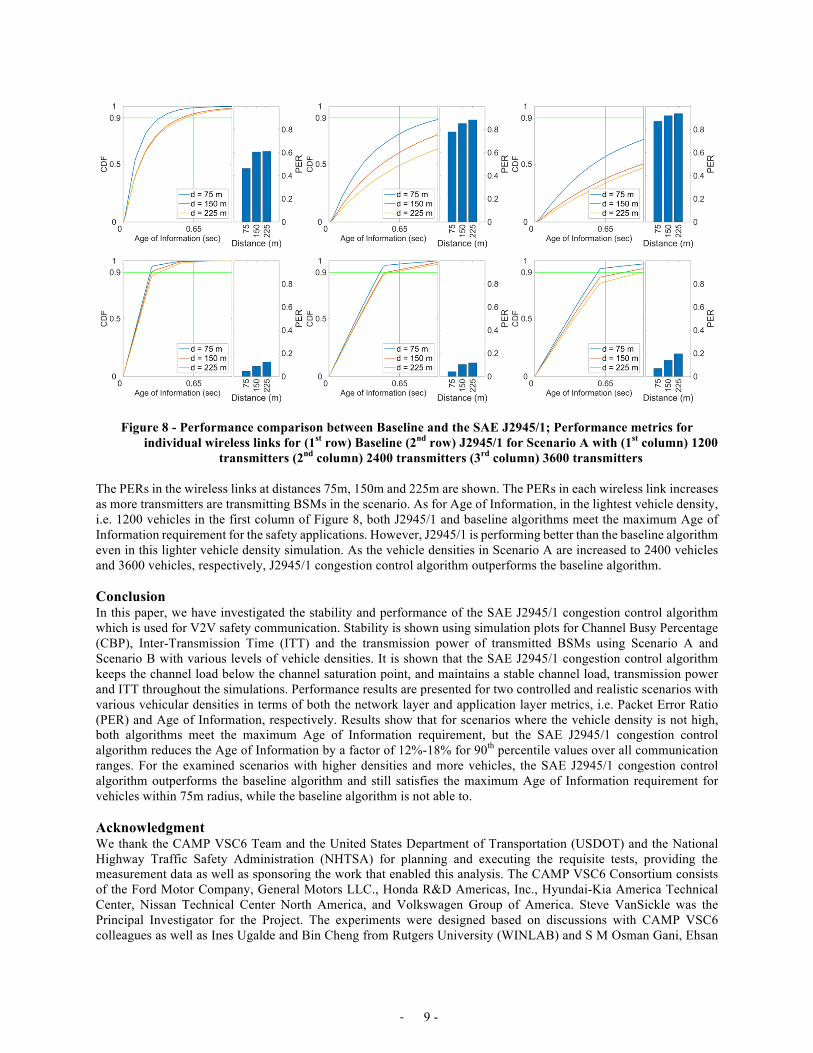
As for Scenario B, where vehicles’ mobility for different traffic conditions are simulated based on real-world data, it is interesting to see the performance results based upon two levels of vehicle traffic density. As mentioned before, the propagation loss model used is the same as the one from Scenario A. The performance comparison is between the SAE J2945/1 congestion control algorithm and the baseline algorithm. In addition, other simulator calibration modules with high impact on the simulation accuracy, such as the frame capture model, is still used for this set of simulations [3]. Figure 7 shows performance comparison for Scenario B, where PER, Age of Information for the baseline algorithm, and Age of Information for the SAE J2945/1 algorithm are presented left to right, and the results are presented in two rows for a comparatively lighter and heavier traffic conditions in the top row and the bottom row, respectively. As for the heavier traffic condition results, it is clear that the baseline algorithm is not able to satisfy the maximum Age of Information requirement for safety applications [6], while J2945/1 is meeting the requirement for almost all the distance ranges. The observed performances for PER show that the SAE J2945/1 congestion control algorithm, by controlling transmission parameters, can significantly lower the PER. As for the lighter traffic condition presented in the top row, although both approaches seem to be able to satisfy the maximum Age of Information requirements, J2945/1 congestion control algorithm reduces the Age of Information by a factor of 12%-18% for 90th percentile values over all communication ranges. This is especially interesting because the observation shows that the J2945/1 congestion control algorithm provides better performance results in both lighter traffic and heavier traffic conditions. As mentioned before, in Scenario A, a group of four cars are driven in the green area of Figure 1. Every two following vehicles have 75 m distance separation. Therefore, there exists three distinct wireless links where the leading vehicle is the transmitter and the other three vehicles in the group are receivers at 75 m, 150 m, and 225 m distances, respectively. Figure 8 shows the Age of Information and PER for the three different wireless links between moving vehicles (i.e. distances 75 m, 150 m and 225 m) as described.
- 9 -
Figure 8 - Performance comparison between Baseline and the SAE J2945/1; Performance metrics for individual wireless links for (1st row) Baseline (2nd row) J2945/1 for Scenario A with (1st column) 1200
transmitters (2nd column) 2400 transmitters (3rd column) 3600 transmitters The PERs in the wireless links at distances 75m, 150m and 225m are shown. The PERs in each wireless link increases as more transmitters are transmitting BSMs in the scenario. As for Age of Information, in the lightest vehicle density, i.e. 1200 vehicles in the first column of Figure 8, both J2945/1 and baseline algorithms meet the maximum Age of Information requirement for the safety applications. However, J2945/1 is performing better than the baseline algorithm even in this lighter vehicle density simulation. As the vehicle densities in Scenario A are increased to 2400 vehicles and 3600 vehicles, respectively, J2945/1 congestion control algorithm outperforms the baseline algorithm. Conclusion In this paper, we have investigated the stability and performance of the SAE J2945/1 congestion control algorithm which is used for V2V safety communication. Stability is shown using simulation plots for Channel Busy Percentage (CBP), Inter-Transmission Time (ITT) and the transmission power of transmitted BSMs using Scenario A and Scenario B with various levels of vehicle densities. It is shown that the SAE J2945/1 congestion control algorithm keeps the channel load below the channel saturation point, and maintains a stable channel load, transmission power and ITT throughout the simulations. Performance results are presented for two controlled and realistic scenarios with various vehicular densities in terms of both the network layer and application layer metrics, i.e. Packet Error Ratio (PER) and Age of Information, respectively. Results show that for scenarios where the vehicle density is not high, both algorithms meet the maximum Age of Information requirement, but the SAE J2945/1 congestion control algorithm reduces the Age of Information by a factor of 12%-18% for 90th percentile values over all communication ranges. For the examined scenarios with higher densities and more vehicles, the SAE J2945/1 congestion control algorithm outperforms the baseline algorithm and still satisfies the maximum Age of Information requirement for vehicles within 75m radius, while the baseline algorithm is not able to. Acknowledgment We thank the CAMP VSC6 Team and the United States Department of Transportation (USDOT) and the National Highway Traffic Safety Administration (NHTSA) for planning and executing the requisite tests, providing the measurement data as well as sponsoring the work that enabled this analysis. The CAMP VSC6 Consortium consists of the Ford Motor Company, General Motors LLC., Honda R&D Americas, Inc., Hyundai-Kia America Technical Center, Nissan Technical Center North America, and Volkswagen Group of America. Steve VanSickle was the Principal Investigator for the Project. The experiments were designed based on discussions with CAMP VSC6 colleagues as well as Ines Ugalde and Bin Cheng from Rutgers University (WINLAB) and S M Osman Gani, Ehsan
- 10 -
Emad Marvasti, Behrad Toghi, MD Saifuddin, and Dr. Yaser P. Fallah from University of Central Florida. The opinions, findings and conclusions expressed in this publication are those of the author(s) and not necessarily those of the USDOT or the NHTSA. The United States Government assumes no liability for its content or use thereof. References 1. SAE International (2016). On-Board System Requirements for V2V Safety Communications, version 201603. 2. Hsu, C. J., Fikentscher, J., & Kreeb, R. (2017). Development of potential methods for testing congestion control algorithm implemented in vehicle-to-vehicle communications. Traffic injury prevention, 18(sup1), S51-S57. 3. Cheng, B., Rostami, A., & Gruteser, M. (2016). Experience: accurate simulation of dense scenarios with hundreds of vehicular transmitters. In Proceedings of the 22nd Annual International Conference on Mobile Computing and Networking (pp. 271-279). ACM. 4. Kaul, S., Gruteser, M., Rai, V., & Kenney, J. (2011, June). Minimizing age of information in vehicular networks. In Sensor, Mesh and Ad Hoc Communications and Networks (SECON), 2011 8th Annual IEEE Communications Society Conference on (pp. 350-358). IEEE. 5. SAE International (2016). Dedicated Short Range Communications (DSRC) Message Set Dictionary™, version 201603. 6. National Highway Traffic Safety Administration (2016). U.S. DOT/NHTSA- Phase 2 Final Report Volume 1- Communications Scalability for V2V Safety Development and Phase 2 Final Report Volume 2- Communications Scalability for V2V Safety Analysis. NHTSA-2015-0060-0001.