V. STATION AND APPARATUS DEPLOYMENT METHODOLOGY
53
Portland Fire and Rescue Service Delivery System Study TriData, a Division of 84 March 2006 System Planning Corporation V. STATION AND APPARATUS DEPLOYMENT This chapter discusses the deployment of fire stations and emergency response apparatus in Portland. As discussed in the previous chapters, there are many factors that should be taken into account when determining the appropriate number of stations, including demand for services, population, density of demand and population, size of the jurisdiction, and desired response times. This chapter applies these factors to the current and future situation of the Portland Fire and Rescue (PF&R). METHODOLOGY Before any analysis took place, project team members gathered and reviewed information related to properly locating fire stations, including but not limited to: • Current station locations and building ages • Current apparatus deployment • Current zoning and land use and related policies • National response time standards (see Chapter IV) • Current PF&R response time standards (see Chapter IV) • Current and projected population (see Chapter III) • Current and projected demand and workload (see Chapter III) Actual incident data for FY00 and FY05 was gathered from the computer aided dispatch system (CAD). Data included addresses for geocoding, type of incident, units responding (FY05 only), and overall response times (FY05 only). 38 Geographic information system (GIS) files used for the analysis were provided by the city. Due to the size of the city and differences in the areas covered, it would be difficult to complete a thorough analysis while looking at the city as a whole. Therefore, the city was analyzed by the PF&R response districts which are shown in Map 8. Since District 1 contains only Station 1, Districts 1 and 2 were combined for the analysis. 38 Geocoding is a process by which the street address of an emergency incident is translated into latitude and longitude so that it can be placed onto a map.
Transcript of V. STATION AND APPARATUS DEPLOYMENT METHODOLOGY

Portland Fire and Rescue Service Delivery System Study
TriData, a Division of 84 March 2006 System Planning Corporation
V. STATION AND APPARATUS DEPLOYMENT
This chapter discusses the deployment of fire stations and emergency response apparatus in Portland. As discussed in the previous chapters, there are many factors that should be taken into account when determining the appropriate number of stations, including demand for services, population, density of demand and population, size of the jurisdiction, and desired response times. This chapter applies these factors to the current and future situation of the Portland Fire and Rescue (PF&R).
METHODOLOGY
Before any analysis took place, project team members gathered and reviewed information related to properly locating fire stations, including but not limited to:
• Current station locations and building ages • Current apparatus deployment • Current zoning and land use and related policies • National response time standards (see Chapter IV) • Current PF&R response time standards (see Chapter IV) • Current and projected population (see Chapter III) • Current and projected demand and workload (see Chapter III)
Actual incident data for FY00 and FY05 was gathered from the computer aided dispatch system (CAD). Data included addresses for geocoding, type of incident, units responding (FY05 only), and overall response times (FY05 only).38 Geographic information system (GIS) files used for the analysis were provided by the city.
Due to the size of the city and differences in the areas covered, it would be difficult to complete a thorough analysis while looking at the city as a whole. Therefore, the city was analyzed by the PF&R response districts which are shown in Map 8. Since District 1 contains only Station 1, Districts 1 and 2 were combined for the analysis.
38 Geocoding is a process by which the street address of an emergency incident is translated into latitude and longitude so that it can be placed onto a map.

Portland Fire and Rescue Chapter V. Station and Apparatus Deployment Service Delivery System Study
TriData, a Division of 85 March 2006 System Planning Corporation
Map 8: PF&R Districts
Travel speed was based on U.S. Census Tiger files contained in the road files provided by the city. Tiger files contain census feature class codes (CFCC codes) that define road types and can be used to assign estimated speed limits. Speed limits were then set at 10 miles per hour below the typical speed limit based on road type to account for obstacles that a unit may encounter while responding to an incident such as traffic congestion, stops, and turns. No speed limits were set below 25 mph.
Estimated travel time for each road segment was based on the speed limits and length of the segment. Road segments containing a traffic calming device had 4.7 seconds per device added to the estimated travel time. The additional time was based on the average delay caused by speed humps as recorded by PF&R in previous studies.

Portland Fire and Rescue Chapter V. Station and Apparatus Deployment Service Delivery System Study
TriData, a Division of 86 March 2006 System Planning Corporation
Station and apparatus deployment analysis was based on the goals outlined in Chapter IV, Determining Resource Needs.
CURRENT RESPONSE TIMES
The first step in the deployment analysis is a review of department-wide response times. As discussed in Chapter IV, response time is the total amount of time elapsing between an individual calling 911 and emergency service personnel arriving at the scene. Response time can be broken down into multiple segments for analysis.
Methodology – The analysis of response times included emergency incidents only. Call processing included the first-dispatched unit from each incident. Turnout, travel, vertical, and total response times included only engines, trucks, rescues, and the squad. These criteria were applied to keep the analysis in line with the standards against which times are being compared. For all time segments, the CAD data from FY05 was used. In some cases there were invalid entries (did not have a time recorded) or obvious errors (unit arrived before the call came in) that were excluded from the dataset. All response times are for Code 3 calls only, which are high priority calls. Code 1 calls are lower priority calls where apparatus does not go to the incident with lights and sirens; therefore, response times are much higher due to the apparatus traveling with the flow of traffic. Finally, to eliminate outliers, times that were more than three standard deviations from the median were also excluded. Three times the standard deviation was used because assuming that the travel times had a normal distribution 99.7 percent of incidents are expected to fall within three standard deviations.
Call Processing – Call processing time includes both call processing (taking down necessary information) and dispatch (notifying the appropriate units). Some CAD systems track each time segment separately; most do not. Throughout this section call processing time includes dispatch time.
In Portland, when an individual calls 911, the call is answered and dispatched at the Bureau of Emergency Communications (BOEC). BOEC call takes gather the necessary information, code the call, and transfer it to the appropriate BOEC fire/EMS or police dispatcher, who dispatches the appropriate units. All of this time is included in the call processing times discussed below.
In FY05, call processing times for PF&R averaged 1:13 with a 90th percentile time of 1:53. Table 20 shows the 90th percentile call processing time for FY05 by type of call. EMS calls are processed slightly slower than fire calls, but the difference is not statistically significant. EMS call processing times are almost 30 seconds higher than PF&R’s current goal for high priority EMS calls, while fire times are nearly one minute higher than the current goal for urgent priority fire calls. It should be noted that the BOEC User Board sets the call processing goals;

Portland Fire and Rescue Chapter V. Station and Apparatus Deployment Service Delivery System Study
TriData, a Division of 87 March 2006 System Planning Corporation
however, PF&R should work with the BOEC in determining how to reduce the overall call processing times.
Table 20: PF&R Call Processing Time by Call Type
Type 80th Percentile 90th Percentile Portland Goal EMS 01:29 01:52 01:30 Fire 01:22 01:48 01:00
Some variation can be expected by time of day to correspond with heavier or lighter call volumes. Figure 20 depicts the variation in 90th percentile call processing time by time of day. Despite the variation in call levels, call processing time is relatively steady throughout the day ranging from 1:50 between 8 A.M. and 10 A.M. to 2:00 between midnight and 2 A.M.
Figure 20: 90th Percentile Call Processing Time by Time of Day, FY05
0:01
:58
0:02
:00
0:01
:50
0:01
:54
0:01
:50
0:01
:53
0:01
:51
0:01
:56
0:01
:52
0:01
:54
0:01
:55
0:01
:51
14.1
2
16.8
9 17.7
8
18.0
4
18.1
8
17.4
4
15.5
6
9.55
7.67
6.32
9.28
12.7
0
0:00:00
0:00:30
0:01:00
0:01:30
0:02:00
0:02:30
0:03:00
Midnight-1:59am
2:00-3:59am
4:00-5:59am
6:00-7:59am
8:00-9:59am
10:00-11:59am
Noon-1:59pm
2:00-3:59pm
4:00-5:59pm
6:00-7:59pm
8:00-9:59pm
10:00-11:59pm
0.00
2.00
4.00
6.00
8.00
10.00
12.00
14.00
16.00
18.00
20.0090th Percentile Call ProcessingTimeAverage Calls Per Day
Figure 21 depicts the variation in 90th percentile call processing time by time of day and
call type. EMS call processing times remain reasonably steady throughout the day ranging between 1:48 and 1:57. Fire call processing times fluctuate quite a bit over the course of the day with a nearly 30 second spike from 8 A.M. to 10 A.M. Call processing times for other calls appear to be high, but this is likely because most of these types of calls are low priority or non-emergency incidents; therefore, more time can be spent gathering relevant information.

Portland Fire and Rescue Chapter V. Station and Apparatus Deployment Service Delivery System Study
TriData, a Division of 88 March 2006 System Planning Corporation
Figure 21: 90th Percentile Call Processing Time by Time of Day and Call Type, FY05
0:00:00
0:00:30
0:01:00
0:01:30
0:02:00
0:02:30
0:03:00
Midnight-1:59am
2:00-3:59am
4:00-5:59am
6:00-7:59am
8:00-9:59am
10:00-11:59am
Noon-1:59pm
2:00-3:59pm
4:00-5:59pm
6:00-7:59pm
8:00-9:59pm
10:00-11:59pm
EMS Fire Other
Although call processing times in Portland are higher than current and recommended
goals, they are not much out of line with those in other communities, some of examples of which are shown in Table 21.
Table 21: Comparison of 90th Percentile Call Processing Times39
City 90th Percentile Cincinnati, Ohio 01:03 Corpus Christi, Texas 01:39 Irving, Texas 01:44 Long Beach, California 02:39 Portland, Oregon 01:53
Recommendation 16: Review the call processing and dispatch process to determine whether any changes can be made to improve call processing and dispatch times. Areas to consider include staffing levels in the dispatch center, the amount of information gathered before dispatching the first unit, and turnover rates in dispatch staff and resulting lack of experience. A full review of the dispatch center in Portland was beyond the scope of this study; therefore, information on staffing and turnover was not reviewed. These are common issues within dispatch
39 We had relatively recent data from other TriData studies for these communities

Portland Fire and Rescue Chapter V. Station and Apparatus Deployment Service Delivery System Study
TriData, a Division of 89 March 2006 System Planning Corporation
centers. PF&R should work closely with the BOEC to lower the current call processing times, as they are a critical component in overall response time.
Turnout – Turnout time is measured from when the alarm is received by personnel to when the apparatus begins driving to the incident scene. The average turnout time in Portland in FY05 was 1:09 with a 90th percentile time of 1:51, nearly 60 seconds higher than the recommended time of 1:00 as discussed in Chapter IV.
When examining the turnout times by call type, the times remain similar to the overall results. EMS, fire, and other incident turnout times are 1:48, 1:42, and 1:56 respectively, again nearly 60 seconds over our recommended goal. Turnout times for fire and EMS are very similar despite fires requiring the donning of protective equipment. There is also no significant difference in 90th percentile turnout times by unit type with the times ranging from 1:50 to 2:02.
Turnout time vary considerably by time of day. Station design and personnel duties (e.g. inspections) also play a role. Figure 22 shows turnout times by time of day during FY05. There is significant (nearly one-minute) variation in turnout time by time of day, which can be expected since personnel are generally asleep between midnight and 6 A.M. (when turnout times are highest). Turnout times during the rest of the day exceed the recommended one-minute time for turnout by around 30 seconds.
Figure 22: Turnout Times by Time of Day, FY05
0:02
:13
0:02
:19
0:02
:20
0:02
:11
0:01
:31
0:01
:29
0:01
:25
0:01
:28
0:01
:29
0:01
:25
0:01
:28
0:01
:51
14.1
2
16.8
9 17.7
8
18.0
4
18.1
8
17.4
4
15.5
6
9.55
7.67
6.32
9.28
12.7
0
0:00:00
0:00:30
0:01:00
0:01:30
0:02:00
0:02:30
0:03:00
Midnight-1:59am
2:00-3:59am
4:00-5:59am
6:00-7:59am
8:00-9:59am
10:00-11:59am
Noon-1:59pm
2:00-3:59pm
4:00-5:59pm
6:00-7:59pm
8:00-9:59pm
10:00-11:59pm
0.00
2.00
4.00
6.00
8.00
10.00
12.00
14.00
16.00
18.00
20.00
90th Percentile Turnout Time
Average Calls per Day
Portland Fire and Rescue Chapter V. Station and Apparatus Deployment Service Delivery System Study
TriData, a Division of 90 March 2006 System Planning Corporation
Finally, some units turnout faster than others. Engine 20, for example, had a 90th percentile turnout time of 1:37 in FY05, the lowest of all engines. Engine 16, on the other hand, had a 90th percentile turnout time of 2:07, 30 seconds longer. The reason for this is unclear; however, a possible reason for the higher turnout times is that units in Portland are not always in the station. Crews perform inspections and public education throughout their first-due areas. It takes longer to turnout for a call when personnel are away from the station rather than in quarters. The extra time to turnout may be worth the benefits and cost-savings of using crew personnel “downtime” for prevention activities such as inspections and public education.
Of the different segments of response time (call processing, turnout, and travel) it is easier and less costly to improve call processing and turnout times. Travel time is typically much more difficult and the most expensive to improve (e.g., new/more stations, new roads, or traffic signal pre-emption devices). Reducing the first two times will reduce total response times. Reduction in call processing and turnout time also permits longer travel times without increasing total response times; thus, stations can typically serve larger areas and still meet response time goals. The critical time is to dispatch the first unit; further call processing can occur simultaneously (i.e., talking more to the caller to obtain details).
Travel – Travel (drive) time is the time it takes to travel from the station, or wherever the unit is, to the emergency incident. Station and apparatus placement has the biggest impact on travel time. (Apparatus are not always in the station when dispatched to an incident.) Additional factors influencing travel time include traffic, weather, traffic limiting devices (stop lights, speed bumps, etc.), and driver familiarity with the area. It should be noted that fire apparatus stop at all signal controlled intersections before proceeding through – a safe practice. While this will slightly increase travel times, the tradeoff for safety may be worth the extra time. (Studies have documented a significant number of injuries and fatalities caused by vehicular crashes involving emergency response vehicles driving through intersections and responding en-route to an incident). Traffic congestion and weather are beyond the department and city’s control; however, traffic limiting devices and driver knowledge are not.
Travel times in Portland are higher than the TriData recommended 90th percentile travel times of four minutes. In FY05, PF&R experienced an average travel time of 3:56 and a 90th percentile time of 5:58 overall. However, the four-minute travel time is recommended for the first arriving unit only. (The idea is that a four-minute travel time coupled with the recommended call processing and turnout times will result in an overall six-minute total response time for the first unit to each call.)
The 90th percentile travel time for the first arriving unit on all call types was 5:41, better but still nearly two minutes higher than the recommend goal. When broken down by call type, the 90th percentile travel time for first arriving unit to EMS calls was 5:39. For fire calls, the 90th percentile travel time was 5:41. Both of these are more than two minutes higher than the

Portland Fire and Rescue Chapter V. Station and Apparatus Deployment Service Delivery System Study
TriData, a Division of 91 March 2006 System Planning Corporation
recommended four-minute travel time. Table 22 shows the 90th percentile travel times by call type for FY05.
Table 22: 90th Percentile Travel Time by Call Type, FY05
Response Level
90th Percentile (All Units)
90th Percentile (First Arriving Unit)
80th Percentile (First Arriving Unit)
70th Percentile (First Arriving Unit)
EMS 05:43 05:39 04:47 04:13 Fire 08:05 05:41 04:36 03:59 Other 06:11 05:53 04:48 04:12 Overall 05:58 05:41 04:46 04:12
It is not until the 70th percentile range that the travel times fall below the four-minute goal for travel.
In addition to varying by response level and call type, travel times vary by time of day due to traffic and visibility. Relatively steady travel times throughout the day in Portland, as shown in Figure 23, indicate that congestion due to rush-hour traffic is not a major problem for PF&R.
Figure 23: 90th Percentile Travel Time by Time of Day, FY05
0:05
:58
0:06
:11
0:06
:02
0:05
:49
0:05
:37
0:05
:44
0:05
:27
0:05
:44
0:05
:37
0:05
:26
0:05
:30
0:05
:44
14.1
2
16.8
9 17.7
8
18.0
4
18.1
8
17.4
4
15.5
6
12.7
0
7.67
9.55
9.28
6.32
0:04:00
0:04:30
0:05:00
0:05:30
0:06:00
0:06:30
0:07:00
Midnight-1:59am
2:00-3:59am
4:00-5:59am
6:00-7:59am
8:00-9:59am
10:00-11:59am
Noon-1:59pm
2:00-3:59pm
4:00-5:59pm
6:00-7:59pm
8:00-9:59pm
10:00-11:59pm
0.00
2.00
4.00
6.00
8.00
10.00
12.00
14.00
16.00
18.00
20.00
90th Percentile Travel Time
Average Calls per Day

Portland Fire and Rescue Chapter V. Station and Apparatus Deployment Service Delivery System Study
TriData, a Division of 92 March 2006 System Planning Corporation
Vertical – Vertical response time is the time to get from the street to the patient’s side or fire location and includes time to dismount from vehicle, assemble equipment, and locate the patient or fire floor. The time can be significant in areas with high-rise buildings or large properties (e.g., malls or golf courses). Vertical response time often is not tracked by first responders; however, PF&R does track vertical response times on many EMS calls.
On EMS calls, services cannot be provided until personnel arrive at the side of the patient. In FY05, PF&R’s vertical response time averaged 1:44 with a 90th percentile time of 3:07. Since so few departments record vertical response times, it is not possible to compare this to other communities.
While it is possible to reduce the other components of response time through technology and fire station location, it is difficult to substantially and safely reduce vertical response times. As a result, the importance of built-in fire suppression systems cannot be overstated. These systems buy time for the firefighters to get to where they have to be within the structure to completely extinguish fire or provide emergency care.
Total Response Time – It is important to note that, for mathematical reasons, one cannot simply add the average or 90th percentile time components of response time to reach the total response time. In FY05, total response times for PF&R averaged 6:12 for the first arriving unit to all calls with a 90th percentile total response time of 8:31. When factoring in vertical response times PF&R averaged 7:32 with a 90th percentile time of 10:15. All of these times are well above current and recommended goals.
Table 23 shows the 90th, 80th, and 60th percentile total response times for first arriving unit in FY05 incidents by call type. There is a nearly one minute difference in total response time between EMS calls and fire calls at the 90th percentile level; however, that decreases at the 80th percentile level. The total response times are over the recommended goal of six minutes at the 90th percentile level, and do not fall below six minutes until the 60th to 50th percentile level.
Table 23: FY05 60th, 80th and 90th Percentile Total Response Time by Call Type
Call Type EMS Fire 60th Percentile 06:12 06:01 80th Percentile 7:18 7:27 90th Percentile 8:16 9:00 80th Percentile with Vertical 9:03 – 90th Percentile with Vertical 10:12 –
Generally, the variation in total response time by time of day follows the same pattern as the travel time since that is the largest component. Total response time by time of day is shown in Figure 24.

Portland Fire and Rescue Chapter V. Station and Apparatus Deployment Service Delivery System Study
TriData, a Division of 93 March 2006 System Planning Corporation
Actual response times in Portland are compared to NFPA standards and the study team’s recommended goals in Table 24.
Figure 24: 90th Percentile Total Response Time by Time of Day, FY05 0:
09:1
3
0:09
:38
0:09
:12
0:08
:35
0:08
:04
0:08
:04
0:07
:41
0:08
:00
0:08
:01
0:07
:57
0:07
:59
0:08
:16
14.1
2
16.8
9 17.7
8
18.0
4
18.1
8
17.4
4
15.5
6
9.55
7.67
6.32
9.28
12.7
0
0:00:00
0:01:00
0:02:00
0:03:00
0:04:00
0:05:00
0:06:00
0:07:00
0:08:00
0:09:00
0:10:00
0:11:00
0:12:00
Midnight-1:59am
2:00-3:59am
4:00-5:59am
6:00-7:59am
8:00-9:59am
10:00-11:59am
Noon-1:59pm
2:00-3:59pm
4:00-5:59pm
6:00-7:59pm
8:00-9:59pm
10:00-11:59pm
0.00
2.00
4.00
6.00
8.00
10.00
12.00
14.00
16.00
18.00
20.0090th Percentile Total Response Time
Average Calls per Day
Table 24: Portland 90th Percentile Response Times, FY05 vs. Standards and Goals
Current PF&R Recommended
Call Type Time Segment Current 90th Percentile Goal
Reduction Needed Goal
Reduction Needed
Call Processing: Urgent 0:01:00 0:00:48 Call Processing: High 0:01:30 0:00:18 Fire Call Processing: Low
0:01:48*
0:02:00 N/A 0:01:00 0:00:48
Call Processing: High 0:01:30 0:00:22 EMS
Call Processing: Low 0:01:52*
0:03:00 N/A 0:01:00 0:00:52
ALL Turnout 0:01:51 0:01:00 0:00:51 Travel 0:05:41 0:04:00 0:01:41 Fire Total 0:09:00 0:06:00 0:03:00 Travel 0:05:39 0:04:00 0:01:39
EMS Total 0:08:16
0:05:20
0:06:00 0:02:12 * The analysis did not break the call processing times into priority levels, but rather as an overall time for both EMS and Fire
calls.

Portland Fire and Rescue Chapter V. Station and Apparatus Deployment Service Delivery System Study
TriData, a Division of 94 March 2006 System Planning Corporation
Total response times are three minutes (3:00) higher than the recommended time of six minutes for fire calls and slightly over two minutes (2:12) higher than the goal for EMS calls. These total response times are high and the department should take steps to reduce the times and improve 90th percentile compliance. That being said, the department is doing a very good job providing service to Portland and meet the six-minute response time goal at the 60th percentile level. Focus should be placed on reducing call processing and turnout times to get the overall total response time closer to the 90th percentile compliance level.
Figure 25 shows the 90th percentile total response times with vertical times by time of day. Again, the overall pattern is similar to the travel and total times, with higher times at night and in the very early morning.
Figure 25: 90th Percentile Total Response Time (including Vertical) by Time of Day, FY05
0:11
:22
0:11
:35
0:11
:43
0:10
:42
0:10
:02
0:10
:04
0:09
:31
0:09
:40
0:09
:43
0:09
:51
0:09
:41
0:10
:20
14.1
2
15.5
6
17.4
418.1
8
18.0
4
17.7
8
16.8
9
12.7
0
9.28
6.32
7.67
9.55
0:00:00
0:01:00
0:02:00
0:03:00
0:04:00
0:05:00
0:06:00
0:07:00
0:08:00
0:09:00
0:10:00
0:11:00
0:12:00
0:13:00
0:14:00
0:15:00
Midnight-1:59am
2:00-3:59am
4:00-5:59am
6:00-7:59am
8:00-9:59am
10:00-11:59am
Noon-1:59pm
2:00-3:59pm
4:00-5:59pm
6:00-7:59pm
8:00-9:59pm
10:00-11:59pm
0.00
2.00
4.00
6.00
8.00
10.00
12.00
14.00
16.00
18.00
20.00
90th Percentile Total Response Time With Vertical Times
Average Calls per Day
ANALYSIS OF STATION AND APPARATUS LOCATIONS
This section provides an in-depth look at station and apparatus placement. The goal is to determine what areas, if any, are in need of additional or fewer resources. As discussed earlier, to complete the analysis the city was divided into three regions. Engine coverage is discussed by region while truck (ladder), Hazmat, and battalion chief coverage is discussed citywide since there are so few.

Portland Fire and Rescue Chapter V. Station and Apparatus Deployment Service Delivery System Study
TriData, a Division of 95 March 2006 System Planning Corporation
In addition to the response times, demand, and workload discussed up to this point, this analysis takes into account geocoded incidents and resulting incident density. The FY05 CAD data included 59,687 unique emergency incidents, 51,460 of which contained with complete addresses and 49,198 (96 percent) geocoded. CAD data for FY00 contained 57,597 unique incidents of which 55,542 contained complete addresses and 52,807 geocoded (95 percent).
District 1 and 2 – Districts 1 and 2 cover 66.6 square miles and are bordered on the east by District 3, on the south by District 4, on the west by Tualatin Valley, and on the north by the Columbia River. The districts contain nine fire management areas (FMAs), also known as a first-due area. Fire stations 1, 3, 6, 8, 14, 16, 17, 22, 24, and 26 are currently located in Districts 1 and 2. Table 25 shows pertinent information about each station.
Map 9 shows that Districts 1 and 2 are primarily residential with large areas of industrial development along the river and business/commercial development in the downtown area (District 1).

Portland Fire and Rescue Chapter V. Station and Apparatus Deployment Service Delivery System Study
TriData, a Division of 96 March 2006 System Planning Corporation
Map 9: District 1 and 2 Zoning

Portland Fire and Rescue Chapter V. Station and Apparatus Deployment Service Delivery System Study
TriData, a Division of 97 March 2006 System Planning Corporation
Table 25: PF&R Station and Apparatus Complement, District 1 and 2
Station Address Bays Apparatus 1 55 SW Ash St. 5 Truck 1, Engine 1 3 1715 NW Johnson St. 3 Engine 3, Truck 3 6 1505 SW Dewitt St. 2 Engine 6, Fireboat 8 7134 N Maryland Ave. 2 Engine 8, Truck 8 14 1905 NE Killingsworth St. 2 Engine 14 16 1715 SW Skyline Blvd. 2 Engine 16 17 848 N Tomahawk Island Dr. 2 Engine 17, Fireboat, Rescue Boat 22 7205 N. Alta St. 3 Engine 22, Truck 22 24 4515 N. Maryland Ave. 2 Engine 24, MRV 26 5247 N. Lombard St. 2 Engine 26
RISKS: Map 10 shows the locations of risks in Districts 1 and 2 in relation to the 10 fire stations protecting the area. Major risks in the region include 57 schools, 33 high-occupancy buildings, four nursing homes, two mental health facilities, one hospital, and 162 locations with Hazmat permits. These are all high-risk structures or facilities with special public safety needs. Additional hazards in the area include: 107 miles of heavy freight rail lines, 22 miles of light rail lines, numerous parks, open spaces, major portions of I-5 and I-205, and public lands (risk for wildfires during the summer).

Portland Fire and Rescue Chapter V. Station and Apparatus Deployment Service Delivery System Study
TriData, a Division of 98 March 2006 System Planning Corporation
Map 10: Districts 1 and 2 Risks
POPULATION: Population for the districts was estimated using the rate of change between
the 1990 and 2000 U.S. Censuses. Districts 1 and 2 had an estimated population of 143,999 in FY05, the lowest of all districts.40 Overall, there are 2,162 people per square mile in Districts 1 and 2. Map 11 shows the year 2000 population by square mile in each census tract. The lower population density in Districts 1 and 2 is due to the concentration of businesses in the downtown area and the industrial areas along the rivers; thus, less residential development. 40 Population was based on U.S. Census tracts. Not all tracts fall completely within one district, and population is not distributed evenly throughout a tract. Therefore, population was included in District containing the center of the tract.

Portland Fire and Rescue Chapter V. Station and Apparatus Deployment Service Delivery System Study
TriData, a Division of 99 March 2006 System Planning Corporation
Map 11: Year 2000 Population per Square Mile, Districts 1 and 2
DEMAND: In FY05, there were 15,614 geocoded calls in Districts 1 and 2. This is about 235 calls per square mile, 1,561 calls per station, and 108 calls per 1,000 people. Since incidents are not distributed evenly across the area, Table 26 shows the number of incidents in each FMA in District 1 and 2 for FY00 and FY05. Station 1 had the highest number of incidents for FY05 in Districts 1 and 2 as well as citywide (4,511), while Station 6 had the lowest (333). Map 12 illustrates FY05 call density for Districts 1 and 2. Overall, there were 128 fewer incidents in FY05 than in FY00 for Districts 1 and 2.

Portland Fire and Rescue Chapter V. Station and Apparatus Deployment Service Delivery System Study
TriData, a Division of 100 March 2006 System Planning Corporation
Demand has been remarkably level overall in Districts 1 and 2, with only minor changes by station area.
Table 26: Calls by FMA, District 1 and 2, FY05
FMA Incidents FY00 Incidents FY0501* 4,204 4,511 03* 3,403 3,476 06 437 333 08* 1,700 1,580 14 2,951 2,351 16 109 538 17 943 890 22* 2,001 2,072 24 2,036 2,077 26 1,400 1,228 Total 19,184 19,056
* Station in FMA has multiple companies Note: Numbers reflect emergency incidents in the specified FMA and do not reflect total unit responses. Note: Station 16 opened in February 2002, however FMA 16 contained 109 emergency incidents in fiscal year 2000
Based on the population growth expected in Districts 1 and 2 and projected systemwide demand, demand in the area could increase to 20,000–22,000 calls by 2010, as shown in Table 27. Unit responses could increase as shown in Table 28. Based on the projected demand and unit responses, there does not appear to be a need for additional fire apparatus in Districts 1 and 2 in the next five years. (The data should be re-evaluated in five years to make sure the fire apparatus is still not needed. Much can happen in this timeframe that might require additional resources). A recommendation is made in Chapter VI, Fire and Rescue Operations, to increase the number of rescue units to help reduce workload for some of the fire apparatus at Station 1.

Portland Fire and Rescue Chapter V. Station and Apparatus Deployment Service Delivery System Study
TriData, a Division of 101 March 2006 System Planning Corporation
Map 12: FY05 Call Density, District 1 and 2
Table 27: District 1 and 2 Demand, FY06–FY10
Fiscal Year Low High 2006 19,884 20,298 2007 20,143 20,650 2008 20,348 21,031 2009 20,392 21,602 2010 20,438 22,192

Portland Fire and Rescue Chapter V. Station and Apparatus Deployment Service Delivery System Study
TriData, a Division of 102 March 2006 System Planning Corporation
Table 28: District 1 and 2 Unit Responses, FY06–FY25
FY06 FY10 FY15 FY20 FY25
Unit Low High Low High Low High Low High Low High Engine 1 2,477 2,511 2,609 2,816 2,738 3,186 2,874 3,537 3,018 3,934Engine 3 2,792 2,830 2,940 3,174 3,086 3,591 3,240 3,987 3,402 4,434Engine 6 430 436 452 488 475 552 499 613 523 682Engine 8 1,552 1,574 1,635 1,765 1,716 1,996 1,801 2,217 1,891 2,465Engine 14 2,517 2,552 2,651 2,862 2,782 3,237 2,921 3,594 3,067 3,998Engine 16 890 902 937 1,012 984 1,145 1,033 1,271 1,084 1,413Engine 17 865 877 911 984 957 1,113 1,004 1,236 1,054 1,374Engine 22 1,221 1,238 1,286 1,388 1,350 1,570 1,417 1,744 1,488 1,939Engine 24 2,408 2,442 2,536 2,738 2,662 3,097 2,795 3,439 2,934 3,825Engine 26 1,461 1,481 1,539 1,661 1,615 1,879 1,695 2,086 1,780 2,320Truck 1 1,679 1,703 1,769 1,909 1,856 2,160 1,949 2,398 2,046 2,667Truck 3 1,463 1,483 1,541 1,664 1,617 1,882 1,698 2,089 1,783 2,324Truck 8 917 929 965 1,042 1,013 1,179 1,064 1,309 1,117 1,456Truck 22 1,192 1,209 1,256 1,356 1,318 1,534 1,384 1,703 1,453 1,894Squad 01 1,871 1,897 1,791 2,127 2,068 2,406 2,171 2,672 2,280 2,972
Total 23,735 24,063 24,997 26,988 26,237 30,527 27,544 33,896 28,921 37,697
RESPONSE TIMES AND COVERAGE: To determine whether there are any areas in Districts 1 and 2 that are not well covered, and to evaluate the overlap among stations, the ability of apparatus to cover the area and risks present in the recommended time must be evaluated. As discussed above, overall total response times are higher than recommended; however, station and apparatus placement depends largely on travel times. In Districts 1 and 2, 90th percentile travel times for the first arriving unit in FY05 was 05:20, about one and a half minutes higher than the four minutes recommended by TriData.
Table 29 summarizes 90th percentile travel times to incidents in Districts 1 and 2 during FY05. Travel times for Engines 17 and 22 are significantly higher than other units in the districts. Engines 17 and 22 have larger first-due areas than other units in the district. In addition, a large portion of the area covered by Engine 22 is hilly, with narrow, winding roads that are more difficult to travel safely along than the downtown roads.

Portland Fire and Rescue Chapter V. Station and Apparatus Deployment Service Delivery System Study
TriData, a Division of 103 March 2006 System Planning Corporation
Table 29: District 1 and 2 Apparatus Travel Times in FY05
Unit 90th Percentile
Travel* Engine 1 03:49 Engine 3 04:25 Engine 6 04:58 Engine 8 05:20 Engine 14 05:17 Engine 16 05:53 Engine 17 07:10 Engine 22 08:06 Engine 24 04:30 Engine 26 04:55 Truck 1 03:53 Truck 3 04:38 Truck 8 04:44 Truck 22 06:50 * All times calculated for first-arriving
unit to incidents in the units’ respective FMAs.
Based on the road network and travel speeds discussed above, the four-minute response reach of stations in Districts 1 and 2 is shown in Map 13. Based on the calculated response reach, 97 percent (15,115 of 15,614) of FY05 calls were within the theoretical four-minute travel time from the current District 1 and 2 stations. However, because the reach (as shown in the map) is theoretically based, it does not reflect the actual response times. Based on the response time data, about 60 to 70 percent of incidents are being reached in less than four minutes.

Portland Fire and Rescue Chapter V. Station and Apparatus Deployment Service Delivery System Study
TriData, a Division of 104 March 2006 System Planning Corporation
Map 13: District 1 and 2, Current Four-Minute Response Reach
There are two main areas beyond the current theoretical four-minute travel time reach; one northwest of Station 16 and one west of Station 22. The area northwest of Station 16 is the area to be covered by Station 27 upon its completion. The area north of Station 22 and west of Station 17 also is just outside of the four-minute response reach. This area is mainly industrial and port facilities. However, given the total demand in the region and the relative workloads of units serving the area, there is no need for additional stations or apparatus in Districts 1 and 2 at present or for the next three to five years. After that time period, demand would need to be examined again to determine if a need exists.

Portland Fire and Rescue Chapter V. Station and Apparatus Deployment Service Delivery System Study
TriData, a Division of 105 March 2006 System Planning Corporation
Of the high-risk facilities identified above, only four Hazmat sites are beyond current four-minute reach.
FUTURE NEEDS: Despite the current travel times in Districts 1 and 2, there does not appear to be a need for additional resources in this area in the next 5 years. The current number of apparatus is sufficient to handle future demand under both the low and high projections. Finally, stations are of a reasonable age, and in very good condition. Response times in Districts 1 and 2 can be reduced through reductions in call processing and turnout time, as discussed earlier in this chapter.
District 3 – District 3 is comprised of 63.2 square miles of commercial, industrial, and residential development, as shown in Map 14. Industrial development occurs primarily on the northern side of the region around the airport and along the Columbia River. Much of the district is residential with large segments of commercial development along major roadways. The district is bordered on north by the Columbia River, on the east by Gresham, on the west by Districts 1, 2 and 4, and on the south by Happy Valley.

Portland Fire and Rescue Chapter V. Station and Apparatus Deployment Service Delivery System Study
TriData, a Division of 106 March 2006 System Planning Corporation
Map 14: District 3 Zoning
District 3 is protected by 10 stations: 2, 11, 12, 19, 25, 28, 41, 42, 43, and 45. Table 30
shows pertinent information about each station currently located in District 3. Station 28 was recently renovated and therefore, units stationed there did not respond to calls in FY05.

Portland Fire and Rescue Chapter V. Station and Apparatus Deployment Service Delivery System Study
TriData, a Division of 107 March 2006 System Planning Corporation
Table 30: PF&R Station and Apparatus Complement, District 3
Station Address Bays Apparatus 2 4800 NE 122nd 3 Engine 2, Truck 2 11 5707 SE 92nd 2 Engine 11 12 8645 NE Sandy 2 Engine 12 19 7301 E Burnside 2 Engine 19 25 5211 SE Mall 2 Engine 25, Truck 25 28* 5540 NE Sandy Blvd. 2 Engine 28, Air Unit 28 41 1500 SE 122nd 4 Engine 41, Truck 41, Hazmat 41 42 13310 SE Foster 2 Engine 42 43 13313 NE San Rafael St. 2 Engine 43 45 1927 SE 174th 2 Engine 45
* Station 28 was undergoing Seismic Retrofitting in FY05.
RISKS: Major risks in District 3 include 108 schools, three hospitals, and 47 locations with Hazmat permits (Map 15). These are all high-risk structures or facilities with special public safety needs. Additional hazards in the area include: I-84 and I-205 (high-volume roads); 27.6 miles of heavy railroad lines; 19.2 miles of light rail lines; Portland International Airport; and 19 nursing homes.

Portland Fire and Rescue Chapter V. Station and Apparatus Deployment Service Delivery System Study
TriData, a Division of 108 March 2006 System Planning Corporation
Map 15: District 3 Risks
POPULATION: Map 16 shows the population by square mile for each census tract in year
2000 for District 3. Overall, the calls in this district are up sharply, by 17 percent since FY00. Total population for the region was approximately 270,799 in FY05.41 Overall, there are 4,285 people per square mile in District 3. District 3 has the highest population of the three districts, but the second highest density.
41 Population was based on U.S. Census tracts. Not all tracts fall completely within one district, and population is not distributed evenly throughout a tract. Therefore, population was included in District containing the center of the tract.

Portland Fire and Rescue Chapter V. Station and Apparatus Deployment Service Delivery System Study
TriData, a Division of 109 March 2006 System Planning Corporation
DEMAND: In FY05, there were 21,028 geocoded calls in District 3. This is 78 calls per 1,000 people.
Map 16: Year 2000 Population per Square Mile, District 3

Portland Fire and Rescue Chapter V. Station and Apparatus Deployment Service Delivery System Study
TriData, a Division of 110 March 2006 System Planning Corporation
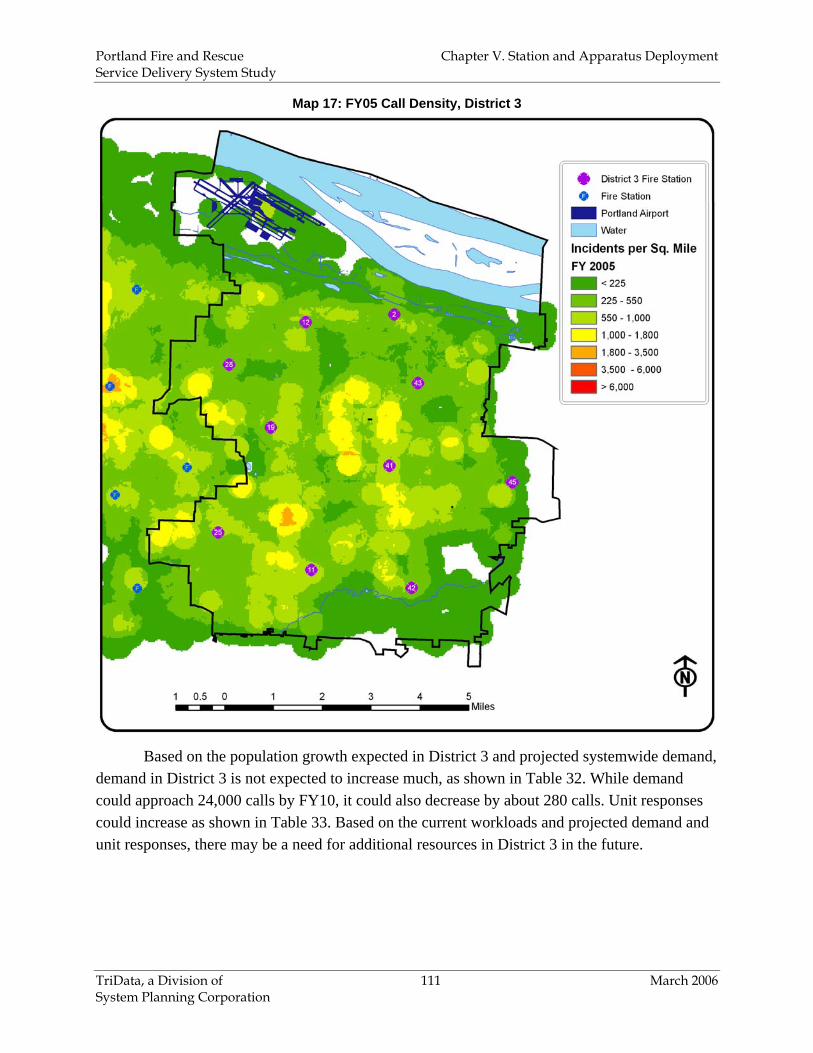
Table 31 shows the number of incidents for each FMA in District 3. Stations 11 and 41 had the highest number of incidents in FY05 (3,647 and 4,231 respectively), and Stations 2 and 12 had the lowest number of incidents (1,421 and 1,295). Station 41 had the second highest call volume in the city. Map 17 shows the FY05 call density for District 3.
Table 31: Calls by FMA, District 3, FY05
FMA Incidents FY00 Incidents FY0502* 1,638 1,421 11 3,003 3,647 12 266 1,295 19 2,735 2,938 25* 3,189 3,331 28 - - 41* 3,033 4,231 42 1,350 1,550 43 2,136 2,319 45 1,622 1,542
Total 18,972 22,274 *Station in FMA has multiple companies Note: Numbers reflect emergency incidents in the specified FMA and do not reflect total unit responses. Note: FMA 28 had no incidents recorded in either the 2000 or 2005 CAD Data
Portland Fire and Rescue Chapter V. Station and Apparatus Deployment Service Delivery System Study
TriData, a Division of 111 March 2006 System Planning Corporation
Map 17: FY05 Call Density, District 3
Based on the population growth expected in District 3 and projected systemwide demand, demand in District 3 is not expected to increase much, as shown in Table 32. While demand could approach 24,000 calls by FY10, it could also decrease by about 280 calls. Unit responses could increase as shown in Table 33. Based on the current workloads and projected demand and unit responses, there may be a need for additional resources in District 3 in the future.

Portland Fire and Rescue Chapter V. Station and Apparatus Deployment Service Delivery System Study
TriData, a Division of 112 March 2006 System Planning Corporation
Table 32: District 3 Demand, FY06–FY10
Fiscal Year Low High 2006 21,398 21,844 2007 21,677 22,222 2008 21,897 22,632 2009 21,744 23,247 2010 21,995 23,882
Table 33: District 3 Unit Responses, FY05–FY25
FY06 FY10 FY15 FY20 FY25
Unit Low High Low High Low High Low High Low High Engine 2 1,316 1,335 1,386 1,497 1,455 1,693 1,528 1,880 1,604 2,091Engine 11 2,982 3,024 3,141 3,391 3,297 3,836 3,461 4,259 3,634 4,737Engine 12 2,007 2,035 2,114 2,283 2,219 2,582 2,330 2,867 2,446 3,188Engine 19 2,904 2,945 3,059 3,303 3,211 3,736 3,371 4,148 3,539 4,613Engine 25 2,615 2,651 2,754 2,974 2,891 3,364 3,035 3,735 3,187 4,154Engine 41 3,145 3,189 3,313 3,577 3,477 4,045 3,650 4,492 3,833 4,996Engine 42 1,808 1,833 1,905 2,056 1,999 2,326 2,099 2,583 2,204 2,872Engine 43 2,523 2,558 2,657 2,869 2,789 3,245 2,928 3,603 3,074 4,007Engine 45 1,817 1,842 1,913 2,066 2,008 2,337 2,108 2,594 2,214 2,885Truck 2 954 968 1,005 1,085 1,055 1,228 1,108 1,363 1,163 1,516Truck 25 1,875 1,901 1,975 2,132 2,073 2,412 2,176 2,678 2,285 2,978Truck 41 2,174 2,205 2,290 2,473 2,404 2,797 2,523 3,105 2,650 3,454Total 26,123 26,485 27,513 29,704 28,878 33,599 30,316 37,307 31,831 41,491
RESPONSE TIMES AND COVERAGE: Again, to determine whether there are any areas in District 3 that are not well covered, and to evaluate the overlap among stations, the ability of apparatus to cover the area and risks present in the recommended time must be evaluated. In District 3, the 90th percentile travel time for the first arriving unit in FY05 was 5:45; this is slightly higher with the times seen in Districts 1 and 2, but still nearly two minutes higher than the four minutes recommended in Chapter IV.
Table 34 summarizes 90th percentile travel times for individual units to incidents in District 3 during FY05. The extended travel times in this region could be due in part to traffic congestion or the abundance of traffic calming devices in the area. Travel times for engines vary from 6:08 (Engine 2) to 4:42 (Engine 41). There are very few instances where the first unit arriving is from outside their FMA. This indicates that the first due unit in a FMA is usually the first unit arriving to an incident. This likely eliminates the explanation that the high travel times are a result of units not being in their respective FMA when a call is received – it is other factors.

Portland Fire and Rescue Chapter V. Station and Apparatus Deployment Service Delivery System Study
TriData, a Division of 113 March 2006 System Planning Corporation
Table 34: District 3 Apparatus Response Times in FY05
Unit 90th Percentile
Travel* Engine 2 06:08 Engine 11 05:14 Engine 12 04:49 Engine 19 05:37 Engine 25 05:17 Engine 28** – Engine 41 04:42 Engine 42 05:56 Engine 43 05:31 Engine 45 05:21 Truck 2 06:32 Truck 25 06:03 Truck 41 05:06 * All times calculated for first-arriving unit to incidents in
the units’ respective FMAs. ** Engine 28 did not have any responses in FY05
Based on the road network and travel speeds discussed above, the theoretical four-minute response reach of stations in District 3 is shown in Map 18. Based on the calculated response reach, 97 percent of FY05 calls were within a four-minute travel time from the current District 3 station; however, actual response times indicate only 60 to 70 percent of incidents are being reached in less than four minutes. Of the high-risk facilities identified above, all are covered except three Hazmat locations south of the airport.

Portland Fire and Rescue Chapter V. Station and Apparatus Deployment Service Delivery System Study
TriData, a Division of 114 March 2006 System Planning Corporation
Map 18: District 3, Current Four-Minute Response Reach
FUTURE NEEDS: Given the current workloads of units serving the area, anticipated future demand, and current travel times, multiple units may become overloaded in 10–15 years. This situation should be monitored for its impact on unit availability and response times. Improvements in response times could be achieved by placing two-person rescue units in the district as discussed in Chapter VI, Fire and Rescue Operations.
Recommendation 17: Monitor the availability and response times of units in District 3 for changes due to increased demand. Regular (annual) monitoring of unit availability will alert

Portland Fire and Rescue Chapter V. Station and Apparatus Deployment Service Delivery System Study
TriData, a Division of 115 March 2006 System Planning Corporation
the department to changes impacting response times and service before they become a significant problem.
The location of Station 45 is contingent upon the current agreement with Gresham. This poses a unique problem. Should the agreement with Gresham end, much of Station 45’s coverage area would be outside of Portland. In the event of this occurring, however, it would be difficult to move Station 45 further into the city without having significant coverage overlap with Station 41. Demand in the area is such that eliminating Station 45 is also not a good option. While not in an ideal location, demand and response times would require Portland to continue operating Station 45 at its current location. In the event of such a scenario, a future station location study should be conducted in District 3 to determine the most effective deployment of resources.
District 4 Region – District 4 covers 33.1 square miles and is the smallest of the three Districts. District 4 is bordered on the north by Districts 1 and 2, on the east by District 3, on the south by Milwaukie, and on the west by Tualatin Valley.
Map 19 shows the zoning for District 4. Much of the area is zoned for residential development; however, there are several large areas of commercial development along I-5 and in the downtown area. There are also some areas of industrial development along the Willamette River.
STATIONS: Nine fire stations cover District 4: 4, 5, 9, 10, 13, 15, 18, 20, and 23. An additional station, Station 21, is proposed on the western side of the district. Table 25 shows pertinent information about each station. Station 15 is the oldest station in the city.
Table 35: PF&R Station and Apparatus Complement, District 4
Station Address Bays Apparatus 4 511 SW College 2 Engine 4, Truck 4 5 1505 SW Dewitt St. 2 Engine 5 9 1706 SE 39th 2 Engine 9 10 451 SW Taylors Ferry 2 Engine 10 13 926 NE Weidler St. 2 Engine 13, Truck 13 15 1920 SW Spring St. 1 Engine 15 18 8720 SW 30th Ave. 2 Engine 18 20 2235 SE Bybee Blvd. 2 Engine 20 23 2915 SE 13 Pl. 3 Engine 23

Portland Fire and Rescue Chapter V. Station and Apparatus Deployment Service Delivery System Study
TriData, a Division of 116 March 2006 System Planning Corporation
Map 19: District 4 Zoning
RISKS: Map 20 shows the locations of risks in District 4 in relation to the fire stations protecting the area. Major risks in the region include 75 schools, 54 sites with Hazmat permits, and 5 hospitals. Additional hazards in the area include: Interstates 5 and 205; 45.4 miles of heavy railroad lines; 17.8 miles of light rail lines; and 14 nursing homes.

Portland Fire and Rescue Chapter V. Station and Apparatus Deployment Service Delivery System Study
TriData, a Division of 117 March 2006 System Planning Corporation
Map 20: District 4 Risks
POPULATION: In FY05, District 4 had a population of approximately 156,450.42 Map 21 shows the population by square mile in year 2000 census tracts. Overall, there are 4,727 people per square mile in District 4, which is the highest of the districts.
42 Population was based on U.S. Census tracts. Not all tracts fall completely within one district, and population is not distributed evenly throughout a tract. Therefore, population was included in District containing the center of the tract.

Portland Fire and Rescue Chapter V. Station and Apparatus Deployment Service Delivery System Study
TriData, a Division of 118 March 2006 System Planning Corporation
Map 21: Year 2000 Population per Square Mile, District 4
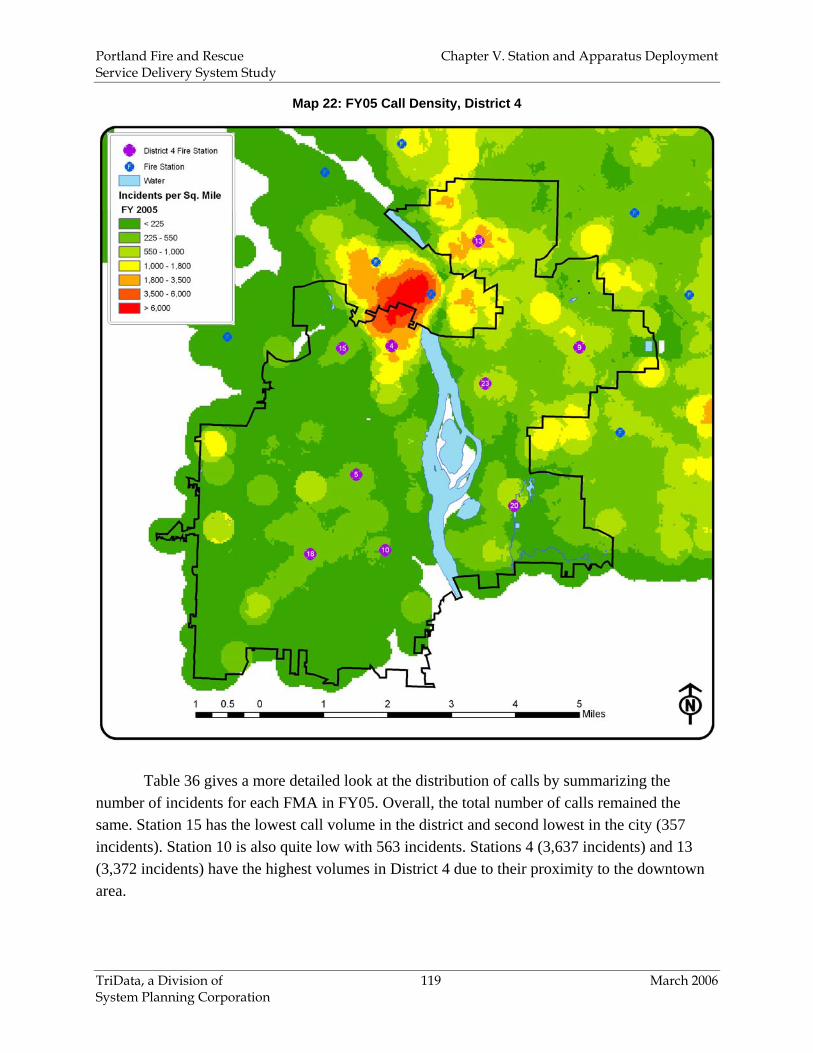
DEMAND: In FY05, there were 12,536 geocoded calls in District 4. This is about 1,393 calls per station and 80 calls per 1,000 people. Like the population, incidents are concentrated north of Station 4 near the downtown area, as shown in Map 22.
Portland Fire and Rescue Chapter V. Station and Apparatus Deployment Service Delivery System Study
TriData, a Division of 119 March 2006 System Planning Corporation
Map 22: FY05 Call Density, District 4
Table 36 gives a more detailed look at the distribution of calls by summarizing the number of incidents for each FMA in FY05. Overall, the total number of calls remained the same. Station 15 has the lowest call volume in the district and second lowest in the city (357 incidents). Station 10 is also quite low with 563 incidents. Stations 4 (3,637 incidents) and 13 (3,372 incidents) have the highest volumes in District 4 due to their proximity to the downtown area.

Portland Fire and Rescue Chapter V. Station and Apparatus Deployment Service Delivery System Study
TriData, a Division of 120 March 2006 System Planning Corporation
Based on the population growth expected in District 4 and projected systemwide demand, demand in the area could increase to nearly 18,000 calls by 2010. Demand could also remain closer to the 16,000–17,000 incident range, as shown in Table 37. Unit responses could increase as shown in Table 38. Based solely on the projected demand and unit responses, there does not appear to be a need for additional resources in District 4 at present or for 5 years out. Only Engine 13 might need some relief about FY10.
Table 36: Actual Calls by FMA, District 4, FY05
FMA Incidents FY00 Incidents FY0504* 3,173 3,637 05 1,131 1,181 09 2,603 2,276 10 569 563 13* 3,315 3,372 15 513 357 18 1,355 1,500 20 1,394 1,144 23 1,274 1,126
Total 15,327 15,156 * Station in FMA has multiple companies Note: Numbers reflect emergency incidents in the specified FMA and do not reflect total unit responses.
Table 37: Projected District 4 Demand, FY06–FY10
Fiscal Year Low High 2006 15,852 16,182 2007 16,058 16,462 2008 16,221 16,766 2009 16,256 17,221 2010 16,294 17,692

Portland Fire and Rescue Chapter V. Station and Apparatus Deployment Service Delivery System Study
TriData, a Division of 121 March 2006 System Planning Corporation
Table 38: District 4 Unit Responses, FY05–FY25
FY06 FY10 FY15 FY20 FY25
Unit Low High Low High Low High Low High Low High Engine 4 2,598 2,634 2,736 2,954 2,872 3,341 3,015 3,710 3,166 4,126Engine 5 1,268 1,286 1,336 1,442 1,402 1,631 1,472 1,811 1,545 2,014Engine 9 2,352 2,384 2,477 2,674 2,600 3,025 2,729 3,359 2,866 3,735Engine 10 875 887 921 994 967 1,125 1,015 1,249 1,066 1,389Engine 13 2,693 2,730 2,836 3,062 2,977 3,464 3,125 3,846 3,282 4,278Engine 15 525 532 553 597 580 675 609 750 640 834Engine 18 1,595 1,617 1,680 1,814 1,763 2,052 1,851 2,278 1,944 2,534Engine 20 1,086 1,101 1,143 1,235 1,200 1,396 1,260 1,551 1,323 1,724Engine 23 641 650 675 729 708 824 744 915 781 1,018Truck 4 1,661 1,684 1,749 1,889 1,836 2,136 1,927 2,372 2,024 2,638Truck 13 1,724 1,748 1,816 1,961 1,906 2,218 2,001 2,463 2,101 2,739Total 17,017 17,253 17,922 19,350 18,812 21,888 19,749 24,303 20,736 27,029
RESPONSE TIMES AND COVERAGE: In District 4, the 90th percentile travel time for the first arriving unit in FY05 was 5:45, similar to the other districts. Table 39 summarizes 90th percentile travel times to incidents in District 4 during FY05. The extended travel times in this region can be attributed partly to the topography. This is a hilly area and that could be causing a significant decrease in travel speed, resulting in higher travel times.
Table 39: District 4 Apparatus Response Times in FY05
Unit 90th Percentile Travel* Engine 4 04:46 Engine 5 06:11 Engine 9 04:31 Engine 10 05:25 Engine 13 04:44 Engine 15 06:40 Engine 18 06:07 Engine 20 05:54 Engine 23 04:35 Truck 4 04:34 Truck 13 04:24
* All times calculated for first-arriving unit to incidents in the units’ respective FMAs.
Based on the road network and travel speeds discussed above, the theoretical four-minute response reach of stations in District 4 is shown in Map 23. Based on the calculated response reach, 93 percent of FY05 calls were within a four-minute travel time from the current District 4 stations. This is lower than the other districts, and is due to the lack of coverage in the areas west

Portland Fire and Rescue Chapter V. Station and Apparatus Deployment Service Delivery System Study
TriData, a Division of 122 March 2006 System Planning Corporation
of stations 5 and 18. Of the high-risk facilities identified above, only three schools and one Hazmat locations are beyond this four-minute reach.
There are is one concentration of calls beyond the current station reach. It is located west of Stations 5 and 18. The area would be covered by the proposed Station 21; however, another possibility is relocating Stations 5 and 18. In 2005, there were 833 calls in this area outside the current theoretical four-minute response reach.
Map 23: District 4, Current Response Reach

Portland Fire and Rescue Chapter V. Station and Apparatus Deployment Service Delivery System Study
TriData, a Division of 123 March 2006 System Planning Corporation
Map 24: Overall Four-Minute Response Reach
FUTURE NEEDS: Based on the future demand in District 4 and current travel times to the area, there is a need to redeploy some resources in District 4 over the next several years.
In FY05 there were 833 incidents that were located beyond the four-minute response reach of any station in District 4. This included 771 incidents in the areas of Stations 5 and 18. Based on the volume of calls in the region west of stations 18 and 5, there are productivity and coverage gains that can be realized by relocating the two stations to cover the area. Station 18 should be relocated to the planned area near I-5 and SW Capitol Hwy. Station 5 should be relocated to an area near SW Vermont St. and SW 30th Ave. Station 18 is the higher priority.

Portland Fire and Rescue Chapter V. Station and Apparatus Deployment Service Delivery System Study
TriData, a Division of 124 March 2006 System Planning Corporation
Station 5 can be moved within the next five to ten years, or if a co-located station is not built with TVF&R. By relocating these two stations, the need to build Station 21 in its currently proposed location is minimized.
Map 25 shows the four-minute response reach of current stations along with the reach of proposed Station 21. Much of the area that would be covered by Station 21 is already covered by Station 5. There are inefficiencies as a result of this proposed location. Therefore, the need for Station 21 in its currently proposed site is minimal and that a relocated Station 5 and 18 would be a more cost effective option. While Station 21 would reduce the number of calls outside the four-minute response reach from 771 to 192, most of those incidents can be covered by relocating Station 5 to cover the area. TriData recommends adding a station when there are at least 500 calls; however, because of the proposed location of Station 21, this would cause too much coverage overlap with the existing stations.

Portland Fire and Rescue Chapter V. Station and Apparatus Deployment Service Delivery System Study
TriData, a Division of 125 March 2006 System Planning Corporation
Map 25: Proposed Station 21 and Current Four-Minute Response Reach
Map 26 shows the current and proposed four-minute response reaches of Station 5 and Proposed Station 5. This move would cover much of the area Station 21 would cover. Map 27 shows the current and proposed four-minute response reaches of Station 18 and Proposed Station 18.

Portland Fire and Rescue Chapter V. Station and Apparatus Deployment Service Delivery System Study
TriData, a Division of 126 March 2006 System Planning Corporation
Map 26: Proposed Station 5 Change in Four-Minute Response Reach

Portland Fire and Rescue Chapter V. Station and Apparatus Deployment Service Delivery System Study
TriData, a Division of 127 March 2006 System Planning Corporation
Map 27: Proposed Station 18 Change in Four-Minute Response Reach
Map 28 shows the current four-minute response reach of Stations 5 and 18. This illustrates the overlap between those two stations as well as Station 10. The planned construction of Station 21 would cover the area currently outside the reach of Stations 18 and 5. While this would be a possible solution, it would not only require the construction of a new station on the periphery of the city, but would also require additional staffing. As an alternative, relocating Station 18 and Station 5 would provide the coverage needed, while maximizing response area within Portland. Additionally, no additional staffing would be required, since no additional stations are being added to the system.

Portland Fire and Rescue Chapter V. Station and Apparatus Deployment Service Delivery System Study
TriData, a Division of 128 March 2006 System Planning Corporation
Map 28: Station 5 and Station 18 Current Four- Minute Response Reach
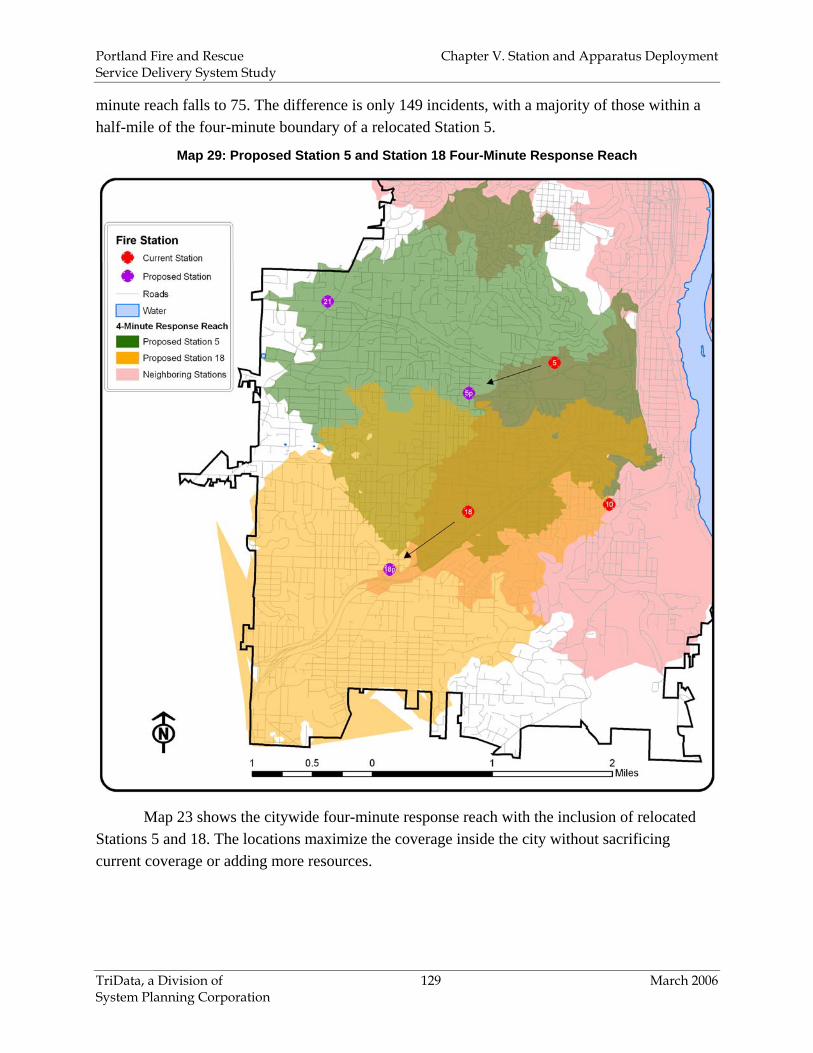
Map 29 shows the four-minute response reach with relocated Stations 18 and 5. This adds
much of the area currently outside of the four-minute response reach without sacrificing coverage elsewhere. At this time, Station 21 would not be needed with these two stations relocating unless there is a dramatic increase in demand in the area. Of the 771 incidents in FY05 that were outside the response reach of these stations, only 224 remain with the relocation of Stations 5 and 18. Demand may increase in future years, but it is projected to be low to moderate growth. This eliminates almost two-thirds of the incidents outside the coverage reach. With the construction of Station 21 and the move of Station 18, the number of incidents outside the four-
Portland Fire and Rescue Chapter V. Station and Apparatus Deployment Service Delivery System Study
TriData, a Division of 129 March 2006 System Planning Corporation
minute reach falls to 75. The difference is only 149 incidents, with a majority of those within a half-mile of the four-minute boundary of a relocated Station 5.
Map 29: Proposed Station 5 and Station 18 Four-Minute Response Reach
Map 23 shows the citywide four-minute response reach with the inclusion of relocated Stations 5 and 18. The locations maximize the coverage inside the city without sacrificing current coverage or adding more resources.

Portland Fire and Rescue Chapter V. Station and Apparatus Deployment Service Delivery System Study
TriData, a Division of 130 March 2006 System Planning Corporation
Map 30: Overall Four-Minute Response Reach with Proposed Relocation of Stations 5 & 18
Recommendation 18: Do not proceed with the construction of Station 21 in its proposed location. There are efficiencies that can be gained by relocating Stations 18 and 5. Station 21 in its proposed location has too much overlap with the other stations and does not adequately cover the current travel time gap. Further, the station would lie too close to the city’s border and would offer only limited coverage benefit to Portland. However, the city should work with TVF&R to find a location that would optimize regional coverage (i.e., extending beyond political borders). While TVF&R stands to benefit more than Portland, the joint partnership should be further explored. A GIS and Station Location Analysis should be performed with data from both municipalities to more definitively determine an appropriate location for Station 21. A station would have to be located very close to the border between TVF&R and Portland to offer Portland significant coverage.
Portland Fire and Rescue Chapter V. Station and Apparatus Deployment Service Delivery System Study
TriData, a Division of 131 March 2006 System Planning Corporation
Recommendation 19: Relocate Station 5 southwest to a location near the intersection of SW 30th Avenue and SW Vermont Street. This relocation would place Station 5 in a more central location in its first-due area and would bring the area in the western portion of FMA 5 to be within the four-minute coverage reach of Station 5. Due to the low call volume in the area currently outside of Stations 5’s four-minute reach, the decision to move the station does not have to be immediate, but should be considered in the next 5 to 10 years. Also important to consider is the potential partnership with TVF&R and to further consider how a joint station will impact the coverage area.
Recommendation 20: Relocate Station 18 southwest to a location near the intersection of SW Capitol Highway and Interstate 5. Continue with the plans to move Station 18 to its new location. This move will bring more of the western area into the four-minute response reach of Station 18.
Truck Deployment – The Portland Fire and Rescue operates nine trucks. These units are located at Stations 1, 2, 3, 4, 8, 13, 22, 25, and 41. Truck companies need to be placed strategically throughout the city in order to fully cover areas with high-rise buildings and structure fires.
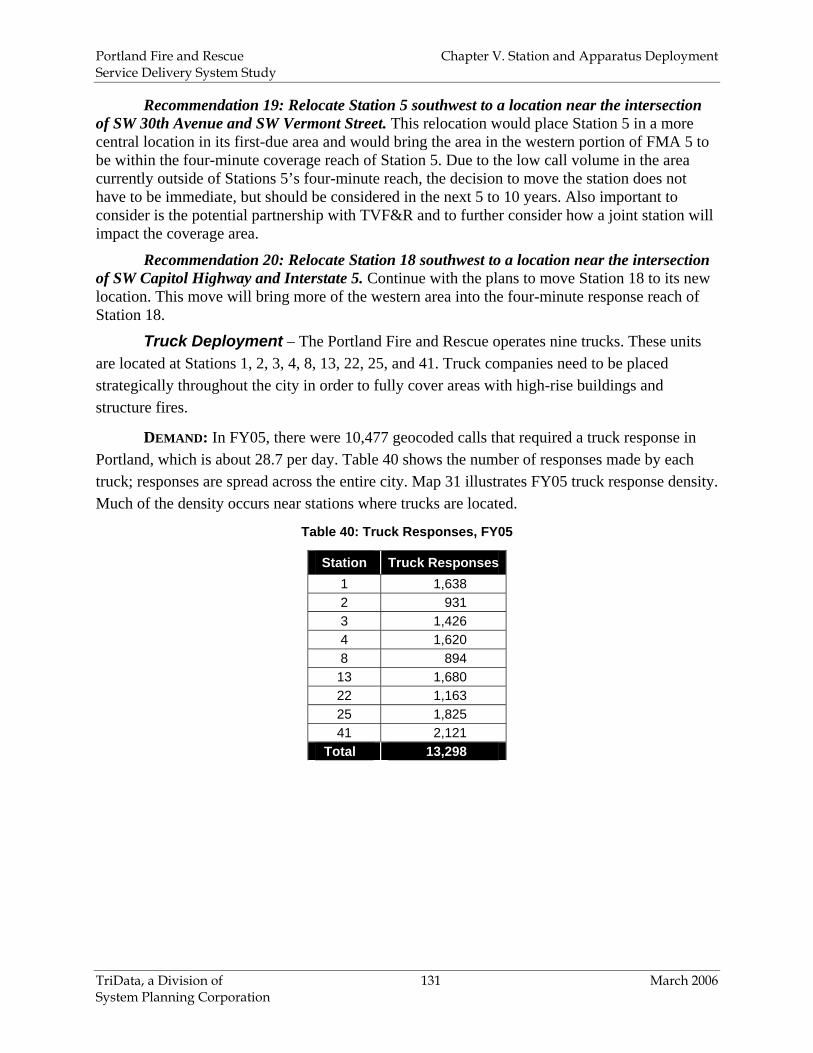
DEMAND: In FY05, there were 10,477 geocoded calls that required a truck response in Portland, which is about 28.7 per day. Table 40 shows the number of responses made by each truck; responses are spread across the entire city. Map 31 illustrates FY05 truck response density. Much of the density occurs near stations where trucks are located.
Table 40: Truck Responses, FY05
Station Truck Responses1 1,638 2 931 3 1,426 4 1,620 8 894 13 1,680 22 1,163 25 1,825 41 2,121
Total 13,298

Portland Fire and Rescue Chapter V. Station and Apparatus Deployment Service Delivery System Study
TriData, a Division of 132 March 2006 System Planning Corporation
Map 31: FY05 Density of Truck Responses
Based on the population growth expected and projected systemwide (fire) demand,
demand for trucks is expected to increase, as shown in Table 41. The increase could range from slightly over 16,000 responses to over 21,000 responses by 2025. Unit responses would increase as shown in Table 42.
Table 41: Truck Demand, FY06–FY25
Fiscal Year Low High 2006 13,640 13,829 2010 14,366 15,510 2015 15,079 17,544 2020 15,830 19,480 2025 16,621 21,665

Portland Fire and Rescue Chapter V. Station and Apparatus Deployment Service Delivery System Study
TriData, a Division of 133 March 2006 System Planning Corporation
Table 42: Truck Responses, FY05–FY25
FY06 FY10 FY15 FY20 FY25
Unit Low High Low High Low High Low High Low High Truck 1 1,679 1,703 1,769 1,909 1,856 2,160 1,949 2,398 2,046 2,667Truck 2 954 968 1,005 1,085 1,055 1,228 1,108 1,363 1,163 1,516Truck 3 1,463 1,483 1,541 1,664 1,617 1,882 1,698 2,089 1,783 2,324Truck 4 1,661 1,684 1,749 1,889 1,836 2,136 1,927 2,372 2,024 2,638Truck 8 917 929 965 1,042 1,013 1,179 1,064 1,309 1,117 1,456Truck 13 1,724 1,748 1,816 1,961 1,906 2,218 2,001 2,463 2,101 2,739Truck 22 1,192 1,209 1,256 1,356 1,318 1,534 1,384 1,703 1,453 1,894Truck 25 1,875 1,901 1,975 2,132 2,073 2,412 2,176 2,678 2,285 2,978Truck 41 2,174 2,205 2,290 2,473 2,404 2,797 2,523 3,105 2,650 3,454
Total 13,640 13,829 14,366 15,510 15,079 17,544 15,830 19,480 16,621 21,665
Despite the increasing responses by PF&R trucks, analysis of UHUs using the high demand projections from the previous section, the same unit response to incident ratio (assumes that growth will occur uniformly throughout the city), and the same demand distribution throughout the day shows that Truck 41, with the highest number of responses will reach a UHU of only 9.2 percent overall in FY25.
RESPONSE TIMES AND COVERAGE: To determine whether there were any areas in the city that were in need of truck coverage, the ability of apparatus to cover the area and risks present in the recommended time was evaluated. In FY05, trucks had 90th percentile travel times of 6:00, which is very good considering the large area that truck units have to cover. Table 43 summarizes 90th percentile truck travel times during FY05.
Table 43: Truck Travel Times in FY05
Unit 90th Percentile Travel Truck 1 03:51 Truck 2 06:32 Truck 3 04:38 Truck 4 04:34 Truck 8 04:44 Truck 13 04:24 Truck 22 06:50 Truck 25 06:03 Truck 41 05:06
Based on the road network and travel speeds discussed above, the six-minute response reach of trucks is shown in Map 32. Based on the calculated response reach, 98 percent of FY05

Portland Fire and Rescue Chapter V. Station and Apparatus Deployment Service Delivery System Study
TriData, a Division of 134 March 2006 System Planning Corporation
calls requiring a truck response were within a 6-minute travel time from the current stations with a truck.
Map 32: Current Truck Placement and 6-Minute Drive-Time Coverage
Map 33 shows the 6-minute response reach for trucks if Truck 1 is relocated to Station 5
in its current location. This move would add needed coverage to the southwest portion of the city and would only slightly increase the call volume of trucks 3, 4, and 13. It is also an alternative to purchasing and staffing an additional truck for Station 5. This also spreads out the coverage overlap that exists in the downtown area creating longer travel times to an incident in the southwest portion of the city.
The current coverage overlap of Trucks 1, 3, 4, and 13 is inefficient. While the number of calls requiring a truck in the southwest corner of the city is low, the move would improve truck response times and coverage redundancy. If Truck 1 and Truck 4 were both required on a call, and an incident occurred in the southwest area, either Truck 3 or Truck 25 would have to respond

Portland Fire and Rescue Chapter V. Station and Apparatus Deployment Service Delivery System Study
TriData, a Division of 135 March 2006 System Planning Corporation
and there would be a significant travel time. By relocating Truck 1 to Station 5, two trucks are still available for downtown incidents, and Truck 5 would become the first due unit on areas near Station 4.
Map 33: 6-Minute Truck Coverage with Relocation to Station 5
Recommendation 21: Relocate Truck 1 to Station 5. Moving Truck 1 to Station 5 will
maximize truck coverage. Currently, there are four trucks in the downtown area with significant coverage area overlap. By moving Truck 5, response reach is increased without sacrificing coverage to the downtown area. This move is recommended for either the current location of Station 5 or in the relocated Station 5.
SUMMARY
Overall, the Portland Fire & Rescue has done a good job of distributing stations and apparatus throughout the city to provide appropriate response coverage. Response times overall are currently longer than recommended. Call processing, and turnout are major factors in the

Portland Fire and Rescue Chapter V. Station and Apparatus Deployment Service Delivery System Study
TriData, a Division of 136 March 2006 System Planning Corporation
extended total response times. While travel time does play a role in the extended total response times in Portland, response time efforts should initially be focused on reducing call processing and turnout times.
The relocation of Stations 5 and 18 would ensure a greater coverage area in the southwest portion of the city and eliminate the need to build and staff Station 21. Station 21 would be a candidate for co-location; however, the coverage area it would offer outside the city would not be enough to fully cover the gap in TVF&R’s coverage. Relocating Stations 5 and 18, the response area offered by Station 21 is covered with no additional staffing or apparatus cost within Portland. Co-location of a station between PF&R and TVF&R should be discussed.
Truck coverage for the city overall is very good. Overall truck response times are also quite good. There is a significant coverage overlap between Trucks 1, 3, 4, and 13. To maximize coverage and efficiency, Truck 1 should be relocated to Station 5.