V RESOURCES INVENTORY FOR THE POWELL RIVER COMMUNITY FOREST · VEGETATION RESOURCES INVENTORY FOR...
21
VEGETATION RESOURCES INVENTORY FOR THE POWELL RIVER COMMUNITY FOREST FINAL REPORT Prepared for: Powell River Community Forest Ltd. 4760 Joyce Ave. Powell River, BC V8A 3B6 Attn: Chris Laing, RPF, Results Based Forest Management Ltd. by: Resource Group Ltd. 101 – 1584 7 th Avenue Prince George, BC, V5Z 4C2 November, 2015
Transcript of V RESOURCES INVENTORY FOR THE POWELL RIVER COMMUNITY FOREST · VEGETATION RESOURCES INVENTORY FOR...
VEGETATION RESOURCES INVENTORY FOR THE POWELL RIVER COMMUNITY FOREST
FINAL REPORT
Prepared for:
Powell River Community Forest Ltd.
4760 Joyce Ave. Powell River, BC
V8A 3B6
Attn: Chris Laing, RPF, Results Based Forest Management Ltd.
by:
Resource Group Ltd. 101 – 1584 7th Avenue
Prince George, BC, V5Z 4C2
November, 2015
Vegetation Resources Inventory – Powell River Community Forest
ACKNOWLEDGEMENTS
Many individuals have contributed time and effort into the completion of this Vegetation Resources Inventory (VRI) project. In particular, Ecora would like to express its sincere appreciation to the following individuals and groups:
Chris Laing, RPF, of Results Based Forest Management who served as Project Manager and initiated this project on behalf of Powell River Community Forest Ltd. Chris provided valuable early support and guidance related to current access within the PRCF. Additionally, Chris provided PRCF data, local knowledge to help improve species identification, quads for access, and certain field supplies.
Powell River Community Forest Ltd., for funding this forest inventory project, and for use of their 2012 LIDAR data set.
Western Forest Products Ltd. for use of their 2013 aerial digital frame imagery viewer sets.
iGi Consulting Ltd. for additional enhancement of Western’s viewer sets.
Vegetation Resources Inventory - Powell River Community Forest
iii
TABLE OF CONTENTS
1.0 Introduction ........................................................................................................... 1
1.1 Project Objectives ............................................................................................. 1
1.2 Description of Project Area ................................................................................ 2
2.0 Methods ................................................................................................................ 4
2.1 Standards ......................................................................................................... 4
2.2 Base Data ......................................................................................................... 4
2.3 Softcopy System ............................................................................................... 5
2.4 Polygon Delineation .......................................................................................... 5
2.5 Field Calibration ................................................................................................ 6
2.6 Polygon Attribution ............................................................................................ 7
2.6.1 Polygon Attributes ...................................................................................... 7
2.6.2 Tree Layer Attributes .................................................................................. 7
2.6.3 Data Source Codes .................................................................................... 8
2.7 LIDAR Integration.............................................................................................. 9
2.7.1 LIDAR calibration ....................................................................................... 9
2.8 Quality Control ................................................................................................ 10
2.9 Quality Assurance ........................................................................................... 11
3.0 Findings .............................................................................................................. 12
3.1 Polygon Delineation ........................................................................................ 12
3.2 Field Calibration and Other Data Sources ....................................................... 12
3.3 Polygon Attribution .......................................................................................... 14
4.0 References ......................................................................................................... 17
TABLE OF TABLES
Table 1: Comparison of 1991 Forest Cover and 2014 VRI polygons ......................... 12
Table 2: Summary of PRCF inventory polygons by Inventory Standard Code ........... 14
Table 3: Percentage of treed polygons by leading species and inventory .................. 14
Table 4: VRI treed polygon tally and percentage by height data source .................... 15
Table 5: Comparison of area by height class and inventory ....................................... 15

Vegetation Resources Inventory - Powell River Community Forest
iv
TABLE OF FIGURES
Figure 1: Powell River Community Forest overview ...................................................... 3
Figure 2: Trees visible for interpretation and description ............................................... 7
Figure 3: PRCF inventory data sources ...................................................................... 13
Figure 4: Comparison of area by height class and inventory ....................................... 16

Vegetation Resources Inventory – Powell River Community Forest
1
1.0 INTRODUCTION
In May 2014 representatives of the Powell River Community Forest (PRCF) met with a team from Ecora Resource Group Ltd. (Ecora) to discuss a plan to integrate Light Detection and Ranging (LIDAR) data into the existing Forest Cover inventory covering the license area. The PRCF expressed a keen interest in better understanding the productive capacity of the land base, completing a timber supply analysis to determine if the current harvest level is appropriate, and proposing a subsequent tactical planning / optimization project, which would bring significant value once the core dataset was improved.
Through that meeting it became evident that the PRCF’s objectives would be only partially achieved through that proposed project given that the core dataset, an incomplete Vegetation Resources Inventory (VRI) produced from an aggregate of 1966 and 1991 Forest Cover inventories, was very unreliable and included outdated delineation and suspect attribution.
The PRCF sits within the Sunshine Coast Timber Supply Area (TSA). A VRI project was recently completed for portions of the TSA, but the area occupied by the PRCF was not re-inventoried. Further, the Province has no plans to conduct VRI within the balance of the TSA for the foreseeable future. Similarly, although Terrestrial Ecosystem Mapping (TEM) was completed in 2010 for the portions of the Haslam Landscape Unit (LU) in the Sunshine Coast TSA, the polygons and attributes within the PRCF were not field verified.
The plan envisioned in the meeting was to improve the core datasets, specifically the VRI and TEM covering the license area. Given that the PRCF owns 2012 LIDAR data and has access to 2013 aerial digital frame imagery, that TEM can enable subsequent timber supply analyses to use Site Index by Site Series (SIBEC) for managed stand yields, and that improving managed stand yields and VRI would likely increase the harvest level supported by the land base, the suggested approach evolved to:
Complete a full VRI using all available data to improve the reliability of the attribution. LIDAR, TEM, Reporting Silviculture Updates and Land status Tracking System (RESULTS) and standing timber inventory (STI) would be used to improve the accuracy of the VRI stand level attributes;
Retain the 2010 Haslam LU TEM as a stand-alone dataset, rather than provide an ecosystem mapping label for each VRI polygon; and
Work with the local PRCF team to implement a process for continual improvement of the inventory.
1.1 Project Objectives
The objectives of the VRI project for the PRCF were to:
Re-delineate the license area to current VRI standards at a minimum using the 2013 imagery;
Collect sufficient field data to both calibrate the photo interpreters and calibrate the LIDAR dataset;
Provide a full VRI attribute label for every polygon in the license area referencing field calibration, STI, RESULTS, LIDAR and TEM data where possible; and
Vegetation Resources Inventory - Powell River Community Forest
2
Deliver a seamless VRI with accompanying report for use in timber supply analyses and subsequent tactical planning / optimization projects.
1.2 Description of Project Area
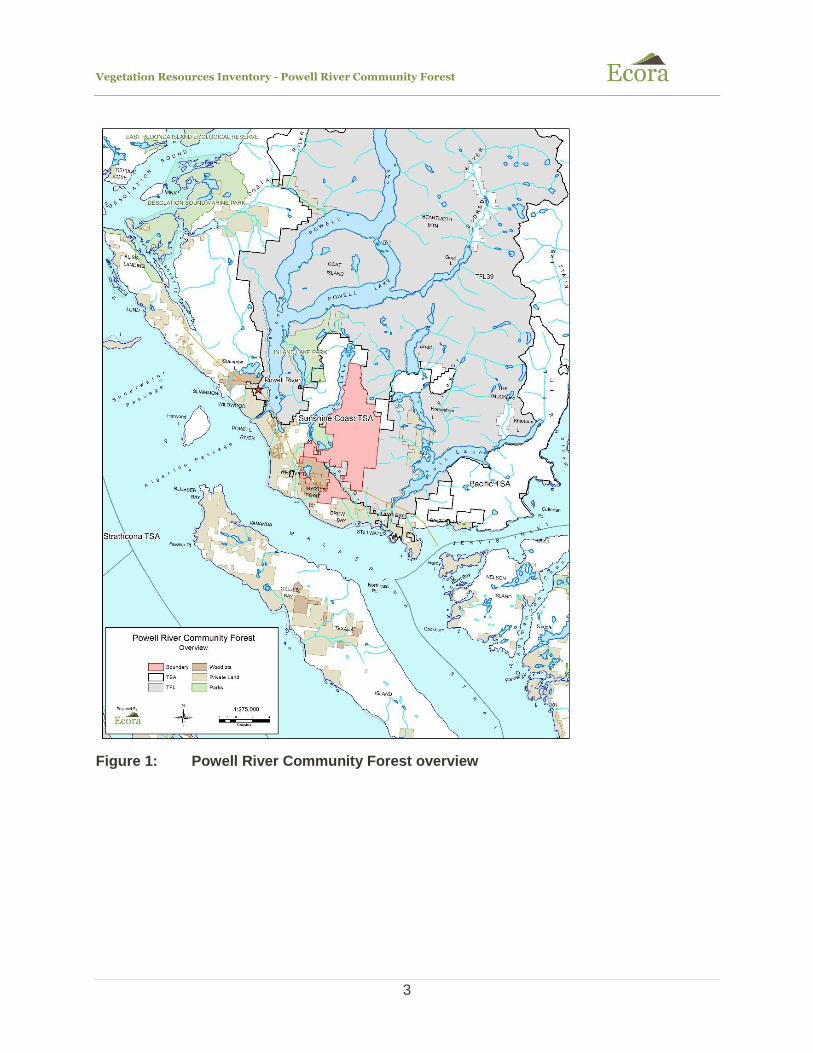
The PRCF is located in the Sunshine Coast Natural Resource District, managed by the Ministry of Forests, Lands and Natural Resource Operations (MFLNRO). It is situated just east of the community of Powell River, BC, as illustrated in Figure 1 below, and encompasses a forested land base of approximately 7,100 ha.
The dominant coniferous tree species throughout the sampled portions of the PRCF forest are Douglas-fir, western red cedar, and western hemlock, with lesser amounts of western white pine. At elevations of approximately 600 m and higher (below 500 m in colder areas such as creek draws), amabilis fir and yellow cedar occur with western red cedar and western hemlock, although Douglas-fir still represents a minor component at transitional elevations. In localized areas of wetter and/or richer soils, red alder typically represents a sub-component and is locally common in some areas of rich soil. Lodgepole pine is infrequent within the PRCF, occurring primarily on the very driest and wettest portions of the landscape. Arbutus and big leaf maple occur sporadically in suitable micro-habitats within the PRCF, including on exposed outcrops and at the base of coarse talus slopes, respectively.
Vegetation Resources Inventory - Powell River Community Forest
3
Figure 1: Powell River Community Forest overview
Vegetation Resources Inventory - Powell River Community Forest
4
2.0 METHODS
The following is a detailed synopsis of the methodology used to produce the VRI for the PRCF. For clarity the 1991 Forest Cover inventory covering the PRCF is referred to as the existing inventory.
2.1 Standards
The PRCF VRI was produced in accordance with Ecora’s project plan, and following these current versions of the relevant Provincial VRI procedures, standards and guidelines:
BC Ministry of Forest, Lands and Natural Resource Operations. 2014. Vegetation Resources Inventory Photo Interpretation Procedures, v.3.0. Forest Analysis and Inventory Branch, Victoria, BC.
BC Ministry of Forest, Lands and Natural Resource Operations. 2013. Photo Interpretation Guidelines for Integrating RESULTS Information. Forest Analysis and Inventory Branch, Victoria, BC.
BC Ministry of Forest, Lands and Natural Resource Operations. 2014. Vegetation Resources Inventory Photo Interpretation Quality Assurance Procedures and Standards, v.3.7. Forest Analysis and Inventory Branch, Victoria, BC.
BC Ministry of Forest, Lands and Natural Resource Operations. 2014. Vegetation Resources Inventory Field Calibration Procedures for Photo Interpretation, v.1.4. Forest Analysis and Inventory Branch, Victoria, BC.
BC Ministry of Sustainable Resource Management. 2002. Vegetation Resources Inventory - The BC Land Cover Classification Scheme, v.1.3. Terrestrial Information Branch, Victoria, BC.
BC Ministry of Forests and Range. 2009. VRIMS Personal Geodatabase Structure and Use, v.1.2. BC Ministry of Forests and Range, Victoria, BC.
BC Ministry of Forests and Range. 2013. VRIMS Vegetation Cover Polygon Validation Rules, v.1.7.4. BC Ministry of Forests and Range, Victoria, BC.
BC Ministry of Forests and Range. 2009. Vegetation Resources Inventory Preparing a Project Implementation Plan for Photo interpretation – Appendix D Field Calibration Plan Guidelines, v.2.3. Forest Analysis and Inventory Branch, Victoria, BC.
2.2 Base Data
A variety of base data sources were gathered for this inventory to facilitate all phases of the project.
The following datasets were acquired from the Province’s Geo BC online digital data warehouse, and clipped to the PRCF boundary:
Community Forest Agreement K3G boundary
RESULTS Forest Cover
RESULTS Openings

Vegetation Resources Inventory - Powell River Community Forest
5
Forest Tenures (FTEN) Cut Blocks
Terrestrial Resource Information Management (TRIM) II water features
Provincial road atlas coverage
Forest inventory data for BCGS map sheets 092F078, 093F079, 092F088, 093F089, 092F098 and 093F099
The PRCF subsequently provided or facilitated the delivery of the following data sets:
PRCF standing timber inventory
PRCF trail network
PRCF 8 ppm LIDAR data
30 cm GSD 4-band (RGBI) digital frame imagery and related softcopy viewer set files, with permission from Western Forest Products Ltd.
2.3 Softcopy System
All polygon delineation, field calibration planning and polygon attribution was completed in a virtual environment using PurVIEW v.1.2.0.54 softcopy software on an ESRI ArcMap 9.3.1 platform.
2.4 Polygon Delineation
Polygon delineation is the process of segregating the land base into uniform polygons in accordance with provincially defined criteria. Polygon delineation is based on observable differences in vegetated or non-vegetated covers using mid-scale aerial photography or digital frame imagery, as the case may be.
VRI polygon delineation is based on the BC Land Cover Classification Scheme (BCLCS), which includes both vegetated and non-vegetated cover classes. Polygons identified by the land classification scheme are further divided into similar vegetated or non-vegetated polygons based on these Provincial criteria, with additional criteria dictating the delineation of treed (≥ 10% crown closure) polygons.
Delineating polygons provides boundaries for similar vegetated or non-vegetated land covers, and provides logical units for the estimation of attributes.
The Ecora plan initially called for a review and revision of the existing inventory polygons. However, it quickly became apparent that those polygons had little spatial agreement with the timber types visible on the 2013 imagery, and so the PRCF was completely re-delineated without regard for the existing inventory polygons.
Polygons were generally delineated at a scale of 1:3500, but larger scales of up to 1:1000 were used to delineate distinct boundaries such as cut block edges.
TRIM double-line water features such as rivers and lakes were incorporated and remained unaltered in accordance with Provincial requirements.
Similarly, RESULTS Forest Cover (not to be confused with the 1991 Forest Cover inventory) polygons were incorporated, but there was some minor boundary alterations based on visual inspection.
Vegetation Resources Inventory - Powell River Community Forest
6
2.5 Field Calibration
Field calibration is a vital component of all VRI projects, and is the basis for accurate and consistent attribute estimation. It provides:
Calibration information for subsequent photo interpretation by the individuals conducting the field work;
Photo interpreters with a knowledge of the different vegetation types and site conditions in the project area;
Correlations between vegetation attributes on the ground and their signatures on mid-scale aerial photography or digital frame imagery; and
Useful data sources for the current inventory and any subsequent inventories.
The 2014 VRI field calibration program for PRCF also provided LIDAR calibration data, which is expanded upon in Section 2.7 below.
The existing inventory within the PRCF includes approximately 90 inventory field calibration data sources completed to the now-obsolete Forest Cover standard. However, the geographic coordinates of these point and strip samples are not included in the inventory and the location of the source document photos capturing that information has been lost to history. Thus, only the extent of the existing inventory polygons with those historic data sources is known.
PRCF VRI field calibration was completed between 25 and 29 July 2014, and included the installation of 15 one-point ground calls and 12 ground observations. The distribution of samples was restricted to road and trail access. The guiding principle for selecting sample locations, within road and trail accessible areas, was to sample a wide variety of treed polygons outside the footprint of areas with historic inventory data sources, and in accordance with the LIDAR calibration sample plan. The sample plan was produced as a geo-referenced PDF map and loaded onto an iPad Mini for use in the field.
The current Provincial VRI field calibration procedures include three sample types:
Three-point-ground call – for stands with high variability
One-point ground call – for stands with low variability
Ground observation – for height and age data and/or ocular species estimation
The 15 ground calls installed in 2014 were one-point ground calls enhanced with three to five additional prism sweeps away from the measure (species, age, height, diameters) plot in order to better explore the variation within the polygon. The measure plot was placed at least 50 m from the nearest opening at a pre-selected distance so as to be placed in a random location, rather than subjectively placed in a more-or-less representative location.
Similarly, ten of the twelve 2014 ground observations were enhanced with multiple additional prism sweeps and a randomly placed count (species, age, height) plot. The two remaining ground calls were completed to the Provincial standard, and only captured height and age data.
Three-point ground calls were not installed in this program as they are labor-intensive and provide less information than an enhanced one-point ground call.
Field data was recorded on VRI field cards, and office reviewed for completeness and accuracy at the conclusion of each field day. Age cores were placed in plastic sleeves and office counted
Vegetation Resources Inventory - Powell River Community Forest
7
with 3.5X magnification. Heights were measured with a Vertex hypsometer calibrated at least once daily. Plot location was captured with the iPad and recorded with a recreational-grade GPS with an expected accuracy of < 5 m, and then office reviewed to ensure accurate transfer. Species composition and basal area was calculated using all prism sweeps within the polygon. Density was calculated for ground calls using the collected diameter data. Density was not calculated for ground observations, as no diameter data was collected. Age correction was completed using Ministry of Forests Research Branch SiteTools v.3.3 software.
2.6 Polygon Attribution
VRI polygon attribution involves assigning descriptions that are either estimates of polygon characteristics or contain other information relating to the polygon.
Polygon attribute descriptions were recorded using Ecora’s EDIT data entry tool. Polygons were inspected at a scale of 1:3500 to 1:5000 to estimate general ecology and land cover attributes, larger scales of ~1:1000 to determine species composition and crown closure, and even larger scales of ~1:500 to measure heights.
2.6.1 Polygon Attributes
The general ecology (not to be confused with BEC or TEM data), land cover component, non-tree vegetation and non-vegetation attribute descriptions were photo-interpreted for all polygons.
The general ecology attributes where described in accordance with the Provincial procedures, but their inclusion in the VRI is perfunctory given that a TEM is available for the PRCF.
2.6.2 Tree Layer Attributes
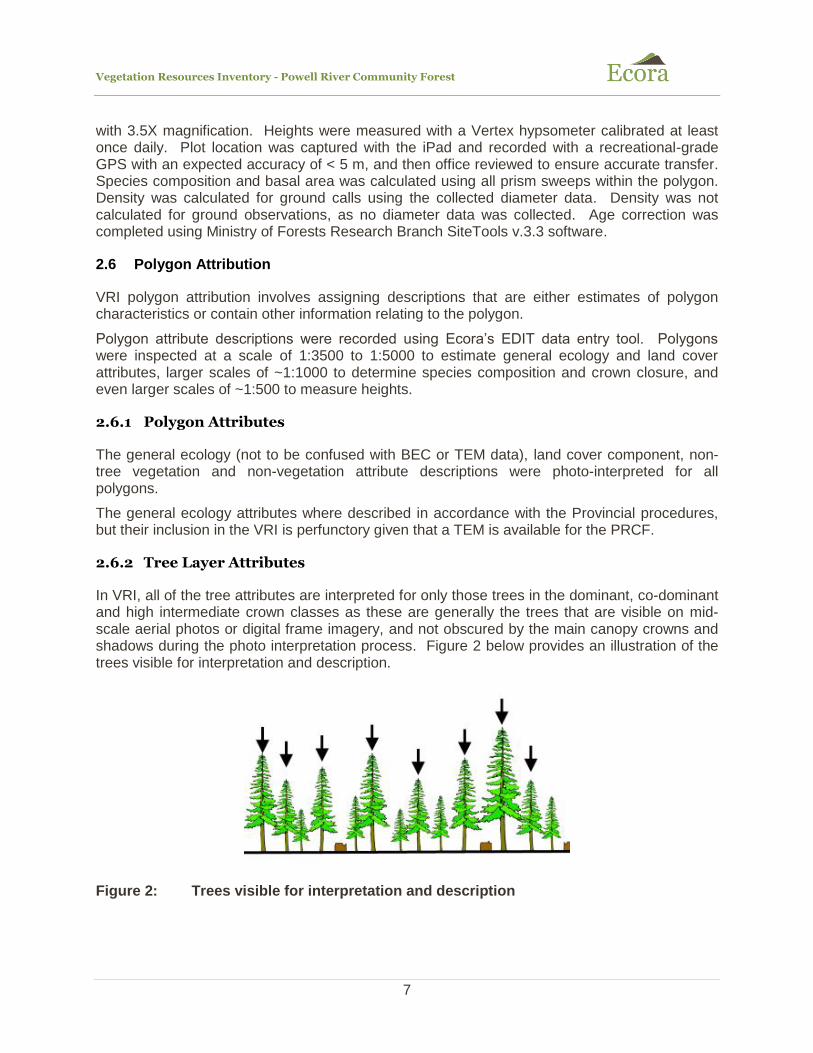
In VRI, all of the tree attributes are interpreted for only those trees in the dominant, co-dominant and high intermediate crown classes as these are generally the trees that are visible on mid-scale aerial photos or digital frame imagery, and not obscured by the main canopy crowns and shadows during the photo interpretation process. Figure 2 below provides an illustration of the trees visible for interpretation and description.
Figure 2: Trees visible for interpretation and description
Vegetation Resources Inventory - Powell River Community Forest
8
Species composition was photo-interpreted where RESULTS, STI or 2014 VRI ground data sources were not available. RESULTS species compositions were accepted when tree species composition could not be photo-interpreted due to the size of the trees.
Age was assigned to polygons with 2014 VRI ground data sources first, and those polygons were then referenced during age assignment to the balance of polygons with trees. For managed stands with RESULTS data, the age assigned was the difference of 2013 (the year of the imagery) and the RESULTS-defined disturbance start year.
Height was assigned in one of four ways using:
2014 VRI ground data sources where that data was available;
LIDAR top-height and mean tree height measurements as a guide;
Photogrammetric heights in polygons with high vertical complexity as LIDAR measurements generally underestimated mean tree height in those polygons; or
For managed stands with RESULTS data, a height derived as a function of age and site index in accordance with the Provincial procedures.
Density was assigned using 2014 VRI ground data sources when available, and the using either LIDAR density measurements as a guide, or photo-interpretation when the LIDAR measurements didn’t reflect the polygon. Density values from RESULTS were assigned when that information was available and appropriate.
Crown closure, basal area, cover pattern and snag density were photo-interpreted for all treed polygons.
RESULTS Opening ID values were assigned where they were available, as not all openings appeared in the RESULTS data sets available from Geo BC.
2.6.3 Data Source Codes
Data source refers to the primary source of information used to describe an attribute or attributes. Data sources provide calibration points to assist in polygon description, but data sources may not be available within each polygon. A photo interpretation process, including comparison with adjacent polygons (with or without data sources of their own), is used to describe polygons without data sources.
The Province currently has 23 data sources codes used to describe the origin of various attribute descriptions. Examples include 0 for photo interpreted, 7 for RESULTS data and 18 for VRI air call data. There are six attributes that require a data source code; general ecology, species composition, height, age, basal area and density.
The attribution for the PRCF followed the Provincial procedures and standards through-out the process, with the following exception around LIDAR data and data source codes.
There are attributes that can be measured (e.g. height, density) or derived (e.g. basal area) from LIDAR data. LIDAR-measured height and density values were incorporated into the VRI where appropriate. However, the Province does not currently have data source codes for LIDAR measured or derived attributes. In the absence of those data source codes, a data source code value of 3 (which is obsolete) was used as a surrogate.
Vegetation Resources Inventory - Powell River Community Forest
9
2.7 LIDAR Integration
Tree height and stand density values were directly calculated from LIDAR data, and integrated for review at the polygon attribution stage. There were three steps to this process.
2.7.1 LIDAR Calibration
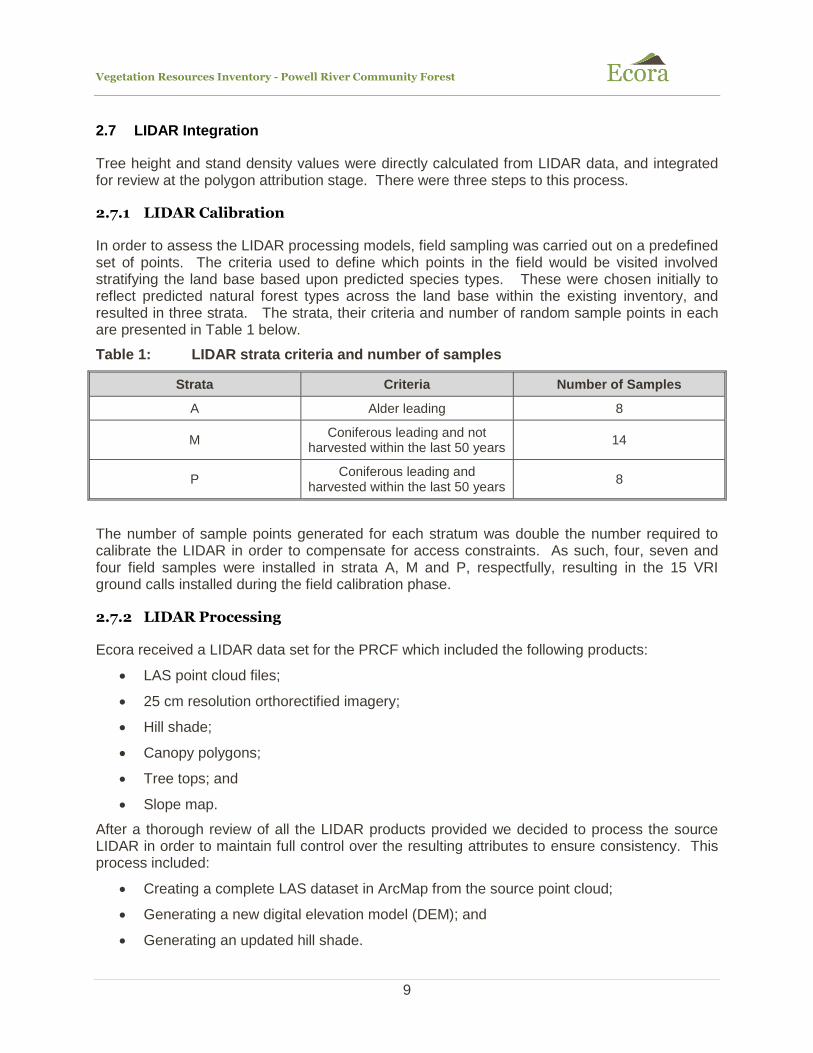
In order to assess the LIDAR processing models, field sampling was carried out on a predefined set of points. The criteria used to define which points in the field would be visited involved stratifying the land base based upon predicted species types. These were chosen initially to reflect predicted natural forest types across the land base within the existing inventory, and resulted in three strata. The strata, their criteria and number of random sample points in each are presented in Table 1 below.
Table 1: LIDAR strata criteria and number of samples
Strata Criteria Number of Samples
A Alder leading 8
M Coniferous leading and not
harvested within the last 50 years 14
P Coniferous leading and
harvested within the last 50 years 8
The number of sample points generated for each stratum was double the number required to calibrate the LIDAR in order to compensate for access constraints. As such, four, seven and four field samples were installed in strata A, M and P, respectfully, resulting in the 15 VRI ground calls installed during the field calibration phase.
2.7.2 LIDAR Processing
Ecora received a LIDAR data set for the PRCF which included the following products:
LAS point cloud files;
25 cm resolution orthorectified imagery;
Hill shade;
Canopy polygons;
Tree tops; and
Slope map.
After a thorough review of all the LIDAR products provided we decided to process the source LIDAR in order to maintain full control over the resulting attributes to ensure consistency. This process included:
Creating a complete LAS dataset in ArcMap from the source point cloud;
Generating a new digital elevation model (DEM); and
Generating an updated hill shade.
Vegetation Resources Inventory - Powell River Community Forest
10
The LAS point cloud data provided was classified into the following four categories:
Processed but unclassified non-ground returns;
Ground returns;
Noise returns; and
Water.
To calculate height two separate grids were created, one of the bare earth terrain model (DEM) and the other a canopy surface model or digital surface model (DSM). The DEM was generated using only the ground returns while the DSM was classified using the first return values representing the tops of the canopy. The resulting DEM was subtracted from the DSM to generate a height grid.
To calculate density we needed to generate a tree canopy point layer where each point represented the top of one tree. The returns were processed and analyzed to see which returns represented the high points where no other branching returns flowed from. Each identified high point was classified as a tree and assigned its associated height. Several iterations of the density process were completed and compared with the collected field sample data to fine tune the density model. Once a virtual tree layer had been built density was calculated based upon a per hectare ratio per inventory polygon. There were many issues in generating this layer such as trying to determine which return was a top tree and which returns represented second layer trees or simple crown features of various trees. Field data and extensive heads up softcopy reviews were conducted to ensure the values calculated were reasonable. Moving forward this process can be used again with a much higher degree of accuracy now that the model has been calibrated to the PRCF land base.
2.7.3 LIDAR Integration
The process of integrating LIDAR data into the new forest inventory involved:
Segregating the current LIDAR data using the new VRI inventory polygons;
Identifying treed polygons within the new VRI while excluding treed polygons within this subset where height and density values were captured through field calibration;
Calculating a top height, mean height, and density value for each treed polygon from the LIDAR data; and
Applying those values to the corresponding new VRI polygon.
2.8 Quality Control
Internal quality control was undertaken through all phases of this project and the final deliverables were subject to a quality control process before final submission. During this project, the following quality control measures were completed:
Polygon delineation was completed as a polyline feature class and then vector cleaned before being converted a polygon feature class;
All polygons less than 0.5 ha were visually inspected and merged into the most similar neighbor polygon where appropriate;
Vegetation Resources Inventory - Powell River Community Forest
11
Field cards were reviewed for accuracy and completeness at the conclusion of each field day;
Plot locations were office reviewed to ensure accurate coordinate transfer;
Polygon attribution was subject to frequent peer reviews;
The spatial vs. attribute polygon data was checked to ensure a 1:1 link of the final polygons;
EDIT attribute databases were converted to VRIMS databases and subjected to the Province’s spatial and attribute validation routines, and then to Ecora’s proprietary spatial and attribute validation routines; and
A final review was conducted of the flat file database for overall completeness.
2.9 Quality Assurance
A third-party quality assurance review was not within the scope of this project. Bruce McClymont, RPF, of Ecora, is one a small of number of VRI certified photo interpreters that regularly undertakes third-party VRI photo interpretation quality assurance audit projects for the Province and was the technical lead on this project. Ecora looks forward to working with the PRCF should they choose to pursue an independent, third-party quality assurance review of the project.
Vegetation Resources Inventory - Powell River Community Forest
12
3.0 FINDINGS
3.1 Polygon Delineation
The current VRI delineation standards specify three minimum polygon sizes: 2.0 ha for areas with distinct boundaries (e.g. new cut blocks), 5.0 ha for areas with indistinct boundaries (e.g. dense timber with a gradual height change, wetlands, treed alpine areas); and 0.5 ha for polygons on the project boundary or map sheet neat line.
The mean polygon size for the existing inventory was 11.1 ha, while the mean polygon size for treed (≥10% crown closure) polygons was 12.0 ha. The PRCF does not have a disproportionality large number of managed stands or alpine areas, and so from experience the mean polygon size should be approximately 10 ha. Additionally, 42 polygons were below the minimum permissible polygon size of 0.5 ha, possibly the result of clipping the existing inventory to the PRCF boundary.
The mean polygon size for the new VRI is 8.2 ha, with an mean polygon size of 8.3 ha for treed polygons. There are six polygons below the minimum permissible polygon size of 0.5 ha, which are the result of edge tying with Woodlot Licenses W0029 and W1671 or segregating merchantable from non-merchantable timber along the PRCF boundary. With the exception of the 2014 VRI for Woodlot Licenses W0029 and W1671, the delineation was not edge tied to the existing inventory beyond the PRCF boundary, as that existing inventory was completed to a now-obsolete standard.
For the PRCF, the 2.0 ha minimum polygon size was waived in order to remove non-productive types from merchantable timber and provide a more operational inventory.
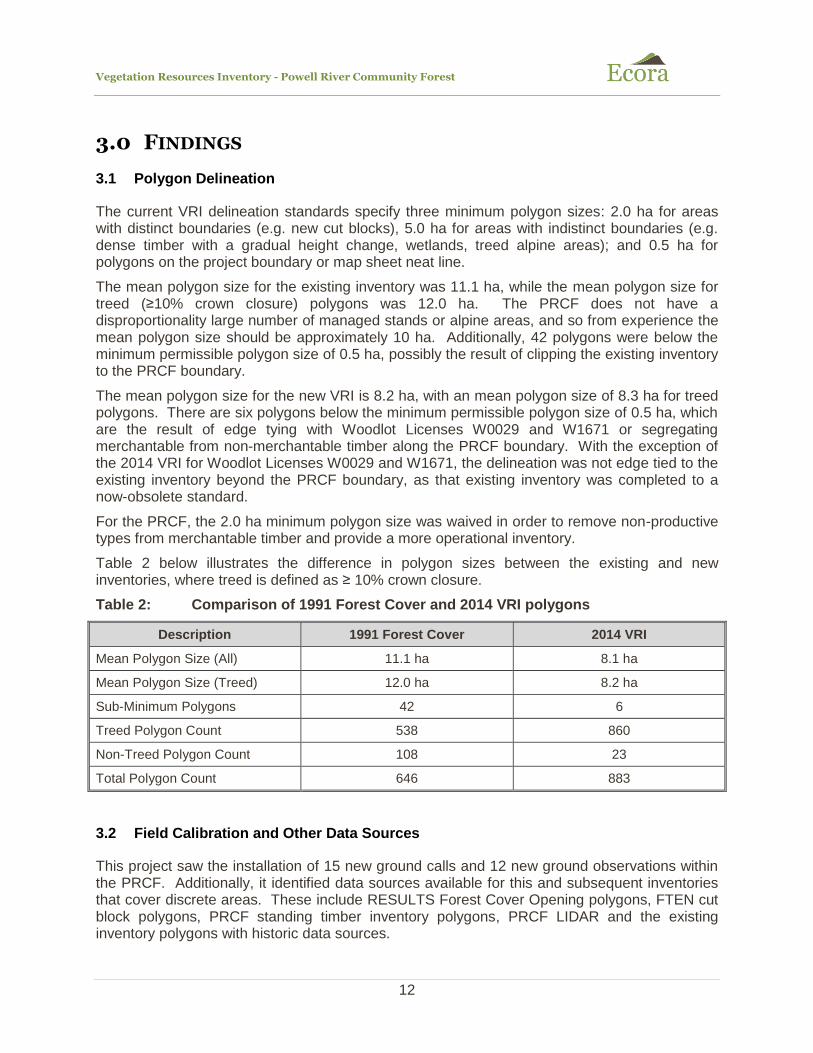
Table 2 below illustrates the difference in polygon sizes between the existing and new inventories, where treed is defined as ≥ 10% crown closure.
Table 2: Comparison of 1991 Forest Cover and 2014 VRI polygons
Description 1991 Forest Cover 2014 VRI
Mean Polygon Size (All) 11.1 ha 8.1 ha
Mean Polygon Size (Treed) 12.0 ha 8.2 ha
Sub-Minimum Polygons 42 6
Treed Polygon Count 538 860
Non-Treed Polygon Count 108 23
Total Polygon Count 646 883
3.2 Field Calibration and Other Data Sources
This project saw the installation of 15 new ground calls and 12 new ground observations within the PRCF. Additionally, it identified data sources available for this and subsequent inventories that cover discrete areas. These include RESULTS Forest Cover Opening polygons, FTEN cut block polygons, PRCF standing timber inventory polygons, PRCF LIDAR and the existing inventory polygons with historic data sources.
Vegetation Resources Inventory - Powell River Community Forest
13
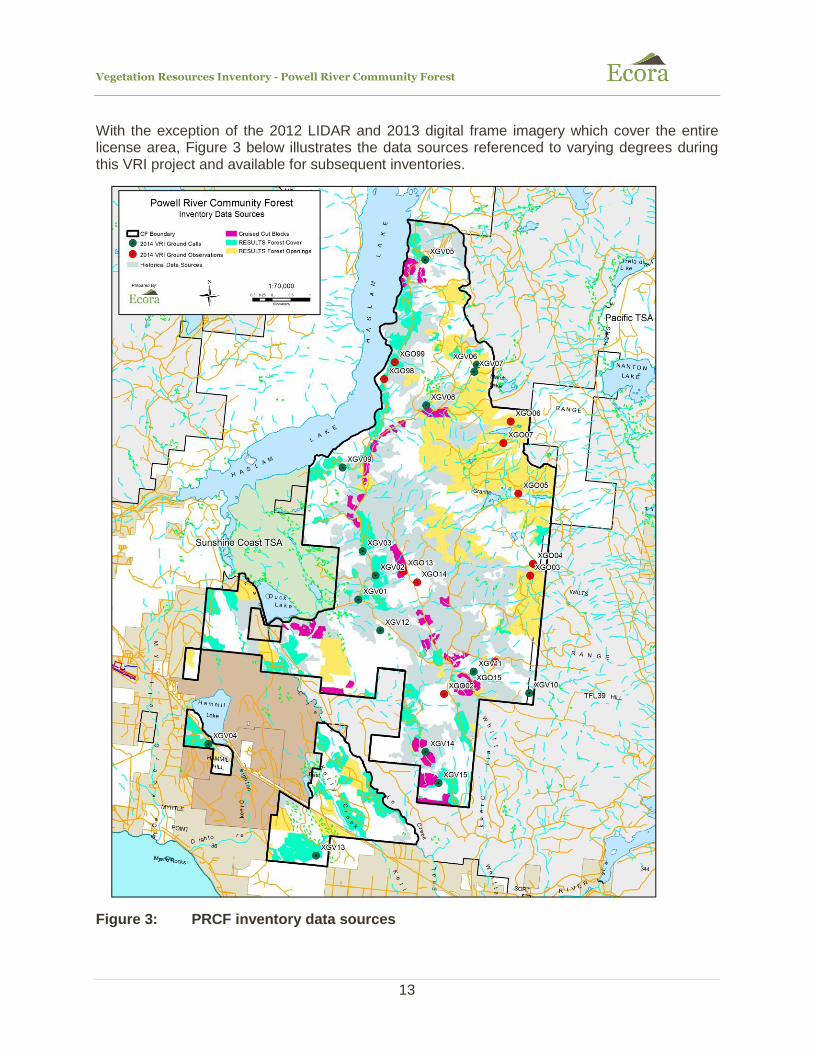
With the exception of the 2012 LIDAR and 2013 digital frame imagery which cover the entire license area, Figure 3 below illustrates the data sources referenced to varying degrees during this VRI project and available for subsequent inventories.
Figure 3: PRCF inventory data sources
Vegetation Resources Inventory - Powell River Community Forest
14
3.3 Polygon Attribution
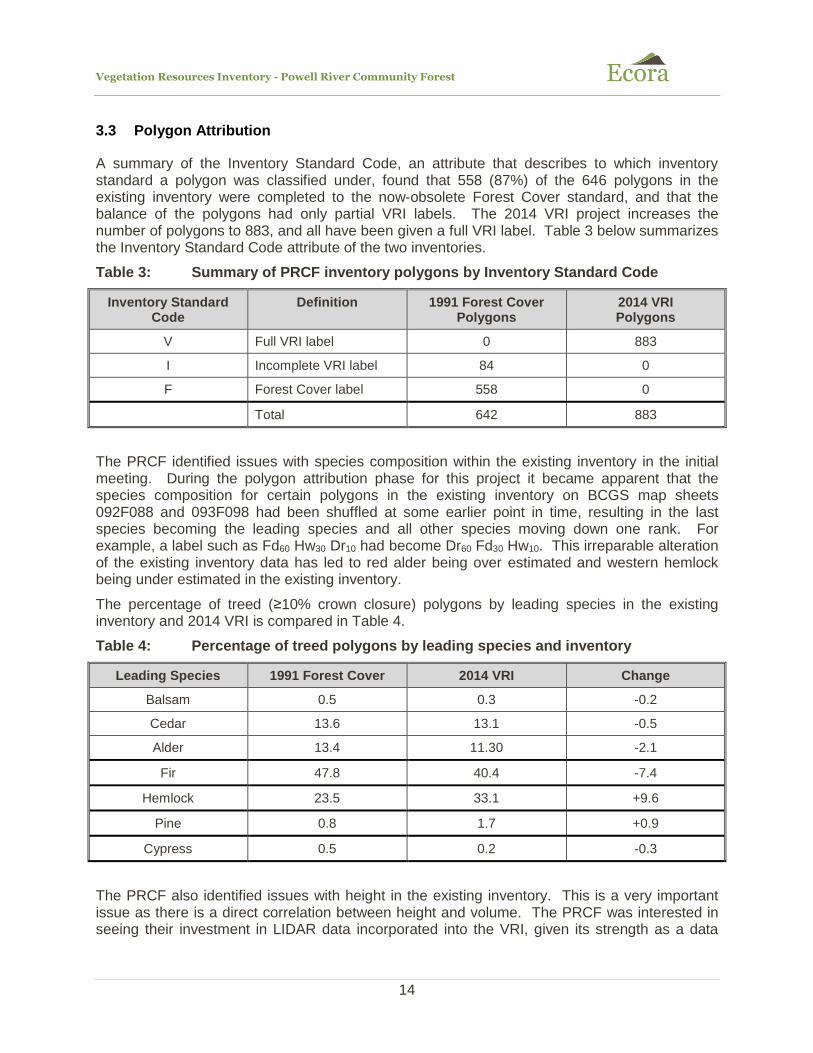
A summary of the Inventory Standard Code, an attribute that describes to which inventory standard a polygon was classified under, found that 558 (87%) of the 646 polygons in the existing inventory were completed to the now-obsolete Forest Cover standard, and that the balance of the polygons had only partial VRI labels. The 2014 VRI project increases the number of polygons to 883, and all have been given a full VRI label. Table 3 below summarizes the Inventory Standard Code attribute of the two inventories.
Table 3: Summary of PRCF inventory polygons by Inventory Standard Code
Inventory Standard Code
Definition 1991 Forest Cover Polygons
2014 VRI Polygons
V Full VRI label 0 883
I Incomplete VRI label 84 0
F Forest Cover label 558 0
Total 642 883
The PRCF identified issues with species composition within the existing inventory in the initial meeting. During the polygon attribution phase for this project it became apparent that the species composition for certain polygons in the existing inventory on BCGS map sheets 092F088 and 093F098 had been shuffled at some earlier point in time, resulting in the last species becoming the leading species and all other species moving down one rank. For example, a label such as Fd60 Hw30 Dr10 had become Dr60 Fd30 Hw10. This irreparable alteration of the existing inventory data has led to red alder being over estimated and western hemlock being under estimated in the existing inventory.
The percentage of treed (≥10% crown closure) polygons by leading species in the existing inventory and 2014 VRI is compared in Table 4.
Table 4: Percentage of treed polygons by leading species and inventory
Leading Species 1991 Forest Cover 2014 VRI Change
Balsam 0.5 0.3 -0.2
Cedar 13.6 13.1 -0.5
Alder 13.4 11.30 -2.1
Fir 47.8 40.4 -7.4
Hemlock 23.5 33.1 +9.6
Pine 0.8 1.7 +0.9
Cypress 0.5 0.2 -0.3
The PRCF also identified issues with height in the existing inventory. This is a very important issue as there is a direct correlation between height and volume. The PRCF was interested in seeing their investment in LIDAR data incorporated into the VRI, given its strength as a data
Vegetation Resources Inventory - Powell River Community Forest
15
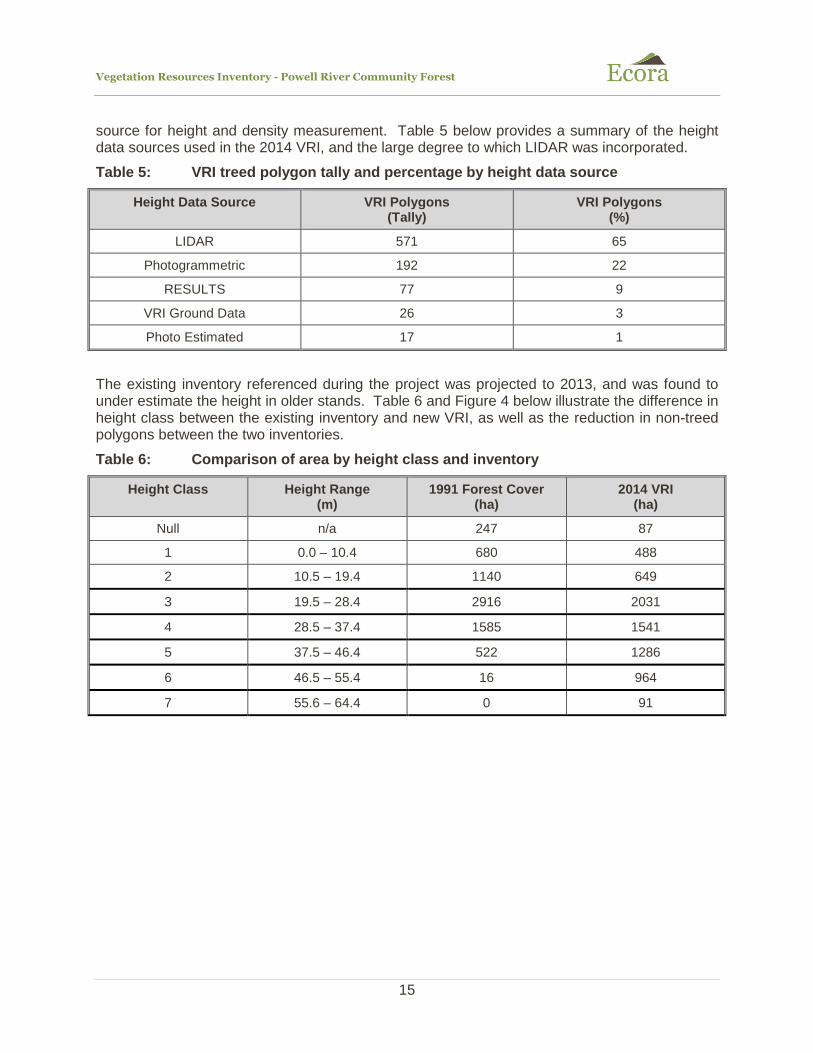
source for height and density measurement. Table 5 below provides a summary of the height data sources used in the 2014 VRI, and the large degree to which LIDAR was incorporated.
Table 5: VRI treed polygon tally and percentage by height data source
Height Data Source VRI Polygons (Tally)
VRI Polygons (%)
LIDAR 571 65
Photogrammetric 192 22
RESULTS 77 9
VRI Ground Data 26 3
Photo Estimated 17 1
The existing inventory referenced during the project was projected to 2013, and was found to under estimate the height in older stands. Table 6 and Figure 4 below illustrate the difference in height class between the existing inventory and new VRI, as well as the reduction in non-treed polygons between the two inventories.
Table 6: Comparison of area by height class and inventory
Height Class Height Range (m)
1991 Forest Cover (ha)
2014 VRI (ha)
Null n/a 247 87
1 0.0 – 10.4 680 488
2 10.5 – 19.4 1140 649
3 19.5 – 28.4 2916 2031
4 28.5 – 37.4 1585 1541
5 37.5 – 46.4 522 1286
6 46.5 – 55.4 16 964
7 55.6 – 64.4 0 91

Vegetation Resources Inventory - Powell River Community Forest
16
Figure 4: Comparison of area by height class and inventory
0
500
1000
1500
2000
2500
3000
3500
0 1 2 3 4 5 6 7
Are
a (h
a)
Height Class
1991 FC
2014 VRI
Vegetation Resources Inventory - Powell River Community Forest
17
4.0 REFERENCES
Ecora Resource Group Ltd. 2014. Powell River Community Forest Integration of LIDAR Data into Vegetation Resource Inventory Project Plan. Resource Inventory Dept., Prince George, BC. 14 pp.
Sandvoss, McClymont and Farnden. 2005. A User’s Guide to the Vegetation Resources Inventory. Tolko Industries Ltd., Williams Lake, BC. 90 pp.
White et al. 2013. A best practices guide for generating forest inventory attributes from airborne laser scanning data using an area-based approach, v2.0. Natural Resources Canada, Canadian Forest Service, Canadian Wood Fibre Centre Information Report FI-X-010. Canadian Wood Fibre Centre, Victoria, BC. 40 pp.