
V. J. Flanigan I/, Hamdy Sadek, Bruce Smith I/ and … · V. J. Flanigan I/, Hamdy Sadek, Bruce...
27
UNITED STATES DEPARTMENT OF THE INTERIOR GEOLOGICAL SURVEY Time-domain electromagnetic tests in the Wadi Bidah district, Kingdom of Saudi Arabia by V. J. Flanigan I/, Hamdy Sadek, Bruce Smith I/ and Charles Tippens I/ Open-File Report Prepared for the Ministry of Petroleum and Mineral Resources Deputy Ministry for Mineral Resources Jiddah, Kingdom of Saudi Arabia This report is preliminary and has not been reviewed for conformity with U.S. Geological Survey editorial standards and stratigraphic nomenclature I/ U.S. Geological Survey, Denver, CO 1983
Transcript of V. J. Flanigan I/, Hamdy Sadek, Bruce Smith I/ and … · V. J. Flanigan I/, Hamdy Sadek, Bruce...

UNITED STATES DEPARTMENT OF THE INTERIOR
GEOLOGICAL SURVEY
Time-domain electromagnetic tests in the Wadi Bidah district,
Kingdom of Saudi Arabia
by
V. J. Flanigan I/, Hamdy Sadek, Bruce Smith I/ and Charles Tippens I/
Open-File Report
Prepared for the Ministry of Petroleum and Mineral ResourcesDeputy Ministry for Mineral Resources
Jiddah, Kingdom of Saudi Arabia
This report is preliminary and has not been reviewed for conformity with U.S. Geological Survey editorial standards and stratigraphic nomenclature
I/ U.S. Geological Survey, Denver, CO
1983
CONTENTS
Page
ABSTRACT................................................ 1
INTRODUCTION. ........................................... 2
ACKNOWLEDGMENTS......................................... 2
TIME-DOMAIN ELECTROMAGNETIC METHOD...................... 2
DISCUSSION OF RESULTS. .................................. 6
Sha'ab at Tare prospect............................. 6Rabathan prospect................................... 15
CONCLUSIONS AND RECOMMENDATIONS......................... 20
DATA STORAGE............................................ 20
REFERENCES CITED........................................ 23
ILLUSTRATIONS
Figure 1. Index map of the western part of the Kingdom of Saudi Arabia showing the location of the Wadi Bidah district....... 3
2. Map of the Wadi Bidah district showing the locations of time-domain electromagnetic test areas at Sha'ab at Tare and Rabathan prospects................................. 7
3. Time-domain electromagnetic (TDEM) loop configurations used at the Sha'ab at Tare prospect............................. 8
4. TDEM profiles showing response of the coincident loop configuration across the Sha'ab at Tare prospect............... 9
5. Apparent-resistivity profiles computed from coincident loop TDEM data showing response across the Sha'ab at Tare prospect........ 10
6. Apparent-resistivity data, fitted least- squares curve, and derived layered-earth model from station 6 of Sha'ab at Tare prospect TDEM profile..................... 12
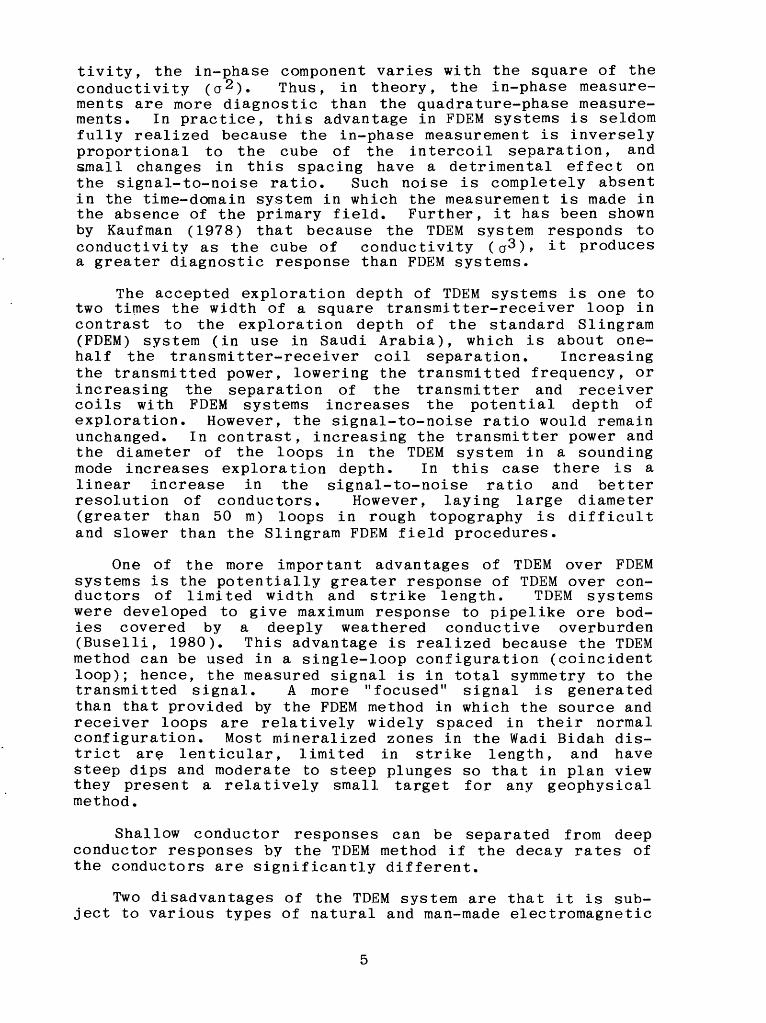
7. TDEM profiles showing response across the Sha'ab at Tare prospect along traverses using 25-m figure-eight loop configurations............................ 13

8. TDEM profiles showing response across the Sha'ab at Tare prospect along traverses using 25-m loops separated by 50 m in a figure-eight loop configuration........... 14
9. Map showing the location of two TDEM pro files and diamond drill holes in the Rabathan prospect area.................... 16
10. TDEM profiles showing response along trav erse 370 N at the Rabathan prospect using 25-m coincident loops..................... 17
11. Apparent-resistivity profiles computed from coincident loop TDEM data along traverse 370 N at the Rabathan prospect............ 18
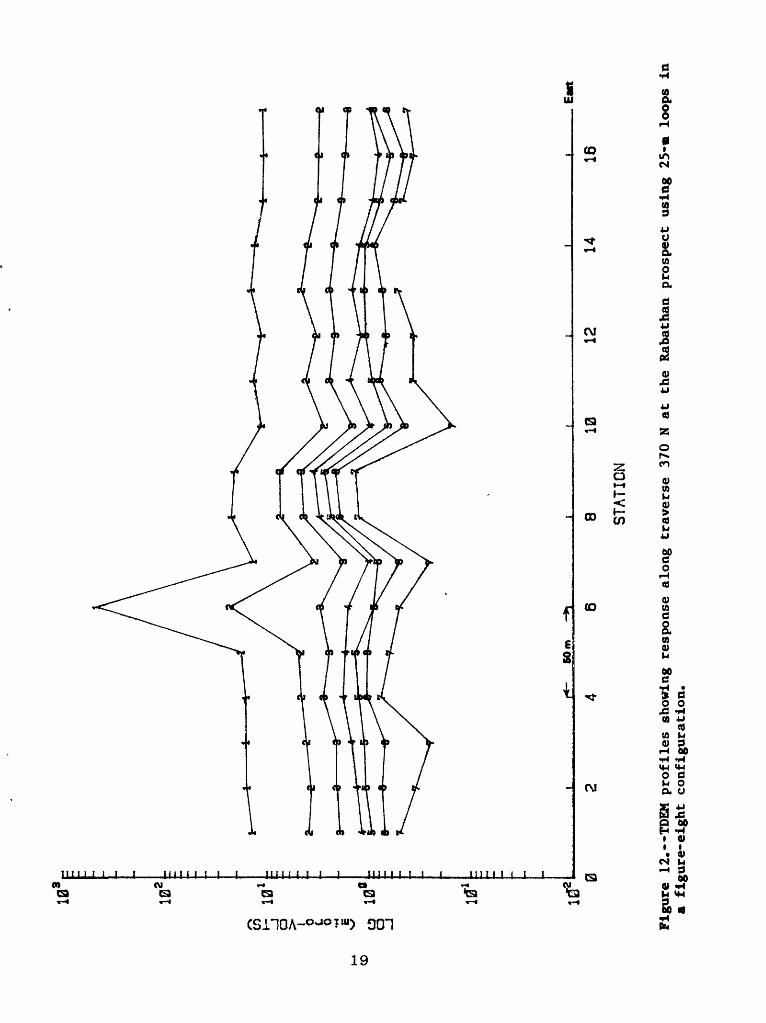
12. TDEM profiles showing response along trav erse 370 N at the Rabathan prospect using 25-m loops in a figure-eight configura tion. ..................................... 19
13. TDEM profiles showing response along trav erse 355 N at the Rabathan prospect using 25-m coincident loops..................... 21
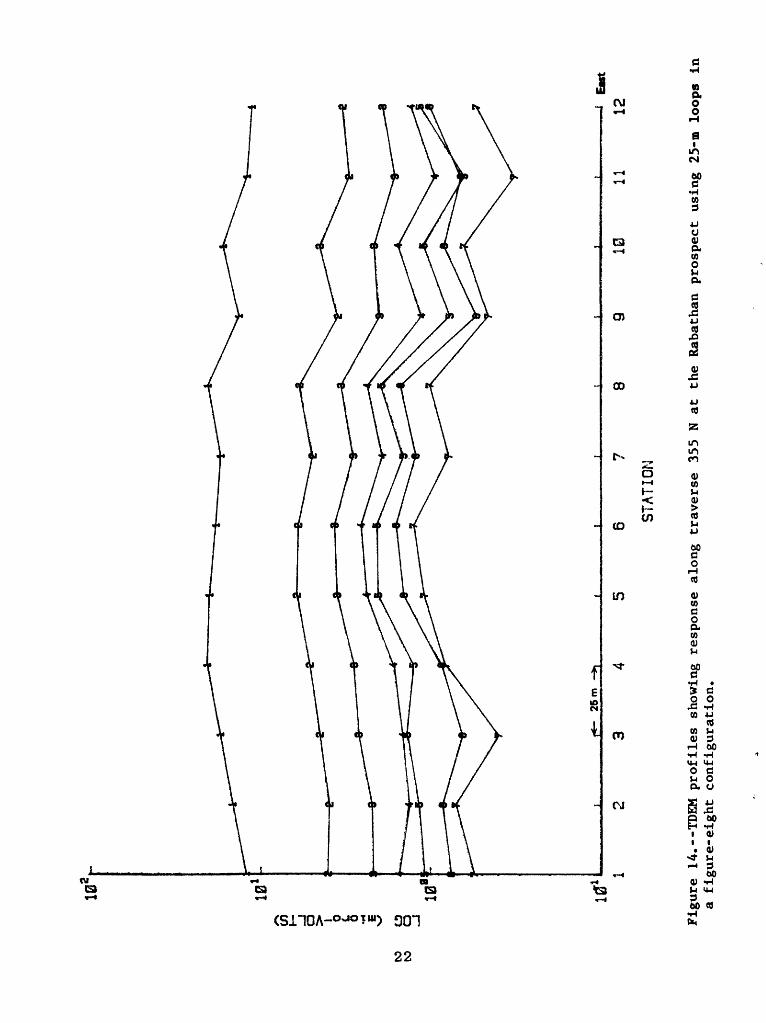
14. TDEM profiles showing response along trav erse 355 N at the Rabathan prospect using 25-m loops in a figure-eight configura tion. ..................................... 22
11

TIME-DOMAIN ELECTROMAGNETIC TESTSIN THE WADI BIDAH DISTRICT,KINGDOM OF SAUDI ARABIA
by
V. J. Flanigan,!/ Hamdy Sadek, Bruce Smithi/ and Charles Tippensi/
ABSTRACT
A time-domain electromagnetic (TDEM) method was tested in two areas of mineralization in Precambrian rocks in the Wadi Bidah district, Kingdom of Saudi Arabia. Transient-decay voltages in profile mode were measured across the Sha'ab at Tare and Rabathan prospects by use of three transmitter- receiver loop configurations. At the Sha'ab at Tare prospect all of the loop configurations indicated the mineralized zone. Analysis of the coincident loop data at Sha'ab at Tare reveals that gossanous and altered rock of 10 ohm-m resistiv ity extends to a depth of 35 m, where there is an unweather- ed, dry mineralized zone of about 1 ohm-m resistivity. The model further suggests that the rocks at a depth of 55 m and below the water table are even less resistive (0.1 ohm-m). The TDEM method successfully discriminated conductors with in from those below the weathered zone at the Rabathan pros pect. Conductors below the weathered zone are identified by a lack of transient response in the early part of the tran sient decay curve, followed by an increasing response in the middle to late parts of the transient decay curve. Results of these limited tests suggest the potential value of inte grating TDEM with other geophysical tools in the Kingdom. Recommendations are made to expand these tests into a more comprehensive program that will evaluate the TDEM potential in various geologic environments that are host to mineral deposits of diverse origin.
i/U.S. Geological Survey, Denver, CO.

INTRODUCTION
A time-domain electromagnetic (TDEM) method was tested by the U.S. Geological Survey (USGS) during 1981-82 in the Wadi Bid- ah district to determine its effectiveness as an identifier of electrical geologic conductors. The Wadi Bidah district was selected as the test site because of the large amount of exploration information available from past studies.
The first geological and geochemical exploration by the USGS in the Wadi Bidah district was by Earhart and Mawad (1970). Mineral exploration by the USGS in the district dur ing 1972-1976 is summarized by Kiilsgaard and others (1978). In 1977, the Wadi Bidah district was included in an extensive airborne electromagnetic (AEM) survey in the Kingdom (Wynn and Blank, 1979). Since 1978, a systematic ground follow-up program of the 1977 AEM survey, including geological, geo chemical, and geophysical investigations has been conducted (Flanigan and others, 198^, 1982).
The Wadi Bidah district is located about 250 km southeast of Jiddah in the rugged Hijaz mountains (fig. 1). Access to the area is by improved highway to a point a few kilometers northwest of the village of Al Bahah and for the remaining distance, approximately 50 km, by unimproved roads.
Metavolcanic rocks in the region are phyllitic quartzite, phyllite, schist, greenstone, meta-andesite, metadacite, and marble (Green and Gonzalez, 1980). The metamorphic grade of the rocks is variable, but generally it is in the green- schist facies. Primary regional structures generally trend north-northwest; secondary transverse structures trend north east to east.
ACKNOWLEDGMENTS
The work on which this report is based was performed in accordance with an agreement between the Saudi Arabian Min istry of Petroleum and Mineral Resources and the U.S. Geo logical Survey (USGS).
TIME-DOMAIN ELECTROMAGNETIC METHOD
The decay of the electromagnetic field from eddy cur rents, which are induced into the earth by a wire loop pulsed by a square wave current source, is measured in the TDEM method. Inasmuch as the induced eddy currents do not cease to flow the instant the inducing current is switched off, their presence is indicated by the gradual decay of transient voltages that are induced in a receiver loop. Hence, the measurement of these transient voltages is a means of detect ing geologic conductors. The higher the conductivity of the conductor, the longer the transient decay voltage persists.
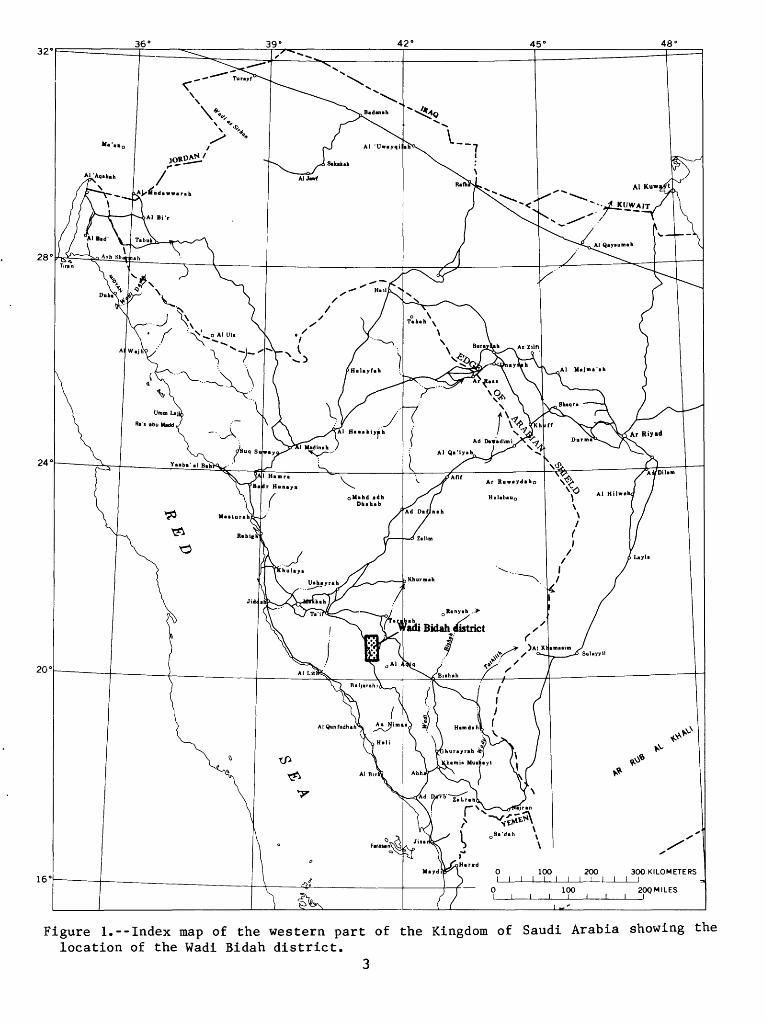
Figure 1.--Index map of the western part of the Kingdom of Saudi Arabia showing the location of the Wadi Bidah district.
3

The transient decay voltage is measured by as many as 32 channels spaced in time between the cutoff of one pulse cycle to the initiation of the next. The system used (SIROTEM) allows for stacking and averaging of as many as 2048 measure ment cycles. Any number of individual stacked measurements may be averaged to determine very accurately the transient voltage decay curve.
A variety of transmitter-receiver loop configurations may be used, the selection of any one depending on tne predicted attitude of the conductor. Characteristics of the inducing EM field are dependent upon the transmitter-receiver loop configuration. Thus, a single wire loop (transmitter and receiver using the same loop) produces a predominantly verti cal EM field, which induces a maximum number of eddy currents into horizontal conductors. Varying the size of the trans mitter loop increases the depth of exploration, and the depth of exploration is usually considered to be about twice the side dimension of a square transmitter loop.
Measurements are made either in a profile mode or in a sounding mode. The purpose of the profile mode is to delin eate the horizontal extent, across strike, of an electrical conductor, whereas the purpose of the sounding mode is to evaluate the thickness and electrical conductivity of layers beneath the sounding loop. The operational methods of the two modes do not have to differ significantly, but usually in the profile mode fewer time channels are used to sample the transient decay voltage at several successive loop setups. In the sounding mode, the full transient decay voltage (with in equipment limits) is measured at a single, generally large loop setup.
In this study three loop configurations were used to determine the optimum response i of near-vertical conductors that are known to exist in the Wadi Bidah district. The data were taken primarily in a profile mode using coincident and figure-eight configurations. In addition, one sounding was selected from one of the profiles for analysis.
The TDEM method has several advantages and disadvantages compared to frequency domain EM (FDEM) methods. The princi pal advantage is that the TDEM method allows measurement of many of the in-phase characteristics of the response of a target in the absence of the primary field. Kaufman (1978) suggested that the most diagnostic electromagnetic- exploration system is the one most sensitive to small changes in conductivity (a); that is, it is the system that has a response proportional to conductivity raised to the highest power (a 11 )- Kaufman (1978) has shown that for low frequen cies in FDEM systems, both the in-phase and quadrature-phase response increase with target conductivity. However, whereas the quadrature-phase component varies linearly with conduc-
tivity, the in-phase component varies with the square of the conductivity (a 2 ). Thus, in theory, the in-phase measure ments are more diagnostic than the quadrature-phase measure ments. In practice, this advantage in FDEM systems is seldom fully realized because the in-phase measurement is inversely proportional to the cube of the intercoil separation, and small changes in this spacing have a detrimental effect on the signal-to-noise ratio. Such noise is completely absent in the time-domain system in which the measurement is made in the absence of the primary field. Further, it has been shown by Kaufman (1978) that because the TDEM system responds to conductivity as the cube of conductivity (a3 ) * it produces a greater diagnostic response than FDEM systems.
The accepted exploration depth of TDEM systems is one to two times the width of a square transmitter-receiver loop in contrast to the exploration depth of the standard Slingram (FDEM) system (in use in Saudi Arabia), which is about one- half the transmitter-receiver coil separation. Increasing the transmitted power, lowering the transmitted frequency, or increasing the separation of the transmitter and receiver coils with FDEM systems increases the potential depth of exploration. However, the signal-to-noise ratio would remain unchanged. In contrast, increasing the transmitter power and the diameter of the loops in the TDEM system in a sounding mode increases exploration depth. In this case there is a linear increase in the signal-to-noise ratio and better resolution of conductors. However, laying large diameter (greater than 50 m) loops in rough topography is difficult and slower than the Slingram FDEM field procedures.
One of the more important advantages of TDEM over FDEM systems is the potentially greater response of TDEM over con ductors of limited width and strike length. TDEM systems were developed to give maximum response to pipelike ore bod ies covered by a deeply weathered conductive overburden (Buselli, 1980). This advantage is realized because the TDEM method can be used in a single-loop configuration (coincident loop); hence, the measured signal is in total symmetry to the transmitted signal. A more "focused" signal is generated than that provided by the FDEM method in which the source and receiver loops are relatively widely spaced in their normal configuration. Most mineralized zones in the Wadi Bidah dis trict are lenticular, limited in strike length, and have steep dips and moderate to steep plunges so that in plan view they present a relatively small target for any geophysical method.
Shallow conductor responses can be separated from deep conductor responses by the TDEM method if the decay rates of the conductors are significantly different.
Two disadvantages of the TDEM system are that it is sub ject to various types of natural and man-made electromagnetic

interferences, and that the use of large diameter loops and high power transmitters do not .'allow the portability that is characteristic of Slingram FDEM system.
DISCUSSION OF RESULTS
Sha'ab at Tare prospect
The Sha'ab at Tare prospect (lat 20°35 I 58" N. , long 41 0 22 f 35 n E.; MODS 00464) is located west of the Wadi Bidah road and about 1 km northwest of an air strip (fig. 2). A mineralized, gossanous chloritic-quartz porphyry grades to the east into a sericitic-quartz-porphyry (Kiilsgaard and others, 1978). Previous geologic mapping, geochemical sam pling, and diamond core drilling indicate that a massive sulfide body, approximimately 400 m long, is at shallow depth. The average width of the mineralized zone, as deter mined by several drill hole intercepts, is 29 m. Massive sulfide mineralization consists of copper (0.40 percent), zinc (1.0 percent) and silver (3.1 grams/short ton). Poten tial tonnage of 4,000,000 short tons of ore reserves has been estimated with the conclusion that the deposit is uneconomic (Earhart and Mawad, 1970; Kiilsgaard and others, 1978), and no additional work was undertaken in the area. Previous geo logical mapping, diamond drilling, and geophysical surveys provide good interpretative control to test the TDEM method.
Three loop configurations were used throughout the survey area: coincident, figure-eight series, and figure-eight ser ies separated by 50 m. Three 25-m square loops v;ere first laid out as shown in figure 3a. With the transmitter and receiver placed at point A, decay voltages in loops 1 and 2 were measured in coincident mode. Then loops 1 and 2 were connected in a figure-eight configuration (figure 3b) and measurements were made. Finally, loops 1 and 3 were connected in a separated figure-eight configuration (figure 3c) and the decay voltages were again measured. The instrument was then moved to point B, loop 1 was moved to the loop 4 position, and the same series of measurements were repeated. One trav erse was made in profile mode along the vertical projection of inclined diamond drill hole S-3 (see fig. 7 in Kiilsgaard and others, 1978).
The results of these measurements are shown as profiles in figures 4, 5, 7, and 8. The numbers on each curve des ignate the time-channel number, the larger numbers denoting a later time. In all figures, the data are plotted at the cen ter of the loop configuration, and, for reference, the loca tion of drillhole S-3 is projected on all profiles. The ver tical projection of the dipping mineralized zone as inter cepted by inclined drill hole S-3 (Kiilsgaard and others, 1978) is also shown. Diamond drilling results suggest that the zone is about 55 m wide and that it dips to the east;
6

41°30'20°40'
20°30' -
20°I5'
20°00 -^ To Al Bahah
Figure 2.--Map of the Wadi Bidah district showing the location of time-domain elec tromagnetic IDEM test areas at Sha'ab at Tare and Rabathan prospects.
7

(a)
(b)
(c)I - L_
Figure 3.--Time-domain electromagnetic (TDEM) loop configurations used at the Sha'ab at Tare prospect. 3a illustrates the loop lay-out procedure, see text for explana tion. 3b is the figure-eight configuration. 3c is the separated figure-eight con figuration.

10 1SJ2
Ver
tical
pro
ject
ion
of m
iner
aliz
ed z
one
DDHS-3
25m
8
STATION
10J
East
1112
Figu
re 4.--TDEM profiles sh
owin
g re
spon
se of the
coin
cide
nt lo
op co
nfig
urat
ion
acro
ss th
e Sha'ab at Tare
prospect.

Ver
tical
pro
ject
ion
of
min
eral
ized
zon
e
pe- 25m
DDHS-3
iEa
st
811
12
STATION
Figure 5.
--Ap
pare
nt-r
esis
tivi
ty pr
ofil
es computed from coincident lo
op IDEM
data sh
owin
g re
spon
se ac
ross
th
e Sha'ab at Ta
re pr
ospe
ct.

thus, the TDEM method defines a conductor that is wider than the true mineralized zone. A slightly asymmetric response seen from stations 4 to 9 confirms the east dip of the con ductor (fig. 4). A set of apparent-resistivity profiles was computed by a method similar to that suggested by Raiche and Spies (1981, fig. 5). Apparent resistivities of almost 100 ohm-m computed from the early time channels (channels 1 and 2) on either end of the profiles suggest the presence of near-surface resistive rock (100 ohm-m), whereas the mineral ized zone is characterized by relatively low apparent resis tivities of nearly 10 ohm-m.
Data from the coincident loop configuration at station 6, which is considered to lie approximately over the center of the ore body, were modelled by use of computer programs developed by Anderson (1982a,b). These programs compute layered-earth model parameters (resistivity and thickness) that generate least-squares curves that fit the observed apparent-resistivity data. The layered-earth assumptions are not strictly valid in this geologic environment because the conductor is dipping and because * t is of small areal extent. However, because the effective loop radius (14.1 m) is less than the projected apparent width of the conductor, and be cause a "focused" EM field is produced in which the resultant response is influenced more by the changes in conductivity directly beneath the loop than by lateral changes, the solu tion may be a valid approximation to the vertical distribu tion of conductivity.
The effective loop radius (A, in meters) is defined as the equivalent circular loop of a square loop of side L (m) and is expressed as A = L/yffT. The observed data and the com puted response of the best nonlinear, least-squares fit are shown in figure 6a. The resultant model (fig. 6b) is gossan and altered rock of 10 ohm-m resistivity from the surface to a depth of about 35 m underlain by a second layer of about 1 ohm-m that extends to about 55 m. Below 55 m, the decrease in resistivity to about 0.1 ohm-m suggests mineralization below the water table.
The average vertical intercept of the mineralized zone in diamond drill hole S-3 is shown to be about 55 ̂ n (Kiilsgaard and others, 1978). The present TDEM data do not indicate the base of the highly conductive sulfide zone because of the small loop diameters. Larger loop diameters may be needed to establish the depth of mineralization, and additional pro files will be necessary to establish the width and strike length of the conductor.
The results of the other two loop configurations (figure- eight and figure-eight separated by 50 m) are shown in fig ures 7 and 8. The responses of these configurations are sim ilar to the coincident-loop responses, except that the ampli-
11

SNA' AB EL TARE FLAYERS
I
u
ifiI I I I I I I i 1
10(a)
TIME (SEE.J
5HA' AB EL TARE 3hLAtER5
Mtt
If0-
If.-I T
If
1 1 1 1 1
1 1 1 1 1
1 ' 1
1 i i
i 1 i 1 i 1 i 1 i 1 i .
i 1 i i i 1 i t i 1 ift»AAA*»»»A«
S 8(b)
LAYER DEPTH (M.)
Figure 6.--Apparent-resistivity data (circles) and fitted least-squares curve (6a), and derived layered-earth model (6b) from station 6 of Sha'ab at Tare prospect IDEM profile.
12
en
h- o o
Ver
tical
pro
ject
ion
of
min
eral
ized
zon
e
I Ea
tt
STAT
ION
Figure 7.--TDEM profiles sh
owin
g re
spon
se ac
ross
the
Sha'
ab at
Tare pr
ospe
ct al
ong
trav
erse
s us
ing
25-m
figure-eight lo
op configuration.

o o 0 CD
O
_J
Ver
tical
pro
ject
ion
of
min
eral
ized
zon
e
45
STATION
DDHS3 1
8-1
Eait
Figu
re 8.--TDEM p
rofi
les
show
ing
response across the
Sha'ab at Ta
re prospect along
trav
erse
s using
25-m lo
ops
sepa
rate
d by
50 m in
a fi
gure
-eig
ht lo
op configuration.
tude of the decay-voltage measurements are higher and the shape of the EM anomaly is broader for the separated figure- eight configuration because this configuration measures a larger volume of the earth.
Rabathan prospect
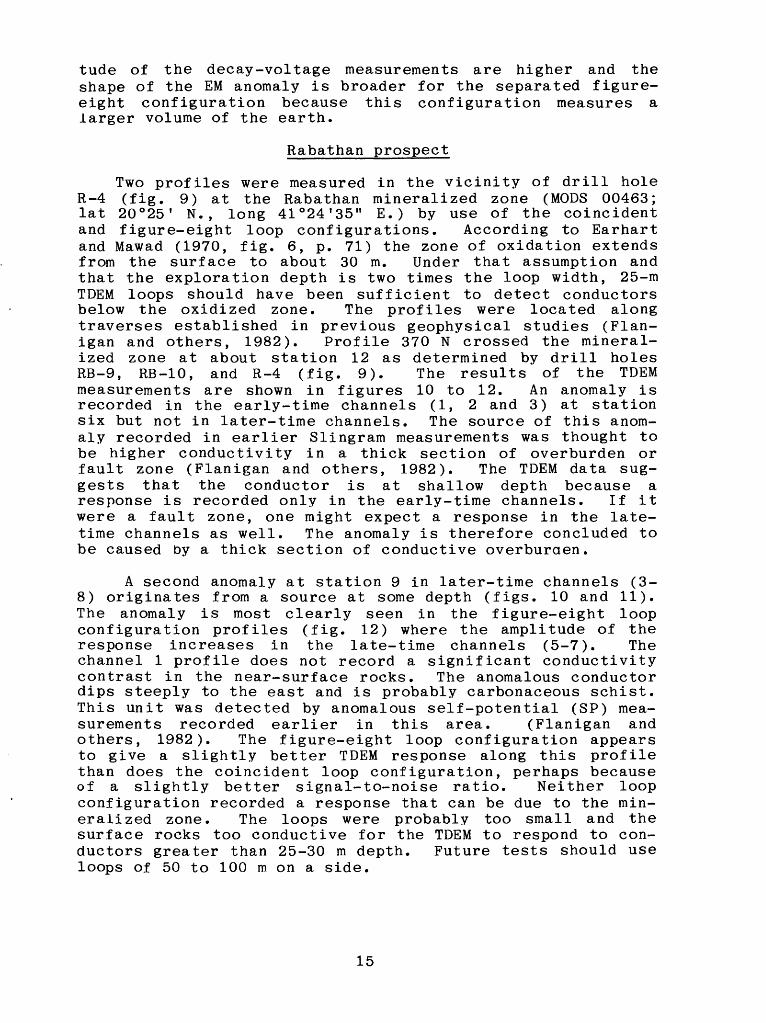
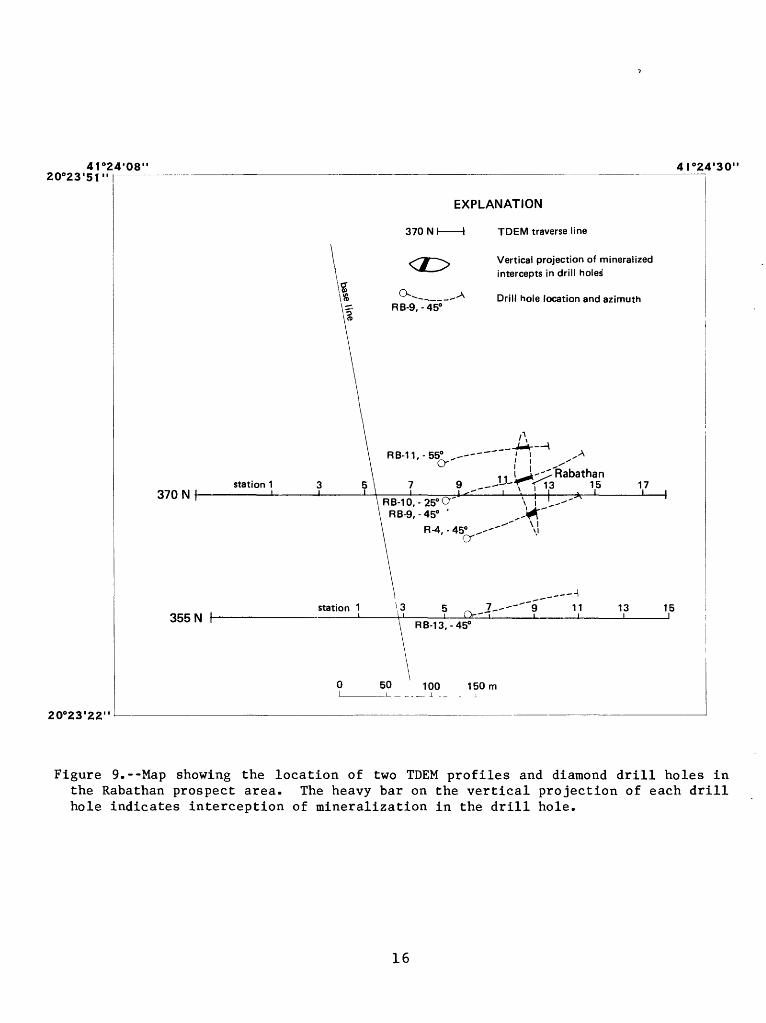
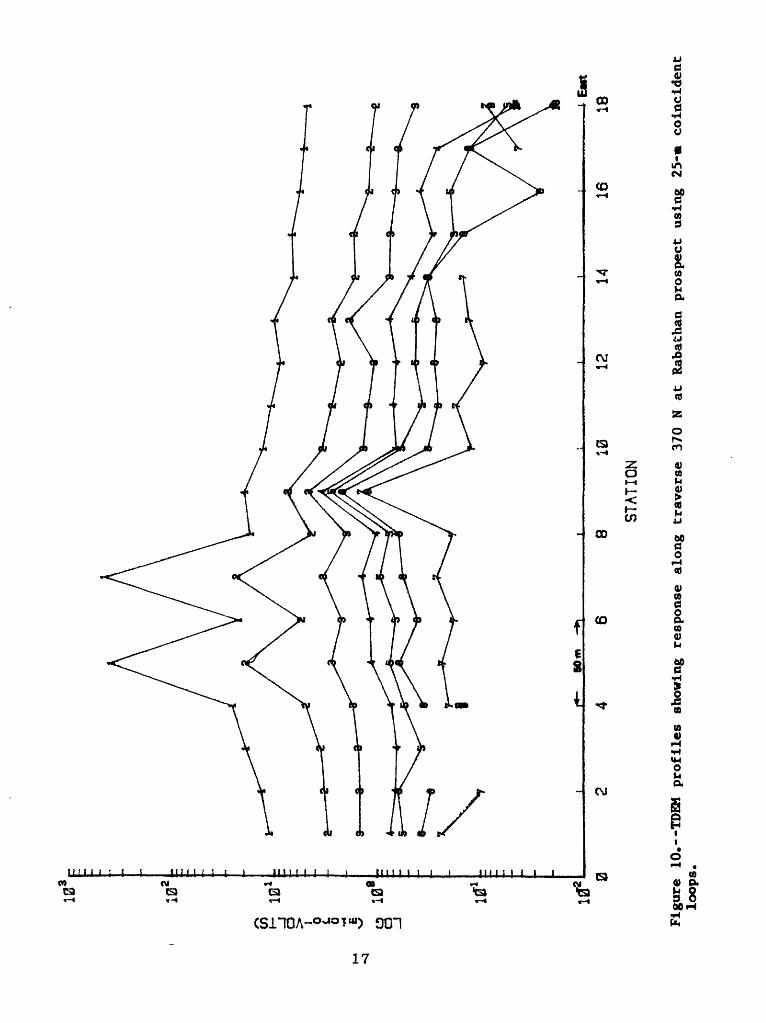
Two profiles were measured in the vicinity of drill hole R-4 (fig. 9) at the Rabathan mineralized zone (MODS 00463; lat 20°25' N., long 41°24 1 35 11 E.) by use of the coincident and figure-eight loop configurations. According to Earhart and Mawad (1970, fig. 6, p. 71) the zone of oxidation extends from the surface to about 30 m. Under that assumption and that the exploration depth is two times the loop width, 25-m TDEM loops should have been sufficient to detect conductors below the oxidized zone. The profiles were located along traverses established in previous geophysical studies (Flan- igan and others, 1982). Profile 370 N crossed the mineral ized zone at about station 12 as determined by drill holes RB-9, RB-10, and R-4 (fig. 9). The results of the TDEM measurements are shown in figures 10 to 12. An anomaly is recorded in the early-time channels (1, 2 and 3) at station six but not in later-time channels. The source of this anom aly recorded in earlier Slingram measurements was thought to be higher conductivity in a thick section of overburden or fault zone (Flanigan and others, 1982). The TDEM data sug gests that the conductor is at shallow depth because a response is recorded only in the early-time channels. If it were a fault zone, one might expect a response in the late- time channels as well. The anomaly is therefore concluded to be caused by a thick section of conductive overburden.
A second anomaly at station 9 in later-time channels (3- 8) originates from a source at some depth (figs. 10 and 11). The anomaly is most clearly seen in the figure-eight loop configuration profiles (fig. 12) where the amplitude of the response increases in the late-time channels (5-7). The channel 1 profile does not record a significant conductivity contrast in the near-surface rocks. The anomalous conductor dips steeply to the east and is probably carbonaceous schist. This unit was detected by anomalous self-potential (SP) mea surements recorded earlier in this area. (Flanigan and others, 1982). The figure-eight loop configuration appears to give a slightly better TDEM response along this profile than does the coincident loop configuration, perhaps because of a slightly better signal-to-noise ratio. Neither loop configuration recorded a response that can be due to the min eralized zone. The loops were probably too small and the surface rocks too conductive for the TDEM to respond to con ductors greater than 25-30 m depth. Future tests should use loops of 50 to 100 m on a side.
15
41°24 i 08' 20°23'5T"
4I°24'30"
20°23'22"
370 Nf-station 1
355 N
EXPLANATION
370 N I I TDEM traverse line
R 8-9,45°
Vertical projection of mineralized intercepts in drill holes'
Drill hole location and azimuth
RB-11,-55° .
9 _. U-l
J!UI I ! i .-Rabathan\ I 13 15 17
RB-10,-25°O"' \ RB-9,-45° '
\ R-4,-45°
\ ' .--
station 1 o RB-13,-45°
11I
13 15_J
Figure 9.--Map showing the location of two TDEM profiles and diamond drill holes in the Rabathan prospect area. The heavy bar on the vertical projection of each drill hole indicates interception of mineralization in the drill hole.
16
IB'
102
h- o 0 0 o
Itf2
50m
EMt
8 10
STATION
1214
1618
Figu
re 10
.--T
DEM
profiles sh
owin
g re
spon
se al
ong
trav
erse
37
0 N
at Ra
bath
an pr
ospe
ct using
25-m coincident
loop
s.
10V
00
CO LU ft:
tz UJ ct: Q.
CL O
10' 10'6dm
8 10
STAT
ION
1214
16East
18
Figure 11
.--A
ppar
ent-
resi
stiv
ity
prof
iles
computed fr
om c
oinc
iden
t loop TDEM dat
a along
traverse 37
0 N a
t th
e Ra
batb
an pr
ospe
ct.
10' 10'
M
CD
CO
j !j
10
o 0 0 o -J
50m
8 STAT
IDiN
1214
16E«t
Figure 12
. I
DEM profiles showing
resp
onse
al
ong
trav
erse
37
0 N
at the
Rabathan prospect us
ing
25-m lo
ops
in
a figure-eight configuration.
A second TDEM profile was made at 355 N as shown in fig ure 9 by use of 25 m coincident and figure-eight loop config urations (fig. 13, 14). This area is south of the minerali zation as determined by diamond arill hole RB-13 (Kiilsgaard and others, 1978). The fact that the coincident loop pro files show a broad anomaly in channels 1 to 3 suggests a zone of conductive, near-surface rocks that lie between stations 5 and 11 (37-212 m east of the base line). This interpretation correlates well with previous FDEM and SP data that suggest carbonaceous schist as the source of the anomalous responses (profile 360 N; Flanigan and others, 1982).
CONCLUSIONS AND RECOMMENDATIONS
The results of these TDEM measurements demonstrate that the method might be used successfully in the search for min eral deposits in Saudi Arabia. At the Sha'ab at Tare pros pect, results of quantitative analysis of the coincident loop data agree with previous diamond drill results. At the Raba- than prospect, the ability to distinguish readily between near-surface conductors, such as overburden, and deep geo logic conductors has been demonstrated. Not demonstrated by these limited tests is the ability of the method to respond to mineralized zones that lie beneath a thick conductive overburden.
Prudent and successful exploration for mineral resources on the Arabian Shield should consider exploration objectives, geologic environment, and method capabilities when selecting geophysical methods for a particular exploration effort. In many cases, particularly in reconnaissance, the geologic environment is not well understood; thus, several methods may be used. The TDEM method is not considered by the authors to be a reconnaissance tool, but it can confirm results from reconnaissance surveys as well as provide data readily amen able to quantitative analysis. In geologic environments in which conductive overburden is a problem, the TDEM may pro duce positive results when other electrical methods fail.
Further tests of the TDEM method are recommended in other areas of the Kingdom in which the geologic environment and mineral deposits are different, or in areas in which FDEM methods have failed to produce positive results. In partic ular, at the Kutam prospect in the southern part of the King dom, Turam EM measurements failed to detect the mineralized zone (Blank and others, 1979).
DATA STORAGE
Mineral localities referred to in this report are record ed in the Mineral Occurrence Documentation System (MODS) and identified by a unique 5-digit locality number. Inquiries regarding the MODS data bank may be made through the Office
20

10 10'
CO10
' 050m
6 STATION
810
EMt
12
Figure
13.--TDEM profiles showing response along traverse
355
N at
the
Rabathan prospect using
25-
coincident lo
ops.
East
Figure 14.--IDEM
profiles sh
owing
resp
onse
along
trav
erse
355
N at the
Rabathan pr
ospe
ct using
25-m
lo
ops
in
a fi
gure
-eig
ht configuration.

of the Technical Advisor, Saudi Arabian Deputy Ministry for Mineral resources, Jiddah.
No base data files were established as a result of this study.
REFERENCES CITED
Anderson, W. L., 1982a, Non-linear least-squares inversion of transient soundings for a coincident loop system (Program NLSTCO): U.S. Geological Survey Open-File Report 82- 1182, 30 p.
________ 1982b, Adaptive non-linear least-squares solutionfor constrained or unconstrained mineralization problems (subprogram NLSOL): U.S. Geological Survey Open-File Report 82-68, 35 p.
Blank, H. R. , Flanigan, V. J. , Gettings, M. E. , and Merghe- lani, H. M. , 1979, Geophysical investigations of the Kutam ancient mine and vicinity, Kingdom of Saudi Arabia: U.S. Geological Survey Saudi Arabian Project Report 278, 48 p.; also, U.S. Geological Survey Open-File Report 80- 1268.
Buselli, G., 1980, The application of Sirotem in weathered terrain: Bulletin-Australian Society of Exploration Geophysicists, v. 11, p. 99-109.
Earhart, R. L. , and Mawad, M. M. , 1970, Geology and mineral evaluation of the Wadi Bidah district, Southern Hijaz quadrangle, Kingdom of Saudi Arabia: U.S. Geological Survey 6pen-File Report' (IE)SA^L19.
Flanigan, V. J., Wynn, J. C., Worl, R. G., and Smith, C. W., 198&, Preliminary report on geophysics ground follow-up of the 1977 airborne survey in the Wadi Bidah district, Kingdom of Saudi Arabia: U.S. Geological SurveyOpen^il Report 82-2 02, G30SA4348. '
Flanigan, V. J., Sadek, Hamdy, and Smith, C. W., 1982, Phase 3 geophysical studies in the Wadi Bidah district, Kingdom of Saudi Arabia: Saudi Arabian Deputy Ministry for Mineral Resources Open-File Report USGS-OF-02-45, 44 p.
Greene, R. C., and Gonzalez, L., 1980, Reconnaissance geology of the Wadi Shuqub quadrangle, sheet 20/41 A, Kingdom of Saudi Arabia: Saudi Arabian Directorate General of Mineral Resources Geologic Map GM-54, 15 p., scale 1:100,000.
23

Kaufman, A. A., 1978, Resolving capabilities of the inductive methods of electroprospecting: Geophysics, v. 43, p. 1392-1398.
Kiilsgaard, T. H. , Greenwood, W. R. , Puffett, W. P., Naqvi, Mohammad, Roberts, R. J., Worl, R. G., Merghelani, Habib, Flanigan, V. J., and Gazzaz, A. R., 1978, Mineral explo ration in the Wadi Bidah district, 1971-1976, Kingdom of Saudi Arabia: U.S. Geological Survey Open-File Report 78-771, (IE)SA-237.
Raiche, A. P., and Spies, B. R., 1981, Coincident loop tran sient electromagnetic master curves for interpretation of two-layer earths: Geophysics, v. 46, no. 1, p. 53-64.
Wynn, J. C., and Blank, H. R., 1979, A preliminary assessment of the 1977 INPUT survey on the Arabian Shield, Kingdom of Saudi Arabia, with guides for interpretation and ground follow-up: U.S. Geological Survey Open-File Report 79-1508, (TR)SA-268.
24


![Operations Research [Hamdy Taha].pdf](https://static.fdocuments.in/doc/165x107/577c781b1a28abe0548ec00b/operations-research-hamdy-tahapdf.jpg)


