
v - iea.org · t r s v v &dqdgldq &rdo &rqvxpswlrq ... ó x ô ì í x î í r
14
Canada Leader: Ann Marie Hann, Coal Association of Canada (Canada) Contributor: Kevin Stone, Natural Resources Canada (Canada) Canada is a mid-sized coal-producing country, ranked 12 th in the world (2014). The annual production is a 50-50% split between coking and thermal coal. Canada is the world’s third largest seaborne coking coal suppliers and is a net exporter of energy. The indigenous production of oil, of gas and of coal exceeds the consumption within the country. Exports of oil, gas and coal play an important role for the Canadian economy. Figure 1: Map of Coal Mines, Ports and Infrastructure Canadian coal mines, ports and rail infrastructure Source: Natural Resources Canada 1. Structure of the energy supply by energy sources The primary energy demand of the country, which accounted for 476 Mtce in 2014, was covered by energy sources as follows: 3 Oil: 31% Natural gas: 28% Coal: 6% Nuclear energy: 7%
-
Upload
nguyenkiet -
Category
Documents
-
view
214 -
download
0
Transcript of v - iea.org · t r s v v &dqdgldq &rdo &rqvxpswlrq ... ó x ô ì í x î í r

Canada Leader: Ann Marie Hann, Coal Association of Canada (Canada) Contributor: Kevin Stone, Natural Resources Canada (Canada) Canada is a mid-sized coal-producing country, ranked 12th in the world (2014). The annual production is a 50-50% split between coking and thermal coal. Canada is the world’s third largest seaborne coking coal suppliers and is a net exporter of energy. The indigenous production of oil, of gas and of coal exceeds the consumption within the country. Exports of oil, gas and coal play an important role for the Canadian economy. Figure 1: Map of Coal Mines, Ports and Infrastructure Canadian coal mines, ports and rail infrastructure
Source: Natural Resources Canada 1. Structure of the energy supply by energy sources The primary energy demand of the country, which accounted for 476 Mtce in 2014, was covered by energy sources as follows:3 Oil: 31% Natural gas: 28% Coal: 6% Nuclear energy: 7%

Hydro power: 26% Other renewables: 2% Thanks to the huge hydropower potential, the major part of electricity is produced in hydro power plants. The electricity generation on the basis of hydropower was 378.8 TWh in 2014. The share of hydropower in the total power generation (627.7 TWh) accounted for 60.3% in 2014. Coal has a share of only 10% in electricity generation (thereof 13.8% from hard coal 70.8% from sub-bituminous coal and 15.4% lignite). The remaining fraction of electricity was provided by nuclear energy, natural gas and non-hydro renewable energies. 2. Coal supply in 2014 Hard coal production totaled 35 Mt in 2014. Of which, 34 Mt was mined in surface pits and 1 Mt from underground operations. The majority of Canada´s hard coal production was exported in 2014. Canada produced 34 Mt of brown coal in 2014 – 25 Mt of subbituminous coal and 9 Mt of lignite. All of the brown coal was produced from surface operations. Almost all of the extracted brown coal is consumed locally for electricity generation. Figure 2: Development of Coal Production through 2014
Sources: Natural Resources Canada, Statistics Canada 3. Coal exports in 2014 Canada is the world’s third largest coking coal exporter after Australia and the United States. Coal exports contribute significantly to the country´s economy. In 2014, Canada exported 34.5 Mt of hard coal.
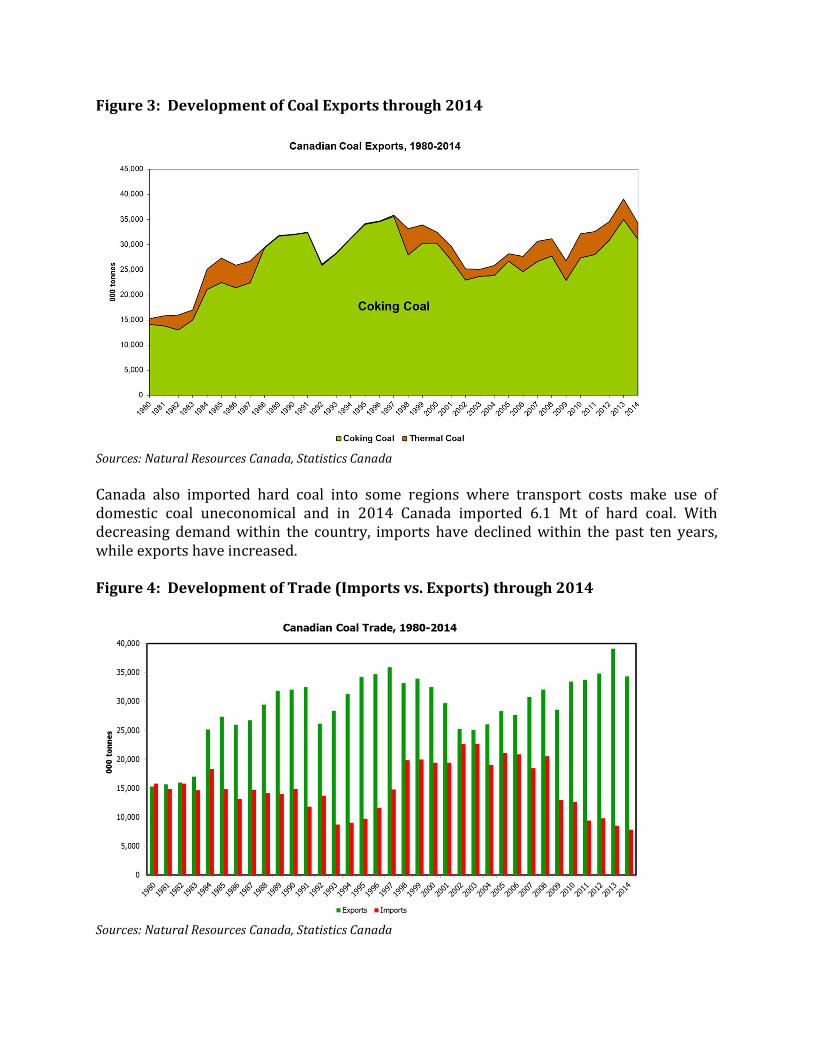
Figure 3: Development of Coal Exports through 2014
Sources: Natural Resources Canada, Statistics Canada Canada also imported hard coal into some regions where transport costs make use of domestic coal uneconomical and in 2014 Canada imported 6.1 Mt of hard coal. With decreasing demand within the country, imports have declined within the past ten years, while exports have increased. Figure 4: Development of Trade (Imports vs. Exports) through 2014
Sources: Natural Resources Canada, Statistics Canada

4. Role of coal in the energy supply market Coal is mainly used in electricity generation in Canada. Electricity generation accounts for about 85.3% of coal consumption while 7.2% goes to coke manufacturing and 7.6% is used by various industries and non-energy use. Figure 5: Development of Coal Consumption through 2014
Source: Natural Resources Canada, Statistics Canada Coal-fired generation contributes about 10% of Canada’s total electricity generation. Figure 6: Power Generation by Source in 2014
0
10,000
20,000
30,000
40,000
50,000
60,000
70,000
000 to
nnes
Canadian Coal Consumption, 1980-2014
Annual Coal Consumption Coal-fired Generation Consumption
Hydro60%
Nuclear16% Coal
10%
Natural Gas8% Wood and Spent
Liquor2%
Wind, Solar and Tidal2%
Heavy, Light and Diesel Oil
1%Others1%
Canadian Electric Power Generation by Sources, 2014

Source: Natural Resources Canada, Statistics Canada Over the years, progress of environmental policies and actions resulted in reducing use of coal in coal-fired generation and the share of electricity generated by coal was also declining. As of 2014, all coal-fired generation units had been phased-out under the provincial legislation. Figure 7: Declining Share of Coal in Electricity Generation through 2014
Source: Natural Resources Canada, Statistics Canada Table 1: Canadian coal-fired power plants, 2015, > 500 MW installed capacity
15.5%14.7%
15.7%14.7%
12.8% 13.2%11.8%
10.2% 10.3% 9.8%
0%2%4%6%8%
10%12%14%16%18%
2005 2006 2007 2008 2009 2010 2011 2012 2013 2014
perce
ntage
Coal Share in Canada's Electricity Generation, 2005-2014
Facility Province Capacity (MW) Units, On-stream Sundance Alberta 2 126 6 units: 1970-1980, Uprates on units 3, 4, 5 and 6 in 2012, 2007, 2009, 2001 Genesee Alberta 1 266 3 units: 1989, 1994, 2005 Keephills Alberta 1 253 3 units: 1983, 1983, 2011 Boundary Dam Saskatchewan 700 unit 1: 1959 (shut down permanently in 2013); unit 2: 1960 (shut down permanently in 2014); unit 3: 1969 (rebuilt in 2013 with CCS); unit 4: 1970; unit 5: 1973; unit 6: 1978 Sheerness Alberta 780 2 units: 1986 and 1990

Sources: Natural Resources Canada It is expected that the power generation sector’s share of total coal consumption will continue to decline in the future. Federal greenhouse gas regulations for coal-fired electricity generation will require each coal-fired unit that reaches 50 years of age to be shut down, retrofitted with CCS or converted to a different fuel. By 2030 more than half of Canada´s coal fired generation units will have reached the end of their useful life. 5. Coal transportation Canadian coal is cost-competitive in terms of coal mining, processing, royalties and taxes, but has to deal with high transportation cost, due to the long-haul distance from mine sites to ports. All of Canada’s export coal mines are located in B.C. and Alberta. The average distance is 1,100 km from coal mine to export ports and terminals in B.C. on the West Coast Transportation of coal by rail to the West Coast ports is an essential element of Canadian coal production. Coal is the number one dry bulk commodity transported by rails. In 2014, around 40 Mt were hauled by two rail operators, Canadian National (CN) and Canadian Pacific (CP). Rail service continues to be a challenge for coal shippers in Canada, as many commodities use the same routes. Canadian ports handled some 50 Mt of coal in 2014. Port Metro Vancouver has two terminals: Westshore Terminals, the largest coal export terminals in North America, and the Neptune Terminals. The Ridley Terminals is located at Prince Rupert in northern B.C. There is a coal terminal located in the Port of Thunder Bay in Ontario (Great Lakes) and the international Coal Pier is located at Sydney, Nova Scotia (Atlantic Ocean). Table 2: Canadian major coal terminals capacity and forecast Terminals 2011 2012 2013 2014 2015 2020
(throughput Mt/y) Westshore 29 33 33 33 36 36 Neptune 8 8 8 12.5 18.5 18.5 Ridley 12 12 12 12 25 25 TOTAL 49 53 53 57.5 79.5 79.5
Source: Natural Resources Canada By early 2013, Westshore, Neptune and Ridley Terminals on Canada’s west coast had seen over CAD 1 billion invested in improvements to the efficiency and capacity of their terminals.
Battle River Alberta 689 units 1 and 2: 1956 (decommissioned in 2000), unit 3, 4, 5: 1969, 1975, 1981 Poplar River Saskatchewan 630 unit 1 and 2: 1981, 1983 Lingan Nova Scotia 620 4 units: 1979-1984

This includes the addition of around 30 Mt in coal handling capacity in the next few years. A direct transfer coal facility was planned at Fraser Surrey Docks (FSD), at Port Metro Vancouver, to handle around 4 Mt per year of coal from the United States. The company proposed to take the coal down the Fraser River to Texada Island for storage purposes before it gets exported, so that no coal would be stored at FSD. The approval has been challenged by environmental groups in Canada’s Federal Court. The government of Canada, provincial governments, major ports and railways are working together on the Asia Pacific Gateway and Corridor Initiative (APGCI). The initiative aims to deliver investment for a strong transportation corridor, facilitating various commodities being delivered to global markets from Canada to the Asia Pacific. The government of Canada has invested over CAD 1.4 billion in strategic infrastructure projects. Provinces and major ports, airports and railways have also invested significantly into B.C. Lower Mainland and Prince Rupert ports, road and rail connections across Western Canada and North America, as well as major airports and border crossings. 6. Industry structure In 2014, Canada had 19 large operating coal mines. Of which, 17 were open pit and two underground mines. There were ten mines in B.C.: Brule, Coal Mountain, Elkview, Fording River, Greenhills, Line Creek, Quinsam, Trend, Perry Creek (Wolverine), and Willow Creek, seven coal mines in Alberta: Cardinal River, Coal Valley, Genesee, Grande Cache, Highvale, Paintearth, and Sheerness, and two in Saskatchewan: Estevan(Bienfait and Boundry Dam) and Poplar River. Table 3: Coal mines in Canada, 2014
Mine name Owner Operator Capacity (Mt/y)
Capacity (Mt/y) Product Location Mine Plant
Coking Fording River Teck Resources Ltd.
Teck Resources Ltd. 8.5 9.5 Coking Elkford, B.C.
Elkview Teck Resources Ltd. Teck Resources Ltd.
7.0 7.0 Coking Sparwood, B.C.
Greenhills Teck Resources Ltd. Teck Resources Ltd.
5.2 5.2 Coking Elkford, B.C.

Coal Mountain Teck Resources Ltd. Teck Resources Ltd.
2.7 3.5 Coking Sparwood, B.C.
Line Creek Teck Resources Ltd. Teck Resources Ltd.
3.5 3.5 Coking Sparwood, B.C.
Cardinal River Teck Resources Ltd. Teck Resources Ltd.
2.0 3.0 Coking Hinton, Alta.
Perry Creek (Wolverine)
Walter Energy, Inc. Walter Energy, Inc. 2.0 3.5 Coking Tumbler Ridge, B.C.
Brule Walter Energy, Inc. Walter Energy, Inc. 1.8 2.5 Pulverized Coal Injection (PCI) Chetwynd. B.C.
Willow Creek Walter Energy, Inc. Walter Energy, Inc. 1.3 Coking, PCI Chetwynd. B.C. Grand Cache Winsway Coking Coal Holdings Ltd. and Marubeni Corp.
Grande Cache Coal Corp. 2.5 2.5 Coking Grande Cache, Alta.
Trend Anglo American plc Peace River Coal Inc. 1.8 2.0 Coking Tumbler Ridge, B.C. Thermal Coal Valley Westmoreland Coal Co. Westmoreland Coal Co. 4.0 4.0 Bituminous thermal Edson, Alta. Quinsam Vitol Group Hillsborough Resources Ltd.
0.5 0.5 Bituminous thermal Campbell River, B.C.
Paintearth Westmoreland Coal Co. Westmoreland Coal Co. 3.0 n.a. Subbituminous Forestburg, Alta. Sheerness Westmoreland Coal Co. Westmoreland Coal Co. 3.7 n.a. Subbituminous Hanna, Alta.

Genesee Westmoreland Coal Co. (50%) and Capital Power Corp. (50%)
Westmoreland Coal Co. 5.6 n.a. Subbituminous Warburg, Alta.
Highvale TransAlta Corp. TransAlta 13.0 n.a. Subbituminous Seba Beach, Alta. Estevan Westmoreland Coal Co. Westmoreland Coal Co. 6.4 n.a. Lignite Estevan, Sask. Poplar River Westmoreland Coal Co. Westmoreland Coal Co. 3.3 n.a. Lignite Coronach, Sask.
Note: Only large mines with an annual production over 100 000 t, are listed. Source: Natural Resources Canada Seven publicly traded companies own or jointly-own eighteen mines, while one private entity owns and operates one mine. There are no government-owned or operated coal mines in Canada; all are owned and operated by the private sector. Four companies produce coking coal or PCI coal for export: Teck Resources Ltd. (Teck); Walter Energy, Inc.’s (Walter Energy) Canadian Operations; Winsway Coking Coal Holdings Ltd. (Winsway) and Marubeni Corp. (Marubeni) jointly owned Grande Cache Coal Corp. (GCC); and Anglo American Plc’s Peace River Coal Inc. Two companies produce bituminous thermal coal for export: Westmoreland Coal Company (Westmoreland) and Vitol Group’s Hillsborough Resources Ltd. Westmoreland produces brown coal for domestic coal-fired power generation. TransAlta Corp. (TransAlta) produces subbituminous coal for its own power plants. Amid falling international coal prices and the need for cost reductions across the sector, the Canadian coal industry has witnessed the closure of less profitable mines, a reduction in the workforce, as well as changes and delays in investment in new mines and infrastructure. Major U.S. met coal producer, Walter Energy, idled Canada’s major Wolverine and Brule mine in 2014, and suspended operations at Willow Creek mine in 2013, pending price recovery. Anglo American suspended operations at the Trend mine in 2014. By spring 2015, there are no coal mines in operations in the Peace River Coalfield. At the same time, several mine projects were deferred due to the low international coal prices. This includes the planned restart of Teck’s Quintette coal mine, which would produce 3-4 Mt per year of coking coal for export. Despite restructuring and consolidation, several export mine investments made in the high-price period are expected to come online in the medium term.

Coalspur’s Vista project in Alberta, which received all regulatory approvals, was ready for mine construction. However, the mine construction was delayed due to global coal market conditions and assembling mine construction capital. The mine will produce bituminous thermal coal (hard coal) for exports. The company proposed mine development in two phases, reaching 12 Mt per year in total in the medium-term. First production targets for mid-2016. HD Mining’s Murray River project is close to the completion of the environmental assessment review conducted by British Columbia Environmental Assessment Office. HD Mining proposes to develop an underground mine with a production capacity of 6 Mt of coking coal per year for export over 31 years. The Donkin mine project on Cape Breton Island, Nova Scotia, received environmental approval in 2013 and is expected to produce 2.75 Mt per year by 2016 and exports through Sydney port. These projects, including the upgrade of terminals and port capacity on the west coast are forecasted to support Canadian exports to grow by 3.4% per year to reach 39 Mt by 2019 (IEA, 2015). This growth is mainly driven by the expected global increase in demand for hard coal. 7. The role of technology Canada has become a world leader in CCS technologies with the opening of the SaskPower Boundary Dam CCS facility in the fall of 2014, the first large-scale carbon capture and storage (CCS) power station project in the world. In this project, carbon dioxide (CO2) is permanently stored through enhanced oil recovery) in Boundary Dam. The project will be able to reduce Boundary Dam Unit 3’s CO2 emissions by 90%, or up to one million tonnes of CO2 per year, while also reducing the plants NOx and SO2 emissions by 50% and 100% respectively. In addition, federal funds and research programs support clean energy technology research, development and demonstration activities, including CCS, through the Clean Coal and CCS Technology program under the Program of Energy Research and Development (PERD), the ecoENERGY Innovation Initiative, the Clean Energy Fund and Sustainable Development Technology Canada (SDTC). The federal government works with interested provinces (Alberta, Saskatchewan, and Nova Scotia being the most closely engaged), many universities (20 or more), and industry and industrial collaborations (e.g. Canadian Clean Power Coalition, Petroleum Technology Research Centre). Also at international level, the partners are engaged in both bilateral (e.g. Canada-U.S. Clean Energy Dialogue) and multilateral dialogues and cooperation (e.g. International Energy Agency, Carbon Sequestration Leadership Forum).

8. Energy policy Canada does not have a specific coal policy. However, the Minerals and Metals Policy of the government of Canada applies to the mining sector and several environmental acts and regulations set standards for coal producers and consumers. The provincial governments are mainly responsible for oversight of mining - the exploration for and the development and extraction of mineral resources, as well as the construction, management, reclamation and closure of mine sites – within their jurisdiction. The federal government’s plan for Responsible Resource Development (RRD), launched in 2012, is modernizing Canada’s regulatory system for project reviews by delivering on four key objectives: (i) making project reviews more predictable and timely; (ii) reducing duplication of project reviews; (iii) strengthening environmental protection; and (iv) enhancing Aboriginal consultations. 9. Environmental rules Existing coal mine operators need to comply with the rules under the Canadian Environmental Protection Act (1999) which protects the environment and human health, applies the precautionary principle, and promotes and reinforces enforceable pollution prevention approaches. New mine projects are approved under the new Canadian Environmental Assessment Act (2012) which also promotes cooperation between federal and provincial governments, and provides opportunities for public participation, including consultation with Aboriginal groups. Coal use in power generation is governed by a number of federal environmental rules with regard to air pollutants and GHG emissions and provincial energy and climate policies as well as new technology developments, such as carbon capture and storage. The Canadian Environmental Protection Act, 1999 (CEPA 1999) provides legislative authority for the Government of Canada to regulate air pollutants such as sulphur oxides (SOx), nitrogen oxides (NOx), volatile organic compounds (VOCs), particulate matters (PM), mercury and other pollutants. Under the CEPA, permitting of facilities is generally carried out by the provinces through equivalency agreements. Since 2006, Canada-Wide Standards (CWS) are in place for mercury emissions from coal-fired power plants. These standards include provincial caps for mercury emissions from existing plants, and mercury emission limits for new power stations based on best available control technology. Under CEPA 1999, new emission performance standards were adopted at the federal level in 2012 with the Reduction of Carbon Dioxide Emissions from Coal-Fired Generation of Electricity Regulations. The regulations aim to reduce carbon dioxide emissions from new

coal-fired power plants and those reaching the end of their economic life, by setting an emission intensity performance standard limit at 420 t CO2 per GWh, the level achievable using efficient natural gas combined cycle technology. The performance standards come into effect on 1 July 2015. This will have a major impact on existing coal-fueled power plants, mainly in Alberta, Saskatchewan and Nova Scotia. Regulated firms will be subject to enforcement and compliance requirements and penalties under CEPA, 1999. The federal regulations aim to facilitate a permanent transition towards low-carbon generation including high-efficiency natural gas, coal with CCS and renewable generation sources. To meet the stringent regulations, existing power plants will need to retrofit using carbon capture and storage (CCS), convert to biomass or shut down once they reach their end of life as defined in the regulations. The regulations allow new and end-of-life units that incorporate CCS to defer compliance with the emission performance standard until 31 December 2024. Existing units that install CCS prior to end of life may apply for a two-year deferral of the performance standard. In general, coal-fired power plants reach their end-of-useful-life under the regulations 50 years from the unit’s commissioning date. Units that were commissioned before 1975 will reach their end-of-life after 50 years of operation or at the end of 2019, whichever comes earlier. Units commissioned in or after 1975 but before 1986 will reach their end-of-life after 50 years of operation or at the end of 2029, whichever comes earlier. According to the federal government, the regulations are projected to result in a net reduction of approximately 214 Mt CO2-eq of GHG over the period 2015–2035. The new emission performance standards are set to significantly reduce air pollution levels and NOx and SO2. They are expected to lead to a reduction in SO2 emission from 2002 levels by 54% by 2020 and 84% by 2030. Equally, they are contributing to a reduction in NOx emissions from 2002 levels by 50% by 2020 and 80% by 2030 (CEA, 2014). 10. Conclusion Canada is rich in coal resources and a mature industry. Canada’s high quality coking coal is in demand by global coking coal consumers. Canada needs to take advantage of its coal quality and west coast proximity to Asia to continue expanding its coal exports to contribute to the country’s economic prosperity. Canada is a global leader in carbon capture and storage. Canada should use its leading position to promote deployment of CCS technologies. The CCS technologies also make the continuous use of low grade coal viable and economical. With new technologies to reduce environmental footprints, the ample global coal resources could still be the best economic energy option.

Fact Sheets Canada Energy Production in Mtce in 2014 Hard coal Lignite Crude Oil Natural Gas Nuclear energy Renewable and other energies
45.4 4.2 303.5 193.5 39.9 67.6 Total 654.1
Source: IEA, Energy Balances of OECD Countries, 2015 Edition, Paris 2015 Energy Imports in Mtce in 2014 Hard coal and lignite Crude oil and oil products Natural gas Other energies
7.7 65.0 26.2 3.1 Total 102.0
Energy Exports in Mtce in 2014 Hard coal and lignite Crude oil and products Natural gas Other energies
29.5 249.4 93.1 8.7 Total 380.7
Source: IEA, Energy Balances of OECD Countries, 2015 Edition, Paris 2015 Primary energy consumption in Mtce in 2014 Hard coal and lignite Oil Natural gas Nuclear energy Hydro Power Other renewable and other energies
27.8 113.9 124.7 39.9 46.6 15.5 Total 368.4
Source: IEA, Energy Balances of OECD Countries, 2015 Edition, Paris 2015 Coal Balance in Mtce in 2014
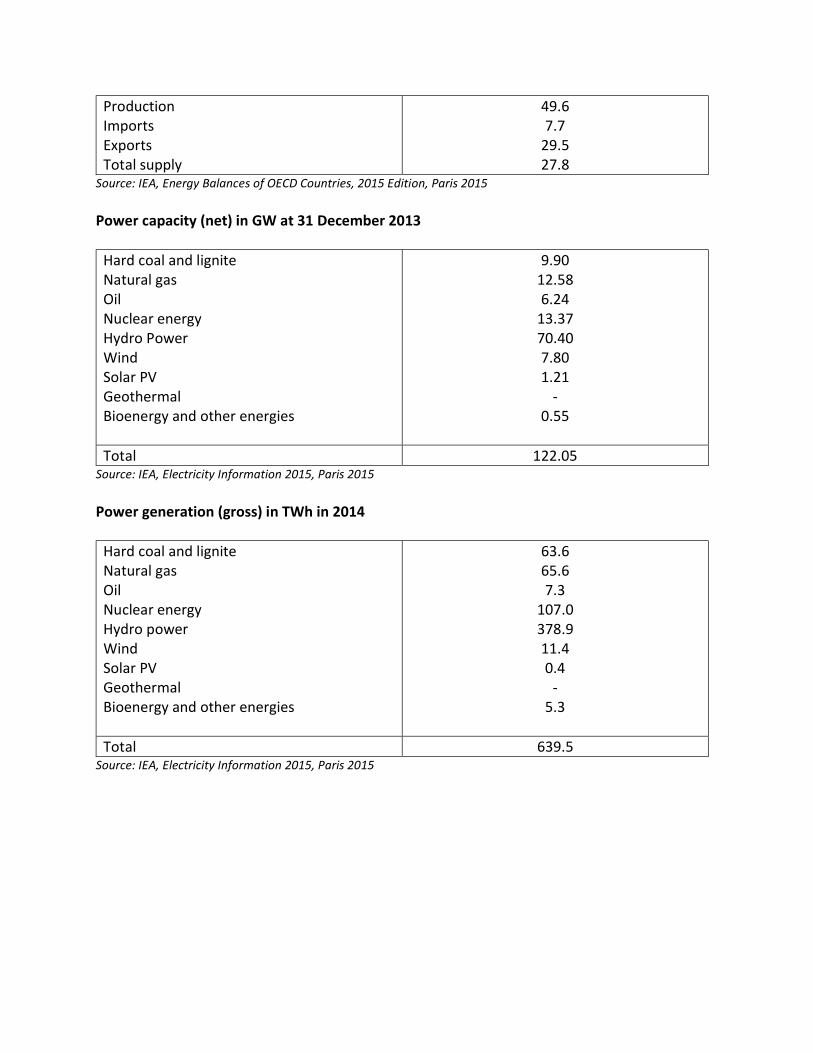
Production Imports Exports Total supply
49.6 7.7 29.5 27.8 Source: IEA, Energy Balances of OECD Countries, 2015 Edition, Paris 2015 Power capacity (net) in GW at 31 December 2013
Hard coal and lignite Natural gas Oil Nuclear energy Hydro Power Wind Solar PV Geothermal Bioenergy and other energies
9.90 12.58 6.24 13.37 70.40 7.80 1.21 - 0.55 Total 122.05
Source: IEA, Electricity Information 2015, Paris 2015 Power generation (gross) in TWh in 2014 Hard coal and lignite Natural gas Oil Nuclear energy Hydro power Wind Solar PV Geothermal Bioenergy and other energies
63.6 65.6 7.3 107.0 378.9 11.4 0.4 - 5.3 Total 639.5
Source: IEA, Electricity Information 2015, Paris 2015

![s ] Z v µ , } unityagni.com/.../Vishnu-Homam-Sanskrit-Regular.pdf · & , } u K v o ] v / v r } v o Á Á Á X v ] Ç P v ] X } u } v W = õ í õ î ô ï í í í í í ï](https://static.fdocuments.in/doc/165x107/5f80ff35cdf48776b064476e/s-z-v-u-k-v-o-v-v-r-v-o-x-v-p-v-x-u-.jpg)
![o v ] Ç o } } h&K> W€¦ · s } ] o ( ] Z v £ õ U í ì U í í U í î U í ï U í ð U í ñ í ò µ P o u v v ] } v o W } µ o ] µ µ Ç o } } U o v } µ À µ Æ } µ o](https://static.fdocuments.in/doc/165x107/60422e2c3c877340ba2ed4e8/o-v-o-hk-w-s-o-z-v-u-u-u-u-.jpg)
![t ] ] v P D y Y µ ] } v D µ o ] r ] u v ] } v o µ Á ] Z K> W /^ ò í í ^ µ v v ...cis.csuohio.edu/~sschung/cis611/CIS611_LectureNotes_MDX... · 2020. 7. 27. · /^ ò í í](https://static.fdocuments.in/doc/165x107/6024fe43bb418a181c310c5c/t-v-p-d-y-y-v-d-o-r-u-v-v-o-z-k-w-.jpg)
![r^ v Ç ] ] v } Á X v · 2019-11-06 · r^ v Ç ] ] v } Á X v ô í í = , î ì í ì / î v } l } µ µ ] Á ] Z ^ ô í í ~ K î v sK v , î ì í ì ~ ~ u µ v Z µ u ] ] Ç](https://static.fdocuments.in/doc/165x107/5f50de8f05566a226e0f2dc5/r-v-v-x-v-2019-11-06-r-v-v-x-v-.jpg)
![v } µ ] } v } Z î ì í ô ] ] } v } ( / í ñ ô ð r î ì í ô ... · X t ] r: v > U hd o ] v P } v o U v : µ o Ç ï í U î ì í õ ...](https://static.fdocuments.in/doc/165x107/5fbf0eb0eab0cf4b3a1877ce/v-v-z-v-r-x-t-r.jpg)
![D } v (W rs ( Z v ] u µ í ð X í ì X î ì í ô · D } v (W rs ( Z v ] u µ í ð X í ì X î ì í ô o Æ v t ] v } ] Z U D o Z l ' u , U](https://static.fdocuments.in/doc/165x107/60849ca43b620d16f86e59ef/d-v-w-rs-z-v-u-x-x-d-v-w-rs-z-v-u-.jpg)
![Secondary Textbooks 2017-2018€¦ · õ ó ô í ñ ô í î í î î í í Á v^ ] P vW z: E: z >Kd ^>/ ^ ] P v ] v PE µ o o Ç í r ò õ ó ô í ñ ô í î í î í ì ñ Á](https://static.fdocuments.in/doc/165x107/5e9a2184d9c3c53d4f2e4e15/secondary-textbooks-2017-2018-v-p-vw.jpg)
![Z P ] Ç } ( s ~ ] ( ] ] v s } o µ v u ] v ] ] } v } ( : µ ... · Y µ ] v ] v µ KZ h v ] ^ í î l ï í l î ì î í Z Z o v /E h v ] ^ í î l ï í l î ì î î](https://static.fdocuments.in/doc/165x107/5f601431ff3e0126327f81ab/z-p-s-v-s-o-v-u-v-v-y-v-v-.jpg)
![^ XE } X } v P } Ç E u } ( µ v ] h v ] r u ] o / í í õ l í ...](https://static.fdocuments.in/doc/165x107/622f6c617e88da2277563c60/-xe-x-v-p-e-u-v-h-v-r-u-o-.jpg)
![W ] v P Z /^K l/ ï ì í ð í / }d ( v Z ] µ ] ] } v î Z } µ ... · /^K l/ ï ì í ð í W î ì í ô / }dZ ( v Z ] µ K î ì í ð r µ P î ì í ô ~ ð Ç r À o } ] v](https://static.fdocuments.in/doc/165x107/5ec7a1177760e763de0c7673/w-v-p-z-k-l-d-v-z-v-z-k-l-.jpg)

![î ì í ò E Á o v E Z } o } P Ç í í Z EEh > Z WKZd...W } o v P u v ( } l ] v Ç ( ] o µ U ] v ] v u ] o o ] } v ñ ñ õ í í ô ñ î ì í í ô W } o Á ] Z l ] v Ç ( ]](https://static.fdocuments.in/doc/165x107/5eddb5eaad6a402d6668e096/-e-o-v-e-z-o-p-z-eeh-z-wkzd-w-o-v-p-u-v-.jpg)
![Actuonix LAC Datasheet - Amazon Simple Storage ServiceLAC+Datasheet.pdf · Æ v o } v v ] } v ] o y í WY í î µ } } v v } ñ ] v U í u u W ] Z &W } v v }](https://static.fdocuments.in/doc/165x107/5b185acb7f8b9a41258bc002/actuonix-lac-datasheet-amazon-simple-storage-service-lacdatasheetpdf-a.jpg)
![X í X í / v ] ] o ^ ] ( ] ] } v } ( / }d r v o µ } v } u ... · ï µ } u ] À ] v P & µ v ] } v v Z o rd ] u ^ Z ] v P í ò ï X í µ } u s o W l ] v P í ò ï X í X í &](https://static.fdocuments.in/doc/165x107/5e87b809e2d4a90b1720cd2b/x-x-v-o-v-d-r-v-o-v-u-u-.jpg)

![Series results v1 after 4 events · v v o o t ] o o ] u } µ } v Z } µ v v >h í í ì í ô õ õ õ õ õ õ î ì í ò Z o } D } P v & } K ( v >h í í í õ ì õ õ õ õ õ](https://static.fdocuments.in/doc/165x107/5ed61b1b300e8232eb7fa8f3/series-results-v1-after-4-events-v-v-o-o-t-o-o-u-v-z-v-v-h-.jpg)
![Z v D v P u v í ì í W ^ u o ] v ] v P z } µ W ^ Ç u · < ] Z v D v P u v í ì í W ^ u o ] v ] v P z } µ W ^ Ç u ñ l î ð l î ì í ó } Ç ] P Z î ì í ó Z µ v K Á](https://static.fdocuments.in/doc/165x107/5e87b6050f872f523f5688e9/z-v-d-v-p-u-v-w-u-o-v-v-p-z-w-u-z-v-d-v-p-u-v-.jpg)
![u ] o ^ Ç u } ] µ u > v } v ( v v U > v h v ] À ] Ç U h v ... · > v } v ( v v U > v h v ] À ] Ç U h v ] < ] v P } u U í í r í î l î l î ì í õ ^ Ç u](https://static.fdocuments.in/doc/165x107/5e64075b0cf9711b3041267b/u-o-u-u-v-v-v-v-u-v-h-v-u-h-v-v-.jpg)