V. FINANCIAL MARKETS
41
V. FINANCIAL MARKETS V.1 The subprime crisis, that emerged in the US housing mortgage market in the second half of 2007, snowballed into a global financial crisis and a global economic crisis. The global financial landscape changed significantly during the course of 2008-09 wherein several large international financial institutions either failed or were restructured, with the support of very large goverment interventions in many countries, to prevent imminent collapse. The significant deterioration in global financial conditions since mid- September 2008, led to severe disruptions in the short-term funding markets, widening of risk spreads, sharp fall in equity prices and inactivity in the markets for asset- backed securities. Consequently, the strain on the balance sheets of financial institutions increased, threatening the viability of some of the most well known financial entities in the world. The freezing up of credit markets necessitated extraordinary actions on the part of central banks and governments in countries across the world to mitigate the systemic risks posed by the ongoing financial crisis. V.2 To restore confidence and facilitate orderly functioning of markets, central banks have been responding through both conventional and unconventional measures and there have been instances of coordinated policy actions by the central banks. The conventional measure of monetary easing has been achieved through policy rate cuts 57 The process of deleveraging and dysfunctional financial markets in the advanced economies accentuating a global financial crisis has highlighted the importance of orderly functioning of markets for achieving macroeconomic objectives. In the third quarter of 2008-09, when liquidity dried down in the global money markets and the credit markets almost froze, there were knock-on effects on the domestic money and foreign exchange markets, which prompted the Reserve Bank to initiate measures to ensure adequate provision of both rupee and foreign exchange liquidity in the market. While orderly conditions were restored in the money market by November 2008, the pressure on the exchange rate continued, alongside pressure on the country’s balance of payments and draw down of foreign exchange reserves. The equity markets followed the general global sentiments and market trends and after a phase of sharp downward movement, the market has shown some recovery since March 2009. In the government securities market, reflecting the economy’s need for large fiscal stimulus, the gross market borrowings of the Government in 2008-09 were substantially higher than that for 2007-08. The entire market borrowing programme was managed smoothly by the Reserve Bank. In the credit market, following significant reduction in policy rates by the Reserve Bank, the lending rates of banks have begun to exhibit some moderation. In the context of the high volatility that was witnessed in global financial markets in 2008-09, one notable aspect of the Indian financial markets was that all segments functioned normally, with occasional volatility for short periods.
Transcript of V. FINANCIAL MARKETS

V. FINANCIAL MARKETS
V.1 The subprime crisis, that emergedin the US housing mortgage market in thesecond half of 2007, snowballed into aglobal financial crisis and a globaleconomic crisis. The global financiallandscape changed significantly during thecourse of 2008-09 wherein several largeinternational financial institutions eitherfailed or were restructured, with the supportof very large goverment interventions inmany countries, to prevent imminentcollapse. The significant deterioration inglobal financial conditions since mid-September 2008, led to severe disruptionsin the short-term funding markets, wideningof risk spreads, sharp fall in equity pricesand inactivity in the markets for asset-backed securities. Consequently, the strain
on the balance sheets of financialinstitutions increased, threatening theviability of some of the most well knownfinancial entities in the world. The freezingup of credit markets necessitatedextraordinary actions on the part of centralbanks and governments in countries acrossthe world to mitigate the systemic risksposed by the ongoing financial crisis.
V.2 To restore confidence and facilitateorderly functioning of markets, central bankshave been responding through bothconventional and unconventional measuresand there have been instances of coordinatedpolicy actions by the central banks. Theconventional measure of monetary easinghas been achieved through policy rate cuts
57
The process of deleveraging and dysfunctional financial markets in the advanced economiesaccentuating a global financial crisis has highlighted the importance of orderly functioningof markets for achieving macroeconomic objectives. In the third quarter of 2008-09, whenliquidity dried down in the global money markets and the credit markets almost froze, therewere knock-on effects on the domestic money and foreign exchange markets, which promptedthe Reserve Bank to initiate measures to ensure adequate provision of both rupee and foreignexchange liquidity in the market. While orderly conditions were restored in the money marketby November 2008, the pressure on the exchange rate continued, alongside pressure on thecountry’s balance of payments and draw down of foreign exchange reserves. The equitymarkets followed the general global sentiments and market trends and after a phase ofsharp downward movement, the market has shown some recovery since March 2009. In thegovernment securities market, reflecting the economy’s need for large fiscal stimulus, the
gross market borrowings of the Government in 2008-09 were substantially higher than
that for 2007-08. The entire market borrowing programme was managed smoothly by theReserve Bank. In the credit market, following significant reduction in policy rates by theReserve Bank, the lending rates of banks have begun to exhibit some moderation. In thecontext of the high volatility that was witnessed in global financial markets in 2008-09, onenotable aspect of the Indian financial markets was that all segments functioned normally,with occasional volatility for short periods.

58
Macroeconomic and Monetary Developments in 2008-09
which has taken the policy rate to nearly zeroas in the case of the US and to an all-timelow of 0.5 per cent as in the case of UK and1.25 per cent in the Euro area. The othermeasures include lending by central banksto non-banks, large-scale provision of term-funding in local currency and dollar marketsand expansion of the range of acceptablecollateral for receiving funding from thecentral bank. Further, steps have been takento deal with distressed assets and provideliquidity, including through bankrecapitalisation.
V.3 The important initiatives taken bythe US Federal Reserve, besides reductionof the federal funds rate, include conductingdirect purchases of agency debt and agencymortgage-backed securities, broadening ofliquidity programmes to financialintermediaries and other central banks andinitiating programmes in support ofsystemically important market segments.The US government entities also undertookextraordinary initiatives to support thefinancial sector by injecting capital into thebanking system and providing guaranteeson select liabilities of depositoryinstitutions. Many foreign central banks andgovernments took similar steps. Despite thehost of measures taken in most countries,normalcy continues to elude theinternational financial markets. This hascontributed to the continued uncertainty anddeterioration of the world economicoutlook. The financial markets need to bestabilised in order to achieve a turnaroundin global growth conditions.
V.4 Restoring investor confidence is keyto achieving financial stability. In this
context, there is a paramount need to dealwith distressed assets and recapitalise vitalinstitutions. This entails substantialcontribution from governments for supportof the financial sector. Simultaneously,governments have been addressing therecession through growth stimulus packages,while the tax receipts are likely to reduce inthe face of the economic downturn. Thelonger it takes to effectively implement thesupport packages for the financial sector, thenegative feedback transmitting from thefinancial sector to the real sector may leadto more protracted recession. The USgovernment and the Federal Reserve haveinitiated programmes for systemicallyimportant segments/institutions of thefinancial market. The authorities areconducting severe stress tests on all themajor banks, and if they are found short ofcapital required under more severe butplausible scenarios, they could fill the gapby recourse to private financing or throughtemporary capital buffers made available bythe government. The US Treasury, inconjunction with the Federal DepositInsurance Corporation and the FederalReserve, has announced the details of aPublic-Private Investment Programme whichwould use US$ 75-100 billion of TroubledAssets Relief Programme (TARP) capital andcapital from private investors and seek togenerate US$ 500 billion in purchasingpower to buy legacy assets, with the potentialto expand to US$ 1 trillion over time.
V.5 Due to the inter-linkages in theglobal financial markets, the ramificationsof developments in the advanced economiesare felt in the emerging economies. Hence,

Financial Markets
59
there needs to be greater coordination andcooperation amongst the policy-makingbodies so as to restore trust in the markets.In this regard, the Basel Committee onBanking Supervision and the FinancialStability Forum, to be known as FinancialStability Board in its expanded version,have extended their membership to anumber of emerging market economiesincluding India.
V.6 The knock-on effects of theinternational developments spilled into theIndian financial markets in mid-September2008. The Reserve Bank, like most centralbanks, has since taken a number ofconventional and unconventional measuresto augment the domestic and foreignexchange liquidity and address the supplyconstraints impacting the growthmomentum in the domestic economy. Animportant distinction between the actionstaken by the Reserve Bank and other centralbanks is that the interaction is still largelythrough the banking channel and even themeasures aimed at addressing the liquidityand redemption needs of mutual funds, non-banking financial companies (NBFCs) andhousing finance companies are directedthrough the banks1. Another notabledistinction is that there has not been anydilution of the collateral taken by theReserve Bank. The array of instrumentsavailable allow for flexibility in ReserveBank's operations. Liquidity modulationthrough flexible use of a combination of
instruments, to a significant extent,cushioned the impact of the internationalfinancial turbulence on domestic financialmarkets by absorbing excessive marketpressures and ensuring orderly conditions.Thus, liquidity pressures were evident inIndia for a temporary period in Septemberand October 2008. The Indian financialmarkets are robust and working normallywith no dislocations in the foreign exchange,money and government securities markets.
International Financial Markets
V.7 Since mid-October 2008, thedevelopments in the international financialmarkets have been largely conditioned bythe policy responses to the crisis. Thepricing behaviour has begun to mirror thestrains of the ongoing economic recessionand prices have been decidedly volatilegiven the environment of heighteneduncertainty. Pressure on credit marketpersists in the wake of recession in manyeconomies and subdued corporateperformance, which has given rise to theexpectation of possible increase in defaults.During the fourth quarter of 2008-09, theequity valuations generally remained low onaccount of concerns stemming from theweak financial and economic outlook.
Money Markets
V.8 The policies initiated by centralbanks and the guarantees offered bygovernments assuaged to an extent the
1 The Government of India had announced an arrangement for providing liquidity support to meet the temporary liquiditymismatches for eligible Systemically Important Non-Deposit taking Non-Banking Financial Companies (NBFC-ND-SI) throughthe Industrial Development Bank of India Stressed Asset Stabilisation Fund Trust, which has been notified as a Special PurposeVehicle for undertaking this operation.

60
Macroeconomic and Monetary Developments in 2008-09
funding pressures that were evident in theinternational financial markets duringSeptember and October 2008. The spreadsbetween Libor and overnight index swaps(OIS) have been gradually narrowing. Inthe UK, however, bank funding marketscame under renewed pressure. The SterlingLibor-OIS spreads slightly widened and theinterbank term-lending remained subduedduring late January and February 2009.
V.9 The benchmark credit default swap(CDS) indices have shown significant spreadvolatility since end-November 2008 up tothe fourth quarter of 2008-09. Investmentgrade spreads, however, mostly performedbetter than the lower-rated borrowers. Forinstance, between end-November 2008 andend-February 2009, the US five-year CDXhigh-yield index spread had risen by 148basis points, while the investment gradespreads registered a decline of 28 basispoints. The same pattern was exhibited bythe European CDS indices. As problemspersist in the banking sector internationallyand recessionary conditions have becomewidespread, it is expected that default rateswill increase. Risk tolerance in the marketis low and lower-rated spreads are expectedto see increased volatility. In March 2009,the Federal Reserve approved the applicationof the ICE Trust to become a member of theFederal Reserve system. The ICE trustwould provide central counterparty servicesfor CDS contracts conducted by itsparticipants. Under the arrangement, the ICETrust would work towards reducing the riskassociated with the trading and settlementof CDS transactions by assumingcounterparty credit risk and enforcing
participation standards and marginrequirements.
V.10 As spreads continued to be affectedby financial market concerns, in January2009, the authorities in the UK announceda further broad-based package for rescueof the financial institutions in the country.Additional support measures wereannounced by other European countries aswell. However, as concerns mounted overthe fiscal implications of the supportpackages and the depressed risk appetite,spreads on sovereign CDS rose during thefirst three months of 2009.
V.11 Recent measures taken by thegovernments and central banks do seem tobe having a favourable impact on certainsegments of the money and credit markets,which had faced severe disruptions duringthe acute phase of the crisis in the thirdquarter of 2008-09. For instance, the USgovernment’s announcement in November2008 and the subsequent initiation of aprogramme for purchase of up to US$ 100billion of direct obligations of housing-related government-sponsored enterprisesand up to US$ 500 billion of mortgage-backed securities (MBS) backed by FannieMae, Freddie Mac, and Ginnie Mae hashelped in reducing spreads on agency debtand the conditions for high-qualityborrowers in the primary residentialmortgage market recovered to an extent. InMarch 2009, the Federal Open MarketCommittee also announced plans topurchase an additional US$ 750 billion ofagency MBS and invest an additional US$100 billion in agency debt. The Committee

Financial Markets
61
also announced that it would buy up to US$300 billion of longer-term Treasurysecurities over the next six months to helpimprove conditions in private creditmarkets.
V.12 The Federal Reserve launched theTerm-Asset Backed Securities LoanFacility (TALF) on March 3, 2009 in anattempt to unfreeze markets for securitiesbacked by loans. Spreads in the areaswhere the programme is focussed – pooledcredit card, auto, student and smallbusiness loans – narrowed during the firsttwo months of 2009 in anticipation ofTALF and narrowed considerably inMarch with the launch of the programme.The first tranche of funding under TALFwas settled on March 25, 2009.
V.13 The banking sector in the US andEurope continued to show further signs ofproblems, despite the massive injection ofcapital by the government and from privatesources since late 2007. Notable instancesof governments picking up or hiking theirstakes in financial entities during the fourthquarter of 2008-09 include the Germangovernment taking a 25 per cent stake inthe merged entity of Commerzbank andDresdner Bank, the US authorities’investment of US $ 20 billion in Bank ofAmerica through a preferred equity stakeand the UK government restructuring itsinvestment in the Royal Bank of Scotland.The UK authorities continued to announcea series of measures during the fourthquarter of 2008-09 for enabling sufficientcredit flow to households and businesses.These measures include capping the losses
on banks’ holdings of risky assets, stateguarantees to facilitate bank funding andpurchase of commercial paper, corporatebonds and other securities to enhance creditavailability in the economy. In March 2009,the Bank of England embarked upon apolicy of credit/quantitative easingentailing the purchase of £ 75 billion worthof conventional gilts and notified privatesector assets in the secondary market, in abid to support the flow of corporate credit.The UK programme has resulted insignificantly lower yields for the gilts,which the Bank has agreed to buy.Corporate bond yields have also fallen. Bythe first week of April 2009, £ 26 billion ofasset purchases had been made and it isexpected that the programme will becompleted in another two months. In April2009, the Bank of Japan announced that itwould offer credit-worthy commercial bankssubordinated loans worth up to ¥1 trillion tosmoothen financial intermediation in thecountry. The programme is likely tocommence in May 2009.
Short-term Interest Rates
V.14 The easing of short-term interestrates in advanced economies persisted inthe fourth quarter of 2008-09, as policyrates continued to be cut with inflationconcerns disappearing and the recessionin most advanced economies turning outto be deeper and more protracted than wasearlier estimated (Table 41). The USfederal funds rate remains in the range of0.0-0.25 per cent set in mid-December2008. The Bank of England effected a 50basis point cut in policy rates in each of

62
Macroeconomic and Monetary Developments in 2008-09
(Per cent)
Region/Country End of
March March June Sept Dec March2007 2008 2008 2008 2008 2009
1 2 3 4 5 6 7
Advanced Economies
Euro Area 3.91 4.72 4.96 5.07 2.97 1.50
Japan 0.57 0.75 0.75 0.75 0.62 0.54
UK 5.55 6.01 5.93 6.25 2.73 1.70
US 5.23 2.26 2.29 2.04 0.44 0.50
Emerging Market Economies
Argentina 9.63 10.44 16.50 13.81 19.56 14.44
Brazil 12.68 11.18 12.17 13.66 13.66 11.16
China 2.86 4.50 4.48 4.31 1.86 1.22
Hong Kong 4.17 1.83 2.33 3.66 1.00 0.90
India 7.98 7.23 8.73 8.56 5.04 4.95
Malaysia 3.64 3.62 3.69 3.70 3.40 2.09
Philippines 5.31 6.44 6.00 4.00 5.25 4.50
Singapore 3.00 1.38 1.25 1.75 0.91 0.56
South Korea 4.94 5.32 5.36 5.78 3.98 2.41
Thailand 4.45 3.25 3.65 3.85 3.85 1.80
Note : Data for India refer to 91-day Treasury Bills rate and for other countries 3-month money market rates.Source : The Economist.
Table 41: Short-term Interest Rates
the three months of the fourth quarter of2008-09. As of March 5, 2009, the officialbank rate was at an all-time low of 0.5 percent. The ECB has reduced its policy ratesby 300 basis points since October 2008,the rate for main refinancing operationsthus stands reduced to 1.25 per cent. Thesoftening of interest rates was broad-basedand across the spectrum, as emergingeconomies also saw frequent cuts in policyrates and liquidity injections by theauthorities. Countries that effected cuts inpolicy rates during the fourth quarter of2008-09 include Turkey (cumulativereduction of 725 basis points since October2008), South Africa (cumulative reduction
of 250 basis points since October 2008)and South Korea (cumulative reduction of300 basis points since October 2008). Thepolicy rate cuts by the Czech Republic,Peru, Sri Lanka, Chile, Egypt, Canada,Poland, Malaysia, New Zealand, Icelandand Brazil, during the fourth quarter of2008-09, ranged from 50 basis points to600 basis points.
Government Bond Yields
V.15 There has been much volatility inthe government bond yields because evenas most advanced economies are facing arecession, concerns have mounted over the
Financial Markets
63
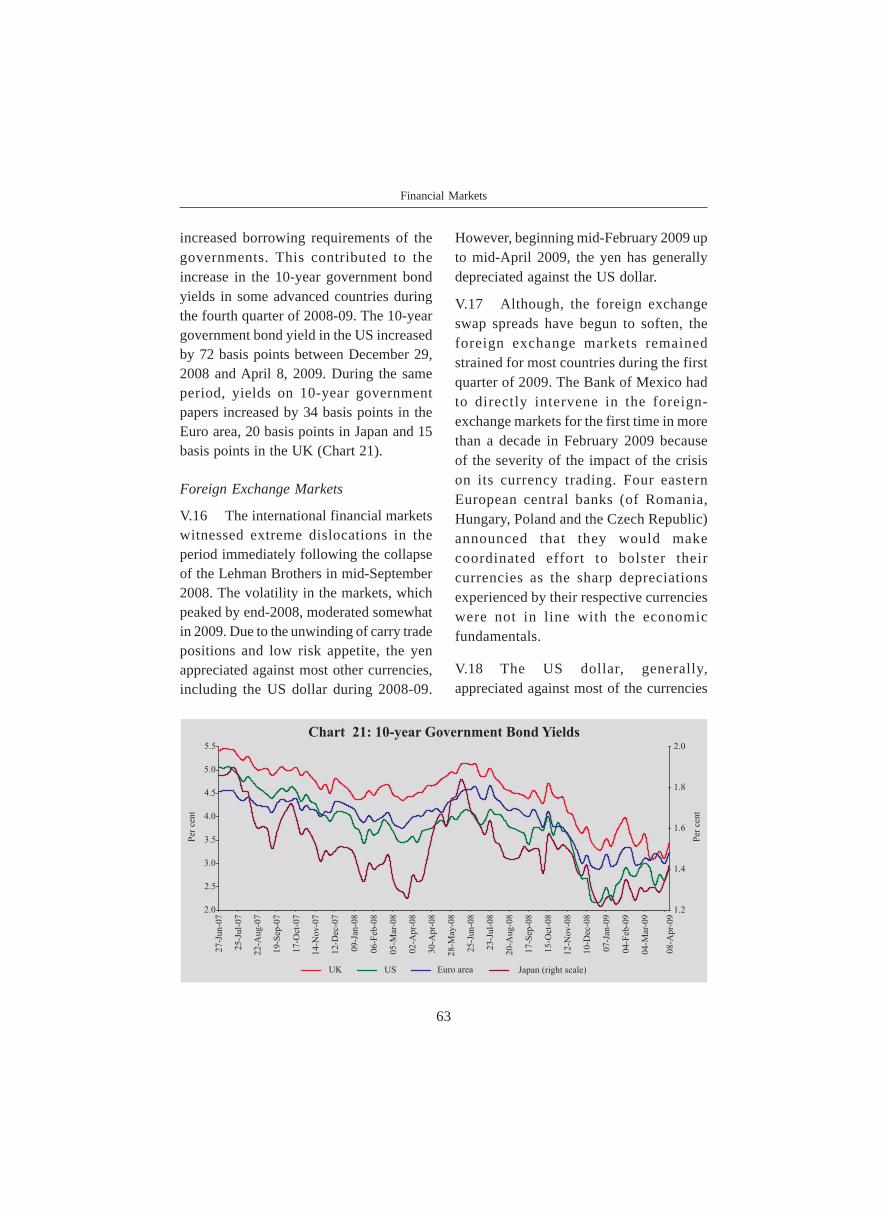
increased borrowing requirements of thegovernments. This contributed to theincrease in the 10-year government bondyields in some advanced countries duringthe fourth quarter of 2008-09. The 10-yeargovernment bond yield in the US increasedby 72 basis points between December 29,2008 and April 8, 2009. During the sameperiod, yields on 10-year governmentpapers increased by 34 basis points in theEuro area, 20 basis points in Japan and 15basis points in the UK (Chart 21).
Foreign Exchange Markets
V.16 The international financial marketswitnessed extreme dislocations in theperiod immediately following the collapseof the Lehman Brothers in mid-September2008. The volatility in the markets, whichpeaked by end-2008, moderated somewhatin 2009. Due to the unwinding of carry tradepositions and low risk appetite, the yenappreciated against most other currencies,including the US dollar during 2008-09.
However, beginning mid-February 2009 upto mid-April 2009, the yen has generallydepreciated against the US dollar.
V.17 Although, the foreign exchangeswap spreads have begun to soften, theforeign exchange markets remainedstrained for most countries during the firstquarter of 2009. The Bank of Mexico hadto directly intervene in the foreign-exchange markets for the first time in morethan a decade in February 2009 becauseof the severity of the impact of the crisison its currency trading. Four easternEuropean central banks (of Romania,Hungary, Poland and the Czech Republic)announced that they would makecoordinated effort to bolster theircurrencies as the sharp depreciationsexperienced by their respective currencieswere not in line with the economicfundamentals.
V.18 The US dollar, generally,appreciated against most of the currencies

64
Macroeconomic and Monetary Developments in 2008-09
Though the decline in equity valuations wasbroad-based across all sectors, financialinstitutions, particularly in Japan, were theworst sufferers. The volatility in the marketsin the fourth quarter was compounded bythe lack of detailed information aboutgovernment rescue packages. The equitymarkets saw a slight recovery in mostcountries/regions since mid-March 2009,helped further by the US governmentannouncing the details of the public-privateinvestment programme aimed at repairingbalance sheets of financial institutions.
Emerging Markets
V.21 The ongoing crisis has invalidatedthe ‘decoupling hypothesis’, as emergingeconomies too have been hit by the crisis.
as the US investors were liquidating theirpositions in overseas equity and bondmarkets and repatriating the money backto the US. Notwithstanding the deepeningof the financial crisis and weakness ineconomic activity in the US, the flight tosafety considerations helped strengthen theUS dollar. During 2008-09, the US dollarappreciated against most major currenciesincluding the euro and the pound sterling.The US dollar, however, depreciatedagainst the Japanese yen, as a result ofunwinding of carry trades. Amongst Asiancurrencies also, the US dollar appreciatedagainst Korean won, Thai baht, Malaysianringgit, Indonesian rupiah and Indianrupee but depreciated against Chineseyuan. As on April 14, 2009, however, theUS dollar depreciated against most majorcurrencies, except the euro and theJapanese yen, over end-March 2009 levels(Table 42).
Equity Markets
V.19 The year 2008-09 continued to be adismal year for the stock markets. As areflection of the economic and financialmarket outlook, the year was characterisedby depressed equity valuations. Equityprice indices in most advanced economieswere relatively flat during July and August2008, but caught on the downward spiralsubsequently, which continued into the firsttwo months of 2009 (Table 43).
V.20 Consequently, price/earnings ratiosin most markets across the world followeda downward trend. They remained at orclose to all-time low levels for most regionsduring the fourth quarter of 2008-09.
(Per cent)
Currency End- End- April 14, March March 2009*
2008 @ 2009 @
1 2 3 4
Euro -15.77 18.82 0.24Pound Sterling -1.53 38.67 -3.78Japanese Yen -14.92 -2.00 1.78Chinese Yuan -9.34 -2.61 -0.09Russian Ruble -9.68 44.25 -1.52Turkish Lira -5.75 27.69 -6.03Indian Rupee -8.30 27.47 -2.15Indonesian Rupiah 1.09 25.58 -5.13Malaysian Ringgit -7.77 14.42 -1.41South Korean Won 5.47 38.86 -3.26Thai Baht -10.16 12.85 -0.24Argentine Peso 2.08 17.32 -0.84Brazilian Real -16.99 31.20 -3.02Mexican Peso -3.48 32.90 -7.53South African Rand 11.34 17.22 -4.95
@ : Year-on-year variation.* : Variation over end-March 2009.
Table 42: Appreciation (+)/Depreciation (-) of the US dollar
vis-à-vis other Currencies

Financial Markets
65
Table 43: International Stock MarketsCountry/Index Percentage Variation
(year-on-year)
End- End- End-March March March
2007 2008 2009
1 2 3 4
Developed MarketsUS (Dow Jones) 11.2 -0.7 -38.0
US (NASDAQ) 3.5 -5.9 -32.9
FTSE UK 100 5.8 -9.6 -31.2
Euro area (FTSE 100) 7.5 -15.7 -40.1
Japan (Nikkei 225) 1.3 -27.6 -35.3
Hong Kong (Hang Seng) 25.3 15.4 -40.6
Emerging MarketsRussia 34.9 6.1 -66.4
Brazil 20.7 33.1 -32.9
Colombia -3.7 -16.0 -10.6
South Africa 34.3 11.5 -32.7
South Korea 6.8 17.3 -29.2
Hungary 1.6 -7.3 -49.0
Singapore 28.2 -4.9 -43.5
Malaysia 34.6 0.1 -30.1
Argentina 16.8 0.0 -46.5
Turkey 1.8 -10.6 -34.0
Indonesia 38.4 33.7 -41.4
India 15.9 19.7 -37.9Thailand -8.1 21.3 -47.2
China 145.2 9.1 -31.7
Memo:
World (MSCI) 13.4 -5.1 -44.0
EMEs (MSCI) 17.9 18.9 -48.4
Source : Bloomberg.
Even though institutions in most of theemerging economies did not have directexposure to the toxic assets, theseeconomies are suffering the consequencesof the economic recession that has grippedthe advanced economies. The emergingmarket economies witnessed capital flowreversals, sharp widening of spreads onsovereign and corporate debt and abruptcurrency depreciations during 2008-09. Banks have curtailed their lending to
emerging economies as reflected in the nearhalving of the total volume of internationalsyndicated loan facilities given toborrowers in emerging markets in the lastquarter of 2008 as against thecorresponding period of the previous year.
V.22 The central and east Europeaneconomies seem to have suffered the bruntof the global financial markets upheaval,given their large current account deficits.Banks in most of these countries are inneed of government support in the formof recapitalisation. Several emergingeastern European countries, includingHungary, Romania and Ukraine, havesought IMF support to stabilise theirfinancial markets. The emergingeconomies of Europe which sawplummeting valuations in equity marketsinclude the Czech Republic, Hungary,Poland and Russia. During the fourthquarter of 2008-09, the foreign exchangemarkets of most emerging marketeconomies continued to be under pressure.The Russian rouble continued thedownward spiral against both the USdollar and the euro, with the plunge beingparticularly persistent during the fourthquarter of 2008-09. Some other currenciesthat suffered sharp losses during the periodinclude the Czech koruna, the Hungarianforint, the Polish zloty, the Brazilian real,the Korean won, the Mexican peso and theIndonesian rupiah. Ten ASEAN membersand China, Japan and Korea have togetherpledged US$ 120 billion to counter the riskof a currency collapse in the region byenhancing the total size of themultilateralised Chiang Mai Initiative.

66
Macroeconomic and Monetary Developments in 2008-09
Sovereign credit spreads in select emergingmarket economies showed improvementover the levels that were seen in October2008. However, for most low-rated LatinAmerican and Eastern European issuers,the spreads continued to be at record highs.
V.23 Though emerging marketeconomies, including India, do not havedirect or significant exposure to stressed
financial instruments or troubled financialinstitutions, they are not immune to theadverse effects of the financial crisis.During the fourth quarter of 2008-09, anumber of countries announced furthermeasures for monetary easing, provisionof liquidity and restructuring/recapitalisation of the financial system(Table 44).
Table 44: Recent Global Response to Financial Market Turmoil
Country Key Measures
1 2
United Monetary Policy EasingStates • The target range for federal funds rate was set between 0.00 and 0.25 per cent on December 16, 2008 and
has remained unchanged since then.
Liquidity Provision• Term funds continued to be auctioned through new channels such as the Term Auction Facility (TAF).
• The set of eligible collateral for loans extended by the Term Asset-Backed Securities Loan Facility (TALF)was expanded to include four additional categories of asset-backed securities.
• Five liquidity facilities – the Primary Dealer Credit Facility (PDCF), the Asset-Backed Commercial PaperMoney Market Mutual Fund Liquidity Facility (AMLF), the Commercial Paper Funding Facility (CPFF),the Money Market Investor Funding Facility (MMIFF) and the Term Securities Lending Facility (TSLF) –were extended up to October 30, 2009.
• The Temporary Money Market Funds Guarantee Program extended up to September 18, 2009.
• The set of institutions eligible to participate in the MMIFF was expanded. Several economic parameters ofthe MMIFF were adjusted so that it remained a viable source of back-up liquidity for money market investorseven at very low levels of money market interest rates.
• The Federal Reserve to purchase US$ 1.25 trillion of agency mortgage-backed securities and US$ 200billion of agency debt in 2009.
• The Federal Reserve to purchase US$ 300 billion of longer-term Treasury securities by September 2009.
• A Public-Private Investment Programme to generate purchasing power of up to US$ 1 trillion to buylegacy assets.
Recapitalisation of the Financial System• Restructuring of Government’s financial support to the American International Group (AIG) was announced
in March 2009.
• The US government entered into an agreement with Bank of America to provide a package of guarantees,liquidity access and capital.
• The US Treasury to participate in Citigroup’s exchange offering by converting a portion of its preferredsecurity to common equity alongside the other preferred holders.
• Community Development Financial Institutions (CDFI) Fund announced to award nearly US$ 100 millionin grants and US$ 3 billion in additional tax credit authority to support community-based financial institutionssuch as loan funds, credit unions, banks, venture capital firms and other financing entities.
• Total Capital Purchase Program (CPP) investment of US$ 195.3 billion in 359 institutions since October 2008.
• Capital Assistance Programme announced for the major US banking institutions.
(Contd...)

Financial Markets
67
Other Measures• A policy announced to help avoid preventable foreclosures on certain residential mortgage assets held,
owned or controlled by a Federal Reserve Bank.• Application of the ICE trust to provide central counterparty services for certain CDS contracts was approved.
United Monetary Policy EasingKingdom • Official bank rate was cut thrice by 50 basis points (bps) each during January-March, 2009 to 0.5
per cent.
Liquidity Provision• Asset Purchase Facility to buy gilts, commercial paper and corporate bonds from the secondary market
using central bank reserves amounting to £ 75 billion.• Extension of the drawdown window of the Credit Guarantee Scheme (CGS) up to December 31, 2009.• Extension of the term of the Bank of England’s permanent discount window facility to 364 days for an
additional fee of 25 bps.
Financial Restructuring• The UK Treasury’s preference share investment in RBS was converted to ordinary shares.
Recapitalisation of the Financial System• Asset Protection Scheme, which aims to remove uncertainty about the value of banks’ past investments,
clean up banks’ balance sheets and enable them to rebuild and restructure their operations and increaselending in the economy. The scheme is available for a fee on eligible assets of select participating institutions.Agreement signed with Lloyds Banking Group and Royal Bank of Scotland.
Other Measures• The Banking Act 2009, which strengthens the UK’s statutory framework for financial stability and depositor
protection, was enacted.
Other Monetary Policy EasingCountries • ECB cut its interest rates on the main refinancing operations by 50 bps each in January and March 2009
and by 25 bps in April 2009 to 1.25 per cent, on the marginal lending facility by 50 bps in March 2009 andby 25 bps in April 2009 to 2.25 per cent and on deposit facility by 100 bps in January, 50 bps in March 2009and 25 bps in April 2009 to 0.25 per cent.
• Central Bank of the Republic of Turkey cut its overnight borrowing rate by 450 bps during January-March 2009.• South Korea reduced its monetary policy base rate by 50 bps each in January and February 2009 to 2.0 per
cent as on February 12, 2009.
Liquidity Provision• Japan issued fresh guidelines on eligible collateral for credit extended by banks.• Bank of Japan announced terms and conditions for the outright purchase of corporate financing instruments
such as CP and corporate bonds.• The frequency and duration of special funds supplying operations were increased. Most other provisions
taken for achieving financial stability, that were set to expire in April 2009, were extended up to at leastSeptember 2009.
Recapitalisation of the Financial System• Germany extended a bailout package to Commerzbank to backstop losses at newly acquired Dresdner
Bank and took a 25 per cent holding in the combined entity.• Ireland took control of the Anglo Irish Bank.• The Dutch authorities granted ING Group a backup facility guaranteeing part of the bank’s securitised
mortgage portfolio worth US$ 35 billion.
Other Measures• To address continued pressures in global US dollar funding markets, the temporary reciprocal currency
arrangements (swap lines) between the Federal Reserve and other central banks were extended till October30, 2009.
Source : Websites of respective central banks, finance ministries.
Table 44: Recent Global Response to Financial Market Turmoil (Concld.)Country Key Measures
1 2

68
Macroeconomic and Monetary Developments in 2008-09
Domestic Financial Markets
V.24 Beginning mid-September 2008,the Indian financial markets came underpressure owing to the knock-on effects ofthe global crisis through the monetary,financial, real and confidence channels.The contagion was initially felt in theequity markets due to the reversal offoreign institutional portfolio flows. Withsharp tightening of global liquidity, Indianbanks and corporates saw their overseasfinancing drying up. As a means ofsubstitute financing, corporates withdrewtheir investments from domestic moneymarket mutual funds, thereby puttingredemption pressure on them and onNBFCs where the mutual funds hadinvested a significant portion of theirfunds. This substitution of overseasfinancing by domestic financing broughtboth money market and credit marketunder pressure. Moreover, the foreignexchange market was impacted by thereversal of capital flows as part of the globaldeleveraging process. Simultaneously,corporates were converting the funds raisedlocally into foreign currency to meet theirexternal obligations. Both these factors putdownward pressure on the rupee. Furthermore, the Reserve Bank’sintervention in the foreign exchangemarket to manage the volatility in therupee temporarily tightened the moneymarket.
V.25 In response, the Reserve Bankinitiated several measures since September16, 2008 to augment domestic and foreignexchange liquidity for proper functioning
of the domestic markets and maintainingfinancial stability (Annex 2). Reflectingthe impact of the measures, call rates inthe money market have settled back intothe informal LAF corridor sinceNovember 2008, having breached theupper bound in the preceding two months(Table 45). In the foreign exchangemarket, the Indian rupee generallydepreciated against major currencies. Inthe credit market, the lending rates ofscheduled commercial banks (SCBs)have begun to exhibit some moderationsince November 2008. The governmentsecurities market was bearish for most ofthe fourth quarter of 2008-09 and yieldshardened. Indian equity markets, pickingup global cues, staged some recovery inMarch 2009.
Liquidity Conditions
V.26 The Reserve Bank’s monetarypolicy response to the global crisisimpinging on India was to keep thedomestic money and credit marketsfunctioning normally and ensure that theliquidity stress did not trigger solvencyissues. The need to maintain a comfortablerupee liquidity position, to augment foreignexchange liquidity and to ensure creditdelivery to all productive sectors of theeconomy marked a reversal of ReserveBank’s policy stance from monetarytightening in the first half of 2008-09 tomonetary easing in the second half. Themeasures to meet the above objectives camein several policy packages starting mid-September 2008.

Financial Markets
69
Year/ Call Money Government Foreign Exchange Liquidity EquityMonth Securities Management
Average Average Average Average Average Average RBI’s Net Average Average Average Average Average AverageDaily Call Turnover 10-Year Daily Exchange Foreign MSS Daily Daily Daily BSE S&P
Turnover Rates* in Govt. Yield@ Inter- Rate Currency Out- Reverse BSE NSE Sensex** CNX(Rs. (Per Securities+ (Per bank (Rs. per Sales (-)/ standing# Repo Turnover Turnover Nifty**
crore) cent) (Rs. cent) Turnover US $) Purchases (Rs. (LAF) (Rs. (Rs.crore) (US $ (+) crore) Out- crore) crore)
million) (US $ standingmillion) (Rs.
crore)
1 2 3 4 5 6 7 8 9 10 11 12 13 14
2006-07 21,725 7.22 4,863 7.78 18,540 45.28 26,824 ## 37,698 21,973 3,866 7,812 12,277 3,5722007-08 21,393 6.07 8,104 7.91 34,044 40.24 78,203 ## 1,28,684 4,677 6,275 14,148 16,569 4,8972008-09 P 22,436 7.06 7,175 7.56 – 45.92 – 1,48,889 2,885 4,498 11,212 12,366 3,731Apr 2008 19,516 6.11 6,657 8.10 37,580 40.02 4,325 1,70,726 26,359 5,773 13,561 16,291 4,902May 2008 19,481 6.62 6,780 8.04 32,287 42.13 148 1,75,565 11,841 6,084 13,896 16,946 5,029Jun 2008 21,707 7.75 6,835 8.43 38,330 42.82 -5,229 1,74,433 -8,622 5,410 12,592 14,997 4,464Jul 2008 24,736 8.76 5,474 9.18 37,173 42.84 -6,320 1,72,169 -27,961 5,388 12,862 13,716 4,125Aug 2008 23,408 9.1 7,498 9.06 38,388 42.94 1,210 1,71,944 -22,560 4,996 11,713 14,722 4,417Sep 2008 23,379 10.52 10,418 8.45 44,700 45.56 -3,784 1,75,666 -42,591 5,147 12,489 13,943 4,207Oct 2008 28,995 9.9 4,321 7.85 36,999 48.66 -18,666 1,69,123 -45,612 3,911 10,810 10,550 3,210Nov 2008 21,812 7.57 5,866 7.41 31,322 49.00 -3,101 1,47,648 -8,017 3,539 9,618 9,454 2,835Dec.2008 21,641 5.92 11,451 5.88 34,874 48.63 -318 1,24,848 22,294 3,851 95,928 9,514 2,896Jan 2009 18,496 4.18 9,568 5.84 27,171P 48.83 -29 1,13,535 45,474 3,526 9,559 9,350 2,854Feb 2009 22,241 4.16 5,916 5.98 24,840P 49.26 230 1,02,934 50,649 2,856 7,887 9,188 2,819March 2009P 23,818 4.17 5,322 6.56 – 51.23 – 88,077 33,360 3,488 10,140 8,995 2,802
* : Average of daily weighted call money borrowing rates. + : Average of daily outright turnover in Central Government dated securities.@ : Average of daily closing rates. # : Average of weekly outstanding MSS.** : Average of daily closing indices. ## : Cumulative for the financial year.LAF : Liquidity Adjustment Facility. BSE : Bombay Stock Exchange LimitedMSS : Market Stabilisation Scheme. NSE : National Stock Exchange of India Limited .P : Provisional – : Not available.Note : In column 10, (-) indicates injection of liquidity, while (+) indicates absorption of liquidity.
Table 45: Domestic Financial Markets at a Glance
Cash Management of the CentralGovernment
V.27 The surplus cash balance ofRs.76,686 crore as at end-March 2008 wasused up by the Central Government to meetits expenditure needs and it resorted to waysand means advances (WMA) during August4-6, 2008 and again during September2-14, 2008. During the third quarter of2008-09, the Government announced fiscalstimulus packages even as revenue receiptsdecelerated. The Central Government wasin WMA for 23 days and resorted tooverdraft (OD) for 10 days during the third
quarter. The Central Government was inWMA for 70 days and in OD for 55 daysduring the fourth quarter of 2008-09(Table 46 and Chart 22).
Table 46: Cash Management of theCentral Government
2007-08 2008-09
1 2 3
Total Number of DaysWMA 91 109OD 37 65Cash Deficit 91 109
Average Daily Utilisation*WMA 3,615 2,077OD 647 1,823
* : in Rupees crore.

70
Macroeconomic and Monetary Developments in 2008-09
as the drying up of capital inflows hadbrought a turnaround in the foreignexchange operations of the Reserve Bankfrom net spot purchases up to May 2008to net spot sales thereafter, barring August2008 (refer Table 47). Consequently, theMSS auctions of dated securities were keptin abeyance after end-April 2008 and MSSissuances, even through Treasury Bills,were stopped after September 2, 2008(Chart 23). Reflecting the impact of thesedevelopments, the LAF turned fromabsorption mode to injection mode afterthe first week of June 2008.
V.30 Beginning mid-September 2008,the severe disruptions in internationalfinancial markets brought pressures on thedomestic money and foreign exchangemarkets in conjunction with transient localfactors such as advance tax payments. Inorder to alleviate these stresses and withthe abatement of inflationary pressures,the Reserve Bank augmented rupeeliquidity through a series of measures
Liquidity Management
V.28 During the financial year 2008-09,liquidity management operations had tochange course beginning mid-September2008 as the knock-on effects of the severedisruptions in international financialmarkets began to be felt in the domesticfinancial markets. The use of liquiditymanagement tools such as the cash reserveratio (CRR) and the Open MarketOperation (OMO), including the MarketStabilisation Scheme (MSS) and theLiquidity Adjustment Facility (LAF), wasthus modulated in accordance with theevolving conditions in financial markets.Variations in the cash balances of theCentral Government and the capital flowsand the concomitant foreign exchangeoperations of the Reserve Bank continuedto be the key drivers of liquidity conditionsduring the year (Table 47).
V.29 There was a reduction in thegeneration of domestic liquidity during theperiod from April to mid-September 2008,

Financial Markets
71
including reduction in CRR by acumulative 400 basis points to 5.0 percent and a slew of special facilities (refer
Annex 2). Furthermore, the repo rate andthe reverse repo rate under LAF wereprogressively reduced from 9.0 per cent
Table 47: Reserve Bank’s Liquidity Management Operations(Rupees crore)
Item 2007-08 2008-09 2008-09(April- (April-
Q1 Q2 Q3 Jan FebMarch February)
1 2 3 4 5 6 7 8
A. Drivers of Liquidity (1+2+3+4+5) 2,03,121 -1,24,579 6,061 -18,917 -1,01,304 -12 -10,4081. RBI’s net purchases from
Authorised Dealers 3,12,054 -1,60,765 -8,555 -40,249 -1,12,168 -129 3362. Currency with the Public -85,475 -82,369 -30,071 12,294 -40,096 -7,724 -16,7713. Surplus cash balances of the
Centre with the Reserve Bank -26,594 76,586 40,073 -3,845 36,554 3,804 04. WMA and OD 0 9,603 0 0 0 9,166 4375. Others (residual) 3,136 32,366 4,615 12,884 14,406 -5,129 5,590
B. Management of Liquidity (6+7+8+9) -1,17,743 1,06,952 -37,659 7,217 1,33,325 -3,516 7,5866. Liquidity impact of LAF Repos 21,165 -1,10,170 -18,260 24,390 -71,110 -39,975 -5,2157. Liquidity impact of OMO (Net) * 13,510 48,472 14,642 11,949 10,681 5,173 6,0288. Liquidity impact of MSS -1,05,418 66,400 -6,041 628 53,754 11,286 6,7739. First round liquidity impact
due to CRR change -47,000 1,02,250 -28,000 -29,750 1,40,000 20,000 0
C. Bank Reserves (A+B) # 85,378 -17,627 -31,598 -11,700 32,021 -3,528 -2,822
(+) : Indicates injection of liquidity into the banking system.(-) : Indicates absorption of liquidity from the banking system.# : Includes vault cash with banks and adjusted for first round liquidity impact due to CRR change.* : Includes oil bonds but excludes purchases of Government securities on behalf of State Governments.Note : Data pertain to March 31 and last Friday for all other months.

72
Macroeconomic and Monetary Developments in 2008-09
to 5.0 per cent and 6.0 per cent to 3.5 percent, respectively. These apart, MSSbuyback auctions were started fromNovember 6, 2008, largely dovetailed withthe Government’s normal marketborrowing programme to provide anotheravenue for injecting liquidity (Table 48 andChart 24). Reflecting the impact of these
measures, the average daily net outstandingliquidity injection under LAF, which hadincreased to around Rs.43,000-46,000 croreduring September and October 2008,declined sharply thereafter and turned intonet absorption from early December 2008.
V.31 For more effective liquiditymanagement and to ensure that the marketborrowing programme of the Governmentwas conducted in a non-disruptive manner,the scope of the OMO was widened witheffect from February 19, 2009 by includingpurchases of government securities throughan auction-based mechanism in addition topurchases through the Negotiated DealingSystem – Order Matching (NDS-OM)segment. The cut-off yields in the OMOpurchase auctions were based on theattractiveness of offers for securitiesrelative to their secondary market yields.Auction-based purchases aggregatedRs.5,000 crore whereas purchases throughNDS-OM aggregated Rs.800 crore duringFebruary 2009.
V.32 With the change in the externalaccounts in the recent period resulting inattendant draining of primary liquidityreflecting the impact of the Reserve Bank’soperations in the foreign exchange market,the Memorandum of Understanding (MoU)on the MSS was amended on February 26,2009 to permit the transfer of the sterilisedliquidity from the MSS cash account to thenormal cash account of the Government(details covered in the Central Governmentsecurities section later in the Chapter).
V.33 In March 2009, the OMOpurchases through auctions and NDS-OM
Table 48: Liquidity Management
Outstanding LAF MSS Centre’s Totalas on Surplus (2 to 4)Last Friday with the
RBI @
1 2 3 4 5
2008January 985 1,66,739 70,657 2,38,381
February 8,085 1,75,089 68,538 2,51,712
March* -50,350 1,68,392 76,586 1,94,628
April 32,765 1,72,444 36,549 2,41,758
May -9,600 1,75,362 17,102 1,82,864
June -32,090 1,74,433 36,513 1,78,856
July -43,260 1,71,327 15,043 1,43,110
August -7,600 1,73,658 17,393 1,83,451
September -56,480 1,73,804 40,358 1,57,682
October -73,590 1,65,187 14,383 1,05,980
November -9,880 1,32,531 7,981 1,30,632
December 14,630 1,20,050 3,804 1,38,484
2009
January 54,605 1,08,764 -9,166 1,54,203
February 59,820 1,01,991 -9,603 1,52,208
March* 1,485 88,077 16,219 1,05,781
April 10 1,29,810 71,145 -13,779 1,87,176
@ : Excludes minimum cash balances with the ReserveBank in case of surplus.
* : Data pertain to March 31.
Note : 1. Negative sign in column 2 indicates injection ofliquidity through LAF.
2. The Second LAF that was discontinued fromAugust 6, 2007 was re-introduced from August1, 2008 on reporting Fridays and from September17, 2008 on a daily basis.
3. Negative sign in column 4 indicates injection ofliquidity through WMA/OD.
(Rupees crore)

Financial Markets
73
were placed at Rs.41,640 crore andRs.4,475 crore, respectively, whereas MSSredemptions amounted to Rs.2,000 crore(over and above the de-sequestering ofRs.12,000 crore of MSS balances); thesehelped to further ease liquidity conditions.The average daily net outstanding liquidityabsorption through LAF, however,declined to around Rs.33,000 crore inMarch 2009 from over Rs.50,000 crore inthe previous month, reflecting, inter-alia,advance tax outflows. It is, however,noteworthy that the net injection ofliquidity through LAF did not occur evenon a single day of March 2009, includingthe last day of the month, in sharp contrastto the experience in the previous few years.
Money Market
V.34 During the first half of 2008-09 (upto mid-September 2008), reflecting theorderly conditions in the money market,the call rates remained largely within theinformal corridor of the reverse repo and
repo rates. The failure of Lehman Brothersand a few other global financialinstitutions in September 2008 saw theabrupt freezing of money market activitiesin the major financial centres. In order tocontain the excess volatility in the foreignexchange market, the Reserve Bank madeavailable substantial dollar liquidity. Thishad a tightening impact on rupee liquidity.The impact was magnified on account ofdomestic factors such as advance taxoutflows from the banking system. Thecall rate moved above the repo rate in mid-September 2008 (Chart 25). As the seriesof measures initiated by the Reserve Bankto augment liquidity began to take effect,the weighted average call money ratedeclined and mostly remained within theLAF corridor from November 3, 2008onwards.
V.35 Interest rates in the collateralisedsegments of the money market – the marketrepo (outside the LAF) and theCollateralised Borrowing and Lending

74
Macroeconomic and Monetary Developments in 2008-09
Obligation (CBLO) – moved in tandemwith, but remained below, the call rateduring 2008-09 in general, including in thelast quarter of the year (Chart 26). Averagedaily volumes in the CBLO and market reposegments, declined sharply during April-October 2008, mainly on account oftightening of liquidity conditions andincreasing recourse to LAF repos. TheCBLO and market repo volumes picked up
substantially in the last quarter of 2008-09,largely reflecting the easing of liquidityconditions and the enhanced lendingcapacity of mutual funds. The total averagedaily volume of the three segments of themoney market was placed at Rs.82,000crore in March 2009 as compared withRs.41,000 crore in October 2008 andRs.64,000 crore in April 2008. The sharesof the CBLO, market repo and call

Financial Markets
75
segments in total money market wereplaced at 59 per cent, 26 per cent and 15per cent in March 2009, nearly the same asin April 2008.
Certificates of Deposit
V.36 The outstanding amount ofcertificates of deposit (CDs) issued bySCBs increased from end-March 2008 upto September 2008. This was followed bya decline up to December 2008, reflectingthe indirect impact of the global financialturmoil. Subsequently, with the easing ofliquidity conditions, the outstanding
amount of CDs rose from January 2009.The outstanding amount constituted 5.23per cent of aggregate deposits of CD-issuing banks with significant inter-bankvariation as on March 13, 2009. Theweighted average discount rate (WADR)of CDs generally increased up toNovember 2008 but declined thereafter inconsonance with the movements in othermoney market rates (Table 49).
Commercial Paper
V.37 The outstanding amount ofcommercial paper (CP) issued by
Table 49: Activity in Money Market Segments(Rupees crore)
Year/ Month Average Daily Volume (One Leg) Commercial Paper Certificates of Deposit
Call Repo Collateralised Total Money Term Outstanding WADR Outstanding WADRMoney Market Borrowing (2+3+4) Market Money (Per (PerMarket (Outside and Rate* Market cent) cent)
the Lending (PerLAF) Obligation cent)
(CBLO)
1 2 3 4 5 6 7 8 9 10 11
2006-07 10,863 8,419 16,195 35,477 6.57 506 21,329 + 8.08 + 64,821 + 8.24 +
2007-08 10,697 13,684 27,813 52,194 5.48 352 33,813 + 9.20 + 1,17,186 + 8.94 +
2008-09 P 11,218 14,330 30,776 56,323 6.43 397 47,312 + 10.57 + 1,61,257 + 9.39 +
Apr 2008 9,758 14,966 38,828 63,552 5.31 374 37,584 8.85 1,50,865 8.49
May 2008 9,740 14,729 36,326 60,795 6.29 420 42,032 9.02 1,56,780 8.95
Jun 2008 10,854 11,262 35,774 57,890 7.35 253 46,847 10.03 1,63,143 9.16
Jul 2008 12,368 8,591 23,669 44,628 8.09 226 51,569 10.95 1,64,892 10.23
Aug 2008 11,704 10,454 22,110 44,268 8.65 501 55,036 11.48 1,71,966 10.98
Sep 2008 11,690 10,654 20,547 42,891 9.26 335 52,038 12.28 1,75,522 11.56
Oct 2008 14,497 9,591 16,818 40,906 8.66 345 48,442 14.17 1,58,562 10.00
Nov 2008 10,906 15,191 24,379 50,476 6.58 319 44,487 12.42 1,51,493 10.36
Dec 2008 10,820 16,943 32,261 60,024 5.37 415 40,391 10.70 1,51,214 8.85
Jan 2009 9,248 18,053 31,794 59,095 3.99 454 51,668 9.48 1,64,979 7.33
Feb 2009 11,121 19,929 38,484 69,534 3.89 669 52,560 8.93 1,75,057 6.73
March 2009 P 11,909 21,593 48,319 81,821 3.76 451 49,953 9.78 # 1,67,320 6.73 #
– : Not available. * : Weighted average rate of the call, CBLO and market repo segments.+ : Fortnightly average for the year. Data for 2008-09 are up to mid-March 2009.# : Provisional data as on mid-March 2009. P : Provisional.WADR : Weighted Average Discount Rate.

76
Macroeconomic and Monetary Developments in 2008-09
Table 50: Commercial Paper - Major Issuers(Rupees crore)
Category of Issuer End of
March March June September December March2007 2008 2008 2008 2008 15, 2009
1 2 3 4 5 6
Leasing and Finance 12,594 24,925 34,957 39,053 27,965 31,528(70.5) (76.5) (76.6) (75.0) (73.5) (63.1)
Manufacturing 2,754 5,687 8,150 9,925 6,833 13,925
(15.4) (17.4) (17.4) (19.1) (18.0) (27.9)
Financial Institutions 2,515 1,980 3,740 3,060 3,257 4,500
(14.1) (6.1) (8.0) (5.9) (8.5) (9.0)
Total 17,863 32,592 46,847 52,038 38,055 49,953(100.0) (100.0) (100.0) (100) (100) (100)
Note : Figures in parentheses are percentage shares in the total outstanding.
corporates, which had increased graduallyduring April-August 2008-09, declinedthereafter till December 2008, mainlyreflecting tight liquidity conditions andgeneral risk-aversion. Subsequently, theoutstanding amount of CPs picked up, asliquidity conditions eased. Leasing andfinance companies continued to be themajor issuers of CPs, accounting for 63.1per cent of total outstanding as of March15, 2009 (Table 50). The WADR of CPsincreased steadily up to October 2008, andgenerally declined subsequently up to mid-March 2009, with the easing of liquidityconditions (refer Table 49). Thedifferential in the WADR of CP vis-a-visCD, however, continues to remain elevatedsince October 2008.
Treasury Bills
V.38 The notified amounts for 91-day,182-day and 364-day Treasury Bills(excluding MSS) were raised during the
course of the year to finance the temporarycash mismatch, inter alia, arising from theexpenditure on the Agricultural DebtWaiver Scheme. Thus, an additional amountof Rs.1,87,500 crore (Rs.97,000 crore, net)was raised over and above the notifiedamount during the year. During 2008-09,primary market yields on 91-day TreasuryBills increased steadily from 6.94 per centon April 2, 2008 (first auction of the year2008-09) and peaked at 9.36 per cent onJuly 30, 2008, reflecting tight liquidityconditions in response to measures takento combat inflation such as hike in CRRand repo rate. It started declining thereafter,responding to various measures taken toease liquidity and stimulate the economyamidst global recessionary trends. Yieldson 91-day Treasury Bills declined sharplyin December 2008 and were lowest at 4.58per cent on January 14, 2009 and March12, 2009 (Table 51 and Chart 27). Similartrend was observed in yields on 182-day

Financial Markets
77
and 364-day Treasury Bills. The yield spreadbetween 364-day and 91-day Treasury Bills
was 48 basis points during March 2009 (8.9basis points in March 2008).
Table 51: Treasury Bills in the Primary Market
Year/Month Notified Average Implicit Yield at Average Bid-Cover RatioAmount Minimum Cut-off Price
(Rupees crore) (Per cent)
91-day 182-day 364-day 91-day 182-day 364-day
1 2 3 4 5 6 7 8
2007-08 2,24,500@ 7.10 7.40 7.42 2.84 2.79 3.212008-09 2,99,000@ 7.10 7.22 7.15 3.43 2.91 3.47
Apr 2008 22,000 7.28 7.41 7.53 1.70 1.36 2.36
May 2008 21,000 7.41 7.55 7.61 2.65 2.78 3.05
Jun 2008 11,500 8.01 8.42 7.93 2.00 2.76 2.80
Jul 2008 16,000 9.07 9.33 9.39 2.35 2.72 2.70
Aug 2008 23,500 9.15 9.31 9.24 2.99 2.86 4.35
Sept 2008 25,000 8.69 8.92 8.83 3.06 3.04 3.57
Oct 2008 35,000 8.13 8.36 7.92 1.95 2.42 4.00
Nov 2008 28,000 7.30 7.13 7.23 7.95 2.97 4.33
Dec 2008 16,500 5.69 5.35 5.07 5.36 4.67 5.14
Jan 2009 38,500 4.69 4.60 4.64 4.56 3.22 4.80
Feb 2009 32,000 4.78 4.71 4.62 2.81 1.86 2.62
March 2009 25,000 4.77 4.86 5.25 2.10 2.67 1.44
@ : Total for the financial year.Note : Notified amounts are inclusive of issuances under the MSS.

78
Macroeconomic and Monetary Developments in 2008-09
Foreign Exchange Market
V.39 During 2008-09, the rupeedepreciated on account of widened tradedeficit, capital outflows and strengtheningof the US dollar vis-à-vis other majorcurrencies. The rupee/US dollar exchangerate was Rs. 39.99 per dollar at end-March2008. It fell to Rs. 52.09 per dollar on March5, 2009, before recovering to Rs. 50.95 perdollar at end-March 2009. As on March 31,2009, the Indian rupee had depreciated by21.5 per cent against the US dollar over itslevel on March 31, 2008. Over the sameperiod, the rupee experienced a depreciationof 6.5 per cent against the euro, 22.8 per centagainst the Japanese yen and 23.6 per centagainst the Chinese yuan. However, therupee showed an appreciation of 9.1 per centagainst the pound sterling. The rupee/USdollar exchange rate was 49.90 on April 15,2009. As on April 15, 2009, the rupee hadgenerally appreciated against the US dollar,the euro and the Japanese yen butdepreciated against the pound sterling overthe end-March 2009 level (Chart 28).
V.40 It is also useful to look at the indicesof NEER and REER, which are often usedas indicators of external competitivenessover a period of time. REER capturesmovements in cross-currency exchangerates as well as inflation differentialbetween India and its major trading partnersover time. The average 6-currency trade-based REER (base: 1993-94=100) was114.09 in 2007-08, indicating anovervaluation of 14.1 per cent in real terms.There was a reduction in the extent ofovervaluation during the first half of 2008-09 and the REER has moved closer to itsbase level (1993-94=100), especially sinceDecember 2008 (Chart 29). The 6-currencytrade-based REER which stood at 112.16in April 2008, indicating an overvaluationof 12.2 per cent, gradually declined to100.07 in February 2009 mainly on accountof significant depreciation of the rupeeagainst the US dollar and against othermajor currencies like the euro, the Japaneseyen and the Chinese yuan during 2008-09.The sharp decline in inflation rate in India

Financial Markets
79
in the recent months has also contributedtowards the correction in the extent of theovervaluation of the rupee. Over the sameperiod, the 6-currency NEER declinedgradually from 70.63 in April 2008 to 62.75in February 2009 (Table 52).
V.41 The 36-currency trade-weightedNEER and REER depreciated by 5.3 percent and 10.7 per cent, respectively,between March 2008 and February 2009(as against an appreciation of 6.9 per centand 3.0 per cent, respectively, during the
Base : 1993-94 (April-March) = 100
6-CurrencyWeights
36-CurrencyWeights
Year/Month
NEER REER NEER REER
1 2 3 4 5
Base : 1993-94 (April-March) = 100
6-CurrencyWeights
36-CurrencyWeights
Year/Month
NEER REER NEER REER
1 2 3 4 5
Table 52: Nominal and Real Effective Exchange Rate of the Indian Rupee(Trade-based Weights)
2007-08 (P) 74.17 114.09 93.91 104.81Apr 2008 (P) 70.63 112.16 93.26 101.86May 2008 (P) 67.48 108.23 89.04 97.72Jun 2008 (P) 66.38 108.20 87.65 97.76July 2008(P) 65.83 107.94 87.04 97.40Aug 2008(P) 67.22 111.30 88.60 99.65
Sep. 2008(P) 64.37 106.96 85.42 95.97Oct 2008(P) 62.08 102.36 83.23 92.29Nov 2008(P) 63.06 102.80 84.69 92.54Dec 2008(P) 62.12 100.18 83.91 90.40Jan 2009(P) 62.28 100.06 83.63 90.01Feb 2009(P) 62.75 100.07 85.20 91.07
Movement of Average Exchange Rate – Per cent change
2007-08 2007-08 (April-Feb) 2008-09 (April-Feb)36-currency trade-based REER 6.4 6.9 -9.436-currency trade-based NEER 9.3 9.9 -8.26-Currency trade-based REER 8.1 8.5 -7.86-Currency trade-based NEER 6.7 7.3 -12.9
Memo:Rupees/ US dollar Exchange Rate 12.5 -12.4*
NEER : Nominal Effective Exchange Rate. REER : Real Effective Exchange Rate. P : Provisional.* : Average for April-March.Note : Rise in indices indicates appreciation of the rupee and vice versa.

80
Macroeconomic and Monetary Developments in 2008-09
corresponding period of the previousyear).
V.42 During 2008-09, forward premiashowed significant variation reflecting theunderlying supply and demand conditions.As on March 31, 2009, the one month,three month and six month premia were at4.71 per cent, 3.34 per cent and 2.78 percent, respectively. As on April 9, 2009, theone month, three month and six month
premia were 3.85 per cent, 3.29 per centand 2.76 per cent, respectively (Chart 30).
V.43 The daily average turnover in theforeign exchange market was lower atUS$ 47.8 billion during April-February2008-09 as compared with US$ 47.4billion during the corresponding period ofthe previous year. The ratio of inter-bankto merchant turnover increased to 2.7 from2.4 during this period (Chart 31).

Financial Markets
81
Credit Market
V.44 Bank deposit and lending rates,which had firmed up during 2008-09 upto October 2008, started easing fromNovember 2008, reflecting measurestaken by the Reserve Bank. Interestrates offered by public sector banks(PSBs) on deposits of maturity of oneyear to three years were in the range of
8.00-9.25 per cent in March 2009 ascompared with the range of 8.50-10.75per cent in December 2008, while thoseon deposits of maturity of over threeyears were in the range of 7.50-9.00 percent as compared with the range of8.50-9.75 per cent during the sameperiod (Table 53). Similarly, the rangeof interest rates offered by private sector
Table 53: Deposit and Lending Rates(Per cent)
Item March March September December March2007 2008 2008 2008 2009
1 2 3 4 5 6
1. Domestic Deposit Rate
Public Sector BanksUp to 1 year 2.75-8.75 2.75-8.50 2.75-10.25 2.75-10.25 2.75-8.25More than 1 year and up to 3 years 7.25-9.50 8.25-9.25 8.75-10.25 8.50-10.75 8.00-9.25More than 3 years 7.50-9.50 8.00-9.00 8.50-9.75 8.50-9.75 7.50-9.00
Private Sector BanksUp to 1 year 3.00-9.00 2.50-9.25 3.00-9.75 3.00-10.00 3.00-8.75More than 1 year and up to 3 years 6.75-9.75 7.25-9.25 8.30-10.50 9.00-11.00 7.50-10.25More than 3 years 7.75-9.60 7.25-9.75 8.25-10.25 8.50-11.00 7.50-9.75
Foreign BanksUp to 1 year 3.00-9.50 2.25-9.25 3.50-9.75 3.50-9.75 2.50-8.50More than 1 year and up to 3 years 3.50-9.50 3.50-9.75 3.50-10.50 3.50-11.25 2.50-9.50More than 3 years 4.05-9.50 3.60-9.50 3.60-11.00 3.60.11.00 2.50-10.00
2. Benchmark Prime Lending RatePublic Sector Banks 12.25-12.75 12.25-13.50 13.75-14.75 12.50-14.00 11.50-14.00Private Sector Banks 12.00-16.50 13.00-16.50 13.75-17.75 13.00-17.25 12.75-16.75Foreign Banks 10.00-15.50 10.00-15.50 10.00-16.00 10.00-17.00 10.00-17.00
3. Actual Lending Rate*Public Sector Banks 4.00-17.00 4.00-17.75 6.00-18.75 5.25-18.00 –Private Sector Banks 3.15-25.50 4.00-24.00 5.06-23.00 5.06-30.00 –Foreign Banks 5.00-26.50 5.00-28.00 5.00-25.50 5.00-26.00 –
4. Weighted Average Lending Rate**Public Sector Banks 11.81 12.15 # – – –Private Sector Banks 11.91 12.67 # – – –Foreign Banks 13.03 12.94 # – – –
– : Not available. # : Provisional.* : Interest rate on non-export demand and term loans above Rs.2 lakh excluding lending rates at the extreme five per cent
on both sides.** : Data based on the accounts with credit limit of over Rs.2 lakh and is exclusive of inland and foreign bills purchased and
discounted. Oustanding amounts are used as weights for calculating average lending rates.

82
Macroeconomic and Monetary Developments in 2008-09
banks and foreign banks on deposits ofvarying maturity declined in March 2009as compared with the range in December2008. Notably, the administered interestrates on most small savings instrumentshave remained unchanged since March2003.
V.45 The benchmark prime lendingrates (BPLRs) of PSBs and private sectorbanks declined from the range of 12.50-14.00 per cent and 13.00-17.25,respectively, in December 2008 to therange of 11.50-14.00 per cent and 12.75-16.75 per cent, respectively, in March2009 (Chart 32). The range of BPLRs offoreign banks remained unchanged at10.00-17.00 per cent during the sameperiod. The weighted average BPLR ofPSBs and private sector banks decreasedfrom 14.00 per cent and 16.48 per cent,respectively, in October 2008 to 12.48 percent and 16.03 per cent, respectively, inMarch 2009. The weighted average BPLRof foreign banks decreased marginally
from 15.32 to15.07 per cent during thesame period.
V.46 The share of sub-BPLR lending(excluding export credit and small loans)for PSBs decreased to 68.0 per cent inDecember 2008 from 70.6 per cent inMarch 2008. The sub-BPLR lending ofprivate sector banks, at 87.9 per cent,decreased from the March 2008 level of88.7 per cent. The sub-BPLR lending offoreign banks, however, declinedsignificantly from the high of 77.6 per centin March 2008 to 61.3 per cent inDecember 2008. Together, the share ofsub-BPLR lending for all SCBs (excludingexport credit and small loans) declinedfrom 75.9 per cent in March 2008 to 71.5per cent in December 2008. At thedisaggregated level, the major share ofsub-BPLR lending of PSBs was for longertenure term loans (above 5 years), whereasfor the private sector banks and foreignbanks, the major share of sub-BPLR loanswas for consumer credit.

Financial Markets
83
Government Securities Market
Central Government Securities
V.47 The financial year 2008-09 wascharacterised by a significantly higher levelof Central Government market borrowingthan budgeted earlier (as detailed in ChapterII), particularly during the second half ofthe year, in order to finance the expandingfiscal deficit in the wake of fiscal stimulusmeasures and various other committedexpenditure of the Government. During thefirst six months of 2008-09, all issuancesof dated securities were in accordance withthe issuance calendar for the first half ofthe year, except on two occasions (Table 54).On the other hand, for the second half ofthe year, apart from the scheduled issuancecalendar for dated securities released onSeptember 26, 2008 in consultation withthe Government of India, three additionalindicative calendars were issued onDecember 5, 2008, January 6, 2009 andFebruary 10, 2009. The Government ofIndia raised Rs.1,16,000 crore to meet theadditional expenditure approved by theParliament by way of two supplementarydemands for grants and various stimuluspackages.
V.48 Furthermore, the MoU on the MSSsigned between the Government of Indiaand the Reserve Bank, in March 2004, wasamended on February 26, 2009 to enablethe Government and the Reserve Bank tode-sequester MSS cash balance forfinancing the Government’s approvedexpenditure. Accordingly, it was decided totransfer an amount of Rs.45,000 crore, ininstallments, from the MSS cash account
to the normal cash account of Governmentof India by March 31, 2009. An equivalentamount of government securities was toaccordingly form part of the normalborrowing of the Government. In thisregard, an amount of Rs.12,000 crore wastransferred from the MSS cash account tothe normal cash account of theGovernment of India on March 4, 2009.Inclusive of this amount, gross and netmarket borrowings (dated securities and364-day Treasury Bills) of the CentralGovernment during 2008-09 amounted toRs.3,18,550 crore and Rs.2,42,316 crore,respectively, accounting for 93 per centand 91 per cent of the revised marketborrowings for the year, respectively. Inview of the comfortable cash position, theGovernment of India, in consultation withthe Reserve Bank, decided not to effectthe transfer of the balance amount ofRs.33,000 crore in 2008-09. Based on thefund requirements of the Government, thebalance amount would be de-sequesteredagainst the approved market borrowing for2009-10 or the MSS securities would bebought back in 2009-10. The MSSoutstanding as on March 31, 2009 wasRs.88,773 crore.
V.49 Despite the significantly enhancedlevel, the market borrowing programmewas managed smoothly by undertaking thefollowing measures: (i) synchronisingOMO (purchase of government securities)with issuances of dated securities under themarket borrowing calendar, (ii) creatingfiscal space by way of buyback of securitiesissued under the MSS, (ii) amending theMoU on MSS in February 2009, allowing

84
Macroeconomic and Monetary Developments in 2008-09
Table 54: Central Government Dated Securities Issued during 2008-09
(Amount in Rupees crore/Maturity in years/Yield in per cent)
Borrowings as per Auction Calendar Actual Borrowings
Sr. Period of auction Amount Residual Maturity Date of Auction Amount Residual YieldNo. Maturity
1 2 3 4 5 6 7 8
1. April 04 - 11, 2008 6,000 5-9 year April 11, 2008 6,000 7.38 8.14
4,000 20- year and above 4,000 24.37 8.67
2. April 18 - 25, 2008 6,000 10-14 year April 21, 2008 6,000 10.00 8.24
4,000 20- year and above 4,000 28.13 8.77
3. May 2-9, 2008 6,000 5-9 year May 9,2008 6,000 7.92 7.96
4,000 20-year and above 4,000 24.29 8.35
4. May 16-23, 2008 6,000 10-14 year May 23, 2008 6,000 9.91 8.07
4,000 20-year and above 4,000 23.72 8.52
5. May 30- June 6, 2008 6,000 10-14 year June 6, 2008 6,000 9.87 8.26
4,000 20 year and above 4,000 24.22 8.72
6. June 13 - 20, 2008 6,000 15-19 year security June 20,2008 6,000 18.64 9.25
7. July 4-11, 2008 6,000 10-14 year July 4, 2008 6,000 9.79 9.13
4,000 20 year and above 4,000 23.60 10.02
8. July 18-25,2008 6,000 15-19 year July 24,2008 6,000 9.74 9.08
9. August 1-8, 2008 6,000 10-14 year August 8, 2008 6,000 9.70 9.14
4,000 20 year and above 4,000 24.05 9.88
10. August 14-22, 2008 6,000 15-19 year August 22, 2008 6,000 18.47 9.86
11. September 5-12, 2008 5,000 10-14 year September 12, 2008 5,000 9.60 8.30
3,000 20-year and above 3,000 23.95 8.70
September 26,2008 6,000 12.65 9.04
4,000 23.38 9.26
12. October 3-10, 2008 6,000 5-9 year Auction Cancelled – – –
4,000 20-year and above Auction Cancelled – – –
13. October 17-24, 2008 6,000 10-14 year Auction Cancelled – – –
4,000 20-year and above Auction Cancelled – – –
14. October 31-November 7, 2008 6,000 5-9 year October 31 , 2008 6,000 6.00 7.56
4,000 20-year and above 4,000 23.82 8.08
November 7,2008 6,000 9.45 7.73
4,000 23.26 8.44
15. November 14-21, 2008 6,000 5-9 year November 14,2008 6,000 5.96 7.38
4,000 23.78 8.21
November 21,2008 6,000 5.94 7.16
3,000 12.50 7.42
(Contd...)

Financial Markets
85
Table 54: Central Government Dated Securities Issued during 2008-09 (Concld.)
(Amount in Rupees crore/Maturity in years/Yield in per cent)
Borrowings as per Auction Calendar Actual Borrowings
Sr. Period of auction Amount Residual Maturity Date of Auction Amount Residual YieldNo. Maturity
1 2 3 4 5 6 7 8
16. December 5-12, 2008 3,000 10-14 year Preponed to
November 21, 2008 – – –
6,000 5-9 year December 12, 2008 6,000 4.72 6.24
4,000 20-year and above 4,000 25.65 6.98
17. January 2-9, 2009 6,000 5-9 year January 2, 2009 6,000 8.65 5.73
4,000 20-year and above 4,000 26.68 6.53
18. January 5-9, 2009 7,000 5-9 year January 9, 2009 7,000 7.25 6.70
4,000 15-19 year 4,000 14.24 7.35
4,000 20-year and above 4,000 25.58 7.60
19. January 12-16, 2009 6,000 5-9 year January 16, 2009 4,000 5.79 5.5
4,000 20-year and above 3,000 30.00 6.83
3,000 9.26 5.45
20. January 23-30, 2009 6,000 10-14 year January 30, 2009 3,000 5.75 6.02
4,000 20-year and above 4,000 10.00 6.05
21. February 6-9, 2009 5,000 5-9 year 3,000 29.96 7.35
2,000 15-19 year February 6, 2009 5,000 8.55 6.83
22. February 13-20, 2009 6,000 10-14 year 2,000 14.17 7.15
2,000 20-year and above February 13, 2009 6,000 9.96 5.94
23. February 20-27, 2009 6,000-7,000 2,000 29.23 7.37
2,000-3,000 February 24, 2009 7,000 8.51 6.98
2,000-3,000 3,000 13.22 7.50
24. February28-March 6, 2009 6,000-7,000 2,000 25.46 7.75
2,000-3,000 March 6, 2009 8,000 9.90 6.50
2,000-3,000 2,000 15.93 7.75
25. March 6-March 13, 2009 6,000-7,000 2,000 29.86 7.90
2,000-3,000 March 20, 2009 4,000 4.92 6.60
2,000-3,000 6,000 9.86 6.59
26. March 13-March 20, 2009 6,000-7,000 March 26,2009 5,000 4.43 6.77
2,000-3,000 7,000 9.84 6.97
2,000-3,000
Note : 1. Issuances on December 12, 2008 and January 2, 2009 were as per calendar issued on December 5, 2008.
2. Issuances from January 12, 2009 to February 13, 2009 were as per calendar issued on January 6, 2009.
3. Issuances from February 24, 2009 to March 26, 2009 were as per calendar issued on February 10, 2009.

86
Macroeconomic and Monetary Developments in 2008-09
Table 55: Issuances of CentralGovernment Dated Securities
2007-08 2008-09
1 2 3
Number of Issuances Re Issue 34 52 New Issues 1 4Bid-cover Ratio (Range) 1.58-4.76 1.22-4.51Weighted Average Maturity (years) 14.9 13.8 Yield (per cent) 8.12 7.69Devolvement on PDs(Rupees crore) 957 10,773
transfer from the MSS cash account to thenormal cash account of the Government ofIndia for financing of fiscal defict, and (iv)purchase of government securities onNDS-OM platform. All auctions during2008-09 were for reissuance of existingsecurities, barring four new issues. Thebid-cover ratio during 2008-09 wascomparable with that of 2007-08. Thedevolvement on primary dealers (PDs) washigher in 2008-09 as compared with theprevious year. The weighted averagematurity and weighted average yield,both declined during 2008-09 (Table 55).
State Government Securities
V.50 The net allocation for the marketborrowings of the State Governmentsduring 2008-09 was placed at Rs.51,719crore. Taking into account repayment ofRs.14,371 crore and additional allocationof Rs.62,990 crore (of which Rs.19,768crore was on account of shortfall in NSSFcollection and Rs.28,896 crore was onaccount of second fiscal stimuluspackage), the gross allocation of marketborrowings was placed at Rs.1,29,081
crore for 2008-09 as compared withRs.80,570 crore during the previous year.Twenty six State Governments and theUnion Territory of Puducherry raised atotal amount of Rs.1,18,138 crore throughauctions (Table 56) with cut-off yields inthe range 5.80-9.90 per cent as comparedwith Rs.67,779 crore by 25 StateGovernments (cut-off yields in the range7.84-8.90 per cent) during the previousyear. The weighted average interest rateon market loans was lower at 7.85 per centduring 2008-09 as compared with 8.25 percent last year. The spreads of StateGovernment securities over the yields ofCentral Government securities ofcorresponding maturity ranged between21-236 basis points as compared with19-90 basis points during 2007-08.
Secondary Market
V.51 Yields in the government securitiesmarket hardened from April 2008 till thefirst fortnight of July 2008 on account ofthe heightened inflationary expectations inthe face of sharp increase in globalcommodity prices and concomitantmonetary policy responses – hikes in theCRR and the LAF repo rate. Thereafter,the government securities’ yields generallyeased till around mid-September 2008 asinflationary pressures abated. The yields,however, temporarily hardened aroundend-September 2008 as liquidityconditions tightened in the wake ofadverse developments in the internationalfinancial markets and advance taxoutflows. In line with the liquidityaugmenting measures taken by the

Financial Markets
87
Table 56: Market Borrowings of the State Governments/U.T.s - 2008-09
Item Date Cut-off Yield Tenor Amount Raised(Per cent) (Years) (Rupees crore)
1 2 3 4 5
Auction
i. First April 4, 2008 8.50-8.60 10 2,648
ii. Second May 27, 2008 8.39-8.68 10 3,264
iii. Third June 27, 2008 9.38-9.59 10 2,300
iv. Fourth July 10, 2008 9.81 10 500
v. Fifth August 31,2008 9.86-9.90 10 2,100
vi. Sixth August 26,2008 9.30-9.44 10 2,060
vii. Seventh September 9, 2008 8.80 10 1,800
viii. Eighth September 25, 2008 8.81-8.88 10 1,212
ix. Ninth October 7,2008 8.50-8.89 10 2,012
x. Tenth October 22, 2008 7.97-8.11 10 4,300
xi Eleventh November 11, 2008 8.21-8.54 10 3,595
xii. Twelfth November 20, 2008 7.77-7.86 10 4,850
xiii. Thirteenth December 11, 2008 6.95-7.10 10 5,910
xiv. Fourteenth December 23, 2008 6.38-6.45 10 4,795
xv. Fifteenth January 6, 2009 5.80-6.10 10 5,702
xvi. Sixteeth January 13, 2009 6.65-6.73 10 5,795
xvii. Seventeenth January 22,2009 7.00-7.13 10 7001
xviii. Eighteenth February 5,2009 7.24-7.29 10 5149
xix. Nineteenth February 17,2009 7.40-7.50 10 8362
xx. Twentieth February 27,2009 7.55-7.93 10 13424
xxi. Twenty one March 9, 2009 8.16-8.89 10 14095
xxii. Twenty two March 17, 2009 8.40-8.59 10 12215
xxiii. Twenty three March 24, 2009 8.08-8.48 10 5048
Grand Total 1,18,138
Reserve Bank and the sharp decline in WPIinflation, the yields eased substantially tillend-December 2008. The 10-year yieldstood at 5.31 per cent as at end-December2008, as compared with 8.63 per cent asat end-September 2008 and 7.93 per centas at end-March 2008 (Chart 33).
V.52 Notwithstanding further reductionin the CRR and LAF rates in January 2009,market sentiment worsened in January andFebruary 2009, following the large andabrupt increase in the Government’s marketborrowing programme for 2008-09, at a
time when the system had excess SLRinvestment amounting to aroundRs.1,79,000 crore. The large marketborrowing requirement of the Governmentfor 2009-10 also weighed on the market.Subsequent to the announcement of theInterim Budget on February 16, 2009, evenas the Reserve Bank initiated a series ofauction-based purchases of governmentdated securities in addition to its purchasesthrough the NDS-OM, the 10-year yieldincreased to 6.02 per cent as at end-February 2009. The yields continued to

88
Macroeconomic and Monetary Developments in 2008-09
harden in early March 2009 despite afurther cut in the LAF interest rateseffective March 5, 2009. The benchmark10-year paper (6.05 per cent governmentsecurity 2019), however, dropped sharplyby 40 basis points (from the closing levelof March 12, 2009) to 7.07 per centfollowing the rejection of all bids receivedfor sale of Government dated securities onMarch 13, 2009. The subsequentannouncement of enhanced amounts ofauction-based purchases of the governmentdated securities by the Reserve Bank onMarch 16 and 19, 2009, helped to improvemarket sentiments. The ten-year yield stoodat 7.01 per cent as at end-March 2009.
V.53 The government securities yieldcurve moved upwards and peaked by end-July 2008 during 2008-09 (Chart 33).Thereafter, it moved downwards till end-December 2008 but again firmed up overthe last quarter of 2008-09. The yield curveis kinked at the 5-year and 10-year yieldswhere trading is concentrated and is flat
beyond 15 years. As a sequel, the spreadbetween 10-year and 15-year yields was 71basis points as against the spread of 6 basispoints between the 15-year and 30-yearyields, as at end-March 2009.
V.54 The daily turnover in the CentralGovernment securities market averagedRs.6,935 crore during January-March 2009,which was around 4 per cent lower than thatin the preceding quarter (Chart 34).
V.55 During 2008-09, the yield on 5-yearAAA-rated corporate bonds, witnessed ahardening trend up to October 2008 andbegan to soften thereafter. The yield hasbeen inching up again since February 2009.The credit spread between the yields on 5-year AAA-rated bonds and 5-yeargovernment securities have been wider inthe second half of 2008-09 as comparedwith the first half (Chart 35). However, itnarrowed during the fourth quarter of 2008-09, the spread being 179 basis points onMarch 31, 2009 as compared to 312 basispoints on December 31, 2008.

Financial Markets
89
Equity Market
Primary Market
V.56 The primary market segment of thedomestic capital market witnessed amarginal increase during the fourth quarterof 2008-09. Cumulatively, resources raisedthrough public issues declined sharply toRs.14,671 crore during 2008-09 fromRs.83,707 crore during 2007-08. The
number of issues also declined considerablyfrom 119 to 45 (Table 57). Out of the 45issues during 2008-09, 21 were initialpublic offerings (IPOs) issued by privatesector companies, constituting 13.9 per centof total resource mobilisation. Furthermore,all the issues during 2008-09 were equityissues by private non-financial companiesexcept two by private financial companies.The average size of public issues declined

90
Macroeconomic and Monetary Developments in 2008-09
from Rs.703.4 crore during 2007-08 toRs.326.0 crore during 2008-09.
V.57 Mobilisation of resources throughprivate placement declined by 25.1 percent during April-December 2008 (theperiod for which the latest data areavailable) as against an increase of 35.2per cent during April-December 2007(refer Table 57). Public sector entities
accounted for 58.4 per cent of totalmobilisation as compared with 37.2 percent during the corresponding period ofthe previous year. Resource mobilisationthrough financial intermediaries (bothfrom public and private sector) registereda decline of 40.5 per cent over thecorresponding period of last year andaccounted for 54.4 per cent of the totalmobilisation during April-December 2008.
Table 57: Mobilisation of Resources from the Primary Market(Amount in Rupees crore)
Item No. of Issues Amount No. of Issues Amount
1 2 3 4 5
2007-08 2008-09 P
A. Prospectus and Rights Issues*
1. Private Sector (a+b) 115 63,638 45 14.671a) Financial 11 14,676 2 466
b) Non-financial 104 48,962 43 14,205
2. Public Sector (a+b+c) 4 20,069 – –
a) Public Sector Undertakings – – – –
b) Government Companies 2 2,516 – –
c) Banks/Financial Institutions 2 17,553 – –
3. Total (1+2) 119 83,707 45 14,671
of which:
(i) Equity 116 82,398 45 14,671
(ii) Debt 3 1,309 – –
April-December 2007 April-December 2008
B. Private Placement
1. Private Sector (a+b) 1,245 94,139 522 46,687a) Financial 693 63,916 235 26,265
b) Non-financial 552 30,223 287 20,422
2. Public Sector (a+b) 117 55,817 130 65,605a) Financial 80 38,621 62 34,773
b) Non-financial 37 17,196 68 30,832
3. Total (1+2) 1,362 1,49,956 652 1,12,292of which:
(i) Equity – – 1 114
(ii) Debt 1,362 1,49,956 651 1,12,178
C. Euro Issues 26 26,556 13 4,788
P : Provisional. * : Excluding offers for sale. – : Nil/Negligible.

Financial Markets
91
However, resources raised by non-financialintermediaries registered an increase of 8.1per cent (45.7 per cent of total resourcemobilisation) during April-December2008 over the corresponding period of theprevious year.
V.58 During 2008-09, resources raisedthrough Euro issues – American DepositoryReceipts (ADRs) and Global DepositoryReceipts (GDRs) – by Indian corporatesdeclined significantly by 82.0 per cent toRs.4,788 crore as compared with thecorresponding period of the previous year.All the Euro issues during the financial yearwere GDR issues.
V.59 During 2008-09, net resourcemobilisation by mutual funds turnednegative; there was a net outflow ofRs.28,297 crore during the year as comparedto a net inflow of Rs.1,53,801 crore during2007-08 (Table 58). Scheme-wise, during2008-09, income/debt oriented schemeswitnessed a net outflow of Rs.32,161 crore,while growth/equity oriented schemes
registered a net inflow of Rs.4,024 crore.There were substantial outflows during themonths of June 2008 (Rs.39,233 crore),September 2008 (Rs.45,651 crore) andOctober 2008 (Rs.45,796 crore) due to theuncertain conditions in the stock marketsand redemption pressures from banks andcorporates on account of tight liquidityconditions prevailing at that time. TheReserve Bank then announced immediatemeasures to provide liquidity support tomutual funds through banks. With theeasing of overall liquidity conditions,investment in mutual funds again becameattractive. During November 2008 toFebruary 2009, net resource mobilisationby mutual funds turned positive. However,during March 2009 there was a net outflowof Rs.98,697 crore.
Secondary Market
V.60 The domestic stock markets, afterremaining weak and volatile duringJanuary-February 2009, witnessed gains
Table 58: Resource Mobilisation by Mutual Funds(Rupees crore)
Category 2007-08 2008-09
Net Net Net NetMobilisation Assets Mobilisation Assets
1 2 3 4 5
Private Sector 1,33,304 4,15,621 -34,018 3,35,527Public Sector * 20,497 89,531 5,721 81,772Total 1,53,801 5,05,152 -28,297 4,17,299
* : Including UTI Mutual fund.Note : 1. Data exclude funds mobilised under Fund of Funds Schemes.
2. Net Mobilisation is net of redemptions.3. Net Assets is for end-period.
Source : Securities and Exchange Board of India.

92
Macroeconomic and Monetary Developments in 2008-09
during March 2009. The losses during thefirst two months of 2009 were mainly dueto the downward trend in internationalequity markets on account of more thanexpected contraction of economic growthin the US, the UK, Japan and Chinapointing towards deepening of recession.Other factors that led to weak equitymarkets were heavy net sales by FIIs inthe Indian equity market, slowdown inindustrial and export growth, depreciationof the rupee against the US dollar, fall inADR prices, lower than expectedcorporate earnings in the third quarter of2008-09, revelations about financialirregularities in a particular informationtechnology company and other sector andstock specific news. In line with thebehaviour of equity markets across theworld, the Indian stock markets have beenshowing improvement since March 2009.The reasons for the improvement areannouncement of the details of US$ 1trillion public private investment program
by the US Treasury, some major US banksposting profits for the first two months of2009, extention of the deadline forbuyback of foreign currency convertiblebonds (FCCBs) by the Reserve Bank toDecember 31, 2009, domestic consumerdurable and capital goods outputincreasing by 2.5 per cent and 15.4 percent, respectively, in January 2009, lowerdomestic inflation rate, strengthening ofthe rupee against the US dollar and netpurchases by FIIs and mutual funds indomestic equity market. The BSE Sensexand the S&P CNX Nifty closed at 9709and 3021 at end-March 2009 registeringlosses of 37.9 per cent and 36.2 per cent,respectively, over end-March 2008(Chart 36). The BSE sensex closed at11,023 on April 17, 2009.
V.61 According to the data released bythe Securities and Exchange Board of India(SEBI), FIIs made net sales of Rs.48,249crore (US $ 12.0 billion) in the Indian equity

Financial Markets
93
Table 59: BSE Sectoral Stock Indices(Base: 1978-79=100)
Sector Variation (per cent)
End-March 2007 End-March 2008 End-March 2009
1 2 3 4
Fast Moving Consumer Goods -21.4 31.7 -11.1Public Sector Undertakings -3.2 25.4 -29.6Information Technology 21.6 -27.6 -35.6Auto -8.5 -7.1 -32.3Oil and Gas 30.5 56.0 -29.6Metal -4.3 65.2 -58.7Health Care -5.4 5.4 -26.5Bankex 24.2 18.0 -41.8Capital Goods 11.1 54.4 -53.8Consumer Durables 11.1 8.8 -58.1BSE 500 9.7 24.3 -42.8BSE Sensex 15.9 19.7 -37.9
Source : Bombay Stock Exchange Limited.
market during 2008-09 as against netpurchases of Rs.52,574 crore (US $ 12.7billion) during 2007-08 (Chart 37). Mutualfunds, on the other hand, made netpurchases of Rs.6,985 crore during2008-09 as compared with net purchasesof Rs.15,775 crore in the previous year.
V.62 The sectoral indices witnessedselling pressure across the board during2008-09 viz., metal, consumer durables,capital goods, banking, IT, oil and gas,auto, public sector undertakings,healthcare and fast moving consumergoods sector (Table 59).

94
Macroeconomic and Monetary Developments in 2008-09
Table 60: Stock Market IndicatorsIndicator BSE NSE
2007-08 2008-09 2007-08 2008-09
1 2 3 4 5
1. BSE Sensex / S&P CNX Nifty(i) End-period 15,644 9,709 4,735 3,021(ii) Average 16,569 12,366 4,897 3,731
2. Coefficient of Variation 13.7 24.2 14.4 23.2
3. Price-Earning Ratio (end-period)* 20.1 13.7 20.6 14.3
4. Price-Book Value Ratio (end-period)* 5.2 2.7 5.1 2.5
5. Yield* (per cent per annum)(end-period) 1.0 1.8 1.1 1.9
6. Listed Companies 4,887 4924 # 1,381 1425 #
7. Cash Segment Turnover(Rupees crore) 15,78,856 10,30,284 # 35,51,038 25,49,224 #
8. Derivative Segment 2,42,308 12,264 # 1,30,90,478 99,70,552 #
Turnover (Rupees crore)
9. Market Capitalisation(Rupees crore) @ 51,38,015 28,62,873 # 48,58,122 26,75,622 #
10. Market Capitalisation to GDPRatio (per cent) 108.8 52.8 102.9 49.3
* : Based on the 30 scrips included in the BSE Sensex and the 50 scrips included in the S&P CNX Nifty.@ : As at end-period.# : As at end-February 2009.Source : Bombay Stock Exchange Ltd. (BSE) and National Stock Exchange of India Ltd. (NSE).
V.63 In line with the downward trend instock prices, the price-earnings (P/E) ratiosof the 30 scrips included in the BSE Sensexdeclined from 20.1 at end-March 2008 to13.7 at end-March 2009. The marketcapitalisation of the BSE also declined by44.3 per cent between end-March 2008 andend-February 2009. The cash segmentturnover of BSE and NSE also declined by
30.2 per cent during April-February2008-09 over the corresponding period of2007-08. The turnover in the derivativesegment of BSE and NSE also declined by25.1 per cent during April-February 2008-09over the corresponding period of the previousyear. The volatility in the stock market,measured as coefficient of variation, however,increased during 2008-09 (Table 60).

Financial Markets
95
Annex 2: Policy Response of the Reserve Bank since mid-September 2008
Item Key Measures
1 2
Monetary • Cut in the repo rate under the LAF by a cumulative 400 basis points from 9.0Measures to 5.0 per cent since October 20, 2008.
• Cut in the reverse repo rate by a cumulative 250 basis points from 6.0 to 3.5per cent since December 8, 2008.
Rupee Liquidity/• Cut in the CRR by a cumulative 400 basis points of NDTL from 9.0 per centCredit Delivery to 5.0 per cent since October 11, 2008.
• Introduction of a special refinance facility under Section 17(3B) of theReserve Bank of India Act, 1934 under which all SCBs (excluding RRBs)are provided refinance from the Reserve Bank equivalent to up to 1.0 percent of each bank’s NDTL as on October 24, 2008 at the LAF repo rate upto a maximum period of 90 days. Banks are encouraged to use this facilityfor the purpose of extending finance to micro and small enterprises. Thefacility will continue up to September 30, 2009.
• Institution of a term repo facility for an amount of Rs.60,000 crore underthe LAF to enable banks to ease liquidity stress faced by mutual funds,NBFCs and housing finance companies (HFCs) with associated SLRexemption of 1.5 per cent of NDTL. This facility is available up to September30, 2009 (banks can avail of this facility either on an incremental or on arollover basis within their entitlement of up to 1.5 per cent of NDTL).
• Reduction in statutory liquidity ratio (SLR) by one percentage point from25 to 24 per cent of NDTL with effect from the fortnight beginning November8, 2008.
• Introduction of a mechanism to buyback dated securities issued under theMSS so as to provide another avenue for injecting liquidity of a more durablenature into the system.
• Extension of the period of entitlement of the first slab of pre-shipment andpost-shipment rupee export credit, by 90 days each, with effect fromNovember 15, 2008 and December 1, 2008, respectively.
• Increase in the eligible limit of the ECR facility for scheduled banks(excluding RRBs) from 15 per cent to 50 per cent of the outstanding exportcredit eligible for refinance at the prevailing repo rate under the LAF.
• Amounts allocated, in advance, from SCBs for contribution to the SIDBIand the NHB to the extent of Rs.2,000 crore and Rs.1,000 crore, respectively,against banks’ estimated shortfall in priority sector lending in March 2009.
• Reduction in the provisioning requirements for all types of standard assets(for residential housing loan beyond Rs.20 lakh, standard advances in thecommercial real estate sector, personal loans including outstanding credit cardreceivables, loans and advances qualifying as capital market exposure and
(Contd...)

96
Macroeconomic and Monetary Developments in 2008-09
Annex 2: Policy Response of the Reserve Bank since mid-September 2008 (Contd.)
Item Key Measures
1 2
(Contd...)
non-deposit taking systemically important NBFCs) to a uniform level of 0.40per cent except in case of direct advances to agricultural and SME sectorwhich shall continue to attract provisioning of 0.25 per cent, as hitherto.
• Downward revision of risk weights on banks’ exposures to certain sectors,which had been increased counter-cyclically earlier. All unrated claims oncorporates and claims secured by commercial real estate attract a uniformrisk weight of 100 per cent as against the risk weight of 150 per centprescribed earlier. Claims on rated as well as unrated non-deposit takingsystemically important non-banking financial companies (NBFC-ND-SI)are uniformly risk weighted at 100 per cent. As regards the claims on assetfinancing companies (AFCs), there is no change in the risk weights, whichcontinue to be governed by the credit rating of the AFCs, except the claimsthat attract a risk weight of 150 per cent under the new capital adequacyframework, reduced to a level of 100 per cent.
• In order to provide liquidity support to housing, export and MSE sectors,the Reserve Bank provided a refinance facility of Rs.4,000 crore to the NHB,Rs. 5,000 crore to the EXIM Bank and Rs. 7,000 core to the SIDBI up toMarch 2010.
• For more effective liquidity management, the Reserve Bank widened thescope of OMO by including purchases of government securities through anauction-based mechanism in addition to operations through NDS-OM.
Foreign • To continue selling foreign exchange (US dollars) through agent banksExchange to augment supply in the domestic foreign exchange market or interveneLiquidity directly to meet any demand-supply gaps.
• To institute special market operations to meet the foreign exchangerequirements of public sector oil marketing companies against oil bonds.
• The ceiling rate on export credit in foreign currency increased to LIBORplus 350 basis points subject to banks not levying any other charges.
• Authorised Dealer (AD) category - I banks allowed to borrow funds fromtheir head office, overseas branches and correspondents and overdrafts innostro accounts up to a limit of 50 per cent of their unimpaired Tier 1 capitalas at the close of the previous quarter or US$ 10 million, whichever washigher, as against the earlier limit of 25 per cent.
• As a temporary measure, HFCs registered with the NHB were allowed toraise short-term foreign currency borrowings under the approval route,subject to compliance with prudential norms laid down by the NHB.

Financial Markets
97
Annex 2: Policy Response of the Reserve Bank since mid-September 2008 (Concld.)
Item Key Measures
1 2
• A forex swap facility with tenure up to three months to Indian public andprivate sector banks having overseas operations in order to provide themflexibility in managing their short term funding requirements at their overseasoffices. The facility is available up to March 31, 2010.
• Cumulative increase in the interest rate ceilings on FCNR (B) and NR(E)RAterm deposits by 175 basis points each since September 16, 2008.
• Proposals from Indian companies to prematurely buyback their FCCBs tobe considered under the approval or automatic route, depending on the extentof discount of the FCCBs and the source of funds, subject to compliancewith certain stipulated conditions. (The buyback should be financed by thecompany’s foreign currency resources held in India or abroad and/or out offresh external commercial borrowing (ECB) raised in conformity with thecurrent norms for ECBs). Extension of FCCBs also to be permitted at thecurrent all-in-cost for the relative maturity.
ECB Norms • The all-in-cost ceiling for ECBs of average maturity period of three to fiveyears and of maturity period over five years was enhanced to 300 basispoints above LIBOR and 500 basis points above LIBOR, respectively. Theall-in-cost ceiling for trade credit less than three years was enhanced to 6-month LIBOR plus 200 basis points.
• ECBs up to US$ 500 million per borrower per financial year were permittedfor rupee/foreign currency expenditure for permissible end-uses under theautomatic route.
• The definition of infrastructure sector for availing ECB was expanded toinclude mining, exploration and refinery sectors. Payment for obtaininglicense/permit for 3G spectrum by telecom companies was classified aseligible end-use for the purpose of ECB.
• The requirement of minimum average maturity period of 7 years for ECBof more than US$ 100 million for rupee capital expenditure by the borrowersin infrastructure sector was dispensed with.
• Borrowers were granted the flexibility to keep their ECB proceeds offshoreor keep it with the overseas branches/subsidiaries of Indian banks abroad orto remit these funds to India for credit to their rupee accounts with ADcategory-I banks in India, pending utilisation for permissible end-uses.
• NBFCs exclusively involved in financing of the infrastructure sector werepermitted to avail of ECBs under the approval route from multilateral/regional financial institutions and Government-owned development financialinstitutions for on-lending to the borrowers in the infrastructure sector,subject to compliance with certain conditions.