V CONFERENCIA DE LA RED DE MONITOREO Y...
24
Minas Gerais Monitoring and Evaluation System Tadeu Barreto Guimarães V CONFERENCIA DE LA RED DE MONITOREO Y EVALUACIÓN (M&E) EN AMÉRICA LATINA Y EL CARIBE
Transcript of V CONFERENCIA DE LA RED DE MONITOREO Y...

Minas Gerais Monitoring and
Evaluation System
Tadeu Barreto Guimarães
V CONFERENCIA DE LA RED DE MONITOREO Y EVALUACIÓN (M&E) EN AMÉRICA LATINA Y EL CARIBE
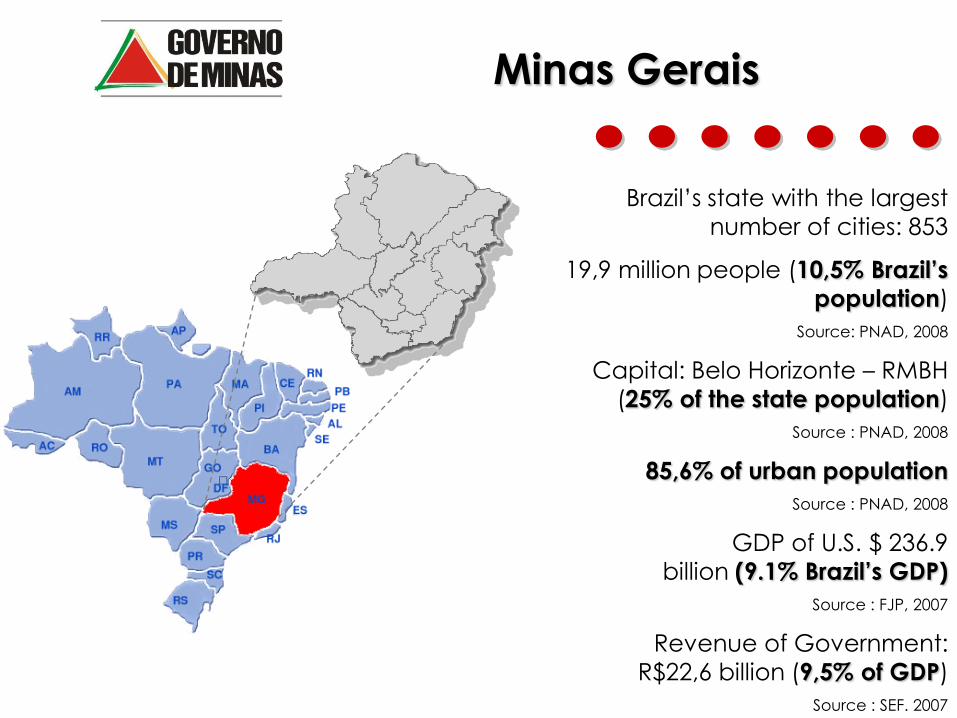
Minas Gerais
Brazil’s state with the largest
number of cities: 853
19,9 million people (10,5% Brazil’s
population)
Source: PNAD, 2008
Capital: Belo Horizonte – RMBH
(25% of the state population)
Source : PNAD, 2008
85,6% of urban population
Source : PNAD, 2008
GDP of U.S. $ 236.9
billion (9.1% Brazil’s GDP)
Source : FJP, 2007
Revenue of Government:
R$22,6 billion (9,5% of GDP)
Source : SEF. 2007

Choque de Gestão
Context
Deficit of R$2,4 billion in 2003
Action
Precarious
infrastructure and
public services
Difficulty in making
payments on time
Choque de Gestão
Planning
Government
Revitalization
Strategic Project Office
establishment - GERAES
ResultsPublic Sector Revitalization
Basis for results generation

State for Results Program
Fiscal Balance
Government Organization
and Strategic Projects
Choque de Gestão
Consolidation of Fiscal
Balance and Strategic
Projects Management
Results for Minas Gerais
citizens
2003-2006 2007-2010

BENEFICIARIES OF PUBLIC POLICIES
STATE FOR RESULTS
RESULTS AREAS
MINAS GERAIS: THE BEST STATE TO LIVE
PMDI: PLANO MINEIRO DE DESENVOLVIMENTO INTEGRADO – 2007/2023
Human capital
Integrated
Approach
Investiments and
Bussiness
Competitive
Territorial
Integration
Environmental
Sustentability
Equity and
WelfareCities Network
Quality in
Education
Youth
Protagonism
Healthy Life
Investment and Value
Added in Production
Innovation,
Technology and
Quality
Integration Logisticsc
and Development
Poverty Reduction
and Productive
Inclusion
Social Protection
Cities Network
and Services
Environmenatl
QualityDevelopment of the
North Region,
Jequitinhonha,
Mucuri e Rio Doce
QU
AL
ITY
AN
D I
NN
OV
AT
ION
IN P
UB
LIC
SE
CT
OR
MA
NA
GE
ME
NT
FIS
CA
L Q
UA
LIT
Y
EDUCATED,
QUALIFIED AND
HEALTHY
INDIVIDUALS
SAFETY AND
CONSERVATED
CITIES
INTERPERSONAL
AND REGIONAL
EQUITY
YOUNG
PROTAGONIST
DYNAMIC AND
INNOVATIVE
FIRMS
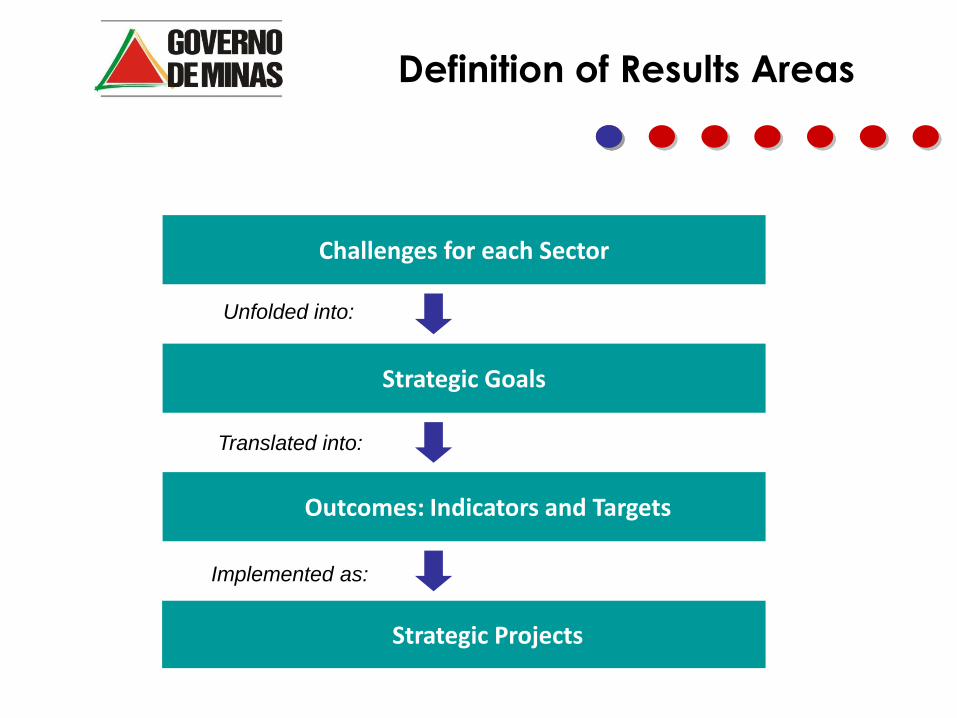
Definition of Results Areas
Strategic Projects
Unfolded into:
Translated into:
Implemented as:
Challenges for each Sector
Strategic Goals
Outcomes: Indicators and Targets

BENEFICIARIES OF PUBLIC POLICIES
STATE FOR RESULTS
RESULTS AREAS
MINAS GERAIS: THE BEST STATE TO LIVE
PMDI: PLANO MINEIRO DE DESENVOLVIMENTO INTEGRADO – 2007/2023
Human capital
Integrated
Approach
Investiments and
Bussiness
Competitive
Territorial
Integration
Environmental
Sustentability
Equity and
WelfareCities Network
Quality in
Education
Youth
Protagonism
Healthy Life
Investment and Value
Added in Production
Innovation,
Technology and
Quality
Integration Logisticsc
and Development
Poverty Reduction
and Productive
Inclusion
Social Protection
Cities Network
and Services
Environmenatl
QualityDevelopment of the
North Region,
Jequitinhonha,
Mucuri e Rio Doce
QU
AL
ITY
AN
D I
NN
OV
AT
ION
IN P
UB
LIC
SE
CT
OR
MA
NA
GE
ME
NT
FIS
CA
L Q
UA
LIT
Y
EDUCATED,
QUALIFIED AND
HEALTHY
INDIVIDUALS
SAFETY AND
CONSERVATED
CITIES
INTERPERSONAL
AND REGIONAL
EQUITY
YOUNG
PROTAGONIST
DYNAMIC AND
INNOVATIVE
FIRMS

Challenges and goalsO Estado está acima da média nacional e crescendo, mas
ainda abaixo do desejado
Média de desempenho em Língua Portuguesa – SAEB 2003 Média de desempenho em Língua Portuguesa – SAEB 2003
0
100
200
300
400
3º série/EM8ª série4ª série
Média de desempenho em Matemática – SAEB 2003Média de desempenho em Matemática – SAEB 2003
0
100
200
300
400
3º série/EM8ª série4ª série
Objetivos estratégicos
▪ Promover um salto na
escolaridade média da
população, formada em um
sistema eficiente, com altos
níveis de equidade e
orientado por padrões
internacionais de custo e
qualidade
▪ Reduzir as disparidades
regionais de aprendizado em
Minas Gerais
▪ Promover um salto de
qualidade no ensino,
orientado por padrões
internacionais
Objetivos estratégicosObjetivos estratégicos
▪ Promover um salto na
escolaridade média da
população, formada em um
sistema eficiente, com altos
níveis de equidade e
orientado por padrões
internacionais de custo e
qualidade
▪ Reduzir as disparidades
regionais de aprendizado em
Minas Gerais
▪ Promover um salto de
qualidade no ensino,
orientado por padrões
internacionais
Brasil
Sudeste
MG
Média mínima
satisfatória
Brasil
Sudeste
MG
Média mínima
satisfatória
Strategic Objectives:
• Increase the population
schooling average, formed
by an efficient system, with
high levels of equity and
guided by international
standards of cost and
quality
• Reduce regional learning
disparities in Minas.
• Increase the education
quality, guided by
international standards

Results and Projects
Deployed
Projects:
Full Time School
Teachers
Performance and
Qualification (PIP)
Education System
of Evaluation
New
Management
Standards
20,5%**/
34,9%
60,2%*/
46,9%*
Port / Mat
204,8 / 218,2
250,2 / 255,8
274 / 282,2
72,5%
2008
100%48,6%
10% / 20%25,6% / 41,8%
Port / Mat
225 / 225
266 / 275
312 / 325
Port / Mat
190 / 196,5
242,7 / 246,3
267,6 / 274,6
• 4ª série/ 5º ano do Ensino
Fundamental
• 8ª série / 9º ano do Ensino Fundamental
• 3ª ano do Ensino Médio
60,6% / 45,4%
Status PMDI
2006
80% / 70%
Goal
PMDI 2011
20,5%**/
34,9%
60,2%*/
46,9%*
Port / Mat
204,8 / 218,2
250,2 / 255,8
274 / 282,2
72,5%
Status
2008
100%48,6%
10% / 20%25,6% / 41,8%
Port / Mat
225 / 225
266 / 275
312 / 325
Port / Mat
190 / 196,5
242,7 / 246,3
267,6 / 274,6
• 4ª série/ 5º ano do Ensino
Fundamental
• 8ª série / 9º ano do Ensino Fundamental
• 3ª ano do Ensino Médio
60,6% / 45,4%
Status PMDI
2006
80% / 70%
PMDI 2011INDICATOR
Increase the percentage of students
of 3º year EF recommended reading
Increase state students learning
(PROEB)
Increase students graduation rate in
state schools - EF e EM(PROEB)
Reduce the rate distortion age in
state schools - EF e EM

M&E System
Priority Setting PolicymakingPolicy
Implementation
Policy’sMonitoring and
Evaluation
Indicators
Evaluations
What is this system?
Which is this system objective?
“Feedback”
Source: Adapted of Barkenbus (1998). Own elaboration.

Public Policy Cycle
Design Inputs Actions Outputs Outcomes

Planning
What are Government
objectives?
How do you want to
reach them?
Projects Design
Design Inputs Actions Outputs Outcomes
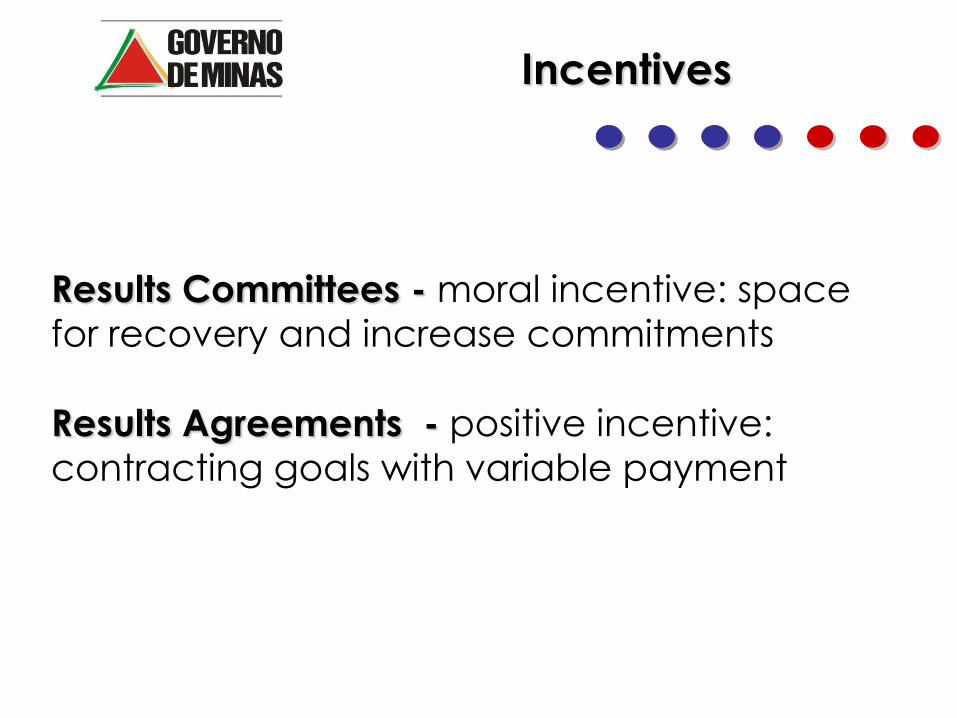
Incentives
Results Committees - moral incentive: space
for recovery and increase commitments
Results Agreements - positive incentive:
contracting goals with variable payment

Results Committee
J
Intensive monitoring of the
Strategic Projects.
Accompanying the
Sector Agenda.
Action Plan Forward

Strategy Developed in the
Results Agreements
Strategy
Deployed in
Results
Agreements
1st fase
Deployed in
Results
Agreements
2nd fase
Operational System
Work Teams
Governor
State Departments
Agencies
PRÊMIO
Goals by team
State Departments
Agencies

Institutions Aligning
Formal Pact
Results Agreements 1
Moral Pact
Appointments Book
FINAL RESULTS
STRATEGIC
PROJECTS
SECTOR AGENDA
OF THE
MANGEMENT SHOCK
INDICATORS OF PERFORMANCE
IMPROVEMENT AND
EXPEDITURE RATIONALIZATION

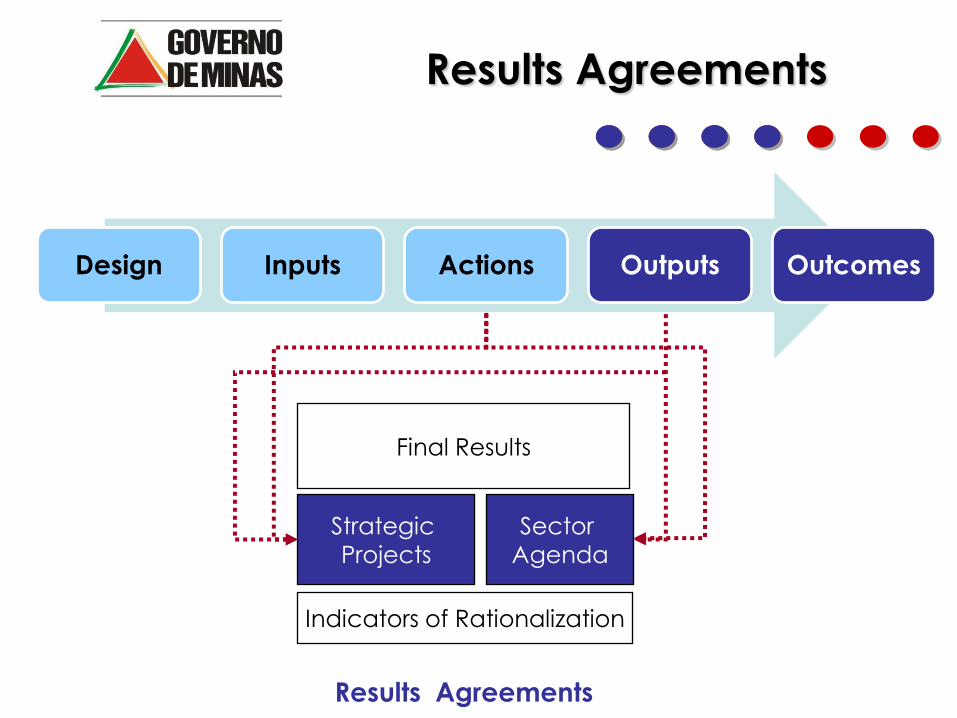
Results Agreements
Final Results
Strategic
Projects
Sector
Agenda
Indicators of Rationalization
Results Agreements
Design Inputs Actions Outputs Outcomes
Results Agreements
Final Results
Strategic
Projects
Sector
Agenda
Indicators of Rationalization
Results Agreements
Design Inputs Actions Outputs Outcomes

Results Agreements
Final Results
Results Agreements
Design Inputs Actions Outputs Outcomes
Strategic
Projects
Sector
Agenda
Indicators of Rationalization

Projects Monitoring
Physical monitoring of implementation tied to
financial performance: planned versus performed
Design Inputs Actions Outputs Outcomes
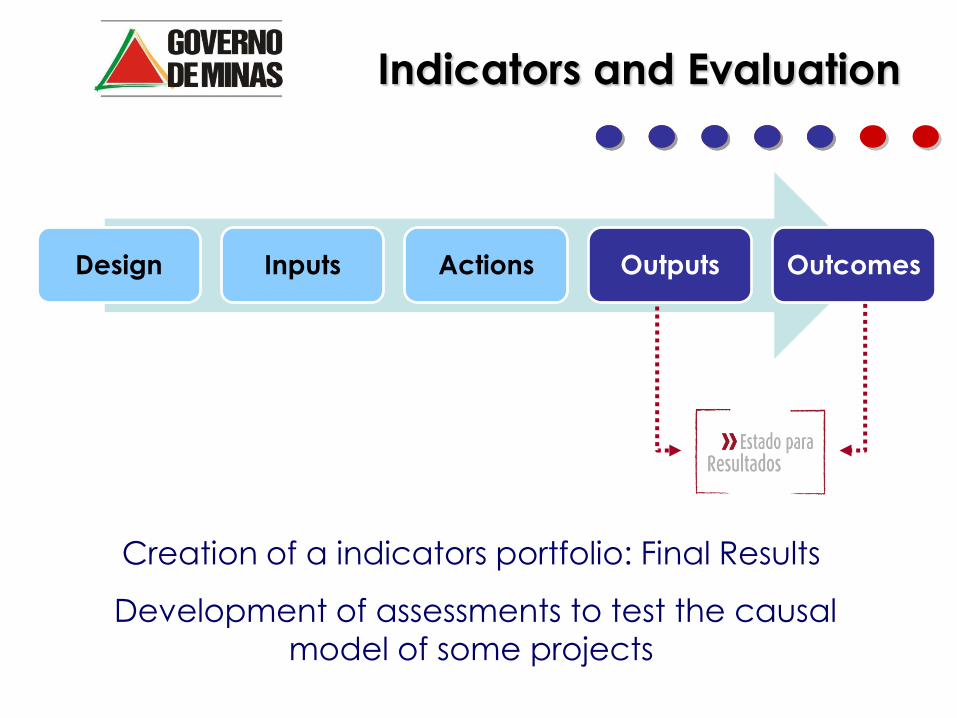
Indicators and Evaluation
Creation of a indicators portfolio: Final Results
Development of assessments to test the causal
model of some projects
Design Inputs Actions Outputs Outcomes

Indicators Book
Set of 104 indicators
monitored by State for Results
Program and annually
evalueted in Results
Agreements.

Feedback
Guidance for results / goals
mobilizing
Evaluation
Evaluation as
action induce
Public Value
added
All children's
reading and
writing to the 8
years of age

Future challenge
Tadeu Barreto
Create ways to consolidate an effective
management for results.