V,. -...
8
TIHl EFFECT OF ANEMIA ON THE ALVEOLAR-CAPILLARY EXCHANGE OF CARBON MONOXIDE IN MIAN * By J. RANKINt R. S. McNEILL t AND R. E. FORSTER § (From the Department of Physiology, Graduate School of Medicine, University of Pennsylvania, Philadelphia, Pa.) (Submitted for publication October 31, 1960; accepted March 30, 1961) Previous work has demonstrated that the ex- change of CO between alveolar gas and pulmo- nary capillary blood is at least partially limited by the rate at which it can combine reversibly with in- tracellular hemoglobin. The relative importance of the rate of gas diffusion across the pulmonary membrane and the rate of gas uptake by the red cells in determining the over-all rate of alveolar capillary gas exchange has been expressed by the relation (1): 1/DL = 1/Dm + 1/OVc [1] In this equation DL is the over-all diffusing ca- pacity of the lungs and Dm is that of the pulmo- nary membrane alone, both given in milliliters of gas per minute per millimeter Hg; V, is the aver- age volume of blood in the pulmonary- capillary bed and 9 is the rate at which 1 ml of this blood combines with CO in milliliters of gas reacting per minute per millimeter CO tension; 0 equals the product of the number of grams of hemoglobin per milliliter of blood and the gas uptake rate per gram of hemoglobin. By analogy, the movement of gas between the alveoli and the red cell interior may be compared with the flow of electricity through two resistances in series where 1/DL is the total resistance, 1/Dm is that of the membrane alone and 1/OV, is that of the average total mass of red cells in the pulmonary capillary bed at any instant; 9 decreases as capillary 02 tension rises, because 02 competes with CO for intracellular hemoglobin, in effect lowering the chemical reac- tion rate. By measuring DL at two or more dif- * This work was supported by a grant from the Life Insurance Medical Research Fund. It was presented as an abstract in J. clin. Invest. 1957, 36, 922. t Present address: Department of Medicine, Univ. of Wisconsin, Madison, Wis. t Present address: Department of Pharmacology and Therapeutics, Univ. of St. Andrew's Medical School, Dundee, Scotland. § Lowell NM. Palmer Senior Fellow. ferent capillary 02 tensions for which correspond- ing values of 9 are known, the data can be ob- tained for the solution of Equation 1 for both D1 and V,. When the concentration of red cells in the pul- monary capillary blood is decreased, without any remarkable changes in the gas uptake rate of the individual cell, 9 also decreases and the formula predicts that DL will decrease as well. In order to determine the physiological effects of anemia on gas exchange and also to confirm the validity of Equation 1, we have measured DL, D21, and V, in five patients with severe iron-deficiency anemia without significant pulmonary disease, both be- fore and after therapy. METHODS AND SUBJECTS The pulmonary diffusing capacity was determined by a modification of the Krogh breath-holding technique (2), in which the seated resting subject makes a maxi- mal inspiration from residual volume of a gas mixture containing approximately 0.3 per cent CO, 10 per cent He, and the remainder 02 and N2. An alveolar sample is obtained from the expirate after a 10-second period of breath-holding. The expired alveolar sample was dried and analyzed on an infrared analyzer for CO, and on a continuously-sampling mass spectrometer for He, 02 and CO2. Appropriate corrections were applied for the slight sensitivity of the instrument to CO2; 4 per cent CO2 gave a response equivalent to 0.001 per cent CO. Measurements of DL were repeated at several alveolar oxygen tensions from about 100 to approximately 600 mm Hg. The alveolar oxygen tension during the meas- urement of DL was varied a) by having the subject in- spire gas mixtures containing different concentrations of oxygen during the actual measurement of DL; and b) by having the subject breathe 99.5 per cent oxygen or air for several minutes prior to the measurement. Knowing DL for several different oxygen tensions, Equation 1 was solved graphically for Dm and Ve (3); 0 was obtained from the data of Roughton and Forster (1) who use a value of 2.5 for the ratio of the permeability of the red cell membrane to that of the interior of the cell; 0 is proportional to the concentration of hemoglobin (or of normal red cells) in the blood. The values of 0 1323
Transcript of V,. -...

TIHl EFFECT OF ANEMIA ON THE ALVEOLAR-CAPILLARY EXCHANGEOF CARBONMONOXIDEIN MIAN *
By J. RANKINt R. S. McNEILL t AND R. E. FORSTER§
(From the Department of Physiology, Graduate School of Medicine, University of Pennsylvania,Philadelphia, Pa.)
(Submitted for publication October 31, 1960; accepted March 30, 1961)
Previous work has demonstrated that the ex-change of CO between alveolar gas and pulmo-nary capillary blood is at least partially limited bythe rate at which it can combine reversibly with in-tracellular hemoglobin. The relative importanceof the rate of gas diffusion across the pulmonarymembrane and the rate of gas uptake by the redcells in determining the over-all rate of alveolarcapillary gas exchange has been expressed by therelation (1):
1/DL = 1/Dm + 1/OVc [1]
In this equation DL is the over-all diffusing ca-pacity of the lungs and Dm is that of the pulmo-nary membrane alone, both given in milliliters ofgas per minute per millimeter Hg; V, is the aver-age volume of blood in the pulmonary- capillarybed and 9 is the rate at which 1 ml of this bloodcombines with CO in milliliters of gas reacting perminute per millimeter CO tension; 0 equals theproduct of the number of grams of hemoglobinper milliliter of blood and the gas uptake rate pergram of hemoglobin. By analogy, the movementof gas between the alveoli and the red cell interiormay be compared with the flow of electricitythrough two resistances in series where 1/DL isthe total resistance, 1/Dm is that of the membranealone and 1/OV, is that of the average total massof red cells in the pulmonary capillary bed at anyinstant; 9 decreases as capillary 02 tension rises,because 02 competes with CO for intracellularhemoglobin, in effect lowering the chemical reac-tion rate. By measuring DL at two or more dif-
* This work was supported by a grant from the LifeInsurance Medical Research Fund. It was presented asan abstract in J. clin. Invest. 1957, 36, 922.
t Present address: Department of Medicine, Univ. ofWisconsin, Madison, Wis.
t Present address: Department of Pharmacology andTherapeutics, Univ. of St. Andrew's Medical School,Dundee, Scotland.
§ Lowell NM. Palmer Senior Fellow.
ferent capillary 02 tensions for which correspond-ing values of 9 are known, the data can be ob-tained for the solution of Equation 1 for both D1and V,.
When the concentration of red cells in the pul-monary capillary blood is decreased, without anyremarkable changes in the gas uptake rate of theindividual cell, 9 also decreases and the formulapredicts that DL will decrease as well. In orderto determine the physiological effects of anemia ongas exchange and also to confirm the validity ofEquation 1, we have measured DL, D21, and V, infive patients with severe iron-deficiency anemiawithout significant pulmonary disease, both be-fore and after therapy.
METHODSAND SUBJECTS
The pulmonary diffusing capacity was determined bya modification of the Krogh breath-holding technique(2), in which the seated resting subject makes a maxi-mal inspiration from residual volume of a gas mixturecontaining approximately 0.3 per cent CO, 10 per centHe, and the remainder 02 and N2. An alveolar sampleis obtained from the expirate after a 10-second period ofbreath-holding. The expired alveolar sample was driedand analyzed on an infrared analyzer for CO, and on acontinuously-sampling mass spectrometer for He, 02 andCO2. Appropriate corrections were applied for the slightsensitivity of the instrument to CO2; 4 per cent CO2 gavea response equivalent to 0.001 per cent CO.
Measurements of DL were repeated at several alveolaroxygen tensions from about 100 to approximately 600mmHg. The alveolar oxygen tension during the meas-urement of DL was varied a) by having the subject in-spire gas mixtures containing different concentrations ofoxygen during the actual measurement of DL; and b) byhaving the subject breathe 99.5 per cent oxygen or airfor several minutes prior to the measurement.
Knowing DL for several different oxygen tensions,Equation 1 was solved graphically for Dmand Ve (3); 0was obtained from the data of Roughton and Forster (1)who use a value of 2.5 for the ratio of the permeabilityof the red cell membrane to that of the interior of thecell; 0 is proportional to the concentration of hemoglobin(or of normal red cells) in the blood. The values of 0
1323

J. RANKIN, R. S. McNEILL AND R. E. FORSTER
were derived for an assumed blood hemoglobin concentra-tion of 14.9 g per 100 ml (equivalent to an 02 or COcombining capacity of 20 ml per 100 ml). When the pul-monary capillary hemoglobin concentration does notequal this value, may be obtained by direct proportion.
The measurements of DL were corrected for the pres-ence of significant amounts of COHbin the mixed venousblood by subtracting the equilibrated CO tension owing tothis compound. After washing out most of the nitrogenin the lungs by breathing approximately 100 per cent 02
beforehand, which resulted in an alveolar 02 tension ofabout 600 mmHg, the equilibrated CO tension was ob-tained by breath-holding for 1.5 minutes. Estimates ofequilibrated blood CO tension were obtained in thismanner before and after a group of measurements of DL,and the correct value for the individual measurement ob-tained by interpolation and proportioned to the appropri-ate 02 tension (4). The calculations are not precise foralveolar 02 tensions of much less than 200 mmHg, butare adequate for the present purposes.
Residual volume was measured by the open circuit ni-trogen washout method of Darling, Cournand and Rich-ards (5). Maximal expiratory and inspiratory flowrates were calculated by the method of Cander and Com-roe (6). The evenness of distribution of inspired gas
was measured in four of the five patients by the single-breath 02 method (7).
We desired subjects for this investigation who hadphysiologically normal lungs and cardiovascular systems,
and who could be studied a) at a time when their bloodhemoglobin was very low, and later b) when it had beenraised by therapy. The most common condition in whichthese circumstances prevail is a previously undiagnosedanemia resulting from acute or chronic blood loss, im-mediately prior to and after blood transfusion. Wewere
able to study only five patients fulfilling these criteriaover a period of more than a year. Their vital sta-tistics, pulmonary function tests and primary diagnosesare given in Table I. Pulmonary function tests were
repeated only in Patient 5, whose average results are
given. None of these patients had any history, physicalsigns, or indications by X-ray examination of respira-tory disease. Since it is desirable to treat any patientwith a markedly low hematocrit as soon as possible, itwas difficult to obtain complete pulmonary function stud-ies (particularly arterial blood analyses) on each pa-tient while he was in his most anemic state, but this was
largely accomplished, save in Patient 1.He had a large hiatus hernia with gastrointestinal
bleeding and this was considered the major cause of hisanemia, although some of the blood findings were notwholly explicable on this basis. Owing to his condi-tion, it was necessary to perform all studies while hewas supine.
Patient 2 had large myofibromata of the uterus withconsiderable vaginal bleeding She also gave a historysuggesting heart disease some 20 years earlier. The daybefore the first measurements of DL, the patient devel-
TABLE I
Vital statistics and results of pulmonary function tests *
N2RV/ uni-
Patient diagnosis Age Sex BSA VC RV TLC TLC MIFR MEFR MBC formity
m2 ml ml ml % Limin L/min Limin %N21 44 ci 1.80 4,650 3,450 8,100 42 270 590 1.7
Hiatus hernia (3,850) (1,180) (5,030)
2 38 9 1.56 2,730 1,690 4,420 38 226 259 1.2Uterine fibromata (2,890) (880) (3,700)
3 40. 9 1.78 3,570 1,828 5,398 34 280 253 84 0.5tUterine fibromata (2,800) (855) (3,655)
4 52 9 1.51 2,760 2,365 5,365 44 270 485 0.7Carcinoma of (2,630) (800) (3,430)
cervix
5 53 9 1.70 2,380 1,792 4,172 43 230 260 80 0Carcinoma of (2,670) (810) (3,480)
cervix
* Diagnosis refers to the condition producing the anemia via chronic blood loss. VC is vital capacity, RV residualvolume, TLC total lung capacity (all in ml BTPS). Predicted normal values (8) are given in the parentheses. MIFRand MEFRare maximal inspiratory and expiratory flow rates in liters BTPS/min. The normal values are between 200and 600 L/min. MBCis the maximal voluntary ventilation in liters BTPS/min. The normal values are given in pa-rentheses (9). N2 uniformity [single breath N2 test (7) ] is the change in expired alveolar N2%between 750 and 1,250 mlof expirate. The normal value is 2%or less. The first study on Patient 1 had to be done supine. Pulmonary functionstudies were repeated about 1 week after treatment in Patient 5; average values are given. There wereno significantchanges.
t This figure is the percentage of N2 in the expired alveolar gas after breathing 02 for 7 minutes. A normal valuewould be <2.5% (5).
1324
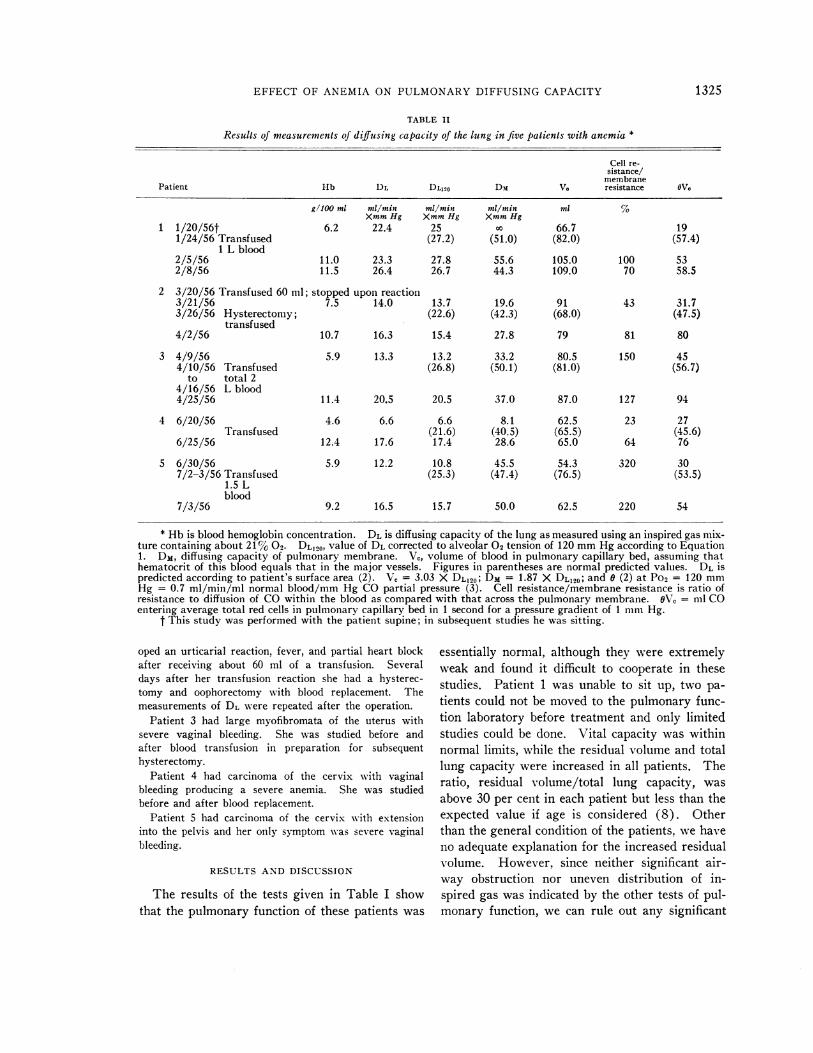
EFFECT OF ANEMIA ON PULMONARYDIFFUSING CAPACITY
TABLE II
Results of measurements of diffusing capacity of the lung in five patients with anemia *
Cell re-sistance/
membranePatient Hb DL DL120 Dm VC resistance WVe
g1lo0 ml ml/min ml/min ml/min ml %XmmHg XmmHg XmmHg
1 1/20/56t 6.2 22.4 25 X 66.7 191/24/56 Transfused (27.2) (51.0) (82.0) (57.4)
1 L blood2/5/56 11.0 23.3 27.8 55.6 105.0 100 532/8/56 11.5 26.4 26.7 44.3 109.0 70 58.5
2 3/20/56 Transfused 60 ml; stopped upon reaction3/21/56 7.5 14.0 13.7 19.6 91 43 31.73/26/56 Hysterectomy; (22.6) (42.3) (68.0) (47.5)
transfused4/2/56 10.7 16.3 15.4 27.8 79 81 80
3 4/9/56 5.9 13.3 13.2 33.2 80.5 150 454/10/56 Transfused (26.8) (50.1) (81.0) (56.7)
to total 24/16/56 L blood4/25/56 11.4 20.5 20.5 37.0 87.0 127 94
4 6/20/56 4.6 6.6 6.6 8.1 62.5 23 27Transfused (21.6) (40.5) (65.5) (45.6)
6/25/56 12.4 17.6 17.4 28.6 65.0 64 76
5 6/30/56 5.9 12.2 10.8 45.5 54.3 320 307/2-3/56 Transfused (25.3) (47.4) (76.5) (53.5)
1.5 Lblood
7/3/56 9.2 16.5 15.7 50.0 62.5 220 54
* Hb is blood hemoglobin concentration. DL is diffusing capacity of the lung as measured using an inspired gas mix-ture containing about 21% 02. DL120, value of DL corrected to alveolar 02 tension of 120 mmHg according to Equation1. DM, diffusing capacity of pulmonary membrane. Vc, volume of blood in pulmonary capillary bed, assuming thathematocrit of this blood equals that in the major vessels. Figures in parentheses are normal predicted values. DL ispredicted according to patient's surface area (2). V, = 3.03 X DL120; DM = 1.87 X DL120; and 0 (2) at Po2 = 120 mmHg = 0.7 ml/min/ml normal blood/mm Hg CO partial pressure (3). Cell resistance/membrane resistance is ratio ofresistance to diffusion of COwithin the blood as compared with that across the pulmonary membrane. OV0 = ml COentering average total red cells in pulmonary capillary bed in 1 second for a pressure gradient of 1 mmHg.
t This study was performed with the patient supine; in subsequent studies he was sitting.
oped an urticarial reaction, fever, and partial heart blockafter receiving about 60 ml of a transfusion. Severaldays after her transfusion reaction she had a hysterec-tomy and oophorectomy with blood replacement. Themeasurements of DL were repeated after the operation.
Patient 3 had large myofibromata of the uterus withsevere vaginal bleeding. She was studied before andafter blood transfusion in preparation for subsequenthysterectomy.
Patient 4 had carcinoma of the cervix with vaginalbleeding producing a severe anemia. She was studiedbefore and after blood replacement.
Patient 5 had carcinoma of the cervix with extensioninto the pelvis and her only symptom was severe vaginalbleeding.
RESULTS AND DISCUSSION
The results of the tests given in Table I showthat the pulmonary function of these patients was
essentially normal, although they were extremelyweak and found it difficult to cooperate in thesestudies. Patient 1 was unable to sit up, two pa-tients could not be moved to the pulmonary func-tion laboratory before treatment and only limitedstudies could be done. Vital capacity was withinnormal limits, while the residual volume and totallung capacity were increased in all patients. Theratio, residual volume/total lung capacity, wasabove 30 per cent in each patient but less than theexpected value if age is considered (8). Otherthan the general condition of the patients, we haveno adequate explanation for the increased residualvolume. However, since neither significant air-way obstruction nor uneven distribution of in-spired gas was indicated by the other tests of pul-monary function, we can rule out any significant
1325

J. RANKIN, R. S. McNEILL AND R. E. FORSTER
obstructive pulmonary disease. Further, sincethese patients gave no indication of significantpulmonary disease by history, or by physical orX-ray examination, we inclined to the view thatthey were as free from pulmonary dysfunction aswe could expect under the circumstances per-taining.
A summary of the measurements of the diffus-ing capacity of the lung at an alveolar 02 tensionof about 100 mmHg in these patients, before andafter blood replacement by transfusion, is givenin Table II. More complete data are presentedin Figure 1, which is a plot of DL for all five sub-jects, at varying alveolar 02 tension from 100 toabout 600 mmHg before treatment. At the timeof the first study, the average blood Hb concentra-tion was 6 g per 100 ml, and after treatment the
average blood Hb concentration was 11 g per 100ml. Each point in the figure is the average of twoor more measurements of DL. At all three levelsof alveolar 02 tension, DL in the anemic state waslower than similar data from eight normal sub-jects at comparable alveolar 02 tensions (3)(p < 0.01). The value of DL (corrected to astandard alveolar 02 tension of 120 mm Hg(DL120)) for each patient was less than the valuepredicted from the body surface area (2) (p <0.05). With the exception of the case of Patient1, each measured value of DL120 was more than2 SD (8 ml per minute per mmHg) below thepredicted value at the lower Hb concentration.Except for two data points of Patient 1, all of theDL measurements were less than the normal dataeven at the higher Hb concentration. At an av-
30-
DL
IN 20-ML
MINX MMHG
10I
00.0
0
00
I0
I 00
aI
03
25
(9XgX2
3
452 (0
0 01
0
00 00
@0*0
3
2(D@5
@0
O 100 200 300 400 500 600 700
ALVEOLAR 02 TENSION IN MMHG
FIG. 1. THE DIFFUSING CAPACITY OF THE. LUNG (DL) FOR EACH OF THE 5 PATIENTSPLOTTED AGAINST ALVEOLAR PO2 IN MMHG. The circled figures indicate measurementsmade when the patients were severely anemic, prior to the therapy (average Hb conc. 6g per 100 ml). The figures without circles indicate measurement made after therapywhen the blood hemoglobin concentration had been raised (average Hb conc. 11 g per100 ml). The numbers refer to the individual patients as in the tables. The solid circles(0) are data from 8 normal subjects (3). Each point is the average of at least twoobservations.
1326
w
I

EFFECT OF ANEMIA ON PULMONARYDIFFUSING CAPACITY
erage Hb concentration of 6.0 g per 100 ml, DL120was 55 per cent of its predicted value.
In all five patients, after the increase in bloodHb concentration produced by transfusion, DL120was increased (Table II, Figure 2). At an aver-age Hb concentration of 11 g per 100 ml, DL190was 77 per cent of its predicted value. The ini-tial studies in Patient 1 were done with himsupine, the later studies, sitting. Since DL isgreater supine than sitting (2), this would tend todisplace upward the most leftward point of thegraph for Patient 1. Any correction applied forthis fact would bring the data on this patient moreinto line with the remainder. On the average, a10-day interval occurred between the pre- andpost-transfusion studies in a given patient (range3 to 16 days). Except at the highest alveolartension in Patient 2, and in spite of variations be-tween individuals, it can be seen (Figure 1) thatDL was greater at the greater blood Hb concen-
tration in all five patients, and at all three alveolar02 tension levels. These differences are statisti-cally significant.
30-
25
oL120ltN 20
MLMINX MMHO
15
10-
5v
0 2 4BLOOD
Two major questions raised by the present re-sults are: a) Why is DL less than the predictednormal value in all five patients? b) What is themechanism of its increase after transfusion?
The five patients studied were of relatively smallbody size compared with the normal subjectswhose data are given in Figure 1-an averagesurface area of 1.67 m2 as compared with anaverage of 2.00 M2. Under normal circum-stances DL is less the smaller the body size (2)and this might be the explanation for the lowervalues of DL in Figure 1 and Table II. However,in four of five patients, the value of DL (as meas-ured at the lower hemoglobin concentration) wasmore than 2 SD below the value predicted on thebasis of body surface area. Only one patient hada DL outside these predicted limits after partialrestoration of normal hemoglobin concentration.We conclude that the initial low values for DLare not entirely explicable on the basis of thesmall body size of the patients.
The effective surface area of the pulmonarymembrane might have been reduced in these pa-
I r
6 8HEMOGLOBIN
10IN GM/IOOML
12 14
FIG. 2. A GRAPHOF DL120, THE VALUE CORRESPONDINGTO AN ALVEOLAR O., TENSION OF
120 MmHG, AGAINST PERIPHERAL BLOODHEMOGLOBINCONCENTRATIONFOR TILE 5 PATIENTS
STUI)IED. The numerals inside the circles indicate the patient from whom the datum de-rives. The lines connect measurements made at different levels of blood hemoglobinconcentration on any single patient.
1327

J. RANKIN, R. S. McNEILL AND R. E. FORSTER
I/@ IN MLXMINXMMHG(CHB 59 GM/100ML)ML34B]:5.7 M'!
12 7 Iip
00
0
0CHBO] 5.9 GM/IOI
/ -' 00
*; -'tJ-.-(HB] 9.2 GM/I00ML
,-
°2 TENSION IN MMHG100 200 300 400 500 600
I .I i 1,|
2 3 4 5 6 7
I/O IN MLX MIN X MMHG ((HB] J9.2 GM/IOOML)ML
FIG. 3. A GRAPH OF 1/DL AGAINST 1/0 FOR PATIENT 5, BEFORE AND AFTER TREATMENTOF
ANEMIA. Because is directly proportional to the blood CO capacity or hemoglobin concentra-tion (1), the scales on the abscissae have to be different for the measurements before and aftertreatment of the anemia. The solid circles (0) indicate measurements made when the patient'shemoglobin concentration was 5.9 g per 100 ml and the abscissa should be read on the top scale.The open circles (0) refer to measurements made after the patient had been transfused and thehemoglobin concentration in the blood had risen to 9.2 g per 100 ml. These data should beread on the lower scale. The approximate capillary 02 tension is also plotted on the abscissaand refers to either graph. The lines are the least mean squares regression lines for the twogroups of data. The intercept on the ordinate equals 1/Dm; Dm is 45.5 and 50.0 ml per minuteper mmHg for the upper (more anemic) and lower (post-treatment) cases, respectively. Theslopes of the two lines, calculated according to their particular abscissal scale, are proportionalto I/Va. V! was 54.3 and 62.5 for the anemic and post-treatment measurements, respectively;each point is the mean of at least two observations.
tients by a chronic abnormality, such as pulmonaryfibrosis, or a more acute process, such as pulmo-nary edema. However, save possibly in Patient2 (who may have had some cardiopulmonary dys-function following her transfusion reaction), therewere no indications of abnormalities in the lungsby the usual clinical, radiological, or functionaltests. Since, after transfusion, DL120 increasedan average of 58 per cent in from 3 to 16 days,any abnormalities in the pulmonary membranewould have had to be rapidly reversible to ex-
plain the changes in Dr. found.
The values of the diffusing capacity of the pul-monary membrane and the pulmonary capillaryblood volume presented in Table II were obtainedfrom graphical solutions of Equation 1, by thedata in Figure 1. This graphical solution for thecase of Patient 5 is given in Figure 3. The ini-tial measurements of DL were made when the pa-
tient's peripheral venous blood had a Hb concen-
tration of 5.9 g per 100 ml. After transfusionthis rose to 9.2 g per 100 ml at the time of the sec-
ond measurements of DL; 6, the rate of combina-tion of COwith the blood, is proportional to Hb
O.
DLIN
1328

EFFECT OF ANEMIA ON PULMONARYDIFFUSING CAPACITY
concentration. Therefore, two scales are given onthe abscissa, corresponding to the two blood Hbconcentrations. The data were fitted to Equation1 by the method of least squares. It should benoted that the two lines are plotted against differ-ent scales for 1/0 on the abscissa and that in ac-tuality their slopes (1/V,) are approximatelyequal.
A reduction in DL in anemia can be predictedfrom Equation 1 because of the increase in theintravascular diffusion resistance, 1/6V,, second-ary to the decrease in the rate at which 1 ml ofblood in the pulmonary capillaries can take upCOper mmHg of plasma COtension. OV, couldbe considered the "diffusing capacity" of the redcells in the capillary bed at any instant.
If the only change in the pulmonary capillarybed in anemia were a decrease in the hematocritof the pulmonary capillary blood, one would ex-pect DMand V, (which are dependent mainly uponthe dimensions of this bed) to be normal and re-main relatively unchanged by therapy. Also onewould expect the measured value of 6V, in ane-mia to be less than normal and to rise with an in-crease in the hematocrit. As seen in Table II,DMwas less than normal prior to therapy and in-creased after therapy in four of five patients, butthese changes are not statistically significant. Itshould be remarked that Dm is obtained by ex-trapolation (see Figure 3) and that 1/Dm liesnear the origin except in severe pulmonary capil-lary block. Slight errors in the measured valuesof DL can lead to large proportional changes inDm, making it theoretically a more variable meas-ure than V,. For example, the initial value ofDm in Patient 1 was infinity. In addition, un-usually large variations in DL were found, par-ticularly at high alveolar 02 tensions, because,when DL is reduced (as it was in these patients),the relative change in alveolar CO concentrationduring 10 seconds of breath-holding becomessmall, and small analytical errors produce largechanges in the calculated value of DL. For ex-ample, in Patient 4 prior to treatment, the alveolarCOconcentration fell between 10 and 25 per centin 10 seconds. An analytical error of 3 per cent(which is not unrealistic) would produce an errorin DL of between 14 and 30 per cent. V, tendedto be closer to the predicted values than did Dm1,and rose in four of five patients, but again these
changes are not statistically significant. It wouldnot be unreasonable to expect an increase in thedimensions of the pulmonary capillary bed in ane-mia in view of the known increase in pulmonaryblood flow seen in it (10).
OVO, which actually equals the "diffusing ca-pacity" of the red cells in the pulmonary capillarybed at any instant, was less than the predictedvalue and rose after therapy in all five patients;this change was statistically significant (p 0.03).Changes in OV, can be observed without havingto make any assumptions as to the value of 6, since1/DL can be plotted against mean capillary 02tension. These findings are in agreement withthe hypothesis that in anemia COmovement withinthe pulmonary capillary blood is impeded. SinceV, calculated on the basis of assumed changes in0, did not change significantly, it is most probablethat OV0 was reduced because 0 was reduced, andthe latter change could have been caused eitherbecause the number of red cells in the pulmonarycapillary bed was reduced, or because the rate ofCOuptake of the individual red cells was reduced.No data are available on the latter point, but thereis no evidence to lead us to expect such an abnor-mality. If there had been an increase in the re-sistance to gas diffusion through the plasma ofthe pulmonary capillaries in the anemic state, thisshould have been interpreted as an increase inDM, because the "pulmonary membrane" includesthe entire path between the surface of the red cellsand the alveolar gas according to the analysis.It is not possible to obtain direct experimentalmeasurements of the hemoglobin concentrationin the pulmonary capillary blood, so we have as-sumed it is equal to that in the peripheral venousblood, and it is on this basis that the values of V,in Table II have been calculated.
Since there appear no other reasonable explana-tions, it seems permissible to conclude that the ini-tially reduced values of DL in these patients re-sulted from an increase in 1/0V, and that the in-crease in DL, which occurred when the blood he-matocrit rose, resulted from a decrease in thisintravascular resistance.
Since the rate at which 1 ml of normal wholeblood takes up 02 from the plasma per mmPo2difference is of the same order as 6 for CO (1),we presume that the rate of diffusion of 02 withinthe blood is also an important factor in determin-
1329

J. RANKIN, R. S. McNEILL AND R. E. FORSTER
ing the rate of 02 exchange in the lungs as wellas in the peripheral tissues. In anemia, where thetotal red cell surface available for 02 exchange inthe capillaries at any instant is decreased, the 02gradient would necessarily be increased.
Mochizuki and associates (11) have measuredthe diffusing capacity for 02 in anesthetized dogs,in which the red cell concentration was varied fromabout 2.5 to 6.8 x 10⁹ per ml blood. They esti-mated the venous admixture percentage (arterial-mixed venous) from 02 content and alveolar andarterial Po2 while the animal was breathing a gasmixture enriched with 02. These authors foundthat the calculated value of DL for 02 increasedproportionally to the increase in hematocrit, otherconditions remaining constant. This finding isconsistent with the data in Figure 2.
SUMMARY
The diffusing capacity of the lung (DL) wasmeasured by the breath-holding CO technique infive patients with severe chronic anemia, butwithout evidence of significant lung disease, be-fore and after their blood hemoglobin concentrationwas increased by transfusion. Simple pulmonaryfunction studies showed an increase in residualvolume but no significant airway obstruction ornon-uniform distribution of inspired gas.
DL prior to therapy was less than predicted inall five patients. The average interval betweenthe measurements of DL in each patient was 9 days,in which time DL at an average alveolar 02 ten-sion of 120 mmHg had increased an average of54 per cent; at an average alveolar 02 tension of250 mmHg had increased an average of 95 percent; and at an average alveolar 02 tension of 590mmHg had increased an average of 69 per cent.
ACKNOWLEDGMENTS
The authors wish to thank Dr. Phyllis Marciano forinvaluable technical assistance in performing these stud-ies, the house staffs of the Philadelphia General Hos-pital and the Hospital of the University of Pennsylvaniafor their help in selecting the patients, and Dr. J. H.Comroe, Jr., for much helpful criticism.
REFERENCES
1. Roughton, F. J. W., and Forster, R. E. Relative im-portance of diffusion and chemical reaction ratesin determining the rate of exchange of gases in thehuman lung, with special reference to true dif-fusing capacity of pulmonary membrane and vol-ume of blood in lung capillaries. J. appl. Physiol.1957, 11, 290.
2. Ogilvie, C. M., Forster, R. E., Blakemore, W. S., andMorton, J. W. A standardized breath holding tech-nique for the clinical measurement of the diffusingcapacity of the lung for carbon monoxide. J. clin.Invest. 1957, 36, 1.
3. McNeill, R. S., Rankin, J., and Forster, R. E. Thediffusing capacity of the pulmonary membrane andthe pulmonary capillary blood volume in cardio-pulmonary disease. Clin. Sci. 1958, 17, 465.
4. Forster, R. E., Fowler, W. S., Bates, D. V., andVan Lingen, B. Absorption of carbon monoxideby the lungs during breathholding. J. clin. Invest.1954, 33, 1135.
5. Darling, R. C., Cournand, A., and Richards, D. W.,Jr. Studies on intrapulmonary mixture of gases.III. An open circuit method for measuring residualair. J. clin. Invest. 1940, 19, 6091.
6. Cander, L., and Comroe, J. H., Jr. A method forthe objective evaluation of bronchodilator drugs;effects of Dapanone, Isuprel, and aminophylline inpatients with bronchial asthma. J. Allergy 1955,26, 210.
7. Comroe, J. H., Jr., and Fowler, W. S. Lung func-tion studies. VI. Detection of uneven alveolarventilation during a single breath of oxygen.Amer. J. Med. 1951, 10, 408.
8. Greifenstein, F. E., King, R. M., Latch, S. S., andComroe, J. H., Jr. Pulmonary function studiesin healthy men and women 50 years and older. J.appl. Physiol. 1952, 4, 641.
9. Baldwin, E. de F., Cournand, A., and Richards,D. W., Jr. Pulmonary insufficiency: I. Physio-logical classifications, clinical methods of analysis,standard values in normal subjects. Medicine(Baltimore) 1948, 27, 243.
10. Ryan, J. M., and Hickam, J. B. The alveolar-arterialoxygen pressure gradient in anemia. J. clin. In-vest. 1952, 31, 188.
11. Mochizuki, M., Anso, T., Goto, H., Hamamoto, A.,and Makiguchi, Y. The dependency of the diffus-ing capacity on the HbO2 saturation of the capil-lary blood and on anemia. Jap. J. Physiol. 1958, 8,225.
1330