V 1.9 Final Needs Assessment (APNA) 2014 · Balby Bridge in the central area. ... Increasing but...
31
1 V 1.9 Final Anti-Poverty Needs Assessment (APNA) 2014 Evidence Base Anti- Poverty Strategy 2014-2017 July 2014
Transcript of V 1.9 Final Needs Assessment (APNA) 2014 · Balby Bridge in the central area. ... Increasing but...
1
V 1.9 Final
Anti-Poverty
Needs
Assessment
(APNA) 2014
Evidence Base Anti-
Poverty Strategy
2014-2017
July 2014

2
CONTENTS
Section Page No.
Section 1: Purpose of the APNA 3
Section 2: Deprivation 4
Section 3: Labour Market & Worklessness 5
Section 4: Welfare Reform & Housing 10
Section 5: Financial Exclusion & Debt 15
Section 6: Health 18
Section 7: Children & Young People 20
Section 8: Stronger Families 26
Section 9: Food Poverty 27
Section 10: Fuel Poverty 29
Section 11: Areas of Focus/Priorities for 2014/15 31
3
Section 1: Purpose of the Anti-Poverty Needs Assessment
1.1 The ‘Anti-Poverty’ debate has gathered momentum in 2013-14 and into early 2014-
15. This Needs Assessment will outline some of the key information about the drivers
of poverty in Doncaster, identify areas where Doncaster significantly deviated from
national comparators and some of the impacts of poverty. The findings of this
needs assessment should inform the composition of an ‘Anti-Poverty’ strategy and
help to inform service delivery decisions across the partnership.
1.2 The inter-relationships across many parts of people’s lives mean that poverty is a
complex problem; there are no easy fixes. Although poverty has been a long
standing issue across many towns and places across the country, there does seem
to be an issue of people who are in work but with low incomes who are struggling
to pay for food, fuel or other items we may take for granted. Although this paper
may help to make sense of parts of the poverty problem across Doncaster,
inevitably there will be other data, research and opinion that will be needed to
support the work of the partnership.

4
Section 2: Deprivation
2.1 Deprivation has been measured using a number of different methods, but the latest
set of informatics is derived from the Census 2011. The data shows a similar pattern
to previous data, with areas within the main urban core showing higher levels of
deprivation, along with some of the settlements that surround the core - many of
which are former mining areas.
2.2 Figure 1 below shows the areas of Doncaster and their levels of deprivation, based
on the 2011 Census. The deprivation measure uses employment, education, health
and housing measures to give an overall ‘score’ for how deprived an area is. It is
clear there are some clusters across Doncaster, but also some communities where
there are wide variations of deprivation in close proximity. This highlights the
inequalities across the borough. Two particular areas of Doncaster have been in the
most deprived 1% nationally in previous assessments: Denaby Main in the west; and
Balby Bridge in the central area.
Figure 1: Map to show deprivation across Doncaster, 20111
1 Census 2011 deprivation measure composed of ;
1. Employment: any member of a household not a full-time student is either unemployed or long-term sick.
2. Education: no person in the household has at least L2 education, and no person aged 16-18 is a full-time student.
3. Health and disability: any person in the household has general health ‘bad or very bad’ or has a long term health
problem.
4. Housing: Household's accommodation is either overcrowded, with an occupancy rating -1 or less, or is in a shared
dwelling, or has no central heating.
Moorends Askern
Carcroft
Adwick Le Street
Stainforth
Intake
New Rossington
Town Centre & Balby Bridge
Denaby Main
Mexborough
Balby
5
Section 3: Labour Market & Worklessness
3.1 Doncaster is the second largest economy in the Sheffield City Region. Key
transformational projects are planned to increase the number of jobs and unlock
development land. However, there are a number of inter-related issues that need
to be tackled to develop a more balanced and resilient economy. The Local
Economic Assessment identifies2 Doncaster’s key Labour Market challenges:
Employment Rate: Increasing but the gap with regional averages is only
narrowing slowly. Doncaster’s females are less likely to work than others in the
region.
Wage Rates: Weekly earnings are over 10% lower than the UK average.
Youth Unemployment: Youth unemployment is falling faster than the overall
unemployment rate, but a remains a challenge
Working Age Population: Since 2001, the working age population has grown in
line with national averages, but decreases in the 5-9 & 10-14 age ranges may
adversely affect the number of workers available locally in the medium term,
along with an increasingly ageing population.
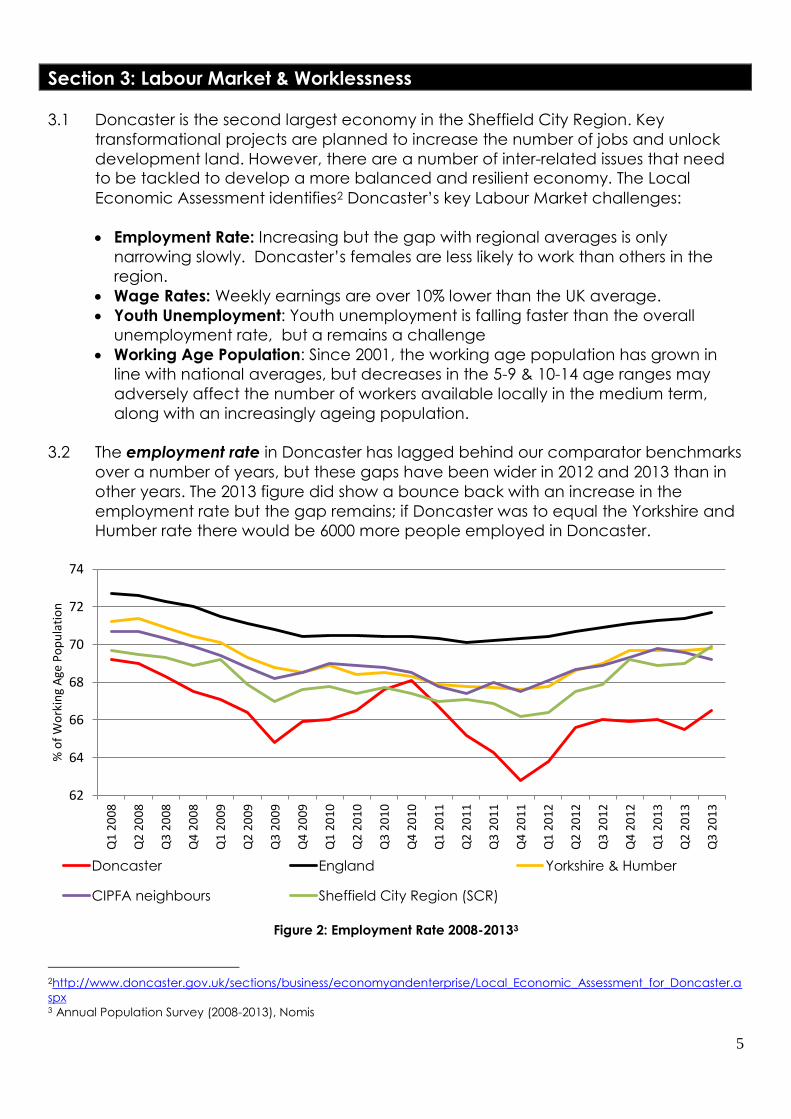
3.2 The employment rate in Doncaster has lagged behind our comparator benchmarks
over a number of years, but these gaps have been wider in 2012 and 2013 than in
other years. The 2013 figure did show a bounce back with an increase in the
employment rate but the gap remains; if Doncaster was to equal the Yorkshire and
Humber rate there would be 6000 more people employed in Doncaster.
Figure 2: Employment Rate 2008-20133
2http://www.doncaster.gov.uk/sections/business/economyandenterprise/Local_Economic_Assessment_for_Doncaster.a
spx 3 Annual Population Survey (2008-2013), Nomis
62
64
66
68
70
72
74
Q1
20
08
Q2
20
08
Q3
20
08
Q4
20
08
Q1
20
09
Q2
20
09
Q3
20
09
Q4
20
09
Q1
20
10
Q2
20
10
Q3
20
10
Q4
20
10
Q1
20
11
Q2
20
11
Q3
20
11
Q4
20
11
Q1
20
12
Q2
20
12
Q3
20
12
Q4
20
12
Q1
20
13
Q2
20
13
Q3
20
13
% o
f W
ork
ing
Age
Po
pu
lati
on
Doncaster England Yorkshire & Humber
CIPFA neighbours Sheffield City Region (SCR)

6
Unemployment4
3.3 Unemployed people form a small percentage of the population; the Office for
National Statistics (ONS) has developed a statistical model that provides estimates of
total unemployed for unitary authorities and local authority districts. The
unemployment rate measures people who are unemployed as a percentage of the
economically active population. Unemployment is higher in Doncaster than the
average rates for Yorkshire & Humber, CIPFA5 neighbours, Sheffield City Region and
England. A reduction to the regional levels would approximate to 1250 less people
unemployed in Doncaster.
Figure 3: Model Based Employment Rate Q3 20136
Jobseekers Allowance (JSA)7
3.4 The JSA claimant count is not itself a measure of unemployment but is strongly
correlated with unemployment. It is commonly used as a proxy measure for
joblessness. The number of working age JSA claimants in Doncaster continues to
reduce. After a significant rise following the economic downturn in 2008/9 to a peak
in February 2012 of 11,000 people, or 5.8% of the working age population, it has
reduced to 8,000 in April 2014, approximately 4.2% of the working age population.
3.5 These reductions are positive for Doncaster but the gap between Doncaster and the
comparator benchmarks has not closed with other areas seeing similar reductions
(shown in figure 4). Doncaster would need to reduce the number of JSA claimants by
1115 to equal regional rates of JSA.
4 Refers to people without a job who were available to start work in the two weeks following their jobcentre interview
and who had either looked for work in the four weeks prior to interview or were waiting to start a job they had already
obtained. 5 CIPFA Neighbours: Rotherham, Barnsley, Wigan, Wakefield, Dudley, Tameside, Bolton, Sunderland, Dudley, Walsall,
Oldham, Gateshead, Wirral, Sefton, Rochdale, Tameside, Stockport 6 Annual Population Survey, Unemployment Rates, NOMIS 7 JSA claimant count records the number of people claiming Jobseekers Allowance (JSA) and National Insurance
credits. People claiming JSA must declare that they are out of work, capable of, available for and actively seeking work
during the week in which the claim is made
10.4
9.3 9.0 9.2
7.6
0
2
4
6
8
10
12
Doncaster CIPFA
Neighbours
Sheffield City
Region (SCR)
Yorkshire &
Humber
England
% o
f w
ork
ing
age
po
pu
lati
on
Unemployment rate - Q3 2013

7
Figure 4: JSA Rate (Proportion of Working age population), 2005-20148
3.6 The number and rate of 18-24 year olds in Doncaster who are JSA claimants is also
reducing. Claimant figures for the 18-24 year old age group show a reduction of
32% between April 2013 and April 2014. This reduction is better than the England,
Yorkshire & Humber, Sheffield City Region and our CIPFA comparator authorities’
average reductions. However this age group still accounts for 27.5% of working age
claimants in Doncaster and is a significant challenge to the local economy and to
local services. Although similar to the regional average, there are nearly 400 young
people aged 18-24 that have been claiming JSA for over 12 months. There are
more young people who have just started claiming JSA (Under 6 months) in
Doncaster than regional and national average, with 5.5% of the population in this
category for Doncaster compared to 3.6 and 3.0% for the regional and national
figure respectively.
Figure 5: JSA Claimant Count by Age Group
8 Claimant Count, NOMIS
0.0
1.0
2.0
3.0
4.0
5.0
6.0
Jan
20
05
Ap
r 2
005
Jul 2
00
5
Oct
200
5
Jan
20
06
Ap
r 2
006
Jul 2
00
6
Oct
200
6
Jan
20
07
Ap
r 2
007
Jul 2
00
7
Oct
200
7
Jan
20
08
Ap
r 2
008
Jul 2
00
8
Oct
200
8
Jan
20
09
Ap
r 2
009
Jul 2
00
9
Oct
200
9
Jan
20
10
Ap
r 2
010
Jul 2
01
0
Oct
201
0
Jan
20
11
Ap
r 2
011
Jul 2
01
1
Oct
201
1
Jan
20
12
Ap
r 2
012
Jul 2
01
2
Oct
201
2
Jan
20
13
Ap
r 2
013
Jul 2
01
3
Oct
201
3
Jan
20
14
Ap
r 2
014
JSA rate (proportion of working age population) 2005-2014
Doncaster England Yorks and Humber CIPFA Neighbours Sheffield City Region (SCR)
0
2
4
6
8
10
12
Pro
po
rtio
n o
f p
op
ula
tio
n
Doncaster JSA claimant rate by age group
Aged 16-24 Aged 25-49 Aged 50-64

8
Gender
3.10 Females in Doncaster are far less likely to work:
59.6% of females of working age are in employment which is significantly less than
the Y&H average (a 5.6 percentage points gap) and the lowest in South Yorkshire
(60.4% Rotherham; 67.6% Barnsley; 64.4% Sheffield)(2013).
Doncaster having the fourth highest female JSA rate amongst all comparator
authorities (April 14).
Key out-of-work Benefits
3.11 Key out-of-work benefits, consists of the groups: - JSA; Employment Support
Allowance (ESA) and Incapacity Benefits; lone parents and others on income related
benefits. These groups have been chosen to best represent a count of all those
benefit recipients who cannot be in full-time employment as part of their condition of
entitlement.
3.12 The number of working age population claiming key out-of-work benefits within
Doncaster has been reducing back to similar levels that were recorded in early 2008.
This is a pattern that is replicated against national and local comparators.
3.13 The proportion of claimants in the Employment Support Allowance (ESA) and lone
parent groups has seen a gradual decrease since early 2008. Whereas those in the
job seekers allowance group fluctuates more increasing from 2.7% in February 2008
up to 5.8% in February 2012, down to 4.1% in November 2013.
Figure 6: Key out of Work Benefits 2008-20139
9 Key out of Work Benefit Statistics, Nomis
10.0
11.0
12.0
13.0
14.0
15.0
16.0
17.0
Feb
20
08
Ap
r 2
008
Jun
20
08
Au
g 2
008
Oct
200
8
Dec
20
08
Feb
20
09
Ap
r 2
009
Jun
20
09
Au
g 2
009
Oct
200
9
Dec
20
09
Feb
20
10
Ap
r 2
010
Jun
20
10
Au
g 2
010
Oct
201
0
Dec
20
10
Feb
20
11
Ap
r 2
011
Jun
20
11
Au
g 2
011
Oct
201
1
Dec
20
11
Feb
20
12
Ap
r 2
012
Jun
20
12
Au
g 2
012
Oct
201
2
Dec
20
12
Feb
20
13
Ap
r 2
013
Jun
20
13
Au
g 2
013
Oct
201
3
Doncaster England Yorks and Humber CIPFA Neighbours Sheffield City Region (SCR)
9
Work Programme
3.14 People are referred to the Work Programme by Job Centre Plus. The programme
providers work with participants on a specified ‘attachment activity’ before placing
them in employment. If the participant remains in employment, usually for a
minimum period of 26 weeks, a fee is paid to the provider. Of the 9980 people joining
the Work Programme in Doncaster up to and including December 2013, 17.03% of
them remained in employment for at least 26 weeks, although this is slightly higher at
22.82% for the 18-24 age group.
Skills
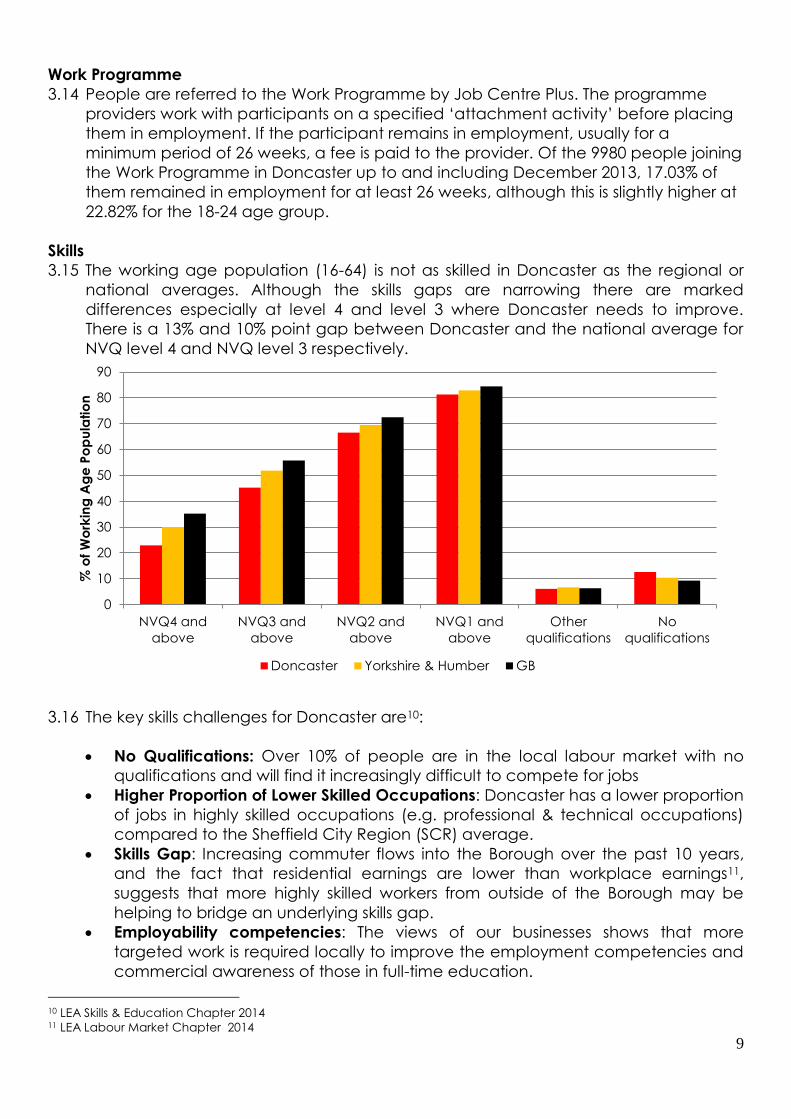
3.15 The working age population (16-64) is not as skilled in Doncaster as the regional or
national averages. Although the skills gaps are narrowing there are marked
differences especially at level 4 and level 3 where Doncaster needs to improve.
There is a 13% and 10% point gap between Doncaster and the national average for
NVQ level 4 and NVQ level 3 respectively.
3.16 The key skills challenges for Doncaster are10:
No Qualifications: Over 10% of people are in the local labour market with no
qualifications and will find it increasingly difficult to compete for jobs
Higher Proportion of Lower Skilled Occupations: Doncaster has a lower proportion
of jobs in highly skilled occupations (e.g. professional & technical occupations)
compared to the Sheffield City Region (SCR) average.
Skills Gap: Increasing commuter flows into the Borough over the past 10 years,
and the fact that residential earnings are lower than workplace earnings11,
suggests that more highly skilled workers from outside of the Borough may be
helping to bridge an underlying skills gap.
Employability competencies: The views of our businesses shows that more
targeted work is required locally to improve the employment competencies and
commercial awareness of those in full-time education.
10 LEA Skills & Education Chapter 2014 11 LEA Labour Market Chapter 2014
0
10
20
30
40
50
60
70
80
90
NVQ4 and
above
NVQ3 and
above
NVQ2 and
above
NVQ1 and
above
Other
qualifications
No
qualifications
% o
f W
ork
ing
Ag
e P
op
ula
tio
n
Doncaster Yorkshire & Humber GB

10
Section 4: Welfare Reform & Housing
4.1 Following the introduction of welfare reform changes in April 201312, a specific multi
agency steering group was set up in Doncaster to co-ordinate the changes and
manage the impacts across Doncaster.
4.2 The location of the households affected were mapped and then compared to the
Indices of Multiple Deprivation 2010 (see figure 7). This shows that there are clusters of
households affected by the welfare reform changes within the most deprived areas
of Doncaster, in the central core and outlying settlements. To a lesser extent there
are also effects on areas which are not classified as deprived areas such as
Bessacarr and Edenthorpe.
Figure 7: Map to show deprivation and Welfare benefit reform changes13
Under Occupancy Reductions
4.3 Reductions are made to the Housing Benefit of households that have ‘spare’
bedrooms. If there is one spare bedroom the amount of housing benefit is reduced
by 14% of the eligible rent. Two or more spare bedrooms, lead to a 25% reduction.
The reduction applies to working age people claiming housing benefit. Children
under the age of 10, or under 16 if of the same gender, are expected to share a
bedroom.
12 Local Council Tax Support Scheme; Under Occupancy Reductions to Housing Benefit; Benefit Cap. 13 Indices of Multiple Deprivation 2010, DCLG, University of Oxford & DMBC Benefits Data.

11
Figure 8: Under Occupancy Reductions by age and household type14
4.4 The largest group affected by the under occupancy reductions are single people,
particularly those over the age of 50 where children may have moved out leaving
their rooms vacant. However in the 16-34 group, over three quarters of households
affected are households containing children.
4.5 The Strategic Housing Market Needs Assessment15 suggests ‘Based upon the
bedroom standard, 20127 households (18.9%) have sufficient bedrooms to meet their
requirements given the household composition. 82393 households (77.4%) have more
bedrooms than required and are under-occupying while 3906 households (3.7%)
have insufficient bedrooms to meet their household needs and are over-crowded.
High levels of under-occupancy are not surprising against generally small household
sizes. These rates are in line with those for the Yorkshire and Humber Region’.
14 DMBC Benefits Data, April to June 2014 15 http://www.doncaster.gov.uk/Images/Doncaster%20SHMA%20Update%20FINAL37-102263.pdf
27
217
529
221 155 152
325
657
347
65 89
912
0
200
400
600
800
1000
Couple Couple with family Lone parent Single
Under Occupancy reductions by age and household type
Aged 16-34
Aged 35-49
Aged 50-64
18.91%
77.42%
3.67%
Have sufficient bedrooms to
meet requirements
Under-occupying
Over-crowded
Figure 9: Household Needs
12
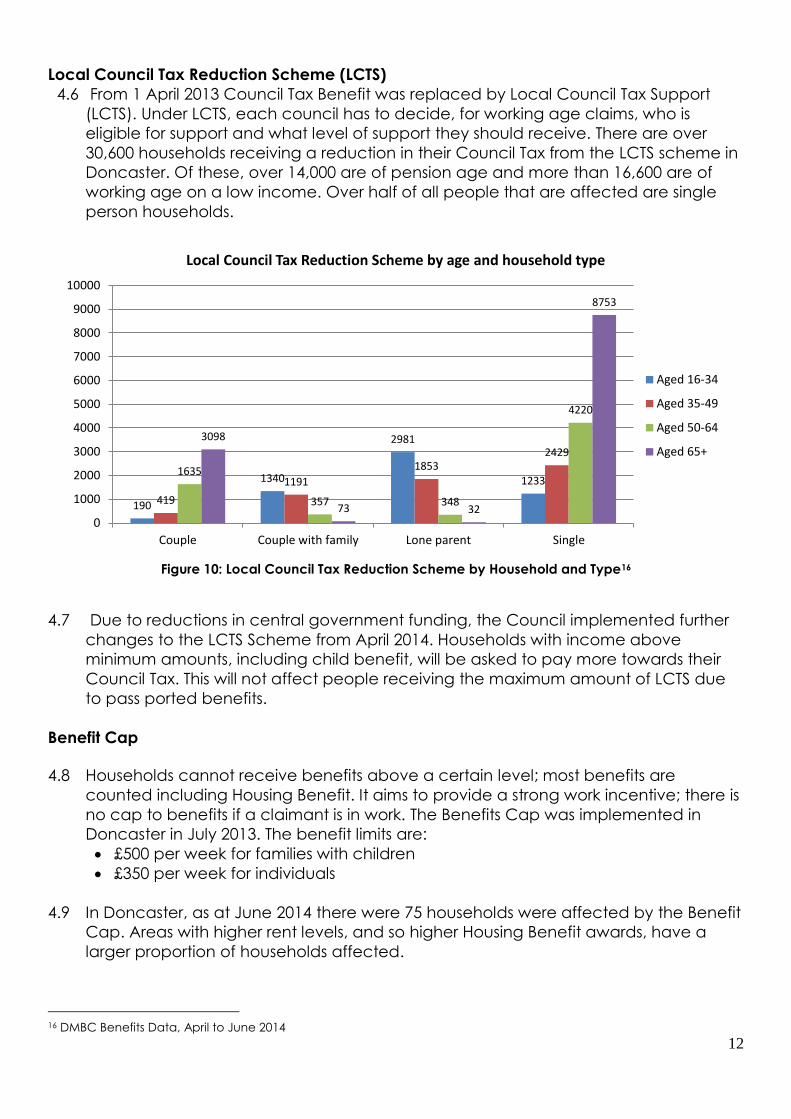
Local Council Tax Reduction Scheme (LCTS)
4.6 From 1 April 2013 Council Tax Benefit was replaced by Local Council Tax Support
(LCTS). Under LCTS, each council has to decide, for working age claims, who is
eligible for support and what level of support they should receive. There are over
30,600 households receiving a reduction in their Council Tax from the LCTS scheme in
Doncaster. Of these, over 14,000 are of pension age and more than 16,600 are of
working age on a low income. Over half of all people that are affected are single
person households.
Figure 10: Local Council Tax Reduction Scheme by Household and Type16
4.7 Due to reductions in central government funding, the Council implemented further
changes to the LCTS Scheme from April 2014. Households with income above
minimum amounts, including child benefit, will be asked to pay more towards their
Council Tax. This will not affect people receiving the maximum amount of LCTS due
to pass ported benefits.
Benefit Cap
4.8 Households cannot receive benefits above a certain level; most benefits are
counted including Housing Benefit. It aims to provide a strong work incentive; there is
no cap to benefits if a claimant is in work. The Benefits Cap was implemented in
Doncaster in July 2013. The benefit limits are:
£500 per week for families with children
£350 per week for individuals
4.9 In Doncaster, as at June 2014 there were 75 households were affected by the Benefit
Cap. Areas with higher rent levels, and so higher Housing Benefit awards, have a
larger proportion of households affected.
16 DMBC Benefits Data, April to June 2014
190
1340
2981
1233
419
1191
1853 2429
1635
357 348
4220
3098
73 32
8753
0
1000
2000
3000
4000
5000
6000
7000
8000
9000
10000
Couple Couple with family Lone parent Single
Local Council Tax Reduction Scheme by age and household type
Aged 16-34
Aged 35-49
Aged 50-64
Aged 65+
13
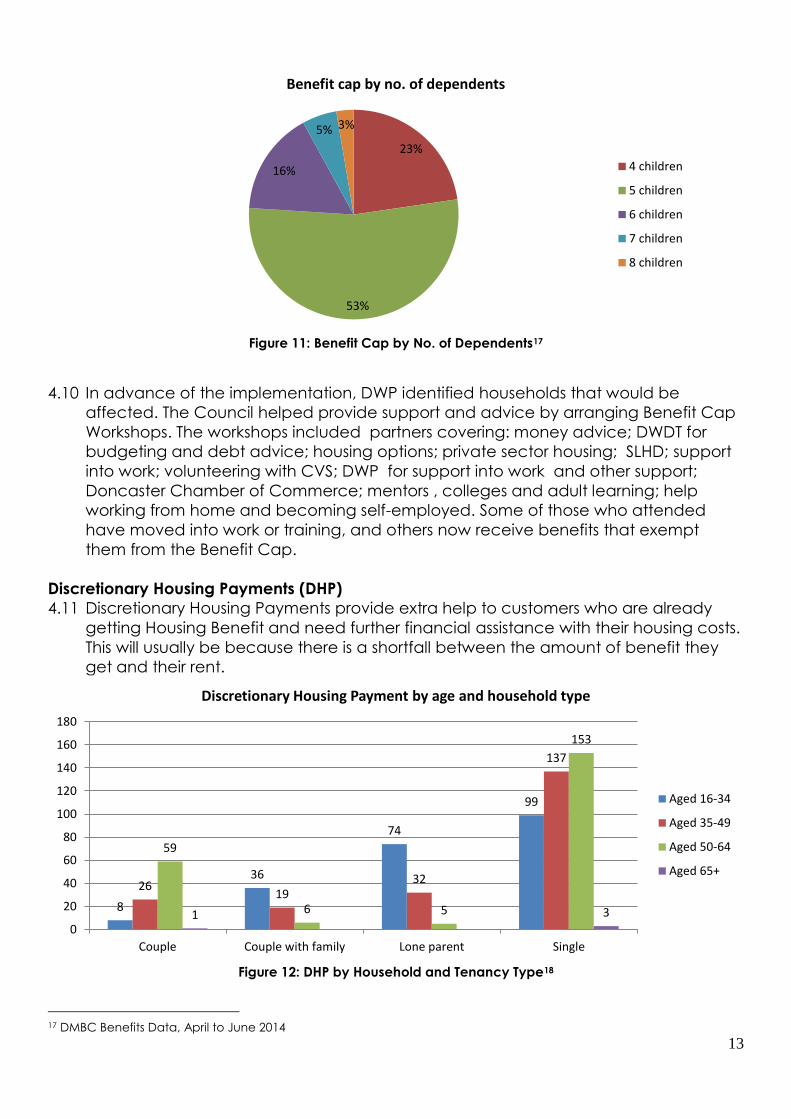
Figure 11: Benefit Cap by No. of Dependents17
4.10 In advance of the implementation, DWP identified households that would be
affected. The Council helped provide support and advice by arranging Benefit Cap
Workshops. The workshops included partners covering: money advice; DWDT for
budgeting and debt advice; housing options; private sector housing; SLHD; support
into work; volunteering with CVS; DWP for support into work and other support;
Doncaster Chamber of Commerce; mentors , colleges and adult learning; help
working from home and becoming self-employed. Some of those who attended
have moved into work or training, and others now receive benefits that exempt
them from the Benefit Cap.
Discretionary Housing Payments (DHP)
4.11 Discretionary Housing Payments provide extra help to customers who are already
getting Housing Benefit and need further financial assistance with their housing costs.
This will usually be because there is a shortfall between the amount of benefit they
get and their rent.
Figure 12: DHP by Household and Tenancy Type18
17 DMBC Benefits Data, April to June 2014
23%
53%
16%
5% 3%
Benefit cap by no. of dependents
4 children
5 children
6 children
7 children
8 children
8
36
74
99
26 19
32
137
59
6 5
153
1 3
0
20
40
60
80
100
120
140
160
180
Couple Couple with family Lone parent Single
Discretionary Housing Payment by age and household type
Aged 16-34
Aged 35-49
Aged 50-64
Aged 65+
14
4.12 The Council receives some money from the Government each year to spend on
Discretionary Housing Payments but there is a limit on the amount that they can
spend. This means that not everyone who claims will be awarded this extra help. To
qualify for Discretionary Housing Payments, households must meet certain conditions.
They must be receiving some Housing Benefit or Universal Credit that includes a
housing element towards rental liability; there must be a shortfall between the
amount of benefit they receive and their rent; and they must be able to show that
they need extra help in exceptional circumstances to meet housing costs. In return
there is an agreement to take action to address specific issues on a case by case
basis. The majority of Discretionary Housing Payments (DHP) were made to single
person households (60%) and in particular to those aged 50 and over representing
almost a quarter of all DHP payments. Local Assistance Support Scheme (LASS)
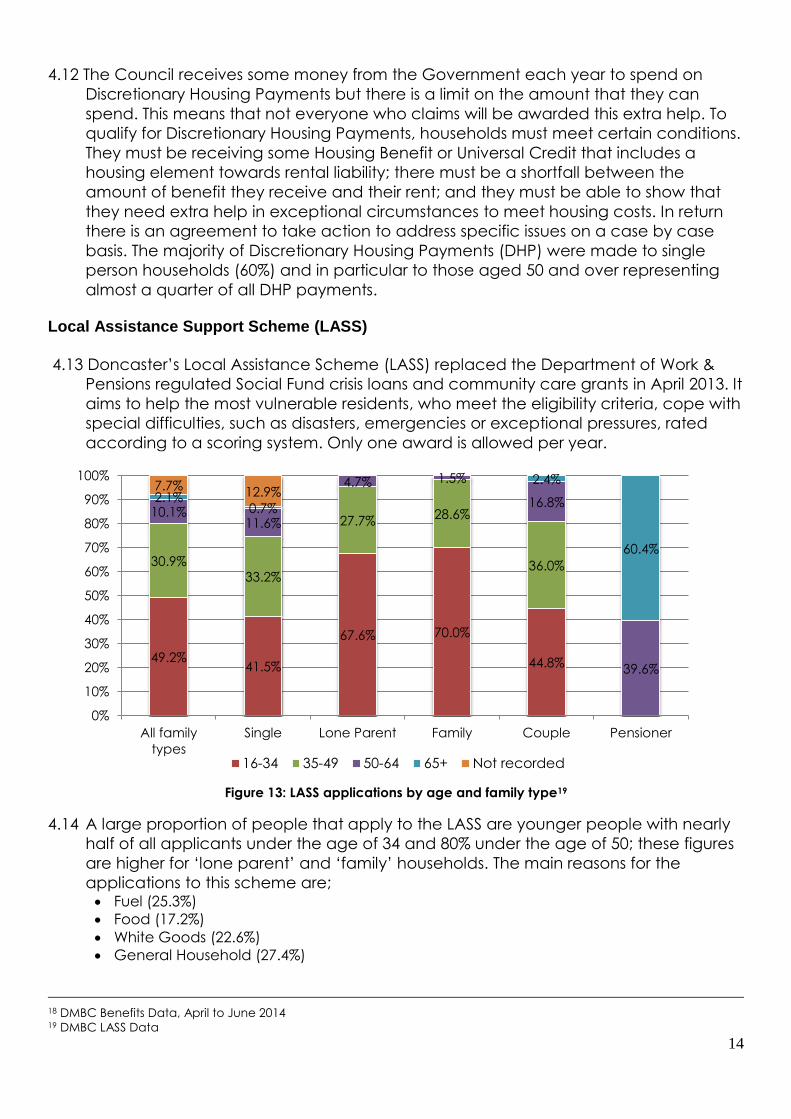
4.13 Doncaster’s Local Assistance Scheme (LASS) replaced the Department of Work &
Pensions regulated Social Fund crisis loans and community care grants in April 2013. It
aims to help the most vulnerable residents, who meet the eligibility criteria, cope with
special difficulties, such as disasters, emergencies or exceptional pressures, rated
according to a scoring system. Only one award is allowed per year.
Figure 13: LASS applications by age and family type19
4.14 A large proportion of people that apply to the LASS are younger people with nearly
half of all applicants under the age of 34 and 80% under the age of 50; these figures
are higher for ‘lone parent’ and ‘family’ households. The main reasons for the
applications to this scheme are; Fuel (25.3%)
Food (17.2%)
White Goods (22.6%)
General Household (27.4%)
18 DMBC Benefits Data, April to June 2014 19 DMBC LASS Data
49.2% 41.5%
67.6% 70.0%
44.8%
30.9% 33.2%
27.7% 28.6%
36.0%
10.1% 11.6%
4.7% 1.5%
16.8%
39.6%
2.1% 0.7%
2.4%
60.4%
7.7% 12.9%
0%
10%
20%
30%
40%
50%
60%
70%
80%
90%
100%
All family
types
Single Lone Parent Family Couple Pensioner
16-34 35-49 50-64 65+ Not recorded

15
Section 5: Earnings, Financial Exclusion & Debt
Income and Earnings
5.1 Employee earnings give an indication of living standards people are able to enjoy. If
people have high earnings, then they are likely to have a higher disposable income
and will, therefore, have a higher standard of living. Higher wage rates are
associated with higher skill levels.
5.2 Earnings can be measured in two broad ways, through the earnings of residents
where they live and secondly through the earnings where people work. Resident
earnings reflect the average earnings where people live and are indicative of the
quality of skills of local people;
Resident earnings are higher in Doncaster than workplace earnings, indicating
that workers are travelling outside of Doncaster to take better paid jobs.
Doncaster residents earn 1.9% less than the SCR average (gross weekly wages of
£463 compared to £472). If Doncaster residents were competing more for higher
paid jobs within Doncaster and elsewhere, earnings would be higher.
Residential and workplace earnings are over 10% lower than the UK average
Figure 14: Residential and Workplace Earnings 201320
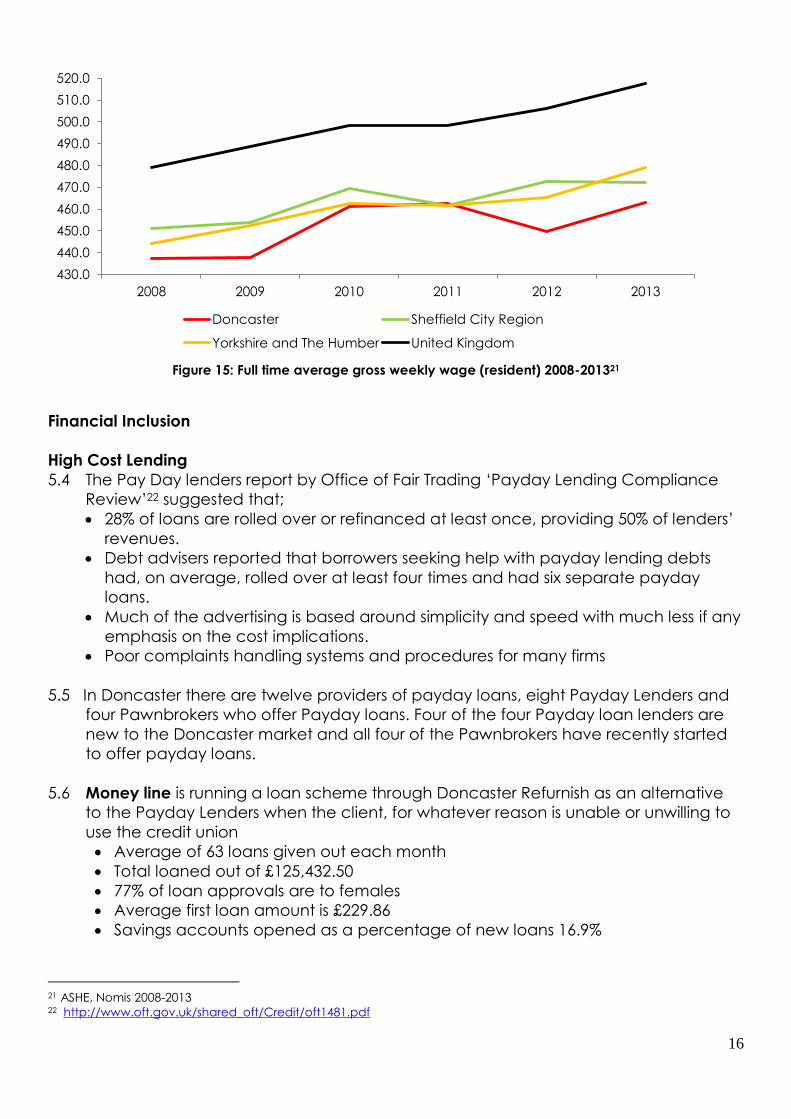
5.3 Growth in the Doncaster resident’s average wage for full time workers between 2008
and 2013 led to a narrowing of the gap between Doncaster, the SCR and Y&H
average resident based weekly earnings. However Doncaster failed to make any
significant changes compared to the England average. After a reduction in average
earnings in Doncaster in 2012, there has now been an increase in 2013. However the
gap between Doncaster’s average and the England average has further increased
to £55 per week compared to the £42 per week difference in 2008.
20 ASHE, Nomis 2013
463.0 472.0
479.1
517.5
457.4 457.8
479.1
517.5
420
430
440
450
460
470
480
490
500
510
520
530
Doncaster Sheffield City
Region
Yorkshire and The
Humber
United Kingdom
Ave
rag
e g
ross
we
ek
ly w
ag
e
Residential earnings 2013 Workplace earnings 2013
16
Figure 15: Full time average gross weekly wage (resident) 2008-201321
Financial Inclusion
High Cost Lending
5.4 The Pay Day lenders report by Office of Fair Trading ‘Payday Lending Compliance
Review’22 suggested that;
28% of loans are rolled over or refinanced at least once, providing 50% of lenders’
revenues.
Debt advisers reported that borrowers seeking help with payday lending debts
had, on average, rolled over at least four times and had six separate payday
loans.
Much of the advertising is based around simplicity and speed with much less if any
emphasis on the cost implications.
Poor complaints handling systems and procedures for many firms
5.5 In Doncaster there are twelve providers of payday loans, eight Payday Lenders and
four Pawnbrokers who offer Payday loans. Four of the four Payday loan lenders are
new to the Doncaster market and all four of the Pawnbrokers have recently started
to offer payday loans.
5.6 Money line is running a loan scheme through Doncaster Refurnish as an alternative
to the Payday Lenders when the client, for whatever reason is unable or unwilling to
use the credit union
Average of 63 loans given out each month
Total loaned out of £125,432.50
77% of loan approvals are to females
Average first loan amount is £229.86
Savings accounts opened as a percentage of new loans 16.9%
21 ASHE, Nomis 2008-2013 22 http://www.oft.gov.uk/shared_oft/Credit/oft1481.pdf
430.0
440.0
450.0
460.0
470.0
480.0
490.0
500.0
510.0
520.0
2008 2009 2010 2011 2012 2013
Doncaster Sheffield City Region
Yorkshire and The Humber United Kingdom

17
5.7 Local groups have been encouraged to bid for cash, confiscated from illegal money
lenders, as part of an initiative organised by the England Illegal Money Lending Team
and Doncaster Council. The ‘Your Choice’ scheme gave residents a say in how
money taken from loan sharks is spent to improve their community. The specialist
Team who investigate and prosecute loan sharks put forward £3000 of proceeds of
crime money to fund as many projects as possible.
5.8 Local residents, charities, community and voluntary groups, schools and statutory
agencies benefiting those that live in Doncaster were welcome to apply for the
cash, to spend on any worthwhile community project which does one of the
following:
Contributes to raising the awareness of the dangers of using ‘loan sharks’
Promotes professional credit options to people at risk of using ‘loan sharks’
Promotes financial management or budgeting to people at risk of using ‘loan
sharks’
Reduces crime, disorder and illegal money lending in the local area
5.9 There are many money management programmes/services available including;
Money Matters has established Peer Support Groups around Doncaster, to provide
money saving tips, advice and guidance in deprived communities. By the end of
year 2, the project developed 1723 Action Plans, delivered 1372 interventions,
started 42 money advice groups, held 700 workshops and has 27 volunteers.
Money Works started in July 2013, and aims to increase personal financial
capability through one to one support, ultimately to move away from benefit
dependency and gain independence through employment.
Moving On helps people who have experienced drug or alcohol problems, to
make a positive change in their lives by progressing into training or employment.
To date 253 people have accessed this support, 97 have undertaken training, and
32 have progressed into work.
UK Online Training programme and the Terrace Job Club support people to learn
how to use computers and gain IT skills for employment. To date 423 people have
gained basic IT Skills and have progressed towards job readiness. The job club
provides a drop in for job search twice weekly.
5.10 South Yorkshire Credit Union continues to recruit new members in the Doncaster area
and provide affordable loans, Christmas savings and savings accounts. Members
can also access debt advice, budgeting advice and credit options.
18
Section 6: Health
6.1 Health has been improving in Doncaster for both men and women over the last 10
years. Life expectancy at birth for men (2008-10) was 76.8 years, this has increased
from 74.6 ten years earlier (1999-01). In women the increase in the same period is
from 79.4 years to 81.4 years. However life expectancy is higher nationally, currently
life expectancy for men in England & Wales is 78.6 years, 1.8 years ahead of
Doncaster. In women national life expectancy is 82.6 years, 1.2 years higher than
Doncaster.
6.2 Mortality rates for the major causes of premature deaths have been falling in the
borough. Death rate for cancers, coronary heart disease and strokes have all been
falling since 2000. It is worth noting that while mortality rates from lung cancer remain
very high in Doncaster they too are now falling, and there is some evidence that
they may be falling faster than nationally. There are two important exceptions to this
general picture. Respiratory disease mortality rates remain high and while they are
not significantly increasing they show no sign of falling either. The second exception is
deaths from liver disease, which continue to rise. Most of these deaths are related to
sustained and excessive alcohol consumption.
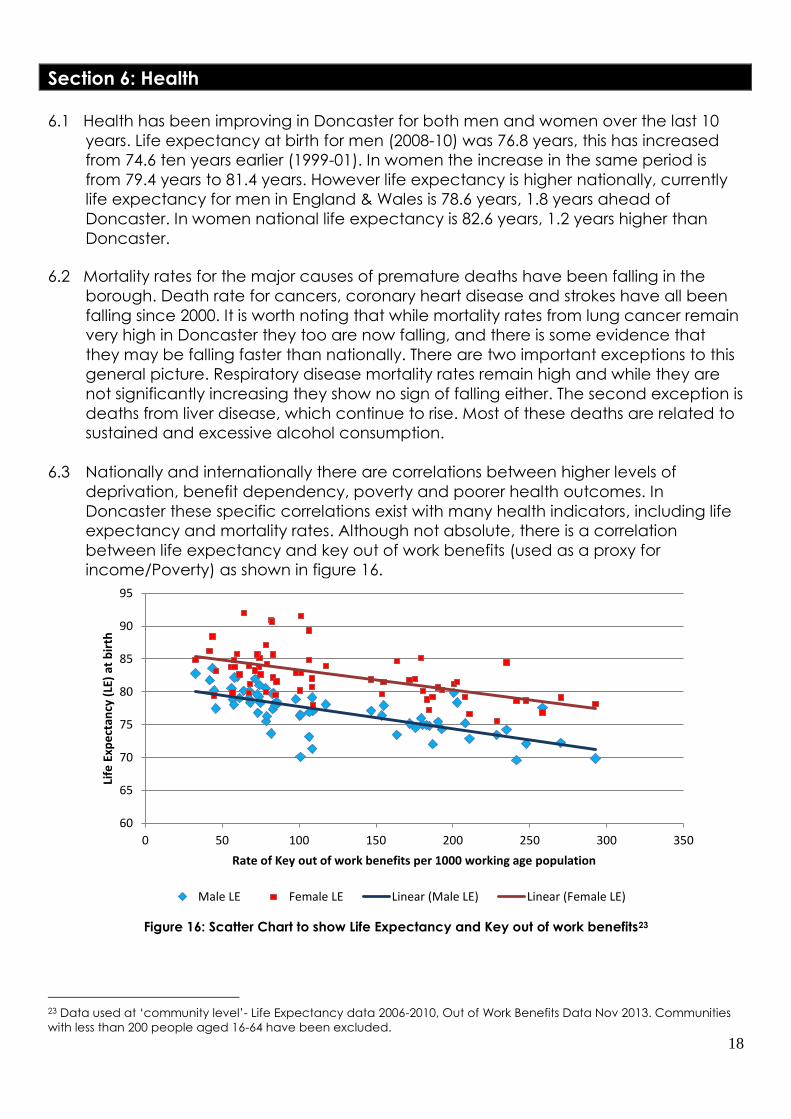
6.3 Nationally and internationally there are correlations between higher levels of
deprivation, benefit dependency, poverty and poorer health outcomes. In
Doncaster these specific correlations exist with many health indicators, including life
expectancy and mortality rates. Although not absolute, there is a correlation
between life expectancy and key out of work benefits (used as a proxy for
income/Poverty) as shown in figure 16.
Figure 16: Scatter Chart to show Life Expectancy and Key out of work benefits23
23 Data used at ‘community level’- Life Expectancy data 2006-2010, Out of Work Benefits Data Nov 2013. Communities
with less than 200 people aged 16-64 have been excluded.
60
65
70
75
80
85
90
95
0 50 100 150 200 250 300 350
Life
Exp
ect
ancy
(LE
) at
bir
th
Rate of Key out of work benefits per 1000 working age population
Male LE Female LE Linear (Male LE) Linear (Female LE)

19
6.4 As part of the Joint Strategic Needs Assessment 2012, a study of Mental Health in
Doncaster, from the perspective of the voluntary sector, was undertaken24. The
report found that the recession and debt issues were affecting people’s mental
health. The recession was also impacting mental health through behaviours such as
alcohol use and gambling. Changes to the benefit system, such as Work Capability
Assessments, were also having a negative impact on people’s mental health. A small
scale survey, undertaken in summer 2013 in Barnsley, of residents accessing financial
advices services, identified that:
82% of clients stated that benefit changes had made them worried about the
future;
76% said the thought of them had made them feel more stressed and
69% said the benefit changes had made them feel depressed.
.
24 http://www.doncastertogether.org.uk/Doncaster_Data_Observatory/mental_health_in_doncaster.asp
20
Section 7: Children & Young People
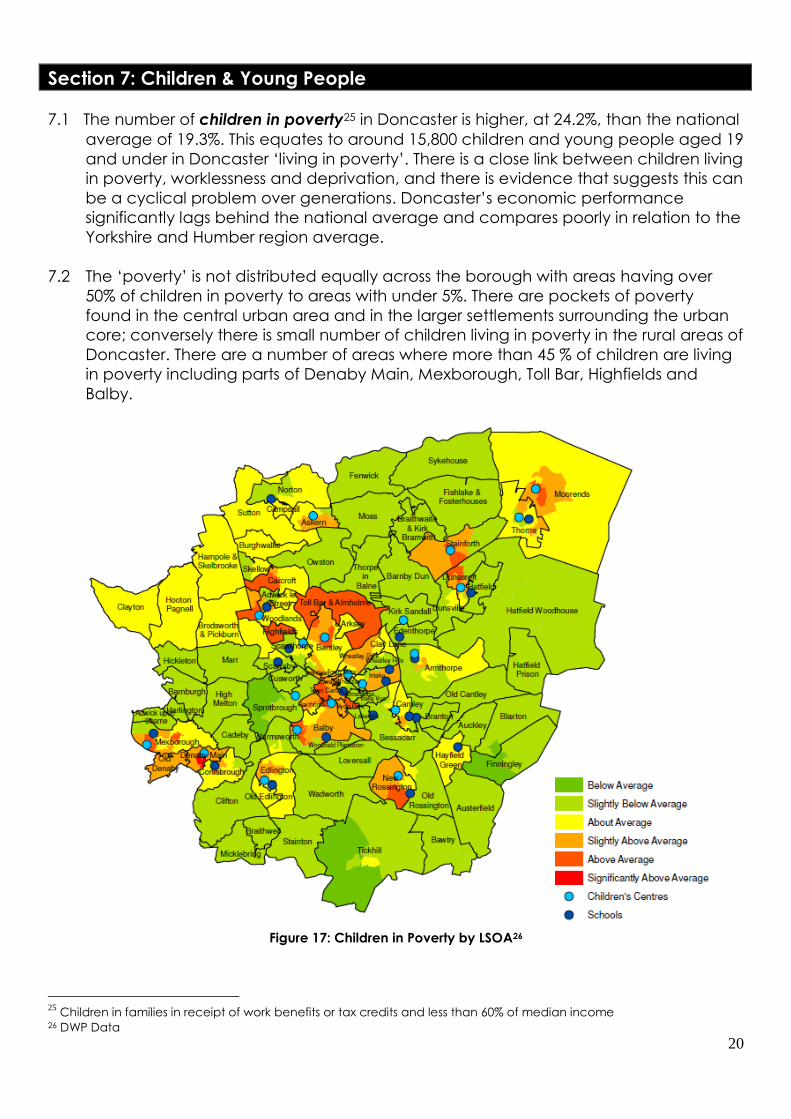
7.1 The number of children in poverty25 in Doncaster is higher, at 24.2%, than the national
average of 19.3%. This equates to around 15,800 children and young people aged 19
and under in Doncaster ‘living in poverty’. There is a close link between children living
in poverty, worklessness and deprivation, and there is evidence that suggests this can
be a cyclical problem over generations. Doncaster’s economic performance
significantly lags behind the national average and compares poorly in relation to the
Yorkshire and Humber region average.
7.2 The ‘poverty’ is not distributed equally across the borough with areas having over
50% of children in poverty to areas with under 5%. There are pockets of poverty
found in the central urban area and in the larger settlements surrounding the urban
core; conversely there is small number of children living in poverty in the rural areas of
Doncaster. There are a number of areas where more than 45 % of children are living
in poverty including parts of Denaby Main, Mexborough, Toll Bar, Highfields and
Balby.
Figure 17: Children in Poverty by LSOA26
25
Children in families in receipt of work benefits or tax credits and less than 60% of median income 26 DWP Data

21
7.3 In January 2014 the government launched a consultation on a child poverty
strategy up to 201727. As part of this consultation some of the main factors of child
poverty, and the length and effect they have, were considered. The top factors
were: parental employment and wage levels; and parental qualifications.
Doncaster has higher levels of unemployment (including longer term claimants)
and lower levels of working age qualifications, particularly at level 4. Whilst
Doncaster underperforms in these areas child poverty will remain an issue. Further
work has been carried out to ascertain the main aspects of child poverty that
translate into adult poverty (i.e. a child growing up in poverty and remaining in
poverty as an adult). The findings point to educational attainment as the key to
supporting a child out of poverty
Figure 18: Drivers of Child Poverty28
Figure 19: Key factors that impact on future poverty29
27
https://www.gov.uk/government/consultations/child-poverty-a-draft-strategy 28 Certainty – Does it have an effect; Strength - How big is the effect; Coverage – How many are affected 29 Certainty – Does it have an effect; Strength - How big is the effect; Coverage – How many are affected

22
7.4 The proportion of pupils that are eligible for, and claim, free school meals has been
used as a proxy for deprivation. It is used to determine the Pupil Premium funding to
schools. Doncaster has higher numbers of children eligible for free school meals than
regional and national averages, with 5750 (21.2% of pupils).
Figure 20: Proportion of Pupils Eligible and claiming free school meals30
Apprenticeships
7.5 The number of apprenticeships offered to people in Doncaster has risen, particularly
in the period 2009/10 – 2011/12. Achievements have risen year on year for the past
eight years. There has been a drop in the number of apprenticeship starts in 2012/13,
but the continued increase in the number of achievements remains positive.
Furthermore the proportion of apprenticeship achievements at ‘advanced or higher’
is increasing; 27% in 2010/11, 32% in 2011/12 and 42% in 2012/13.
Figure 21: Number of Apprenticeship Starts and Achievements by Year in Doncaster31
30 DFE, School Census Jan 2013
18.1%
18.7%
21.2%
0.00% 5.00% 10.00% 15.00% 20.00% 25.00%
England
Yorkshire & Humber
Doncaster
England Yorkshire & Humber Doncaster
1840 1630
2030 2340 2440
3610
4550
3640
830 1090 1100
1440 1440 1590
2010 2170
0
500
1000
1500
2000
2500
3000
3500
4000
4500
5000
2005/06 2006/07 2007/08 2008/09 2009/10 2010/11 2011/12 2012/13
Starts Achievements

23
Not in Education, Employment or Training (NEET)
7.6 The proportion of young people (16-18) that are NEET in Doncaster is 6.3%32 which is
much higher than the national average (5.4%) and also higher than the regional
average (5.8%). Almost half (45.7%) of young people who are NEET are from six
communities across Doncaster Central (10.9%)
Mexborough (9.3%)
Balby (6.5%)
Stainforth & Moorends (6.5%)
Wheatley (6.4%)
Rossington (6.1%)
7.7 Nearly 70% of the young people (16-18) who are NEET in Doncaster, are so because
of three reasons, they require either level 2 (GCSE) training, sub level 2 training or
they are a teenage parent or pregnant. This is similar to other areas but highlights the
importance of successful outcomes in school.
Figure 22: Reasons for NEET in Doncaster33
Qualifications at age 19
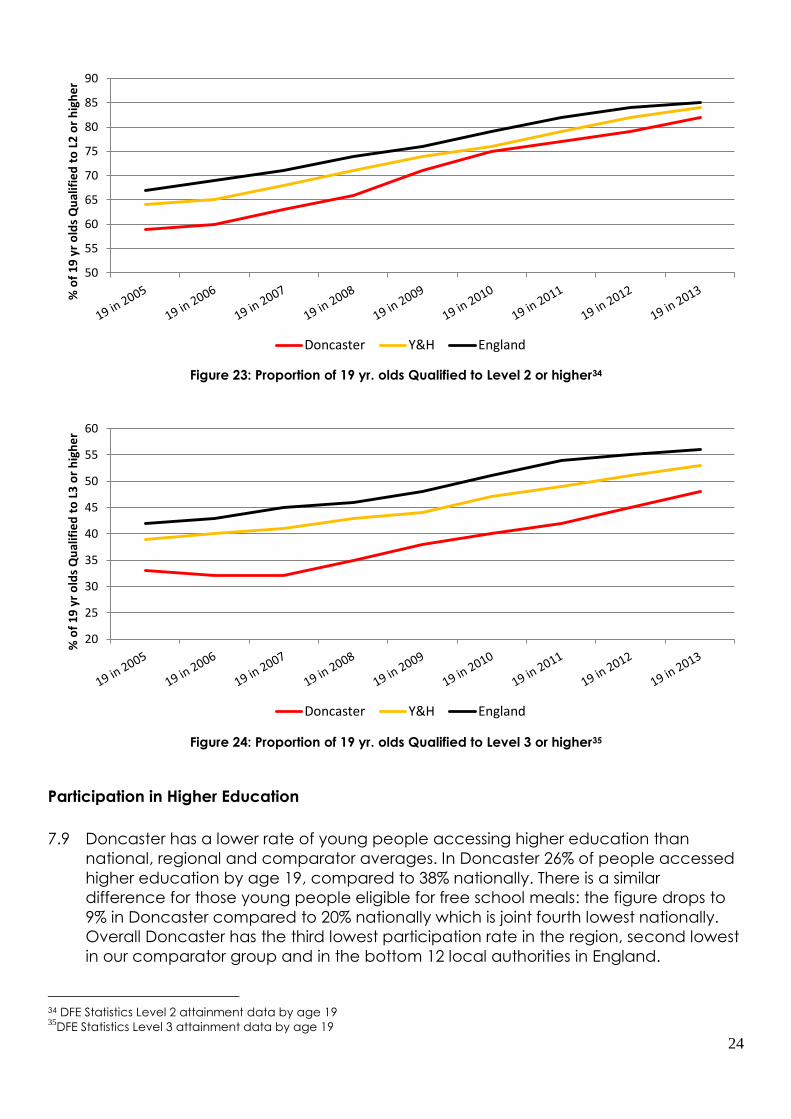
7.8 Although Doncaster has improved consistently over several years, the numbers of 19
year olds with level 2 and level 3 qualifications are not as high regional and national
benchmarks, particularly level 3 qualifications. To equal the national average there
would need to be approximately an extra 105 qualified to level 2 and 290 qualified
to level 3 in Doncaster.
31 Skills Funding Agency and DBIS Data, 2005/6 – 2012/13 32 DFE Local Authority NEET Figures Apr 14 – Jun 14. There is also a high proportion of young people where activity is not
known (9.10%), as a result the proportion of people NEET in Doncaster may be inaccurate. 33 CCIS Data March 2014
24.1%
22.9%
22.8%
13.2%
7.6%
3.2% 3.2%
1.2% 1.1% 0.8%
Req level 2 trng provision
Supporting Family - Teenage parents orPregnantReq sub level 2 trng provision
Seeking employment only
Sickness
Start date agreed
Other
Working not for reward
Supporting Family Young Carers
Req level 3+ trng provision
24
Figure 23: Proportion of 19 yr. olds Qualified to Level 2 or higher34
Figure 24: Proportion of 19 yr. olds Qualified to Level 3 or higher35
Participation in Higher Education
7.9 Doncaster has a lower rate of young people accessing higher education than
national, regional and comparator averages. In Doncaster 26% of people accessed
higher education by age 19, compared to 38% nationally. There is a similar
difference for those young people eligible for free school meals: the figure drops to
9% in Doncaster compared to 20% nationally which is joint fourth lowest nationally.
Overall Doncaster has the third lowest participation rate in the region, second lowest
in our comparator group and in the bottom 12 local authorities in England.
34 DFE Statistics Level 2 attainment data by age 19 35
DFE Statistics Level 3 attainment data by age 19
50
55
60
65
70
75
80
85
90%
of
19
yr
old
s Q
ual
ifie
d t
o L
2 o
r h
igh
er
Doncaster Y&H England
20
25
30
35
40
45
50
55
60
% o
f 1
9 y
r o
lds
Qu
alif
ied
to
L3
or
hig
he
r
Doncaster Y&H England
25
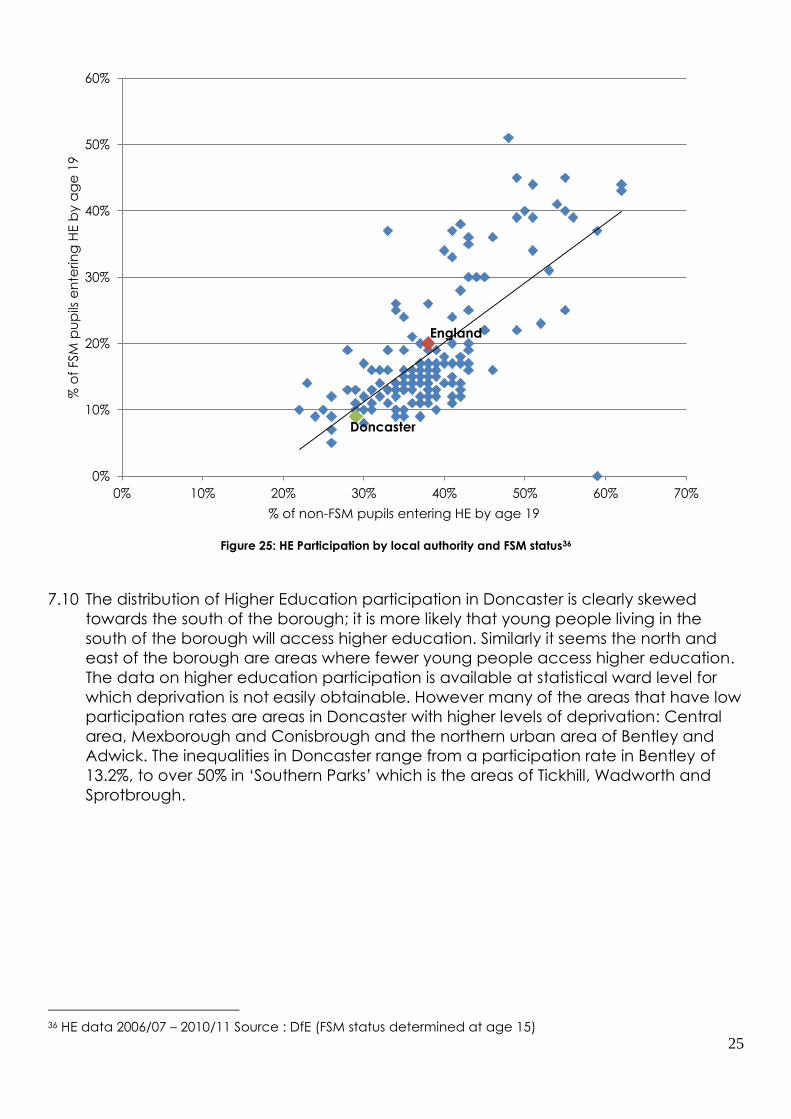
Figure 25: HE Participation by local authority and FSM status36
7.10 The distribution of Higher Education participation in Doncaster is clearly skewed
towards the south of the borough; it is more likely that young people living in the
south of the borough will access higher education. Similarly it seems the north and
east of the borough are areas where fewer young people access higher education.
The data on higher education participation is available at statistical ward level for
which deprivation is not easily obtainable. However many of the areas that have low
participation rates are areas in Doncaster with higher levels of deprivation: Central
area, Mexborough and Conisbrough and the northern urban area of Bentley and
Adwick. The inequalities in Doncaster range from a participation rate in Bentley of
13.2%, to over 50% in ‘Southern Parks’ which is the areas of Tickhill, Wadworth and
Sprotbrough.
36 HE data 2006/07 – 2010/11 Source : DfE (FSM status determined at age 15)
England
Doncaster
0%
10%
20%
30%
40%
50%
60%
0% 10% 20% 30% 40% 50% 60% 70%
% o
f FSM
pu
pils
en
terin
g H
E b
y a
ge
19
% of non-FSM pupils entering HE by age 19

26
Section 8: Stronger Families
8.1 Troubled families (locally the Stronger Families Programme) are those that have
problems and cause problems to the community around them, putting high costs on
the public sector. The government is committed to working with local authorities and
their partners to help 120,000 troubled families in England to turn their lives around by
2015. Troubled families are defined as households that:
Are involved in crime and anti-social behaviour
Have children not in school
Have an adult on out-of-work benefits
8.2 Within these three criteria there are more specific definitions in order to fully identify
those families that should be included within the programme. There is also the
capability for local authorities to use their discretion to include any other families that
they are concerned about. The national programme allows for payment by results if
outcomes against the set criteria can be evidenced.
8.3 It was estimated nationally that Doncaster would have 870 families that would meet
the criteria but as at April 2014 this number is 1047 with potentially more identified
through area and partner teams. This programme has made claims (and therefore
achieved outcomes) for 395 families up to April 2014 which gives an indication of the
good work that has taken place to date but also the work still required in the phase
of the programme which runs up to Spring/Summer 2015.
27
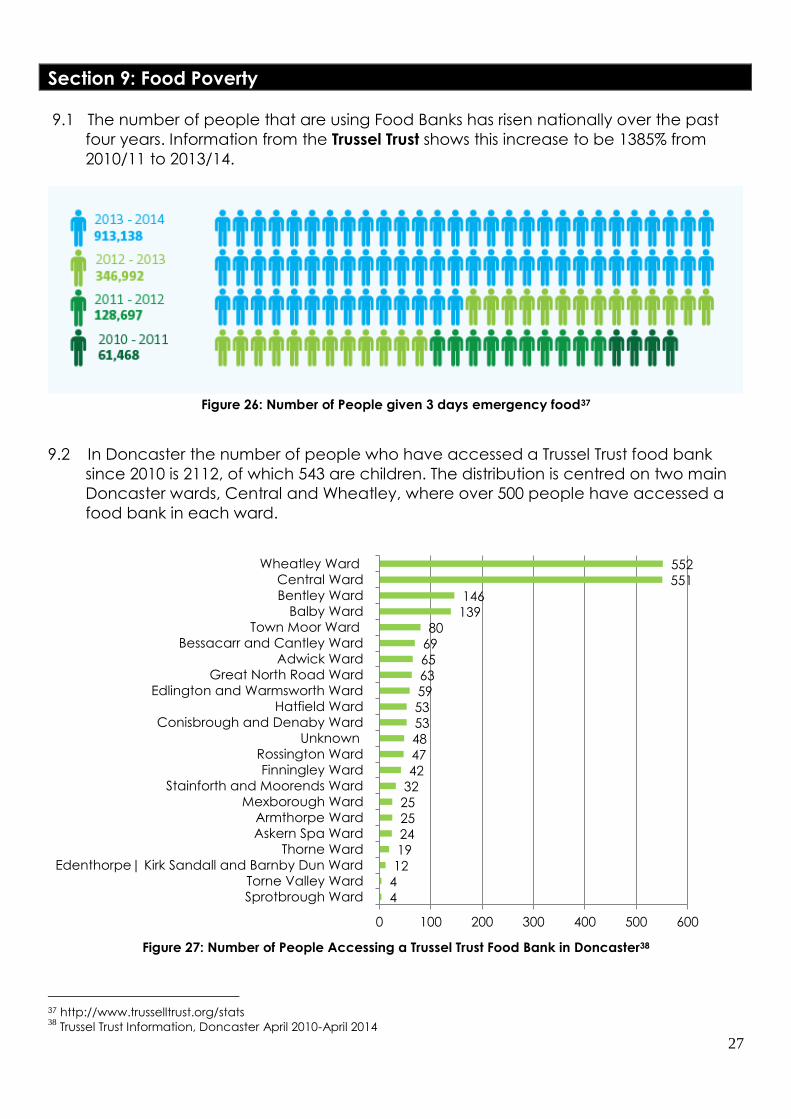
Section 9: Food Poverty
9.1 The number of people that are using Food Banks has risen nationally over the past
four years. Information from the Trussel Trust shows this increase to be 1385% from
2010/11 to 2013/14.
Figure 26: Number of People given 3 days emergency food37
9.2 In Doncaster the number of people who have accessed a Trussel Trust food bank
since 2010 is 2112, of which 543 are children. The distribution is centred on two main
Doncaster wards, Central and Wheatley, where over 500 people have accessed a
food bank in each ward.
Figure 27: Number of People Accessing a Trussel Trust Food Bank in Doncaster38
37 http://www.trusselltrust.org/stats 38
Trussel Trust Information, Doncaster April 2010-April 2014
4
4
12
19 24
25
25
32
42 47
48
53
53
59 63
65
69
80
139 146
551
552
0 100 200 300 400 500 600
Sprotbrough Ward
Torne Valley Ward
Edenthorpe| Kirk Sandall and Barnby Dun Ward
Thorne Ward
Askern Spa WardArmthorpe Ward
Mexborough Ward
Stainforth and Moorends Ward
Finningley Ward
Rossington Ward Unknown
Conisbrough and Denaby Ward
Hatfield Ward
Edlington and Warmsworth Ward
Great North Road WardAdwick Ward
Bessacarr and Cantley Ward
Town Moor Ward
Balby Ward
Bentley WardCentral Ward
Wheatley Ward

28
9.3 The main reasons for people accessing Food Banks are associated with key benefits.
A change in the benefits or a delay in the process of people receiving their benefits,
accounted for 61.6% of people from April 10 to April 14. In addition, nearly 17% of
people are accessing because of low income - this should be referenced with the
earlier chapter on wages and earnings in Doncaster.
Figure 28: Crisis Types/Reasons for Accessing Food Banks39
39 Trussel Trust Information, Doncaster April 2010-April 2014
0
100
200
300
400
500
600
700
800
900

29
Section 10: Fuel Poverty
10.1 In 2011, around 2.39 million households in England were identified as fuel poor (DECC
2013), representing approximately 11% of the population. Fuel poverty rates for
Doncaster and the surrounding areas are slightly higher at 11.4%.
Figure 29: Fuel Poverty Households, 201140
10.2 In the UK a household was said to be in fuel poverty if it needs to spend more than
10% of its income on fuel to maintain a safe temperature (Marmot Review Team,
2011). The government has recently set out a new definition of fuel poverty which it
intends to adopt under the Low Income High Costs (LIHC) framework (DECC, 2013).
Under the new definition, a household will be said to be in fuel poverty if:
They have required fuel costs that are above average (the national median level)
Were they to spend that amount they would be left with a residual income below
the official poverty line.
10.3 The key drivers behind fuel poverty are the energy efficiency of the property, the cost
of energy and the income of the household. Fuel poverty is more likely when
household income is low; a property is poorly insulated and has an old inefficient
heating system. It is less likely when a property is well insulated and income levels are
higher. Where a property is not connected to the mains gas supply, as in some rural
areas, or is older with solid walls unsuitable for cavity wall insulation, fuel poverty is
also more likely.
10.4 Within Doncaster, the highest concentration of fuel poverty was found in part of the
town centre, at 37.9% of households. This compares with one of the lowest
concentrations, in Old Rossington, at 3.7%. The map below gives a comparison with
the national average.
40 Department for Energy and Climate Change Information 2011.
2011 Data All Households Fuel Poor
Households % Fuel Poor
Barnsley 102,298 11,175 10.9%
Doncaster 127,619 14,516 11.4%
Rotherham 110,636 11,160 10.1%
Sheffield 234,605 25,899 11.0%
Yorkshire & Humber 2,266,428 249,518 11.0%
England 21,918,363 2,390,053 10.9%

30
Figure 30: Fuel Poverty by LSOA in Doncaster41
10.5 The Children’s Society report Behind Cold Doors42 examined the impact of fuel
poverty on families with children. It found that two-thirds of families with children,
around 5 million families, were likely to turn down their heating because they could
not afford to pay for it. The Warm Home Discount is a key form of support for low
income families with children. It provides the extra help they need to heat their
homes in winter and reduces the need for them to cut back on other basics in order
to pay for fuel. However, around 1.9 million children living in poverty are in families
that do not receive this vital help. Many of these children are excluded because
their parents are in low paid work rather than in receipt of benefits.
10.6 A Warm Homes, Warm Families report presented findings from a research project
funded by Consumer Futures and NHS Doncaster. It explores the factors influencing
the ability of households with children with asthma to keep warm at home in winter
and access help. The decisions parents have to take in order to keep their homes
warm were examined.
41 Department for Energy and Climate Change Information by LSOA, 2011. 42 http://www.childrenssociety.org.uk/sites/default/files/tcs/behind_cold_doors_-_final.pdf
M o o r e n d s
A s k e r n
B e n tle y
Y o r k R o a d
T o w n C e n tr e
H e x th o rp e
B a lb y
H y d e P a r k
T o w n M o o r
L o w e r
W h e a tle y

31
Section 11: Area of Focus/Priorities
11.1 It seems clear that there are key reasons why poverty exists in higher concentrations
in some parts of Doncaster and some key challenges that arise because of this. This
division of thought seems like a useful process to summarise areas of focus and
priorities in Doncaster;
Key Drivers of Poverty
11.2 In Doncaster there are a number of key factors that drive or explain the higher
proportions of people in poverty;
Low wage economy/lower wages
Higher benefit dependency and unemployment
Lower skill levels (working age population and young people)
Welfare Reform (although not unique to Doncaster)
Young People accessing work or participating in Higher Education
Entrenched deprivation levels
Key Challenges
11.3 There seems to be a number of key challenges that present due to higher levels of
poverty;
Rise in food poverty
Local residents accessing jobs
Higher levels of fuel poverty
Poorer health outcomes including mental health issues
Education and participation in Higher Education
Rise in unhealthy borrowing and debt
Services for Housing & Benefits
o Rent arrears and engagement of tenants
o Advice, awareness and debt collection