Uzbekistan Telecommunication Network Expansion Project (1 ... · 1 Uzbekistan Telecommunication...
23
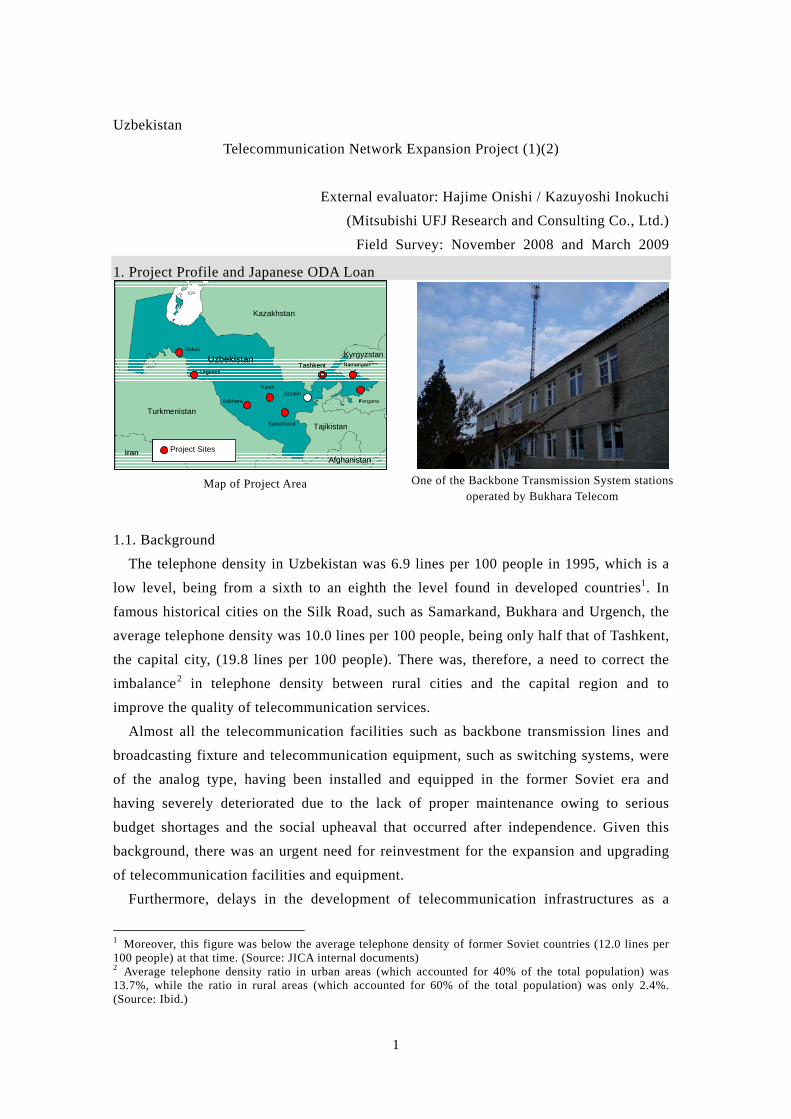
1 Uzbekistan Telecommunication Network Expansion Project (1)(2) External evaluator: Hajime Onishi / Kazuyoshi Inokuchi (Mitsubishi UFJ Research and Consulting Co., Ltd.) Field Survey: November 2008 and March 2009 1. Project Profile and Japanese ODA Loan Tashkent Fergana Namangan Samarkand Navoi Bukhara Urgench Nukus Uzbekistan Kazakhstan Turkmenistan Tajikistan Iran Afghanistan Jizzakh Kyrgyzstan Tashkent Fergana Namangan Samarkand Navoi Bukhara Urgench Nukus Uzbekistan Kazakhstan Turkmenistan Tajikistan Iran Afghanistan Jizzakh Kyrgyzstan Project Sites Map of Project Area One of the Backbone Transmission System stations operated by Bukhara Telecom 1.1. Background The telephone density in Uzbekistan was 6.9 lines per 100 people in 1995, which is a low level, being from a sixth to an eighth the level found in developed countries 1 . In famous historical cities on the Silk Road, such as Samarkand, Bukhara and Urgench, the average telephone density was 10.0 lines per 100 people, being only half that of Tashkent, the capital city, (19.8 lines per 100 people). There was, therefore, a need to correct the imbalance 2 in telephone density between rural cities and the capital region and to improve the quality of telecommunication services. Almost all the telecommunication facilities such as backbone transmission lines and broadcasting fixture and telecommunication equipment, such as switching systems, were of the analog type, having been installed and equipped in the former Soviet era and having severely deteriorated due to the lack of proper maintenance owing to serious budget shortages and the social upheaval that occurred after independence. Given this background, there was an urgent need for reinvestment for the expansion and upgrading of telecommunication facilities and equipment. Furthermore, delays in the development of telecommunication infrastructures as a 1 Moreover, this figure was below the average telephone density of former Soviet countries (12.0 lines per 100 people) at that time. (Source: JICA internal documents) 2 Average telephone density ratio in urban areas (which accounted for 40% of the total population) was 13.7%, while the ratio in rural areas (which accounted for 60% of the total population) was only 2.4%. (Source: Ibid.)
Transcript of Uzbekistan Telecommunication Network Expansion Project (1 ... · 1 Uzbekistan Telecommunication...
1
Uzbekistan
Telecommunication Network Expansion Project (1)(2)
External evaluator: Hajime Onishi / Kazuyoshi Inokuchi
(Mitsubishi UFJ Research and Consulting Co., Ltd.)
Field Survey: November 2008 and March 2009
1. Project Profile and Japanese ODA Loan
Tashkent
Fergana
Namangan
Samarkand
Navoi
Bukhara
Urgench
Nukus
Uzbekistan
Kazakhstan
Turkmenistan
Tajikistan
IranAfghanistan
Jizzakh
Kyrgyzstan
Project Sites
Tashkent
Fergana
Namangan
Samarkand
Navoi
Bukhara
Urgench
Nukus
Uzbekistan
Kazakhstan
Turkmenistan
Tajikistan
IranAfghanistan
Jizzakh
Kyrgyzstan
Project SitesProject Sites
Map of Project Area
One of the Backbone Transmission System stations
operated by Bukhara Telecom
1.1. Background
The telephone density in Uzbekistan was 6.9 lines per 100 people in 1995, which is a
low level, being from a sixth to an eighth the level found in developed countries1. In
famous historical cities on the Silk Road, such as Samarkand, Bukhara and Urgench, the
average telephone density was 10.0 lines per 100 people, being only half that of Tashkent,
the capital city, (19.8 lines per 100 people). There was, therefore, a need to correct the
imbalance2 in telephone density between rural cities and the capital region and to
improve the quality of telecommunication services.
Almost all the telecommunication facilities such as backbone transmission lines and
broadcasting fixture and telecommunication equipment, such as switching systems, were
of the analog type, having been installed and equipped in the former Soviet era and
having severely deteriorated due to the lack of proper maintenance owing to serious
budget shortages and the social upheaval that occurred after independence. Given this
background, there was an urgent need for reinvestment for the expansion and upgrading
of telecommunication facilities and equipment.
Furthermore, delays in the development of telecommunication infrastructures as a
1 Moreover, this figure was below the average telephone density of former Soviet countries (12.0 lines per 100 people) at that time. (Source: JICA internal documents) 2 Average telephone density ratio in urban areas (which accounted for 40% of the total population) was 13.7%, while the ratio in rural areas (which accounted for 60% of the total population) was only 2.4%. (Source: Ibid.)

2
whole was regarded as the biggest bottleneck in promoting market-oriented economic
reform and to achieving industrial growth. Tackling these challenges, as well as to
respond to the increasing demand of telecommunication services, the rapid development
and expansion of the telecommunication infrastructure in Uzbekistan was of urgent
importance.
1.2. Objective
To expand telecommunication networks and to improve the telecommunications service
by installing digital switching systems, backbone transmission networks, Wireless Local
Loop (WILL) systems and TV & radio broadcasting systems in major cities in the central
and western regions of Uzbekistan, and thereby contributing to the balanced industrial
growth of the whole nation.
1.3. Borrower / Executing Agencies
Government of the Republic of Uzbekistan / Ministry of Communications (UZMOC, at
the time of appraisal of Phase-I) / The Posts and Telecommunications Agency of
Uzbekistan (at the time of appraisal of Phase-II) / Communication and Information
Agency of Uzbekistan (UZCIA, at the time of completion)
1.4. Outline of Loan Agreement
Loan Amount / Disbursed Amount 12,700 million yen / 12,587 million yen (Phase-I)
12,692 million yen / 12,121 million yen (Phase-II)
Exchange of Notes /
Loan Agreement
June 1995 / June 1995 (Phase-I)
November 1999 / December 1999 (Phase-II)
Terms and Conditions
-Interest Rate
-Repayment Period (Grace Period)
-Procurement
3.0% for Phase-I / 2.2% for Phase-II (1.8% for
Consulting Services)
30 years (10 years) for Phase-I & II
General untied for Phase-I & II
Final Disbursement Date October 2000 (Phase-I)
October 2006 (Phase-II)
Main Contactors (over 1 billion
yen)
Mitsui Corporation (Japan) /
Marubeni Corporation (Japan)
Consulting Services (over 100
million yen)
NTT International (Japan) / InfoCom Research, Inc.
(Japan) / Japan Technology Transfer (Japan) /
DETECON (Germany)
Feasibility Study (F/S), etc. November 1993 UZMOC
September 1998 The Posts and Telecommunications
Agency of Uzbekistan (Revised F/S)
3
2. Evaluation Result (Rating: B)
2.1. Relevance (Rating: a)
The Project has been highly relevant with Uzbekistan's development needs and national
policies at the times of both appraisal and ex-post evaluation.
2.1.1. Relevance at the time of appraisal
The government of Uzbekistan regarded the development of telecommunications as
one of its priority issues in regards to development at the appraisal of Phase-I in 1995 and
approved Regulation of the Cabinet of Ministries N307, “National Program for the
Reconstruction and Development of the Telecommunications Network” in August 1995.
The objectives of the Program were to create a national telecommunications network on
the basis of a digital transmission system and digital switching equipment that foresaw
deep integration with the global telecommunications system by year 2010 and to increase
the telephone density per 100 habitants to 13.4.
The government of Uzbekistan also approved “The State Program on Distribution of
TV/Radio Programs to All Regions of the Republic of Uzbekistan Using Up-To-Date
Communication Devices” in 1997 to achieve full reconstruction, upgrade and expansion
of the network of TV/Radio program broadcasting. The objective of the Program was to
achieve 100% coverage of the population with four State TV/Radio program channels and
improve average daily broadcasting time.
The national telephone density at appraisal in Uzbekistan was noticeably less than the
average in the former USSR. In addition, Uzbekistan faced serious quality deterioration
and decrepit telecommunication and broadcasting facilities due to lack of maintenance
after independence, while regarding them as development issues. Therefore, the Project,
aiming at upgrading and modernizing the telecommunications infrastructure, was
consistent with the development policies to tackle the development problems in
Uzbekistan.
2.1.2. Relevance at the time of evaluation
At the time of ex-post evaluation in 2008, N307 still remains a key policy in the
telecommunications’ sector strategy and modernization in the telecommunications and
broadcasting infrastructure is still regarded as a priority issue in the telecommunications
sector. Reflecting the recent trend of the rapid expansion of the cellular phone service, the
government of Uzbekistan approved Decree PP-117 in July 2005, whose short-term
targets were to achieve 100% digitalization in the telecommunications system and 3
million cellular communication subscribers by 20103. There is no change in government
3 This is a reflection of a new phenomenon: the explosive expansion of cellular phones. The new target to

4
policies aiming at bringing the domestic communication network close to international
standards. In addition to the government adopting PP-117 the government took a flexible
measure in response to the telecommunication technological revolution.
Due to the rapid spread of cellular phones, the demand for fixed telephone lines in four
target areas, such as Nukus, Urgench, Navoi and Bukhara, is limited and the demand for
the installation of land lines is low4. On the other hand, subscribers for cellular phones
already exceeded the target of PP-117, 3 million and reached over 5.87 million in 20075.
Considering those trends, demand for telecommunications still remains high and the need
to upgrade and modernize the communications infrastructure has not changed.
Regarding the development of broadcasting infrastructure, the government approved
Decree 592, “On measures on assurance of effective use of radio frequency spectrum in
the sphere of television and radio broadcasting” in December 2004 to aid the
enhancement of the modernization of TV and radio broadcasting, including the expansion
of broadcasting coverage and extension of broadcasting time.
The project components described below are in line with the above-described situation
and development issues in Uzbekistan. The Project has high priority being to develop the
communications and broadcasting infrastructure.
2.2. Efficiency (Rating: b)
The actual cost slightly exceeded the plan and the Project period (especially Phase-II)
was much longer than planned; therefore the evaluation for efficiency is moderate.
2.2.1. Outputs
Major differences in outputs between the actual and original plan at the time of
appraisal in both Phase-I and 2 were observed. As a result of the Site Survey conducted in
1996 just after the start of the Project, it was confirmed that there are new findings which
were not observed in the feasibility study conducted in 1993, which became the baseline
study for the planning of the Project. Two main findings, namely, the necessity to deal
with the new market environment, such as demand fluctuation and the importance of
installing new technology brought on by the communication technology revolution were
recognized. Therefore, the priorities of the Project components were changed as follows: enable cellular phones to be an alternative tool to fixed line communication was set. This policy helped to lower the importance of fixed lines. However, there is no change observed in the policy of communication system digitalization. Besides, backbone transmission systems, which were constructed by the Project, are utilized as the most important transmission channel for the mobile telephone communication service. Thus, the Project is consistent with the policy targeting the expansion of the cellular phone service in Uzbekistan. 4 At the time of ex-post evaluation, additional demand for fixed lines is only 18,600 lines (source: Uzbektelecom). This is far below 664,000 lines, the forecast for the year 2005 estimated at the time of the Project appraisal. 5 Source: Statistical Office of Uzbekistan (2008) Transport and Communication in Uzbekistan, 2008 (original text was written in Uzbek)

5
(1) construction of a transmission system, (2) digitalization of the switching system and
(3) construction of subscriber cables6. In line with these priorities, the components of
Phase-I were reviewed. The findings of the Site Survey were also applicable to Phase-II
and the construction of a fiber optic transmission system was regarded as the prioritized
component. The changes and the background to these changes in both Phase-I and
Phase-II are listed below.
Figure-1: Location of Project Sites (Phase-I & II)
Fergana
AndizhanNamangan
Karshi
Termez
Angren
To Shanghai via Bishkek, Almaty, etc.
To Frankfurt via Ashgabat (Turkmenistan), Iran, Turkey, etc.
Major cities related to the Project
Investigated by the post evaluation mission among the above cities
Backbone Transmission System (Fiber optic, Including Phase-I & II)
Backbone Transmission System (Fiber optic) constructed by Trans-Asia-Europe(TAE) Project
Backbone Transmission System (Microwave, Including Phase-I & II)
Aral Sea
TurkmenistaTurkmenistann
TajikistanTajikistan
KyrgyzstanKyrgyzstan
KazakhstanKazakhstan
AfghanistanAfghanistan
UzbekistanUzbekistan
IranIran
Nukus
Urgench
Uchquduq
Tashkent
Samarkand
Navoi
Bukhara
Major development area of Junction Transmission System (Fiber optic, including Phase-I & II)
Table-1: Changes in Output (Phase-I)
Project Components Original Actual
1. Digital switching system 198,000 lines 281,739 lines7
2. Subscriber cable 325,000km in total Cancelled
3. Backbone transmission system (Fiber Optic) 720km in total 833km in total
4. Junction transmission system (Fiber Optic) 470km in total 1,082km in total
5. Backbone transmission system (Microwave) 490km in total 884km in total
6. Consulting Services 203M/M 231M/M
Source: Uzbektelecom and others
Digital switching system: It was found that demand for the digital switching system8
exceeded the original expectations of the Site Survey. Thus, additional digital
6 Confirmed by interviews with Uzbektelecom and UZCIA. 7 42 operating support systems were also installed. 8 A digital switching system is a system to convert audible signals to digital symbols. It enables transmission of data and image information.

6
switching systems were constructed.
Subscriber cable: Considering the fact that the subscriber cable is of a lower priority
and domestically procurable, as well as there being budget constraints, construction of
subscriber cables were canceled.
Backbone transmission system (Fiber Optic) and Junction transmission system (Fiber
Optic): As the most important component, additional transmission systems were
constructed. In addition, the most up-to-date technology was introduced (the
transmission system was changed from 140Mbps PDH9 to 622 Mbps SDH).
Backbone transmission system (Microwave): As a result of the Site Survey, 9
additional hops were built (2 hops in the backbone line Angren-Namangan and 7 hops
in the backbone line Karshi-Termez).
Consulting Service: With a change of scope, the consulting service was increased by
28M/M.
Table-2: Changes in Output (Phase-II)
Project Components Original Actual
1. Digital switching system 37,000 lines 42,670 lines
2. Operation Support System (OSS) 4 systems to be installed Cancelled
3. Network Management System (NMS) To be developed in Tashkent Cancelled
4. Backbone transmission system (Fiber Optic) 430km in total 1,816km in total
5. Junction transmission system (Fiber Optic) 513km in total 1,277km in total
6. Junction transmission system (Microwave) 199km in total 215km in total
7. Backup transmission system To be constructed mainly
around Fergana area
As originally planned
8. TV & radio broadcasting system:
TV Transmitters
Radio broadcasting transmitters
61 sets
28 sets
89 sets
36 sets
9. Wireless Local Loop (WLL) 10,000 lines 4,250 lines
10. Consulting Services 281M/M 246M/M
Source: Uzbektelecom and others
Digital switching system: As amended in Phase-I, it was found that the demand for
the digital switching system exceeded the original expectations at the time of the
Project appraisal. Thus, an additional digital switching system was constructed. In
response to promotion of digitalization in the Karshi and Fergana areas, a toll
switching system and 5,670 additional lines were constructed.
Operation Support System (OSS): It was cancelled because of (1) lower priority and
(2) Uzbekistan has already introduced OSS in Phase-I and secured the budget for
9 PDH stands for Plesiochronous Digital Hierarchy. At appraisal, PDH, which differed from one country to another, was a widely used transmission system and a speed conversion device was necessary for international communication. However, in response to the momentum to unify transmission systems into one common system, the ITU established SDH as an international standard. SDH was widely expanded to include Asian and European countries.

7
introducing it in Phase-II.
Network Management System (NMS): NMS was, at that time, the very expensive
system consisting of both hardware and software used to monitor and administrate a
communication network. In addition, in view of the then technological level in
Uzbekistan, it was judged to have canceled out the system installation10.
Backbone transmission system (Fiber Optic) and Junction transmission system (Fiber
Optic): As amended in the Phase-I, they were the most important components, and
additional transmission systems were constructed11.
Junction transmission system (Microwave): Priority was given to develop the
microwave transmission system as a backup system to the backbone transmission
system. With the additional construction of the backbone transmission system, the
construction of a microwave transmission system was undertaken12.
Television and Radio Broadcasting: The results of the detailed design (D/D) showed
that installing a large number of small output power transmitters was more effective
than installing a small number of higher output power transmitters. Thus, the number
of transmitters installed was increased.
Wireless local loops: In addition to the decision to place priority on the construction
of a backbone transmission system (Fiber Optic), it was difficult to predict the
demand for WLL and the prevalence rate of new technology in the future, such as
CDMA, which has been developed to replace WLL as a connection between
telecommunication carriers and users without wires. Thus, the scale of WLL was
limited.
Consulting Service: Although the workload for consultants was increased due to the
changes in scope, Uzbekistan contributed to a part of consultant employment expenses
independently from the Project budget. As a consequence, total M/M was decreased to
246M/M.
2.2.2. Project period (Rating: b)
The Project periods were longer than planned.
Phase-I was scheduled from June 1995 to October 1999, a period of 52 months, but it
extended to 61 months, from June 1995 to June 2000, which was equivalent to 117% of
the original plan. The three main reasons for the delay were (1) a delay in delivery and
installation of equipment (the delay in some of the digital switching systems and
10 At ex-post evaluation, the Uzbekistan government has been in the process of installing NMS through its own resources. 11 A contingency budget and budget surplus due to cost saving by competitive tendering were financed for additional transmission systems. 12 It was mainly constructed in Fergana region (total construction is 215km between Chadak-Limbur and between Pakhta-Angren through Almalik).

8
air-conditioning equipment contributed to a delay of 37 months through the stages of
manufacturing, transportation, installation and testing of equipment), (2) changes and
additions in scope 13 and (3) the original plan, dealing with the installation of
transmission systems, a digital switching system and subscriber cables, was relatively
excessive for the Project14.
Table-3: Comparative Table of Project Periods in Phase-I
Item Original Schedule (months) Actual (months) Differences (months)
Employment of consultant Jun. 1995 - Feb. 1996 (8.0) Jun. 1995 - Nov. 1995 (5.0) -3.0
Contract Feb. 1996 - Dec. 1996 (10.0) Nov. 1995 - Mar. 1997 (16.0) 6.0
Manufacturing Jan. 1997 - Mar. 1998 (14.0) Mar. 1997 - Aug. 1999 (29.0) 15.0
Shipping and transportation Jun. 1997 - June 1998 (12.0) Jul. 1997 - Nov. 1999 (28.0) 16.0
Installation and testing Sep. 1997 - Oct. 1999 (25.0) Sep. 1997 - Apr. 2000 (31.0) 6.0
Operation and maintenance support Apr. 1998 - Sep. 1999 (17.0) Jul. 1999 - Jun. 2000 (11.0) -6.0
Source: Uzbektelecom and others
Phase-II was scheduled from June 1999 to June 2003, a period of 49 months15, but it
extended to 71 months from September 2000 to July 2006, which was equivalent to 145%
of the original plan16. In addition to (1) the excessive scope of the Project, dealing with
the installation of transmission systems, digital switching system and subscriber cables
and (2) a delay in procurement and delivery of equipment 17 , (3) to conduct the
supplement P/Q due to the additional scope, (4) delays in approving bidding documents
and bidding evaluation and (5) contract stalemate, contributed to the overall delays in
schedule.
Table-4: Comparative Table of Project Periods in Phase-II
Item Original Schedule (months) Actual (months) Differences (months)
Employment of consultant Jun. 1999 Sep. 2000 N/A
Contract Jun. 1999 - Jun. 2000 (12.0) Sep. 2000 - Dec. 2003 (39.0) 27.0
Manufacturing Jul. 2000 - Jun 2001 (11.0) Mar. 2002 - Aug. 2002 (5.0) -6.0
Shipping and transportation Jan. 2001 - Dec. 2001 (11.0) Sep. 2002 - Feb. 2004 (17.0) 6.0
Installation and testing Apr. 2001 - Jul. 2002 (15.0) Sep. 2002 - May. 2006 (44.0) 29.0
Operation and maintenance support Nov. 2001 - Jun. 2003 (19.0) Jan. 2004 - Jul. 2006 (30.0) 11.0
13 Additional components, such as the construction of the backbone line for Karshi-Termez, which was financed by a contingency budget, were delayed to April 2000. 14 Confirmed by an interview with Uzbektelecom. 15 Note: Setting December 1999 (L/A) as the date to launch the Project, the planned period of Phase-II was 43 months from December 1999 to June 2003. 16 Note: Setting December 1999 (L/A) as the date to launch the Project, Phase-II extended to 81 months from December 1999 to July 2006, which was equivalent to 165% of the original plan 17 Installation and testing of additional components financed by a contingency budget, such as a backbone transmission system, started in May 2005 and took 13 months to complete. The considerable delay in maintenance and assistance operations was attributed to the delay in the construction of additional components. In addition, the operation took 30 months in total due to extra construction needs.
9
Source: Uzbektelecom and UZCIA Note: The Loan Agreement was made in December 1999
2.2.3. Project cost (Rating: b)
Total project costs slightly exceeded the plan.
The total cost of Phase-I was originally 17,149 million yen (Japanese ODA loan share
was 127 million yen) but the actual Project cost was 14,025 million yen (Japanese ODA
loan share was 12,587 million yen), which was equivalent to 82% of the original plan.
The reduction is considered attributable to competitive bidding, which enabled
cost-effective procurements and cancellation of subscriber cables18.
The total cost of Phase-II was originally 12,960 million yen, (Japanese ODA loan share
was 12,692 million yen) but the actual cost was 13,271 million yen (Japanese ODA loan
share was 12,121 million yen), which was equivalent to 103% of the original plan. The
higher construction cost of transmission systems, increased from 4,470 million yen to
7,930 million yen, is considered attributable to the additional construction of transmission
systems (1,816km of the Backbone transmission system was constructed compared to the
original plan of 430km and 1,277km of the Junction transmission system being
constructed, compared to the original plan of 513km). However, competitive bidding,
which enabled cost-effective procurement and cancellation of some of the components
contributed to the lowering of the cost. Thus, as a consequence, the extra cost was only
3.7 hundred million yen.
2.3. Effectiveness (Rating: b)
It is recognized as a fact that the usage frequency of fixed telephone services was
relatively low. On the other hand, the development and expansion of fiber-optic and
microwave backbone transmission networks, TV broadcasting equipment and other
facilities significantly contributed to a positive impact. Therefore, the Project has
produced certain effects, and its effectiveness is moderate.
2.3.1. Telephone density19
The telephone density of fixed phones in 2007 was still 6.80 lines per 100 people as
shown in Table-5, which remains at almost the same level at the time of the Project
appraisal of Phase-I and is substantially below the forecasted value of the national
average (11.54 lines) in 2005.
18 In addition, it is considered that the international price decline of telecommunications-related equipment due to rapid technological revaluation in communications technology, contributed to lowering the Project cost. 19 Telephone density data by target areas of the Project (Nukus, Urgench, Navoi, Bukhara, Karshi and Fergana) were not provided to the external evaluator.

10
On another front, the number of mobile phone subscribers is currently increasing while
that of fixed phone subscribers has grown at a sluggish pace, thus overall telephone
density, including mobile phones, had reached 28.83 lines per 100 people in 2007. This
value far exceeds the forecasted value of the national average (17.38 lines) in 2015.
Table-5: Telephone Density in Uzbekistan (Fixed and Mobile Phones) Actual Data Demand Forecast3)
Indicators Baseline
(1993) 2004 2005 2006 2007 2005 2015
Fixed Phone Subscribers (Ten thousand) 151.41) 169.49 173.44 177.44 181.27
Mobile Phone Subscribers (Ten thousand) Negligible 57.16 114.62 271.40 587.29
Total Subscribers (Fixed + Mobile, Ten thousand) 151.42) 226.65 288.06 448.84 768.56
302.04) N.A.
Fixed Phone Subscribers per 100 people 6.903) 6.59 6.67 6.74 6.80
Mobile Phone Subscribers per 100 people Negligible 2.22 4.40 10.31 22.03
Total Subscribers per 100 people (Fixed + Mobile) 6.902) 8.81 11.07 17.05 28.83
11.54 17.38
Source of Actual Data: Statistical Office of Uzbekistan (2008) Transport and Communication in Uzbekistan, 2008 (written in Uzbek) Note-1): Calculated from 6.90 (baseline data of fixed phone subscribers per 100 people in 1993) multiplied by 21,942,000 (population of Uzbekistan in 1993, source: World Development Indicators) Note-2): The number of mobile phone subscribers in 1993 is negligible since it was merely 500. (Source: World Development Indicators) Note-3): Data from JICA internal documents Note-4): Calculated from 11.54 (demand forecast data of fixed phone subscribers per 100 people in 2005) multiplied by 26,167,000 (population of Uzbekistan in 2005, source: World Development Indicators)
2.3.2. Telephone Main Lines in Operation (Utilization Rate) and Waiting List for Main
Lines (Waiting Applicants)
Table-6 shows i) the utilization rate (telephone main lines in operation) of digital
switching system installed through Phase-II and ii) the waiting list for main lines in the
six target areas of Nukus, Urgench, Navoi, Bukhara, Karshi and Fergana20 as of 2007.
Regarding the installed capacity, an additional 28,470 lines (newly built: 5,670 lines,
expanded: 22,800 lines) have been installed and the existing 14,200 lines have been
renewed in Nukus, Urgench, Navoi and Bukhara through the implementation of Phase-II.
The utilization rate of six target areas is 88.8% on average (calculated from the total
subscriber lines of 37,875 divided by the total installed capacity of 42,670 lines) in 2007,
which is relatively higher than similar Projects in other developing countries. By area,
the rate is extremely high in Urgench and Navoi (94.3% and 95.8%, respectively), and
followed by Bukhara (81.5%) and Nukus (76.2%). The lowest rate is in the Nukus area
but is still at more than 70%. Given these facts, it can be concluded that the facilities and
equipment procured under Phase-II of the Project are quite effectively utilized21.
20 Regarding the utilization rate and waiting list for main lines of Phase-I-related facilities and equipment, this data was not disclosed to the external evaluator because the data of Phase-I cannot be distinguished and identified from those of Phase-II. Also, the baseline data and target value of these indicators are unclear. 21 In the Nukus area, the telecommunications infrastructure, such as subscriber cables, is still some way from being fully developed, hampered by the vast desert area in which Nukus is located.

11
Table-6: Utilization Rate of Digital Switching System (Phase-II) and Waiting List for Main Lines (2007)
InstalledCapacity(Lines)
SubscriberLines
WaitingApplications
(Lines)
UtilizationRate
Karakalpakstan (Nukus Area) 1 Mangit – 1 2,300 2,253 - 98.0% 2 Mangit - 2 2,000 2,000 - 100.0% 3 Kanlikul 1,100 1,098 149 99.8% 4 Karauzak 1,500 1,279 2 85.3% 5 Chimbay 600 410 833 68.3% 6 Tahtakupir 2,000 200 - 10.0%
Sub-Total 9,500 7,240 984 76.2%Khorezm (Urgench Area)
1 Bagat 750 680 - 90.7% 2 Yangiarik 450 430 - 95.6% 3 Avaz Utar 600 590 - 98.3% 4 Pitnyak 2,000 1,987 13 99.4% 5 Zheleznodorozhnaya 900 800 - 88.9% 6 Khorezm 450 450 11 100.0% 7 Oltin sohil 450 450 10 100.0% 8 Dekhanabad 450 415 - 92.2% 9 Yangibazar 450 330 - 73.3%
Sub-Total 6,500 6,132 34 94.3%Navoi Area
1 Navoi 1,000 1,000 150 100.0% 2 Farhad 450 450 10 100.0% 3 Gazgan 450 398 2 88.4% 4 Nurata 1,500 1,438 52 95.9% 5 Buzton 450 450 12 100.0% 6 Kalkonata 450 404 36 89.8% 7 Tamdi 600 562 28 93.7% 8 New tamdi 250 173 12 69.2% 9 Narpay 450 256 15 56.9% 10 Zarafshan – 1 3,400 3,400 120 100.0% 11 Zarafshan – 2 3,000 2,967 130 98.9%
Sub-Total 12,000 11,498 567 95.8%Bukhara Area
1 Batirova 450 273 18 60.7% 2 Allaeva 450 157 - 34.9% 3 Yusupova 450 300 3 66.7% 4 Zirobod (Sohibkor) 450 390 143 86.7% 5 Chor Bakir 450 321 24 71.3% 6 Ubaydova 450 351 - 78.0% 7 Madaniyat 450 298 23 66.2% 8 Yangi turmush 450 450 9 100.0% 9 Gijduvoniy (Boyhotin) 450 446 17 99.1% 10 Naqshband 450 462 91 102.7% 11 Zheleznodorozhnaya 900 890 63 98.9% 12 Madaniyat (II) 450 341 1 75.8% 13 Romitan 450 416 7 92.4% 14 Ohunbabaeva 1,350 1,015 2 75.2% 15 Zarafshn-1 (Sepatta) 900 787 6 87.4% 16 Guliston (Ok Shoyh) 450 438 2 97.3%
Sub-Total 9,000 7,335 409 81.5%Karshi Area 2,220 2,220 - 100.0%Fergana Area 3,450 3,450 - 100.0%
42,670 37,875 1,994 88.8%
Installed Area
Total Source: Uzbektelecom Note): The utilization rate is usually calculated as the percentage of main lines in operation against the installed capacity of the switching unit. However, as the data on main lines in operation were not available this time, it is substituted as the percentage of subscriber lines against the switching capacity.
As shown in Table-7, the total number of waiting applicants (waiting list for main
lines22) in four target areas of Nukus, Urgench, Navoi and Bukhara was 6,447 lines in
1999 and then drastically dropped to 1,994 lines in 2007, which demonstrates the
considerable decline from the huge number of waiting applicants of 33,219 lines in 1993.
It is judged that the implementation of Phase-I & II (completed in 2000 and 2006,
22 The number of households that have been waiting for the start of telephone services after submitting their applications.

12
respectively) of the Project had a crucial impact on reducing the waiting applicants
significantly.
Table-7: Waiting List for Main Lines (Accumulated figures in four target areas of Nukus, Urgench, Navoi and Bukhara)
Year Waiting List for Main Lines Reduction Rate in Waiting
List for Main Lines from 1993
19931) 33,219 - 19992) 6,447 81% 20073) 1,994 94%
Source 1): JICA appraisal documents Source 2): Project Completion Report (Phase-I) Source 3): Uzbektelecom
Considering the huge decrease of 94% compared to the level of 1993 in the waiting list
for main lines, it can be said without a doubt that the Project has greatly contributed to the
decline in the subscription waiting time for fixed phones. In addition, the number of
waiting applicants only accounts for 5% (=1,994 lines / 37,875 lines) in the above four
target areas, which is a very low level.
Furthermore, the waiting applicants are found in the areas where the utilization rates
are almost 100% according to Table-6. In view of this fact, the belief that “the speed of
the installed capacity expansion does not meet the demand of new subscriptions for fixed
phones, therefore the wait for subscription is occurring because of the physical limits of
the installed capacity23”, not because of the delay in Uzbektelecom’s administrative
procedures.
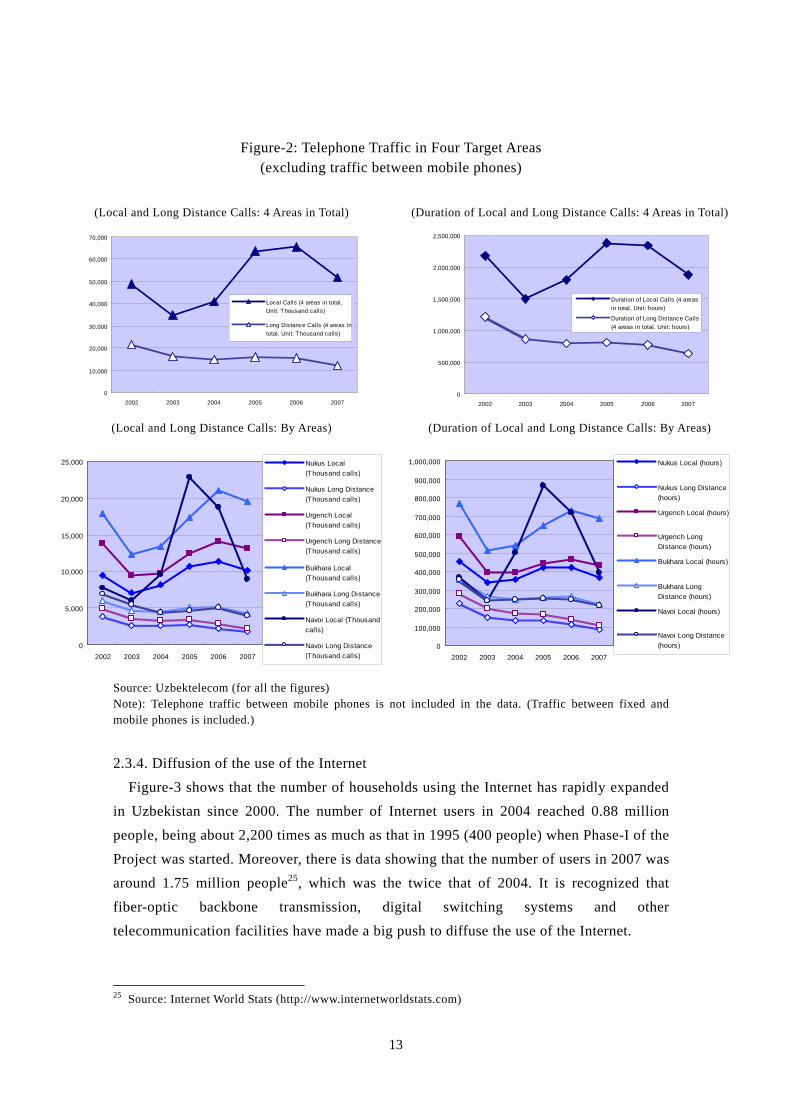
2.3.3. Telephone Traffic (Local and Long Distance Calls)
Figure-2 shows the number and duration of local and long distance calls from 2002 to
August 2008 in four target areas (Nukus, Urgench, Navoi and Bukhara)24.
With regard to the total number of calls in four target areas of the Project, 51,904
thousand local calls and 12,135 thousand long distance calls were recorded in 2007, an
increase of 6% and decrease of 44% from those in 2002, respectively. Regarding the
duration of calls, there were 1,880 thousand hours for local calls and 629 thousand hours
for long distance calls in 2007, decreases of 14% and 48%, respectively, from the levels
in 2002. Due to the rapid diffusion of mobile phones, telephone traffic through the fixed
lines is on a downward trend. (The specific data of telephone traffic between fixed and
mobile phones and that between mobile phones were not obtained.)
23 Nonetheless, as discussed, the subscription needs of fixed phones are currently decreasing. It should be reasonable to understand that, under the circumstances of this decrease, the speed of installed capacity expansion is not fully satisfying the current demand of fixed phones. 24 The data relating to international calls could not be obtained.
13
Figure-2: Telephone Traffic in Four Target Areas (excluding traffic between mobile phones)
(Local and Long Distance Calls: 4 Areas in Total)
(Duration of Local and Long Distance Calls: 4 Areas in Total)
0
10,000
20,000
30,000
40,000
50,000
60,000
70,000
2002 2003 2004 2005 2006 2007
Local Calls (4 areas in total,
Unit: Thousand calls)
Long Distance Calls (4 areas in
total, Unit: Thousand calls)
0
500,000
1,000,000
1,500,000
2,000,000
2,500,000
2002 2003 2004 2005 2006 2007
Duration of Local Calls (4 areas
in total, Unit: hours)
Duration of Long Distance Calls
(4 areas in total, Unit: hours)
(Local and Long Distance Calls: By Areas) (Duration of Local and Long Distance Calls: By Areas)
0
5,000
10,000
15,000
20,000
25,000
2002 2003 2004 2005 2006 2007
Nukus Local
(Thousand calls)
Nukus Long Distance
(Thousand calls)
Urgench Local
(Thousand calls)
Urgench Long Distance
(Thousand calls)
Bukhara Local
(Thousand calls)
Bukhara Long Distance
(Thousand calls)
Navoi Local (Thousand
calls)
Navoi Long Distance
(Thousand calls)0
100,000
200,000
300,000
400,000
500,000
600,000
700,000
800,000
900,000
1,000,000
2002 2003 2004 2005 2006 2007
Nukus Local (hours)
Nukus Long Distance
(hours)
Urgench Local (hours)
Urgench Long
Distance (hours)
Bukhara Local (hours)
Bukhara Long
Distance (hours)
Navoi Local (hours)
Navoi Long Distance
(hours)
Source: Uzbektelecom (for all the figures) Note): Telephone traffic between mobile phones is not included in the data. (Traffic between fixed and mobile phones is included.)
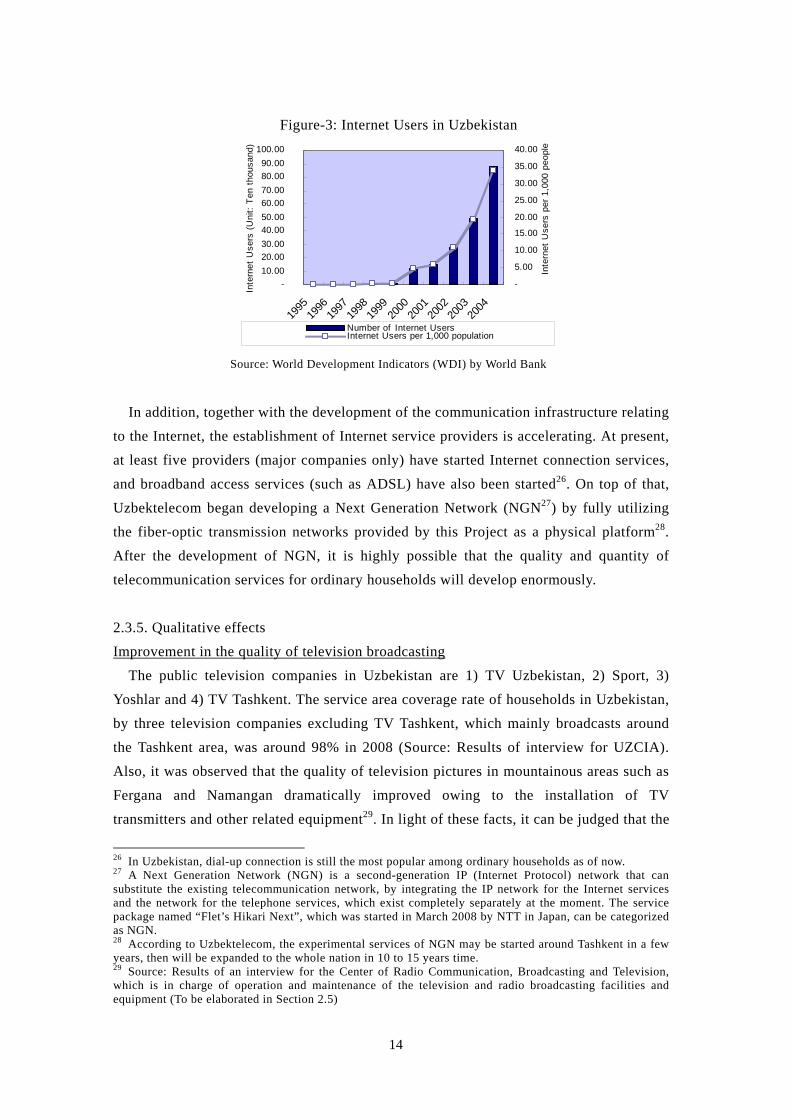
2.3.4. Diffusion of the use of the Internet
Figure-3 shows that the number of households using the Internet has rapidly expanded
in Uzbekistan since 2000. The number of Internet users in 2004 reached 0.88 million
people, being about 2,200 times as much as that in 1995 (400 people) when Phase-I of the
Project was started. Moreover, there is data showing that the number of users in 2007 was
around 1.75 million people25, which was the twice that of 2004. It is recognized that
fiber-optic backbone transmission, digital switching systems and other
telecommunication facilities have made a big push to diffuse the use of the Internet.
25 Source: Internet World Stats (http://www.internetworldstats.com)
14
Figure-3: Internet Users in Uzbekistan
-
10.00
20.00
30.00
40.00
50.00
60.00
70.00
80.00
90.00
100.00
1995
1996
1997
1998
1999
2000
2001
2002
2003
2004
Inte
rne
t U
ser
s (
Un
it: T
en
thou
sand
)
-
5.00
10.00
15.00
20.00
25.00
30.00
35.00
40.00
Inte
rnet
Use
rs p
er 1
,000
peo
ple
Number of Internet UsersInternet Users per 1,000 population
Source: World Development Indicators (WDI) by World Bank
In addition, together with the development of the communication infrastructure relating
to the Internet, the establishment of Internet service providers is accelerating. At present,
at least five providers (major companies only) have started Internet connection services,
and broadband access services (such as ADSL) have also been started26. On top of that,
Uzbektelecom began developing a Next Generation Network (NGN27) by fully utilizing
the fiber-optic transmission networks provided by this Project as a physical platform28.
After the development of NGN, it is highly possible that the quality and quantity of
telecommunication services for ordinary households will develop enormously.
2.3.5. Qualitative effects
Improvement in the quality of television broadcasting
The public television companies in Uzbekistan are 1) TV Uzbekistan, 2) Sport, 3)
Yoshlar and 4) TV Tashkent. The service area coverage rate of households in Uzbekistan,
by three television companies excluding TV Tashkent, which mainly broadcasts around
the Tashkent area, was around 98% in 2008 (Source: Results of interview for UZCIA).
Also, it was observed that the quality of television pictures in mountainous areas such as
Fergana and Namangan dramatically improved owing to the installation of TV
transmitters and other related equipment29. In light of these facts, it can be judged that the
26 In Uzbekistan, dial-up connection is still the most popular among ordinary households as of now. 27 A Next Generation Network (NGN) is a second-generation IP (Internet Protocol) network that can substitute the existing telecommunication network, by integrating the IP network for the Internet services and the network for the telephone services, which exist completely separately at the moment. The service package named “Flet’s Hikari Next”, which was started in March 2008 by NTT in Japan, can be categorized as NGN. 28 According to Uzbektelecom, the experimental services of NGN may be started around Tashkent in a few years, then will be expanded to the whole nation in 10 to 15 years time. 29 Source: Results of an interview for the Center of Radio Communication, Broadcasting and Television, which is in charge of operation and maintenance of the television and radio broadcasting facilities and equipment (To be elaborated in Section 2.5)
15
living conditions of local residents in mountainous regions were much improved through
the implementation of the Project30.
2.3.6. Financial internal rate of return (FIRR)
Recalculation of the Financial Internal Rate of Return (FIRR) cannot be conducted,
since the necessary data for recalculation, such as revenues from telephone services and
from TV and radio broadcasting that are gained from the Project facilities, have not been
provided to the external evaluator. On the other hand, the FIRR may possibly be higher
than that at the time of the Project appraisal if we take into account the high utilization
rate of telecommunication facilities provided under Phase-II as shown in Table-4.
2.4. Impact
It is very much difficult to observe the medium- to long-term impacts (ex. improvement
in the production efficiency in the industries located around the Project facilities) because
only two years and three months have passed since the Project completion and we are still
in the build-up period of such impacts. Given these considerations, the following three
aspects (foreign direct investment, competition with private companies and impact on the
natural and social environment) are to be focused upon when evaluating the “Impact”.
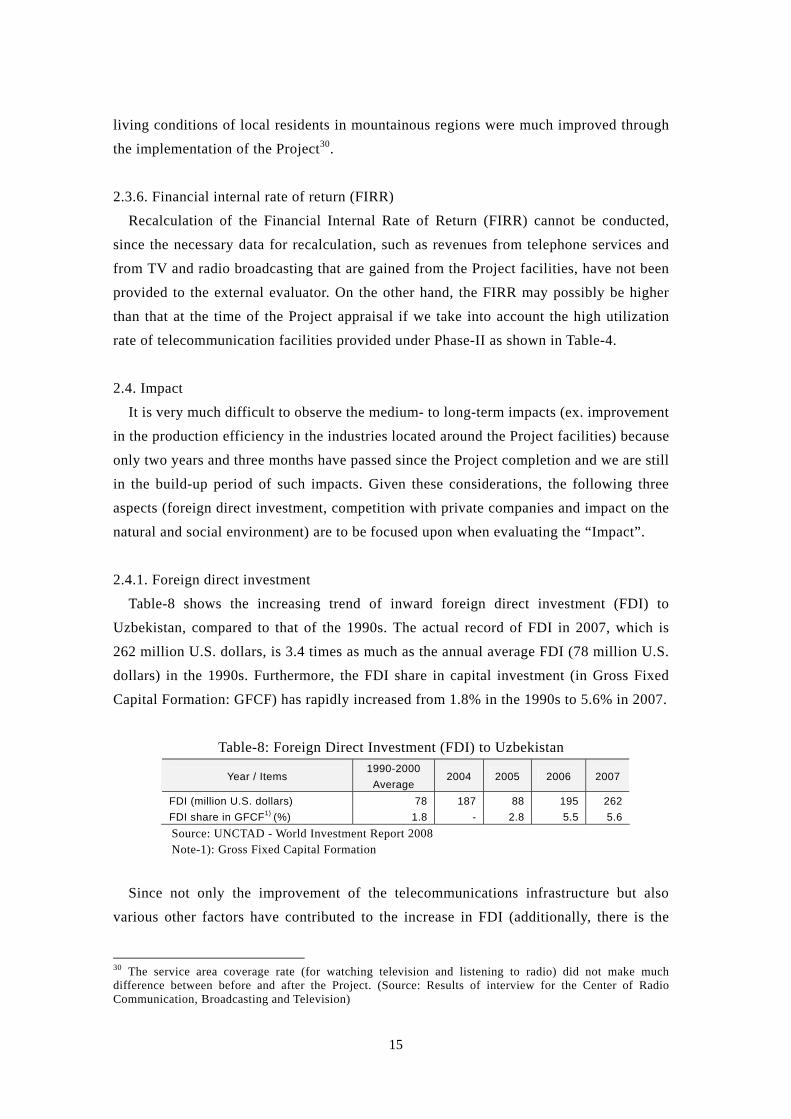
2.4.1. Foreign direct investment
Table-8 shows the increasing trend of inward foreign direct investment (FDI) to
Uzbekistan, compared to that of the 1990s. The actual record of FDI in 2007, which is
262 million U.S. dollars, is 3.4 times as much as the annual average FDI (78 million U.S.
dollars) in the 1990s. Furthermore, the FDI share in capital investment (in Gross Fixed
Capital Formation: GFCF) has rapidly increased from 1.8% in the 1990s to 5.6% in 2007.
Table-8: Foreign Direct Investment (FDI) to Uzbekistan
Year / Items 1990-2000
Average 2004 2005 2006 2007
FDI (million U.S. dollars) 78 187 88 195 262
FDI share in GFCF1) (%) 1.8 - 2.8 5.5 5.6
Source: UNCTAD - World Investment Report 2008 Note-1): Gross Fixed Capital Formation
Since not only the improvement of the telecommunications infrastructure but also
various other factors have contributed to the increase in FDI (additionally, there is the
30 The service area coverage rate (for watching television and listening to radio) did not make much difference between before and after the Project. (Source: Results of interview for the Center of Radio Communication, Broadcasting and Television)

16
consideration in Uzbekistan that mining development is currently booming), the data of
Table-8 do not represent the impact of this Project exclusively. Generally speaking,
however, construction and expansion of the telecommunications infrastructure through
this Project seem to induce certain improvements in the investment environment, thus
contributing to the expansion of foreign direct investment in no small measure.
2.4.2. Competition with private communication companies
It has always been recognized during similar telecommunication ODA loan Projects in
other developing countries, that the utilization rate of telecommunication facilities
provided under the Projects tended to gradually decrease due to the intensifying
competition against private mobile phone operators. However, this common concern
seems to be less likely to happen for this Project because of the following fact: there are
currently two mobile phone operators, East Telecom and Buzton, which aim at expanding
mobile phone business with the development of independent fiber-optic transmission
lines, although the subscribed number of mobile phone lines of these companies is only
an eightieth (= 20,000 lines / 1,600,000 lines) of that of Uzbektelecom’s, thus not posing
a major threat to Uzbektelecom at this moment.
Nonetheless, taking into account i) the number of mobile phone users is expanding
rapidly over a very short period of time and ii) Uzbektelecom is now tying to develop
NGN, it is undeniable that the demands of the digital switching system installed by this
Project may be completely diminished and it is necessary to closely monitor the future
developments of this issue.
2.4.3. Impact on the natural and social environment
No negative impact on the natural environment has been observed31, and the relocation
of local people has not been conducted during the construction of the fiber-optic
transmission cable and installation of heavy machinery, etc.
2.5. Sustainability (Rating: a)
No major problem has been observed in the capacity of the executing agency or its
operation and maintenance system, therefore, sustainability of this project is high.
2.5.1. Executing Agency
2.5.1.1. Operation and maintenance system
The executing agency at the time of the appraisal of Phase-I was the Ministry of
31 According to the results of interviews with the executing agencies and the results of field investigations in Angren, Samarkand, Nukus and Bukhara

17
Communications (UZMOC). Following administrative reform, the executing agency at
the time of the appraisal of Phase-II was changed to the Posts and Telecommunications
Agency of Uzbekistan, which was newly set up in 1997, and was again changed to the
Communication and Information Agency of Uzbekistan (UZCIA), which was established
through organizational reform in May 2005. The operation and maintenance of
telecommunication facilities and equipment procured by the Project were performed by
state-owned subsidiaries under the jurisdiction of UZCIA. The following table shows the
organizational system of operation and maintenance:
Table-9: Demarcation of Operation and Maintenance of Telecommunication Facilities Agency in Charge Detailed Tasks Relating to O&M Activities
Uzbektelecom32 Uzbektelecom is basically in charge of operation and maintenance of fixed and mobile phone-related equipment, data transmission facilities and other equipment.
In more detail, small-size subsidiaries established in each region (regional telecom companies) are directly in charge of operation and maintenance of all the facilities and equipment in their jurisdictional region.
For example, Karakalpakstan Telecom is in charge of the facilities and equipment in the Nukus area, whereas Urgench Telecom is in charge of those in the Urgench area.
Large-scale maintenance operations, which each regional telecom company cannot afford to undertake, will be under the charge of Uzbektelecom headquarters.
Center of Radio Communication, Broadcasting and Television33
In charge of operation and maintenance of television and radio broadcasting facilities and equipment in all Uzbekistan
As demonstrated in Table-9, demarcation of operation and maintenance activities are
very clear among two institutions: Uzbektelecom is in charge of operation and
maintenance of fixed and mobile phone-related equipment, data transmission facilities
and other equipment, whereas the Center of Radio Communication, Broadcasting and
Television is in charge of operation and maintenance of television and radio broadcasting
facilities and equipment.
The data relating to service performance, such as telephone density, telephone traffic
and waiting lists for main lines described in Section 2.3, are primarily collected by each
32 Regarding the organizational structure of Uzbektelekom, there are 21 regional subsidiaries under the headquarters in Tashkent, consisting of regional telecom companies, mobile phone operators, long distance carriers and other related companies. Each subsidiary is financially independent from the parent body, but nationwide prices and common service quality have been set under the supervision of UZCIA. Foreign capital investment in the service delivery of mobile phones and data transmissions are allowed in the telecom market of Uzbekistan, and 12 joint venture companies including Uzbek-Indonesian and Uzbek-Korean telecom company have already been established. (These joint venture companies are different from the above 21 subsidiaries.) 33 Subsidiary body under the jurisdiction of UZCIA. Note that RCBTA, which is described as “in charge of TV and radio broadcasting” in the appraisal document of Phase-I, is a different governmental institution from this body. RCBTA does not relate to the operation and maintenance activities of television and radio broadcasting facilities and equipment.

18
regional telecom subsidiary, but it seems that the systematic and scheduled procedures of
data collection have not been developed within Uzbektelecom and all the regional
telecom companies.
Makhali Telecom and Khalkaro Telecom, which had been considered to participate in
the Project at the time of appraisal, were merged into Uzbektelecom. The number of staff
in Uzbektelecom was 17,500 at the end of 2007, having decreased from 20,000 at the
peak. This is mainly because of the retirement and layoff of excess personnel stemming
from the progress of digitalization in telecom facilities and equipment (Source: Results of
interviews with Uzbektelecom), resulting in a considerable contribution to the
streamlined administrative structure. This effect is expected to have a positive impact on
the financial sustainability of the Project.
2.5.1.2. Technical capacity
Technical skills of engineers and workers
The number of engineers in Uzbektelecom is 7,022 in total (as of the end of 2007), of
which 6,467 received some vocational training at professional colleges (PCs) in
Uzbekistan (of this number, 3,804 engineer graduated from colleges and universities).
There is no problem with the quality and quantity of engineers and workers, and their
technical capabilities and skills are high.
Internal training programs
Intensive internal training programs targeted at engineers and workers have been
periodically set up and implemented at the “Engineer & Technical Center” set up within
Uzbektelecom. On-the-job training (OJT) is conducted by each regional telecom company,
and specific training programs shown in Table-10 are implemented by the Tashkent
University of Information Technology and other governmental agencies. Given these facts,
the implementation scheme of internal training programs for engineers and workers can
be considered as satisfactory.
Table-10: Training Programs Provided by Uzbektelecom (2007)
Internal Training Provided By No. of Participants
in 2007
Engineer & Technical Center 2,527 Tashkent University of Information Technology 40 Academy of State and Social Construction (under the President Office)
42
Other governmental agencies 74
Source: Uzbektelecom Annual Report 2007

19
Training programs provided by the contractors of the Project
OJT training with regard to the operation of digital switching systems and digital
transmission equipment have been smoothly conducted by the contractors of the Project,
over the period of a year after the installation of telecommunication facilities and
equipment. The contents of training programs had a good reputation among trainees.
(Source: Results of interviews for regional telecom companies)
2.5.1.3. Financial status
Revenue and operating profit
Revenue has been growing since 2003 owing to the steady increase in revenue from
long distance and international calls, which account for three-quarters of total revenue.
Revenue in 2007 doubled compared to that of 2003, mainly through the growth in revenue
from data services and the Internet (26% increase from 2006), in addition to that from
long distance and international calls.
As for operating profit, 24.2 billion soum was recorded in 2007, increasing 75.2% from
that in 2003, although there was a sharp decline in 2005. Since the operating margin is
being kept in the range of 10 to 16% except for 2005, the profit performance of
Uzbektelecom seems to be stable. It can be assumed that revenue from long distance and
international calls is currently covering the decrease in revenue from local calls, whereas
the telephone traffic of local calls via a fixed phone tends to be decreasing, as shown in
Figure-2.
Table-11: Revenue and Operating Profit of
Uzbeketelecom Unit: million soum
Year Revenue Operating Profit
2003 84,145 13,8422004 106,178 15,1102005 134,435 7,4992006 154,934 16,9472007 177,472 24,245
Table-12: Revenue Structure of Uzbeketelecom
Revenue Item Share in Revenue
Increase from 2006
Long Distance/International Call 74.2% 15.1%Local Call 21.8% 12.0%Data Services and Internet 2.9% 26.0%TV and Radio Broadcasting 1.1% 20.0%
Source: Prepared from Uzbektelecom Annual Report 2007
Source: Uzbektelecom Annual Report 2007
Balance Sheet (B/S)
Equity capital is about 130 billion soum (approx.9 billion yen) and total assets mounted
to 470 billion soum (approx.33 billion yen) at the end of 2007. The capital-to-assets ratio,
current ratio and quick ratio as of the end of 2007 were 27%, 734% and 700%,
respectively, thus there were no problems regarding long-term stability and short-term
solvency.

20
Table-13: Consolidated Balance Sheet (B/S) of Uzbektelecom Unit: million soum
Item End of 2006 End of 2007
Assets Current Assets 193,340 224,233 Fixed Assets 214,110 243,236
Total Assets 407,450 467,469
Liabilities and Equity Equity Capital 118,750 127,295 Current Liabilities 15,788 30,513 Fixed Liabilities 272,912 309,661Total Liabilities and Equity 407,450 467,469
Source: Prepared from Uzbektelecom Annual Report 2007
Operation and maintenance expenditure of the Project facilities34
It should be pointed out that 3.72 billion soum (not including O&M for the
transmission system) for operation and maintenance expenditure exclusively for the
Project is very small when compared to 153 billion soum, the total expenditure of
Uzbektelecom in 2007. Therefore, the financial resources for operation and maintenance
of the Project’s facilities and equipment are substantially secured.
Table-14: Operation and Maintenance Expenditure of the Project (2007)
Unit: million soum Item O&M Expenditure
Digital switching system 234.60 Transmission system (Fiber-Optic, Microwave) Not known Wireless Local Loop (WLL) 748.71 TV & Radio Transmitters1) 2740.38
Total Expenditure 3,723.69
Source: Uzbektelecom, Center of Radio Communication, Broadcasting and Television and JICA internal documents Note-1): O&M expenditure relating to TV & radio transmitters is made by the Center of Radio Communication, Broadcasting and Television. (All the other expenditures are made through Uzbektelecom.)
2.5.2. Operation and maintenance status
Generally speaking, there seems to be no problem with the operation and maintenance
status, thereby, they can be judged as extremely good.
Among telecommunication facilities and equipment procured by the Project,
telecommunication transmission networks are supervised at the regional level by the
centralized computer software called “Network Management System” (NMS, installed by
other projects). Adding to this supervision system, regular maintenance activities are
performed by each regional telecom company once every three months. For the other
telecom facilities and equipment, operation and maintenance workers at each regional
telecom company conduct maintenance activities.
34 P/L and B/S of the Center of Radio Communication, Broadcasting and Television were not fully disclosed to the external evaluator.

21
The operation and maintenance manuals for each facility and equipment were prepared
by the contractors and the technical skills necessary for operation and maintenance have
already been transferred to the personnel in charge through the previously mentioned
training programs. Regarding spare parts, no problems can be found with any of the four
regional telecom companies35 that were visited by the external evaluator given that there
were enough spare parts stocked.
As for the television and radio broadcasting facilities and equipment, “Tashkent
Radio-Television Transmitting Center”, which comes under the Center of Radio
Communication, Broadcasting and Television, has been in charge of providing technical
services relating to maintenance issues. Some of the TV transmitters were repaired but
there were no specific problems with the maintenance status. (Source: Results of
interviews with Uzbektelecom and regional telecom companies)
It was observed that the processing capacities of digital and toll switching systems at
each area are now approaching their limits, by reason of i) the increasing number of
subscribers, and unforeseen factors such as ii) urgent requests from private mobile phone
operators to expand line capacity. In response to these issues, Samarkand Telecom and
Karakalpakstan Telecom are planning to expand the capacity of the toll switching system
through their own budgets. In addition, some of the equipment (such as digital switching
equipment called “NEAX61”) has already become obsolete and Uzbektelecom has started
to replace it with next-generation digital switching equipment.
3. Conclusion, Lessons Learned and Recommendations
3.1. Conclusion
The components of the Project are highly relevant to the related national policies and
there seems to be no problem with the operation and maintenance systems. Although
some effects caused by the external factors such as the explosive diffusion of mobile
phones were recognized, a certain number of positive impacts have been developed
through the implementation of the Project. In light of the above, this project is evaluated
to be satisfactory.
3.2. Lessons Learned
If fiber-optic and microwave backbone transmission systems were not developed as a
priority issue, the explosive diffusion of mobile phone services and the current movement
to introduce NGN would not have been realized. The decision to flexibly change the 35 Karakalpakstan Telecom (in charge of O&M in the Nukus area), Samarkand Telecom (in charge of O&M in the Samarkand area), Uzbektelecom Angren Office (in charge of O&M in the Angren area) and Bukhara Telecom (in charge of O&M in the Bukhara area)

22
project scope36 in order to respond to the realities in the technology revolution greatly
contributed to achieving the objectives of the Project. In the telecommunications projects,
speedy decision-making is greatly needed to help avoid technological obsolescence and
decisive judgments by the top management of Uzbektelecom, UZCIA and the consultants
can be considered to have assured the success of the Project.
In view of these, it is quite desirable for the telecommunications project to i) secure
flexibility in the project scope (much more than the other infrastructure projects) and ii)
to be ready for scope changes, especially after the completion of detailed design (D/D).
At the same time, it is fundamentally necessary to maintain the rapid implementation of
the project cycle (from project planning to hand over, through F/S, D/D, procurement and
installation) in order to avoid the negative impacts of technological obsolescence at a
minimum level. In this sense, accuracy enhancement of the results of pre-feasibility
studies should be targeted, concurrently securing the flexibility in the changes of the
project scope.
3.3. Recommendations
(For executing agency)
In order to quantitatively understand and monitor in a timely fashion the effects and
achievements of the project, it is highly recommended for Uzbektelecom to decide upon
the “monitoring indicators” similar to JICA’s “Operation and Effect Indicators” and to
promptly develop a monitoring mechanism. Possible candidate indicators may be i)
telephone traffic (by the categorization of local, long-distance and international calls), ii)
telephone density and iii) a waiting list for main lines.
36 Emphasizing future expandability and the necessity to introduce new technologies, the strategic priorities of the Project were set as i) the development of a backbone transmission system, ii) digitalization of a switching system and iii) other components in order, based on the technological revolution in the telecommunications sector at that time. Thus, the development of a fiber-optic backbone transmission system was decided as the component with the highest priority.
23
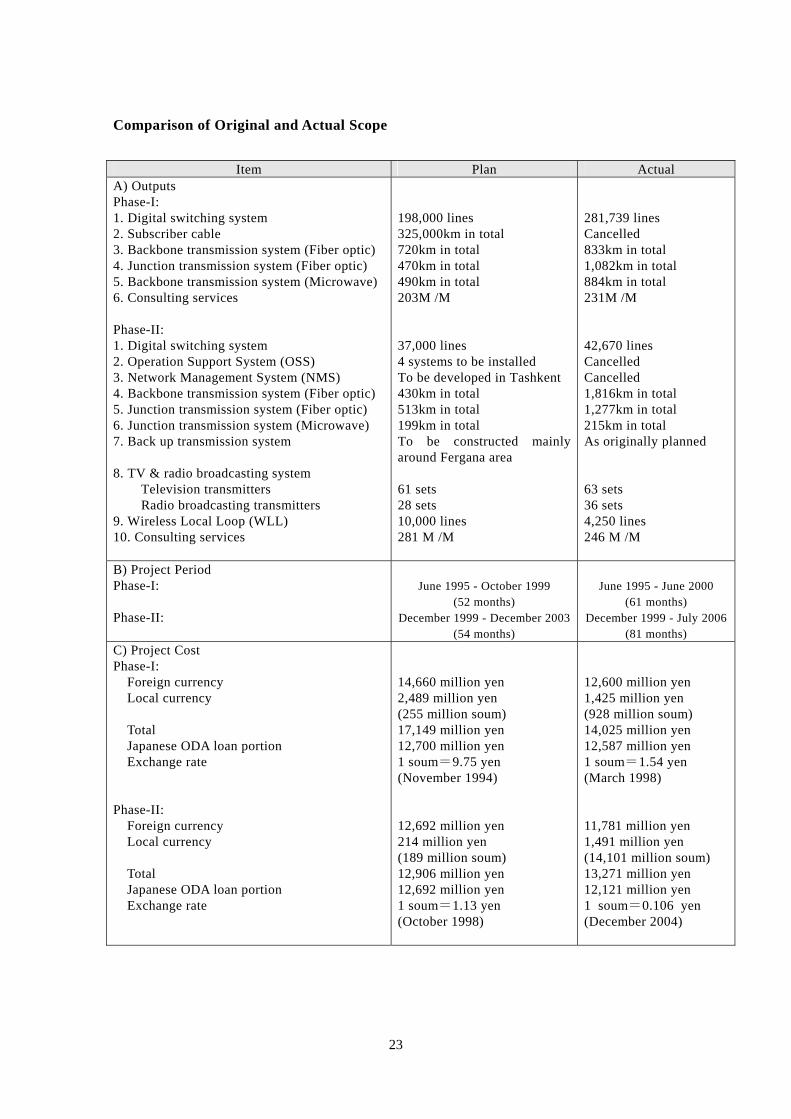
Comparison of Original and Actual Scope
Item Plan Actual
A) Outputs Phase-I: 1. Digital switching system 2. Subscriber cable 3. Backbone transmission system (Fiber optic) 4. Junction transmission system (Fiber optic) 5. Backbone transmission system (Microwave) 6. Consulting services Phase-II: 1. Digital switching system 2. Operation Support System (OSS) 3. Network Management System (NMS) 4. Backbone transmission system (Fiber optic) 5. Junction transmission system (Fiber optic) 6. Junction transmission system (Microwave) 7. Back up transmission system 8. TV & radio broadcasting system
Television transmitters Radio broadcasting transmitters
9. Wireless Local Loop (WLL) 10. Consulting services
198,000 lines 325,000km in total 720km in total 470km in total 490km in total 203M /M 37,000 lines 4 systems to be installed To be developed in Tashkent 430km in total 513km in total 199km in total To be constructed mainly around Fergana area 61 sets 28 sets 10,000 lines 281 M /M
281,739 lines Cancelled 833km in total 1,082km in total 884km in total 231M /M 42,670 lines Cancelled Cancelled 1,816km in total 1,277km in total 215km in total As originally planned 63 sets 36 sets 4,250 lines 246 M /M
B) Project Period Phase-I: Phase-II:
June 1995 - October 1999
(52 months) December 1999 - December 2003
(54 months)
June 1995 - June 2000
(61 months) December 1999 - July 2006
(81 months)
C) Project Cost Phase-I:
Foreign currency Local currency
Total Japanese ODA loan portion Exchange rate
Phase-II:
Foreign currency Local currency
Total Japanese ODA loan portion Exchange rate
14,660 million yen 2,489 million yen (255 million soum) 17,149 million yen 12,700 million yen 1 soum=9.75 yen (November 1994) 12,692 million yen 214 million yen (189 million soum) 12,906 million yen 12,692 million yen 1 soum=1.13 yen (October 1998)
12,600 million yen 1,425 million yen (928 million soum) 14,025 million yen 12,587 million yen 1 soum=1.54 yen (March 1998) 11,781 million yen 1,491 million yen (14,101 million soum) 13,271 million yen 12,121 million yen 1 soum=0.106 yen (December 2004)