UZ Antwerp Effect of compensatory viewing strategies on practical fitness to drive in subjects with...
23
UZ Antwerp UZ Antwerp Effect of compensatory viewing strategies on practical fitness to drive in subjects with visual field defects caused by ocular pathology. Tanja Coeckelbergh W.H. Brouwer, F.W. Cornelissen, A.C. Kooijman University of Groningen, The Netherlands current address: University Hospital Antwerp, Belgium
-
Upload
leslie-garrison -
Category
Documents
-
view
213 -
download
0
Transcript of UZ Antwerp Effect of compensatory viewing strategies on practical fitness to drive in subjects with...

UZ AntwerpUZ AntwerpUZ AntwerpUZ Antwerp
Effect of compensatory viewing strategies
on practical fitness to drive in subjects with visual field defects
caused by ocular pathology.
Tanja Coeckelbergh
W.H. Brouwer, F.W. Cornelissen, A.C. Kooijman
University of Groningen, The Netherlands
current address:
University Hospital Antwerp, Belgium

UZ AntwerpUZ AntwerpUZ AntwerpUZ Antwerp
Bioptic telescopes are intended for
•detailed vision (street names, signs, etc.)
•not for regular driving
are subjects with decreased visual acuity able to drive safely?

UZ AntwerpUZ AntwerpUZ AntwerpUZ Antwerp
SubjectsSubjectscentral VFD
(n=24)
peripheral
VFD (n=36)
central and
peripheral (n=7)
mild VFD
(n=33)
vision parameters
visual acuity (logMAR) 0.64 (0.03) 0.14 (0.02) 0.72 (0.08) 0.11 (0.02)
horizontal field *(°) 142 (13) 84 (35) 91 (35) 141 (13)
sample characteristics
male : female 16:8 29:7 4:3 14:19
age 65 (13) 60 (12) 63 (15) 67 (9)
driving license (# years) 38 (11) 37 (10) 39 (17) 38 (8)
* Goldmann III4 isopter

UZ AntwerpUZ AntwerpUZ AntwerpUZ Antwerp
On-road driving testOn-road driving test
•own car
•own neighbourhood
•official driving examiner (CBR)
•1 hour
•score: viewing behaviour, lateral position, anticipation, changing lanes, turning
left, …
pass/fail score
www.cbr.nl

UZ AntwerpUZ AntwerpUZ AntwerpUZ Antwerp
On-road driving testOn-road driving test
central VFD mild VFD
passed: 6 (25%) 21 (64%)
unfit to drive: 5 (21%) 0 (0%)
not yet fit to drive: 13 (54%) 12 (36%)
fit to drive, limited: 6 (25%) 9 (27%)
fit to drive: 0 (0%) 12 (36%)
UZ AntwerpUZ AntwerpUZ AntwerpUZ AntwerpPercentage of subjects passing TRIP items:
central VFD mild VFD
lateral position 66.7 84.8
lane choice 70.8 66.7
car following 95.8 97.0
speed 66.7 69.4
viewing behaviour 33.3 39.4
detection of traffic signs 58.3** 93.9
overtaking 45.8 72.7
mechanical operations 75.0 84.8
anticipatory behaviour 37.5 63.6
communication 45.8 78.8
turning left 37.5 51.5
merging into another lane 37.5 57.6

UZ AntwerpUZ AntwerpUZ AntwerpUZ Antwerp
Driving simulatorDriving simulator

UZ AntwerpUZ AntwerpUZ AntwerpUZ Antwerp
Central VFD
(n=23)
Mild VFD
(n=23)
visual acuity (dec. not.) 0.24 (0.09) 0.83 (0.27)
horizontal field extent*( ) 142 (14) 142 (14)
* Goldmann I I I 4 isopter
Driving simulator: subjectsDriving simulator: subjects

UZ AntwerpUZ AntwerpUZ AntwerpUZ Antwerp
Driving simulator: resultsDriving simulator: resultscentral VFD mild VFD
speed (km/h) 67(9)** 74(9)
lateral position SD (m) n.s.
thw-average n.s.
thw-minimum n.s.
ttc-minimum (log) 0.61 (.16)**0.70 (.15)
breaking dti n.s.
release accelerator dti n.s.
accident (% drivers) n.s.

UZ AntwerpUZ AntwerpUZ AntwerpUZ Antwerp
1.3
1.4
1.5
1.6
1.7
1.8
1.9
50 km/h 80 km/h left curve 80km/h
right curve 80km/h
path
late
ral p
osi
tio
n
central VFD
peripheral VFD
mild VFD

UZ AntwerpUZ AntwerpUZ AntwerpUZ Antwerp
-0.2
-0.1
0
0.1
0.2
0.3
0.4
constant variable
driving speed of lead car
log
TH
Wm
in
central VFD
peripheral VFD
mild VFD

UZ AntwerpUZ AntwerpUZ AntwerpUZ Antwerp
Compensatory behaviourCompensatory behaviour
viewing behaviour – pass/fail score
central VFD: no relationship
speed – pass/fail score:
central VFD: drive more slowly => pass
UZ AntwerpUZ AntwerpUZ AntwerpUZ Antwerp
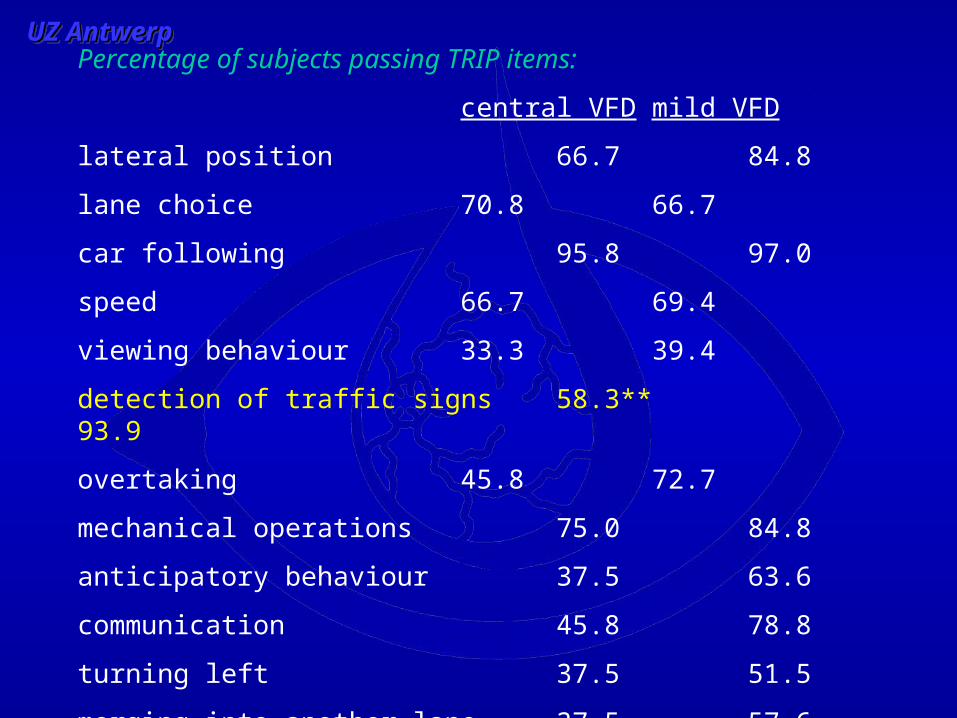
Conclusions before trainingConclusions before training
On-road driving test:
detection of traffic signs was (too) late
Driving simulator:
decreased driving speed (compensation)
shorter following distance
lateral position independent of road curvature
bioptics!
bioptics?

UZ AntwerpUZ AntwerpUZ AntwerpUZ Antwerp
TrainingTraining
aim: teach compensatory viewing strategies
• laboratory training computer based tasks
• mobility training while walking or cycling
• motor traffic training while driving a car

UZ AntwerpUZ AntwerpUZ AntwerpUZ Antwerp
AFOVAFOV
60 degrees
24
degre
es
-15
-10-5
05
1015
-30 -20 -10 0 10 20 30
0
1
2
3
4
threshold presentation time (s)
Dependent variables:
mean threshold presentation time
variation (PDM)

UZ AntwerpUZ AntwerpUZ AntwerpUZ Antwerp
SubjectsSubjects
motor
laboratory mobility traffic
central VFD 5 5 7
peripheral VFD 6 8 7
centr+periph VFD 2 21
mild VFD 3 1 4

UZ AntwerpUZ AntwerpUZ AntwerpUZ Antwerp
AFOVAFOV
0
0.1
0.2
0.3
0.4
pre1 pre2 post1 post2
assessment
log
th
resh
old
pre
sen
tati
on
tim
e
0
20
40
60
80
100
PD
M
thresh. present. timePDM

UZ AntwerpUZ AntwerpUZ AntwerpUZ Antwerp
Driving simulatorDriving simulator
0
10
20
30
40
50
60
70
pre1 pre2 post1 post2session
nu
mb
er o
f h
ead
mo
vem
ents
0
5
10
15
20
25
30
dis
tan
ce t
o in
ters
ecti
on
(m
)
numberdti

UZ AntwerpUZ AntwerpUZ AntwerpUZ Antwerp
On-road driving testOn-road driving test
0
0.5
1
1.5
2
2.5
pre1 pre2 post1 post2session
view
ing
beh
avio
ur
(0-3
)
laboratory
mobility
motor traffic

UZ AntwerpUZ AntwerpUZ AntwerpUZ Antwerp
On-road driving testOn-road driving test
0
10
20
30
40
50
60
function mobility motor traffic
training
% p
ass
pre2post1post2
UZ AntwerpUZ AntwerpUZ AntwerpUZ Antwerp
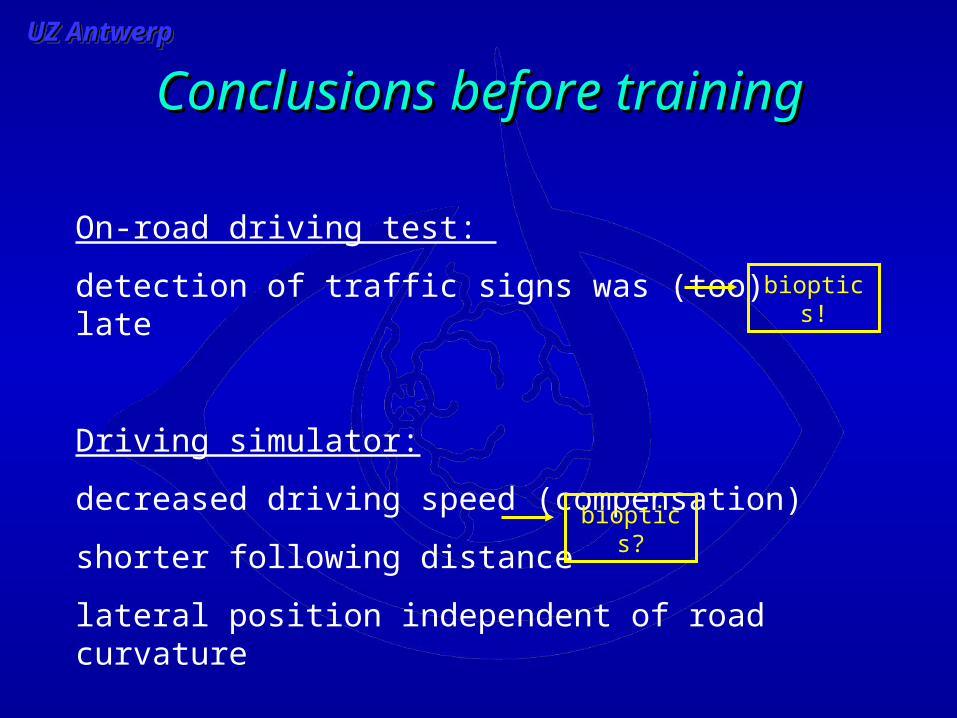
Positive training results:
• compensatory viewing behaviour (AFOV)
• viewing behaviour while driving
• practical fitness to drive (pass/fail score)
• best results: motor traffic training
Conclusions after trainingConclusions after training

UZ AntwerpUZ AntwerpUZ AntwerpUZ Antwerp
Central VFDCentral VFD
before training: 6/24 passed on-road driving test
training: 17/24 (14 failed, 3 passed)
after training: 8/17 passed on-road driving test
(5 had failed before training)

UZ AntwerpUZ AntwerpUZ AntwerpUZ Antwerp
ConclusionConclusion
• Are subjects with decreased visual acuity due to a central visual field defect able to drive safely?
Yes, 11/24 (46%) passed on-road driving test.
• Might bioptic telescopes be helpful to these subjects?
Yes, to improve ‘detection of traffic signs’ and ‘following distance’.