UVSpectroscopy_HS13.pdf
60
Physikalisch-chemisches Praktikum I UV-Vis – 2013 Page 1 of 10 UV/VIS Spectroscopy 1. Summary An obvious difference between many compounds is their colour. For example, quinone is yellow; chlorophyll is green; the 2,4-dinitrophenylhydrazone derivatives of aldehydes and ketones range in colour from bright yellow to deep red, depending on double bond conjugation; and aspirin is colourless. All these colours are caused by absorption of light in the visible region of the electromagnetic spectrum (~400 – 800 nm) under excitation of an electron from the ground state into a higher orbital. In this experiment you will become familiar with the handling of a commercial spectrometer and use absorption spectra to determine the pKa value of an indicator. 2. Introduction 2.1. Absorption of Radiation Electronic orbitals of atoms and molecules have characteristic energies, giving rise to a set of discrete energy levels. An electron is able to change from an occupied orbital to another orbital, gaining or losing energy only in amounts exactly corresponding to the difference between two levels: The promotion of an electron from the ground state (lowest possible energy) at energy E 1 to energy E 2 is possible if the molecule absorbs electromagnetic radiation of the corresponding wavelength λ=c h / (E 2 - E 1 ) (c = speed of light, h = Planck constant). The electron at a higher energy is then said to be excited and to be in an excited state. Excited states usually exist only for very short periods of time (femtoseconds to microseconds), because the higher energy state is unstable and the extra energy is lost through relaxation processes such as emission of light. The typical energy difference between the ground and the first excited levels of many molecules corresponds to electromagnetic waves of the ultra-violet (UV) and visible regions of the electromagnetic spectrum.
-
Upload
amy-nicole-curry -
Category
Documents
-
view
215 -
download
1
Transcript of UVSpectroscopy_HS13.pdf

Physikalisch-chemisches Praktikum I UV-Vis – 2013
Page 1 of 10
UV/VIS Spectroscopy
1. Summary
An obvious difference between many compounds is their colour. For example, quinone is yellow; chlorophyll is green; the 2,4-dinitrophenylhydrazone derivatives of aldehydes and ketones range in colour from bright yellow to deep red, depending on double bond conjugation; and aspirin is colourless. All these colours are caused by absorption of light in the visible region of the electromagnetic spectrum (~400 – 800 nm) under excitation of an electron from the ground state into a higher orbital. In this experiment you will become familiar with the handling of a commercial spectrometer and use absorption spectra to determine the pKa value of an indicator.
2. Introduction
2.1. Absorption of Radiation
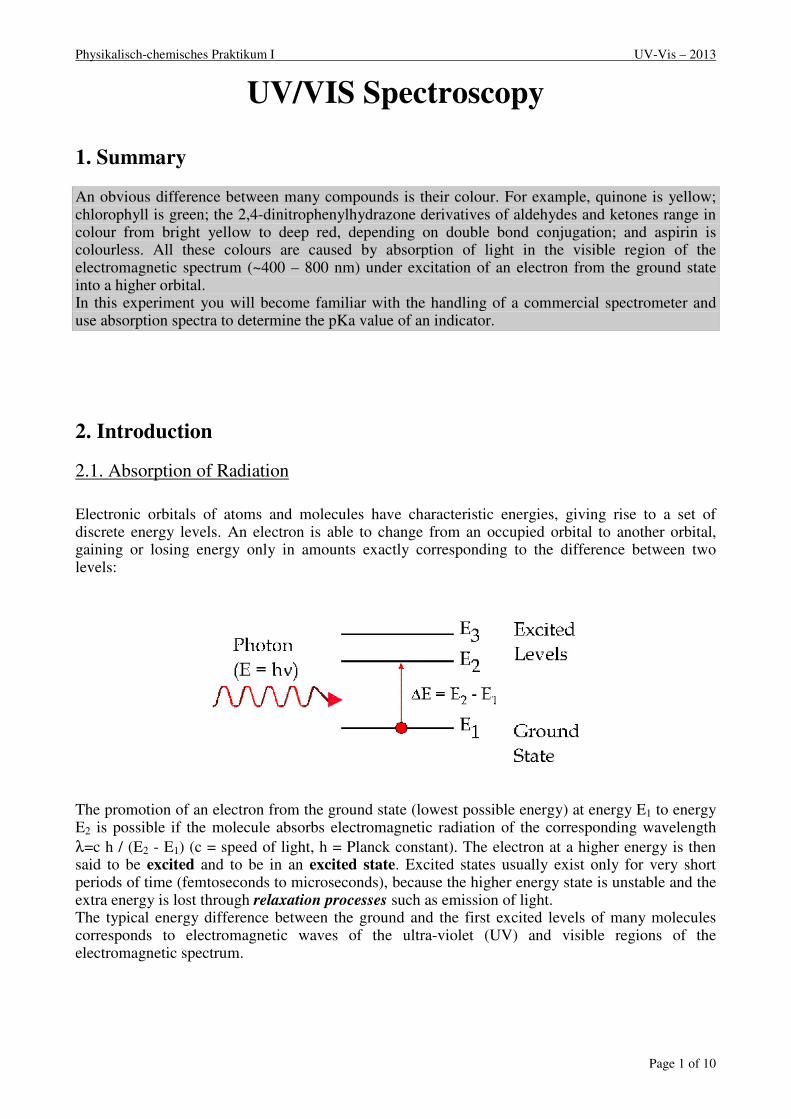
Electronic orbitals of atoms and molecules have characteristic energies, giving rise to a set of discrete energy levels. An electron is able to change from an occupied orbital to another orbital, gaining or losing energy only in amounts exactly corresponding to the difference between two levels:
The promotion of an electron from the ground state (lowest possible energy) at energy E1 to energy E2 is possible if the molecule absorbs electromagnetic radiation of the corresponding wavelength
λ=c h / (E2 - E1) (c = speed of light, h = Planck constant). The electron at a higher energy is then said to be excited and to be in an excited state. Excited states usually exist only for very short periods of time (femtoseconds to microseconds), because the higher energy state is unstable and the extra energy is lost through relaxation processes such as emission of light. The typical energy difference between the ground and the first excited levels of many molecules corresponds to electromagnetic waves of the ultra-violet (UV) and visible regions of the electromagnetic spectrum.

Physikalisch-chemisches Praktikum I UV-Vis – 2013
Page 2 of 10
2.2. The Electromagnetic Spectrum
The UV-visible range is only a small part of the total electromagnetic spectrum, and is generally defined from wavelengths of 190 nm at the high energy UV end to about 750 nm at the low energy red end of the spectrum. Light of other regions of the spectrum gives rise to different types of transitions and hence different types of spectroscopy. For example, IR radiation is usually not energetic enough to cause electronic transitions but can excite vibrations of molecules.
Wavelength λλλλ is the distance between adjacent peaks (or troughs) in the travelling electromagnetic wave, and may be designated in meters, centimetres or nanometres (10
-9 meters). Visible
wavelengths cover a range from approximately 400 to 750 nm.
Frequency νννν is the number of wave cycles that travel past a fixed point per unit of time, and is usually given in cycles per second, or Hertz (Hz). Frequency and wavelength are related via
νλ /c= (1)
where c is the speed of light.
When polychromatic or “white” light passes through or is reflected by a coloured substance, a characteristic portion of the spectrum is absorbed. The remaining light will then exhibit the complementary colour to the wavelength(s) absorbed. Thus, absorption of blue light between 420-430 nm renders a substance yellow, and absorption of green, 500-520 nm light makes it red. Green is unique in that it can be created by absorption close to 400 nm as well as absorption near 800 nm.
2.3. Absorbance and Electronic Transitions
When light travels through a thin slice ∆x of absorbing sample, its intensity diminishes by an amount proportional to the initial intensity I0 and the thickness of the slice:
xIII ∆−= 001 α (2)
This can be rewritten in the form:
0
01 Ix
IIα−=
∆
− or I
dx
dIα−= (3)

Physikalisch-chemisches Praktikum I UV-Vis – 2013
Page 3 of 10
which is a differential equation with the solution
]exp[)( 0 xIxI α−= (4)
By convention, this Lambert-Beer law is usually written in decadic form:
xaIxI
−= 10)( 0 (5)
with the proportionality constant a=α/ln(10). The higher the concentration c of molecules in the sample, the larger is a, so we obtain for the light intensity after a sample of thickness d:
dcIdI
ε−= 10)( 0 (6)
The wavelength dependent quantity ε(λ) is called molar extinction coefficient. It is a measure of the probability that an electronic transition takes place when a molecule interacts with light of
wavelength λ. The sample thickness is usually given in cm, the concentration in mol/l.
Consequently, the unit of ε is
cmMcml
mol 1][ ==ε (7)
UV-visible spectrometers usually measure absorbance, which is the log-ratio of transmitted (sample in beam) over incident (no sample in beam) intensities:
dcI
IA )(log)(
0
10 λελ =−= (8)
When more than one species is present in the sample, the absorbance is the sum of the different contributions:
dccA ])()([)( 2211 K++= λελελ (9)
An absorption spectrum A(λ) shows us the wavelength at which a molecule can absorb light and thus provides information about electronic state energies. Consequently, absorption spectroscopy carried out in UV-visible spectral region is sometimes called "electronic spectroscopy".
In addition, from the magnitude of A(λ) we can obtain information on sample composition and the probability of an electronic transition to take place. Depending on the nature of the ground and excited state orbitals this probability can be very different.

Physikalisch-chemisches Praktikum I UV-Vis – 2013
Page 4 of 10
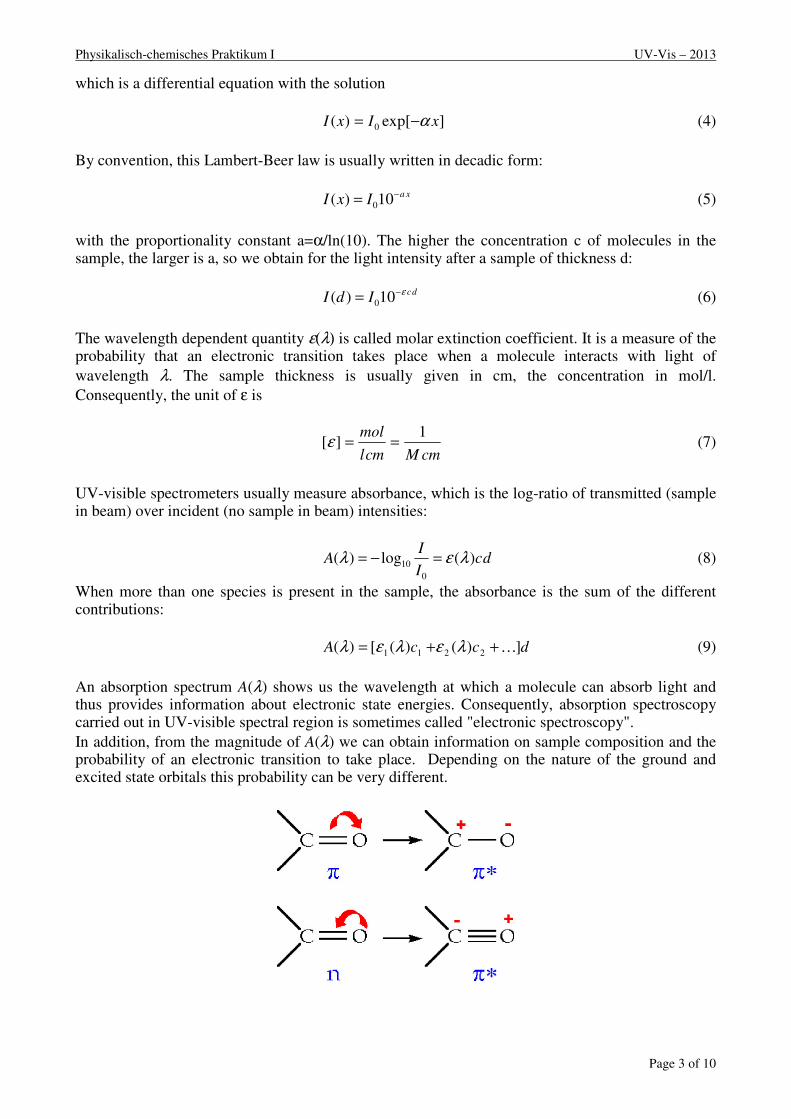
A rigorous discussion of transition probabilities is beyond the scope of this lab course, but one obvious factor is the overlap of the orbitals involved in the electronic excitation. This is nicely
illustrated by the two transitions of an isolated carbonyl group. The n → π* transition is lower in
energy (λmax=290 nm) than the π → π* transition (λmax=180 nm), but the transition probability of the former is a thousand times smaller than that of the latter. The spatial distribution of these orbitals suggests why this is so. As illustrated in the following diagram, the n-orbitals do not overlap at all
well with the π* orbital, so the probability of this excitation is small. The π → π* transition, on the other hand, involves orbitals that have significant overlap, and the transition probability is very large.
Transitions between electronic states are often divided into the following categories:
a. n → σ
* transitions
Saturated compounds with substituents containing lone-pairs such as water, ammonia,
hydrogen disulphide may only display σ-σ*
and n-σ*
transitions.
b. π → π* transitions
For molecules that possess π bonds like alkenes, alkynes, aromatics, acryl compounds or
nitriles, light can promote electrons from a π bonding molecular orbital to a π anti-bonding
molecular orbital. This is called a π → π* transition and is usually strong (high extinction
coefficient). The energy difference for such a transition depends on the π bonded atoms. π
bonds between two carbon atoms give rise to a different π → π* transition than π bonds
between a carbon and an oxygen atom (a carbonyl) or a π bond between a carbon atom and a
nitrogen atom (in a nitrile). Groups of atoms involved in π bonding are often called "chromophores".
c. n → π* transitions
Even lone pairs that exist on oxygen and nitrogen atoms may be promoted from their non-
bonding molecular orbital to a π anti-bonding molecular orbital within a molecule. This is
called an n → π* transition and requires less energy (longer wavelength) compared to a π →
π* transition within the same chromophore. However, the transition probability is usually
much lower.

Physikalisch-chemisches Praktikum I UV-Vis – 2013
Page 5 of 10
d. d-d transitions Many transition metal ion solutions are coloured as a result of their partially filled d-levels, which allows promotion of an electron to an excited state (change of d-level occupation) by the absorption of relatively low energy visible light. The bands are often broad and strongly influenced by the chemical environment. They are also usually very weak.
e. Charge transfer transitions
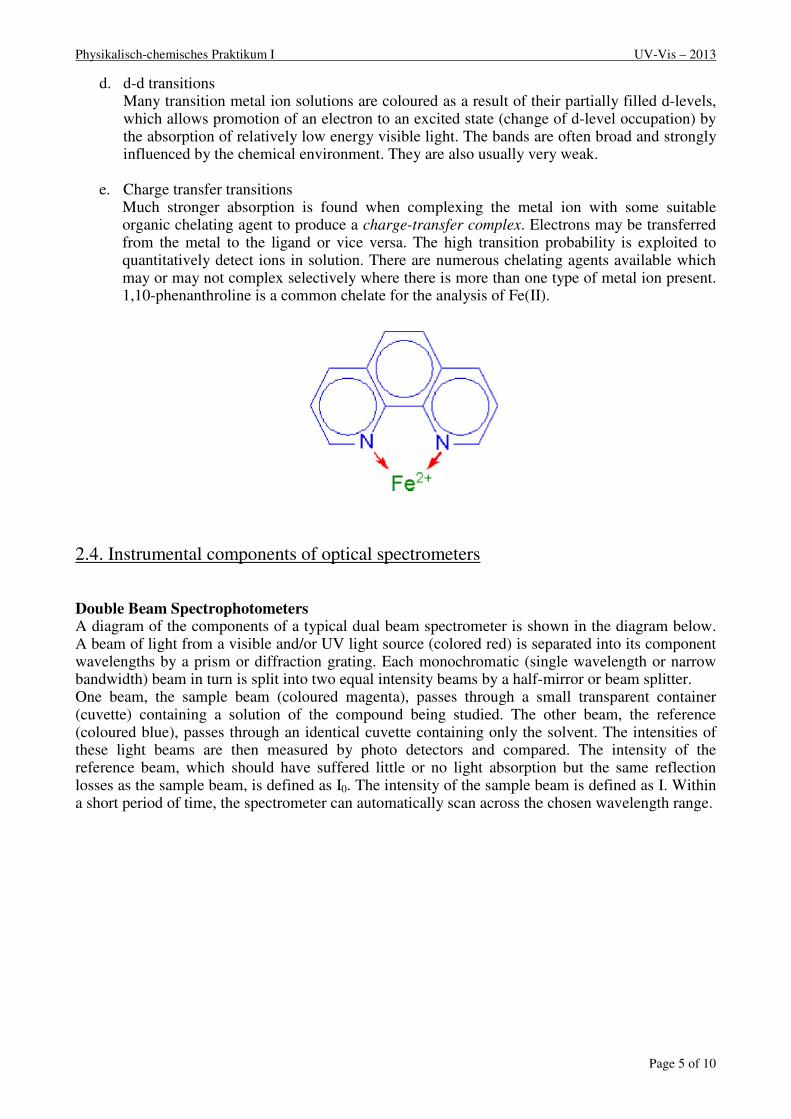
Much stronger absorption is found when complexing the metal ion with some suitable organic chelating agent to produce a charge-transfer complex. Electrons may be transferred from the metal to the ligand or vice versa. The high transition probability is exploited to quantitatively detect ions in solution. There are numerous chelating agents available which may or may not complex selectively where there is more than one type of metal ion present. 1,10-phenanthroline is a common chelate for the analysis of Fe(II).
2.4. Instrumental components of optical spectrometers
Double Beam Spectrophotometers A diagram of the components of a typical dual beam spectrometer is shown in the diagram below. A beam of light from a visible and/or UV light source (colored red) is separated into its component wavelengths by a prism or diffraction grating. Each monochromatic (single wavelength or narrow bandwidth) beam in turn is split into two equal intensity beams by a half-mirror or beam splitter. One beam, the sample beam (coloured magenta), passes through a small transparent container (cuvette) containing a solution of the compound being studied. The other beam, the reference (coloured blue), passes through an identical cuvette containing only the solvent. The intensities of these light beams are then measured by photo detectors and compared. The intensity of the reference beam, which should have suffered little or no light absorption but the same reflection losses as the sample beam, is defined as I0. The intensity of the sample beam is defined as I. Within a short period of time, the spectrometer can automatically scan across the chosen wavelength range.

Physikalisch-chemisches Praktikum I UV-Vis – 2013
Page 6 of 10
During a wavelength scan, intensity changes and fluctuations are equally sensed by the two detectors and normalized out by the division of I by I0 (equation 8). However, even if both cuvettes contain the same solution, these two intensities may not be exactly the same, for example because of different detector efficiencies or spatial beam drifts. This leads to a small background spectrum, which can even be negative in some frequency ranges. Like with a single beam spectrometer (no reference beam) it is thus important to first record the background spectrum with only solvent in the sample cell. This spectrum must then be subtracted from the one recorded with the sample solution.
Light Sources Radiation sources need to be continuous over the range of wavelengths of interest. The earliest sources were simply tungsten filament bulbs (light-bulbs!) but these have since been replaced by tungsten-halogen. Such light sources cover the wavelength range from 300-900 nm. To reach further into the UV an additional source is needed. This is usually a deuterium arc lamp, which has a continuous spectrum below 400 nm. Monochromator A monochromator ("single colour") is used to select the wavelength at which an absorption measurement is to be made. In fact, it is not practically possible to obtain one wavelength, but rather a narrow range of wavelengths, which defines the spectral resolution of the spectrometer. There are two main choices for a monochromator: a prism, or a diffraction grating. The former was the original component, but now most modern instruments employ gratings:

Physikalisch-chemisches Praktikum I UV-Vis – 2013
Page 7 of 10
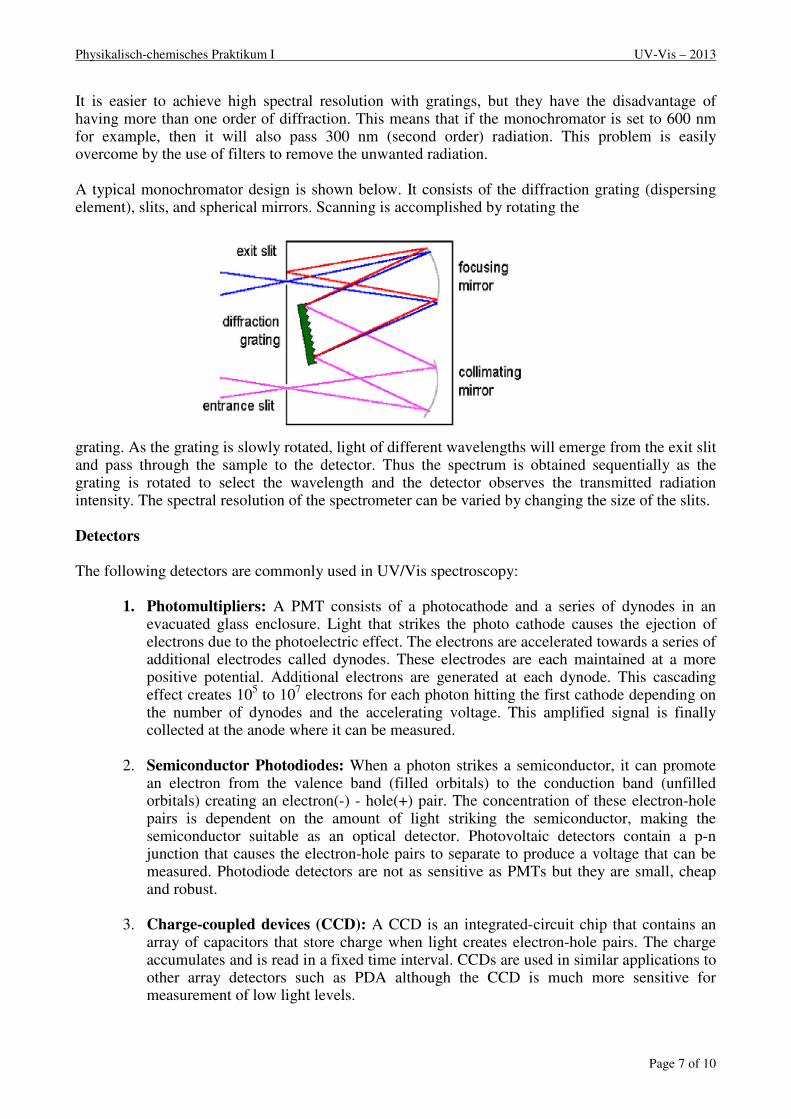
It is easier to achieve high spectral resolution with gratings, but they have the disadvantage of having more than one order of diffraction. This means that if the monochromator is set to 600 nm for example, then it will also pass 300 nm (second order) radiation. This problem is easily overcome by the use of filters to remove the unwanted radiation. A typical monochromator design is shown below. It consists of the diffraction grating (dispersing element), slits, and spherical mirrors. Scanning is accomplished by rotating the
grating. As the grating is slowly rotated, light of different wavelengths will emerge from the exit slit and pass through the sample to the detector. Thus the spectrum is obtained sequentially as the grating is rotated to select the wavelength and the detector observes the transmitted radiation intensity. The spectral resolution of the spectrometer can be varied by changing the size of the slits. Detectors The following detectors are commonly used in UV/Vis spectroscopy:
1. Photomultipliers: A PMT consists of a photocathode and a series of dynodes in an evacuated glass enclosure. Light that strikes the photo cathode causes the ejection of electrons due to the photoelectric effect. The electrons are accelerated towards a series of additional electrodes called dynodes. These electrodes are each maintained at a more positive potential. Additional electrons are generated at each dynode. This cascading effect creates 10
5 to 10
7 electrons for each photon hitting the first cathode depending on
the number of dynodes and the accelerating voltage. This amplified signal is finally collected at the anode where it can be measured.
2. Semiconductor Photodiodes: When a photon strikes a semiconductor, it can promote an electron from the valence band (filled orbitals) to the conduction band (unfilled orbitals) creating an electron(-) - hole(+) pair. The concentration of these electron-hole pairs is dependent on the amount of light striking the semiconductor, making the semiconductor suitable as an optical detector. Photovoltaic detectors contain a p-n junction that causes the electron-hole pairs to separate to produce a voltage that can be measured. Photodiode detectors are not as sensitive as PMTs but they are small, cheap and robust.
3. Charge-coupled devices (CCD): A CCD is an integrated-circuit chip that contains an array of capacitors that store charge when light creates electron-hole pairs. The charge accumulates and is read in a fixed time interval. CCDs are used in similar applications to other array detectors such as PDA although the CCD is much more sensitive for measurement of low light levels.

Physikalisch-chemisches Praktikum I UV-Vis – 2013
Page 8 of 10
Data acquisition The earliest instruments simply directly connected the amplified detector signal to a chart recorder. Today, all experimental settings are controlled by a computer and the detector signals are digitized, processed and stored. Nevertheless it is important that you note parameters which you set via the instrument software (slit width, scan range, scan speed, single beam/dual beam…) into your laboratory journal, along with the name of the file containing the data (and its path). Otherwise it can become very difficult to find or reproduce a measurement after other users have changed these settings!
2.5. Quantitative work
A frequent analytic application of UV-vis spectroscopy is the precise determination of concentration. You should already be familiar with this method from your first year lab course. There, you have determined the Manganese concentration in steel by measuring the absorbance (at a single wavelength) of a solution of permanganate ions that you produced from your steel sample. In addition, you recorded the absorbance of a series of permanganate solutions of known concentration. This allowed you to make a calibration graph of absorbance vs. concentration and fit
a straight line with slope of ε d (molar extinction coefficient times the path length).
The unknown concentration of sample could then be simply read of from the graph or calculated using the value of e determined from the slope. Note that the calibration points and therefore also the straight line usually have errors, which must be taken into account to calculate the final error of the concentration.
2.6. Indicators PH-Indicators are molecules whose colour depends on their protonation state, i.e. they have different colours in different pH-regions. Although the structural changes accompanying protonation and deprotonation may be quite complex, we may simply denote the deprotonated indicator by Ind and the protonated form by HInd and write down the simple equilibrium equation
+− +↔+ OHIndOHHInd 32
This equation has an equilibrium constant[ ][ ]
[ ]HInd
OHIndKa
+−
= 3 , so that we get:

Physikalisch-chemisches Praktikum I UV-Vis – 2013
Page 9 of 10
[ ][ ]HInd
IndLogpHpKa
−
−= 10
It is therefore possible to determine the pKa of the indicator by measuring the concentration ratio
[ ][ ]HInd
Ind−
at different pH values. This concentration ratio can be determined from the UV-vis spectra.
3. Experimental Tasks A. Make yourself familiar with the Spectrometers and make sure that you understand all parameters. Record spectra with only solvent in the cuvette and then repeat the measurement. Load the data you have obtained into a data analysis program (Exel, SciDavies, Origin) and plot the spectra. How big is the difference between two consecutive scans and thus the instrumental error in your data? B. Measure the absorption spectrum of a pH indicator (Bromothymol blue or other) in some buffer solution at different pH, in order to determine its pKa
a. Preparation :
1. Prepare a solution of 50mL of Bromothymol blue at 5.10-4
M in distilled water. The molar mass of Bromothymol blue is 624.38g.mol
-1. Prepare this solution carefully, as
you will use it to make all your other solutions. Note: The assistant may decide to give you a different indicator and will provide the necessary information! From this solution you will make all your other solution. If you take a small volume of this solution and dilute it in a bigger volume (typically >5 times) of any buffer solution, then you can assume that the pH you get is that of the buffer solution.
b. Acquisition of the absorption spectra :
1. Record absorption spectra of Bromothymol blue for pH ≥ 9 and pH ≤ 5 at 5 different concentrations (between c= 10
-4 and c= 2.10
-6). You may also be given a different
indicator and pH range by the Assistant. 2. Record absorption spectra of the indicator for three different pH ( ≥ 9, ≤ 5 and at a
well-defined pH near 7), always at the same concentration.
4. Data Evaluation
3. Plot the optical density at the maximum of the absorption bands as a function of concentration at basic and acidic pH. Calculate the molar extinction coefficient at the
absorption maximum ε(λmax) for the two forms of the indicator, using linear
regression. Provide error limits for ε(λmax). 4. Plot the three spectra recorded at different pH in a single graph, find the wavelength
of the isosbestic point and calculate the pKa. Use your errors for the extinction coefficients to calculate errors for concentrations and pKa. Also consider the uncertainty in pH.

Physikalisch-chemisches Praktikum I UV-Vis – 2013
Page 10 of 10
Hint: Estimate the concentration of HInd and Ind
- at the different pH values of the measurements,
knowing that the pKa of Bromothymol blue is around 7. Use this estimate to simplify the calculation of the extinction coefficient. (Of course: [HInd] + [Ind
-] =const)
Consider a generic indicator (HInd). At low pH the indicator is completely in the HInd form and the absorbance which is due to HInd is at a maximum Likewise, at high pH the indicator is completely in the Ind- form and the absorbance which is due to Ind- is at a maximum . At intermediate pH, the solution contains appreciable concentrations of both HInd and Ind-, and exhibits an absorbance spectrum containing contributions form both forms. As pH changes, the relative concentrations of each form will change in accordance with the Ka of the indicator and the resulting absorbance will also change.

Physikalisch-chemisches Praktikum I UV-Vis – 2013
Page 1 of 10
UV/VIS Spectroscopy
1. Summary
An obvious difference between many compounds is their colour. For example, quinone is yellow; chlorophyll is green; the 2,4-dinitrophenylhydrazone derivatives of aldehydes and ketones range in colour from bright yellow to deep red, depending on double bond conjugation; and aspirin is colourless. All these colours are caused by absorption of light in the visible region of the electromagnetic spectrum (~400 – 800 nm) under excitation of an electron from the ground state into a higher orbital. In this experiment you will become familiar with the handling of a commercial spectrometer and use absorption spectra to determine the pKa value of an indicator.
2. Introduction
2.1. Absorption of Radiation
Electronic orbitals of atoms and molecules have characteristic energies, giving rise to a set of discrete energy levels. An electron is able to change from an occupied orbital to another orbital, gaining or losing energy only in amounts exactly corresponding to the difference between two levels:
The promotion of an electron from the ground state (lowest possible energy) at energy E1 to energy E2 is possible if the molecule absorbs electromagnetic radiation of the corresponding wavelength
λ=c h / (E2 - E1) (c = speed of light, h = Planck constant). The electron at a higher energy is then said to be excited and to be in an excited state. Excited states usually exist only for very short periods of time (femtoseconds to microseconds), because the higher energy state is unstable and the extra energy is lost through relaxation processes such as emission of light. The typical energy difference between the ground and the first excited levels of many molecules corresponds to electromagnetic waves of the ultra-violet (UV) and visible regions of the electromagnetic spectrum.

Physikalisch-chemisches Praktikum I UV-Vis – 2013
Page 2 of 10
2.2. The Electromagnetic Spectrum
The UV-visible range is only a small part of the total electromagnetic spectrum, and is generally defined from wavelengths of 190 nm at the high energy UV end to about 750 nm at the low energy red end of the spectrum. Light of other regions of the spectrum gives rise to different types of transitions and hence different types of spectroscopy. For example, IR radiation is usually not energetic enough to cause electronic transitions but can excite vibrations of molecules.
Wavelength λλλλ is the distance between adjacent peaks (or troughs) in the travelling electromagnetic wave, and may be designated in meters, centimetres or nanometres (10
-9 meters). Visible
wavelengths cover a range from approximately 400 to 750 nm.
Frequency νννν is the number of wave cycles that travel past a fixed point per unit of time, and is usually given in cycles per second, or Hertz (Hz). Frequency and wavelength are related via
νλ /c= (1)
where c is the speed of light.
When polychromatic or “white” light passes through or is reflected by a coloured substance, a characteristic portion of the spectrum is absorbed. The remaining light will then exhibit the complementary colour to the wavelength(s) absorbed. Thus, absorption of blue light between 420-430 nm renders a substance yellow, and absorption of green, 500-520 nm light makes it red. Green is unique in that it can be created by absorption close to 400 nm as well as absorption near 800 nm.
2.3. Absorbance and Electronic Transitions
When light travels through a thin slice ∆x of absorbing sample, its intensity diminishes by an amount proportional to the initial intensity I0 and the thickness of the slice:
xIII ∆−= 001 α (2)
This can be rewritten in the form:
001 I
x
IIα−=
∆
− or I
dx
dIα−= (3)
Physikalisch-chemisches Praktikum I UV-Vis – 2013
Page 3 of 10
which is a differential equation with the solution
]exp[)( 0 xIxI α−= (4)
By convention, this Lambert-Beer law is usually written in decadic form:
xaIxI
−= 10)( 0 (5)
with the proportionality constant a=α/ln(10). The higher the concentration c of molecules in the sample, the larger is a, so we obtain for the light intensity after a sample of thickness d:
dcIdI
ε−= 10)( 0 (6)
The wavelength dependent quantity ε(λ) is called molar extinction coefficient. It is a measure of the probability that an electronic transition takes place when a molecule interacts with light of
wavelength λ. The sample thickness is usually given in cm, the concentration in mol/l.
Consequently, the unit of ε is
cmMcml
mol 1][ ==ε (7)
UV-visible spectrometers usually measure absorbance, which is the log-ratio of transmitted (sample in beam) over incident (no sample in beam) intensities:
dcI
IA )(log)(
0
10 λελ =−= (8)
When more than one species is present in the sample, the absorbance is the sum of the different contributions:
dccA ])()([)( 2211 K++= λελελ (9)
An absorption spectrum A(λ) shows us the wavelength at which a molecule can absorb light and thus provides information about electronic state energies. Consequently, absorption spectroscopy carried out in UV-visible spectral region is sometimes called "electronic spectroscopy".
In addition, from the magnitude of A(λ) we can obtain information on sample composition and the probability of an electronic transition to take place. Depending on the nature of the ground and excited state orbitals this probability can be very different.

Physikalisch-chemisches Praktikum I UV-Vis – 2013
Page 4 of 10
A rigorous discussion of transition probabilities is beyond the scope of this lab course, but one obvious factor is the overlap of the orbitals involved in the electronic excitation. This is nicely
illustrated by the two transitions of an isolated carbonyl group. The n → π* transition is lower in
energy (λmax=290 nm) than the π → π* transition (λmax=180 nm), but the transition probability of the former is a thousand times smaller than that of the latter. The spatial distribution of these orbitals suggests why this is so. As illustrated in the following diagram, the n-orbitals do not overlap at all
well with the π* orbital, so the probability of this excitation is small. The π → π* transition, on the other hand, involves orbitals that have significant overlap, and the transition probability is very large.
Transitions between electronic states are often divided into the following categories:
a. n → σ
* transitions
Saturated compounds with substituents containing lone-pairs such as water, ammonia,
hydrogen disulphide may only display σ-σ*
and n-σ*
transitions.
b. π → π* transitions
For molecules that possess π bonds like alkenes, alkynes, aromatics, acryl compounds or
nitriles, light can promote electrons from a π bonding molecular orbital to a π anti-bonding
molecular orbital. This is called a π → π* transition and is usually strong (high extinction
coefficient). The energy difference for such a transition depends on the π bonded atoms. π
bonds between two carbon atoms give rise to a different π → π* transition than π bonds
between a carbon and an oxygen atom (a carbonyl) or a π bond between a carbon atom and a
nitrogen atom (in a nitrile). Groups of atoms involved in π bonding are often called "chromophores".
c. n → π* transitions
Even lone pairs that exist on oxygen and nitrogen atoms may be promoted from their non-
bonding molecular orbital to a π anti-bonding molecular orbital within a molecule. This is
called an n → π* transition and requires less energy (longer wavelength) compared to a π →
π* transition within the same chromophore. However, the transition probability is usually
much lower.
Physikalisch-chemisches Praktikum I UV-Vis – 2013
Page 5 of 10
d. d-d transitions Many transition metal ion solutions are coloured as a result of their partially filled d-levels, which allows promotion of an electron to an excited state (change of d-level occupation) by the absorption of relatively low energy visible light. The bands are often broad and strongly influenced by the chemical environment. They are also usually very weak.
e. Charge transfer transitions
Much stronger absorption is found when complexing the metal ion with some suitable organic chelating agent to produce a charge-transfer complex. Electrons may be transferred from the metal to the ligand or vice versa. The high transition probability is exploited to quantitatively detect ions in solution. There are numerous chelating agents available which may or may not complex selectively where there is more than one type of metal ion present. 1,10-phenanthroline is a common chelate for the analysis of Fe(II).
2.4. Instrumental components of optical spectrometers
Double Beam Spectrophotometers A diagram of the components of a typical dual beam spectrometer is shown in the diagram below. A beam of light from a visible and/or UV light source (colored red) is separated into its component wavelengths by a prism or diffraction grating. Each monochromatic (single wavelength or narrow bandwidth) beam in turn is split into two equal intensity beams by a half-mirror or beam splitter. One beam, the sample beam (coloured magenta), passes through a small transparent container (cuvette) containing a solution of the compound being studied. The other beam, the reference (coloured blue), passes through an identical cuvette containing only the solvent. The intensities of these light beams are then measured by photo detectors and compared. The intensity of the reference beam, which should have suffered little or no light absorption but the same reflection losses as the sample beam, is defined as I0. The intensity of the sample beam is defined as I. Within a short period of time, the spectrometer can automatically scan across the chosen wavelength range.

Physikalisch-chemisches Praktikum I UV-Vis – 2013
Page 6 of 10
During a wavelength scan, intensity changes and fluctuations are equally sensed by the two detectors and normalized out by the division of I by I0 (equation 8). However, even if both cuvettes contain the same solution, these two intensities may not be exactly the same, for example because of different detector efficiencies or spatial beam drifts. This leads to a small background spectrum, which can even be negative in some frequency ranges. Like with a single beam spectrometer (no reference beam) it is thus important to first record the background spectrum with only solvent in the sample cell. This spectrum must then be subtracted from the one recorded with the sample solution.
Light Sources Radiation sources need to be continuous over the range of wavelengths of interest. The earliest sources were simply tungsten filament bulbs (light-bulbs!) but these have since been replaced by tungsten-halogen. Such light sources cover the wavelength range from 300-900 nm. To reach further into the UV an additional source is needed. This is usually a deuterium arc lamp, which has a continuous spectrum below 400 nm. Monochromator A monochromator ("single colour") is used to select the wavelength at which an absorption measurement is to be made. In fact, it is not practically possible to obtain one wavelength, but rather a narrow range of wavelengths, which defines the spectral resolution of the spectrometer. There are two main choices for a monochromator: a prism, or a diffraction grating. The former was the original component, but now most modern instruments employ gratings:

Physikalisch-chemisches Praktikum I UV-Vis – 2013
Page 7 of 10
It is easier to achieve high spectral resolution with gratings, but they have the disadvantage of having more than one order of diffraction. This means that if the monochromator is set to 600 nm for example, then it will also pass 300 nm (second order) radiation. This problem is easily overcome by the use of filters to remove the unwanted radiation. A typical monochromator design is shown below. It consists of the diffraction grating (dispersing element), slits, and spherical mirrors. Scanning is accomplished by rotating the
grating. As the grating is slowly rotated, light of different wavelengths will emerge from the exit slit and pass through the sample to the detector. Thus the spectrum is obtained sequentially as the grating is rotated to select the wavelength and the detector observes the transmitted radiation intensity. The spectral resolution of the spectrometer can be varied by changing the size of the slits. Detectors The following detectors are commonly used in UV/Vis spectroscopy:
1. Photomultipliers: A PMT consists of a photocathode and a series of dynodes in an evacuated glass enclosure. Light that strikes the photo cathode causes the ejection of electrons due to the photoelectric effect. The electrons are accelerated towards a series of additional electrodes called dynodes. These electrodes are each maintained at a more positive potential. Additional electrons are generated at each dynode. This cascading effect creates 10
5 to 10
7 electrons for each photon hitting the first cathode depending on
the number of dynodes and the accelerating voltage. This amplified signal is finally collected at the anode where it can be measured.
2. Semiconductor Photodiodes: When a photon strikes a semiconductor, it can promote an electron from the valence band (filled orbitals) to the conduction band (unfilled orbitals) creating an electron(-) - hole(+) pair. The concentration of these electron-hole pairs is dependent on the amount of light striking the semiconductor, making the semiconductor suitable as an optical detector. Photovoltaic detectors contain a p-n junction that causes the electron-hole pairs to separate to produce a voltage that can be measured. Photodiode detectors are not as sensitive as PMTs but they are small, cheap and robust.
3. Charge-coupled devices (CCD): A CCD is an integrated-circuit chip that contains an array of capacitors that store charge when light creates electron-hole pairs. The charge accumulates and is read in a fixed time interval. CCDs are used in similar applications to other array detectors such as PDA although the CCD is much more sensitive for measurement of low light levels.

Physikalisch-chemisches Praktikum I UV-Vis – 2013
Page 8 of 10
Data acquisition The earliest instruments simply directly connected the amplified detector signal to a chart recorder. Today, all experimental settings are controlled by a computer and the detector signals are digitized, processed and stored. Nevertheless it is important that you note parameters which you set via the instrument software (slit width, scan range, scan speed, single beam/dual beam…) into your laboratory journal, along with the name of the file containing the data (and its path). Otherwise it can become very difficult to find or reproduce a measurement after other users have changed these settings!
2.5. Quantitative work
A frequent analytic application of UV-vis spectroscopy is the precise determination of concentration. You should already be familiar with this method from your first year lab course. There, you have determined the Manganese concentration in steel by measuring the absorbance (at a single wavelength) of a solution of permanganate ions that you produced from your steel sample. In addition, you recorded the absorbance of a series of permanganate solutions of known concentration. This allowed you to make a calibration graph of absorbance vs. concentration and fit
a straight line with slope of ε d (molar extinction coefficient times the path length).
The unknown concentration of sample could then be simply read of from the graph or calculated using the value of e determined from the slope. Note that the calibration points and therefore also the straight line usually have errors, which must be taken into account to calculate the final error of the concentration.
2.6. Indicators PH-Indicators are molecules whose colour depends on their protonation state, i.e. they have different colours in different pH-regions. Although the structural changes accompanying protonation and deprotonation may be quite complex, we may simply denote the deprotonated indicator by Ind and the protonated form by HInd and write down the simple equilibrium equation
+− +↔+ OHIndOHHInd 32
This equation has an equilibrium constant[ ][ ]
[ ]HInd
OHIndKa
+−
= 3 , so that we get:

Physikalisch-chemisches Praktikum I UV-Vis – 2013
Page 9 of 10
[ ][ ]HInd
IndLogpHpKa
−
−= 10
It is therefore possible to determine the pKa of the indicator by measuring the concentration ratio
[ ][ ]HInd
Ind−
at different pH values. This concentration ratio can be determined from the UV-vis spectra.
3. Experimental Tasks A. Make yourself familiar with the Spectrometers and make sure that you understand all parameters. Record spectra with only solvent in the cuvette and then repeat the measurement. Load the data you have obtained into a data analysis program (Exel, SciDavies, Origin) and plot the spectra. How big is the difference between two consecutive scans and thus the instrumental error in your data? B. Measure the absorption spectrum of a pH indicator (Bromothymol blue or other) in some buffer solution at different pH, in order to determine its pKa
a. Preparation :
1. Prepare a solution of 50mL of Bromothymol blue at 5.10-4
M in distilled water. The molar mass of Bromothymol blue is 624.38g.mol
-1. Prepare this solution carefully, as
you will use it to make all your other solutions. Note: The assistant may decide to give you a different indicator and will provide the necessary information! From this solution you will make all your other solution. If you take a small volume of this solution and dilute it in a bigger volume (typically >5 times) of any buffer solution, then you can assume that the pH you get is that of the buffer solution.
b. Acquisition of the absorption spectra :
1. Record absorption spectra of Bromothymol blue for pH ≥ 9 and pH ≤ 5 at 5 different concentrations (between c= 10
-4 and c= 2.10
-6). You may also be given a different
indicator and pH range by the Assistant. 2. Record absorption spectra of the indicator for three different pH ( ≥ 9, ≤ 5 and at a
well-defined pH near 7), always at the same concentration.
4. Data Evaluation
3. Plot the optical density at the maximum of the absorption bands as a function of concentration at basic and acidic pH. Calculate the molar extinction coefficient at the
absorption maximum ε(λmax) for the two forms of the indicator, using linear
regression. Provide error limits for ε(λmax). 4. Plot the three spectra recorded at different pH in a single graph, find the wavelength
of the isosbestic point and calculate the pKa. Use your errors for the extinction coefficients to calculate errors for concentrations and pKa. Also consider the uncertainty in pH.

Physikalisch-chemisches Praktikum I UV-Vis – 2013
Page 10 of 10
Hint: Estimate the concentration of HInd and Ind
- at the different pH values of the measurements,
knowing that the pKa of Bromothymol blue is around 7. Use this estimate to simplify the calculation of the extinction coefficient. (Of course: [HInd] + [Ind
-] =const)
Consider a generic indicator (HInd). At low pH the indicator is completely in the HInd form and the absorbance which is due to HInd is at a maximum Likewise, at high pH the indicator is completely in the Ind- form and the absorbance which is due to Ind- is at a maximum . At intermediate pH, the solution contains appreciable concentrations of both HInd and Ind-, and exhibits an absorbance spectrum containing contributions form both forms. As pH changes, the relative concentrations of each form will change in accordance with the Ka of the indicator and the resulting absorbance will also change.

Physikalisch-chemisches Praktikum I UV-Vis – 2013
Page 1 of 10
UV/VIS Spectroscopy
1. Summary
An obvious difference between many compounds is their colour. For example, quinone is yellow; chlorophyll is green; the 2,4-dinitrophenylhydrazone derivatives of aldehydes and ketones range in colour from bright yellow to deep red, depending on double bond conjugation; and aspirin is colourless. All these colours are caused by absorption of light in the visible region of the electromagnetic spectrum (~400 – 800 nm) under excitation of an electron from the ground state into a higher orbital. In this experiment you will become familiar with the handling of a commercial spectrometer and use absorption spectra to determine the pKa value of an indicator.
2. Introduction
2.1. Absorption of Radiation
Electronic orbitals of atoms and molecules have characteristic energies, giving rise to a set of discrete energy levels. An electron is able to change from an occupied orbital to another orbital, gaining or losing energy only in amounts exactly corresponding to the difference between two levels:
The promotion of an electron from the ground state (lowest possible energy) at energy E1 to energy E2 is possible if the molecule absorbs electromagnetic radiation of the corresponding wavelength
λ=c h / (E2 - E1) (c = speed of light, h = Planck constant). The electron at a higher energy is then said to be excited and to be in an excited state. Excited states usually exist only for very short periods of time (femtoseconds to microseconds), because the higher energy state is unstable and the extra energy is lost through relaxation processes such as emission of light. The typical energy difference between the ground and the first excited levels of many molecules corresponds to electromagnetic waves of the ultra-violet (UV) and visible regions of the electromagnetic spectrum.

Physikalisch-chemisches Praktikum I UV-Vis – 2013
Page 2 of 10
2.2. The Electromagnetic Spectrum
The UV-visible range is only a small part of the total electromagnetic spectrum, and is generally defined from wavelengths of 190 nm at the high energy UV end to about 750 nm at the low energy red end of the spectrum. Light of other regions of the spectrum gives rise to different types of transitions and hence different types of spectroscopy. For example, IR radiation is usually not energetic enough to cause electronic transitions but can excite vibrations of molecules.
Wavelength λλλλ is the distance between adjacent peaks (or troughs) in the travelling electromagnetic wave, and may be designated in meters, centimetres or nanometres (10
-9 meters). Visible
wavelengths cover a range from approximately 400 to 750 nm.
Frequency νννν is the number of wave cycles that travel past a fixed point per unit of time, and is usually given in cycles per second, or Hertz (Hz). Frequency and wavelength are related via
νλ /c= (1)
where c is the speed of light.
When polychromatic or “white” light passes through or is reflected by a coloured substance, a characteristic portion of the spectrum is absorbed. The remaining light will then exhibit the complementary colour to the wavelength(s) absorbed. Thus, absorption of blue light between 420-430 nm renders a substance yellow, and absorption of green, 500-520 nm light makes it red. Green is unique in that it can be created by absorption close to 400 nm as well as absorption near 800 nm.
2.3. Absorbance and Electronic Transitions
When light travels through a thin slice ∆x of absorbing sample, its intensity diminishes by an amount proportional to the initial intensity I0 and the thickness of the slice:
xIII ∆−= 001 α (2)
This can be rewritten in the form:
001 I
x
IIα−=
∆
− or I
dx
dIα−= (3)

Physikalisch-chemisches Praktikum I UV-Vis – 2013
Page 3 of 10
which is a differential equation with the solution
]exp[)( 0 xIxI α−= (4)
By convention, this Lambert-Beer law is usually written in decadic form:
xaIxI
−= 10)( 0 (5)
with the proportionality constant a=α/ln(10). The higher the concentration c of molecules in the sample, the larger is a, so we obtain for the light intensity after a sample of thickness d:
dcIdI
ε−= 10)( 0 (6)
The wavelength dependent quantity ε(λ) is called molar extinction coefficient. It is a measure of the probability that an electronic transition takes place when a molecule interacts with light of
wavelength λ. The sample thickness is usually given in cm, the concentration in mol/l.
Consequently, the unit of ε is
cmMcml
mol 1][ ==ε (7)
UV-visible spectrometers usually measure absorbance, which is the log-ratio of transmitted (sample in beam) over incident (no sample in beam) intensities:
dcI
IA )(log)(
0
10 λελ =−= (8)
When more than one species is present in the sample, the absorbance is the sum of the different contributions:
dccA ])()([)( 2211 K++= λελελ (9)
An absorption spectrum A(λ) shows us the wavelength at which a molecule can absorb light and thus provides information about electronic state energies. Consequently, absorption spectroscopy carried out in UV-visible spectral region is sometimes called "electronic spectroscopy".
In addition, from the magnitude of A(λ) we can obtain information on sample composition and the probability of an electronic transition to take place. Depending on the nature of the ground and excited state orbitals this probability can be very different.

Physikalisch-chemisches Praktikum I UV-Vis – 2013
Page 4 of 10
A rigorous discussion of transition probabilities is beyond the scope of this lab course, but one obvious factor is the overlap of the orbitals involved in the electronic excitation. This is nicely
illustrated by the two transitions of an isolated carbonyl group. The n → π* transition is lower in
energy (λmax=290 nm) than the π → π* transition (λmax=180 nm), but the transition probability of the former is a thousand times smaller than that of the latter. The spatial distribution of these orbitals suggests why this is so. As illustrated in the following diagram, the n-orbitals do not overlap at all
well with the π* orbital, so the probability of this excitation is small. The π → π* transition, on the other hand, involves orbitals that have significant overlap, and the transition probability is very large.
Transitions between electronic states are often divided into the following categories:
a. n → σ
* transitions
Saturated compounds with substituents containing lone-pairs such as water, ammonia,
hydrogen disulphide may only display σ-σ*
and n-σ*
transitions.
b. π → π* transitions
For molecules that possess π bonds like alkenes, alkynes, aromatics, acryl compounds or
nitriles, light can promote electrons from a π bonding molecular orbital to a π anti-bonding
molecular orbital. This is called a π → π* transition and is usually strong (high extinction
coefficient). The energy difference for such a transition depends on the π bonded atoms. π
bonds between two carbon atoms give rise to a different π → π* transition than π bonds
between a carbon and an oxygen atom (a carbonyl) or a π bond between a carbon atom and a
nitrogen atom (in a nitrile). Groups of atoms involved in π bonding are often called "chromophores".
c. n → π* transitions
Even lone pairs that exist on oxygen and nitrogen atoms may be promoted from their non-
bonding molecular orbital to a π anti-bonding molecular orbital within a molecule. This is
called an n → π* transition and requires less energy (longer wavelength) compared to a π →
π* transition within the same chromophore. However, the transition probability is usually
much lower.

Physikalisch-chemisches Praktikum I UV-Vis – 2013
Page 5 of 10
d. d-d transitions Many transition metal ion solutions are coloured as a result of their partially filled d-levels, which allows promotion of an electron to an excited state (change of d-level occupation) by the absorption of relatively low energy visible light. The bands are often broad and strongly influenced by the chemical environment. They are also usually very weak.
e. Charge transfer transitions
Much stronger absorption is found when complexing the metal ion with some suitable organic chelating agent to produce a charge-transfer complex. Electrons may be transferred from the metal to the ligand or vice versa. The high transition probability is exploited to quantitatively detect ions in solution. There are numerous chelating agents available which may or may not complex selectively where there is more than one type of metal ion present. 1,10-phenanthroline is a common chelate for the analysis of Fe(II).
2.4. Instrumental components of optical spectrometers
Double Beam Spectrophotometers A diagram of the components of a typical dual beam spectrometer is shown in the diagram below. A beam of light from a visible and/or UV light source (colored red) is separated into its component wavelengths by a prism or diffraction grating. Each monochromatic (single wavelength or narrow bandwidth) beam in turn is split into two equal intensity beams by a half-mirror or beam splitter. One beam, the sample beam (coloured magenta), passes through a small transparent container (cuvette) containing a solution of the compound being studied. The other beam, the reference (coloured blue), passes through an identical cuvette containing only the solvent. The intensities of these light beams are then measured by photo detectors and compared. The intensity of the reference beam, which should have suffered little or no light absorption but the same reflection losses as the sample beam, is defined as I0. The intensity of the sample beam is defined as I. Within a short period of time, the spectrometer can automatically scan across the chosen wavelength range.

Physikalisch-chemisches Praktikum I UV-Vis – 2013
Page 6 of 10
During a wavelength scan, intensity changes and fluctuations are equally sensed by the two detectors and normalized out by the division of I by I0 (equation 8). However, even if both cuvettes contain the same solution, these two intensities may not be exactly the same, for example because of different detector efficiencies or spatial beam drifts. This leads to a small background spectrum, which can even be negative in some frequency ranges. Like with a single beam spectrometer (no reference beam) it is thus important to first record the background spectrum with only solvent in the sample cell. This spectrum must then be subtracted from the one recorded with the sample solution.
Light Sources Radiation sources need to be continuous over the range of wavelengths of interest. The earliest sources were simply tungsten filament bulbs (light-bulbs!) but these have since been replaced by tungsten-halogen. Such light sources cover the wavelength range from 300-900 nm. To reach further into the UV an additional source is needed. This is usually a deuterium arc lamp, which has a continuous spectrum below 400 nm. Monochromator A monochromator ("single colour") is used to select the wavelength at which an absorption measurement is to be made. In fact, it is not practically possible to obtain one wavelength, but rather a narrow range of wavelengths, which defines the spectral resolution of the spectrometer. There are two main choices for a monochromator: a prism, or a diffraction grating. The former was the original component, but now most modern instruments employ gratings:
Physikalisch-chemisches Praktikum I UV-Vis – 2013
Page 7 of 10
It is easier to achieve high spectral resolution with gratings, but they have the disadvantage of having more than one order of diffraction. This means that if the monochromator is set to 600 nm for example, then it will also pass 300 nm (second order) radiation. This problem is easily overcome by the use of filters to remove the unwanted radiation. A typical monochromator design is shown below. It consists of the diffraction grating (dispersing element), slits, and spherical mirrors. Scanning is accomplished by rotating the
grating. As the grating is slowly rotated, light of different wavelengths will emerge from the exit slit and pass through the sample to the detector. Thus the spectrum is obtained sequentially as the grating is rotated to select the wavelength and the detector observes the transmitted radiation intensity. The spectral resolution of the spectrometer can be varied by changing the size of the slits. Detectors The following detectors are commonly used in UV/Vis spectroscopy:
1. Photomultipliers: A PMT consists of a photocathode and a series of dynodes in an evacuated glass enclosure. Light that strikes the photo cathode causes the ejection of electrons due to the photoelectric effect. The electrons are accelerated towards a series of additional electrodes called dynodes. These electrodes are each maintained at a more positive potential. Additional electrons are generated at each dynode. This cascading effect creates 10
5 to 10
7 electrons for each photon hitting the first cathode depending on
the number of dynodes and the accelerating voltage. This amplified signal is finally collected at the anode where it can be measured.
2. Semiconductor Photodiodes: When a photon strikes a semiconductor, it can promote an electron from the valence band (filled orbitals) to the conduction band (unfilled orbitals) creating an electron(-) - hole(+) pair. The concentration of these electron-hole pairs is dependent on the amount of light striking the semiconductor, making the semiconductor suitable as an optical detector. Photovoltaic detectors contain a p-n junction that causes the electron-hole pairs to separate to produce a voltage that can be measured. Photodiode detectors are not as sensitive as PMTs but they are small, cheap and robust.
3. Charge-coupled devices (CCD): A CCD is an integrated-circuit chip that contains an array of capacitors that store charge when light creates electron-hole pairs. The charge accumulates and is read in a fixed time interval. CCDs are used in similar applications to other array detectors such as PDA although the CCD is much more sensitive for measurement of low light levels.

Physikalisch-chemisches Praktikum I UV-Vis – 2013
Page 8 of 10
Data acquisition The earliest instruments simply directly connected the amplified detector signal to a chart recorder. Today, all experimental settings are controlled by a computer and the detector signals are digitized, processed and stored. Nevertheless it is important that you note parameters which you set via the instrument software (slit width, scan range, scan speed, single beam/dual beam…) into your laboratory journal, along with the name of the file containing the data (and its path). Otherwise it can become very difficult to find or reproduce a measurement after other users have changed these settings!
2.5. Quantitative work
A frequent analytic application of UV-vis spectroscopy is the precise determination of concentration. You should already be familiar with this method from your first year lab course. There, you have determined the Manganese concentration in steel by measuring the absorbance (at a single wavelength) of a solution of permanganate ions that you produced from your steel sample. In addition, you recorded the absorbance of a series of permanganate solutions of known concentration. This allowed you to make a calibration graph of absorbance vs. concentration and fit
a straight line with slope of ε d (molar extinction coefficient times the path length).
The unknown concentration of sample could then be simply read of from the graph or calculated using the value of e determined from the slope. Note that the calibration points and therefore also the straight line usually have errors, which must be taken into account to calculate the final error of the concentration.
2.6. Indicators PH-Indicators are molecules whose colour depends on their protonation state, i.e. they have different colours in different pH-regions. Although the structural changes accompanying protonation and deprotonation may be quite complex, we may simply denote the deprotonated indicator by Ind and the protonated form by HInd and write down the simple equilibrium equation
+− +↔+ OHIndOHHInd 32
This equation has an equilibrium constant[ ][ ]
[ ]HInd
OHIndKa
+−
= 3 , so that we get:

Physikalisch-chemisches Praktikum I UV-Vis – 2013
Page 9 of 10
[ ][ ]HInd
IndLogpHpKa
−
−= 10
It is therefore possible to determine the pKa of the indicator by measuring the concentration ratio
[ ][ ]HInd
Ind−
at different pH values. This concentration ratio can be determined from the UV-vis spectra.
3. Experimental Tasks A. Make yourself familiar with the Spectrometers and make sure that you understand all parameters. Record spectra with only solvent in the cuvette and then repeat the measurement. Load the data you have obtained into a data analysis program (Exel, SciDavies, Origin) and plot the spectra. How big is the difference between two consecutive scans and thus the instrumental error in your data? B. Measure the absorption spectrum of a pH indicator (Bromothymol blue or other) in some buffer solution at different pH, in order to determine its pKa
a. Preparation :
1. Prepare a solution of 50mL of Bromothymol blue at 5.10-4
M in distilled water. The molar mass of Bromothymol blue is 624.38g.mol
-1. Prepare this solution carefully, as
you will use it to make all your other solutions. Note: The assistant may decide to give you a different indicator and will provide the necessary information! From this solution you will make all your other solution. If you take a small volume of this solution and dilute it in a bigger volume (typically >5 times) of any buffer solution, then you can assume that the pH you get is that of the buffer solution.
b. Acquisition of the absorption spectra :
1. Record absorption spectra of Bromothymol blue for pH ≥ 9 and pH ≤ 5 at 5 different concentrations (between c= 10
-4 and c= 2.10
-6). You may also be given a different
indicator and pH range by the Assistant. 2. Record absorption spectra of the indicator for three different pH ( ≥ 9, ≤ 5 and at a
well-defined pH near 7), always at the same concentration.
4. Data Evaluation
3. Plot the optical density at the maximum of the absorption bands as a function of concentration at basic and acidic pH. Calculate the molar extinction coefficient at the
absorption maximum ε(λmax) for the two forms of the indicator, using linear
regression. Provide error limits for ε(λmax). 4. Plot the three spectra recorded at different pH in a single graph, find the wavelength
of the isosbestic point and calculate the pKa. Use your errors for the extinction coefficients to calculate errors for concentrations and pKa. Also consider the uncertainty in pH.

Physikalisch-chemisches Praktikum I UV-Vis – 2013
Page 10 of 10
Hint: Estimate the concentration of HInd and Ind
- at the different pH values of the measurements,
knowing that the pKa of Bromothymol blue is around 7. Use this estimate to simplify the calculation of the extinction coefficient. (Of course: [HInd] + [Ind
-] =const)
Consider a generic indicator (HInd). At low pH the indicator is completely in the HInd form and the absorbance which is due to HInd is at a maximum Likewise, at high pH the indicator is completely in the Ind- form and the absorbance which is due to Ind- is at a maximum . At intermediate pH, the solution contains appreciable concentrations of both HInd and Ind-, and exhibits an absorbance spectrum containing contributions form both forms. As pH changes, the relative concentrations of each form will change in accordance with the Ka of the indicator and the resulting absorbance will also change.
Physikalisch-chemisches Praktikum I UV-Vis – 2013
Page 1 of 10
UV/VIS Spectroscopy
1. Summary
An obvious difference between many compounds is their colour. For example, quinone is yellow; chlorophyll is green; the 2,4-dinitrophenylhydrazone derivatives of aldehydes and ketones range in colour from bright yellow to deep red, depending on double bond conjugation; and aspirin is colourless. All these colours are caused by absorption of light in the visible region of the electromagnetic spectrum (~400 – 800 nm) under excitation of an electron from the ground state into a higher orbital. In this experiment you will become familiar with the handling of a commercial spectrometer and use absorption spectra to determine the pKa value of an indicator.
2. Introduction
2.1. Absorption of Radiation
Electronic orbitals of atoms and molecules have characteristic energies, giving rise to a set of discrete energy levels. An electron is able to change from an occupied orbital to another orbital, gaining or losing energy only in amounts exactly corresponding to the difference between two levels:
The promotion of an electron from the ground state (lowest possible energy) at energy E1 to energy E2 is possible if the molecule absorbs electromagnetic radiation of the corresponding wavelength
λ=c h / (E2 - E1) (c = speed of light, h = Planck constant). The electron at a higher energy is then said to be excited and to be in an excited state. Excited states usually exist only for very short periods of time (femtoseconds to microseconds), because the higher energy state is unstable and the extra energy is lost through relaxation processes such as emission of light. The typical energy difference between the ground and the first excited levels of many molecules corresponds to electromagnetic waves of the ultra-violet (UV) and visible regions of the electromagnetic spectrum.

Physikalisch-chemisches Praktikum I UV-Vis – 2013
Page 2 of 10
2.2. The Electromagnetic Spectrum
The UV-visible range is only a small part of the total electromagnetic spectrum, and is generally defined from wavelengths of 190 nm at the high energy UV end to about 750 nm at the low energy red end of the spectrum. Light of other regions of the spectrum gives rise to different types of transitions and hence different types of spectroscopy. For example, IR radiation is usually not energetic enough to cause electronic transitions but can excite vibrations of molecules.
Wavelength λλλλ is the distance between adjacent peaks (or troughs) in the travelling electromagnetic wave, and may be designated in meters, centimetres or nanometres (10
-9 meters). Visible
wavelengths cover a range from approximately 400 to 750 nm.
Frequency νννν is the number of wave cycles that travel past a fixed point per unit of time, and is usually given in cycles per second, or Hertz (Hz). Frequency and wavelength are related via
νλ /c= (1)
where c is the speed of light.
When polychromatic or “white” light passes through or is reflected by a coloured substance, a characteristic portion of the spectrum is absorbed. The remaining light will then exhibit the complementary colour to the wavelength(s) absorbed. Thus, absorption of blue light between 420-430 nm renders a substance yellow, and absorption of green, 500-520 nm light makes it red. Green is unique in that it can be created by absorption close to 400 nm as well as absorption near 800 nm.
2.3. Absorbance and Electronic Transitions
When light travels through a thin slice ∆x of absorbing sample, its intensity diminishes by an amount proportional to the initial intensity I0 and the thickness of the slice:
xIII ∆−= 001 α (2)
This can be rewritten in the form:
001 I
x
IIα−=
∆
− or I
dx
dIα−= (3)

Physikalisch-chemisches Praktikum I UV-Vis – 2013
Page 3 of 10
which is a differential equation with the solution
]exp[)( 0 xIxI α−= (4)
By convention, this Lambert-Beer law is usually written in decadic form:
xaIxI
−= 10)( 0 (5)
with the proportionality constant a=α/ln(10). The higher the concentration c of molecules in the sample, the larger is a, so we obtain for the light intensity after a sample of thickness d:
dcIdI
ε−= 10)( 0 (6)
The wavelength dependent quantity ε(λ) is called molar extinction coefficient. It is a measure of the probability that an electronic transition takes place when a molecule interacts with light of
wavelength λ. The sample thickness is usually given in cm, the concentration in mol/l.
Consequently, the unit of ε is
cmMcml
mol 1][ ==ε (7)
UV-visible spectrometers usually measure absorbance, which is the log-ratio of transmitted (sample in beam) over incident (no sample in beam) intensities:
dcI
IA )(log)(
0
10 λελ =−= (8)
When more than one species is present in the sample, the absorbance is the sum of the different contributions:
dccA ])()([)( 2211 K++= λελελ (9)
An absorption spectrum A(λ) shows us the wavelength at which a molecule can absorb light and thus provides information about electronic state energies. Consequently, absorption spectroscopy carried out in UV-visible spectral region is sometimes called "electronic spectroscopy".
In addition, from the magnitude of A(λ) we can obtain information on sample composition and the probability of an electronic transition to take place. Depending on the nature of the ground and excited state orbitals this probability can be very different.

Physikalisch-chemisches Praktikum I UV-Vis – 2013
Page 4 of 10
A rigorous discussion of transition probabilities is beyond the scope of this lab course, but one obvious factor is the overlap of the orbitals involved in the electronic excitation. This is nicely
illustrated by the two transitions of an isolated carbonyl group. The n → π* transition is lower in
energy (λmax=290 nm) than the π → π* transition (λmax=180 nm), but the transition probability of the former is a thousand times smaller than that of the latter. The spatial distribution of these orbitals suggests why this is so. As illustrated in the following diagram, the n-orbitals do not overlap at all
well with the π* orbital, so the probability of this excitation is small. The π → π* transition, on the other hand, involves orbitals that have significant overlap, and the transition probability is very large.
Transitions between electronic states are often divided into the following categories:
a. n → σ
* transitions
Saturated compounds with substituents containing lone-pairs such as water, ammonia,
hydrogen disulphide may only display σ-σ*
and n-σ*
transitions.
b. π → π* transitions
For molecules that possess π bonds like alkenes, alkynes, aromatics, acryl compounds or
nitriles, light can promote electrons from a π bonding molecular orbital to a π anti-bonding
molecular orbital. This is called a π → π* transition and is usually strong (high extinction
coefficient). The energy difference for such a transition depends on the π bonded atoms. π
bonds between two carbon atoms give rise to a different π → π* transition than π bonds
between a carbon and an oxygen atom (a carbonyl) or a π bond between a carbon atom and a
nitrogen atom (in a nitrile). Groups of atoms involved in π bonding are often called "chromophores".
c. n → π* transitions
Even lone pairs that exist on oxygen and nitrogen atoms may be promoted from their non-
bonding molecular orbital to a π anti-bonding molecular orbital within a molecule. This is
called an n → π* transition and requires less energy (longer wavelength) compared to a π →
π* transition within the same chromophore. However, the transition probability is usually
much lower.

Physikalisch-chemisches Praktikum I UV-Vis – 2013
Page 5 of 10
d. d-d transitions Many transition metal ion solutions are coloured as a result of their partially filled d-levels, which allows promotion of an electron to an excited state (change of d-level occupation) by the absorption of relatively low energy visible light. The bands are often broad and strongly influenced by the chemical environment. They are also usually very weak.
e. Charge transfer transitions
Much stronger absorption is found when complexing the metal ion with some suitable organic chelating agent to produce a charge-transfer complex. Electrons may be transferred from the metal to the ligand or vice versa. The high transition probability is exploited to quantitatively detect ions in solution. There are numerous chelating agents available which may or may not complex selectively where there is more than one type of metal ion present. 1,10-phenanthroline is a common chelate for the analysis of Fe(II).
2.4. Instrumental components of optical spectrometers
Double Beam Spectrophotometers A diagram of the components of a typical dual beam spectrometer is shown in the diagram below. A beam of light from a visible and/or UV light source (colored red) is separated into its component wavelengths by a prism or diffraction grating. Each monochromatic (single wavelength or narrow bandwidth) beam in turn is split into two equal intensity beams by a half-mirror or beam splitter. One beam, the sample beam (coloured magenta), passes through a small transparent container (cuvette) containing a solution of the compound being studied. The other beam, the reference (coloured blue), passes through an identical cuvette containing only the solvent. The intensities of these light beams are then measured by photo detectors and compared. The intensity of the reference beam, which should have suffered little or no light absorption but the same reflection losses as the sample beam, is defined as I0. The intensity of the sample beam is defined as I. Within a short period of time, the spectrometer can automatically scan across the chosen wavelength range.

Physikalisch-chemisches Praktikum I UV-Vis – 2013
Page 6 of 10
During a wavelength scan, intensity changes and fluctuations are equally sensed by the two detectors and normalized out by the division of I by I0 (equation 8). However, even if both cuvettes contain the same solution, these two intensities may not be exactly the same, for example because of different detector efficiencies or spatial beam drifts. This leads to a small background spectrum, which can even be negative in some frequency ranges. Like with a single beam spectrometer (no reference beam) it is thus important to first record the background spectrum with only solvent in the sample cell. This spectrum must then be subtracted from the one recorded with the sample solution.
Light Sources Radiation sources need to be continuous over the range of wavelengths of interest. The earliest sources were simply tungsten filament bulbs (light-bulbs!) but these have since been replaced by tungsten-halogen. Such light sources cover the wavelength range from 300-900 nm. To reach further into the UV an additional source is needed. This is usually a deuterium arc lamp, which has a continuous spectrum below 400 nm. Monochromator A monochromator ("single colour") is used to select the wavelength at which an absorption measurement is to be made. In fact, it is not practically possible to obtain one wavelength, but rather a narrow range of wavelengths, which defines the spectral resolution of the spectrometer. There are two main choices for a monochromator: a prism, or a diffraction grating. The former was the original component, but now most modern instruments employ gratings:

Physikalisch-chemisches Praktikum I UV-Vis – 2013
Page 7 of 10
It is easier to achieve high spectral resolution with gratings, but they have the disadvantage of having more than one order of diffraction. This means that if the monochromator is set to 600 nm for example, then it will also pass 300 nm (second order) radiation. This problem is easily overcome by the use of filters to remove the unwanted radiation. A typical monochromator design is shown below. It consists of the diffraction grating (dispersing element), slits, and spherical mirrors. Scanning is accomplished by rotating the
grating. As the grating is slowly rotated, light of different wavelengths will emerge from the exit slit and pass through the sample to the detector. Thus the spectrum is obtained sequentially as the grating is rotated to select the wavelength and the detector observes the transmitted radiation intensity. The spectral resolution of the spectrometer can be varied by changing the size of the slits. Detectors The following detectors are commonly used in UV/Vis spectroscopy:
1. Photomultipliers: A PMT consists of a photocathode and a series of dynodes in an evacuated glass enclosure. Light that strikes the photo cathode causes the ejection of electrons due to the photoelectric effect. The electrons are accelerated towards a series of additional electrodes called dynodes. These electrodes are each maintained at a more positive potential. Additional electrons are generated at each dynode. This cascading effect creates 10
5 to 10
7 electrons for each photon hitting the first cathode depending on
the number of dynodes and the accelerating voltage. This amplified signal is finally collected at the anode where it can be measured.
2. Semiconductor Photodiodes: When a photon strikes a semiconductor, it can promote an electron from the valence band (filled orbitals) to the conduction band (unfilled orbitals) creating an electron(-) - hole(+) pair. The concentration of these electron-hole pairs is dependent on the amount of light striking the semiconductor, making the semiconductor suitable as an optical detector. Photovoltaic detectors contain a p-n junction that causes the electron-hole pairs to separate to produce a voltage that can be measured. Photodiode detectors are not as sensitive as PMTs but they are small, cheap and robust.
3. Charge-coupled devices (CCD): A CCD is an integrated-circuit chip that contains an array of capacitors that store charge when light creates electron-hole pairs. The charge accumulates and is read in a fixed time interval. CCDs are used in similar applications to other array detectors such as PDA although the CCD is much more sensitive for measurement of low light levels.

Physikalisch-chemisches Praktikum I UV-Vis – 2013
Page 8 of 10
Data acquisition The earliest instruments simply directly connected the amplified detector signal to a chart recorder. Today, all experimental settings are controlled by a computer and the detector signals are digitized, processed and stored. Nevertheless it is important that you note parameters which you set via the instrument software (slit width, scan range, scan speed, single beam/dual beam…) into your laboratory journal, along with the name of the file containing the data (and its path). Otherwise it can become very difficult to find or reproduce a measurement after other users have changed these settings!
2.5. Quantitative work
A frequent analytic application of UV-vis spectroscopy is the precise determination of concentration. You should already be familiar with this method from your first year lab course. There, you have determined the Manganese concentration in steel by measuring the absorbance (at a single wavelength) of a solution of permanganate ions that you produced from your steel sample. In addition, you recorded the absorbance of a series of permanganate solutions of known concentration. This allowed you to make a calibration graph of absorbance vs. concentration and fit
a straight line with slope of ε d (molar extinction coefficient times the path length).
The unknown concentration of sample could then be simply read of from the graph or calculated using the value of e determined from the slope. Note that the calibration points and therefore also the straight line usually have errors, which must be taken into account to calculate the final error of the concentration.
2.6. Indicators PH-Indicators are molecules whose colour depends on their protonation state, i.e. they have different colours in different pH-regions. Although the structural changes accompanying protonation and deprotonation may be quite complex, we may simply denote the deprotonated indicator by Ind and the protonated form by HInd and write down the simple equilibrium equation
+− +↔+ OHIndOHHInd 32
This equation has an equilibrium constant[ ][ ]
[ ]HInd
OHIndKa
+−
= 3 , so that we get:

Physikalisch-chemisches Praktikum I UV-Vis – 2013
Page 9 of 10
[ ][ ]HInd
IndLogpHpKa
−
−= 10
It is therefore possible to determine the pKa of the indicator by measuring the concentration ratio
[ ][ ]HInd
Ind−
at different pH values. This concentration ratio can be determined from the UV-vis spectra.
3. Experimental Tasks A. Make yourself familiar with the Spectrometers and make sure that you understand all parameters. Record spectra with only solvent in the cuvette and then repeat the measurement. Load the data you have obtained into a data analysis program (Exel, SciDavies, Origin) and plot the spectra. How big is the difference between two consecutive scans and thus the instrumental error in your data? B. Measure the absorption spectrum of a pH indicator (Bromothymol blue or other) in some buffer solution at different pH, in order to determine its pKa
a. Preparation :
1. Prepare a solution of 50mL of Bromothymol blue at 5.10-4
M in distilled water. The molar mass of Bromothymol blue is 624.38g.mol
-1. Prepare this solution carefully, as
you will use it to make all your other solutions. Note: The assistant may decide to give you a different indicator and will provide the necessary information! From this solution you will make all your other solution. If you take a small volume of this solution and dilute it in a bigger volume (typically >5 times) of any buffer solution, then you can assume that the pH you get is that of the buffer solution.
b. Acquisition of the absorption spectra :
1. Record absorption spectra of Bromothymol blue for pH ≥ 9 and pH ≤ 5 at 5 different concentrations (between c= 10
-4 and c= 2.10
-6). You may also be given a different
indicator and pH range by the Assistant. 2. Record absorption spectra of the indicator for three different pH ( ≥ 9, ≤ 5 and at a
well-defined pH near 7), always at the same concentration.
4. Data Evaluation
3. Plot the optical density at the maximum of the absorption bands as a function of concentration at basic and acidic pH. Calculate the molar extinction coefficient at the
absorption maximum ε(λmax) for the two forms of the indicator, using linear
regression. Provide error limits for ε(λmax). 4. Plot the three spectra recorded at different pH in a single graph, find the wavelength
of the isosbestic point and calculate the pKa. Use your errors for the extinction coefficients to calculate errors for concentrations and pKa. Also consider the uncertainty in pH.

Physikalisch-chemisches Praktikum I UV-Vis – 2013
Page 10 of 10
Hint: Estimate the concentration of HInd and Ind
- at the different pH values of the measurements,
knowing that the pKa of Bromothymol blue is around 7. Use this estimate to simplify the calculation of the extinction coefficient. (Of course: [HInd] + [Ind
-] =const)
Consider a generic indicator (HInd). At low pH the indicator is completely in the HInd form and the absorbance which is due to HInd is at a maximum Likewise, at high pH the indicator is completely in the Ind- form and the absorbance which is due to Ind- is at a maximum . At intermediate pH, the solution contains appreciable concentrations of both HInd and Ind-, and exhibits an absorbance spectrum containing contributions form both forms. As pH changes, the relative concentrations of each form will change in accordance with the Ka of the indicator and the resulting absorbance will also change.

Physikalisch-chemisches Praktikum I UV-Vis – 2013
Page 1 of 10
UV/VIS Spectroscopy
1. Summary
An obvious difference between many compounds is their colour. For example, quinone is yellow; chlorophyll is green; the 2,4-dinitrophenylhydrazone derivatives of aldehydes and ketones range in colour from bright yellow to deep red, depending on double bond conjugation; and aspirin is colourless. All these colours are caused by absorption of light in the visible region of the electromagnetic spectrum (~400 – 800 nm) under excitation of an electron from the ground state into a higher orbital. In this experiment you will become familiar with the handling of a commercial spectrometer and use absorption spectra to determine the pKa value of an indicator.
2. Introduction
2.1. Absorption of Radiation
Electronic orbitals of atoms and molecules have characteristic energies, giving rise to a set of discrete energy levels. An electron is able to change from an occupied orbital to another orbital, gaining or losing energy only in amounts exactly corresponding to the difference between two levels:
The promotion of an electron from the ground state (lowest possible energy) at energy E1 to energy E2 is possible if the molecule absorbs electromagnetic radiation of the corresponding wavelength
λ=c h / (E2 - E1) (c = speed of light, h = Planck constant). The electron at a higher energy is then said to be excited and to be in an excited state. Excited states usually exist only for very short periods of time (femtoseconds to microseconds), because the higher energy state is unstable and the extra energy is lost through relaxation processes such as emission of light. The typical energy difference between the ground and the first excited levels of many molecules corresponds to electromagnetic waves of the ultra-violet (UV) and visible regions of the electromagnetic spectrum.
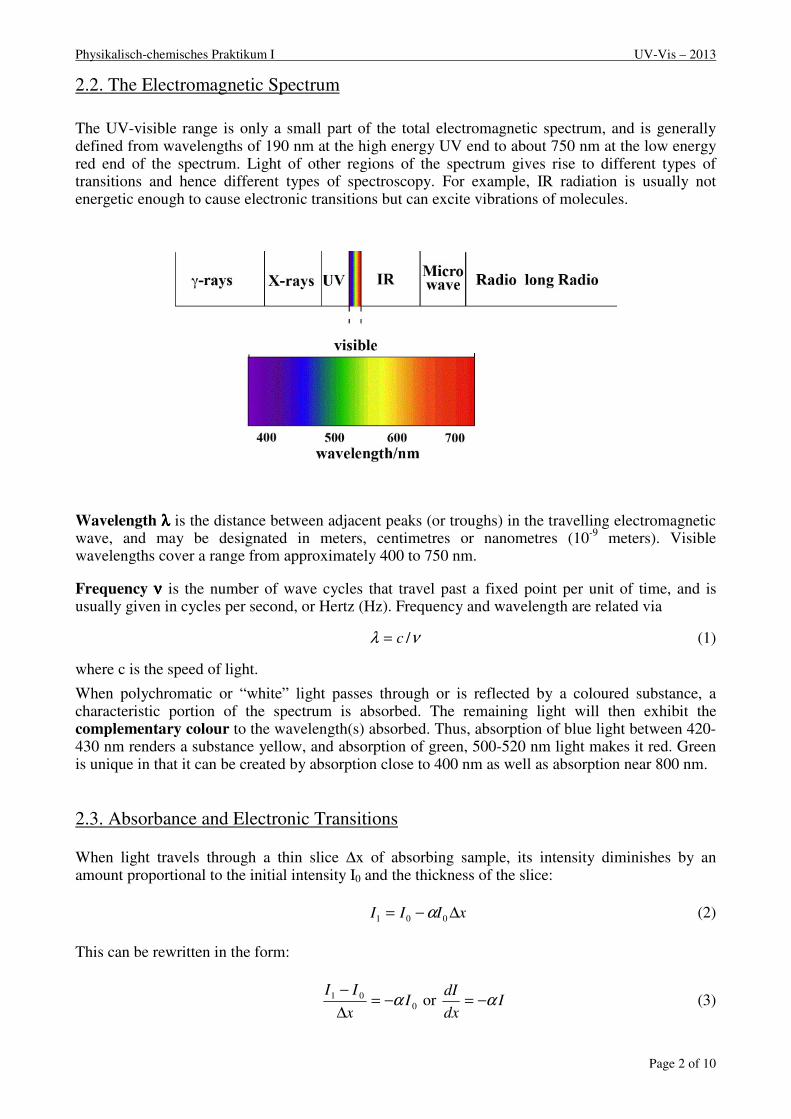
Physikalisch-chemisches Praktikum I UV-Vis – 2013
Page 2 of 10
2.2. The Electromagnetic Spectrum
The UV-visible range is only a small part of the total electromagnetic spectrum, and is generally defined from wavelengths of 190 nm at the high energy UV end to about 750 nm at the low energy red end of the spectrum. Light of other regions of the spectrum gives rise to different types of transitions and hence different types of spectroscopy. For example, IR radiation is usually not energetic enough to cause electronic transitions but can excite vibrations of molecules.
Wavelength λλλλ is the distance between adjacent peaks (or troughs) in the travelling electromagnetic wave, and may be designated in meters, centimetres or nanometres (10
-9 meters). Visible
wavelengths cover a range from approximately 400 to 750 nm.
Frequency νννν is the number of wave cycles that travel past a fixed point per unit of time, and is usually given in cycles per second, or Hertz (Hz). Frequency and wavelength are related via
νλ /c= (1)
where c is the speed of light.
When polychromatic or “white” light passes through or is reflected by a coloured substance, a characteristic portion of the spectrum is absorbed. The remaining light will then exhibit the complementary colour to the wavelength(s) absorbed. Thus, absorption of blue light between 420-430 nm renders a substance yellow, and absorption of green, 500-520 nm light makes it red. Green is unique in that it can be created by absorption close to 400 nm as well as absorption near 800 nm.
2.3. Absorbance and Electronic Transitions
When light travels through a thin slice ∆x of absorbing sample, its intensity diminishes by an amount proportional to the initial intensity I0 and the thickness of the slice:
xIII ∆−= 001 α (2)
This can be rewritten in the form:
001 I
x
IIα−=
∆
− or I
dx
dIα−= (3)

Physikalisch-chemisches Praktikum I UV-Vis – 2013
Page 3 of 10
which is a differential equation with the solution
]exp[)( 0 xIxI α−= (4)
By convention, this Lambert-Beer law is usually written in decadic form:
xaIxI
−= 10)( 0 (5)
with the proportionality constant a=α/ln(10). The higher the concentration c of molecules in the sample, the larger is a, so we obtain for the light intensity after a sample of thickness d:
dcIdI
ε−= 10)( 0 (6)
The wavelength dependent quantity ε(λ) is called molar extinction coefficient. It is a measure of the probability that an electronic transition takes place when a molecule interacts with light of
wavelength λ. The sample thickness is usually given in cm, the concentration in mol/l.
Consequently, the unit of ε is
cmMcml
mol 1][ ==ε (7)
UV-visible spectrometers usually measure absorbance, which is the log-ratio of transmitted (sample in beam) over incident (no sample in beam) intensities:
dcI
IA )(log)(
0
10 λελ =−= (8)
When more than one species is present in the sample, the absorbance is the sum of the different contributions:
dccA ])()([)( 2211 K++= λελελ (9)
An absorption spectrum A(λ) shows us the wavelength at which a molecule can absorb light and thus provides information about electronic state energies. Consequently, absorption spectroscopy carried out in UV-visible spectral region is sometimes called "electronic spectroscopy".
In addition, from the magnitude of A(λ) we can obtain information on sample composition and the probability of an electronic transition to take place. Depending on the nature of the ground and excited state orbitals this probability can be very different.

Physikalisch-chemisches Praktikum I UV-Vis – 2013
Page 4 of 10
A rigorous discussion of transition probabilities is beyond the scope of this lab course, but one obvious factor is the overlap of the orbitals involved in the electronic excitation. This is nicely
illustrated by the two transitions of an isolated carbonyl group. The n → π* transition is lower in
energy (λmax=290 nm) than the π → π* transition (λmax=180 nm), but the transition probability of the former is a thousand times smaller than that of the latter. The spatial distribution of these orbitals suggests why this is so. As illustrated in the following diagram, the n-orbitals do not overlap at all
well with the π* orbital, so the probability of this excitation is small. The π → π* transition, on the other hand, involves orbitals that have significant overlap, and the transition probability is very large.
Transitions between electronic states are often divided into the following categories:
a. n → σ
* transitions
Saturated compounds with substituents containing lone-pairs such as water, ammonia,
hydrogen disulphide may only display σ-σ*
and n-σ*
transitions.
b. π → π* transitions
For molecules that possess π bonds like alkenes, alkynes, aromatics, acryl compounds or
nitriles, light can promote electrons from a π bonding molecular orbital to a π anti-bonding
molecular orbital. This is called a π → π* transition and is usually strong (high extinction
coefficient). The energy difference for such a transition depends on the π bonded atoms. π
bonds between two carbon atoms give rise to a different π → π* transition than π bonds
between a carbon and an oxygen atom (a carbonyl) or a π bond between a carbon atom and a
nitrogen atom (in a nitrile). Groups of atoms involved in π bonding are often called "chromophores".
c. n → π* transitions
Even lone pairs that exist on oxygen and nitrogen atoms may be promoted from their non-
bonding molecular orbital to a π anti-bonding molecular orbital within a molecule. This is
called an n → π* transition and requires less energy (longer wavelength) compared to a π →
π* transition within the same chromophore. However, the transition probability is usually
much lower.

Physikalisch-chemisches Praktikum I UV-Vis – 2013
Page 5 of 10
d. d-d transitions Many transition metal ion solutions are coloured as a result of their partially filled d-levels, which allows promotion of an electron to an excited state (change of d-level occupation) by the absorption of relatively low energy visible light. The bands are often broad and strongly influenced by the chemical environment. They are also usually very weak.
e. Charge transfer transitions
Much stronger absorption is found when complexing the metal ion with some suitable organic chelating agent to produce a charge-transfer complex. Electrons may be transferred from the metal to the ligand or vice versa. The high transition probability is exploited to quantitatively detect ions in solution. There are numerous chelating agents available which may or may not complex selectively where there is more than one type of metal ion present. 1,10-phenanthroline is a common chelate for the analysis of Fe(II).
2.4. Instrumental components of optical spectrometers
Double Beam Spectrophotometers A diagram of the components of a typical dual beam spectrometer is shown in the diagram below. A beam of light from a visible and/or UV light source (colored red) is separated into its component wavelengths by a prism or diffraction grating. Each monochromatic (single wavelength or narrow bandwidth) beam in turn is split into two equal intensity beams by a half-mirror or beam splitter. One beam, the sample beam (coloured magenta), passes through a small transparent container (cuvette) containing a solution of the compound being studied. The other beam, the reference (coloured blue), passes through an identical cuvette containing only the solvent. The intensities of these light beams are then measured by photo detectors and compared. The intensity of the reference beam, which should have suffered little or no light absorption but the same reflection losses as the sample beam, is defined as I0. The intensity of the sample beam is defined as I. Within a short period of time, the spectrometer can automatically scan across the chosen wavelength range.
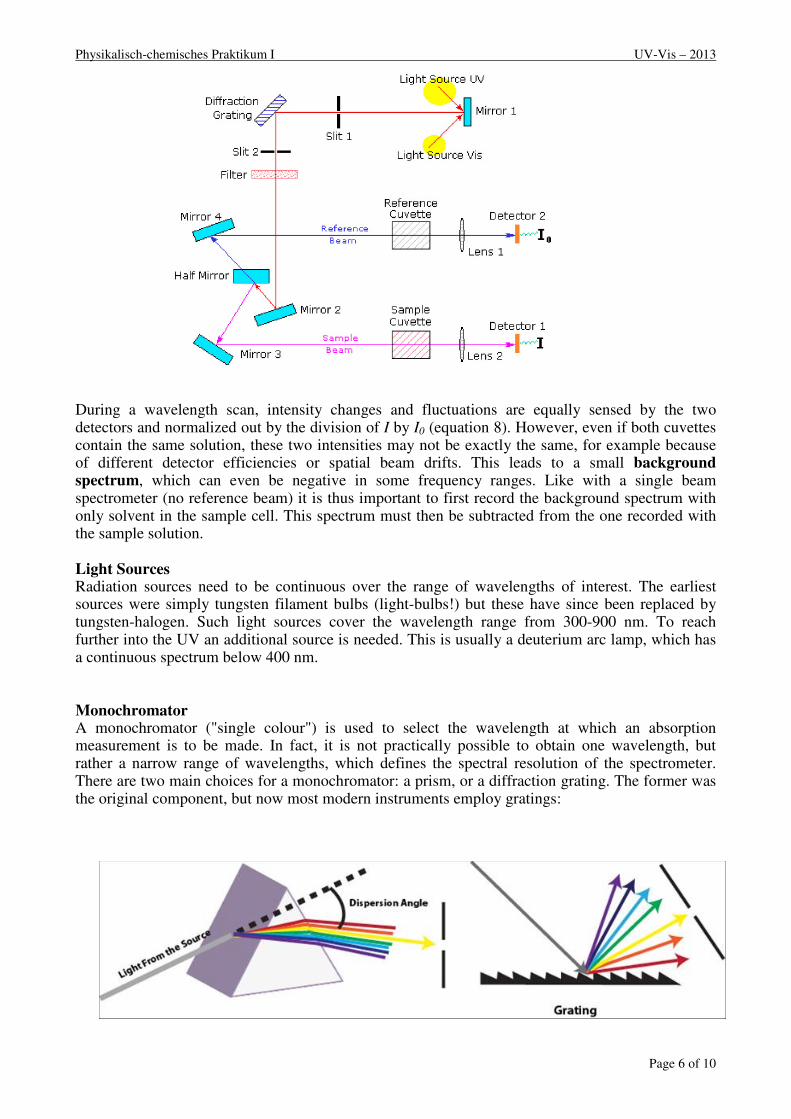
Physikalisch-chemisches Praktikum I UV-Vis – 2013
Page 6 of 10
During a wavelength scan, intensity changes and fluctuations are equally sensed by the two detectors and normalized out by the division of I by I0 (equation 8). However, even if both cuvettes contain the same solution, these two intensities may not be exactly the same, for example because of different detector efficiencies or spatial beam drifts. This leads to a small background spectrum, which can even be negative in some frequency ranges. Like with a single beam spectrometer (no reference beam) it is thus important to first record the background spectrum with only solvent in the sample cell. This spectrum must then be subtracted from the one recorded with the sample solution.
Light Sources Radiation sources need to be continuous over the range of wavelengths of interest. The earliest sources were simply tungsten filament bulbs (light-bulbs!) but these have since been replaced by tungsten-halogen. Such light sources cover the wavelength range from 300-900 nm. To reach further into the UV an additional source is needed. This is usually a deuterium arc lamp, which has a continuous spectrum below 400 nm. Monochromator A monochromator ("single colour") is used to select the wavelength at which an absorption measurement is to be made. In fact, it is not practically possible to obtain one wavelength, but rather a narrow range of wavelengths, which defines the spectral resolution of the spectrometer. There are two main choices for a monochromator: a prism, or a diffraction grating. The former was the original component, but now most modern instruments employ gratings:

Physikalisch-chemisches Praktikum I UV-Vis – 2013
Page 7 of 10
It is easier to achieve high spectral resolution with gratings, but they have the disadvantage of having more than one order of diffraction. This means that if the monochromator is set to 600 nm for example, then it will also pass 300 nm (second order) radiation. This problem is easily overcome by the use of filters to remove the unwanted radiation. A typical monochromator design is shown below. It consists of the diffraction grating (dispersing element), slits, and spherical mirrors. Scanning is accomplished by rotating the
grating. As the grating is slowly rotated, light of different wavelengths will emerge from the exit slit and pass through the sample to the detector. Thus the spectrum is obtained sequentially as the grating is rotated to select the wavelength and the detector observes the transmitted radiation intensity. The spectral resolution of the spectrometer can be varied by changing the size of the slits. Detectors The following detectors are commonly used in UV/Vis spectroscopy:
1. Photomultipliers: A PMT consists of a photocathode and a series of dynodes in an evacuated glass enclosure. Light that strikes the photo cathode causes the ejection of electrons due to the photoelectric effect. The electrons are accelerated towards a series of additional electrodes called dynodes. These electrodes are each maintained at a more positive potential. Additional electrons are generated at each dynode. This cascading effect creates 10
5 to 10
7 electrons for each photon hitting the first cathode depending on
the number of dynodes and the accelerating voltage. This amplified signal is finally collected at the anode where it can be measured.
2. Semiconductor Photodiodes: When a photon strikes a semiconductor, it can promote an electron from the valence band (filled orbitals) to the conduction band (unfilled orbitals) creating an electron(-) - hole(+) pair. The concentration of these electron-hole pairs is dependent on the amount of light striking the semiconductor, making the semiconductor suitable as an optical detector. Photovoltaic detectors contain a p-n junction that causes the electron-hole pairs to separate to produce a voltage that can be measured. Photodiode detectors are not as sensitive as PMTs but they are small, cheap and robust.
3. Charge-coupled devices (CCD): A CCD is an integrated-circuit chip that contains an array of capacitors that store charge when light creates electron-hole pairs. The charge accumulates and is read in a fixed time interval. CCDs are used in similar applications to other array detectors such as PDA although the CCD is much more sensitive for measurement of low light levels.

Physikalisch-chemisches Praktikum I UV-Vis – 2013
Page 8 of 10
Data acquisition The earliest instruments simply directly connected the amplified detector signal to a chart recorder. Today, all experimental settings are controlled by a computer and the detector signals are digitized, processed and stored. Nevertheless it is important that you note parameters which you set via the instrument software (slit width, scan range, scan speed, single beam/dual beam…) into your laboratory journal, along with the name of the file containing the data (and its path). Otherwise it can become very difficult to find or reproduce a measurement after other users have changed these settings!
2.5. Quantitative work
A frequent analytic application of UV-vis spectroscopy is the precise determination of concentration. You should already be familiar with this method from your first year lab course. There, you have determined the Manganese concentration in steel by measuring the absorbance (at a single wavelength) of a solution of permanganate ions that you produced from your steel sample. In addition, you recorded the absorbance of a series of permanganate solutions of known concentration. This allowed you to make a calibration graph of absorbance vs. concentration and fit
a straight line with slope of ε d (molar extinction coefficient times the path length).
The unknown concentration of sample could then be simply read of from the graph or calculated using the value of e determined from the slope. Note that the calibration points and therefore also the straight line usually have errors, which must be taken into account to calculate the final error of the concentration.
2.6. Indicators PH-Indicators are molecules whose colour depends on their protonation state, i.e. they have different colours in different pH-regions. Although the structural changes accompanying protonation and deprotonation may be quite complex, we may simply denote the deprotonated indicator by Ind and the protonated form by HInd and write down the simple equilibrium equation
+− +↔+ OHIndOHHInd 32
This equation has an equilibrium constant[ ][ ]
[ ]HInd
OHIndKa
+−
= 3 , so that we get:

Physikalisch-chemisches Praktikum I UV-Vis – 2013
Page 9 of 10
[ ][ ]HInd
IndLogpHpKa
−
−= 10
It is therefore possible to determine the pKa of the indicator by measuring the concentration ratio
[ ][ ]HInd
Ind−
at different pH values. This concentration ratio can be determined from the UV-vis spectra.
3. Experimental Tasks A. Make yourself familiar with the Spectrometers and make sure that you understand all parameters. Record spectra with only solvent in the cuvette and then repeat the measurement. Load the data you have obtained into a data analysis program (Exel, SciDavies, Origin) and plot the spectra. How big is the difference between two consecutive scans and thus the instrumental error in your data? B. Measure the absorption spectrum of a pH indicator (Bromothymol blue or other) in some buffer solution at different pH, in order to determine its pKa
a. Preparation :
1. Prepare a solution of 50mL of Bromothymol blue at 5.10-4
M in distilled water. The molar mass of Bromothymol blue is 624.38g.mol
-1. Prepare this solution carefully, as
you will use it to make all your other solutions. Note: The assistant may decide to give you a different indicator and will provide the necessary information! From this solution you will make all your other solution. If you take a small volume of this solution and dilute it in a bigger volume (typically >5 times) of any buffer solution, then you can assume that the pH you get is that of the buffer solution.
b. Acquisition of the absorption spectra :
1. Record absorption spectra of Bromothymol blue for pH ≥ 9 and pH ≤ 5 at 5 different concentrations (between c= 10
-4 and c= 2.10
-6). You may also be given a different
indicator and pH range by the Assistant. 2. Record absorption spectra of the indicator for three different pH ( ≥ 9, ≤ 5 and at a
well-defined pH near 7), always at the same concentration.
4. Data Evaluation
3. Plot the optical density at the maximum of the absorption bands as a function of concentration at basic and acidic pH. Calculate the molar extinction coefficient at the
absorption maximum ε(λmax) for the two forms of the indicator, using linear
regression. Provide error limits for ε(λmax). 4. Plot the three spectra recorded at different pH in a single graph, find the wavelength
of the isosbestic point and calculate the pKa. Use your errors for the extinction coefficients to calculate errors for concentrations and pKa. Also consider the uncertainty in pH.

Physikalisch-chemisches Praktikum I UV-Vis – 2013
Page 10 of 10
Hint: Estimate the concentration of HInd and Ind
- at the different pH values of the measurements,
knowing that the pKa of Bromothymol blue is around 7. Use this estimate to simplify the calculation of the extinction coefficient. (Of course: [HInd] + [Ind
-] =const)
Consider a generic indicator (HInd). At low pH the indicator is completely in the HInd form and the absorbance which is due to HInd is at a maximum Likewise, at high pH the indicator is completely in the Ind- form and the absorbance which is due to Ind- is at a maximum . At intermediate pH, the solution contains appreciable concentrations of both HInd and Ind-, and exhibits an absorbance spectrum containing contributions form both forms. As pH changes, the relative concentrations of each form will change in accordance with the Ka of the indicator and the resulting absorbance will also change.