UvA-DARE (Digital Academic Repository) The Rapid Burster and … · Bagnoli, T. (2015). The Rapid...
148
UvA-DARE is a service provided by the library of the University of Amsterdam (http://dare.uva.nl) UvA-DARE (Digital Academic Repository) The Rapid Burster and its X-ray bursts: extremes of accretion and thermonuclear burning Bagnoli, T. Link to publication Citation for published version (APA): Bagnoli, T. (2015). The Rapid Burster and its X-ray bursts: extremes of accretion and thermonuclear burning General rights It is not permitted to download or to forward/distribute the text or part of it without the consent of the author(s) and/or copyright holder(s), other than for strictly personal, individual use, unless the work is under an open content license (like Creative Commons). Disclaimer/Complaints regulations If you believe that digital publication of certain material infringes any of your rights or (privacy) interests, please let the Library know, stating your reasons. In case of a legitimate complaint, the Library will make the material inaccessible and/or remove it from the website. Please Ask the Library: http://uba.uva.nl/en/contact, or a letter to: Library of the University of Amsterdam, Secretariat, Singel 425, 1012 WP Amsterdam, The Netherlands. You will be contacted as soon as possible. Download date: 13 Feb 2019
Transcript of UvA-DARE (Digital Academic Repository) The Rapid Burster and … · Bagnoli, T. (2015). The Rapid...
UvA-DARE is a service provided by the library of the University of Amsterdam (http://dare.uva.nl)
UvA-DARE (Digital Academic Repository)
The Rapid Burster and its X-ray bursts: extremes of accretion and thermonuclear burningBagnoli, T.
Link to publication
Citation for published version (APA):Bagnoli, T. (2015). The Rapid Burster and its X-ray bursts: extremes of accretion and thermonuclear burning
General rightsIt is not permitted to download or to forward/distribute the text or part of it without the consent of the author(s) and/or copyright holder(s),other than for strictly personal, individual use, unless the work is under an open content license (like Creative Commons).
Disclaimer/Complaints regulationsIf you believe that digital publication of certain material infringes any of your rights or (privacy) interests, please let the Library know, statingyour reasons. In case of a legitimate complaint, the Library will make the material inaccessible and/or remove it from the website. Please Askthe Library: http://uba.uva.nl/en/contact, or a letter to: Library of the University of Amsterdam, Secretariat, Singel 425, 1012 WP Amsterdam,The Netherlands. You will be contacted as soon as possible.
Download date: 13 Feb 2019


Cover image: Luca Cioni


The Rapid Burster and its X-ray bursts:extremes of accretion
and thermonuclear burning
ACADEMISCH PROEFSCHRIFT
ter verkrijging van de graad van doctoraan de Universiteit van Amsterdamop gezag van de Rector Magnificus
prof. dr. D.C. van den Boomten overstaan van een door het College voor Promoties ingestelde
commissie, in het openbaar te verdedigen in de Agnietenkapelop vrijdag 4 december 2015, te 10:00 uur
door
Tullio Bagnoli
geboren te Rome, Italië

Promotiecommissie:
Promotor: Prof. dr. M.B.M. van der Klis Universiteit van AmsterdamCopromotor: Dr. J.J.M. in ’t Zand SRON Netherlands Space Research InstituteCopromotor: Dr. A.L. Watts Universiteit van Amsterdam
Overige leden: Prof. dr. L.B.F.M. Waters Universiteit van AmsterdamProf. dr. R.A.M.J. Wijers Universiteit van AmsterdamProf. dr. W. Hermsen Universiteit van AmsterdamProf. dr. F. Verbunt Radboud Universiteit NijmegenProf. dr. M. Mendez Rijksuniversiteit GroningenDr. R.A.D. Wijnands Universiteit van AmsterdamDr. A. Patruno Universiteit Leiden
Faculteit der Natuurwetenschappen, Wiskunde en Informatica
The research reported in this thesis was carried out at SRON, the Netherlands Institute for Space Re-search, Utrecht, The Netherlands, and at the Anton Pannekoek Institute for Astronomy, University ofAmsterdam, The Netherlands.

What you see from this silent rostrum up on my mountainon a night as splendidly clear as that [...]
is that universe into which error does not obtrude.You see the inconceivable: the colossal spectacle
of no antagonism. You see with your own eyesthe vast brain of time, a galaxy of fire
set by no human hand.The stars are indispensable.
Philip Roth, I married a communist


Contents
1 Introduction 11.1 Neutron stars: formation and composition . . . . . . . . . . . . . . . . . . . 11.2 X-ray binaries: mass transfer and accretion . . . . . . . . . . . . . . . . . . 31.3 Unstable thermonuclear burning: the type I X-ray bursts . . . . . . . . . . . 61.4 Unstable gravitational accretion: the Rapid Burster type II X-ray bursts . . . 81.5 This thesis and beyond . . . . . . . . . . . . . . . . . . . . . . . . . . . . . 10
2 Indications for a slow rotator in the Rapid Burster from its thermonuclear burst-ing behaviour 132.1 Introduction . . . . . . . . . . . . . . . . . . . . . . . . . . . . . . . . . . . 142.2 Observations . . . . . . . . . . . . . . . . . . . . . . . . . . . . . . . . . . 152.3 Analysis . . . . . . . . . . . . . . . . . . . . . . . . . . . . . . . . . . . . . 172.4 Results . . . . . . . . . . . . . . . . . . . . . . . . . . . . . . . . . . . . . . 222.5 Discussion and conclusions . . . . . . . . . . . . . . . . . . . . . . . . . . . 23
3 Double-peaked thermonuclear bursts at the soft–hard state transition in theRapid Burster 313.1 Introduction . . . . . . . . . . . . . . . . . . . . . . . . . . . . . . . . . . . 323.2 Observations . . . . . . . . . . . . . . . . . . . . . . . . . . . . . . . . . . 333.3 Results . . . . . . . . . . . . . . . . . . . . . . . . . . . . . . . . . . . . . . 343.4 Discussion . . . . . . . . . . . . . . . . . . . . . . . . . . . . . . . . . . . . 463.5 Conclusions . . . . . . . . . . . . . . . . . . . . . . . . . . . . . . . . . . . 54
4 A population study of type II bursts in the Rapid Burster 574.1 Introduction . . . . . . . . . . . . . . . . . . . . . . . . . . . . . . . . . . . 584.2 Observations . . . . . . . . . . . . . . . . . . . . . . . . . . . . . . . . . . 614.3 Methodology . . . . . . . . . . . . . . . . . . . . . . . . . . . . . . . . . . 654.4 Results . . . . . . . . . . . . . . . . . . . . . . . . . . . . . . . . . . . . . . 664.5 Observational summary . . . . . . . . . . . . . . . . . . . . . . . . . . . . . 804.6 Discussion . . . . . . . . . . . . . . . . . . . . . . . . . . . . . . . . . . . . 83
i

Contents
4.7 Models for Type II bursts . . . . . . . . . . . . . . . . . . . . . . . . . . . . 874.8 Conclusions . . . . . . . . . . . . . . . . . . . . . . . . . . . . . . . . . . . 954.A Burst search algorithm . . . . . . . . . . . . . . . . . . . . . . . . . . . . . 964.B Spectral analysis . . . . . . . . . . . . . . . . . . . . . . . . . . . . . . . . 97
5 Discovery of GRS 1915+105 variability patterns in the Rapid Burster 1035.1 Introduction . . . . . . . . . . . . . . . . . . . . . . . . . . . . . . . . . . . 1045.2 Observations . . . . . . . . . . . . . . . . . . . . . . . . . . . . . . . . . . 1055.3 Data analysis . . . . . . . . . . . . . . . . . . . . . . . . . . . . . . . . . . 1065.4 Discussion . . . . . . . . . . . . . . . . . . . . . . . . . . . . . . . . . . . . 109
Bibliography 113
Contribution from co-authors 121
Publications 123
Summary 125
Nederlandse Samenvatting 131
Acknowledgements 137
ii

1Introduction
1.1 Neutron stars: formation and composition
Neutron stars are fascinating objects. Their densities are the largest in the visible universe- only surpassed by those in (by definition, invisible) black holes. They include the fastestspinning stars and the strongest magnets in the universe. The idea that they might be apossible outcome of stellar evolution (Baade & Zwicky 1934) came about soon after thediscovery of the neutron particle (Chadwick 1932) and predates their actual observationaldiscovery by then PhD student Jocelyn Bell-Burnell by more than 30 years (Hewish et al.1968).
When a massive star, with an initial mass between 8 and 30 M⊙ (ranges are still debatedand vary depending on binarity, rotation and metallicity, see e.g., Woosley et al. 2002) ex-hausts the nuclear fuel that burns in its interiors, it can no longer sustain itself against its owngravity and its core violently collapses while the outer layers are ejected in a supernova event.This scenario is common to the formation of neutron stars and black holes alike. However,if the collapsing core is lighter than a critical mass (the Tolman-Oppenheimer-Volkoff limit,Oppenheimer & Volkoff 1939; Tolman 1939), degeneracy pressure arrests the collapse and astable neutron star is formed. Above this limit (the upper limit to the mass of a neutron staris still not accurately determined) nothing can stop gravity from shrinking the former stellarcore into a black hole. In an alternative formation scenario, a white dwarf - also a compact ob-ject supported by degenerate pressure - in a binary system surpasses the critical mass for thisdegenerate star (the Chandrasekhar limit, Chandrasekhar 1931) through accretion, yielding asupernova and a neutron star (Nomoto & Kondo 1991).
The resulting object has roughly a mass of 1.25 to 2 M⊙ (for a list of current mass mea-
1

1 Introduction
Figure 1.1: Schematic structure of a neutron star. Courtesy of Y. Cavecchi.
surements, see Watts et al. 2015, and references therein) within a 10 to 20 km radius. Thismeans that densities equal or exceeding the nuclear matter density of ρ0 ∼ 2× 10¹⁴ g cm−3
are reached. At present, the structure of matter under these conditions is impossible to calcu-late from quantum chromodynamics (QCD, the theory behind the strong nuclear force), andeven if it would be, the theory would stay untested since particle accelerators can reproducesuch densities only at much larger temperatures than those that are present in the interior ofa neutron star. Also, as the stellar core turns into the proto-neutron star, flux conservationmeans that the magnetic field strength increases by orders of magnitude, to 1013 − 1013.5 G.This ‘fossil field’ (Ferrario & Wickramasinghe 2006) can befurther amplified to ∼ 1015 G bya dynamo effect in the early, highly convective stages (Duncan & Thompson 1992; Thomp-son & Duncan 1993). Even as the neutron star ages for billions of years and its magnetic fielddecays (Viganò et al. 2013; Gourgouliatos & Cumming 2014), the field will play an importantrole in the emission of radiation, accretion and burning physics, as we explain below.
From the inside out, an isolated neutron star consists of a inner and outer core, an innerand outer crust, and an envelope, which is divided between an ocean and an atmosphere(see Fig. 1.1, from Page & Reddy 2006). The outer layers are thinner than the inner ones.The envelope is about a hundred meters thick, mostly composed of H and He and heavierelements the abundances of which depend on the age of the neutron star and the nature of itsprogenitor. The outer crust is a solid lattice of nuclei surrounded by degenerate, relativisticelectrons (Chamel & Haensel 2008). Here, pycnonuclear fusion (low-temperature fusion ofneighbouring nuclei in a lattice, Yakovlev et al. 2006) and electron-capture reactions takeplace, the latter producing isotopes increasingly richer in neutrons (Sato 1979; Haensel &
2

1.2 X-ray binaries: mass transfer and accretion
Zdunik 1990).At some point it becomes energetically favorable for some neutrons to be outside nu-
clei. This ‘neutron drip’ demarcates the boundary between the outer and inner crust, atρ ∼ 4.3 × 10¹¹ g cm−3. These free neutrons are at temperatures below their Fermi tem-perature (meaning their behaviour is effectively that of zero-temperature particles), whichmakes them degenerate (see Lattimer & Prakash 2004).
At about 1 km in depth, when ρ ∼ (0.5−1)ρ0, most nuclei have dissolved. This outer coreregion mostly consists of neutrons, and a small percentage of protons, electrons and muons- all being degenerate. This might well extend all the way to the centre of the neutron star,depending on its central density (and hence, on its mass and radius). For densities larger than2ρ0, a separate inner core region must be considered, the conditions of which are the leastwell understood. Exotic mixtures of strange and even free quark matter have been proposedas the ingredients making up the core of a neutron star (for a review, see Lattimer & Prakash2007).
Depending on the interior composition, different pressure-density-temperature relationsare predicted. Each of these equations of state maps directly to the mass-radius relationof a neutron star. The study of these compact objects therefore connects astrophysics withfundamental nuclear physics. Measurements of masses and radii are since long the ‘holygrail’ of neutron star research.
However, neutron stars are fascinating in many more aspects than the physics of densematter alone concerns. We are here interested in studying the accretion flows and nuclearreactions in strongly magnetized and curved space–time – in other words, the behaviour ofmatter when it happens to fall onto these compact objects and subsequently settle and burn.
1.2 X-ray binaries: mass transfer and accretion
Initially, the newly born neutron star is very hot. It will cool down, starting from initialsurface temperatures of ∼ 106 K, emitting a thermal spectrum that peaks in the very softX-rays. Despite the high temperature, the small emitting area of a neutron star means that theluminosity is low in this initial stage: indeed, only seven young thermally-emitting neutronstars are known (the ‘Magnificent Seven’, for a review, see Turolla 2009).
Due to angular momentum conservation in the collapsed core, the neutron star will beborn rotating fast: the youngest known neutron stars have periods of tens of Hz (e.g. the CrabPulsar, at a frequency of 29 Hz). They are also slowing down the fastest: it is often assumedthat the surface electric field strips charges off the surface and accelerates them in a beamcentred at the magnetic poles, carrying away energy and angular momentum. This modelcan therefore explain the radio emission as the synchrotron radiation from the acceleratedparticles. If the (dipolar) magnetic and spin axes are misaligned, a ‘stellar lighthouse’ is born:and if the beam crosses our line of sight, one observes pulsed radio emission and speaks of apulsar (Gold 1968).
3

1 Introduction
Figure 1.2: Artistic impression of the X-ray binary GRO J1665–40. The gas is seen streaming from thecompanion star, through the Roche lobe and into an accretion disc, where it loses angular momentumuntil reaching the central compact object. Jets can sometimes be launched (Credit: ESA, NASA andFelix Mirabel).
Continued cooling down and spin-down is the fate of isolated neutron stars. However,most massive stars are born in multiple systems (Sana et al. 2012), and if the binary survivesthe supernova explosion and the resulting kick, a neutron star will be born with a companionstar. In fact, 10% of all neutron stars are observed in a binary system (Liu et al. 2007).When this companion is a low mass star (≲ 1M⊙), its further, slower evolution can lead it tooverflow its Roche lobe, at which point stable mass transfer from the companion star ensues,an accretion disc forms and a low-mass X-ray binary is born (Bhattacharya & van den Heuvel1991, see Fig. 1.2).
The disc has to form because matter leaves the companion star with far larger angularmomentum than it can have at the neutron star surface, and cannot, therefore, directly accrete.As it slowly loses angular momentum and heats up via viscous processes in the disc (for areview, see Frank et al. 2002), the infalling gas loses gravitational energy, resulting in a
4
1.2 X-ray binaries: mass transfer and accretion
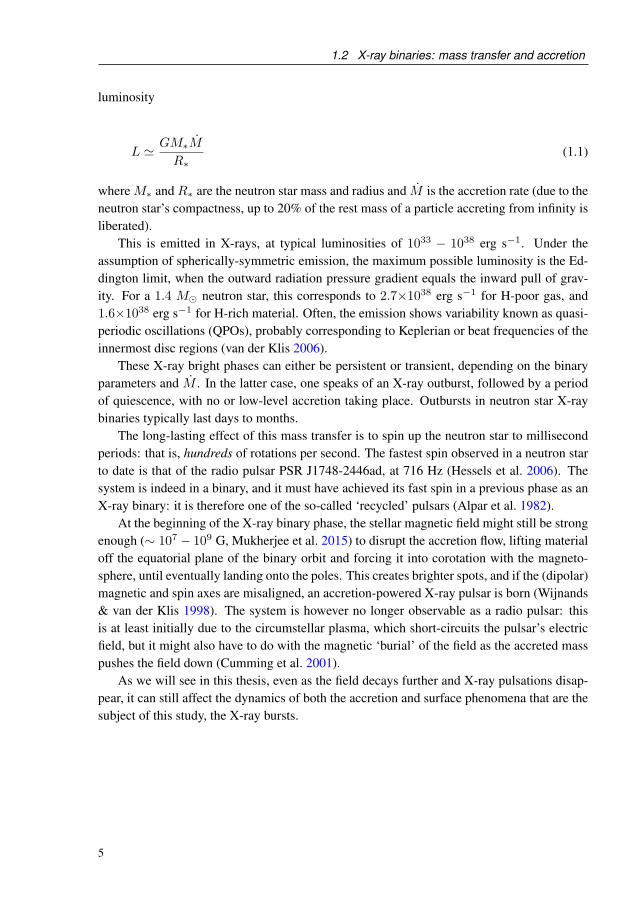
luminosity
L ≃ GM∗M
R∗(1.1)
where M∗ and R∗ are the neutron star mass and radius and M is the accretion rate (due to theneutron star’s compactness, up to 20% of the rest mass of a particle accreting from infinity isliberated).
This is emitted in X-rays, at typical luminosities of 1033 − 1038 erg s−1. Under theassumption of spherically-symmetric emission, the maximum possible luminosity is the Ed-dington limit, when the outward radiation pressure gradient equals the inward pull of grav-ity. For a 1.4 M⊙ neutron star, this corresponds to 2.7×1038 erg s−1 for H-poor gas, and1.6×1038 erg s−1 for H-rich material. Often, the emission shows variability known as quasi-periodic oscillations (QPOs), probably corresponding to Keplerian or beat frequencies of theinnermost disc regions (van der Klis 2006).
These X-ray bright phases can either be persistent or transient, depending on the binaryparameters and M . In the latter case, one speaks of an X-ray outburst, followed by a periodof quiescence, with no or low-level accretion taking place. Outbursts in neutron star X-raybinaries typically last days to months.
The long-lasting effect of this mass transfer is to spin up the neutron star to millisecondperiods: that is, hundreds of rotations per second. The fastest spin observed in a neutron starto date is that of the radio pulsar PSR J1748-2446ad, at 716 Hz (Hessels et al. 2006). Thesystem is indeed in a binary, and it must have achieved its fast spin in a previous phase as anX-ray binary: it is therefore one of the so-called ‘recycled’ pulsars (Alpar et al. 1982).
At the beginning of the X-ray binary phase, the stellar magnetic field might still be strongenough (∼ 107 − 109 G, Mukherjee et al. 2015) to disrupt the accretion flow, lifting materialoff the equatorial plane of the binary orbit and forcing it into corotation with the magneto-sphere, until eventually landing onto the poles. This creates brighter spots, and if the (dipolar)magnetic and spin axes are misaligned, an accretion-powered X-ray pulsar is born (Wijnands& van der Klis 1998). The system is however no longer observable as a radio pulsar: thisis at least initially due to the circumstellar plasma, which short-circuits the pulsar’s electricfield, but it might also have to do with the magnetic ‘burial’ of the field as the accreted masspushes the field down (Cumming et al. 2001).
As we will see in this thesis, even as the field decays further and X-ray pulsations disap-pear, it can still affect the dynamics of both the accretion and surface phenomena that are thesubject of this study, the X-ray bursts.
5
1 Introduction
1.3 Unstable thermonuclear burning: the type I X-ray bursts
The fresh H and He that accumulates on the surface of a neutron star in an X-ray binary willburn into heavier elements. This can happen under different regimes, depending on the rateat which matter is piling up.
At the largest mass-accretion rates per unit area (m ≳ 2×10⁶ g cm−2 s−1), H and Heburn continuously. The energy per nucleon liberated in this process is smaller by about twoorders of magnitude than the gravitational energy liberated by accretion, so that stable burningcontributes a small fraction to the total observed radiation (Bildsten 1998).
At lower mass-accretion rates, however, an instability develops due to a nuclear energygeneration rate that is more temperature sensitive than radiative cooling and is confined toa thin shell (Hansen & van Horn 1975). Material is burnt only after a critical layer of freshfuel has accumulated (typically just a few meters thick) which is then engulfed by a flamein a matter of a second, and this quick energy release allows burning to briefly outshine thepersistent emission that is due to accretion (Woosley & Taam 1976; Lamb & Lamb 1978).While temperatures in the burning layer reach a few billion K, the photosphere above itthermalizes the radiation and heats up to millions of K and then cools down. The resultingrise and decay in X-ray luminosity is known as a type I X-ray burst. Its spectrum is that of ablack body of rising and decreasing temperature, while durations vary from seconds to hours,depending on the type of nuclear fuel and the thickness of the ignited layer (for reviews, seeLewin et al. 1993; Bildsten 1998; Galloway et al. 2008).
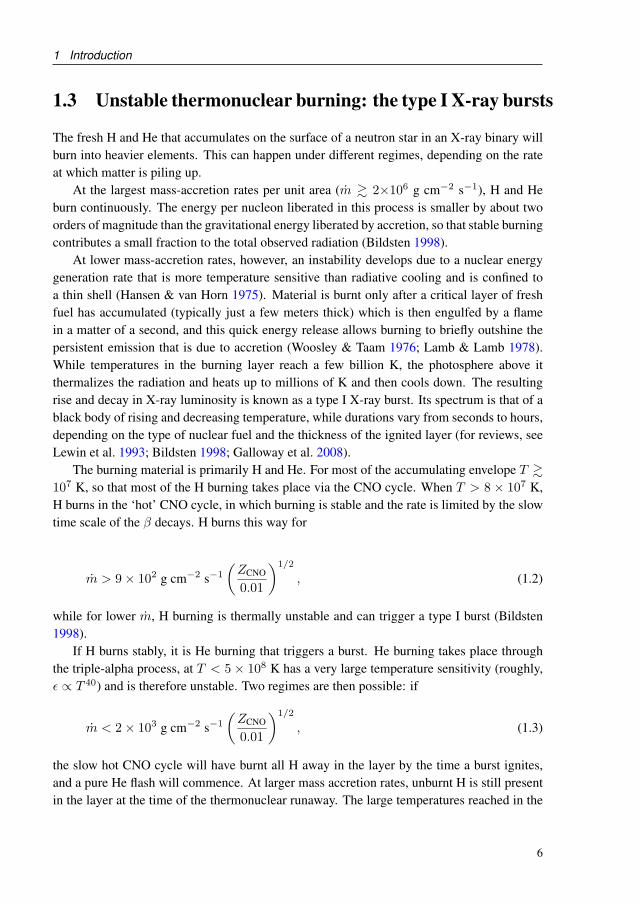
The burning material is primarily H and He. For most of the accumulating envelope T ≳107 K, so that most of the H burning takes place via the CNO cycle. When T > 8 × 10⁷ K,H burns in the ‘hot’ CNO cycle, in which burning is stable and the rate is limited by the slowtime scale of the β decays. H burns this way for
m > 9× 10² g cm−2 s−1
(ZCNO
0.01
)1/2
, (1.2)
while for lower m, H burning is thermally unstable and can trigger a type I burst (Bildsten1998).
If H burns stably, it is He burning that triggers a burst. He burning takes place throughthe triple-alpha process, at T < 5× 10⁸ K has a very large temperature sensitivity (roughly,ϵ ∝ T 40) and is therefore unstable. Two regimes are then possible: if
m < 2× 10³ g cm−2 s−1
(ZCNO
0.01
)1/2
, (1.3)
the slow hot CNO cycle will have burnt all H away in the layer by the time a burst ignites,and a pure He flash will commence. At larger mass accretion rates, unburnt H is still presentin the layer at the time of the thermonuclear runaway. The large temperatures reached in the
6

1.3 Unstable thermonuclear burning: the type I X-ray bursts
He flash allow ‘breakout’ reactions that take catalysts out of the CNO cycle, which then burnthe surrounding H through rapid proton (rp) captures (Wallace & Woosley 1981): a series ofsuccessive proton captures and β decays. These can produce very heavy elements, with massnumbers up to about 100 (Schatz et al. 2001).
Forty years after the first burst observed by the Astronomical Netherlands Satellite (Grind-lay et al. 1976), 105 bursting X-ray binaries are known in our galaxy1. Soon after the discov-ery, one-dimensional models of the bursting layer have successfully explained several burstproperties, including their energetics, durations, recurrence times at low mass-accretion rates(see below) (Fujimoto et al. 1981) and the lifting of the photosphere that takes place whenthe energy release is fast enough to surpass the local Eddington limit (Paczynski 1983). Theblack body spectrum of a type I burst, with its rising and decaying temperature that traces theheating and cooling of the stellar photosphere, also allows to confidently identify the compactobject in an X-ray binary as being a neutron star, as opposed to a surface-less black hole.
Having introduced the bursts, we can start to bring forward some of the problems thatare addressed in this thesis. Among the many questions that remain open, perhaps the mostpressing one is why the changes in burst behaviour as a function of the mass-accretion rate –the recurrence time of type I bursts and their eventual disappearance once burning becomesstable – look starkly different between models and observations. From a luminosity of aboutone tenth of the Eddington limit and higher, the burst rate decreases, despite the fact thatmatter accumulation should be taking place faster (Cornelisse et al. 2003). Stable burningusually sets in at slightly larger luminosities, while models predict this should only be thecase close to the Eddington limit (Heger et al. 2007; Keek et al. 2014).
Although most bursters are not accreting X-ray pulsars, one might wonder whether themagnetic field might still be able, if not to channel accretion, at least to affect the physicsof settling and flame spreading by creating surface inhomogeneities. This is an intrinsicallymultidimensional problem. Likewise, the millisecond periods to which bursters have usuallybeen spun-up can generate a strong Coriolis force, which has only recently been accountedfor in burst models (Spitkovsky et al. 2002; Cavecchi et al. 2013, 2015), but not yet in multi-dimensional simulations of the spreading and settling of the accreting mass during the timeleading up to a burst. Also, the differential rotation between the (faster) newly accretedmatter and the neutron star can generate instabilities resulting in turbulent motion, effectivelymixing the material to deeper, hotter layers and shortening the burst recurrence time (Piro &Bildsten 2007; Keek et al. 2009). These studies show that sources can differ in their type IX-ray burst behaviour because of different spin rates and magnetic field strengths, bridgingour understanding of thermonuclear burning with the observed type I X-ray burst zoo.
1An updated list is maintained at https://www.sron.nl/~jeanz/bursterlist.html
7

1 Introduction
Figure 1.3: Discovery of type I X-ray bursts from the Rapid Burster. The type I bursts are marked as‘special’, and occur independently of the relaxation-oscillator behaviour followed by the type II bursts.This figure is from Hoffman et al. (1978).
1.4 Unstable gravitational accretion: the Rapid Burster typeII X-ray bursts
Almost as soon as type I bursts were discovered, it became clear that the X-ray bursts fromthe source MXB 1730−335 (Lewin et al. 1976, see Fig. 1.3) are of a different nature. Theseconds-long recurrence times were clearly too short for a sufficient amount of nuclear fuelto have been accreted to trigger a thermonuclear runaway, and earned the source the nameby which it is most often referred to: the Rapid Burster. The bursts can only be poweredby gravitational energy in the inner accretion disc during sudden accretion events (as firstpointed out by Hoffman et al. 1978). To avoid confusion, they were therefore called type IIbursts.
For 20 years the Rapid Burster was the only source of these ‘unstable-accretion’ events.The second source, GRO J1744–28, first went into outburst in 1995 (Kouveliotou et al. 1996).This source is an accretion-powered X-ray pulsar (unlike the Rapid Burster) and it was hencenicknamed the Bursting Pulsar. Its strong magnetic field channels accretion onto a small areaaround the poles, making the local mass-accretion rate per unit area large enough to stabilizeburning (Bildsten & Brown 1997), so that no type I bursts appear. This means that the RapidBurster is the only source emitting both type I and type II bursts.
Much attention was initially devoted to the Rapid Burster. The source is in the core
8

1.4 Unstable gravitational accretion: the Rapid Burster type II X-ray bursts
Figure 1.4: False-color image of Liller 1 obtained by combining GEMINI observations in the near-IR Jand KS bands. The field of view is 95′′ × 95′′ This figure is from (Saracino et al. 2015).
of the Galactic globular cluster Liller 1 (see Fig. 1.4), which is heavily absorbed due to itsproximity to the Galactic centre (the distance is 8.1±1.0 kpc) and has the second-largest rateof encounters in the Galaxy (Verbunt & Hut 1987; Saracino et al. 2015). It soon becameclear that, at luminosities above about 10% of the Eddington luminosity, the type II burstsdisappear and the Rapid Burster behaves like any other source of type I bursts (Kunieda et al.1984). Below said threshold, instead, different ‘modes’ of type II burst emission appear(Guerriero et al. 1999). Generally, the first ones are the hundreds of seconds long, flat-toppedmode 0 type II bursts. Their recurrence times are also the longest. The mode 1 burst patternfollows, with sequences of frequent short bursts ending with a longer and brighter one thatis similar in appearance to the shortest mode 0 bursts. Finally, the mode 2 pattern appears,consisting of short bursts like the short ones in mode 1 (but not interrupted by larger burstsfollowed by longer recurrence times).
All type II bursts roughly follow a relaxation oscillator relation, meaning that the fluence
9

1 Introduction
in a burst determines the waiting time to the next burst (Lewin et al. 1976). This is not ob-served in the BP (Kouveliotou et al. 1996). The relaxation-oscillator behaviour seems to pointto the presence of a mass storage from which matter can be released and then replenished ata constant rate, so that the amount of depleted material determines the time to refill the buffer(Lewin et al. 1993). The accretion disc is the most obvious candidate for this buffer and allproposed models involve one (e.g., Walker 1992; Spruit & Taam 1993).
Despite the large amount of dedicated observations no universally accepted model forthe type II bursts exists. Interest in the Rapid Burster eventually waned – a single Chandraobservation took place in the 2000s, and no XMM-Newton observation ever – while in thelast 20 years increasingly sophisticated models have become available. These show thatthe magnetic field can act as a gate on the accretion flow, resulting in burst-like, instead ofcontinuous, accretion.
The idea behind these models is an old one: a sufficiently strong dipolar field can forcethe plasma in the accretion disc into corotation with the magnetosphere. At this radius the Ke-plerian disc is effectively truncated. Depending on whether the new angular velocity (equalto the stellar spin) is larger or smaller than the Keplerian frequency at that radius, accretionor ejection (the so-called ‘propeller’ regime; Illarionov & Sunyaev 1975) will be the result.What the more recent results have shown is that, rather than a simple accretion/ejection di-chotomy, disc states are possible – chiefly depending on the mass-accretion rate, stellar spinrate and dipolar field strength – in which matter cyclically piles up to a critical pressure afterwhich it is suddenly released (Spruit & Taam 1993; Kulkarni & Romanova 2008; D’Angelo& Spruit 2010).
1.5 This thesis and beyond
The first two chapters of this thesis are dedicated to the study of type I bursts. In chapter 2we investigate the general type I burst behaviour of the Rapid Burster by analysing the en-tire sample of type I bursts observed with the Rossi X-ray Timing Explorer during the bright(type II burst-less) portions of its outbursts. The purpose was to study how the type I burstproperties vary with the mass accretion rate. Surprisingly, we find that the type I burst be-haviour of the Rapid Burster is almost unique: as the mass-accretion rate grows above 10%of the Eddington limit, the Rapid Burster shows neither an increasing type I burst recurrencetime nor the early transition to stable burning that is common to all (103) other bursters butone, IGR J17480–2446. We thus establish a unique similarity with this recently discoveredsource. It suggests that, like IGR J17480–2446, the Rapid Burster could be a slowly-rotating,relatively young low-mass X-ray binary. The larger magnetic field of a young, hardly recy-cled neutron star (as IGR J17091–3624 most likely is) could channel accretion towards themagnetic poles where matter would land with a smaller tangential velocity, whereas in oldersources (with weaker magnetic fields) landing would take place on the equator, and producethe maximum amount of shear. This shear could then provoke hydrodynamical instabilities
10

1.5 This thesis and beyond
causing turbulent motions in the accreted layer of the fast rotators, where type I bursts wouldthen ignite earlier (Piro & Bildsten 2007). Perhaps then, as we argue in chapter 2, the largermagnetic fields of the younger Rapid Burster and IGR J17091–3624 allow them to escapethis quenching mechanism and to show type I bursts at larger luminosities.
In chapter 3 we show that the last type I bursts to appear in an outburst before the typeII bursts begin sometimes present an unusual shape. While the majority of type I bursts havea ∼ 10 s rise, a peak and a ∼100 s-long decay, six of them show a strong dip during thedecay. The total duration of the burst is the same. Analysing the dip, we have found thatit is due to enhanced absorption of photons, temporarily obscuring the neutron star surface.The second rise and peak are therefore due to the slow reappearance of the underlying burstprofile. No such dips are observed in the persistent emission around other type I or II bursts(see chapter 4 for a discussion on alleged ‘dips’ around mode 0 type II bursts) in the RapidBurster or in any other bursting source observed with sufficient sensitivity.
The absorbing material must come from the accretion flow, and it can be no coincidencethat this interference only happens when the Rapid Burster is about to start emitting type IIbursts. The changing geometry of the accretion flow (from the configuration it is in when itemits no type II bursts, to when it does) must therefore somehow be related to the double-peak phenomenology. As we discuss in chapter 3, it however remains difficult to explain theduration of the dips, which is in the tens of seconds: the type I bursts are already becomingfainter while the surface is obscured, and the accretion flow should restore itself on muchquicker dynamical time scales.
We then move back to observations, for a comprehensive study of the Rapid Burster’s typeII bursts. In chapter 4 we analyze the entire sample of over 7600 type II bursts observed byRossi X-ray Timing Explorer, which comprises the most extensive catalogue of type II burstsand perform a statistical study of their properties. We confirm already-known trends, anddiscover new ones, such as: the type II bursts are Eddington-limited (unlike in the BurstingPulsar), their durations span four orders of magnitude, from tenths to thousands of seconds,and while short type II bursts leave the underlying persistent emission unaffected, all the longones trigger long periods of enhanced persistent luminosity. We compare the properties ofour sample with those predicted by the most recent available models, and show that thosebased on the gating role of the magnetosphere can reproduce key properties of the type IIbursts, while at the same time account for the uniqueness of the Rapid Burster by requiring afine tuning between the stellar spin, the magnetic field strength, the mass accretion rate andthe alignment between the magnetic field and the spin axis.
Finally, in chapter 5 we report large accretion instabilities serendipitously discoveredin the Rapid Burster and show that, while fundamentally different from the type II bursts,they are obviously similar to those seen in the black-hole X-ray binaries GRS 1915+105and IGR J17091–3624, establishing another important connection between the Rapid Bursterand other peculiar compact accretors. What GRS 1915+105 and the Bursting Pulsar havein common is a long orbital period, which has also been proposed for IGR J17480–2446,and which in the Rapid Burster would be compatible with the large peak brightness of its
11

1 Introduction
outbursts, another characteristic common to all four sources. We note, however, that a largeorbit would be disfavoured in the core of a highly collisional cluster such as Liller 1, whichhas the second-largest rate of encounters in the Galaxy (Verbunt & Hut 1987; Saracino et al.2015).
It is hard imagine to attribute to a single property the various observational peculiaritiesof the Rapid Burster with respect to the larger neutron star zoo - the persistence of type Ibursts at high luminosities, also seen in IGR J17480–2446, the type II bursts, which it shareswith the Bursting Pulsar, and the GRS 1915+105-like variability. We believe that the mostpressing observational issues are determining the strength of the stellar magnetic field in theRapid Burster and the type of its companion star. For the former, a recent study of reflectioncomponents in the spectrum of the Bursting Pulsar (Degenaar et al. 2014) offers a promisingavenue to constrain the stellar magnetic field, even in the absence of pulsations. For the latter,deeper-field imaging made possible by the next generation of optical and infrared telescopeslike JWST might finally be able to penetrate the highly absorbing environment hosting thissource. Also, theoretical simulations must fully address the asymmetric impact of effectivegravity, Coriolis force, magnetic confinement and local mass accretion rate in a consistent,multidimensional manner.
12

2Indications for a slow rotator in the
Rapid Burster from its thermonuclearbursting behaviour
T. Bagnoli, J.J.M. in ’t Zand, D.K. Galloway and A.L. Watts
Published in Monthly Notices of the Royal Astronomical Society, Volume 431, Issue 3,p.1947-1955 (2013)
Abstract
We perform time-resolved spectroscopy of all the type I bursts from the Rapid Burster (MXB1730−335) detected with the Rossi X-ray Timing Explorer. Type I bursts are detected athigh accretion rates, up to ≃ 45% of the Eddington luminosity. We find evidence that burstslacking the canonical cooling in their time-resolved spectra are, none the less, thermonuclearin nature. The type I bursting rate keeps increasing with the persistent luminosity, well abovethe threshold at which it is known to abruptly drop in other bursting low-mass X-ray binaries.The only other known source in which the bursting rate keeps increasing over such a largerange of mass accretion rates is the 11 Hz pulsar IGR J17480−2446. This may indicate asimilarly slow spin for the neutron star in the Rapid Burster.

2 Bursts from the RB: indications for a slow rotator
2.1 Introduction
First discovered by Lewin et al. (1976), the Rapid Burster (MXB 1730−335, hereafter RB)is a neutron star (NS) low-mass X-ray binary (LMXB) located in the globular cluster Liller1, with a recent distance measurement of 7.9± 0.9 kpc (Valenti, Ferraro, & Origlia 2010). Itis a recurrent transient, which had very regular outbursts every ∼ 210 d for most of the timeup to MJD ∼ 51500, after which the outburst recurrence time abruptly dropped to ∼ 100 d(Masetti 2002).
The RB is unique, in that it features both type I and type II bursts. While the former aredue to the heating and cooling of the surface after a thermonuclear flash in the underlyinglayers (for a recent review see Galloway et al. 2008, henceforth G08), type II bursts are mostlikely due to the release of gravitational energy from the inner accretion disc during suddenaccretion events (as first pointed out by Hoffman, Marshall, & Lewin 1978), probably linkedto magnetic gating of the accretion flow (Lamb et al. 1977; Spruit & Taam 1993; D’Angelo& Spruit 2010). Consequently, these two categories of bursts can differ greatly in duration,recurrence time, energy and spectral properties (for a review, see Lewin, van Paradijs, &Taam 1993; hereafter LPT93).
Typically, type I burst recurrence times trec are of the order of hours. Although sometype I bursts have been reported to recur within ∼ 200 s (e.g. Keek et al. 2010) only onesource - IGR J17480−2446, hereafter T5X2 - exhibited that behavior for prolonged series ofbursts lasting for hours, instead of multiple events consisting just of two, three or four bursts.Linares et al. (2012) (henceforth L12) reported T5X2 to constantly increase in burst rate asits persistent luminosity rose from 0.1 to 0.5 of the Eddington luminosity LEdd, with burststransitioning to a mHz quasi-periodic oscillation (QPO), with a period as short as 240 s.
This behaviour is well in agreement with models for thermonuclear bursts. Theory pre-dicts the bursting rate to keep increasing with the persistent luminosity almost up to theEddington limit, when stable burning sets in (Fujimoto, Hanawa, & Miyaji 1981; Heger,Cumming, & Woosley 2007); still, the burst rate for the majority of burst sources is observedto decrease dramatically above a few per cent of the Eddington luminosity (e.g. Cornelisseet al. 2003; Fig. 16 in G08). Although the basic physics of type I bursts is well understood,this discrepancy between the expected and observed trec remains an unsolved issue in ourunderstanding of the phenomenon.
The unusual properties of T5X2 probably set it apart from the other bursting sources,and could possibly explain its extremely regular bursting behavior (L12). T5X2 is an 11 Hzpulsar with a reported magnetic field between 108 and 1010 G (Papitto et al. 2011; Miller et al.2011), making it the slowest rotating burster known, and possibly one of the high magneticfield bursters as well. Slow rotation could prevent turbulent mixing from stabilizing burningat low mass-accretion rates (Keek et al. 2009) and reduces the influence of the Coriolis forceon flame spread and confinement (Spitkovsky et al. 2002). Magnetic confinement, whichprobably accounts for the presence of burst oscillations in T5X2 (Cavecchi et al. 2011), couldlimit burning to a constant portion of the stellar surface, while the burning area may vary with
14

2.2 Observations
mass-accretion rate in other sources (Bildsten 2000).As already mentioned, the presence of type II bursts is probably indicative of a prominent
dynamic role of the magnetic field B in the RB. We therefore seek to investigate whetherits type I burst behaviour shows analogies to T5X2 that could be explained in terms of aslow spin or of surface magnetic field effects, related to a magnetic gating mechanism in theaccretion flow.
We perform a systematic study of all the type I bursts from the Rapid Burster detectedwith the Proportional counter array (PCA) onboard the Rossi X-ray Timing Explorer (RXTE),increasing the number of bursts over that already known by a factor of two. We observebursts over one of the largest ranges in persistent flux, and interestingly find that the burstrate increases to high values with the mass accretion rate. We discuss the implications of thisbehaviour in our understanding of the peculiar RB.
Section 2.2 describes the data selection, with particular care devoted to how we excludedspurious bursts (type II, or type I from a different source). Section 2.3 explains the analyses,spectral and morphological, performed on the bursts and the persistent emission. In Sec-tion 2.4 we report our results on the burst behaviour as a function of the persistent luminosityof the RB. Finally, we discuss the implications of our findings for the burst regimes and thesource spin in Section 2.5.
2.2 Observations
2.2.1 Dataset
The PCA (Jahoda et al. 2006) consists of five co-aligned proportional counter units (PCUs)that combine to a total effective area of 6000 cm2 at 6 keV, in a 2 to 60 keV bandpass. Thephoton energy resolution is 18% full width at half maximum at 6 keV and the time resolutionis programmable down to 1 µs. The field of view (FOV) is circular, with radius ≈ 1° (fullwidth to zero response).
The RB has been extensively monitored with the PCA, from the beginning of the missionin early 1996 until its shutdown in January 2012. We collected all PCA data that we couldfind when the RB was in the FOV of an active PCU, for a total exposure time of 2.83 Msec(this is the sum of all so-called good-time intervals, excluding times when RXTE is slewing,near to an SAA passage, or experiences a large particle rate).
A major issue of the PCA data is that the RB has an angular separation of only 0.56°to the persistently active burster 4U 1728-34. In fact, most observations (67%) were aimedat 4U 1728-34. The RB was the aimpoint for 14% of the time, so that both sources are inthe FOV for 82% of the time (including as well 1% when neither source was at the centreof the FOV). During the remaining 18%, the PCA aimpoint was offset so that only the RBis inside the FOV, decreasing the collimator response by a factor ≃ 0.4, but allowing forspectroscopic measurements unaffected by contributions from other sources. We note that,due to the transient nature of the source, only 32% of the data (or 0.91 Msec) was taken whilst
15

2 Bursts from the RB: indications for a slow rotator
the source was actually active.
2.2.2 Identification of RB type I bursts
We employed the STANDARD 1 data product, consisting of 0.125-s resolved photon countrates per PCU without any photon energy resolution, to search for bursts. Our method con-sists primarily of a computer algorithm to search for statistically significant upward fluctu-ations above a steady background on time-scales of 1 to 300 s. We verified the result ofthis search by a careful visual inspection of the light curves and the identified bursts. Weadditionally applied the criterion that the Rapid Burster should be active, as may be verifiedwith independent RXTE-ASM or ISS-MAXI measurements, to exhibit bursts. The computeralgorithm was set to accept fluctuations above the background if they have a significance ac-cumulated over the burst that is at least 10 σ and if they are accompanied by a stable pointingof the PCA. The algorithm is efficient as long as there are time intervals before or after aburst within 300 s where the background can be measured confidently. As a result some longtype II bursts may be missed that have no flat background between them and bursts that occurduring slews with the RB in the field of view. Through a visual inspection, however, we madesure that type I bursts with the typical fast-rise exponential-decay profile were included evenif they occurred during a slew. We find a total of 7261 bursts, including 121 type I bursts and7140 type II bursts. The latter number is a lower limit.
Type I bursts from 4U 1728−34 are easily recognizable by their short durations (≲ 10 s,typical of H-poor nuclear fuel) and by their brighter (often Eddington limited) peak fluxes,bimodally distributed about a mean of 9.2×10⁻⁸ erg cm−2 s−1 for the bursts showing pho-tospheric radius expansion (PRE) and 4.5×10⁻⁸ erg cm−2 s−1 for normal bursts (Fox et al.2001; Galloway et al. 2003; G08), a factor of 6 brighter than most bursts from the RapidBurster. For an angular separation of 0.56o, this ratio decreases by 40% when the RapidBurster is at the centre of the FOV and there are some type II bursts from the Rapid Bursterwhich come close to half the peak flux of bursts from 4U 1728-34. Still, these are rare andthe bursts can be distinguished by their time profile.
It is also straightforward to exclude most type II bursts. Long-lasting, flat-topped bursts,preceded and followed by dips in the persistent emission are clearly recognizable as type II,as are the intermediate-duration bursts showing multi-peaked decays (Tan et al. 1991). Theshortest type II bursts, the only ones featuring single, short peaks and a fast rise, are poten-tially ambiguous. They however have very short (< 10 s) decays and recur very fast in seriesof 8-40 bursts, making their cumulative energy release incompatible with a thermonuclearorigin (LPT93, see Sec.2.5 for further discussion). When a type I burst hides in a sequenceof such bursts it is easily recognized by its much slower decay.
We nevertheless acknowledge that we could have erroneously misidentified a few type Ibursts as type II. We intend to publish a comprehensive overview of all type I and II burstingbehavior of the Rapid Burster elsewhere, with a detailed description of the burst identifica-tions. Here we concentrate on the 121 type I X-ray bursts that we identified from the Rapid
16

2.3 Analysis
Burster in the PCA data. 65 have already been reported (Fox et al. 2001; G08). Of thesebursts, some have only been partially observed, due to their proximity to the beginning orend of a pointing, and some are surrounded or even covered by trains of fast-recurring typeII bursts. These bursts are not suitable for analysis, especially when the persistent emissionis very low, because part of the accretion is then taking place through the type II bursts,implying that in this case the persistent flux does not even qualitatively reflect the actualmass-accretion rate on the surface, and a relation between burst properties and the persistentemission should therefore no longer be expected. Consequently, we only focus on type Ibursts from observations in which no type II bursts were observed.
2.3 Analysis
We set out to determine a number of key parameters for all bursts.
2.3.1 Burst durations and recurrence times
Using the 1-s resolution light curve, we modelled the tail of the burst light curve, whenthe intensity is less than 90% of the peak intensity minus the pre-burst level, with one or -when necessary - two exponential decay functions. We used these fits to determine the burstduration tdur, defined as the time difference between the burst start time (see G08) and thetime when the intensity drops below 10% of the peak intensity minus the pre-burst level,when the burst count rates are still significantly above the noise, so that variations in thepersistent count rate do not affect our estimate of the burst duration. Generally speaking,single exponentials provide sufficiently good fits to shorter bursts (tdur ∼ 50 s), while twoexponentials are necessary for longer bursts (tdur ∼ 100 s). Although such a definitionof the burst duration is not affected by the varying noise level at different persistent countrates, the burst emission is still not over at tdur. Spectra were therefore extracted up to thetime tend when the intensity decreases to within 2σ of the pre-burst level. We then used theexponential fits to estimate how much fluence of the burst may have been contained in the fartail of the light curve (i.e., after tend). This factor, below 5% for most bursts, was added tothe burst fluence and to its uncertainty (see Sec.2.3.2), to avoid a systematic effect towardsless energetic bursts at higher persistent count rates.
The burst recurrence time trec is defined as the time elapsed between the start time of theprevious burst and that of a given burst. When data gaps occurred, the recurrence time waslabelled an upper limit. In five cases, however, the observed trec was very close to being aninteger multiple (∼2 or 3 times longer) of the recurrence time observed in the adjacent bursts,which was seen to be stable over series of up to five bursts, and a burst occurring with theaverage value of trec would have fallen in a data gap (see Fig. 2.1). Therefore, we assumedthese bursts to be recurring on a regular time-scale and divided their observed trec by theinteger amount of times that gave a nearly constant burst rate.
17

2 Bursts from the RB: indications for a slow rotator
800
1000
1200
1400
0 2 4 6 8
co
un
ts s
-1 P
CU
-1
MJD 51451
600
800
1000
1200
1400
1600
0 2 4 6 8 10
co
un
ts s
-1 P
CU
-1
time [ks]
MJD 51453
Figure 2.1: Cooling type I bursts. Notice the slightly different x and y-axis ranges. The bursts are veryregular, with separations varying by just 10% in the upper sequence (as the average Fpers decreasesby roughly the same amount) and 5% for the lower sequence. The burst separations covering the datagaps are close to twice the mean separation of the other bursts, suggesting another burst occurred inthe gap (see Sec. 2.3.1). In the lower panel, the last burst took place in a configuration that excluded4U 1728-34 from the FOV and reduced the RB intensity by a factor ∼ 0.4. We rescaled the count rateaccordingly. The remaining difference in the persistent emission level is therefore due to the lack ofcontribution of 4U 1728-34.
18

2.3 Analysis
2.3.2 Burst energetics
Throughout our analysis, the particle and cosmic background, as determined with ftool
pcabackest, were subtracted from all spectra. Response matrices were generated withpcarsp (v 11.7.1). All active PCUs were employed, and a correction was applied fordeadtime (although it is always small for the RB). Low-energy absorption by the interstellarmedium was taken into account using the model of Morrison & McCammon (1983), with anequivalent hydrogen column density of NH = 1.6× 1022 cm−2 (Frogel, Kuchinski, & Tiede1995; Masetti et al. 2000; Falanga et al. 2004). Following the RXTE Cookbook prescription1,the analysis was limited to the 3 − 30 keV range, and a systematic error of 0.5% was addedto the results.
To determine the energetics of the bursts and of the persistent emission, we performed atime-resolved spectroscopic analysis according to the following procedure.
The persistent emission
First, the spectrum of the non-burst X-ray emission was extracted from 496 s long STANDARD
2 data stretches preceding the burst, to constrain the background signal underlying the burst.We modelled this spectrum with a generic LMXB model consisting of a disc black body(Mitsuda et al. 1984), a power law and a Gaussian centred at 6.4 keV (G08), that yieldeda χ2
red very close to one for all the pre-burst spectra. In the many cases that the FOV alsoincluded 4U 1728−34, the measured flux also included a contribution from that source andthe resulting fit parameters are not a truthful representation of the persistent emission of theRB, but for assessing the burst energetics this is not crucial as long as the model is a gooddescription of the non-burst emission.
For those cases where 4U 1728-34 was outside the FOV, this model also provides a goodmeasurement of the persistent flux Fpers. Furthermore, even when the FOV contaminationwas an issue, a dedicated offset observation (see Sec. 2.2.1) taken no longer than one hourbefore or after the burst was often available. We used these uncontaminated spectra to esti-mate the persistent flux Fpers in the range 3-25 keV, resorting to the same three-componentmodel mentioned earlier. All but six such measurements were taken within 1500 s from theburst onset. In all cases, we took care to verify the stability of the average count rate overthe interval between the measurement and the burst. The count rate variation in the RB overthe course of an hour was always below 5%. All fits were satisfactory, giving χ2
red ≲ 1.5 for40-50 degrees of freedom. Note that in the case of short recurrence time bursts, a single Fpers
measurement may apply to multiple bursts.For each of these uncontaminated observations, a bolometric correction cbol was calcu-
lated from the portion of the observation excluding 4U 1728−34. We fitted an absorbedComptonisation model (compTT in XSPEC) to the spectrum extracted for each PCU in theenergy range 3–25 keV, and integrated the best fit model to give the flux over this range. We
1See http://heasarc.nasa.gov/docs/xte/recipes/cook_book.html
19

2 Bursts from the RB: indications for a slow rotator
then created (in XSPEC) a ‘dummy’ (ideal) response covering the broader energy range of0.1–200 keV, and calculated the integrated, unabsorbed flux over that range. The bolomet-ric correction for a given PCU was estimated as the ratio of these two fluxes, and the valueadopted for each observation was the mean of the values for the active PCUs, with the stan-dard deviation of the values over all PCUs adopted as the uncertainty. The Comptonisationmodel was chosen over the phenomenological (disk black body plus power law) because theComptonisation model has a finite integral for any choice of the input parameters. In fact,because the persistent spectrum was generally soft, the electron scattering temperature kTe
was typically a few keV, and could be well constrained by the spectrum up to 25 keV. Fora few of the observations, the spectrum was harder, and in some cases the kTe could not beconstrained by the fit. For most of those observations, the addition of a Gaussian componentimproved the fit sufficiently that the kTe could be constrained; for a few examples it waspossible to constrain the plasma temperature for all but PCU #3, and for those observationsthat spectrum was excluded.
We adopt Fpers = cbolF3−25 keV as the bolometric intensity for the source in each obser-vation. We also often refer to its ratio to the Eddington flux FEdd. To derive the latter, weapply the distance estimate to the Eddington luminosity
LEdd = 3.5× 1038(
M
1.4M⊙
)(1
1 +X
)ergs s−1 (2.1)
with M the stellar mass and X the hydrogen fraction (e.g. G08). This corresponds to anEddington flux from the disc FEdd = 2.8×10⁻⁸ erg cm−2 s−1 for a ‘canonical’ NS withmass M = 1.4M⊙ and radius R = 10 km, accreting solar-composition material (X = 0.7).
The bursts
The burst data were divided into a number of time bins, varying in duration to keep the photoncount, and hence the relative error on the derived quantities, approximately constant. The binduration was constrained to be at most 1 s during the burst rise, to be able to track the initiallyrapidly-varying temperature. The minimum bin duration possible was constrained by thetime resolution of STANDARD 1 data, at 0.125 s.
Spectra were extracted for each time bin from event files, the time resolution of whichvaried between 1 and 125 µs. The non-burst emission was not subtracted. Spectra during thebursts were modelled by the combination of black body radiation (leaving free temperatureand emission area, to account for the varying burst emission, and multiplied by a model forinterstellar absorption with NH = 1.6×1022 cm−2) and the model as found for the non-burstspectrum discussed above, keeping the parameters of the latter fixed to the pre-burst values.
The assumption underlying this ‘standard’ procedure is that Fpers is constant during theburst. The well-known caveat (van Paradijs & Lewin 1986) is the possibility that the persis-tent emission actually varies during the burst, giving rise, for instance, to systematic errors
20
2.3 Analysis
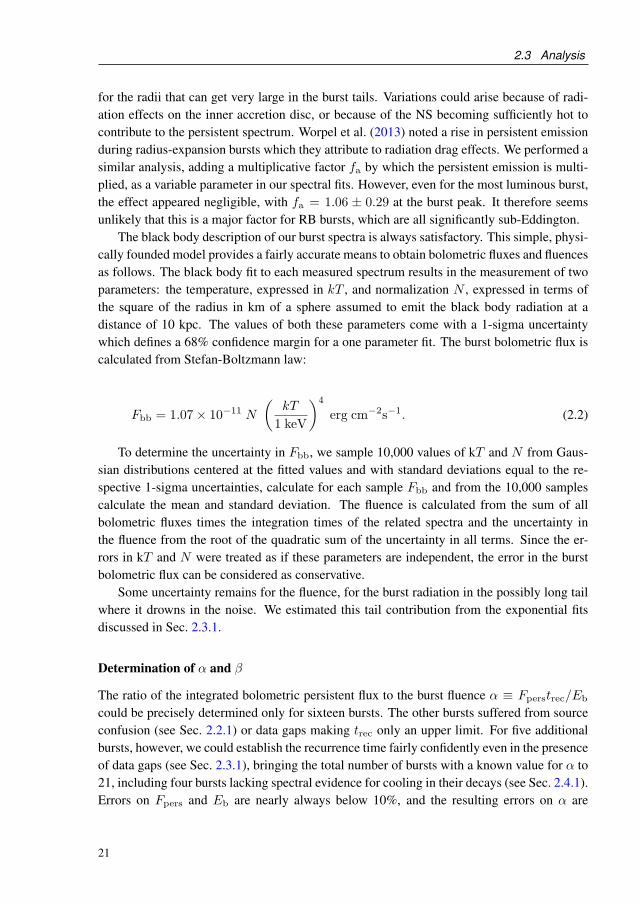
for the radii that can get very large in the burst tails. Variations could arise because of radi-ation effects on the inner accretion disc, or because of the NS becoming sufficiently hot tocontribute to the persistent spectrum. Worpel et al. (2013) noted a rise in persistent emissionduring radius-expansion bursts which they attribute to radiation drag effects. We performed asimilar analysis, adding a multiplicative factor fa by which the persistent emission is multi-plied, as a variable parameter in our spectral fits. However, even for the most luminous burst,the effect appeared negligible, with fa = 1.06 ± 0.29 at the burst peak. It therefore seemsunlikely that this is a major factor for RB bursts, which are all significantly sub-Eddington.
The black body description of our burst spectra is always satisfactory. This simple, physi-cally founded model provides a fairly accurate means to obtain bolometric fluxes and fluencesas follows. The black body fit to each measured spectrum results in the measurement of twoparameters: the temperature, expressed in kT , and normalization N , expressed in terms ofthe square of the radius in km of a sphere assumed to emit the black body radiation at adistance of 10 kpc. The values of both these parameters come with a 1-sigma uncertaintywhich defines a 68% confidence margin for a one parameter fit. The burst bolometric flux iscalculated from Stefan-Boltzmann law:
Fbb = 1.07× 10⁻¹¹ N
(kT
1 keV
)4
erg cm−2s−1. (2.2)
To determine the uncertainty in Fbb, we sample 10,000 values of kT and N from Gaus-sian distributions centered at the fitted values and with standard deviations equal to the re-spective 1-sigma uncertainties, calculate for each sample Fbb and from the 10,000 samplescalculate the mean and standard deviation. The fluence is calculated from the sum of allbolometric fluxes times the integration times of the related spectra and the uncertainty inthe fluence from the root of the quadratic sum of the uncertainty in all terms. Since the er-rors in kT and N were treated as if these parameters are independent, the error in the burstbolometric flux can be considered as conservative.
Some uncertainty remains for the fluence, for the burst radiation in the possibly long tailwhere it drowns in the noise. We estimated this tail contribution from the exponential fitsdiscussed in Sec. 2.3.1.
Determination of α and β
The ratio of the integrated bolometric persistent flux to the burst fluence α ≡ Fperstrec/Eb
could be precisely determined only for sixteen bursts. The other bursts suffered from sourceconfusion (see Sec. 2.2.1) or data gaps making trec only an upper limit. For five additionalbursts, however, we could establish the recurrence time fairly confidently even in the presenceof data gaps (see Sec. 2.3.1), bringing the total number of bursts with a known value for α to21, including four bursts lacking spectral evidence for cooling in their decays (see Sec. 2.4.1).Errors on Fpers and Eb are nearly always below 10%, and the resulting errors on α are
21

2 Bursts from the RB: indications for a slow rotator
generally below 20%.We also looked at the ratio of the burst peak to persistent flux β ≡ Fpeak/Fpers, which
we could derive for 57 bursts. The errors on the peak flux were somewhat large, whichpropagated to errors on β getting large especially at the lower end of the Fpers range.
2.4 Results
2.4.1 Lack of cooling
We fail to find evidence for cooling in six bursts, meaning the temperature difference ∆T =
Tpeak−Tdur is consistent with zero within error bars, with the black body temperature Tpeak
measured at the flux peak and Tdur at the time tdur. They occurred at the beginning of theJune-July 1997 outburst, at the highest level of Fpers we observed in all data (see Fig. 2.2).The highest value for which cooling is not observed is β = 0.37 ± 0.09, while the lowestvalue among bursts with a cooling tail is β = 0.50 ± 0.10. On average β = 0.30 ± 0.13
for the non-cooling bursts. Their α values range from 87 ± 13 to 153 ± 26, consistent witha thermonuclear origin, and they have time profiles typical for type I bursts (see Sec.2.2.2).This convinces us that they are not type II bursts, for which reported values of α range from0.15 to 4.29 (Tan et al. 1991; Masetti et al. 2000).
2.4.2 Burst behaviour as a function of accretion rate
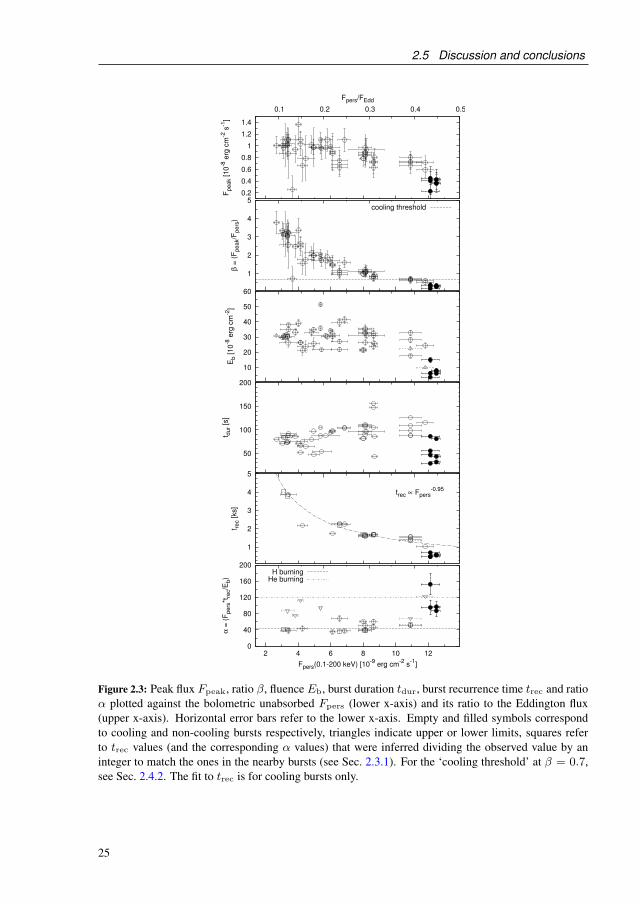
In Fig. 2.3 all burst parameters are plotted against the bolometric accretion flux Fpers and itsratio to the Eddington flux FEdd. The RB produces regular type-I bursts over a much widerrange of persistent flux than seen in other systems, from (2.7± 0.2)×10−9 erg cm−2 s−1 to(12.5± 0.3)×10−9 erg cm−2 s−1, or between 10% and 45% of FEdd.
Some trends in burst parameters versus persistent flux are clearly visible in Fig. 2.3. Theratio β clearly decreases with increasing Fpers, until it falls below the threshold β = 0.7
which Linares, Chakrabarty, & van der Klis (2011) suggest determines whether cooling canbe detected in PCA data (Linares, Chakrabarty, & van der Klis 2011). This is not onlytrivially due to the increase in Fpers. The peak fluxes show a decreasing trend with increasingFpers, down from a maximum of Fpeak = (13.6 ± 2.6)×10−9 erg cm−2 s−1. On the otherhand, the non-cooling bursts at the highest Fpers show much lower peak fluxes, averagingFpeak ≃ 3.7×10⁻⁹ erg cm−2 s−1.
Most importantly, the recurrence time trec falls steadily with increasing Fpers, down to aminimum of 467 s. Regardless of Fpers, the bursts appear to be very regularly clocked (seeFigs. 2.1 and 2.2). A fit to the recurrence times yields a power law with index −1.81± 0.04.The fit however is unacceptably poor, with χ2
red = 22.1 for 22 degrees of freedom. Excludingthe non-cooling bursts, this becomes a flatter −0.95± 0.03, with χ2
red = 3.46 for 17 degreesof freedom. The impossibility of fitting a single relation is due to the steepening of therelation in the non-cooling regime, as is clear from Fig. 2.3. However, too few non-cooling
22

2.5 Discussion and conclusions
bursts are available and they span too narrow an Fpers range for a fit to this latter regime tobe meaningful.
Despite the large spread in values, both Eb and tdur seem to stay relatively constantuntil the highest persistent fluxes. A drop then occurs, coincidently with the disappearanceof cooling from the burst spectra. One might suspect this to be due to the poorer statisticsin the burst tail at large Fpers - a sizeable fraction of the burst fluence might be lost in thenoise. However we defined tdur and Eb exactly to avoid such an effect (see Sec. 2.3.1). Wetherefore believe this drop to be genuine. The average rise time shows no correlation with thepersistent flux (trise ≃ 7.1 s, with standard deviation σ ≃ 2.1 s), although its average value isdifferent for the cooling and non-cooling bursts (6.8 and 9.6 s respectively), perhaps hintingat a late change in bursting regime. Together with the change in burst duration tdur, whichon the other hand seems to get shorter at the largest accretion rates, this makes for burstsbecoming somewhat more symmetric in shape.
Excluding the bursts at the highest accretion rates, nearly constant α values are observedfor the cooling bursts, although at lower Fpers the longer trec means that often only upperlimits on α can be measured. For the cooling bursts for which α is well constrained, onaverage α ≃ 46 with a standard deviation of ≃ 10. Including the bursts for which we dividedtrec by an integer value estimated by comparison with the surrounding bursts (see Sec. 2.3.1and Fig. 2.1) yields an average α ≃ 44 with a standard deviation of ≃ 9, reinforcing ourinference that our assumption of stable recurrence time is correct. Only at the high-end of thedistribution is an upturn in α visible, peaking to α = 153± 26. On average, the non-coolingbursts have α ≃ 98 with a standard deviation of ≃ 26. It is important to stress that for all thebursts for which α is well constrained, the value points to a thermonuclear origin.
No obvious explanation is available for the outlier, the very low Fpeak burst at Fpers =
3.6± 0.3×10⁻⁹ erg cm−2 s−1.
2.5 Discussion and conclusions
2.5.1 Cooling and burst type identification
The identification of a burst from the RB as type I or II can be difficult. Several attempts havebeen made using broad-band spectroscopy, but the results are inconclusive at best (Kuniedaet al. 1984; Stella et al. 1988; Tan et al. 1991; Lubin et al. 1992a; Guerriero et al. 1999). Nonethe less, the presence of cooling in time-resolved spectroscopy of type I bursts has long beenaccepted as a hallmark of thermonuclear burning (LPT93), for type II bursts generally exhibitvery little spectral evolution. This has been used to argue for the occurrence of type II burstsin other sources (e.g. T5X2; Galloway & in ’t Zand 2010). However several authors (Mottaet al. 2011; Chakraborty & Bhattacharyya 2011) soon pointed out that the α values for T5X2bursts that did not show a cooling trend were consistent with a thermonuclear origin. Linareset al. (2011) found the occasional lack of cooling in some bursts from T5X2, Cir X-1, GX17+2 and Cyg X-2 to coincide with a low value for β near the outburst peak. They proved
23

2 Bursts from the RB: indications for a slow rotator
900
1000
1100
1200
1300
1400
1500
0 0.5 1 1.5
co
un
ts s
-1 P
CU
-1
time [ks]
Figure 2.2: Fast recurring, non-cooling type I bursts. Concerning the offset in count rate around the lastburst, see Fig. 2.1.
the α values of these bursts to be consistent with a thermonuclear origin, and found cooling todisappear from bursts below a ratio β of 0.7. They attributed the lack of measurable changesin Tbb to two factors: a loss of sensitivity due to the increased luminosity of the persistentemission (resulting in lower signal to noise); and a reduction in the column depth requiredfor ignition as the layer temperature rises (resulting in less mass being burned and the burstsreaching lower peak temperatures). Values of β for non-cooling PCA bursts from Cir X-1,GX 17+2 and Cyg X-2 are also below β ≃ 0.7, ruling out these sources as type II burstemitters.
Ultimately, α remains the most reliable observable to distinguish type I from type IIbursts. Depending on the fuel composition, thermonuclear burning can release between 1.6and 4.4 MeV/nucleon (Wallace & Woosley 1981; Fujimoto et al. 1987), while the energyrelease from accretion on to a ‘canonical’ neutron star is about 180 MeV/nucleon, yieldingexpected α values between ∼ 40 and ∼ 110 for thermonuclear bursts, about one to twoorders of magnitude above what is observed for type II bursts (Tan et al. 1991; Masetti et al.2000). We found compelling evidence that RB bursts at the highest persistent fluxes have athermonuclear origin with precise measurements of their α values, and showed that cooling
24
2.5 Discussion and conclusions
0.2
0.4
0.6
0.8
1
1.2
1.4
0.1 0.2 0.3 0.4 0.5
Fpeak [10
-8 e
rg c
m-2
s-1
]
Fpers/FEdd
1
2
3
4
5
β =
(F
peak/F
pers
)
cooling threshold
10
20
30
40
50
60
Eb [10
-8 e
rg c
m-2
]
50
100
150
200
t dur [s
]
1
2
3
4
5
t rec [ks]
trec ∝ Fpers-0.95
0
40
80
120
160
200
2 4 6 8 10 12
α =
(F
pers
*tre
c/E
b)
Fpers(0.1-200 keV) [10-9
erg cm-2
s-1
]
H burningHe burning
Figure 2.3: Peak flux Fpeak, ratio β, fluence Eb, burst duration tdur, burst recurrence time trec and ratioα plotted against the bolometric unabsorbed Fpers (lower x-axis) and its ratio to the Eddington flux(upper x-axis). Horizontal error bars refer to the lower x-axis. Empty and filled symbols correspondto cooling and non-cooling bursts respectively, triangles indicate upper or lower limits, squares referto trec values (and the corresponding α values) that were inferred dividing the observed value by aninteger to match the ones in the nearby bursts (see Sec. 2.3.1). For the ‘cooling threshold’ at β = 0.7,see Sec. 2.4.2. The fit to trec is for cooling bursts only.
25

2 Bursts from the RB: indications for a slow rotator
disappears below a β threshold that is roughly consistent with that inferred by Linares et al.(2011). Although the transition seems to lie at a somewhat lower value of β in the RB,it should be noted that the energy band they used to calculate Fpers is narrower than ours(2− 50 keV versus 1− 200 keV). Also, Guerriero et al. (1999) already noted that in the RBtype II bursts only appear late in the outburst decay, usually after the persistent luminosityhas decreased to Fpers ∼ 3×10⁻⁹ erg cm−2 s−1. For all but one burst we analysed, Fpers
lies above this value and we confirm that no type II bursts are observable in the lightcurves. Itis therefore unlikely that type II bursting activity resumes at the highest Fpers levels, with α
values two orders of magnitude larger than usual and smooth exponential decays rather thanthe multi-peaked decays type II bursts of similar duration are reported to show (Tan et al.1991).
The paucity of identified non-cooling bursts is due not only to the relatively short time thesource spends at the highest accretion rates during an outburst, but also to the drop in outburstpeak flux after MJD 51500. Masetti (2002) reported a drop in both the outburst peak flux andrecurrence time by roughly by a factor of two after that date.
2.5.2 Bursting regimes
We showed that the RB keeps emitting type I bursts at an ever increasing rate, over a range ofFpers from (2.7± 0.2)×10−9 erg cm−2 s−1 to (12.5± 0.3)×10−9 erg cm−2 s−1. Assuminga distance of 7.9 kpc, this corresponds to (2.6−9.3)×1037 erg s−1, or (10−45)% LEdd. TheX-ray flux is however known to be a poor proxy of the real mass accretion rate (van der Klis2001), so that the real range in M that the source is spanning remains uncertain. Accountingfor the uncertainty in the distance, the maximum luminosity at the time of a burst rangesbetween 35% and 53% of LEdd.
That the bursting rate keeps increasing over such a large range in Fpers is a strikingsimilarity between the RB and T5X2, and it sets these two sources apart from all other knownbursters (e.g. Cornelisse et al. 2003; Fig. 16 in G08). The trend in Fpeak is also similar.As mentioned, we do not observe a continuous decrease in Eb and tdur. These trends are,however, rather dubious in T5X2 when looking at the individual bursts, and only becomeclear switching to the daily averages of these burst properties (see Fig. 7 and 9 in L12).A larger number of available bursts in T5X2 is due to a bursting rate that initially growsfaster: trec ∝ F−3
pers up to Fpers/FEdd ≃ 0.3, after which it settles on a flatter trec ∝ F−1pers.
The latter relation seems closer to the one followed by the RB for all but the highest Fpers
levels: excluding non-cooling bursts, we fit trec ∝ F(−0.95±0.03)pers . This is consistent with the
empirical relations trec ∝ F−1.05pers found in GS 1826-24 (Galloway et al. 2004) and trec ∝
F−1.1pers in the accreting millisecond pulsar IGR J17511-3057 (Falanga et al. 2011), and it is
indicative of a fuel with a significant H fraction, where the proportionality expected is roughlytrec ∝ m−1, while the steeper index initially observed in T5X2 agrees with models for pureHe burning (Cumming & Bildsten 2000). In the RB there seems instead to be a transitionfrom a flatter to a steeper regime, but the data is too limited to measure the slope of the latter.
26

2.5 Discussion and conclusions
All bursts have α values between 35 ± 5 and 153 ± 26, with a weighted average α =
44 ± 14. Values of α for the cooling bursts are indicative of a fuel composition that iscompatible with the solar H abundance, in line with the observed long burst durations typicalof the H burning rp-processes. The higher α values that are measured at the highest levels ofFpers are unlikely to be due to a smaller H fraction in the burst fuel, as this is the oppositeof what would be expected for the burst with the shortest trec. Instead, the sudden rise in α
might be due to the onset of semi-stable He burning in between the bursts. If some fractionof the fuel is burning in between bursts, this will make overall less material available to burnin a burst, therefore reducing the fluence and making α grow larger.
This explanation seems to be backed up by theoretical modelling of the burst time-scalesand energetics in this transitional regime. Keek et al. (2012) studied models of the NS enve-lope after a superburst. Bursting is initially quenched because of the hot envelope; the firstbursts reappearing after the superburst are less energetic, feature a slower rise and a fasterdecay than the bursts before it. As the envelope cools down further, trec become longer, triseshortens, tdur lengthens and the bursts become again as energetic as they were before. Wesuggest that the same transition could be taking place in the RB as the mass accretion ratedecreases during the outburst decay. Unfortunately, no observations are available for the timeprior to the appearance of the non-cooling bursts to look for stable burning or the mHz QPOsexpected from marginally stable burning at higher mass accretion rates.
It is also worth pointing out that we are not looking at the so-called short-waiting-timebursts described by Keek et al. (2010), which are thought to be due to incomplete burning ofthe fuel in the preceding burst, leading to rapidly following, smaller bursts, in sequences ofup to four events. Within such sequences, the bursts following the first one are on average lessbright, cooler, and less energetic than the initial burst, and their decay profiles lack the longerdecay component from the rp-process, suggesting they take place in a hydrogen-depletedlayer. These short-waiting-time bursts show α ≃ 5 (Boirin et al. 2007), a value so low thatthe fuel must be left over from the preceding burst. We therefore exclude this incomplete-burning scenario to explain the very short trec we report in the RB, given the stability ofthe burst properties across multiple events, the long burst tails indicating the presence of H-burning processes and the aforementioned α values typical of ordinary type I bursts and thelargest in the sample.
2.5.3 Bursts at the highest M : indications for a slow spin?
That the bursting rate keeps increasing over such a large range in Fpers is a striking similaritybetween the RB and T5X2. Such behaviour, although predicted by theory (Fujimoto et al.1981; Heger et al. 2007) has so far been reported in no other source.
When analysing a sample of BeppoSAX Wide Field Camera (WFC) data on nine X-raybursters, both transient and persistent sources in the Galactic centre, Cornelisse et al. (2003)found the burst rate to peak at L ≃ (1.4− 2.1)×1037 erg s−1 before dropping by a factor offive. Above this threshold, all sources also showed significantly shorter bursts, recurring less
27

2 Bursts from the RB: indications for a slow rotator
regularly. It is difficult to interpret this change in behaviour. Cornelisse et al. (2003) suggestedthat it might be due to the transition from unstable to stable H burning, so that bursts above thecritical luminosity are in a pure He regime (the so called case 2, Fujimoto et al. 1981), wherethey take a longer time to build up and have much shorter (≲ 10 s) tails due to the absenceof prolonged H burning via the rp-processes (LPT93). He burning has a much stronger Tdependence, meaning local conditions set by perturbations in the layer steadily burning Hhave a larger importance in setting ignition conditions, leading to variations in trec. Thisseems however an unlikely explanation. Firstly, α values should increase significantly whileswitching to the less efficient burning of He, contrary to the result of G08, who reported α
values above the threshold to stay constant or decrease slightly. Secondly, after an initial drop,the bursting rate should start again increasing through the transition from case 2 to case 1 (theHe triggered, mixed H/He bursts), again contrary to what is observed. Thirdly, case 1 burstshave been observed at lower mass accretion rates (e.g. in GS 1826−24, Galloway et al. 2004),suggesting the transition from case 3 to case 2 takes place at lower M . Another possibility isthat this threshold corresponds to the onset of semi-stable He burning (e.g. in ’t Zand et al.2003), which starts depleting the layer of nuclear fuel. The theory of thermonuclear burninghowever places such a transition at near- or above Eddington luminosities, inconsistent withthe low luminosity (around 10% of LEdd) at which it is observed (Cornelisse et al. 2003;G08). A final possibility involves variation in burning area. As pointed out by Bildsten(2000), the observed flux only reflects the overall mass accretion rate M , while the burningregime depends on the mass accretion rate per unit area m ≡ M/Aeff , with Aeff the surfacearea of the igniting region. If this area increases with a stronger than linear dependence onM , m might actually decrease with increasing persistent flux.
T5X2, by contrast, is very different and behaves more in line with theoretical expec-tations. L12 reported that T5X2 showed a constant increase in burst rate as its persistentluminosity rose from 0.1 to 0.5 LEdd, with bursts gradually evolving into a mHz QPO (witha period as short as 240 s) until the onset of stable burning. They posited that this (up to then)unique match between theory and observations was due to the very slow spin of T5X2. Spin-ning at only 11 Hz, T5X2 rotates an order of magnitude more slowly than all other bursterswhose rotation rate has been measured via burst oscillations. At 11 Hz, rotation is only mini-mally dynamically relevant, whereas at 100 Hz and above its effects are much stronger (Watts2012). Rotation should, for example, affect the burning process (and its stability) by trigger-ing turbulent mixing (Keek et al. 2009). This would stabilize He burning at lower accretionrates per unit area than for a non-rotating source, skewing the theoretical prediction.
Given the relatively strong B field in T5X2, one might wonder whether it is the magneticfield rather than the rotation rate that determines the unusual bursting behaviour in this source.Although the field is weak enough that fuel confinement is unlikely to be effective (Brown& Bildsten 1998), Cavecchi et al. (2011) argued that dynamical magnetic effects may act toconfine the spreading flame front after ignition, leading to stalling and explaining the presenceof burst oscillations in this source. Magnetic channelling should also lead to a reductionin shearing instabilities and rotational mixing in the surface layers independent of the slow
28

2.5 Discussion and conclusions
rotation (L12). Without further study, it has been hard to distinguish these two possibilitiesfor T5X2. However the RB may provide a clue, since in this source there is no evidence formagnetic channelling (in the form of persistent accretion-powered pulsations).
If rotation rate is the main factor determining the bursting behaviour in T5X2, then thesimilarity exhibited by the RB implies that it too may rotate slowly. Patruno et al. (2012)argued that T5X2 has entered its spin-up phase in an exceptionally recent time (a few 107 yr),and that also the total age of the binary is extremely low (≲ 108 yr). It therefore has not onlya slow spin, but also a relatively high magnetic field (between 108 and 1010 G, Papitto et al.2011; Miller et al. 2011). If the RB also rotates slowly, one may speculate that it too is ata similar evolutionary point, a young LMXB with a strong magnetic field. Where it differsfrom T5X2, however, is that it also exhibits type II bursts. Interestingly, the only other sourceknown to exhibit type II bursts is the slow pulsar GRO J1744−28, which spins at just 2.14 Hz(Finger et al. 1996). It has a reported magnetic field in the range (2−20)×1010 G (Sturner &Dermer 1996; Cui 1997), intermediate between the weak fields (B ≃ 108 − 109 G) thoughtto reside in LMXBs and the strong fields (B ≃ 1012 − 1013 G) found in X-ray pulsars. TheB value for GRO J1744-28 is probably large enough to confine burning to a stably burningportion of the surface, explaining the lack of type I bursts.
Confirming the spin rate of the RB is unfortunately difficult, since to date there have beenno observations of either accretion-powered pulsations or burst oscillations from this source.A low-significance claim of a 306 Hz modulation in a set of stacked burst spectra was reportedby Fox et al. (2001). However results from stacked burst spectra have in the past provedmisleading, see for example the case of EXO 0748-676: stacked burst spectra suggested aspin of 45 Hz (Villarreal & Strohmayer 2004) whereas the true burst oscillation frequencyis now known to be 552 Hz (Galloway et al. 2010a). G08 have also already searched forburst oscillations, but only for frequencies above 10 Hz. We are planning a more thoroughand dedicated investigation, to look into the overall timing behaviour of the source, withparticular regard to low-frequency phenomena. (Bagnoli et al. 2014).
The lack of persistent pulsations or magnetically-confined burst oscillations could be ex-plained by scattering in an optically thick Comptonizing cloud, which might degrade thesignal and hide the modulation (Titarchuk, Cui, & Wood 2002), although this seems to bean unlikely explanation for at least three other LMXBs (Gögüs, Alpar, & Gilfanov 2007).Alternatively, no pulsations would be observed if the dipole moment of the magnetic fieldwere very closely aligned with the rotation axis of the NS (Chen & Ruderman 1993). Indeedthis would be supported by models for type II bursts (e.g. Spruit & Taam 1993) that involveunstable disc-magnetosphere interactions in which matter builds up at the magnetosphericradius until a critical gas pressure is reached. This would not be possible in a highly inclineddipole model, where matter can always stream directly to the star along a field line. Morestringent constraints come by D’Angelo & Spruit (2011, 2012), who argue episodic accretionoccurs because of an inner disc radius hovering around the corotation radius rc (the radius atwhich the Keplerian frequency equals the NS spin). They notice that the kind of instabilitythey model would not be possible in case of a strongly misaligned dipole, where at different
29

2 Bursts from the RB: indications for a slow rotator
longitudes the disc would be truncated inside and outside rc, thereby always allowing forsome accretion to occur (Perna, Bozzo, & Stella 2006) and preventing the buildup of a massreservoir to release later in a type II burst. Although such a strongly aligned configurationmight seem unlikely, especially for relatively young systems, this is in agreement with thefact that we only know two type II burst sources, compared to over a hundred type I bursters.T5X2 could perhaps not show type II bursts because it is a more strongly misaligned rotatorthan the RB and the Bursting Pulsar.
AcknowledgementsWe wish to thank Diego Altamirano, Caroline R. D’Angelo, Jóel K. Fridriksson, Michielvan der Klis, Manu Linares and Alessandro Patruno for the occasional guidance and usefuldiscussions during the preparation of this paper.
30
3Double-peaked thermonuclear bursts at
the soft–hard state transition in theRapid Burster
T. Bagnoli, J.J.M. in ’t Zand, A. Patruno and A.L. Watts
Published in Monthly Notices of the Royal Astronomical Society, Volume 437, Issue 3,p.2790-2801 (2014)
Abstract
Long suspected to be due to unstable accretion events, the type II bursts exhibited bythe Rapid Burster (RB, or MXB 1730–335) still lack an exhaustive explanation. Apart fromtype II bursts, the transient RB also shows the better-understood thermonuclear shell flashesknown as type I bursts. In search of links between these two phenomena, we carried out acomprehensive analysis of all Rossi X-ray Timing Explorer observations of the RB and foundsix atypical type I bursts, featuring a double-peaked profile that is not due to photosphericradius expansion. The bursts appear in a phase of the outburst decay close to the onset of thetype II bursts, when the source also switches from the high/soft to the low/hard state. We alsoreport the discovery of a simultaneous low-frequency quasi-periodic oscillation present in thepersistent emission as well as in the burst decaying emission. We discuss several scenarios tounderstand the nature of the peculiar bursts and of the accompanying oscillation, as well astheir possible relation with each other and with the type II burst phenomenon. We favour amodel consisting of two accretion channels, one polar and one equatorial, in a source viewedat low inclination. We also, for the first time, clearly identify the atoll nature of the RB.

3 Double-peaked type I bursts in the RB
3.1 Introduction
The Rapid Burster (RB; e.g. Lewin, van Paradijs, & Taam 1993) is a transiently accretingneutron star (NS) low-mass X-ray binary (LMXB), with outbursts recurring in less than oneyear (Masetti 2002) and peak luminosities up to nearly half the Eddington limit (Bagnoliet al. 2013, hereafter B13). It is located in the globular cluster Liller 1, at a distance of7.9 ± 0.9 kpc (Valenti, Ferraro, & Origlia 2010). It is unique, in that it shows both typeI bursts, which are X-ray eruptions due to the heating and cooling of the NS photosphereafter a thermonuclear shell flash of accreted material (see e.g. reviews by Strohmayer &Bildsten 2006 and Galloway et al. 2008), and type II bursts, most likely due to the release ofgravitational energy during sudden accretion episodes (Hoffman, Marshall, & Lewin 1978).While the former are relatively well understood and observed in over a hundred sources, itremains unclear why the latter have been unambiguously detected in only two NS LMXBs,the other one being the slowly rotating (2 Hz) Bursting Pulsar (Kouveliotou et al. 1996).
The Proportional Counter Array (PCA) onboard the Rossi X-ray Timing Explorer (RXTE)observed 125 type I and about 7050 type II bursts from the RB. A complete analysis (B13)of the type I burst sample shows that type I bursts appear in the RB over a remarkably largerange of mass accretion rates, recurring faster as its bolometric luminosity increases to a largefraction of the Eddington limit, a behaviour only shared with the 11 Hz pulsar IGR J17480–2446 (Linares et al. 2012) among over a hundred bursting LMXBs (see e.g. Cornelisse et al.2003). The known NS spin frequencies in these systems range between 245 and 620 Hz(Watts 2012), and the exceptional bursting behaviour of IGR J17480–2446 can be explainedonly thanks to its slow NS spin (Linares et al. 2012). This indicates the RB should be a slowrotator too (B13).
Type II bursts instead appear only after the outburst has significantly decayed, usuallybelow a bolometric persistent flux of Fpers ≈ 3×10⁻⁹ erg cm−2 s−1 (Guerriero et al.1999). They often show a relaxation-oscillator behaviour, meaning that the fluence in a typeII burst is proportional to the waiting time to the next one. These properties hint at disc-magnetosphere interactions that are largely thought to control the type II burst phenomenon(Baan 1977, 1979; Lamb et al. 1977; Spruit & Taam 1993). Type II bursts in the RB are oftenaccompanied by low-frequency quasi periodic oscillations (LF QPOs) in the persistent emis-sion, both at frequencies ν0 between 2 and 4 Hz, and at much slower values centred about anaverage of 42 mHz. They both cease right before the onset of a type II burst, so it is likelythat they originate in the same mass reservoir whose spasmodic accretion is responsible forthe type II burst (Stella et al. 1988; Lubin et al. 1992b).
Much theoretical work (e.g. Kulkarni & Romanova 2008; D’Angelo & Spruit 2010; Ro-manova et al. 2012; D’Angelo & Spruit 2012) has focused on the dynamical role of themagnetic field, which can act as a ‘gating’ mechanism to the accretion flow once the massaccretion rate drops below a certain threshold. These models could explain the episodicaccretion that is responsible for the type II burst phenomenon, but also LF QPOs at lowmass-accretion rates, as those observed in the light curves of the accreting millisecond X-ray
32

3.2 Observations
pulsars (AMXPs) SAX J1808.4—3658 (Patruno et al. 2009) and NGC 6440 X-2 (Patruno &D’Angelo 2013).
We report here on six peculiar type I bursts that stand out among the RB PCA samplebecause of a unique double-peaked structure first noticed by Fox et al. (2001). We showthat four of these bursts appear at the transition from the high/soft to the low/hard state (vander Klis 2006), and that this takes place at the time of the first appearance of type II bursts.We exclude the possibility that their double peaks are due to photospheric radius expansion(PRE; see e.g. Lewin et al. 1993). We also find a previously unreported QPO at a frequencyof about 0.25 Hz. The QPO becomes visible in the persistent emission a few days beforethe double-peaked bursts, peaks in amplitude at the time the bursts appear, even becomingdirectly visible in the lightcurve, and fades out over the next few days.
We describe the spectral and timing properties of the double-peaked type I bursts andthe LF QPO accompanying them, and investigate whether they can shed further light on thenature of the interaction between accretion and magnetic-field effects in the enigmatic RB.Section 3.2 describes the data set and discusses the data analysis. Section 3.3 presents theresults of our analysis, and finally Section 3.4 discusses the interpretation of these results inthe context of models and observations of other sources.
3.2 Observations
Most measurements described here were obtained through observations with the PCA. ThePCA (Jahoda et al. 2006) is a non-imaging system consisting of five co-aligned proportionalcounter units (PCUs) that combine to a total effective area of 6500 cm2 at 6 keV, in a 2 to60 keV bandpass. The photon energy resolution is 18 per cent full width at half-maximum(FWHM) at 6 keV and the time resolution is programmable down to about 1 µs. The fieldof view (FOV) is approximately circular, with radius 1° (full width to zero response). TheRXTE observations of the RB include a mix of data. There are observations directly pointedat the source that are contaminated by the presence of 4U 1728–34 at an angular distance of0°.56 (Galloway et al. 2008), and offset pointings that do not suffer from such contamination,albeit at the price of a smaller effective area. The total exposure time obtained on the RBwhile it was active is 0.91 Msec. For further details on source confusion in the FOV, burstidentification, and discrimination between type I and type II bursts, we refer the reader toB13.
Six type I bursts have a peculiar double-peaked time profile. They are numbered 35,36, 37, 58, 118 and 119, following their chronological position among the 125 type I burstin the PCA sample (B13). Three of the six double-peaked type I bursts subject of this paperoccurred during one outburst which is shown in Fig. 3.1. The burst lightcurves (Fig. 3.2) wereconstructed employing 0.125-s resolution STANDARD 1 data. Typically, type I X-ray burstsof the RB show a two-component decay profile, with a steeper 10-s long initial decay and ashallower 100-s long tail, whose relative amplitude varies (B13). We constructed an average
33

3 Double-peaked type I bursts in the RB
type I burst profile employing 22 bursts which we chose because they show the longest andbrightest decays. This average burst profile is plotted against each burst in Fig. 3.2.
We define a few variables to help us quantify the morphology of the dip between thepeaks. First, we applied an exponential fit to the first 200 s of the slow-decay portion of theburst after the second peak. We extrapolated this fit backwards to determine the time tdip,startwhen it intercepts the first peak of the burst. The dip duration ∆tdip is the time betweentdip,start and the time of the second peak. The dip depth D is the ratio of the number ofphotons lacking under the extrapolated curve during the interval ∆tdip over the total numberof observed photons between the burst start- and end times (defined as in B13).
Time-resolved spectroscopy of the burst data was performed following the same pro-cedure and tools as in B13. The particle and cosmic background were determined withFTOOL PCABACKEST and subtracted from all spectra. Response matrices were generatedwith PCARSP (v. 11.7.1). All active PCUs were employed, and a correction was applied fordeadtime (although it is always small for the RB). Following the RXTE Cookbook prescrip-tion1, the analysis was limited to the 3 − 25 keV range, and a systematic error of 0.5% wasadded in quadrature to the statistical error of the flux in each channel. The burst data weredivided into a number of time bins, varying in duration to keep the photon count, and hencethe relative error on the derived quantities, approximately constant.
3.3 Results
3.3.1 The outbursts
Typical RB outbursts observed by RXTE prior to 1999 November tend to have a fast rise of 1to 3 d, followed by an exponential decay with an e-folding decay time of about 8 d. Initiallyonly type I bursts are observed. Type II bursts activity starts about 18 d into the outburst,when typically the bolometric flux decreased to a level of Fpers ≈ 3×10⁻⁹ erg cm−2 s−1.The first type II bursts to appear (the so-called mode-0 type II bursts) are long (200–300 s),bright (up to 3000 c s−1 PCU−1), flat-topped and short-lived, usually being visible for onlya couple of days. We inspected all the light curves visually and only found 18 mode-0 typeII bursts. Their rarity is due both to the short outburst fraction in which they are producedand to their long recurrence time, which for RB type II bursts is proportional to the fluencein a burst (the so-called relaxation-oscillator behaviour, Lewin et al. 1993). Shorter, morefrequent (the so-called mode I and mode II) type II bursts then follow for another couple ofweeks until the end of the outburst (Guerriero et al. 1999).
The 1998 August–September outburst during which bursts 35 through 37 appeared has anatypical light curve shape (see Fig.3.1), featuring a much faster decay, as well as much earliermode-0 type II bursts, which could have started already during the outburst rise (Fox et al.1998). Although no PCA coverage is available for more than three days before, the timing
1See http://heasarc.nasa.gov/docs/xte/recipes/cook_book.html
34

3.3 Results
Rap
id B
urst
er fl
ux [A
SM
c/s
day]
time [MJD]
0
10
20
30
40
50
60
51040 51050 51060 51070 51080
Figure 3.1: Daily average 3-12 keV flux of the RB measured with the All-Sky Monitor (ASM, Levineet al. 1996) on board the RXTE during the 1998 August–September outburst. The three double-peakedtype I bursts 35 through 37 occur within ≲2 h (thick black line). The 0.25 Hz QPO (see Sec.3.3.3) isvisible in the power spectra for about three days, from the beginning of the PCA observations until thedouble-peaked bursts (grey-shaded area). Long, flat-topped and very energetic type II bursts appear atthe same time (see Sec. 3.3.1).
of the three double-peaked bursts seems also quite interesting. As can be seen in Fig.3.1,these double-peaked bursts occur during the initial phase of type II bursts, at a time whenthe source is experiencing rapid and large variations in flux (‘reflares’). These considerationsmake us confident that the peculiar sequence of double-peaked type I bursts occurs close tothe onset of the type II bursting activity.
Burst 58 was observed 8 d after the start time of the PCA observations of the 1999 Octoberoutburst. In the time leading to it, 12 type I bursts are observed, and no type II bursts. Noobservation is available in the 3 d prior to burst 58, and not again until 4 d later. Short (mode-I) type II bursts are first observed 10 d after burst 58. It seems plausible that this could be amore typical outburst, and that the short-lived phase of strong, long and flat-topped (mode-0)type II bursts was missed because of the rather limited coverage around the time it could haveoccurred.
Bursts 118 and 119 took place during the last RB outburst observed by RXTE, in 2010
35

3 Double-peaked type I bursts in the RB
0 100 200
35 36 37
118 119
time[s]
58
0 100 200
35 36 37
118 119
time[s]
58
0 100 200
35 36 37
118 119
time[s]
58
0 100 200
35 36 37
118 119
time[s]
58
0 100 200
35 36 37
118 119
time[s]
58
0 100 200
35 36 37
118 119
time[s]
58
Figure 3.2: The six bursts studied here. The time axis has been shifted so that at the burst start timet = 0. The subtracted background level is measured from a 500 s time interval prior to the burst. Thecurves are normalized to their individual peak rate. The zero level is indicated by a dashed line. Eachburst is plotted against the average profile of the 22 single-peaked type I bursts featuring the longestand brightest decays (see Sec. 3.3.2). The shaded region indicates the standard deviation of the sample.The large oscillations in the decays of bursts 35 through 37 are not due to random (white) noise, but tothe 0.25 Hz QPO. They are clearly still visible in the shallower dip of burst 37, but absent in the deeperdip of burst 35. Burst 58 reaches a much larger count rate in its first peak, which makes the second peakand the QPO harder to see in this scaling.
January. Less than 12 ks of PCA data are available for this outburst, in five observationsspanning only 3 d. It is therefore difficult to assess to what extent the outburst has alreadydecayed when these bursts occur. However, starting in 2000 all outbursts recurred withina shorter time and peaked at significantly lower intensities (Masetti 2002). Therefore, theinitial type-I-only phase of the outburst can be significantly shorter. Judging from the All-Sky Monitor light curve, bursts 118 and 119 occurred no longer than 2 d after the beginningof the outburst. None the less, the presence of six more type I bursts, the burst recurrencetime (see Sec. 3.3.2), the count rate in the persistent emission and the lack of type II bursts areall consistent with what is observed in the other four double-peaked bursts, which indicates asimilar accretion state.
3.3.2 The double-peaked bursts
Light curves
Fig. 3.2 shows the six double-peaked type I bursts under analysis and Table 3.1 lists theircharacteristics. Bursts 35 through 37 occurred with a recurrence time of about 2.2 ks, whichis in the middle of the range of observed values of all RB type I bursts (B13). In bursts 35
36

3.3 Results
and 36, the dip clearly lasts longer (∆tdip = 46 s) and the flux even drops to about 5 per centbelow the pre-burst emission level. The dip in burst 37 is instead shorter, at 25 s, and the fluxonly drops to about 20 per cent of the net burst peak count rate. While the QPO is not visibleduring the dips of bursts 35 and 36, it is still present in that of burst 37.
The second peak is about 40 to 50 per cent as large as the first one. It is higher in burst 37,where it occurs earlier. The QPO modulation is clearly visible again in the second portion ofthe decays.
Looking at Fig. 3.2, it is clear that the post-dip portion of the decay is significantly brighterthan in the rest of the type I bursts sample. As a result, the bursts are also longer. If howeverone only looks at the minima of the QPO, the decays might have durations comparable tothose observed in the rest of the sample.
Burst 58 has a much dimmer second peak with respect to the other bursts, only about 15per cent above the net burst count rate, which is however still significantly above the persistentemission. It features the longest dip, at ∆tdip = 72 s, going down to just about 4 per centabove the persistent emission, but still significantly above the noise fluctuations.
The recurrence time for bursts 118 and 119 is 1.8 ks, similar to what is observed for bursts35–37. Their dips are about 30 s long, and briefly drop to count rates within 1 per cent ofthose observed right before the bursts. Like in burst 37, the QPO remains visible during thedip. Their second peaks are about 30 per cent as large as the first ones.
Spectral properties of the pre-burst emission
Burst 35 and 36 were observed during a direct pointing, while burst 37 took place in an offsetconfiguration (see Sec.3.2). The pre-burst spectrum of the RB was derived from the available182 s-long segment of the lightcurve prior to burst 37. We fitted this with a model that is agood description of all RB non-burst data (B13) and consists of a disc blackbody (Mitsudaet al. 1984), a power law and a Gaussian line at 6.4 keV. Low-energy absorption by the inter-stellar medium was taken into account using the model of Morrison & McCammon (1983),with an equivalent hydrogen column density of NH = 1.6× 1022 cm−2 (Frogel, Kuchinski,& Tiede 1995; Masetti et al. 2000; Falanga et al. 2004). The resulting blackbody tempera-ture is (2.48 ± 0.06) keV, the apparent disc radius (1.77 ± 0.06) km × (D/10 kpc)/
√cos i
(with D the source distance and i the disc inclination; for the relation between the apparentand realistic inner disc radius, see Kubota et al. 1998) and the power-law photon index is2.35 ± 0.23. The goodness of the fit is χ2
red = 1.25 for 46 degrees of freedom (d.o.f.). Wecall this the ‘RB spectrum’.
For the persistent emission prior to bursts 35 and 36, whose observations are contaminatedby the nearby source 4U 1728–34, which dominates above 20 keV, simply renormalizingthe RB spectrum according to the collimator responses (1.0 and 0.42 for the on- and offsetpointings, respectively) while leaving the other parameters frozen (under the assumption thatthe spectrum does not change significantly over the short time separating the observations)yields unacceptable fits [for burst 35, χ2
red(d.o.f.) = 53.2(51)]. We therefore also added an
37

3 Double-peaked type I bursts in the RB
Table3.1:
Propertiesofthe
double-peakedbursts
Burst
Obs
IDF
(a)
peak,1
F(b)
peak,2
E(c)
bE
sf /E(d
)b
∆t(e)
dip
D(f
)
[10−9
ergcm
−2
s −1]
[10−9
ergcm
−2
s −1]
[10−8
ergcm
−2]
[s]35
30079-01-03-00R6.0±
0.52.3±
0.623.4±
1.1(35
±6)%
4644%
3630079-01-03-00R
5.7±0.4
1.8±0.4
20.7±1.1
(34±
7)%46
56%37
30079-01-03-01R5.9±
0.52.7±
0.628.8±
1.7(31
±9)%
2511%
5840433-01-02-00R
9.5±0.5
1.1±0.3
29.9±1.5
(73±
7)%72
26%118
95410-01-01-005.2±
0.81.2±
0.317.1±
1.9(28
±6)%
3317%
11995410-01-01-00
5.4±0.8
1.2±0.3
19.1±2.1
(26±
4)%30
16%
Allfluxes
andfluences
arebolom
etric.(a
)First-peak
flux.(b)
Second-peakflux.
(c)
Burstfluence.
(d)
Fractionalfluencebefore
thedip.
(e)
Dip
duration.(f
)D
ipdepth,the
fractionofphotons
losttothe
dip.SeeSec.3.2
forexplanation.
38

3.3 Results
absorbed Comptonization model (NH = 2.4×1022 cm−2; Egron et al. 2011), which we referto as the ‘4U 1728–34 spectrum’. This fit gave χ2
red(d.o.f.) = 1.10(46) and 1.04(46) for thepersistent-emission spectrum before bursts 35 and 36, respectively.
Analogously, a persistent emission spectrum was extracted from an offset pointing 1200 safter burst 58, corrected for the collimator response, and added to a component describing 4U1728–34, for an overall good fit with χ2
red(d.o.f.) = 0.85(42). Finally, no offset observationswere available near bursts 118 and 119. Therefore, we simply fit a model similar to the onedescribed above (an ‘RB’ plus a ‘4U 1728–34’ component) to each of their pre-burst spectra,which gave χ2
red(d.o.f.) = 0.63(49) and 0.88(49), respectively.
Spectral properties of the bursts
Spectra during the bursts were modelled by the combination of blackbody radiation (leavingfree temperature and emission area, to account for the varying burst emission, and multipliedby a model for interstellar absorption with NH = 1.6 × 1022 cm−2) and the model as foundfor the non-burst spectrum discussed above, keeping the parameters of the latter fixed. Thespectral properties of the bursts are listed in Table 3.1.
Bursts 35 to 37 reach remarkably similar bolometric peak fluxes Fpeak (in units of 10−9
erg cm−2 s−1), from 5.7±0.4 to 6.0±0.5 in the first peak, while ranging from 1.8±0.4 to2.7±0.6 in the second one. Burst 58 has instead a 50 per cent brighter first peak, at Fpeak =
9.5±0.5, and a dimmer second peak, at 1.1±0.3. Finally, bursts 118 and 119 have brightfirst peaks, comparable to those of bursts 35–37, and dim second peaks like that of burst 58.Such fluxes are all significantly sub-Eddington: for the quoted distance, the Eddington fluxis FEdd = 2.1×10⁻⁸ erg cm−2 s−1 for a ‘canonical’ NS with mass M = 1.4M⊙ accretingsolar-composition material (hydrogen fraction X = 0.7).
The total burst fluence Eb spans from (17.1±1.9) to (29.9±1.5)×10−8 erg cm−2. Despiteits brighter first peak, burst 58 is not more energetic than burst 37. This is again because thereare differences in how the energy is distributed before and after the second peak: in bursts35–37, 118 and 119, 27 to 35 per cent of the fluence is emitted before the dip, and 65 to 73 percent after it. In burst 58 instead, 73 per cent of the fluence is emitted up to the dip minimumand only 27 per cent after it.
The results of the time-resolved spectroscopic analysis for burst 35 are plotted in Fig. 3.3.Two main conclusions can be drawn. First, a decreasing temperature accompanied by anincreasing radius while the flux drops out of the instrumental bandpass, the hallmarks of pho-tospheric expansion (see e.g. Galloway et al. 2008), are not visible in the spectral evolution.This is also true during the other dips. Therefore, we conclude that they are not due to PRE.
Secondly, the goodness of fits worsens during the decay into the dips of bursts 35 and 36,until χ2
red(d.o.f.) becomes as large as 8.5(27) and 4.2(26), respectively, when the count rateis roughly at the pre-burst level. We therefore examined whether the spectrum in these dipsis different from that in the persistent emission prior to the burst.
We attempted to fit the dip spectrum of burst 35 with three different models. The spectrum
39

3 Double-peaked type I bursts in the RB
Figure 3.3: Time-resolved spectroscopy of burst number 35. The top panel shows the measured full-bandpass photon count rates for the PCA Xenon layers. Following downward, the bolometric flux, theblackbody temperature and radius (assuming a distance of 7.9 kpc) and the χ2
red of the fit are plotted. Itis clear that no PRE takes place, and that during the dip the pre-burst spectrum yields an unacceptablefit (see Sec. 3.3).
40
3.3 Results
was extracted between 32 and 40 s after the burst start, when the flux is stable at about 5 percent below the count rate of the persistent emission prior to the burst (see Fig. 3.2). The modelthat fitted the pre-burst emission (see Sec.3.3.2) was unacceptable for the burst dip, withχ2red(d.o.f.) = 6.68(29). Letting the two additive components that make up the persistent
emission (the RB and 4U 1728–34 spectra) free to vary in normalization also yielded anunacceptable fit, with χ2
red(d.o.f.) = 4.18(27). This means that the fit cannot be improved bysimply allowing the normalization of the subtracted pre-burst spectrum vary, as successfullydone by Worpel, Galloway, & Price (2013) for PRE bursts. The energy dependence of theratio of the model to the data rather suggests that the discrepancy results from an intrinsicallydifferent spectral shape.
We therefore fitted the dip by keeping the 4U 1728–34 spectrum frozen and leaving freeto vary different components of the RB spectrum. The only solution with an acceptablefit required a column density NH = (6.86±0.96)×1022 cm−2, more than four times largerthan the quoted value, which we normally employ for the pre-burst emission. The requiredblackbody temperature and radius were (2.03±0.06) keV and (2.55±1.04) km. This choicegave the best-fitting model, with χ2
red(d.o.f.) = 1.28(26). Conversely, it was not applicableto the pre-burst emission, where it yielded χ2
red(d.o.f.) = 96.4(52).As a final test, we extracted the spectrum of the persistent emission 1000 s after the burst
start. In this stretch of data, the count rate is on average 2.5 per cent below the pre-burstemission. We tried to fit the spectrum of this post-burst emission with both the model for thepre-burst emission and for the dip, letting the ‘RB spectrum’ free to vary in normalizationwhile freezing all the other components. The pre-burst model gave χ2
red(d.o.f.) = 1.32(51)with a normalization 4.2 per cent lower, while the model that best fit the dip resulted in aχ2red(d.o.f.) = 79.07(51), with a 2.5 per cent higher normalization.
Therefore, the dip has a truly different spectral shape than both the pre- and post-burstemission, even though they are roughly at the same count rate.
3.3.3 Timing analysis
A timing analysis of a data set which included the double-peaked bursts 35 through 37 wasalready performed by Fox et al. (2001). However, their main focus was the search of high-frequency burst oscillations, and they calculated Fourier transforms of 1 s long data stretches,thereby ignoring the entire sub-Hz portion of the power spectrum.
For the timing analysis, we used all Good Xenon and Event data, with a time resolutionof 2−20 and 2−13 s, respectively. The Good Xenon data were rebinned to the same resolutionas the Event data. No background subtraction or dead-time correction was applied to the databefore calculating the power spectra, but type I and II bursts were removed. Following a well-established procedure (see e.g. Klein-Wolt, Homan, & van der Klis 2004), we determined thePoisson noise using the formula by Zhang et al. (1995) and then shifted it to the featurelesslevel between 3072 and 4096 Hz, a region in the power spectra dominated by photon countingnoise. This mean value was then subtracted from the power spectra. The background was
41

3 Double-peaked type I bursts in the RB
Table3.2:
Log
oftheR
XTE
timing
measurem
entsofthe
RB
powerspectralfitparam
eters
Obs
IDD
ateStarttim
etobs
rms
Qν0
SignificanceC
ountrate(U
TC
)[ks]
[%]
[Hz]
σ[c
s −1
PCU
−1]
30079-01-03a
1998A
ug22
08:10:368.7
3.93+0.95
−0.97
2.29±0.21
0.25±0.004
16.64569
40058-02-031999
Mar19
18:12:4317.2
1.91+0.84
−0.82
1.42±0.43
0.20±0.016
5.33320
40433-01-02b
1999O
ct0812:06:23
3.02.28
+0.67
−0.63
0.43±0.13
0.20±0.017
12.13555
50420-01-092001
Feb16
14:12:4511.7
5.03+1.47
−1.48
0.79±0.10
0.26±0.011
11.68266
95410-01-01c
2010Jan
1520:41:33
2.82.61
+1.06
−1.11
2.01±0.66
0.18±0.006
5.74405
Errors
onthe
parameters
were
determined
using∆χ2=
1.aIncludes
bursts35
to37.
bIncludesburst58.
cIncludesbursts
118and
119.
42
3.3 Results
calculated for each observation (Obs ID) with the FTOOL PCABACKEST over the entire energyrange. We used 128-s long segments to calculate power spectra with no energy selection.The frequency boundaries for the power spectra are therefore 1/128 Hz and 4096 Hz. Thepower spectra were normalized to the relative rms (van der Klis 1995) which yields the powerdensity in units of (rms/mean)2 Hz−1.
We scanned all the PCA power spectra. Each power spectrum was inspected by eye tolook for the presence of the LF QPO. When it is present, we fit the logarithmically sampledlow-frequency (ν < 30 Hz) portion of the spectrum with a sum of Lorentzian components,following Belloni, Psaltis, & van der Klis (2002). Each Lorentzian peaks at a frequency
νmax = ν0
√1 +
1
4Q2, (3.1)
with centroid frequency ν0 and coherence factor Q corresponding to the ratio of ν0 to theFWHM. An example of these fits can be seen in Fig. 3.4. We then integrated the fractionalrms of each Lorentzian over the whole frequency range, and over smaller energy bands, toquantify the energy dependence of the rms (see Fig. 3.5). Table 3.2 lists all observations inwhich the 0.25 Hz QPO was found, and the QPO properties.
We detect the QPO in five distinct Obs IDs, across five different outbursts. They allfeature either double-peaked type I bursts or the kind of type II bursts (long, bright, flat-topped) which are the first to appear and are only present in a short phase of an outburstdecay (see Sec. 3.3.1). The count rates vary by a factor of 2 across these observations. The fitsyielded acceptable χ2
red(d.o.f.), varying between 0.92(118) and 1.19(108), across the differentobservations. The significance of the detection, defined as the ratio of the integrated powerover its negative error varies between 5.33 and 16.64σ.
The power spectrum of the observation which includes bursts 35 through 37 is shown inFig. 3.4. This is the most significant detection of the 0.25 Hz QPO. Besides the main featurean accompanying QPO is visible at 0.1 Hz. Also present are QPOs that peak at 0.5 and 3 Hz,which are known to appear in the run-up to a large type II burst (Stella et al. 1988). Theformer is probably in a harmonic relation to the 0.25 Hz QPO.
Our newly discovered QPO, relatively well fit by a Lorentzian, covers a relatively narrowfrequency range in the different observations, between 0.18 and 0.26 Hz. Its rms amplitudevaries between (1.91±0.83) to (5.03±1.47) per cent. At its peak, it is also clearly observedin the time domain (see Fig. 3.2). As can be seen in Fig. 3.5, the amplitude seems to growmonotonically over the 2–17 keV (channels 5-64 of the PCA) energy range. The error barsare however quite large, and a constant value could also fit the rms-E relation. We performedan F-test to compare the fits for a constant value and a linear dependence on energy. Thelinear function yields a better fit, and the probability of the improvement being due to randomchance is p = 0.04. We therefore consider the growing trend real. The coherence factor Qis rather low, between 0.43 and 2.29. However, we must stress that the feature is sometimesobserved to increase in frequency during the intensity decrease that precedes the longest type
43

3 Double-peaked type I bursts in the RB
Figure 3.4: Logarithmically rebinned, power spectrum distribution of all the non-burst data in Obs ID30079-01-03, which features bursts 35 to 37. Note the QPOs at 0.1 and 0.25 Hz. This is the onlydetection of the former feature and the most significant detection of the latter. The first harmonic of the0.25 Hz QPO is also visible at 0.5 Hz.
II burst. This degrades its coherence in our fit, which is averaged over an entire observation.The weaker 0.1 Hz QPO feature was only detected on the same date as the double-peaked
bursts 35–37, while it is not present in the other power spectra, and it is poorly fit by aLorentzian. Therefore, we cannot establish whether it might be in a harmonic relation withthe 0.25 Hz oscillation, nor can we exactly quantify its amplitude or coherence. It is howeverquite a narrow feature, and it seems weaker than the 0.25 Hz QPO.
We did not fit the power spectra of the remainder of the observations, but a visual inspec-tion of the power spectra indicated that the QPO disappears as the rare, 300 s long, flat-toppedtype II bursts (which are the first to appear in an outburst, Guerriero et al. 1999) evolve intoshorter, more frequent ones at lower count rates.
3.3.4 The colour–colour diagram
There are ≃335 ks of non-contaminated exposures with 4U 1728–34 outside the FOV and theactive RB inside. We employed 16 s time resolution STANDARD 2 data for these observations
44
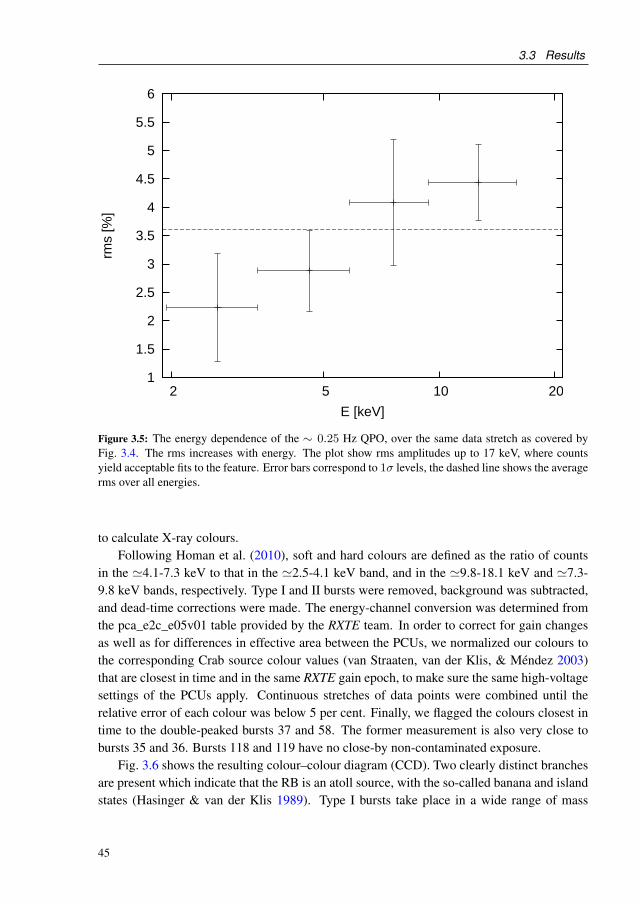
3.3 Results
rms
[%]
E [keV]
1
1.5
2
2.5
3
3.5
4
4.5
5
5.5
6
2 5 10 20
Figure 3.5: The energy dependence of the ∼ 0.25 Hz QPO, over the same data stretch as covered byFig. 3.4. The rms increases with energy. The plot show rms amplitudes up to 17 keV, where countsyield acceptable fits to the feature. Error bars correspond to 1σ levels, the dashed line shows the averagerms over all energies.
to calculate X-ray colours.Following Homan et al. (2010), soft and hard colours are defined as the ratio of counts
in the ≃4.1-7.3 keV to that in the ≃2.5-4.1 keV band, and in the ≃9.8-18.1 keV and ≃7.3-9.8 keV bands, respectively. Type I and II bursts were removed, background was subtracted,and dead-time corrections were made. The energy-channel conversion was determined fromthe pca_e2c_e05v01 table provided by the RXTE team. In order to correct for gain changesas well as for differences in effective area between the PCUs, we normalized our colours tothe corresponding Crab source colour values (van Straaten, van der Klis, & Méndez 2003)that are closest in time and in the same RXTE gain epoch, to make sure the same high-voltagesettings of the PCUs apply. Continuous stretches of data points were combined until therelative error of each colour was below 5 per cent. Finally, we flagged the colours closest intime to the double-peaked bursts 37 and 58. The former measurement is also very close tobursts 35 and 36. Bursts 118 and 119 have no close-by non-contaminated exposure.
Fig. 3.6 shows the resulting colour–colour diagram (CCD). Two clearly distinct branchesare present which indicate that the RB is an atoll source, with the so-called banana and islandstates (Hasinger & van der Klis 1989). Type I bursts take place in a wide range of mass
45
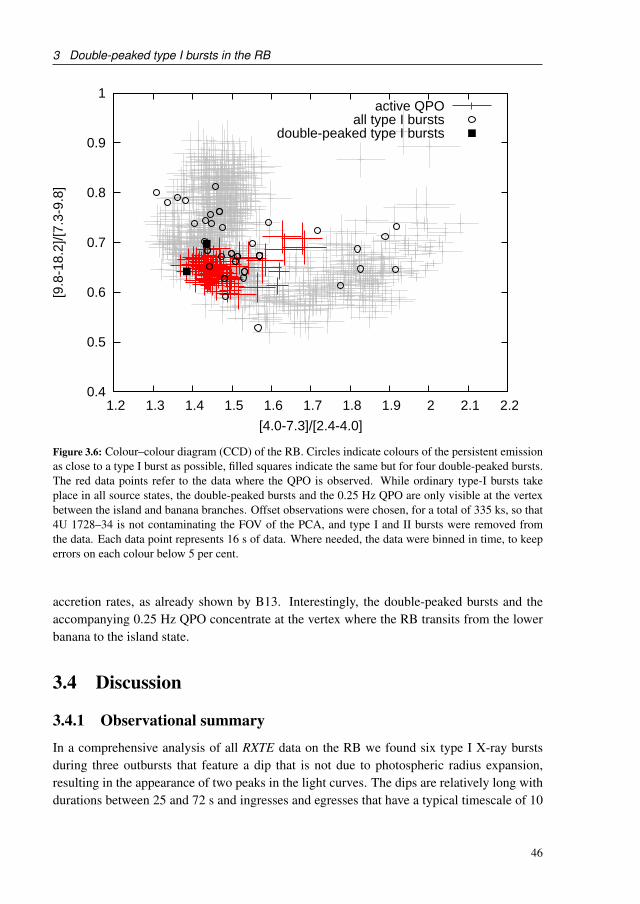
3 Double-peaked type I bursts in the RB
0.4
0.5
0.6
0.7
0.8
0.9
1
1.2 1.3 1.4 1.5 1.6 1.7 1.8 1.9 2 2.1 2.2
[9.8
-18.
2]/[7
.3-9
.8]
[4.0-7.3]/[2.4-4.0]
active QPOall type I bursts
double-peaked type I bursts
Figure 3.6: Colour–colour diagram (CCD) of the RB. Circles indicate colours of the persistent emissionas close to a type I burst as possible, filled squares indicate the same but for four double-peaked bursts.The red data points refer to the data where the QPO is observed. While ordinary type-I bursts takeplace in all source states, the double-peaked bursts and the 0.25 Hz QPO are only visible at the vertexbetween the island and banana branches. Offset observations were chosen, for a total of 335 ks, so that4U 1728–34 is not contaminating the FOV of the PCA, and type I and II bursts were removed fromthe data. Each data point represents 16 s of data. Where needed, the data were binned in time, to keeperrors on each colour below 5 per cent.
accretion rates, as already shown by B13. Interestingly, the double-peaked bursts and theaccompanying 0.25 Hz QPO concentrate at the vertex where the RB transits from the lowerbanana to the island state.
3.4 Discussion
3.4.1 Observational summary
In a comprehensive analysis of all RXTE data on the RB we found six type I X-ray burstsduring three outbursts that feature a dip that is not due to photospheric radius expansion,resulting in the appearance of two peaks in the light curves. The dips are relatively long withdurations between 25 and 72 s and ingresses and egresses that have a typical timescale of 10
46

3.4 Discussion
s. In two bursts, the dips drop for about 10 s below the pre-burst flux level, by up to 5%.The dip is therefore also in the persistent emission, although never outside a burst. When thathappens, the spectral shape is different from the pre-burst spectrum with an increase of theabsorption column density by a factor of 4. After the burst, the persistent emission recoversits pre-burst spectral shape. Such a peculiar and repetitive morphology of type I burst lightcurves has, to the best of our knowledge, never been observed before (see Sec. 3.4.2).
With respect to the other type I bursts from the RB, the duration of the double-peakedbursts seems longer and the decays after the second peak brighter, but that may be due to theaddition of the QPO on the tail and not on the first peak. The fluence of the bursts rangesbetween 17.12 and 28.80×10⁻⁸ erg cm−2. This compares with 17.6 to 51.5×10⁻⁸ erg cm−2
for the other 121 bursts (B13). If the dips hide part of the actual fluence, the total fluencewould be between 10 and 50% larger, varying between about 20 and 37×10−8 erg cm−2.Instead, the pre-dip fluence alone is between 4.80 and 9.01×10⁻⁸ erg cm−2 which is signifi-cantly below the lowest value for all other bursts. These ranges are a strong indication that thesecond peaks are thermonuclear in nature and not, for instance, completely due to accretion.The other burst properties, like peak flux, rise and recurrence times are quite unremarkablecompared to the rest of the sample. However, it must be noted that the recurrence time of thebursts spans a rather limited range, between 1.7 and 2.2 ks, and that they appear at similarpersistent count rates. B13 showed that the RB produces bursts over a very large range ofpersistent fluxes, and that the recurrence timescales varies accordingly. It seems thereforelikely that the double-peaked bursts are peculiar to a limited range of mass accretion rates.
RXTE data of the RB suffer from contamination of another bright LMXB in the sameFOV: 4U 1728–34. This does not affect the analysis of X-ray bursts since those of the RBare easily discerned from those of 4U 1728–34, but the analysis of the non-burst radiationis seriously affected, which precluded thus far the identification of the RB as an atoll or Z-source (Rutledge et al. 1995). However, a portion of the observations were pointed such that4U 1728–34 is outside the FOV, while the RB remains inside, though at a less favourableoff-axis angle. Thanks to the large size of the data set collected by RXTE during its mission,we generated a CCD from these data and are able, for the first time, to identify the RB asan atoll source with unambiguous ‘island’ and ‘banana’ branches (Hasinger & van der Klis1989).
The double-peaked bursts seem to occur at a phase in the decay of the transient outburstwhen type II bursts commence, as signalled by the presence of very energetic, flat-toppedand long type II bursts (Guerriero et al. 1999). Furthermore, the double-peaked bursts arecoincident with a special location in the CCD – the vertex where the source transits betweenthe banana and the island state, indicating a change in the accretion-flow geometry (van derKlis 2006).
The non-burst light curve also shows a peculiar feature, around the double-peaked bursts:a QPO with a typical frequency of about 0.25 Hz. This QPO is present before and afterthe bursts, and during the second peak of the bursts. The amplitude peaks at 5.03±1.47%fractional rms. Notably, it is absent during the first burst peak and the deep dips. It remains
47

3 Double-peaked type I bursts in the RB
visible during shallow dips with a smaller amplitude. When compared to other type I burstsfrom the RB and considering the depth of the deepest dips, this strongly suggests that theQPO represents an additional radiation component to the burst and the persistent emission.
We searched all RXTE data on the RB and found a total of five statistically significantdetections (see Sec. 3.3.3). The feature is present in all the consecutive power spectra thatmake up each observation and it also always lies in the same portion of the CCD across fivedifferent outbursts, at the transition between the island and banana states. Furthermore, allthe observations featuring the 0.25 Hz QPO coincide with either double-peaked bursts or thekind of type II bursts (long, bright, flat-topped) which only appear in a short-lived phase ofan outburst decay (Guerriero et al. 1999).
The observations of mid-burst dips during type-I X-ray bursts and the simultaneous be-haviour of the 0.25 Hz QPO at a state transition are unique. How do they come about andhow are they related to each other? Why do they take place during a state transition? Arethey related to the unique type II bursting behaviour of the RB and, if so, can they provide usfurther constraints on the origin of that behaviour?
3.4.2 Nature of the dips
Other LMXBs exhibit double-peaked bursts that are not due to PRE. For example 4U 1636-53 shows bursts with two (Sztajno et al. 1985; Bhattacharyya & Strohmayer 2006a,b) andeven three peaks (van Paradijs et al. 1986; Zhang et al. 2009). However, the timescales forthis source are different than for the RB (the peaks are separated by at most 5 s) and theflux never drops below the pre-burst emission. The similarities are that the peak flux is alsoa factor of 2 to 3 below the Eddington limit, the inferred mass accretion rate is relativelylarge and the bursts concentrate around the vertex of the island/banana branch of the CCD.Non-PRE double-peaked type I bursts have also been observed from 4U 1608–52 (Penninxet al. 1989), GX 17+2 (Kuulkers et al. 2002) and 4U 1709–267 (Jonker et al. 2004), all withdurations shorter than 20 s.
There is great diversity in the observations of other sources, precluding a single explana-tion for all irregularities. The double-peaked bursts in the RB are no exception: they too areunique, particularly because of relatively long time scales for the dip ingress and egress andthe simultaneous QPO behaviour. We will now discuss several explanations for the double-peaks phenomenon in the other sources.
Two-stage energy release on the surface?
One possibility is that the multiple peaks are the result of a variation in either the rate at whichthe energy is transported to the surface of the NS, or in the rate at which energy is released inthe flash. A shear instability could mix layers which have undergone a thermonuclear flashwith unburnt material lying above them (Fujimoto et al. 1988), or there could be a waitingpoint in the rp-processes (Fisker, Thielemann, & Wiescher 2004). However, it is difficultto keep unburnt fuel above burnt material without the two mixing (Spitkovsky, Levin, &
48

3.4 Discussion
Tabl
e3.
3:M
echa
nism
sfo
rthe
dips
and
QPO
Mod
elB
urst
sQ
POA
ccre
tion
stat
eD
oubl
epe
aks(a
)∆t(b)
dip
Spec
trum
(c)
ν 0rm
srm
s(E
)(d)
Soft
/Har
d(e)
Type
IIbu
rst(f
)
Unb
urnt
laye
rY
PN
......
......
...R
eact
ion
chai
nst
allin
gY
NN
......
......
...E
quat
oria
lsta
lling
YP
N...
......
P...
Mag
netic
confi
nem
ent
YP
N...
......
N...
Bur
st-i
nduc
edco
rona
NN
Y...
......
......
Mar
gina
lly-s
tabl
ebu
rnin
g...
......
NY
NY
...H
igh
incl
inat
ion
(dip
per)
YY
YY
YN
N...
Dis
c–m
agne
tosp
here
inst
abili
ty...
......
YN
YN
YL
owin
clin
atio
n,tw
och
anne
lsY
PY
P...
...Y
P
The
tabl
eco
mpa
res
the
prop
ertie
sof
the
burs
ts,
the
QPO
and
the
sour
cest
ate
agai
nst
the
pred
ictio
nsm
ade
byth
eva
riou
sm
odel
sdi
scus
sed
inSe
c.3.
4.Y
/N(y
es/n
o)in
dica
tes
that
the
mod
elca
n/ca
nnot
expl
ain
the
prop
erty
ina
give
nco
lum
n.T
hesy
mbo
lP(p
ossi
ble)
indi
cate
sth
atth
em
odel
mig
htbe
able
toex
plai
nth
epr
oper
tyif
cert
ain
cond
ition
sar
em
et.
An
empt
yfie
ldin
dica
tes
that
the
mod
elm
akes
nosp
ecifi
cpr
edic
tion
for
that
prop
erty
.(a
)N
on-P
RE
,dou
ble-
peak
edbu
rsts
;(b)di
pdu
ratio
n;(c)en
hanc
edab
sorp
tion
inth
edi
psp
ectr
uman
ddi
pgo
ing
belo
wth
epe
rsis
tent
flux
leve
l;(d
)Q
POfr
actio
nala
mpl
itude
grow
ing
with
ener
gy;(
e)ap
pear
ance
ofth
edi
pan
dth
eQ
POon
lyat
the
soft
/har
dtr
ansi
tion;
(f)ap
pear
ance
ofth
edi
pan
dQ
POat
the
sam
etim
eas
the
first
type
IIbu
rsts
.
49

3 Double-peaked type I bursts in the RB
Ushomirsky 2002), or to have the burning reaction chain stalling as long as the dips aresometimes observed to last (Bhattacharyya & Strohmayer 2006a).
Other explanations discussed in literature involve stalling of the burning front. For a weakburst with high-latitude ignition, the spreading of the flame could stall at the equator if that iswhere most of the disc material is accreted (Bhattacharyya & Strohmayer 2006a). Otherwise,a temporary boosting of the magnetic field B, due to the motion of the fluid upon ignition,could temporarily confine the burning region (Cavecchi et al. 2011). Obviously B is notexpected to be different for the double-peaked bursts and the rest of the RB bursts, nor is thefuel composition, given their similar timescales and energetics. The ignition location and themass-accretion rate are therefore the remaining possible triggers for a confining mechanismthat could give rise to the double peaks. Perhaps high-latitude ignition could be rare enoughto only happen in 6 bursts out of 125, although these are not among the weakest in the sampleas observed for double-peaked bursts in 4U 1636–53 (Bhattacharyya & Strohmayer 2006a).On the other hand, the possibility of magnetic confinement is at odds with the fact that theRB double-peaked bursts occur in a limited range of intermediate mass-accretion rates, withsingle-peaked bursts being observed at both higher and lower M .
Transient obscuration from the disc?
Generally speaking, all the scenarios discussed above revolve around phenomena confinedto the surface. None of them can therefore explain why, in bursts 35 and 36, the flux dropsbelow pre-burst levels while the absorption column density increases. The accretion flow,responsible for the non-burst emission, must clearly also be affected.
For example, the multi-peaked structure could result from scattering of the X-rays bymaterial evaporated from the accretion disc during the flash, forming a burst-induced accre-tion disc corona. Models seem however to require Eddington-limited bursts (Melia & Zylstra1992), and indeed observations of radiative or dynamical interactions with the accretion dischave so far been limited to very energetic PRE bursts (in’t Zand et al. 2011, 2013; Degenaaret al. 2013). Instead, the double-peaked bursts in the RB are sub-Eddington by at least afactor of 2, implying that the burst flux delivers insufficient radiation pressure to influencethe accretion flow. Even resorting to beaming, to raise the flux in a direction outside the lineof sight to a sufficient level, the problem remains that the timescales are dynamical in natureand much shorter than those observed (e.g. Melia & Zylstra 1992).
The energetic properties of these bursts are unremarkable with respect to the rest of thetype I sample, which makes explaining their exceptionality difficult. None the less, the dipsseem to be initiated by the bursts, responding to the burst with a delay of about 10 s. As away around this, the origin of the dips might lie in a short-lived, peculiar geometry of theinner accretion flow rather than in the bursts themselves.
For a scenario that is independent of burst properties and features longer dips, one canlook at dipping sources. These show periodic dips in their light curves that are thought tobe caused by periodic obscuration of the central source by a structure formed in an interplay
50

3.4 Discussion
between the gas stream from the companion and the accretion disc (White & Swank 1982).Therefore, they have generally been inferred to be at inclination angles larger than 60° (Frank,King, & Lasota 1987), unless the splash traverses over the compact object to the other sideof the accretion disc (e.g., Armitage & Livio 1998).
The depth, duration and spectral properties of the dips vary from source to source andfrom cycle to cycle (Parmar & White 1988). The timescale of the dips in the RB is similar tothat shown by some dipping sources (e.g. Kitamoto et al. 1984), and, as we said, the fact thatthe dips go twice below the pre-burst flux indicates that, as in dipping sources, the persistentemission is also partially obscured. Most importantly, the RB dips spectrum is consistent witha larger portion of the flow coming in the line of sight. Unlike in all other sources, however,in the RB the dips only occur during bursts. Likely this means that the inclination angle islower, since at a high inclination angle dips in the persistent emission should also be visible.
None the less, obscuration phenomena of the surface might be possible even at low incli-nations. 3D MHD simulations by Romanova et al. (2008, 2012) and Kulkarni & Romanova(2008) showed that two different regimes of accretion on magnetized stars like AMXPs arepossible in presence of a tilt (≲ 30°) between the rotational axis and the magnetic dipole. Atlarge M , in what they call the ‘boundary layer’ regime, matter can accrete directly throughthe magnetosphere via narrow and tall ‘tongues’ due to Raleigh-Taylor instability, forming abelt-shaped hot region on the surface of the star. Instead at lower M , in the so-called ‘magne-tospheric regime’, the accretion flow forms few (two or four) ordered funnel streams towardsthe magnetic poles.
If these predictions are correct, for a low inclination the appearance of obscuring funnelsis indeed to be expected as M goes down. Furthermore, as these funnels are nothing buttransient accretion episodes at low M , they might help explain the onset of the type II burstactivity at the transition from the soft to the hard state. However, if this change in geometry isbehind the obscuration, it remains unclear why double peaks would not be an overall charac-teristic of all bursts in the low M state, and also whether the a burst–funnel interaction couldreproduce the observed dip durations.
3.4.3 Nature of 0.25 Hz QPO
QPOs in LMXBs, no matter how difficult to explain, are always ascribed to a phenomenonin the accretion flow (see van der Klis 2006, and references therein). The only exceptionsare mHz QPOs which are thought to be due to marginal nuclear burning on the NS surface(Revnivtsev et al. 2001; Heger, Cumming, & Woosley 2007). However, those QPOs areinterrupted by type I X-ray bursts (Altamirano et al. 2008) and have frequencies one to twoorders of magnitude smaller than the 0.25 Hz QPOs in the RB. Thus, it is most likely that thedipping behaviour and the 0.25 Hz QPO in the RB are related to the accretion flow.
We explore in this section two possible scenarios to explain the QPO: periodic obscura-tions and modulation of the accretion flow via interactions between the disc and the magne-tosphere.
51
3 Double-peaked type I bursts in the RB
QPOs in dipping sources
At least three dipping bursting LMXBs (XB 1323–619, Jonker et al. 1999; EXO 0748–676,Homan et al. 1999; and 4U 1746–37, Jonker et al. 2000) show ∼1 Hz QPOs. Their rmsamplitudes are about 10 per cent, and the energy dependence of the rms amplitude is nearlyflat. The fractional rms amplitude was found to be consistent with being constant during thepersistent emission, the X-ray dips and, most importantly, type I X-ray bursts. The fact thatthe ∼1 Hz QPOs persist during a dip with unchanged rms indicates that they are formed in aregion at a smaller radius than that where the obscuration takes place.
It seems therefore likely that the ∼1 Hz QPOs detected in dipping LMXBs are causedby matter periodically obscuring our line of sight to the NS, perhaps due to Lense-Thirringprecession of a tilted inner accretion disc around a compact object (Homan 2012). Despite therough match in frequency and amplitude, no dips have ever been observed in the persistentemission of the RB outside a burst, which seems at odds with a system viewed at a highinclination. Also, the ∼1 Hz QPOs of dipping sources span a much larger range of accretionstates, whereas the QPO in the RB appears to be confined to the transition between the islandand banana states. Therefore we consider this scenario not likely to explain the 0.25 Hz QPOin the RB.
QPOs from disc–magnetosphere interactions
First reported by van der Klis et al. (2000), the 1 Hz QPO that is observed in the final stagesof the outbursts of SAX J1808.4—3658 was extensively studied by Patruno et al. (2009).They report a QPO frequency in the (0.8–1.6) Hz range, and an rms amplitude that growsmonotonically with energy up to about 17 keV. A 1 Hz QPO of similar properties has beenreported from NGC 6440 X-2 by Patruno & D’Angelo (2013), who suggest this feature hasthe same origin in both these AMXPs.
The most likely origin for the QPO is an accretion flow instability arising at the inneredge of the disc (Patruno et al. 2009). Among the variety of mechanisms at hand, the mostpromising seems to be the one first proposed by Spruit & Taam (1993) and further exploredby D’Angelo & Spruit (2010, 2012). In this model, an instability can develop when the mag-netosphere truncates the inner accretion disc at a radius rin that is outside but still close tothe corotation radius rcor. A new disc solution known as ‘dead disc’ is then found (Sun-yaev & Shakura 1977; D’Angelo & Spruit 2010, 2012) which is alternative to the ‘propeller’regime (Illarionov & Sunyaev 1975), where the transfer of angular momentum effectivelyexpels matter from the system, and the inner disc radius keeps increasing as M decreases.When rin ≳ rcor the transfer of angular momentum happens from the NS to the disc, spin-ning down the NS and changing the radial gas density distribution at the inner disc regionwithout matter expulsion. In a dead disc, rin does not evolve far from rcor and the matterkeeps flowing in from the outer disc regions piling up there. If certain conditions are metat the magnetosphere–disc interaction (D’Angelo & Spruit 2010, 2012) a critical pressure iseventually reached under which the gas slips inside rcor, thereby initiating a sudden accretion
52

3.4 Discussion
event. After that, the accumulated mass reservoir is depleted, and a new cycle begins.This instability is a potentially interesting model for the 0.25 Hz QPO in the RB. The
frequency of the instability depends on the viscous timescale at the inner disc edge, which inturn depends on the mass accretion rate and on the location of the inner disc (see e.g., Eq. 9in Patruno & D’Angelo 2013). Unfortunately, the inner disc radius is not known for the RB,since neither the spin frequency of the NS nor the strength of its magnetic dipole are known.
Also, a slightly growing rms-E relation is observed in the RB, which is also observed inthe other two sources. While the increase is weaker than in SAX J1808.4—3658 or NGC6440 X-2, this can be explained with the smaller fractional amplitude of the QPO in theRB. Patruno & D’Angelo (2013) explain the monotonic increase in rms with energy in SAXJ1808.4—3658 and NGC 6440 X-2 arguing that as the instability is caused by changes inM , and the latter change the density and temperature of the corona where the photons areupscattered, the QPO fluctuations will translate to a varying hardness of the spectrum, makingthe high-energy flux more variable than the low-energy one. In case of a strong persistentemission, as is the case in the RB, the effect will obviously be weaker.
Differences are, however, clearly present. The QPO in the two AMXPs cannot be fittedwith a Lorentzian because of its fast decline in power at low frequencies. This is however notseen in the RB QPO. Furthermore, the rms amplitude of the QPO is more than one order ofmagnitude larger in the two other sources than in the RB. This is because nearly no accretiontakes place during the QPO minima in SAX J1808.4–3658 and NGC 6440 X-2, which showthe oscillation at moderately low luminosities. The higher count rates and the different QPOshape observed in the RB are therefore challenging to this scenario. Even though the resultsfrom D’Angelo & Spruit (2010) show that for certain ranges of parameters accretion can infact continue to take place in the minima of the QPO, the instability is predicted to produce amuch larger modulation of the mass accretion rate M than observed in the RB, when at thetime of the double-peaked bursts M ≃ 4 × 10⁻⁹M⊙ yr−1, roughly one order of magnitudelarger than what observed in the two other sources at the time of the appearance of the QPOthere.
If however we again invoke a two-channel accretion (see Sec. 3.4.2), with a polar and anequatorial channels, one controlled by the instability and the other one unaffected by it, thelower amplitude would naturally follow. For example, while the centrifugal barrier could actto modulate the equatorial accretion, matter could be leaking from above and below it, andaccrete along the B lines.
Also involving two-channel accretion, the disc–magnetospheric interactions described inRomanova et al. (2008) and Kulkarni & Romanova (2008) can as well explain the appearanceof periodicities in the lightcurve, via accretion-induced hotspots. While at high M sporadi-cally forming ‘tongues’ hit the star in random places, so that the light curve is irregular, at lowM the funnels driving matter from the disc to the magnetic poles are relatively stable, so thatthe position of the hot spots is almost constant, resulting in a modulation of the lightcurve.Again, the problem with this model is that it does not explain why the QPO is short-lived,rather than being an overall characteristic of the island state.
53

3 Double-peaked type I bursts in the RB
3.4.4 Linking the dips and the QPO
In Table 3.3 we list the possible scenarios for the dips and the QPO, and which relevantobservables they are capable of explaining.
The only model that is not ruled out by any observable involves a relatively short-livedaccretion state consisting of two different accretion channels, an equatorial and a polar one,in a system viewed at low inclination. As part of the inner accretion flow in this particularstate goes along the magnetic field lines to the NS poles, it is then easier for material to comein the line of sight if the inclination angle is low, and for the burst to disturb the accretionflow, thereby causing the flux to dip below the pre-burst level, even if the burst flux is sub-Eddington.
Since the 0.25 Hz QPO disappears during some of the dips, its place of origin would alsoseem to be obscured by the same material. This suggests that the QPO originates close to theNS and closer than the X-ray emitting part of the accretion disc. The latter region probablyreaches out to 104 km (Mitsuda et al. 1984; Makishima et al. 1986), so the obscuring mate-rial would have to be substantially closer than that. If the QPO originates in the equatorialflow, the accretion channel along the magnetic field could be disturbed by the burst so that,given the low inclination, the radiation from the NS surface and the equatorial flow wouldbe obscured, making the dips deeper than the pre-burst emission and causing the temporarydisappearance of the QPO. If instead the QPO originates in the disrupted polar flow, its disap-pearance at the time when the dips are deeper than the pre-burst emission would still naturallyfollow.
To match the observations, this peculiar configuration should be short-lived, appearingroughly at the same time when the type II burst do, and disappearing within days. It is gener-ally thought that in the banana state, at larger mass-accretion rates, a geometrically thin andoptically thick disc probably extends down to very close to the NS surface, whereas the lackof dips in the island state, at lower mass-accretion rates, could be due to a quasi-sphericallysymmetric accretion via an optically thin corona (see e.g. review by Done, Gierlinski, & Kub-ota 2007). The rarity of the double-peaked bursts and of the 0.25 Hz QPO would then matchthe fact that they occur in a particular accretion state of the RB, when part of the accretionflow is starting to become diverted to the type II bursting mechanism.
3.5 Conclusions
We have reported the coincident observation of non-PRE, double-peaked type I bursts and anLF QPO with a frequency of about 0.25 Hz. They occur at the transition from the banana tothe island state, when the geometry of the accretion flow is expected to change. This transitionalso coincides with the appearance of type II bursts. Despite being sometimes at roughly thesame count rate as the pre-burst persistent emission, the dip between the two peaks has adistinctively different spectrum, with a much larger hydrogen column density required to fitthe data. This is suggestive of some kind of temporary obscuration of the NS surface. Also,
54
3.5 Conclusions
the dips in two bursts go below the pre-burst emission level, meaning part of the accretionflow is also obscured, or perhaps even disrupted. No dips are ever observed in the persistentemission outside a burst.
We have explored several models to explain the dips, the QPO, and the peculiar accretionstate in which they appear, including confining mechanisms on the NS surface, obscurationof the surface and inner accretion flow in a high-inclination system, and accretion instabilitiesborne out of the interaction between the accretion disc and the magnetosphere.
Although no single model can explain all the observables, we favour a two-channel ac-cretion state, transitional between the soft and hard state. Mass accretion on to the magneticpoles would allow for the burst to disturb the accretion flow even if the burst flux is sub-Eddington. If the source is viewed at a low inclination, the temporary disruption of the polaraccretion channel by the burst could then obscure the NS surface, which would cause the fluxto go below its pre-burst level, and in some cases even the inner equatorial accretion flow. Ifthe instability causing the QPO controlled the equatorial channel, the disappearance of theQPO in the deepest dips could also be explained.
Further investigation is necessary to develop this model beyond this qualitative picture. Itremains to be seen whether such an accretion geometry could indeed be sustainable, confinedto a very narrow range of accretion rates, and whether this scenario could reproduce the fairlylong dips. The difficulty of constraining such a model notwithstanding, the obscuration thatis responsible from the dip must be connected with the disc instability that is responsible forthe QPO and the type II bursts.
AcknowledgementsWe wish to thank Diego Altamirano, Yuri Cavecchi, Jeroen Homan, Daniela Huppenkothenand Hauke Worpel for useful discussions and occasional guidance offered during the prepa-ration of this paper. TB and AW are members of an International Team in Space Science ontype I X-ray bursts sponsored by the International Space Science Institute (ISSI) in Bern, andwe thank ISSI for hospitality during part of this work.
55

4A population study of type II bursts in
the Rapid Burster
T. Bagnoli, J.J.M. in ’t Zand, C.R. D’Angelo and D.K. Galloway
Published in Monthly Notices of the Royal Astronomical Society, Volume 449, Issue 1,p.268-287 (2015)
Abstract
Type II bursts are thought to arise from instabilities in the accretion flow on to a neutronstar in an X-ray binary. Despite having been known for almost 40 years, no model can yetsatisfactorily account for all their properties. To shed light on the nature of this phenomenonand provide a reference for future theoretical work, we study the entire sample of Rossi X-rayTiming Explorer data of type II bursts from the Rapid Burster (MXB 1730–335). We find thattype II bursts are Eddington-limited in flux, that a larger amount of energy goes in the burststhan in the persistent emission, that type II bursts can be as short as 0.130 s, and that thedistribution of recurrence times drops abruptly below 15–18 s. We highlight the complicatedfeedback between type II bursts and the NS surface thermonuclear explosions known as type Ibursts, and between type II bursts and the persistent emission. We review a number of modelsfor type II bursts. While no model can reproduce all the observed burst properties and explainthe source uniqueness, models involving a gating role for the magnetic field come closest tomatching the properties of our sample. The uniqueness of the source may be explained by aspecial combination of magnetic field strength, stellar spin period and alignment between themagnetic field and the spin axis.

4 The RB type II burst population
4.1 Introduction
X-ray bursts observed in accreting neutron stars (NS) in low-mass X-ray binaries (LMXBs)come in two types, sometimes similar in appearance (∼ 1 min timescales, 1038 erg s−1
peak luminosities) but thought to be due to very different mechanisms, because of the largedifference (by factors ∼ 102) in average power.
Type I bursts arise from the heating and cooling of the NS photosphere after a thermonu-clear shell flash of accreted material (see reviews by Lewin, van Paradijs, & Taam 1993,Strohmayer & Bildsten 2006, Galloway et al. 2008). This is consistent with thermal spectraof varying temperature and roughly constant emitting area. Despite some remaining openquestions (e.g., Cornelisse et al. 2003, Suleimanov, Poutanen, & Werner 2011, Watts 2012),a general understanding of the physics underlying type I bursts has been reached, also thanksto the wide range of circumstances in which they occur (type of LMXB, accretion rates, etc.)provided in particular by the relatively large amount of bursters (over a hundred).
Type II bursts remain largely a puzzle. Soon after their discovery, Hoffman, Marshall, &Lewin (1978) showed that their short recurrence times rule out the possibility that they arepowered by nuclear burning, ascribing the source instead to gravitational potential energy.Little more is understood about their origin, also because they are only confidently detectedin two sources: the Rapid Burster (MXB 1730–335, hereafter RB), a recurring transientwhich is the object of this study and which also exhibits type I bursts, and the Bursting Pulsar(BP), a slowly rotating (2 Hz) accretion-powered pulsar (Kouveliotou et al. 1996).
One of the first properties of type II bursts discovered in the RB is the relaxation-oscillatorbehaviour: the fluence in a type II burst is proportional to the waiting time to the next burst(Lewin et al. 1976). This is not observed in the BP (Kouveliotou et al. 1996). The relaxation-oscillator behaviour seems to point to the presence of a mass storage from which matter canbe released and then replenished at a constant rate, so that the amount of depleted materialdetermines the time to refill the buffer (Lewin et al. 1993). The accretion disc is the mostobvious candidate for this buffer and all proposed models involve one (e.g., Walker 1992;Spruit & Taam 1993). The various timescales at different positions in the disc can helpto explain the range of observed type II burst timescales, while a key role in acting as agating mechanism might be played by a magnetic field (e.g., recent simulations by Kulkarni& Romanova 2008; D’Angelo & Spruit 2010; Romanova et al. 2012; D’Angelo & Spruit2012).
Notwithstanding that models involving some role for the NS magnetic field seem promis-ing, the strength of the magnetic field is unfortunately not known in the RB due to the lackof pulsations. For the BP, estimates of the surface strength of the dipolar component of themagnetic field B put it in the range (2 − 6) × 1010 G (Degenaar et al. 2014). While this islarger than in typical NS LMXBs (Lewin et al. 1993), it is not unique among bursters (esti-mates put the magnetic field of the NS in IGR J17480–2446 at 109 − 1010 G; e.g., Cavecchiet al. 2011). Therefore, at least another parameter besides the magnetic field strength (e.g.,the stellar spin, or the inclination of B with respect to the stellar spin axis) must determine
58

4.2 Observations
the type II burst occurrence.Bagnoli et al. (2013, hereafter B13) have shown that thermonuclear (type I) X-ray bursts
in the RB occur over an unusually large range of accretion luminosities, from about 45 percent of the Eddington luminosity LEdd (assuming it is located in the globular cluster Liller 1at a distance of 7.9 ± 0.9 kpc; Valenti, Ferraro, & Origlia 2010) down to almost quiescence(Masetti et al. 2000). However, while the type I bursts span the entire range of luminosities,type II bursts only appear below a critical luminosity of about 10 per cent LEdd (Guerrieroet al. 1999, B13). Hence, there are a type-I-only phase and a mixed phase.
The type-I-only state is a soft state because the persistent emission spectrum is dominatedby a disc blackbody component, and it spans the range 10–45 per cent of LEdd. This is almostunique among type I burst sources: all other bursters show nearly no type I bursts aboveL ∼ 0.1LEdd (Cornelisse et al. 2003), except for the slow (11 Hz) pulsar IGR J17480–2446(Linares et al. 2012). The abundance of type I bursts in the RB above this threshold promptedB13 to propose that it is a slow rotator too, and to speculate that this might actually be one ofthe necessary ingredients for producing type II bursts.
As the RB exits the soft state, the first type II bursts appear. These first type II burstsare the most energetic, long and infrequent. A brief (typically a few days) intermediate stateexists in which these are accompanied by double-peaked type I bursts and a QPO at 0.25 Hz(Bagnoli et al. 2014, hereafter B14). The unusual shape of the type I bursts found in thisshort-lived intermediate outburst phase seems to be due to a temporary obscuration of the NSsurface during the burst decay, producing the double peaks. The ensuing type II bursts, theobscuration phenomenon and the occurrence of a QPO are probably related to the change inthe accretion geometry that is widely thought to take place between the soft and the hard state(e.g., review by Done, Gierlinski, & Kubota 2007, and references therein).
Having studied the soft and intermediate states in our aforementioned papers, we nowcomplete our study of the entire Rossi X-ray Timing Explorer (RXTE, 1995–2012) RB database by focusing on the type-II-burst-dominated hard state, so called because of the power-law component that dominates the persistent emission spectrum. We aim at constructing apopulation study of type II bursts to compare it with the predictions of the few availabletheoretical models, and as a future reference. In Sec. 4.2, we introduce the data set, and inSec. 4.3 we illustrate our methodology. In Sec. 4.4, we present the type II burst properties andtheir relationship with the persistent emission and the type I bursts, taking advantage of theunprecedented detail provided by the RXTE data. We summarize our findings, some of whichwere previously unknown, in Sec. 4.5, and discuss their physical implications in Sec. 4.6.Finally, in Sec. 4.7 we review proposed theoretical models, checking their predictions againstthe properties of our sample.
59

4 The RB type II burst population
100
101
102
103
104
105
06/2022 23 24 25 26 27 28 29 30 07/01 02 03 04 05 06 07 08 09 10 11 12 13 14 15
10-1
100
101
102
103
c/s/
PC
U
Fbo
lun
abs [1
0-9 e
rg/s
/cm
2 ]
outburst June-July 2006
100
101
102
103
104
105
06/2022 23 24 25 26 27 28 29 30 07/01 02 03 04 05 06 07 08 09 10 11 12 13 14 15
10-1
100
101
102
103
c/s/
PC
U
Fbo
lun
abs [1
0-9 e
rg/s
/cm
2 ]
outburst June-July 2006
mode 0 mode 0 -> 1 mode 1
mode 1 -> 2 mode 2 mode 2 -> quiescence
Figure 4.1: Sandwiched light curve of the observations of the outburst starting on 2006 June 20, forthe complete PCA bandpass at 1 s resolution resolution. Each consecutive data stretch is typicallyabout 3000 s long. Data gaps mark jumps in time when there were no observations. Photon count rateper PCU is on the left y-axis, unabsorbed bolometric flux on the right y-axis. The horizontal dashedline indicates the Eddington luminosity, with the grey-shaded area indicating the uncertainties on thedistance and the spectral fit (see Sec. 4.3.1). Count rates are not background subtracted in this plot,but are corrected for the number of active PCUs and the collimator response. (throughout the restof the paper, the background counts have been subtracted). 4U 1728–34 was never in the FOV. Thenon-zero count rates before the onset of the outburst are therefore due to the instrumental backgroundand the galactic ridge emission (see fig. 2 in Valinia & Marshall 1998). The insets show the varying(following in time left to right, top to bottom) type II bursting modes during the outburst decay. Eachinset shows 1 ks of data, plotted logarithmically between 50 and 5000 c s−1PCU−1. This outburstshows the prototypical sequence mode 0 → mode 1 → mode 2 in bursting behaviour. The soft state,however, does not appear at the beginning of the outburst, hence preceding the type II bursting phaseas in most cases, but it is briefly entered by the RB around June 27, giving rise to the long flat peakaround that date. Note that the shorter plateau visible on June 26 is actually the longest type II burst inour sample, at about 1100 s (see Sec. 4.4.2).
60
4.2 Observations
4.2 Observations
4.2.1 The general sample and burst identification
This study is about measurements with the Proportional Counter Array (PCA) onboard RXTE.It consists of five co-aligned proportional counter units (PCUs) that combine to a total photoncollecting area of 8000 cm2 over a 2 to 60 keV bandpass (Jahoda et al. 2006).
Nearly all RXTE observations of the RB (exposure time 2.4 Ms) were carried out in oneof three configurations. For 553 ks, the PCA was directly pointed at the source. Theseobservations are contaminated by the presence of the persistently bright 4U 1728-34 at anangular distance of 0°.56. For 612 ks, the pointing was offset by just this amount, thusavoiding the contamination at the expense of roughly half the effective area. Finally, for1.3 Ms the PCA was pointed at 4U 1728-34, serendipitously encompassing the RB. We haveinvestigated all of the 2.4 Ms of data.
We extracted a light curve from the ‘STANDARD-1’ data for all the observations contain-ing the RB in the field of view (FOV). These data have 0.125 s time resolution and no photonenergy resolution. The telescope orientation was determined with the FTOOL PCACLRSP, anddeemed stable if the jitter was below 20 arcsec.
We performed a visual inspection of all the light curves. For the details of source (RBversus 4U 1728-34) and burst (type I versus type II) identification, we refer the reader toAppendix 4.A. In total, we identified 123 type I and 8458 type II bursts from the RB.
4.2.2 Type II bursting modes
As already mentioned, type II bursts are only emitted by the RB at persistent luminositiesbelow 10 per cent of the Eddington limit (B13; Guerriero et al. 1999), when the RB is in thehard state (B14). Actually, the RB almost never reaches higher luminosities during outburstsafter 1999 (Masetti 2002; B14).
Three modes of type II bursting behaviour follow one another in a smooth transition,differing in light curves, energetics and bursting patterns (Marshall et al. 1979; Guerrieroet al. 1999). To illustrate the evolution of the type II burst behaviour, we plot the light curvefrom RXTE data of the outburst in 2006 June–July (Fig. 4.1).
The first type II bursts are hundreds of seconds long, often with flat peaks, and havethe longest recurrence times (sometimes longer than a few ks observation). The persistentemission drops right before and after them. These are the so-called mode-0 type II bursts(Fig. 4.1, top-left inset). We identified a record long mode-0 burst with a duration of at least1100 s. It is visible in Fig. 4.1 as the long plateau on June 26.
At lower persistent fluxes, the large bursts are increasingly preceded by sequences of 8to 40 short bursts. After the final longer burst, a longer gap is measured, during which thepersistent emission rises to a level higher than that of the intra-burst emission, in a ‘hump’shape. This bursting pattern is called mode 1 (Fig. 4.1, top-right inset).
61

4 The RB type II burst population
As the outburst decays further, the sequences of mode-1 type II bursts become increas-ingly long, the final bursts less energetic and the humps shorter and less pronounced. Even-tually, all bursts have similar energetics and durations: this is the so-called mode 2 (Fig. 4.1,bottom-middle inset). Finally, even these bursts become increasingly sparse, as the sourcemoves to quiescence (Fig. 4.1, bottom-right inset).
We caution that the sequence ‘no type II bursts → mode 0 → mode 1 → mode 2’ is onlya general trend. For instance, the flat peak in Fig. 4.1 starting on June 27 is not a very longmode-0 type II burst, but an actual switch of the source to the soft state, during which a typeI burst can be seen, but no type II bursts. Two observations were taken the day before and theday after showing long mode-0 type II bursts, meaning that the soft state lasted briefly.
Also, the RB can sometimes be seen switching back and forth between modes. Theswitch is sudden rather than gradual (as shown in Fig. 4.2, already noted by Lewin et al.1993), although the RB can be seen to transit back and forth between modes for a few ks. Itis clear from the picture that the minima before and after a mode-0 burst are not ‘dips’: rather,the humps in between are what is peculiar and are a feature common to all very energetic typeII bursts, independent of bursting mode.
The sampling along an outburst is often patchy, meaning that it is not easy to establish anaverage duration for each mode. The outburst in Fig. 4.1 is probably the best sampled one.It features the longest mode-0 phase in the entire data set, lasting ≈ 8.7 d, albeit including abrief return into the soft state. The longest uninterrupted mode-0 bursting phase occurred inan earlier outburst, and lasted ≈ 6.5 d. Mode-1 bursts are visible in Fig. 4.1 for ≈ 2.1 d. In alater outburst, they were observed to last for twice that time, ≈ 5.2 d. Finally, mode-2 burstwere continuously observed for up to 24 d, the longest stretch in the data set.
4.2.3 The type II burst sample
Our search routine found 8458 type II bursts in the entire data set (see Sec. 4.2.1). The resultsare summarized in Table 4.1. We determined the instrumental and cosmic diffuse backgroundwith the FTOOL PCABACKEST. No bursts were analysed that are outside so-called good timeintervals, are affected by data gaps are overlapping with type I bursts (from either the RB or4U 1728-34), or are in ObsIDs for which the collimator response was not constant becauseof a slew. This left us with 7601 bursts.1 Of these, 3662 type II bursts are present in 389 ks ofdirect pointings, while 3183 were observed during 341 ks of offset pointings, and 756 during92 ks of 4U 1728-34 observations.
In total, the RB was stably in mode 0 during the entirety of an ObsID for 114 ks, in mode1 for 170 ks, and in mode 2 for 492 ks. In 51 ks of data, the behaviour was intermediatebetween two consecutive modes, switching often back and forth during the transition. Wefound 104 mode-0 bursts, 2522 mode-1 bursts and 4971 mode-2 bursts. For 4 bursts takingplace during very short observations (a few hundred seconds), we could not clearly assign amode.
1A table including all the burst properties for the entire sample is available online.
62
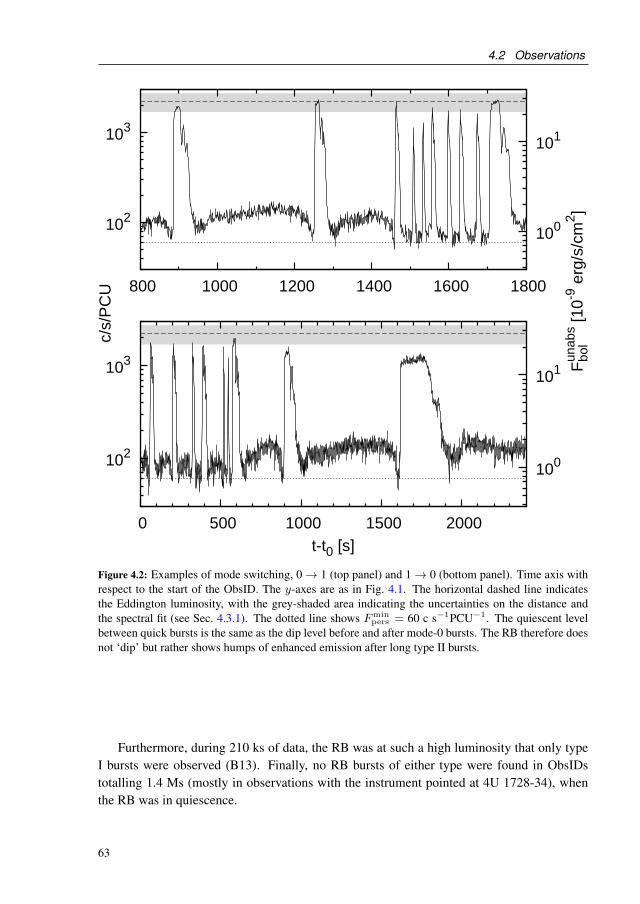
4.2 Observations
102
103
800 1000 1200 1400 1600 1800
100
101
102
103
0 500 1000 1500 2000
100
101
t-t0 [s]
c/s/
PC
U
Fbo
lun
abs [1
0-9 e
rg/s
/cm
2 ]Figure 4.2: Examples of mode switching, 0 → 1 (top panel) and 1 → 0 (bottom panel). Time axis withrespect to the start of the ObsID. The y-axes are as in Fig. 4.1. The horizontal dashed line indicatesthe Eddington luminosity, with the grey-shaded area indicating the uncertainties on the distance andthe spectral fit (see Sec. 4.3.1). The dotted line shows Fmin
pers = 60 c s−1PCU−1. The quiescent levelbetween quick bursts is the same as the dip level before and after mode-0 bursts. The RB therefore doesnot ‘dip’ but rather shows humps of enhanced emission after long type II bursts.
Furthermore, during 210 ks of data, the RB was at such a high luminosity that only typeI bursts were observed (B13). Finally, no RB bursts of either type were found in ObsIDstotalling 1.4 Ms (mostly in observations with the instrument pointed at 4U 1728-34), whenthe RB was in quiescence.
63

4 The RB type II burst population
0 50 100 150 200Fmin
pers [c/s/PCU]
100
101
102
103
Num
ber
of
type II burs
ts
peak =30
p0.05 =25
p0.95 =60
0.0 0.5 1.0 1.5 2.0 2.5[10−9 erg/s/cm2 ]
0 50 100 150 200⟨Fpers
⟩=E next
pers /∆tnext [c/s/PCU]
100
101
102
103
peak =30
p0.05 =26
p0.95 =70
0.0 0.5 1.0 1.5 2.0 2.5[10−9 erg/s/cm2 ]
0 100 200 300 400 500⟨Ftot
⟩=(Eb +E next
pers )/∆tnext [c/s/PCU]
100
101
102
103
peak =160
p0.05 =51
p0.95 =300
0 1 2 3 4 5 6[10−9 erg/s/cm2 ]
Figure 4.3: Histograms of all persistent flux parameters (see Sec. 4.4.1): the persistent count rate imme-diately before a burst Fmin
pers, the average persistent count rate after a burst ⟨Fpers⟩ and the total averageflux (including the burst) ⟨Ftot⟩. The peak of the distribution, 5th and 95th percentiles are indicatedfor each parameter. Only bursts that were not contaminated by 4U 1728-34 have been included (seeSec. 4.2.1).
Table 4.1: The sample of analysed(a) type II bursts.
Bursting mode(b) Number of bursts per aimpoint(c) TotalRB offset 1728-34
0 78 24 2 1041 964 895 663 25222 2620 2260 91 4971unclear 0 4 0 4all 3662 3183 756 7601
(a)About 800 bursts identified by our routine were not analysed, see Sec. 4.2.1.(b)For a description of the bursting patterns, see Sec.4.2.2.(c)The different orientations of the telescope in the data and their effect on FOV contamina-tion and effective area are discussed in Sec. 4.2.1.
64

4.3 Methodology
4.3 Methodology
4.3.1 Counts as proxy for energy
We adopted the photon counts as a proxy for the energy flux, rather than fitting time-resolvedspectra. This approach offers an obvious advantage in speed of the data reduction. Further-more, the intra-burst persistent emission would often be too short and weak to constrain thespectrum well. Finally, the flux variations, which can be very large during type II bursts, arelargely achromatic; it is mostly the normalization factor and not the intrinsic spectral shapethat is changing. This is shown in Appendix 4.B, where we perform time-resolved spec-troscopy on a representative selection of the type II bursts. We obtained the best fits with aComptonization model (COMPTT in XSPEC Titarchuk 1994). The conversion factor betweenPCA counts and 3–25 keV fluence is 1.02×10⁻¹¹ erg cm−2 per c/PCU. The uncertainty in-duced by the spectral shape is 10 per cent (full range, not 1σ). The bolometric correctionwould be 1.24± 0.07 for the COMPTT model.
For a M = 1.4M⊙ NS, the Eddington luminosity LEdd is 2.1×1038 erg s−1. Thisassumes isotropic emission, no gravitational redshift and an accreted H fraction X = 0.7
because the RB type I bursts show long (100 s) tails that are typical of burning of H-rich mate-rial. For a distance of (7.9±0.9) kpc, this yields a flux FEdd = (2.8±0.3)×10−8 erg cm−2 s−1.Given the above conversion to the bolometric flux, and propagating the relative errors on thespectral shape, bolometric correction and distance, the Eddington luminosity in the RB cor-responds to FPCA
Edd = (2200± 500) c s−1PCU−1.
4.3.2 Extracting the sample properties
For each type II burst, we calculated from the STANDARD-1 light curve the start time andduration tdur at 0.125 s accuracy by seeking backward and forward in time for the first twoconsecutive time bins where the count rate was below the persistent emission level. This way,we also determined ∆tprev and ∆tnext, the recurrence times with respect to the previous andthe next burst, respectively, as the difference between the start times. Because the burstduration can be a significant fraction of the duty cycle for type II bursts (unlike for most typeI bursts), the actual non-bursting time can be significantly shorter than the recurrence timesso defined.
We defined two different measurements of the intra-burst persistent flux. First, we calcu-lated the actual intra-burst fluence Epers and divided that by the intra-burst time, providingthe average persistent flux ⟨Fpers⟩. In a vast majority of cases, the instantaneous flux wasstable during the interval, and deviated little from the average.
As mentioned in Sec. 4.2.2, the persistent emission however tends to rise after very en-ergetic bursts (the mode-0 and end-of-sequence mode-1 bursts), reaching a minimum imme-diately before and after those bursts. Therefore, for the purpose of measuring the net burstemission properties, we also calculated the average count rate Fmin
pers in the 10 s before a burst
65

4 The RB type II burst population
(or less, when ∆tprev is shorter). This assumes that, during the burst, the persistent emissionwill be stable at the minimum level reached right before it.
We made this choice for two reasons. First, this assumption has long been part of thestandard approach to burst analysis (e.g., Galloway et al. 2008). Secondly, the reappearanceof the persistent emission at roughly the same flux after the energetic bursts (see e.g., Fig. 4.2)supports our choice.
We subtracted Fminpers from the observed count rates to calculate the net burst emission
properties. We defined the peak flux Fpeak and the total burst fluence Eb as the maximumnet count rate and the integrated burst net counts during this interval.
The ratio of Epers to Eb is the parameter α, which is key to distinguishing between typeI and II bursts, because the ratio of the fluence liberated in the persistent emission to that theburst diagnoses whether the latter can be explained by thermonuclear burning of the accretedmaterial or not. For reasons that will become clearer in Sec. 4.4.2, we defined two values ofα for each burst, employing Epers before and after the burst: thus, we retrieved a backward-defined αprev and a forward-defined αnext. The previous is the parameter that is normallyemployed in studies of type I bursts, but as we will see, the latter shows a more significantrelationship for type II bursts.
We subtracted the instrumental background counts (calculated and interpolated from theSTANDARD-2 data in 16 s resolution) from all quantities, and then normalized them by thenumber of active PCUs and the correction given by the telescope orientation (see Sec. 4.2.1).Clearly, all quantities related to the persistent emission have to be considered upper limits(lower for α) when the FOV is contaminated by 4U 1728-34. We did not include these in ouranalysis.
4.4 Results
4.4.1 The persistent emission
First we look at the properties of the persistent emission when the RB is emitting type IIbursts, whenever not contaminated by 4U 1728-34 (see Sec. 4.2.1). We plot the variousproperties in Fig. 4.3, with the peak of the distribution (the highest bin) and the 5 and 95percentiles indicated.
The average persistent emission count rate before a burst Fminpers is limited to a narrow
range of values, with 90 per cent of the distribution between 25 and 60 c s−1PCU−1, or≃ (0.01 − 0.025)FEdd. Therefore, no bursts are observed on top of a null net persistentemission. The largest observed value is 110 c s−1PCU−1, corresponding to ≃ 0.05FEdd
(note that at times when there are no type II bursts, the persistent flux can be as high as≃ 0.45FEdd).
As explained in Sec. 4.3.2, this is only a lower limit on the actual intra-burst emission.However, short mode-1 and mode-2 bursts make up the majority of our sample, so that thefollowing histogram, of the average persistent count rates after a burst ⟨Fpers⟩, shows a very
66

4.4 Results
mode 0 mode 1 mode 2101
102
c/s/
PC
U
Fminpers⟨Fpers
⟩⟨Ftot
⟩
Figure 4.4: The average values of Fminpers, ⟨Fpers⟩ and ⟨Ftot⟩ during mode-0,-1 and-2 type II bursts (see
Sec. 4.4.1). The error bar indicates the standard deviation in each sample.
similar distribution, with a slightly longer tail. The minimum values are similar to those ofFminpers because the persistent emission never dips between bursts, but only right before and
after them. The maximum of the distribution is larger with respect to Fminpers, with all but 10
bursts showing ⟨Fpers⟩ < 200 c s−1PCU−1 ≃ 0.09FEdd.Since both the persistent emission and the type II bursts probably originate from the re-
lease of gravitational energy (although possibly through different channels), the total averageflux in the interval between two bursts ∆t, including both the burst and persistent emission,is also a potential proxy for the actual mass accretion rate of the RB during the hard state(under the assumption that the radiative efficiency is similar for the persistent emission andthe type II bursts). We call this flux ⟨Ftot⟩, and plot it in the following histogram in Fig. 4.3.The bursts seem to increase the accretion flux by a factor of ∼4, up to an upper limit of400 c s−1PCU−1, or ≃ 0.17FEdd. Therefore, an average 75 per cent of the accretion goesthrough bursts.
All three measurements show a monotonically decreasing trend from mode 0 to 1 to 2,as plotted in Fig. 4.4. However, the dispersion within each sample is similar or larger thanthe difference in values between modes. We obtained the same result trying to reproduce the
67

4 The RB type II burst population
0 1000 2000 3000 4000Fpeak[c/s/PCU]
100
101
102
103
Num
ber
of
burs
ts
peak =1050
p0.05 =840
p0.95 =2130
0 1 2 3 4 5[10−8 erg/s/cm2 ]
0 20000 40000 60000 80000 100000Eb[c/PCU]
100
101
102
103
peak =2500
p0.05 =1391
p0.95 =20365
0.0 0.2 0.4 0.6 0.8 1.0 1.2[10−6 erg/cm2 ]
0 20 40 60 80 100tdur[s]
100
101
102
103
Num
ber
of
burs
ts
peak =3.5
p0.05 =2.4
p0.95 =23.75
0 100 200 300 400 500∆t[s]
100
101
102
103
peak =16.5
p0.05 =14.4
p0.95 =210.1
0 1 2 3 4αprev =E prev
pers /Eb
100
101
102
103
Num
ber
of
burs
ts
peak =0.20
p0.05 =0.07
p0.95 =1.50
0 1 2 3 4αnext =E next
pers /Eb
100
101
102
103
peak =0.20
p0.05 =0.11
p0.95 =1.35
Figure 4.5: Histograms of all burst parameters. The peak of the distribution, 5th and 95th percentilesare indicated for each parameter. The dashed line in the left-top plot is the flux corresponding to theEddington luminosity for M = 1.4M⊙, X = 0.73. The grey area reflects the uncertainty in thespectral fit (see Appendix 4.B). The shortest observed ∆t = 2 s, tdur = 0.125 s. The dashed linein the α plots divides the regions where the burst fluence exceeds that of the persistent emission andviceversa. α values have only been computed for observations that were not contaminated by 4U 1728-34 (see Sec. 4.2.1).
68

4.4 Results
same figure for the outburst plotted in Fig. 4.1 alone. It seems therefore that the persistentemission variations only marginally trace the changing type II burst behaviour.
4.4.2 The type II bursts
For all 7601 analysed type II bursts we study their energetics (peak flux Fpeak and fluenceEb) and timescales (duration tdur and recurrence time ∆t). Furthermore, we investigatetheir relationships to the persistent emission properties for the 3183 bursts observed when 4U1728-34 is outside the FOV. In Fig. 4.5, we have plotted histograms of the burst properties,again annotated with the peak of the distribution (the highest bin) and the 5 and 95 percentiles.
Burst properties
Starting with the distribution of peak fluxes of type II bursts, the peak is at about half theEddington luminosity, or 1100 c s−1PCU−1. Overall, the distribution is relatively narrow,with 90 per cent of the bursts peaking in the range (1.1–2.7)×108 erg cm−2 s−1. The dis-tribution seems compatible with being Eddington limited. Only 1 per cent of the bursts areabove the upper limit on LEdd given by the uncertainty over the distance and the spectral fit(see Sec. 4.3.1; this limit is actually more clear in Figs 4.7–4.9).
A larger dynamic range of values is observed for the burst fluences, which span aboutthree orders of magnitude, making for a fairly large distribution. The majority of bursts arein mode 1 or 2, so it is not surprising that many show a relatively small fluence. Thesebursts radiate typically between 10−8 and several 10−7 erg cm−2. The more energeticmode-0 bursts show minimum fluences of several 10−7 erg cm−2. 42 mode-0 bursts showEb >10−6 erg cm−2, peaking at Emax
b = 5.8×10⁻⁶ erg cm−2.The durations of type II bursts can vary by four orders of magnitude, although 90 per
cent of them last between 2.4 and 23.75 s. The shortest bursts actually challenge the timeresolution of STANDARD-1 data of 0.125 s, and need to be resolved in event-mode data(Fig. 4.6, top). The shortest burst in our sample only lasted 130 ms. We found 61 bursts withsub-second durations, all during mode-2 bursting phases towards the end of an outburst, 46of them in ObsID 92026-01-08-05 alone.
These very short bursts do not show peak fluxes smaller than the rest of the sample. Theirfluences are however some of the smallest observed, liberating on average ∼ 5×10⁻⁹ erg cm−2.Their light curves tend to show very fast rises and equally fast decays, although they can haveshapes that are unseen in the rest of the sample (such as the burst in the bottom-left panel ofFig. 4.6, which has a gradual rise and a sudden decay).
The longest burst observed in its entirety lasts 533 s (Fig. 4.6, bottom). The record holderis however a burst lasting at least 1100 s, the rise of which was not caught in the observation.Only 26 bursts recorded durations longer than 100 s, all but two being mode-0 bursts.
The recurrence times are mostly below 200 s (again, with the exception of the mode-0bursts), the shortest and the longest (without data gaps) ∆t being 2 and 1656 s, respectively.Overall, the distribution is extremely asymmetric. This is logical, since the shorter the re-
69

4 The RB type II burst population
currence time, the more bursts will be observed. The peak of the distribution is howeverwell above zero, at ∆t =15–18 s. Below this bin, the distribution drops abruptly. Concerningmode-0 bursts, their recurrence times (excluding lower limits) range between 105 and 1562 s.
For the 3183 bursts that were in observations uncontaminated by 4U 1728–34, we com-pared the fluence released in the burst to that in the persistent emission. We calculated theαprev and αnext values, respectively, by dividing the integrated fluence in the interval priorand after the burst by the total burst fluence Eb. The former is the parameter that is employedwhen dealing with type I bursts, since thermonuclear bursts are due to the burning of materialafter this has been accreted. Fig. 4.5 shows that the values of αprev for type II bursts peak at0.20, meaning more energy is released in the bursts than in the persistent emission. They areincompatible with the values expected from thermonuclear burning (≃ 40 at least, for H-richfuel; Lewin et al. 1993, and the minimum measured α ≃ 10; Keek et al. 2010).
Even at the lowest persistent fluxes, when the RB approaches quiescence and the type IIburst frequency drops, (see bottom-right inset of Fig. 4.1), αprev < 10. The only type II burstswith larger αprev values are those with sub-s durations, which can have αprev ∼20–200, butare much shorter than type I bursts.
The type II bursts are thought to draw from the same energy reservoir as the persistentemission. Also, their occurrence and properties seems to affect the persistent emission thatfollows, rather than to depend on the persistent emission that precedes them (see below). Be-cause of this, we also plot the integrated ratio of the fluence following a burst to the integratedburst fluence, αnext. The two distributions are similar, although that of αnext is narrower anddoes not approach values as small as the other one. The final large bursts in mode-1 sequencestend to have short ∆tprev (the time interval to the previous burst), and long ∆tnext. Hence,their αprev are smaller than their αnext.
Correlations
Having described the burst properties individually, we turn our attention to the relationshipsbetween them. As we show in Fig. 4.7, some burst properties show trivial correlations. Theburst fluence Eb correlates with both the peak flux Fpeak (Spearman rank-order correlationcoefficient ρ = 0.57) and, more strongly, with the burst duration tdur (ρ = 0.90), with themode-0 bursts having the largest Eb and longest tdur. In the lower left corner of the upperplot are the bursts for which almost the entire fluence is emitted in a short interval around theburst peak (in the lower plot these bursts are mostly shorter than 10 s). At the opposite endof the top plot, the correlation between Fpeak and Eb saturates once the peak flux reachesthe Eddington limited. There seems to be no correlation between peak flux and duration (notplotted).
It is also interesting to see how these quantities, which determine the burst energetics,depend on the bursting rate at a given moment. Fig. 4.8 shows the type II burst peak flux,fluence and duration as a function of the recurrence time to the next burst ∆tnext. On top,one can see that Fpeak is roughly independent of the waiting time (ρ = 0.04). A correlation
70

4.4 Results
0
1
2
-1 0 1
t-t0 [s]
c/s/
PC
U (
x100
0)
0
1
2
3
4
-1 0 1t-t0 [s]
c/s/
PC
U (
x100
0)
0
1
2
3
-1 0 1
t-t0 [s]
c/s/
PC
U (
x100
0)
0
1
2
-1 0 1t-t0 [s]
c/s/
PC
U (
x100
0)
102
103
0 500 1000 1500
100
101
c/s/
PC
U
Fbo
lun
abs [1
0-9 e
rg/s
/cm
2 ]
t-t0 [s]
Figure 4.6: Top: examples of some of the shortest bursts in the sample from the 10 ms resolution lightcurve of ObsID 92026-01-08-05 (2006 July 20). Left y-axis is as in Fig. 4.1. The bursts take placeduring an otherwise ordinary sequence of mode-2 type II bursts. Bottom: for comparison, the longestentirely observed burst in the sample, at 533.125 s, from ObsID 40058-02-03-01S (1999 April 20).The y-axes are as in Fig. 4.1. The flat top is substantially below the Eddington limit, indicated by thehorizontal dashed line, with the grey-shaded area indicating the uncertainties on the distance and thespectral fit (see Sec. 4.3.1). A longer burst (≳ 1100 s, see Fig. 4.1 and Sec. 4.4.2) was only partiallyobserved.
71

4 The RB type II burst population
102
103
104
101
102
101
102
103
104
Fp
ea
k [c/s
/PC
U]
[10
-9 e
rg/s
/cm
2]
[10-9
erg/cm2]
ρ = 0.57
mode 0mode 1mode 2
model
10-1
100
101
102
103
102
103
104
105
106
t du
r [s
]
Eb [c/PCU]
ρ = 0.90
Figure 4.7: Peak flux Fpeak and burst duration tdur as a function of the burst fluence Eb (see Sec. 4.4.2).Count rates and energies are as in Fig. 4.1. The horizontal dashed line indicates the Eddington lu-minosity, with the grey-shaded area indicating the uncertainties on the distance and the spectral fit(see Sec. 4.3.1). The correlation (given by the Spearman correlation factor ρ) is strong in both cases,although it saturates in the upper plot at the flux corresponding to the Eddington luminosity. The dash–dotted line in the bottom plot indicates the duration of an Eddington-limited burst of a given fluence.The red diamonds are the values predicted by three the models in Fig. 4.15, with two of them nearlyoverlapping (see Sec. 4.7.1).
72

4.4 Results
102
103
104
101
102
100
101
102
103
104
Fpeak [
c/s
/PC
U]
[10
-9 e
rg/s
/cm
2]
ρ = 0.04
mode 0mode 1mode 2
102
103
104
105
106
101
102
103
104
Eb [
c/P
CU
]
[10
-9 e
rg/c
m2]
ρ = 0.71
10-1
100
101
102
103
100
101
102
103
104
t dur [s
]
∆tnext
[s]
ρ = 0.87
tdur ∝ ∆tnext0.76
Figure 4.8: Burst peak flux Fpeak, fluence Eb, duration tdur as a function of the waiting time ∆t tothe next burst (see Sec. 4.4.2). Count rates and energies are as in Fig. 4.1. The horizontal dashedline indicates the Eddington luminosity, with the grey-shaded area indicating the uncertainties on thedistance and the spectral fit (see Sec. 4.3.1). The middle and bottom plot show the relaxation oscillatorbehaviour of the type II bursts; the burst recurrence time seems to more accurately predicted by theduration of the previous burst than its fluence. The least-squares fit to the data in the bottom plot is alsoshown with a dotted line (see Sec. 4.4.2).
73

4 The RB type II burst population
102
103
104
101
102
0 0.5 1 1.5 2 2.5
Fpeak [
c/s
/PC
U]
[10
-9 e
rg/s
/cm
2]
[10-9
erg/s/cm2]
ρ = -0.03
mode 0mode 1mode 2
102
103
104
105
106
101
102
103
104
Eb [
c/P
CU
]
[10
-9 e
rg/c
m2]ρ = 0.46
ρ = -0.04
10-1
100
101
102
103
0 50 100 150 200
t dur [s
]
<Fpers> = Epersnext
/ ∆tnext
[c/s/PCU]
ρ = 0.23
ρ = -0.04
Figure 4.9: Same burst properties as in Fig. 4.8, here plotted against the average persistent flux ⟨Fpers⟩(see Sec. 4.4.2 for definition). Only bursts observations that were not contaminated by 4U 1728-34 areplotted (see Sec. 4.2.1). Count rates and energies are as in Fig. 4.1. The horizontal dashed line indicatesthe Eddington luminosity, with the grey-shaded area indicating the uncertainties on the distance and thespectral fit (see Sec. 4.3.1). No overall correlation is visible in the data, although it might hold for thelongest, most energetic bursts (see Sec. 4.4.2).
74

4.4 Results
102
103
104
105
106
101
102
103
104
105
106
101
102
103
104
100
101
102
103
104
Eb [c/P
CU
]
[10
-9 e
rg/c
m2]
Enexthump = Epers - (∆tnext x F
minpers) [c/PCU]
[10-9
erg/cm2]
mode 0mode 1mode 2
Figure 4.10: The burst fluence Eb against the ‘net’ (i.e. above Fminpers) hump fluence Ehump (see
Sec. 4.4.2). Count rates and energies are as in Fig. 4.1. Above a critical Eb ∼ 2 × 10⁴ c/PCU, acorrelation appears. Both the brightest mode-1 bursts and all mode-0 bursts can be above this threshold.
instead appears in the middle panel, which plots Eb against ∆tnext (ρ = 0.71): this is thewell-known relaxation-oscillator behaviour of the RB, according to which the more energetica burst, the longer it takes for the next one to occur. This is the reason why we chose tointroduce the parameter αnext. However, a look at the bottom plot in Fig. 4.8 reveals that∆tnext correlates more tightly with tdur (ρ = 0.87) than with Eb. This implies that theduration of a type II burst, rather than the energy it releases, determine the time it takes forthe next type II burst to occur. A least-squares fit yielded trec ∝ (∆tnext)0.76±0.01. There is,however, a large spread in the data, especially for the mode-1 and mode-2 bursts.
As we explained in Sec. 4.2.2 different patterns of type II bursts follow each other duringthe outburst decay, while on average the persistent flux decreases. We therefore wish to assesswhether the burst properties show any dependence on the strength of the persistent emission.Fig. 4.9 shows the burst peak flux, fluence and duration plotted against the average persistentflux ⟨Fpers⟩. It is immediately evident that all correlations are weaker than with respect to∆tnext. As in the previous case, Fpeak shows no evident relation to the persistent emissionproperties (ρ = −0.03). In the middle and bottom panels, where we plot Eb and tdur against
75
4 The RB type II burst population
⟨Fpers⟩, no monotonic trends can be seen. Instead, two distinct behaviours appear. While forbursts that liberate little fluence (Eb ≲ 2× 10⁴ c/PCU) or that are short (tdur ≲ 20 s) Eb andtdur do not correlate with ⟨Fpers⟩ (ρ = −0.04 in both cases), for energetic and long burstsa positive correlation is visible, that at least for Eb appears to be significant (ρ = 0.46 and0.23, respectively).
In other words, when looking at how the burst properties are influenced by the persistentemission, there is a dichotomy in behaviour between the mode-0 type II bursts, which havelarge fluences and long durations, and appear in the upper half of the plots, and mode-2 bursts,characterized by small fluences and short durations, appearing in the bottom half. Mode-1bursts can clearly be found both in the lower half of the plots of Fig. 4.9 (low fluence and shortduration) and in the upper half (large fluence and long duration). These are, respectively, theshort bursts initiating the mode-1 sequence, and the long one that concludes it. These twogroups inhabit the same regions of the plots as the mode-2 and -0 bursts, respectively.
The same threshold in fluence seems to determine the presence of a hump after a burst.Fig. 4.10 shows that, independent of burst mode, above a critical Eb ∼ 2×10⁻⁷ erg cm−2,the burst fluence correlates with the ‘net’ (i.e. above Fmin
pers) hump fluence Ehump. Again,bursts above this threshold are not only the mode 0, but also the resembling mode 1 that enda sequence of bursts and precede a hump.
4.4.3 Type I bursts in the mixed (hard) state
Various methods help identify the type I bursts in the sample. Their profiles in the lightcurves differ for a number of features from those of type II bursts. The type-I-burst peakfluxes are smaller than those of most type II bursts (type I bursts in the RB reach at most one-third of the Eddington luminosity; B13). Also, all type II bursts show multiple peaks in theirdecays, while type I bursts generally have smooth decays (but see B14). Finally, type I burstshave generally longer durations, causing the fast-recurring type II bursts to overlap with theirexponential decays. Finding candidate type I bursts is therefore relatively straightforward.
Nonetheless, a secure identification of type I bursts should come from measurements ofα or from the detection of cooling in their time-resolved spectra. However, the first method isonly applicable in a state where either type I or II bursts are emitted. In a mixed state, wheretype II bursts recur faster than the type I bursts, one cannot rely on their αprev values todiscriminate between them. The second method, the detection of cooling, is only a sufficient,and not necessary condition for the type I burst identification. Observing spectral cooling isgenerally only possible for bright type I bursts (Fpeak ≳ 0.7Fpers; Linares et al. 2011). B13also showed that some RB bursts which lack evidence for cooling are to be identified as typeI, due to their large α values and their occurrence in the brightest phases of the soft state.
To determine the presence of cooling, we measured hardness ratios as the flux ratios in the5.1–7.6 keV and 2.3–5.1 keV bands. 26 candidate bursts show secure evidence of cooling,and we can therefore confirm they are type I even without being able to measure their α
values.
76

4.4 Results
0
500
1000
1500
2000
0
10
20
c/s
/PC
U
Fb
ol
un
ab
s [10
-9 e
rg/s
/cm
2]
0.5
1
1.5
800 1000 1200 1400
hard
ness r
atio
[5.7
1-1
5.1
8 / 2
.47-5
.71]
time [s]
Figure 4.11: Light curve and hardness ratio of ObsID 50420-01-09-00R, featuring a type I burst takingplace during a mode-0 type II burst. The vertical lines indicate the approximate start and end time ofthe burst. The net peak flux to persistent flux ratio β ≲ 0.2, hiding the hardening of the flux during thetype I burst below the detection level (Linares et al. 2011, B13).
Additionally, we found three bursts taking place ‘on top’ of a mode-0 type II bursts (seeFig. 4.11). For these bursts Fpeak ≲ 0.2Fpers, meaning the lack of cooling in their spectracannot rule out their type I nature. Given their distinctive shape (fast rise and exponentialdecay), these three bursts are unlikely to be a sudden spike of the type II bursts, which tendto show nearly flat plateaus (see Sec. 4.2.2). Therefore, we believe they are type I bursts aswell.
Summarizing, we found a total of 29 type I bursts occurring in an observation where alsotype II bursts appeared, out of a total of 123. Note that 17 candidate type I bursts could notbe confirmed.
As shown in Fig. 4.12, the type I bursts in the hard state are significantly different fromthose in the soft state. Most remarkably, the durations are much shorter, with tdur ≲40 s, asare the peaks, that lack the 6-8 s plateau displayed by type I bursts in the soft state (B13).
77
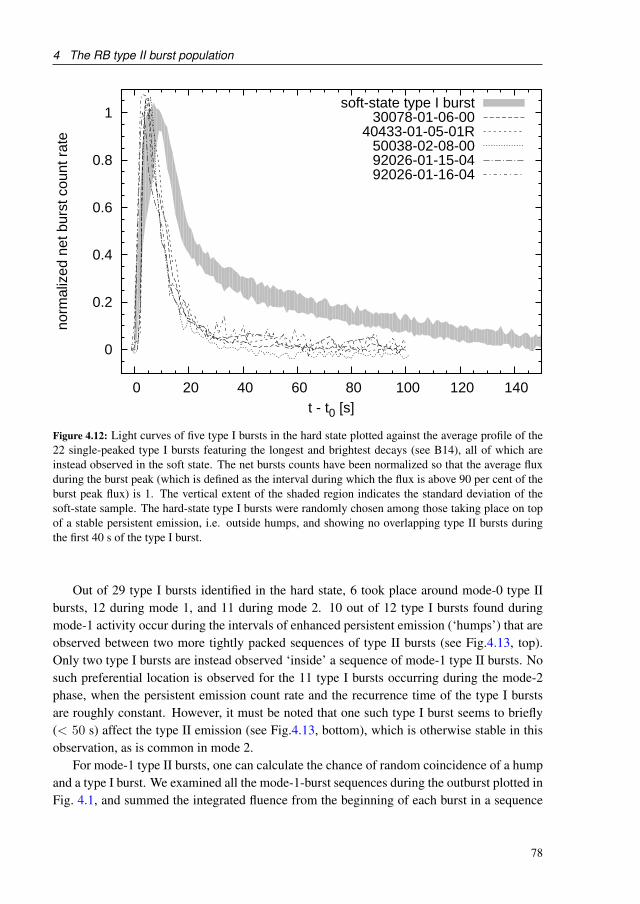
4 The RB type II burst population
0
0.2
0.4
0.6
0.8
1
0 20 40 60 80 100 120 140
norm
aliz
ed n
et b
urst
cou
nt r
ate
t - t0 [s]
soft-state type I burst30078-01-06-00
40433-01-05-01R50038-02-08-0092026-01-15-0492026-01-16-04
Figure 4.12: Light curves of five type I bursts in the hard state plotted against the average profile of the22 single-peaked type I bursts featuring the longest and brightest decays (see B14), all of which areinstead observed in the soft state. The net bursts counts have been normalized so that the average fluxduring the burst peak (which is defined as the interval during which the flux is above 90 per cent of theburst peak flux) is 1. The vertical extent of the shaded region indicates the standard deviation of thesoft-state sample. The hard-state type I bursts were randomly chosen among those taking place on topof a stable persistent emission, i.e. outside humps, and showing no overlapping type II bursts duringthe first 40 s of the type I burst.
Out of 29 type I bursts identified in the hard state, 6 took place around mode-0 type IIbursts, 12 during mode 1, and 11 during mode 2. 10 out of 12 type I bursts found duringmode-1 activity occur during the intervals of enhanced persistent emission (‘humps’) that areobserved between two more tightly packed sequences of type II bursts (see Fig.4.13, top).Only two type I bursts are instead observed ‘inside’ a sequence of mode-1 type II bursts. Nosuch preferential location is observed for the 11 type I bursts occurring during the mode-2phase, when the persistent emission count rate and the recurrence time of the type I burstsare roughly constant. However, it must be noted that one such type I burst seems to briefly(< 50 s) affect the type II emission (see Fig.4.13, bottom), which is otherwise stable in thisobservation, as is common in mode 2.
For mode-1 type II bursts, one can calculate the chance of random coincidence of a humpand a type I burst. We examined all the mode-1-burst sequences during the outburst plotted inFig. 4.1, and summed the integrated fluence from the beginning of each burst in a sequence
78

4.4 Results
102
103
-300 -200 -100 0 100 200 300
100
101
c/s/
PC
U
Fbo
lun
abs [1
0-9 e
rg/s
/cm
2 ]
102
103
-300 -200 -100 0 100 200 300
100
101
t-t0[s]
c/s/
PC
U
Fbo
lun
abs [1
0-9 e
rg/s
/cm
2 ]
Figure 4.13: Two examples of type I bursts during the hard state, during mode 1 (top) and 2 (bottom)type II bursts respectively. The x-axis shows time with respect to the type-I-burst start time t0. They-axes are as in Fig. 4.1. The horizontal dashed line indicates the Eddington luminosity, with the grey-shaded area indicating the uncertainties on the distance and the spectral fit (see Sec. 4.3.1). Notice thatthe type I burst during the mode-1 phase takes place during the hiatus in type II bursts that follows along one, while the persistent emission level rises in a hump shape. This is the case for 10 out of 12type I burst during the mode-1 phase. Neither effect is observable as a type I burst takes place in themode-2 phase (see Sec. 4.4.3). The type I burst during the mode-2 phase briefly affects the type II burstemission. This is only observed in 1 case out of 11.
79
4 The RB type II burst population
until the last, longer one. We divided this integrated energy by the fluence emitted duringthe following hump. Over the course of the outburst, this ratio decreases from 13.5 to 2.7.In order to reach a conservative estimate, we take the latter as the ratio of the amount ofmass accreted during a mode-1-burst sequence to that accreted during a hump. This meansthat, for each individual burst, the probability of random occurrence of a burst on a humpis psingle = 0.27. An estimate of the probability that 10 out of 12 type I bursts randomlytake place on a hump rather than overlap with mode-1 bursts is thus given by the binomialdistribution as p10/12 = 7.24 × 10⁻⁵. Clearly type I bursts have a statistically significantpreference for occurring during breaks in the type II activity, rather than overlapping them.
B13 reported type I burst recurrence times in the soft state in the range 0.4–4 ks. Asthe RB enters the hard state, trec becomes difficult to measure, as it typically surpasses theduration of an observation. The numbers should therefore only be treated as upper limits.
Nonetheless, we can establish average recurrence times of type I bursts across the dif-ferent modes of type II bursting. There are six confidently identified type I bursts in 114 ksof observations of mode 0, 12 in 170 ks of mode 1, and 11 in 492 ks of mode 2. If oneincludes the dubious cases, the type I bursts are 13 in mode 0, 21 in mode 1 and 12 inmode 2. This gives upper and lower limits, respectively, on the average recurrence times:⟨tmode0
rec ⟩ ∼ (8.3 − 18.1) ks, ⟨tmode1rec ⟩ ∼ (8.1 − 14.1) ks and ⟨tmode2
rec ⟩ ∼ (41.0 − 44.7) ks.Thus, the type I burst recurrence time is roughly the same during mode 0 and mode 1.
We plot these recurrence times in Fig. 4.14 together with the type I burst recurrence timesmeasured in the soft state, against the persistent flux Fpers (B13). The latter was taken to bea proxy of the mass accretion rate on the source, and the data show a correlation, with trec ∝F−0.95pers . The ⟨Fpers⟩ parameter we define in Sec. 4.3.2 only measures the emission taking
place between type II bursts, but these should also accrete nuclear fuel on to the surface.Therefore, we plot the type I burst recurrence times across the three modes versus both ⟨Fpers⟩and Ftot, which includes the burst fluence in the average.
As Fig. 4.14 shows, regardless of the proxy that is chosen for the mass accretion rate, thelargest recurrence time for type I bursts is observed during mode-2 type II bursts. Interest-ingly, observations line up with the relation extrapolated from the soft state when employing⟨Fpers⟩, while for Ftot there appears to be a scarcity of type I bursts in the hard state, acrossall modes.
4.5 Observational summary
The large sample of data we have studied allows us to address fundamental questions overthe type II bursts in the RB. In this section, we first summarize the overall properties of thesample, starting with those that were already previously known.
1) There are four patterns of type II bursts (e.g., Fig. 4.1).
i) a (type II) burstless soft state that is visible when the persistent emission flux is above 10per cent of the Eddington limit. This occurs mostly at the beginning of outbursts.
80

4.5 Observational summary
ii) During the outburst decay, the first type II bursts to appear are of so-called mode 0 (Guer-riero et al. 1999). They have the longest durations and recurrence times, and the largestfluences. The flat tops often observed in long mode-0 bursts are often sub-Eddington.Indeed, the flatness of the bursts has before been noticed to be a property of long bursts(Tan et al. 1991), regardless of their luminosity.
iii) The mode-1 burst pattern follows, with sequences of frequent short bursts ending with alonger and brighter one that is similar in appearance to the shortest mode-0 bursts.
iv) Finally, the mode-2 pattern appears, consisting of short bursts like the short ones in mode1 (but not interrupted by larger bursts followed by longer recurrence times).
This is only a general rule and exceptions exist. For instance, the RB sometimes brieflyswitches back to the previous mode, and even back into the soft state. Mode-0 and -1bursts can last for up to ∼ 5− 6 d, while mode-2 bursts persist for up to 24 d.
2) The persistent emission decreases monotonically as the RB progresses from mode-0 to mode-1 to mode-2 bursts (Fig. 4.4). No type II bursts are observed on top of undetectablepersistent emission.
3) All bursts roughly follow a relaxation oscillator relation (Fig. 4.8, middle), meaning that thefluence in a burst determines the waiting time to the next burst.
4) 95 per cent of the bursts show α values below 1.5, one order of magnitude below the min-imum value that is possible for full thermonuclear burning. The distribution peaks at0.2, meaning that five times more fluence is liberated in the bursts than in the persistentemission. This underlines the nature of type II bursts as accretion processes.
5) We calculated the probability of random occurrence of the observed fraction of type I burstson a hump to be p10/12 = 7.24 × 10⁻⁵. Clearly, type I bursts during mode 1 have astatistically significant preference for occurring during breaks in the type II activity, ratherthan overlapping them (see Fig.4.13). This preference was first noticed in SAS-3 data byUlmer et al. (1977), although it was Hoffman et al. (1978) who first proposed that thebursts on the humps and those surrounding them were type I and II, respectively. Theyalso noticed that these bursts were ‘anomalous’ with respect to the type I bursts takingplace during what we call mode 2, in that they had smaller peak fluxes and sometimeslacked spectral softening during burst decay. Likewise, we could confirm the presence ofspectral softening in 11 out of 12 candidate type I bursts during mode 2, but only in 12out of 21 during mode 1.
New findings in RB type II bursts are as follows.
6) The range of minima in the persistent emission between bursts Fminpers is between 1 and 2.5 per
cent of the Eddington luminosity. The distribution of the actual average persistent fluxes(i.e. taking the humps into account) ⟨Fpers⟩ extends to only slightly larger values, becausethe general sample is overwhelmingly dominated by the short mode-1 and mode-2 bursts,without humps in between. Taking into account the burst fluence as well, the RB is onaverage accreting at up to ≃ 0.17LEdd (Fig. 4.3).
7) The persistent flux does not generally seem to correlate with the burst properties (Fig. 4.9).
81

4 The RB type II burst population
Each burst mode presents a large dispersion in the range of observed persistent fluxes(Fig. 4.4), making the latter a poor predictor of the burst mode.
8) The most energetic type II bursts reach the Eddington limit (FEdd = 2.8×10⁻⁸ erg cm−2 s−1;Fig. 4.5, top-left). 1 per cent of the bursts are super Eddington. However, since the max-imum Fmax
peak = 3.0×10⁻⁸ erg cm−2 s−1, even a slight decrease in the H abundance ormoderate beaming are enough to bring every single burst within the uncertainty on LEdd
(Sec. 4.3.1). Bursts reaching the Eddington limit are not accompanied by evidence forphotospheric radius expansion (PRE) in the time-resolved spectra. Generally speaking,the peak flux shows no correlation with the waiting time or the persistent flux properties,and the distribution of peak fluxes is relatively narrow. Even the only visible correlation,the one with the burst fluence (Fig. 4.7), shows a large spread. This suggests that thespeed at which energy is released does not depend on the total amount of energy availablefor a burst, nor on the global mass accretion rate.
9) There is a clear dichotomy between mode-0 and mode-2 bursts. The former appear to feedback into the persistent emission, which rises in between them, while the latter do notseem to affect it. This is also reflected in the fact that only for mode-0 bursts there appearto be correlations between some properties of the bursts and of the persistent emission(Figs 4.8 and 4.9). Mode-1 bursts clearly are an intermediate state of the instability,reproducing both behaviours.
10) Long bursts – meaning both mode-0 bursts and the mode-1 bursts that ‘close’ a sequenceof bursts – are followed by humps, i.e. burst-free enhanced persistent emission. Thisis partially contrary to what was previously believed, that the persistent emission ‘dips’between mode-0 bursts (Marshall et al. 1979; Kunieda et al. 1984; Stella et al. 1988;Lubin et al. 1992b; Lewin et al. 1993; Guerriero et al. 1999), despite the fact that there isno evidence for enhanced absorption in the spectra (Stella et al. 1988; Lubin et al. 1993).However, looking at periods when the RB switches between these modes of emission, weclearly show that such ‘dips’ are actually at the same minimum level observed during asequence of mode-1 bursts (Fig. 4.2). Since the persistent emission level is stable inside amode-1 sequence, and no increase in the column density NH is observed in the spectra ofthe ‘dips’ (see Appendix 4.B), we argue that in both cases the emission following a longburst is enhanced, to decay again in the time running to the next burst.
11) The recurrence time distribution of type II bursts is strongly peaked at ∆t =15–18 s, anddrops abruptly below this value, while showing a smoother decrease to larger recurrencetimes (Fig. 4.5). Bursts with shorter recurrence times are found (as short as 2 s) but theyare a much smaller fraction of the sample, despite the fact that for a shorter ∆t morebursts should be produced. This implies that a minimum time exists for the instability todevelop, and that it is difficult for the RB to produce type II bursts more quickly than that.
12) We found 61 bursts with durations shorter than 1 s, and as short as 130 ms (Fig. 4.6, top), oneorder of magnitude smaller than the shortest bursts so far reported for type II bursts (2 sin EXOSAT data; Lubin et al. 1991). This puts a constraint on theoretical models for thisinstability, that appears to cover four orders of magnitude in duration, up to the record
82

4.6 Discussion
observed tdur = 1100 s.13) The sub-s duration bursts have α values between 20 and 200, thus overlapping with the α
range of type I burst. Precursor events of sub-s durations have been observed before, butthey are always followed by long type I bursts (in’t Zand et al. 2014). Therefore, the sub-sbursts are of type II.
14) The relaxation-oscillator behaviour is more accurately predicted by the burst duration thanthe fluence (Fig. 4.8, bottom).
4.6 DiscussionHaving laid out all observational features of the type II bursts of the RB, we now discuss thephysical implications of these. We leave the discussion of the instability models for type IIbursts to the next section.
4.6.1 Accretion versus ejection
Two observables might suggest the possibility of mass ejection in the RB. One comes fromthe type I burst behaviour, which we discuss in Sec. 4.6.4. The second finding suggesting thatmass could be ejected during type II bursts is that their peak flux never, for any persistent fluxor burst fluence, surpasses a certain value which, within a factor of 2, is equal to the expectedEddington limit for an NS at the distance of the hosting globular cluster, with X = 0.7 andan isotropic radiation field (Figs. 4.7–4.9). One might therefore wonder whether any surplusradiation power is transformed to the kinetic energy of an outflow enforced by radiationpressure.
There is, however, no spectral evidence for expansion of the emitting region. Thus, thepicture arises that when the Eddington luminosity is reached, the accretion is temporarilyhalted, interrupting the release of gravitational energy. This in turn lowers the luminosity sothat accretion can ensue again, rising back to the Eddington limit, and so on. The radiationpressure may momentarily cut off the fuel line for the radiation (the accretion flow), butnot result in isotropic expansion. As a consequence of this, all energy is liberated throughradiation, and there are no kinetic losses. This is in contrast to the type I bursts, wherereaching the Eddington luminosity does not affect the energy release from the layer that hasbeen heated by the burning, and the photosphere expands. Instead, once a type II burst fluxreaches the Eddington luminosity, a larger fluence Eb can only be liberated by means ofan increased duration, which makes for a tight relation between burst duration and fluence(Fig. 4.7, bottom).
4.6.2 Two kinds of type II bursts and three kind of modes
The data point to two kinds of type II bursts: long, often luminous ones and short ones. Longbursts, predominantly mode 0, occur at relatively larger mean accretion rates, while shorter
83

4 The RB type II burst population
ones abound at lower rates, during mode 2. They mix in mode 1. Long bursts induce humpsand adhere more tightly to a relaxation oscillator behaviour, while the short ones are notfollowed by humps and show a larger scatter around the relaxation oscillator relation.
The evidence for this is provided in Fig. 4.9. At large ⟨Fpers⟩ one observes both long andenergetic bursts, that become longer and stronger at larger persistent fluxes, and short andweak ones, displaying an opposite trend (i.e. becoming shorter and weaker at larger ⟨Fpers⟩).The critical fluence separating these two opposite feedbacks is Eb ≈ 2×1039 erg s−1. Thisduality is reflected by the way in which the bursts affect the persistent emission back. Whileshort, weak burst do not have a feedback on Fpers, the long and strong bursts that appear inmode 0 and at the end of a mode-1 sequence generate humps of enhanced persistent emission.Fig. 4.10 shows that the threshold for this behaviour is again at Eb ≈ 2×1039 erg s−1.
Another look at Fig. 4.7 shows that the threshold in fluence at which the bursts becomeEddington limited is Eb ∼ 5×1038 erg s−1. Notice that some mode-2 type II bursts reachFpeak = FEdd, but very quickly decay, and are not followed by humps.
Possibly then, a sustained period of Eddington-limited emission is necessary for a typeII burst to be followed by a period of enhanced persistent emission. It would therefore makemore sense to speak of ‘short’ and ‘long’ bursts, rather than the three modes that are men-tioned in literature. What Fig. 4.10 also shows, however, is that there is a continuity inbehaviour between the two, rather than a clear cut distinguishing two different behavioursamong type II bursts.
4.6.3 The relaxation-oscillator behaviour
Our data confirm the existence of the well-known relaxation oscillator between the burstfluence Eb and the time to the next burst ∆tnext. (Fig. 4.8, middle). However, we alsofind a tighter correlation between the burst duration tdur and ∆t (Fig. 4.8, bottom). It isquite possible that the relaxation-oscillator relation is a by-product of this tighter correlationand of the aforementioned one between Eb and longer tdur. This would mean that it is thetimescales, rather than the energetics, that connect the bursts and the persistent emission.
The burst properties seem to depend weakly on the average intra-burst persistent flux(Fig. 4.9). Also, relatively small changes in the persistent flux are visible between modes. Thevariations in the burst properties are therefore much larger than those in the accompanyingpersistent emission. In other words, the variation in the global mass accretion rate that mustbe present between the beginning and the end of the hard state is not equally split betweenthe bursts and the persistent emission, but almost entirely goes into the former.
4.6.4 Type I bursts as a probe of mass accretion by type II bursts
Our data of type I bursts provide a test of the hypothesis that type II bursts are an accretionphenomenon. They provide an independent constraint on the accretion rate by comparingtype I recurrence times with Fmin
pers, ⟨Fpers⟩ and ⟨Ftot⟩. Fig. 4.14 shows that the type I burst
84
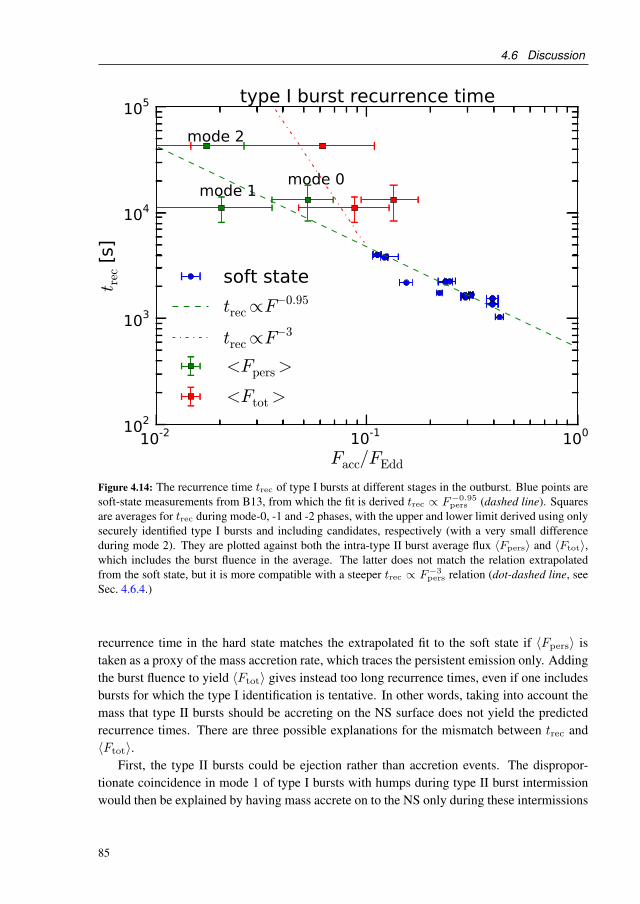
4.6 Discussion
10-2 10-1 100
Facc/FEdd
102
103
104
105t r
ec [
s]
mode 0mode 1
mode 2
type I burst recurrence time
soft state
trec∝F−0.95
trec∝F−3
<Fpers>
<Ftot>
Figure 4.14: The recurrence time trec of type I bursts at different stages in the outburst. Blue points aresoft-state measurements from B13, from which the fit is derived trec ∝ F−0.95
pers (dashed line). Squaresare averages for trec during mode-0, -1 and -2 phases, with the upper and lower limit derived using onlysecurely identified type I bursts and including candidates, respectively (with a very small differenceduring mode 2). They are plotted against both the intra-type II burst average flux ⟨Fpers⟩ and ⟨Ftot⟩,which includes the burst fluence in the average. The latter does not match the relation extrapolatedfrom the soft state, but it is more compatible with a steeper trec ∝ F−3
pers relation (dot-dashed line, seeSec. 4.6.4.)
recurrence time in the hard state matches the extrapolated fit to the soft state if ⟨Fpers⟩ istaken as a proxy of the mass accretion rate, which traces the persistent emission only. Addingthe burst fluence to yield ⟨Ftot⟩ gives instead too long recurrence times, even if one includesbursts for which the type I identification is tentative. In other words, taking into account themass that type II bursts should be accreting on the NS surface does not yield the predictedrecurrence times. There are three possible explanations for the mismatch between trec and⟨Ftot⟩.
First, the type II bursts could be ejection rather than accretion events. The dispropor-tionate coincidence in mode 1 of type I bursts with humps during type II burst intermissionwould then be explained by having mass accrete on to the NS only during these intermissions
85

4 The RB type II burst population
and not during type II bursts. Ejection is possible in a strong propeller regime, where thedisc is truncated by the magnetosphere at sufficiently large radii (rm > 21/3rcor; Lii et al.2014). The mechanism is similar to the one highlighted by D’Angelo & Spruit (2010, 2012,see below) with matter piling up and accreting in burst-like cycles. In this case, accretion isaccompanied by the launch of a well-collimated, magnetically dominated Poynting jet. How-ever, the predicted burst durations and recurrence times fall in the ms to s range, and verylarge B and small mass accretion rates (well below 10 per cent of the Eddington rate) arenecessary. But the strongest argument against this hypothesis is that, in a propeller regime,the luminosity should drastically decrease with respect to the accreting regime, because thepotential energy that would otherwise be liberated during the fall on to the NS surface willnot be available (D’Angelo et al. 2015). As the type II bursts reach luminosities up to theEddington limit, we are inclined to reject ejection as a valid hypothesis.
Secondly, the type I bursting rate could respond not only to the instantaneous mass ac-cretion rate, but also on the rate at which it itself varies (i.e. m). Possibly, the sudden andshort-lived increase in m associated with a type II burst will not produce the same effect inthe burning layers as if the same mass had been more slowly accreted. To the best of ourknowledge, however, simulations of how the type I burst behaviour changes with accretionrate only include models in which m is constant over long periods of time (e.g., Heger et al.2007). It would perhaps be interesting to see what these models predict in case of swift, largeand short-lived changes in the accretion rate, but we cannot presently elaborate further on thishypothesis.
Thirdly, the shorter duration of type I bursts in the hard state indicates that, as the mass-accretion rate decreases, the RB approaches a pure-He burning regime. In this case, a steep-ening of the relation in Fig. 4.14 is expected. Theoretical models predict a steeper relation ina pure-He regime (Cumming & Bildsten 2000), compatible with the trec ∝ m−3 measuredin IGR J17480–2446 (Linares et al. 2012, see their fig. 11). We plot this empirical relation inFig. 4.14, assuming pure-He burning takes place for bursts below 10 per cent of the Edding-ton limit, at the state transition. This way we can account for the recurrence times plottedagainst ⟨Ftot⟩ during mode 1 and 2, although type I bursts remain under-abundant for mode0.
This last hypothesis has the advantage that it also explains the observed change in thetype I burst duration. As already mentioned, type I bursts in the hard state are shorter thanthose in the soft state, both in total duration (∼ 20 s, versus ∼ 100 s in the soft state) and inthe duration of their peaks (see Fig. 4.12). This is also ascribable to changes in the fuel com-position: as the mass accretion rate decreases, the recurrence time of type I bursts lengthens,leaving less H unburnt by the hot CNO process, which in turn reduces the burst duration dueto the lack of unstable H burning via the slow rp-process (Fujimoto et al. 1981). This meansthat in the hard state the RB is approaching a pure-He burst regime. We think this is the mostlikely explanation of the three.
86

4.7 Models for Type II bursts
4.7 Models for Type II bursts
Since the discovery of type II bursts in the Rapid Burster, an assortment of instability mecha-nisms have been proposed for their origin. Bursts have been variously attributed to an instabil-ity in the accretion flow (either in viscosity or temperature), instabilities around the innermoststable circular orbit (ISCO) or as a result of the interaction between the accretion disc and astellar magnetic field (e.g., Spruit & Taam 1993; Kuijpers & Kuperus 1994). In their reviewarticle, Lewin et al. (1993) give an overview of the various strengths and weaknesses of thedifferent models. We proceed to review these models again and test their predictions againstour observations of the population.
4.7.1 Type II bursts: a magnetic phenomenon?
Theory of disc–magnetosphere interactions
A weakness of many models proposed to explain type II bursts is the apparent uniqueness ofthe RB, since most proposed instabilities should be widely applicable. In this respect, modelsbased on magnetospheric instabilities are perhaps the most promising, since a strong mag-netosphere introduces new characteristic lengthscales to the system, and the distinctivenessof the RB behaviour could then be attributed to an unusual magnetic field geometry (suchas alignment with the rotation axis, e.g., Kuijpers & Kuperus 1994), or unusual relationshipbetween the physical properties that determine the magnetic regulation of accretion and theproperties of the accretion flow itself (in particular the accretion rate at which the state tran-sition occurs). On the other hand, since X-ray pulsations have never been detected in the RB,it is not clear that there is a strong magnetic field in the system (although by the argumentabove this could be due to a near alignment between the rotation and the magnetic axes). TheBP does have an estimated magnetic field and measured spin period (B ∼ (2− 6)× 1010 G,P = 467 ms; Finger et al. 1996;Degenaar et al. 2014). The observation of type I X-ray burstsin the RB puts an upper limit of B ∼ 1010 G for the field (based on measured fields of knowbursters; Patruno & Watts 2012), but such a field would still be strong enough to truncate theaccretion disc and regulate the gas flow in the inner regions of the star at moderate accretionrates (e.g., Pringle & Rees 1972). Magnetospheric instability models (studied both analyti-cally and via numerical simulations) have also received the most theoretical development inthe last 20 years (since the Lewin et al. 1993 review), so we concentrate our discussion onthose results and how they compare with observation.
Accretion on to stars with strong magnetic fields becomes regulated by the magnetic fieldonce it reaches a certain distance from the star (the ‘magnetospheric’, or ‘Alfvèn’ radius, rm).At rm the disc is truncated by the magnetic field, and the gas is channelled along magneticfield lines to accrete on the star (Pringle & Rees 1972; Shakura & Sunyaev 1973). Themagnetospheric radius is typically approximated as the point where the ram pressure of theinfalling gas equals the magnetic pressure of the field (with some considerable uncertainty
87

4 The RB type II burst population
from the fact that both the disc and the star are rotating; e.g. Ghosh & Lamb 1979; Spruit &Taam 1993):
rm ≃ 3.1× 10⁸
(M
1016 g s−1
)2/7(M
1.4M⊙
)−1/2
(4.1)
×(
B∗
1010 G
)4/7(R∗
106 cm
)12/7
cm.
The location of the inner disc radius is considerably uncertain and can vary with the spinrate of the star (Spruit & Taam 1993). A factor ∼ 2 uncertainty for rm should generally beassumed.
Since in general the disc and the magnetic field do not rotate at the same rate, the couplingbetween the two will twist the magnetic field lines, creating a torque that allows for angularmomentum exchange between the disc and the star. The sign of the torque will depend onthe location of rm relative to the co-rotation radius, the radius at which the star’s rotationfrequency Ω∗ matches the Keplerian frequency of the disc:
rc ≡(GM∗
Ω2∗
)1/3
. (4.2)
Accretion can only proceed easily when rin < rc, that is, for relatively high accretionrates, slow stellar spin rates, and low magnetic field strengths. When rin > rc, the stellarmagnetic field presents a centrifugal barrier to accretion, and either expels the infalling gas inan outflow (the ‘propeller’ scenario; Illarionov & Sunyaev 1975) or keeps it confined in theinner disc outside rc (the ‘trapped disc’ scenario; Sunyaev & Shakura 1977; Spruit & Taam1993; D’Angelo & Spruit 2010).
Trapped discs
The trapped-disc picture forms the bases of the most developed model to explain type II burstsin the RB. In this scenario, when the accretion rate falls below a certain rate, rm (Eq. 4.1)moves outside rc, and gas is no longer able to accrete on to the star. As long as rm remainsclose to rc, the disc-magnetosphere interaction will not provide enough energy to unbind thegas from the disc and launch an outflow. Instead, the gas stays confined in the disc, graduallypiling up as more gas is accreted from larger radii. This situation continues until enough gashas piled up to push against the magnetic field for rm to move inside rc. Here the centrifugalbarrier disappears and the accumulated gas can rapidly accrete until the reservoir of gas hasbeen depleted and rm again moves outside rc. Observationally, the instability will manifest asshort bursts (as gas accretes freely through the disc and on to the star) contrasted with periodsof non-accretion (as gas gradually accumulates) with a roughly stable luminosity generatedby the interaction between the disc and the magnetic field.
This instability was described and studied analytically and numerically in Spruit & Taam
88

4.7 Models for Type II bursts
(1993);D’Angelo & Spruit (2010) and D’Angelo & Spruit (2012), who investigated its gen-eral properties (duty cycle, frequency, outburst shape, etc.) as a function of the mean accretionrate and the details of the disc–field interaction. In D’Angelo & Spruit (2010) and D’Angelo& Spruit (2012), the disc–field interaction is characterized by two (uncertain) lengthscales:∆r, the radial extent of the disc that is coupled to the magnetic field and ∆r2, the range ofrm around rc where the disc changes from being a trapped disc (outside rc) and accretingfreely (inside rc). A key feature of this instability is that it produces bursts on a wide rangeof timescales, which can generally be much longer than the dynamical timescale of the innerdisc, and plausibly match the burst timescales seen in the RB.
In the trapped disc instability, the main driver of changes in burst shape and duration isa changing mean accretion rate into the inner disc. Roughly speaking, the recurrence timeincreases and the burst duration and fluence decrease as the mean accretion rate decreases.This is broadly seen in the RB: the longest bursts in mode 0 occur early in the outburst, andthe time between mode-2 bursts increases gradually as the overall luminosity declines. If thisinstability is responsible for the behaviour seen in the RB, the stochastic behaviour seen inthe variation between individual bursts is mainly attributable to a variable accretion rate inthe inner disc regions. This may be consistent with the X-ray spectral transition from a disc-dominated (‘soft’ or ‘high’) state to a power-law dominated (‘intermediate’ to ‘low’) state.In NS and black hole binaries, the spectral transition to a power-law spectrum is typicallyaccompanied by large luminosity fluctuations on a range of timescales, which are commonlyinterpreted as fluctuations in local mass accretion rate propagated through the accretion flow(e.g., Lyubarskii 1997). Since the instability requires an accumulated mass reservoir, theseaccretion rate fluctuations will manifest as a variation in the duration and frequency of bursts.
However, the simulations of Spruit & Taam (1993) and D’Angelo & Spruit (2010) donot show the characteristic ‘relaxation-oscillator’ behaviour seen in type II bursts in the RB,where the wait time between bursts scales with the fluence of the previous burst. This isbecause neither set of simulations properly accounted for viscosity in the large-scale disc,which sets the timescale to refill the inner disc regions. Instead, the simulations suppliedgas into the inner regions of the disc at a steady rate, which leads to a steady burst periodfor a given accretion rate. In a realistic disc, if the reservoir of gas is emptied before theouter disc can resupply it with gas, the build-up time will be longer than has been observedin simulations. This introduces a new timescale into the problem: the viscous refilling time.If the accretion rate into the inner disc is unsteady, the timescale between bursts will bevariable, but will be at least as long as it takes for gas to flow into the inner disc. This mayaccount for the recurrence time–fluence relationship seen in Fig. 4.8: the recurrence timehas a minimum (the viscous inflow rate) but can be much longer (if the supply rate suddenlydecreases). D’Angelo & Spruit (2012) indeed found that a steadily decreasing accretion rate(in a large disc) can induce chaotic accretion bursts from the trapped disc instability (fig. 10of that paper). This hypothesis remains to be investigated further.
D’Angelo & Spruit (2012) identified two distinct instability regions for the trapped discinstability: ‘RI’ (long duration, low amplitude bursts), and ‘RII’ (shorter, smaller amplitude
89

4 The RB type II burst population
bursts). In ‘RI’ bursts, ∆r2/r ≲ 0.02 (i.e. the disc makes abrupt transitions between the ac-creting and non-accreting states), and the bursts often have complex profiles and with strongcontrasts between bursting and inter-burst luminosity. In contrast, the ‘RII’ bursts occur atlarger values of ∆r2, bursts are more sinusoidal in shape with higher luminosities, shorterperiods and less contrast between burst and inter-burst luminosities. The complex burst pro-files and characteristic outburst timescales of the mode-0 bursts suggest the RI instability ismore likely applicable for the Rapid Burster.
At high mean accretion rates, the ‘RI’ accretion bursts are longer, with burst profiles thatfrequently show quasi-periodic oscillations (see Fig. 4.15) at the tail of the outburst, similarto mode-0 bursts of the RB. A flat-topped burst is also sometimes seen, although typicallywith an initial spike of accretion, which is not seen in RB mode 0 bursts. As the meanaccretion rate drops, the burst duration and fluence decreases, and the bursts become morewidely separated in time, similar to evolution in the mode-2 bursts of the RB (see Fig. 4.1).
Application to the RB
In comparing the predictions of the trapped disc model to the RB bursts, we consider only theshort burst (mode-2 and short mode-1 bursts). This is because the long mode-0 bursts havesignificantly different properties: they are often Eddington-limited bursts with a distinctiveburst profile and persistent emission that shows a hump and (occasionally) type I bursts,suggesting significant accretion on to the star continues between bursts. We speculate that formode-0 bursts, the trapped disc instability could appear in conjunction with a second physicalprocess (perhaps related to the dramatic state change that marks the onset of type II bursts),but we do not consider this further.
Applying the trapped disc burst model to the RB is challenging, as its spin rate and mag-netic field are unknown. However, if we assume (as this model would suggest) that the typeII bursts begin when rm moves just outside rc, then the ‘critical accretion rate’ (that is, forthe onset of bursts) is about 0.1 MEdd. Equating rm and rc (equations 4.1 and 4.2) at thisaccretion rate leads to a degeneracy between B and P∗. We can set some bounds on theseparameters from other evidence: the appearance of type I bursts suggests B < 1010 G, whileP∗ ≳ 0.0017 s to make the RB compatible with the fastest-rotating known NSs. This leads toa range of B ∼ 6 × 10⁷–1010 G for spin periods P ∼2–80 ms (with the fastest spin periodscorresponding to the smallest magnetic fields). The smaller rc, the nearer the disc will ex-tend to the star, and the shorter the recurrence time will be between bursts, because the bursttimescale is generally set by the viscous diffusion timescale, tvisc ∝ r2in/ν in the disc’s innerregions. For an α-disc viscosity, ν ∼ α(H/r)2(GMr)1/2 (Shakura & Sunyaev 1973, whereH is the scale-height of the disc), so that for α ∼ 0.1, (H/r) ∼ 0.1, tvisc ∼ 10–1000 s atrc for the range of possible spin periods. In D’Angelo & Spruit (2012), the strongest burstsoccur on timescales 0.1–10 tvisc, which would correspond to 1–100 s if the RB is a rapidrotator and 100–104 s if the spin frequency is lower. There is thus considerable degeneracy inthe model, but for a reasonable range of spin periods, magnetic fields and viscosities, it can
90

4.7 Models for Type II bursts
0.10
1.00
0 5 10 15
0.01
0.10
1.00
10 15 20 25 30Time [s]
0.01
0.10
1.00
[L*/L
Ed
d]
Figure 4.15: Bursts predicted by the trapped disc instability for an NS with B = 1010 G and a spin period P =0.02 s, for different mean accretion rates (see Sec. 4.7.1). From top to bottom, M = [0.03, 0.005, 0.002] MEdd,with the burst fluence decreasing (F = [7.8, 1.9, 1.8] × 1038 erg) and recurrence time increasing as the meanaccretion rate decreases. We plotted the properties of these simulated bursts against those of our sample in Fig. 4.7.The viscous response of the disc to the changing inner disc may create a delay in refilling the inner disc for largerbursts, reproducing the behaviour seen in the RB. Note that between bursts accretion in the inner disc is suppressed,and the disc luminosity is generated by the interaction between the disc and the magnetic field.
reproduce the observable features of the RB.In Fig. 4.15, we show bursts at three different accretion rates, choosing representative
simulated parameters that reproduce the RB range of luminosity within the constraints onspin and magnetic field set above. We adopt B = 1010 G, P = 0.02 s and a viscosityν = 10−3(GMr)−1, which gives strong bursts when the mean accretion rate decreases be-low ∼ 10 per cent LEdd. From top to bottom, the accretion rate decreases: M/MEdd =
[0.03,0.005,0.002]. The flux properties of the model agree quite well with the observed prop-erties of the RB (see Fig. 4.7). The fluence in the bursts decrease from 7.8 × 1038 erg inthe brightest burst to 1.8 × 1038 erg in the weaker bursts. In comparison, the RB showsbursts over a somewhat larger range of fluence, with 90 per cent of bursts between 0.13 and
91

4 The RB type II burst population
1.8× 1039 erg. The peak flux in the simulated bursts is nearly independent of accretion rate,which is also roughly consistent with the RB, where the peak luminosity of 90 per cent of thebursts spans a range of ∼ 2.
As discussed in Sec. 4.4.1, the persistent emission between bursts does not show obviouscorrelations with other burst properties, and varies by a factor ∼ 2 for the majority of bursts.This is naturally accounted for by the trapped disc model, where between bursts accretion inthe inner disc is suppressed, and the disc luminosity is generated by the interaction betweenthe disc and the magnetic field, which adds angular momentum and energy to the disc. Sincethe location of the inner disc does not vary much between bursts, the luminosity also staysroughly constant, regardless of the fluence of the subsequent burst. As mentioned above, thisdoes not account for the ‘humps’ and occasional type I bursts seen between long mode-0bursts, since the distinctive nature of mode-0 bursts suggests additional physics beyond thetheoretical picture outlined above.
The observed range of burst recurrence times and durations are less well accounted for inthe model. As described above, all simulations of the instability assumed a constant accretionrate in to a small region of the inner disc, which does not properly account for the time it couldtake the disc to refill after an outburst. As a result, the recurrence timescales linearly withaccretion rate – the lower the mean accretion rate, the longer it takes to refill the reservoirand the weaker the subsequent burst. This is the opposite of what is apparently observed inthe RB. However, if the accretion rate in the inner disc is strongly variable (as is postulatedto explain rapid luminosity variability in the hard state; Lyubarskii 1997), the relationshipbetween the mean accretion rate and burst fluence is less well-defined. Simulations alsoshow bursts with a smaller variation in burst durations (about a factor of 4, with durationsbetween ∼2–8 s) than the RB, in which the majority of bursts (excluding mode 0, whichas we argue above likely have an additional physical process governing their behaviour) lastbetween 2–24 s, with a peak around 3 s.
In summary, the trapped disc instability can reasonably account for multiple properties ofthe RB short type II bursts for a variable accretion rate in the inner disc regions. Simulationscan match observed burst fluences, maximum luminosities, and persistent flux properties forreasonable (albeit poorly constrained) spin and magnetic field. The range of simulated burstdurations and fluences are somewhat smaller (by a factor ∼ 4 and ∼ 2, respectively) than isobserved in the RB. Most significantly, the relaxation-oscillator behaviour is not reproduced,although as we argue above, this is at least in part because the response of the large-scaleviscous disc to the burst instability has not been properly modelled. The finite viscosity inthe disc will delay the refilling time once gas is depleted, lengthening the time between brightbursts. The RB uniqueness may be explained by a special combination of magnetic fieldstrength and stellar spin period (which together sets the accretion rate where the instabilitycan manifest) and an alignment between the magnetic field and the spin axis.
92

4.7 Models for Type II bursts
4.7.2 Other magnetospheric instabilities
Several other mechanisms have been proposed to produce instabilities in the accretion flowthat could explain the RB behaviour, but it is not clear that the timescales on which they areexpected to operate will match the RB. Both mechanisms outlined below rely on the idealmagnetohydrodynamic (MHD) properties of the accretion flow, i.e. that field lines are frozenin to the plasma and may not efficiently re-couple to the disc once the connection is severed(which is expected to happen rapidly due to differential rotation between the field and thedisc). This can lead to either compression of the magnetic field by the disc moving inwardsor unstable fingers of accretion on to the NS surface via interchange instabilities.
Kuijpers & Kuperus (1994) proposed that the perfectly conducting disc can be completelyshielded from the magnetic field of the star, so that the disc will spiral inwards and pinch thedipolar magnetic field along the equator into a distorted ‘butterfly’ shape. This compressionlasts until the matter touches the surface of the star, whereupon the gas penetrates throughthe field and accretes on to the star. This releases the pressure on the magnetic field, whichrapidly re-expands and restarts the cycle. Some version of this scenario is seen in all magneticaccretion simulations (e.g. Hayashi et al. 1996; Miller & Stone 1997; Goodson et al. 1997;Romanova et al. 2009), which use ideal MHD and hence shield the disc from the magneticfield. However, due to the finite numerical diffusivity present in all simulations, the timescalefor the instability is typically a few dynamical timescales, which is much shorter than the RBbursts (∼ 50 − 1000 dynamical times, depending on the spin of the star). Moreover, it isnot at all clear theoretically that gas will have difficulty coupling to the magnetic field, as isrequired by this picture. Simulations of MRI turbulent discs with stratified density profiles(e.g. Davis et al. 2010) show the disc field extends vertically out of the disc, which couldform a low-density magnetized corona above the disc surface (e.g. Jiang et al. 2014). Thiswould provide an obvious site for reconnection, which could recouple the disc to the star andprevent strong compression of the magnetic field.
In this scenario, the burst should have a gradual rise (as the accretion disc spirals inwardstowards the star) with a sudden spike when the gas finally hits the surface. This also seemsinconsistent at least with the short bursts, which show low persistent emission between bursts,although it could perhaps explain the inter-burst humps seen between mode-0 bursts. In orderto match the observed bursting timescales, the original Kuijpers & Kuperus (1994) paper alsoposited a strong 1012 G field for the RB, which is inconsistent with the observation of type IX-ray bursts at relatively high luminosities.
An alternative scenario will develop when the field is not strong enough to efficientlydisrupt the disc, allowing accretion to proceed via interchange (Rayleigh-Taylor) instabilitieson to the star. In this picture the RB magnetic field could be significantly weaker than assumedabove (or the spin rate lower), so that the disc extends down to the star until the accretion ratedrops to ∼ 10 per cent LEdd. At lower luminosities the field will truncate the disc but notenough to enforce accretion on to the poles, and fingers of accretion will extend down tothe stellar surface. This was studied in depth in the in the 3-D simulations of Kulkarni &
93

4 The RB type II burst population
Romanova (2008). However, as in the above scenario, the timescale for the instability istypically the orbital timescale of the inner disc edge, which will be smaller than the spinperiod of the star and thus likely considerably shorter than the observed burst timescalesunless the RB is a very slow rotator.
4.7.3 Thermal/viscous instability models
A number of models have also been proposed that do not rely on a role for the magnetic field.Lewin et al. (1993) have already reviewed them and explained their shortcomings; we willbriefly discuss them in the light of our sample properties.
A class of models invokes thermal (Shakura & Sunyaev 1976) or viscous instabilities(Lightman & Eardley 1974) in the accretion disc to explain the luminosity fluctuations. Bothinstabilities arise in the inner portion of an α disc, where the radiation pressure dominatesand electron scattering is the main source of opacity. Thermal instabilities are due to aninability to maintain a thermal balance, while viscous instabilities arise because the viscousstress becomes inversely proportional to the surface density, breaking up the inner disc inconcentric rings as a result.
These analytical results however only established local criteria for instabilities to grow.They were first tested in a global, time-dependent simulation by Taam & Lin (1984), whoconfirmed the existence of unstable solutions. The produced bursts liberate about the rightamount of energy (1036−38 erg), and the observed durations (0.1–1 s) and recurrence times(∼ 10 s) at least overlap with the (however much broader) ranges observed in type II bursts.Also, the instability develops in a range of mass accretion rates ((0.1 − 0.45) × 1018 g s−1,between 10 and 45 per cent LEdd), above which the flow becomes stable again.
There are two main problems with this model. First, different timescales and energeticscan only be reproduced with variations of the global mass accretion rate. Although thisproblem is shared by the class of magnetospheric models discussed earlier, we should stressthat at least in that case a much broader variety of burst properties is observed, closer tomatching the ranges of fluences, durations and recurrence times that we have characterizedin this study. Secondly, models relying on disc instabilities leave the uniqueness of the RBunaddressed, as they should apply to all accreting compact objects, even black hole binaries,and have indeed been put forward to explain the variability of sources like Cyg X-1.
4.7.4 GR models
An entirely different approach was taken by Walker (1992), who proposed that the RB be anexceptional source in hosting an NS with a radius smaller than the ISCO, surrounded by amassive accretion disc. The latter gives the very low viscosity the model requires. Also, themagnetic field must be weak enough not to disrupt the accretion flow. In this case, rather thanhaving the magnetosphere act as a gate, radiation torques inside the ISCO lead to a suddenspike in the accretion rate, that repeats after the inner disc has been replenished on a viscous
94

4.8 Conclusions
timescale.The predicted burst luminosities match those observed in type II bursts, and the bursts
last between roughly 1 and 50 s. A very large disc would further be compatible with thelarge orbital period of the BP (Porb = 11.8 d), while no orbit information is available forthe RB. The model suffers from the same problem that afflicts all other models, namely thelack of a relaxation oscillator behaviour. But its main shortcoming is that it cannot accountfor type II bursts in the BP, which was only discovered three years after this model wasproposed. Walker (1992) claim that the presence of a massive disc means that even relativelylarge magnetic fields (up to 1012 G) would not disrupt the Keplerian disc before it crosses theISCO. Although estimates of the magnetic field strength in the BP are as low as (2 − 6) ×1010 G (Degenaar et al. 2014), there cannot be any doubt that magnetospheric accretion ishappening in that source, because of the presence of pulsations at the spin frequency, bothin the persistent emission and in the bursts. If GR effects were truly responsible for type IIbursts in the RB, then another mechanism altogether would be at play in the BP.
4.8 ConclusionsOur population study has highlighted a number of new, important features of the type IIbursts. The bursts are Eddington limited, which leaves little doubt as to their origin lyingin accretion episodes. We have constrained the duration of these instabilities to cover the10−1−103 s range, and we have shown that a minimum recurrence time of order of 10 s seemsnecessary to develop a burst. We encourage dropping the old mode-0, -1 and -2 classification,adopting instead a simpler one between short and long bursts, which reflects the dichotomythese show in their interaction with the persistent emission.
We judge models based on thermal and viscous instabilities too general to explain thescarcity of sources displaying type II bursts, while models based on GR effects imply that adifferent phenomenon altogether is responsible for the BP bursts. Models based on the gatingrole of the magnetosphere can reproduce a number of properties in our sample, while at thesame time requiring a fine tuning between the stellar spin, the magnetic field strength, themass accretion rate and the alignment between the magnetic field and the spin axis, and thusaccount better for the uniqueness of the RB.
95
4 The RB type II burst population
4.A Burst search algorithm
The thousands of type II bursts from the RB in the RXTE archive necessitate an automaticburst search algorithm for the identification process. We now proceed to explain the algorithmthat we developed from trial and error. During the development, results were verified byvisual inspection of the light curves.
The automatic procedure employs a light curve generated at 1 s resolution from all PCA’STANDARD-1’ data with the RB in the FOV (2.4 Msec), for all photon energies and forPCU2 which is the only PCU that is always on. Furthermore, the pointing and the elevationof the source above the Earth’s horizon was tracked. From the pointing, the off-axis anglebetween the optical axis to the RB and 4U 1728-34 were calculated. Pointing and elevationinformation is available at 16-s resolution. For unsampled times, the pointing informationwas taken from the prior data point.
First, for each light-curve bin an estimate was made of the persistent emission underlyinga potential burst at that bin, by determining the average of all flux values within 100 s priorto that bin, provided that the pointing is constant within 0.05 deg for at least the previous5 s. If there was no reliable background from those data, the average flux was taken from theposterior 20 to 100 s interval. The background thus determined was subtracted from the fluxof each bin. Second, a ’significance’ was determined by taking the ratio to the Poisson error ofthat bin. If the significance was larger than 1, the bin was further investigated for the presenceof a burst. Third, the background-subtracted flux of subsequent bins after that bin were addedto the signal and the accrued significance determined. This process was repeated for as longas the significance increased, allowing for it to decrease only once. When finished, an attemptwas made to accrue signal going backward in time from the initial bin. Fourth, the candidateburst was verified by checking that no other bursts previously determined (i.e., starting atearlier times) were in the new burst interval, that the total significance was at least 10, thatthe elevation was at least 2.5 degrees, that the pointing was constant during the burst and thatthere was at least one ’empty’ bin between two consecutive bursts. A list of candidate burstswas thus composed. Since this allows for a more careful background determination fromthe original flux array by excluding the burst intervals and, fifth and last, the procedure wasrepeated. When it was impossible to determine the background, the burst was ignored.
All type I bursts from the RB show the typical fast-rise-exponential-decay (FRED) shape.Soft-state type I bursts have rise times (7.1 s) and durations (∼100 s; B13), which are rela-tively long for type I bursts, and typical of the burning of H-rich fuel (Lewin et al. 1993). Aswe have shown in Sec 4.4.3, hard-state type I bursts are typically shorter (∼40 s). Nonethe-less, type II bursts of comparable durations cannot mimic the FRED shape, because multiplepeaks appear in their decays (Tan et al. 1991). This allows identification of a RB type I bursteven when its profile in the light curve overlaps with those of several fast-recurring type IIbursts (as in Fig.4.13, bottom).
As for type I bursts from 4U 1728-34, they show instead the much faster time scales(rise time <1 s, duration ≃10 s) that are typical of H-poor nuclear fuel (Galloway et al.
96

4.B Spectral analysis
2010b), and based only on this could be confused with short RB type II bursts. How-ever, the bursts from 4U 1728-34 show a characteristic bimodal distribution of peak fluxes(9.2×10⁻⁸ erg cm−2 s−1 for the bursts showing photospheric radius expansion (PRE) and4.5×10−8 erg cm−2 s−1 for normal bursts, Galloway et al. 2008), which are much largerthan observed in RB type II bursts. Still, when the PCA is pointed at the RB the peaks fluxesof the weakest 4U 1728-34 bursts can be similar to those of the brightest RB type II bursts.Again, the multiple peaks in the decays reveal the nature of the latter.
Thus, a list of 8754 bursts was derived. Eighteen of these concern overlap between twokinds of bursts. The breakdown of three kinds of bursts is: type I bursts from the RB (123,9 overlapping), type-I bursts from 4U 1728-34 (167, 9 overlapping) and type II bursts fromthe RB (8458, 18 overlapping). Twenty-two bursts could not be definitely identified becauseof insufficient statistics. They are either type I from the Rapid Burster or type II. Otherwise,type-I bursts from 4U 1728-34 are easily recognizable because they are approximately twotimes brighter than the brightest type II bursts from the RB and last the shortest. The lattercharacteristic is necessary for identification because, when the PCA points at the RB and 4U1728-34 is an off-axis angle of 0.5 degrees, the collimator shadow cuts the measured peakflux in roughly two and is comparable to the brightest bursts of the RB. For the other twopointing configurations, identifying bursts from 4U 1728-34 is unambiguous. The differencebetween type I and II bursts from the RB is also manageable. Type I bursts are at least 20 slong, have a typical long tail (Bagnoli et al. 2013, 2014) and show no ringing, contrary tomost type II bursts.
The start and end times of the bursts were determined by searching, starting from the binwith the highest flux, downward and upward, respectively, for the last times when the fluxdrops below 10% of the peak flux. Notably, we identified a record duration for a mode-0burst. Observation ID 92026-01-06-03 apparently starts off during a type II bursts whichsubsides only after 1100 s in a fashion typical for a mode-0 burst.
4.B Spectral analysis
In principle one would like to perform a full time-resolved spectroscopic analysis of eachtype II burst to determine parameters such as peak flux (in erg cm−2s−1), burst fluence (inerg cm−2), fluence of the persistent emission between bursts and α. However, given previ-ously published spectral analyses of RB data data (e.g., Marshall et al. 1979; Rutledge et al.1995; Marshall et al. 2001; Mahasena et al. 2003), there is merit in asking whether that is nec-essary. Spectral variability during and between type II bursts is presumably limited and theaverage energy per photon is probably nearly constant. In order to verify this and determinea conversion factor between PCA-detected photons and energy, we analyzed a representativesubset of the data. The subset was drawn from the ’offset’ observations that are free from con-tamination by 4U 1728-34. Eleven observations, identified by unique ObsIDs, were chosenrepresenting typical as well as extreme behavior of the RB. They are listed in Table 4.2.
97

4 The RB type II burst population
Table4.2:
Arepresentative
subsetofRB
observationsforspectralstudies
ObsID
Date
ofType
ofbehaviorB
olometric
fluxrange
Observation
(10−8
ergcm
−2s −
1)20418-01-01-01R
17-jun-1997brightsoftstate
1.220093-01-07-01R
26-jun-1997high
softstate1.3
20418-01-07-0010-jul-1997
faintersoftstate0.26
30424-01-01-02R25-aug-1998
mode
0,shortbursts0.1-1.7
30424-01-02-02R29-aug-1998
mode
1,sequenceof5
bursts0.1-2.5
30424-01-03-02R1-sep-1998
mode
1,sequenceof20
bursts0.1-2.8
30424-01-04-02R4-sep-1998
mode
2,sequenceof22
bursts0.1-0.8
30424-01-06-01R10-sep-1998
mode-2,single
burstintailoutburst
0.1-0.892026-01-06-00
23-jun-2006m
ode0,sequence
of5shortbursts
(brightestfluxesfrom
RB
)0.2-3.3
92026-01-06-0326-jun-2006
mode
0,record-longburst(>
1300s)
0.15-0.892026-01-06-04
27-jun-2006tem
poraryreturn
tosoftstate
0.45-0.55
98
4.B Spectral analysis
The time resolution of the spectral analysis varied across the different observations andwithin observations is chosen to follow the variability in flux. In total 374 spectra wereextracted from these 11 observations, involving 8 mode-0 bursts (including the longest onedetected), 25 mode-1 bursts and 23 mode-2 bursts.
The spectral analysis involves the following generalities. Spectra were extracted fromevent-mode data with 64 spectral channels. All active PCUs were employed. The band-pass was limited to 2.5-20 keV which is where the PCA is well calibrated (Jahoda et al.2006; Shaposhnikov et al. 2012) and contains most of the signal. A systematic error of 0.5per cent per channel was included (following Shaposhnikov et al. 2012). All spectra werecorrected for particle background and cosmic diffuse background as predicted through thePCABACKEST tool (version 3.8). The PCA response matrix was calculated with version11.7.1 of tool PCARSP. This includes a correction for the collimator response which is al-ways non-standard because the RB is always considerably off-axis in the selected ObsIDs.The collimator throughput for the RB was usually about 0.4. Spectral bins were combinedto obtain at least 20 counts per bin to ensure applicability of the χ2 statistic. All spectralmodelling was carried out with XSPEC version 12.8.2. A constant cold interstellar absorptioncomponent was assumed to apply, equivalent to NH = 1.6× 1022 cm−2 (Frogel et al. 1995).The absorption model of Morrison & McCammon (1983) was followed.
A significant contribution may be expected from the Galactic Ridge. To determine this,off-axis observation ID 92026-01-04-00 was chosen which represents the observation withthe lowest flux measured for the RB field. It was taken on June 9, 2006, 11 days before theonset of the outburst presented in Fig. 1. The background-subtracted data was modelled withthe combination of a Raymond-Smith component (Raymond & Smith 1977) and a power law,following the prescription of Valinia & Marshall (1998) as also determined from PCA ridgedata. The fit was satisfactory with χ2
ν = 1.79 (ν = 20). This constant spectral componentwas assumed to be present in all studied RB spectra.
We tested various models on the data: single component models (power law, Planckfunction, thermal bremsstrahlung, Comptonization) and models with combinations of twocomponents. It was found that models with three free parameters were sufficient to describeall spectra. We chose the Comptonization model according to Titarchuk (1994); Titarchuk &Lyubarskij (1995) as baseline since this is the simplest model fitting all data. Furthermore, wefind that this model performs best to the highest quality spectrum (20093-01-07-01R whosespectrum contains 106 counts), with χ2
ν = 0.92 for ν = 20. As an example, for the samedata χ2
ν = 11.3 for a model consisting of a disk black body and a power law, and 6.88 for acut-off power law. We note that it was necessary to complement the continuum model witha narrow line at about 6.5 keV, in the spectral region where the Fe-K resonance line resides(6.4-6.9 keV, depending on the ionization state of Fe). Possibly it is related to instrumentallyscattered emission from the bright source 4U 1728-34 just outside the field of view, or to aninadequate modelling of the Galactic Ridge at this location.
Figure 4.16 shows an example of a time history for observation 92026-01-06-00 whichshows a sequence of 5 bright and relatively short mode-0 bursts. What is clearly visible
99

4 The RB type II burst population
Figure 4.16: Time-resolved spectroscopy for ObsID 92026-01-06-00. The response is corrected for the off-axisposition of the RB. The fitted model is the Comptonization model according to Titarchuk (1994).
100

4.B Spectral analysis
here, and that applies in general to all our spectral results, is that plasma temperature andoptical depth show no significant variability, while photon seed temperature does. The plasmatemperature varies in general between 2.5 and 3.5 keV while at the same time the plasmaoptical depth varies between 7 and 4, both typical 1-sigma errors of 1 in value. A moredetailed analysis of the spectral data is subject for a future paper. We here confine the analysisto inferring an average translation factor between photon fluxes and fluences and energyfluxes and fluences.
For the most accurately determined 112 spectral shapes, we find that a photon flux of1 c s−1PCU−1 for the whole bandpass translates on average to a 2.5-20 keV energy flux of(1.02 ± 0.02) × 10−11 erg cm−2s−1. All 112 conversion values are contained within 7%from this average. Thus, the maximum systematic error by assuming a constant conversionfactor is 7%. Converting from 2.5-20 keV energy flux to unabsorbed bolometric flux involvesa factor of 1.24 ± 0.07. All 112 bolometric correction factors range between -7% and +2%from the mean. Therefore, the maximum systematic error in the bolometric correction factoris 7%.
In Fig. 4.17 we show spectra of the five most diverse states of the RB. The conversionfactor from c s−1PCU−1 to unabsorbed bolometric erg cm−2s−1 varies between 1.23×10⁻¹¹
and 1.56× 10⁻¹¹.
101

4 The RB type II burst population
105 20
0.1
1
keV
2 (
Photo
ns c
m−
2 s
−1 k
eV
−1)
Energy (keV)
Figure 4.17: Unfolded 2.5-30 keV ν − fν spectra for five widely different states of RB. From bottom to top:non-burst emission between slow mode-2 bursts (black curve, ObsID 30424-01-06-01R), non-burst emission in longintermission between mode-1 bursts (light blue, 30424-01-02-02R), peak of longest mode-0 burst ever measured(green; 92026-01-06-03), soft state prior to mode-0 (red; 20418-01-01-01R), peak of bright short mode-0 burst(dark blue; 30424-01-01-02R). The lowest spectrum shows the iron line clearly whose origin is undetermined.
102

5Discovery of GRS 1915+105 variability
patterns in the Rapid Burster
T. Bagnoli and J.J.M. in ’t Zand
Published in Monthly Notices of the Royal Astronomical Society: Letters, Volume 450, Issue1, p.L52-L56 (2015)
Abstract
We report the discovery of two new types of variability in the neutron star low-mass X-ray binary MXB 1730–335 (the ‘Rapid Burster’). In one observation in 1999, it exhibits alarge-amplitude quasi-periodic oscillation with a period of about 7 min. In another observa-tion in 2008, it exhibits two 4-min-long 75 per cent deep dips 44 min apart. These two kindsof variability are very similar to the so-called ρ or ‘heartbeat’ variability and the θ variabil-ity, respectively, seen in the black hole low-mass X-ray binaries GRS 1915+105 and IGRJ17091–3624. This shows that these types of behaviour are unrelated to a black hole natureof the accretor. Our findings also show that these kinds of behaviour need not take place atnear-Eddington accretion rates. We speculate that they may rather be related to the presenceof a relatively wide orbit with an orbital period in excess of a few days and about the relationbetween these instabilities and the type II bursts.

5 GRS 1915+105 variability patterns in the RB
5.1 Introduction
The Rapid Burster (RB, or MXB 1730–335) was discovered by Lewin et al. (1976) as asource of few-second long X-ray bursts with recurrence times as small as 6 s, much fasterthan similar bursts in other sources with recurrence times of an hour or longer. The RBitself was later resolved to exhibit both kinds of X-ray bursts which were from then on called(slow) thermonuclear type I and (rapid) accretion-powered type II X-ray bursts (Hoffmanet al. 1978). Up to this date, this dual character of the RB remains unique. The RB is locatedin the globular cluster Liller 1, which yields an independent distance estimate of 7.9±0.9 kpc(Valenti et al. 2010).
Type I X-ray bursts have so far been seen from about 100 low-mass X-ray binaries(LMXBs) in our galaxy. The accretor is a neutron star (NS), on which H and/or He is piledup from the atmosphere of the Roche-lobe overflowing companion star. After a certain time,typically a few hours, ignition conditions are reached at the bottom of the pile and a thermonu-clear runaway burns the hydrogen and helium within a fraction of a second. Subsequently,the photosphere heats up to a few tens of MK and cools off, giving rise to a softening X-rayburst of duration ∼1 min (see reviews by Lewin, van Paradijs, & Taam 1993 and Strohmayer& Bildsten 2006).
Type II bursts have so far only been identified in two LMXBs: the RB and the BurstingPulsar (BP). The BP (Kouveliotou et al. 1996) is a transient accretion-powered X-ray pulsarwith a period of 0.467 s and a magnetic dipole field strength of a few times 1010 G, and aprobably low-mass giant companion star in an 11.8 d orbit (Finger et al. 1996; Degenaar et al.2014).
The RB is less well defined than the BP. Neither the NS spin frequency nor the dipolarmagnetic field is known because of the lack of X-ray pulsations. This could either be due to amagnetic field smaller than in the BP (indeed the majority of bursters do not show persistentpulsations), or because of a close alignment of either the observer’s line of sight or the mag-netic dipolar component with the rotation axis. The orbital period is also not known. The RBis a transient that goes into outbursts every 100–200 d. The accretion rate increases to quitehigh values, close to the Eddington limit (Bagnoli et al. 2013), which is rare among LMXBs.
The RB was abundantly observed with the Proportional Counter Array (PCA) on the RossiX-ray Timing Explorer (RXTE). A total exposure time of 2.4 Ms was obtained in 17 years ofobservations, and the RB was active during 1.4 Ms of these (Bagnoli et al. 2015). The largeexposure time and large sensitivity of the PCA provide excellent opportunity to detect rarebehaviour in the RB. In this Letter we present the detection of two kinds of peculiar behaviourof the RB, and speculate on their implications.
104
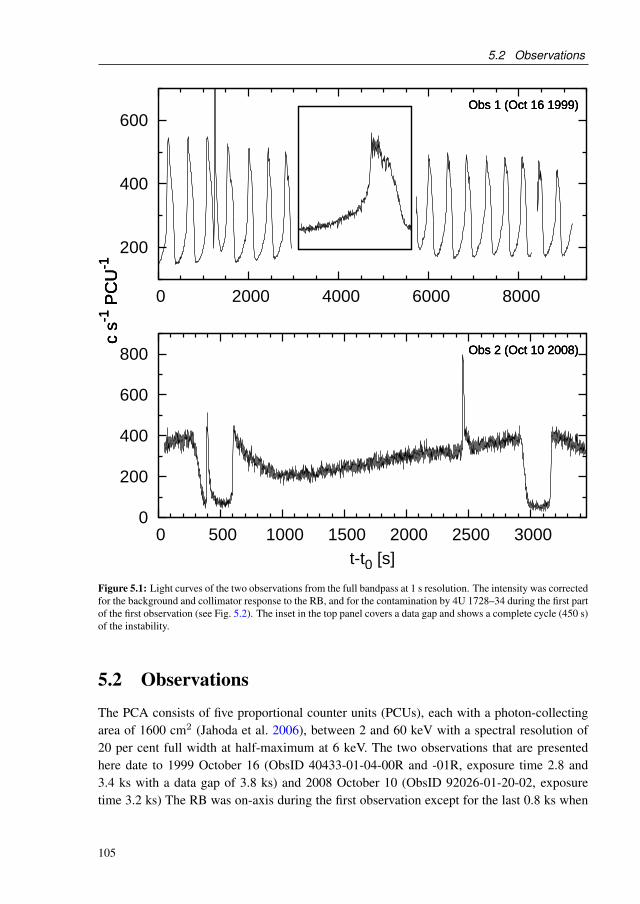
5.2 Observations
200
400
600
0 2000 4000 6000 8000
c s-1
PC
U-1
Obs 1 (Oct 16 1999)
Obs 2 (Oct 10 2008)
c s-1
PC
U-1
Obs 1 (Oct 16 1999)
Obs 2 (Oct 10 2008)
0
200
400
600
800
0 500 1000 1500 2000 2500 3000t-t0 [s]
c s-1
PC
U-1
Obs 1 (Oct 16 1999)
Obs 2 (Oct 10 2008)
Figure 5.1: Light curves of the two observations from the full bandpass at 1 s resolution. The intensity was correctedfor the background and collimator response to the RB, and for the contamination by 4U 1728–34 during the first partof the first observation (see Fig. 5.2). The inset in the top panel covers a data gap and shows a complete cycle (450 s)of the instability.
5.2 Observations
The PCA consists of five proportional counter units (PCUs), each with a photon-collectingarea of 1600 cm2 (Jahoda et al. 2006), between 2 and 60 keV with a spectral resolution of20 per cent full width at half-maximum at 6 keV. The two observations that are presentedhere date to 1999 October 16 (ObsID 40433-01-04-00R and -01R, exposure time 2.8 and3.4 ks with a data gap of 3.8 ks) and 2008 October 10 (ObsID 92026-01-20-02, exposuretime 3.2 ks) The RB was on-axis during the first observation except for the last 0.8 ks when
105

5 GRS 1915+105 variability patterns in the RB
the nearby bright 4U 1728–34 was slewed out of the field of view, thereby putting the RBat an off-axis angle of 0.56 deg and avoiding contaminating signal from 4U 1728–34. Thepointing of the second observation was identical to the last 0.8 ks of the first observation,excluding the signal from 4U 1728–34.
Figure 5.1 (upper panel) shows the light curve of the first observation. A strong quasi-periodic oscillation is apparent with a period varying from ∼ 350 to ∼ 450 s and a peak-to-peak amplitude of roughly 70 per cent (from ≈ 600 to ≈ 200 c s−1PCU−1). We observed15 such flares. The last two flares occurred during a pointing uncontaminated by 4U 1728-34. This behaviour has not been seen from the RB in any other RXTE observation or inany other published observation. Near the 1300 s mark, a burst takes place, lasting about100 s and significantly sub-Eddington. The characteristics of this burst are consistent withbeing of type I: it shows a decreasing spectral hardness and lacks ringing during the decay sotypical of type II bursts of this duration (Bagnoli et al. 2015). The type-I burst is identifiedto originate from the RB, because its peak flux, duration and lack of photospheric expansionare consistent with other bursts from the RB and inconsistent with all other bursts from 4U1728-34 (for more details on the burst identification, see Bagnoli et al. 2013).
The light curve of the second observation is plotted in Fig. 5.1 (lower panel). It shows agradual change in intensity with two dips by about 75 per cent in intensity lasting 260 and220 s, respectively (from halfway ingress to halfway egress). The ingresses are about 100 and80 s long, while the egresses last a shorter 40 and 20 s. The persistent emission outside dipspeaks at about 400 c s−1PCU−1right after the first dip, falls to 200 c s−1PCU−1in 400 s, andthen peaks again at the roughly the same maximum value right before the second one. Theentire cycle (ingress, dip, egress, maximum, decreasing and increasing back to maximum)lasts about 2650 s. The second dip is on average about 50 c s−1PCU−1. Judging from theportions of the light curve before the first dip and after the second, the behaviour seems to beroughly cyclical. Also, there are two bursts, one of them in a dip. These are also of type I,following the above-mentioned arguments. They must be from the RB because 4U 1728–34was outside the field of view. Both have a net peak flux of 460 c s−1PCU−1, calculated withrespect to the persistent emission flux right before. The type I burst recurrence time is 2.1 ks.
5.3 Data analysis
In Fig. 5.2, the intensity versus hardness ratio diagram is drawn for both observations. Itshows that, in the first observation, the rises and falls of the oscillations follow the sametrack, without hysteresis.
In general, the spectrum of the RB (including type II bursts, but excluding type I bursts)is satisfactorily modelled by a Comptonized spectrum (Bagnoli et al. 2015). Therefore, weapplied this model to the two observations. We only included data for which 4U 1728–34was outside of the field of view. This pertains to the last 0.8 ks of the first observation andthe complete second observation. The results are presented graphically in Fig. 5.3. Indeed,
106
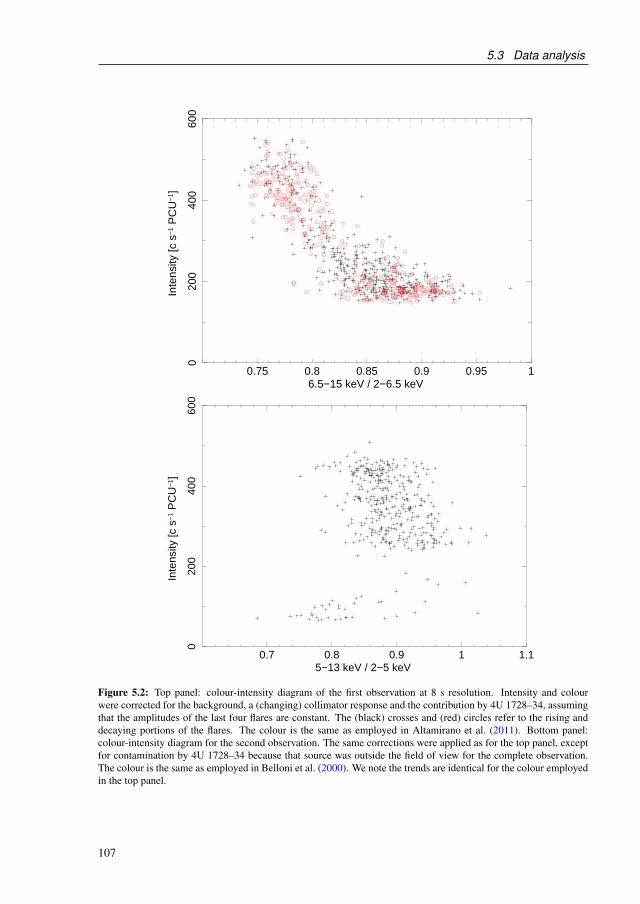
5.3 Data analysis
0.75 0.8 0.85 0.9 0.95 1
020
040
060
0
Inte
nsity
[c s
−1
PC
U−
1 ]
6.5−15 keV / 2−6.5 keV
0.7 0.8 0.9 1 1.1
020
040
060
0
Inte
nsity
[c s
−1
PC
U−
1 ]
5−13 keV / 2−5 keV
Figure 5.2: Top panel: colour-intensity diagram of the first observation at 8 s resolution. Intensity and colourwere corrected for the background, a (changing) collimator response and the contribution by 4U 1728–34, assumingthat the amplitudes of the last four flares are constant. The (black) crosses and (red) circles refer to the rising anddecaying portions of the flares. The colour is the same as employed in Altamirano et al. (2011). Bottom panel:colour-intensity diagram for the second observation. The same corrections were applied as for the top panel, exceptfor contamination by 4U 1728–34 because that source was outside the field of view for the complete observation.The colour is the same as employed in Belloni et al. (2000). We note the trends are identical for the colour employedin the top panel.
107

5 GRS 1915+105 variability patterns in the RB
Figure 5.3: Spectral analysis of the two observations, employing a Comptonization model. For the first observa-tion, only the uncontaminated portion of the data was employed. The entire second observation is unaffected bycontamination. The type I bursts were ignored.
108

5.4 Discussion
the model is satisfactory. There is mild spectral variability, with the spectral hardness anti-correlating with the flux. There is no evidence for increased absorption during the dips. Theflux change is mostly due to a change in the normalization, which represents projected emis-sion region size. The bolometric flux for the applied model is (2 − 5)×10−9 erg cm−2 s−1
during the first observation, and (1 − 6)×10−9 erg cm−2 s−1 during the second. Under thesame assumptions as in Bagnoli et al. (2015) this corresponds to 7 – 18 and 3.5 – 21 per centof the Eddington luminosity, respectively.
Contiguous RXTE observations span 15 to 3 d before the Oct. 16, 1999 observation and 3to 12 d after it, and 5 to 2 d before and then again 6 d after the 2008 October 10 observation. Inboth cases, the source was clearly in the high/soft state in the prior observations, only emittingtype I bursts (for the general spectral and outburst behaviour of the source, see Bagnoli et al.2015), while, afterwards, it had switched to the low/hard state, showing a fainter persistentemission (by a factor of ≈5) and both type I and II bursts. Both types of behaviour are,therefore, coincident with the transitional state of the source, like the ≈ 10 s dips in sometype I bursts in the same state (Bagnoli et al. 2014). Prior to the second observation, six long(∼60 s) type I bursts were visible, with a measured recurrence time of 2.2 ks. The observedtrec, which we have shown to be a tight function of the accretion rate in the RB (Bagnoli et al.2013) is compatible with this transitional-state identification.
The type I burst and the flaring activity in the first observation do not seem to affect oneanother. Likewise, the two type I bursts in the second observation show nearly identical peakfluxes and durations, despite taking place during the dip and well outside it, respectively. Theoscillations and the dips are therefore unaffected by thermonuclear burning taking place onthe surface, and vice versa.
5.4 Discussion
We have discovered two new kinds of behaviour that have never been seen before from theRB, and add to the complexity of this peculiar source. Light curves similar to the ones anal-ysed here have only been seen in two other LMXBs, GRS 1915+105 and IGR J17091–3624.Both are thought to harbour black holes (BHs), although only the former has a dynamicalmass measurement (most recently refined to 12.4+2.0
−1.8 M⊙; Reid et al. 2014).GRS 1915+105 has the largest orbit among LMXBs (orbital period 33.5 d; Greiner et al.
2001), has been active for 20 years (Castro-Tirado et al. 1994) and shows super-Eddingtonfluxes and superluminal jets with a distance of ≈ 12.5 kpc (Mirabel & Rodríguez 1994). It ex-hibits at least twelve classes of variability (Belloni et al. 2000). In general, the extraordinarybehaviour is attributed to intermittent ejections from the disc (Klein-Wolt et al. 2002; Fender& Belloni 2004). IGR J17091–3624 is less well characterized. Orbital period, distance andBH mass are unknown.
The first RB observation highly resembles the ρ (‘heartbeat’) variability state of GRS1915+105 (Belloni et al. 2000) and IGR J17091–3624 (Altamirano et al. 2011). In all three
109

5 GRS 1915+105 variability patterns in the RB
sources, the heartbeats are asymmetric, decaying faster than they rise. The ρ behaviour is theslowest in the RB, with timescales of ≈ 2−100 s in IGR J17091–3624, and ≈ 40−120 s forGRS 1915+105 (Neilsen et al. 2011). The relative scatter in the timescale of the RB is similarto that seen in GRS 1915+105, where the period can vary by more than 20 per cent betweenconsecutive flares (Neilsen et al. 2011). Variability near the maxima of the modulation isvisible in the RB observation and has also been noticed in GRS 1915+105 (Belloni et al.2000). The fractional amplitudes are similar, 60–75 per cent.
The largest difference in behaviour is that in GRS 1915+105 the peak flux of the modu-lation is 80–90 per cent of the Eddington limit (Neilsen et al. 2011). In the RB, this is only18 per cent. The uncertainty on the luminosity in terms of the Eddington limit (see Bagnoliet al. 2015) cannot bring the two results in agreement. The spectra behave partially similarly.The pattern of the RB in the hardness–intensity diagram (HID, Fig. 5.2) partly follows theone in GRS 1915+105 when the latter is below about 6000 c s−1 PCU−1 (Altamirano et al.2011), with hard low-flux intervals and soft high-flux ones. However, the highest luminos-ity points reached by GRS 1915+105 are the hardest, and create a circular hysteresis patternin the HID that is not seen in the RB. Note that IGR J17091–3624 also shows a hysteresispattern, although in an opposite sense to GRS 1915+105.
The intrinsic luminosity of IGR J17091–3624 is not known, due to the lack of a distancemeasurement. Assuming the source emitted at the Eddington limit like GRS 1915+105, thiswould imply either a distance in excess of 20 kpc, with a galactic latitude suspiciously highabove the disc, or an extremely low mass BH (< 3M⊙, Altamirano et al. 2011; Rao &Vadawale 2012). However, hydrodynamical simulations by Janiuk et al. (2015) found thata thermal-viscous instability led by radiation-pressure domination in the innermost regionof disc can occur for luminosities as small as 10 per cent of the Eddington limit, and canreproduce the time scales and amplitudes of the heartbeat light curves. The disc is stable atsmaller luminosities, while larger ones produce, in regions of the disc further out, a windso strong it effectively depletes the inner disc, killing off the instability. Their hypothesis issupported by the detection of strong absorption lines (due to outflows) in the spectrum of IGRJ17091–3624, which become undetectable when the luminosity decreases and the instabilitybecomes visible (King et al. 2012). A sub-Eddington luminosity would bring IGR J17091–3624 better into agreement with the radio/X-ray correlation for BH (Rodriguez et al. 2011).Clearly, the appearance of the ρ class in the RB at roughly the same fraction of the Eddingtonlimit supports this scenario.
A possible explanation for the lack of hysteresis in the RB as shown by the BH accretorsduring the ρ variability could be related to the presence of an additional emission componentfrom the solid surface and/or boundary layer of the former. As shown by Done & Gierlinski(2003), NS and BH accretors clearly show different spectral evolutions as a function of lumi-nosity in their bright states, which is due to the presence of a surface in the case of NSs.
In all three sources, the flares in the heartbeat are asymmetric: they decay sharply, to thenrise more gradually. This is true for all hard phases in GRS 1915+105 which Belloni et al.(1997a,b) interpreted as the result of a viscous-thermal instability in the accretion disc, with
110

5.4 Discussion
the rise time determined by the speed at which a heating wave moves through the disc, andthe faster decay time corresponding to the infall of matter into the BH.
The second observation highly resembles the θ-class variability of GRS 1915+105 (notseen in IGR J17091–3624). This class also presents ‘M’-shaped light curves separated by100-200 s long minima. The luminosities are again lower in the RB than in GRS 1915+105,where this variability reaches the Eddington limit (Belloni et al. 2000). The spectral be-haviour of the RB is similar to that observed in GRS 1915+105, in which the ‘M’ portionsare harder, while the dips are slightly softer. The separation is however not as clear as in GRS1915+105.
A particularly interesting feature of the θ variability in the RB is the occurrence of anunaffected type I burst during the dip. The burst reveals that the NS emission must be unaf-fected. Still, the accretion disc flux drops by 75 per cent within a matter of 60 s. This pointseither to a cylindrically asymmetric disc which is obscured from below or above our line ofsight to the NS or to a global change of the emissivity of the disc, for instance by a loss ofmass. The latter would be consistent with the ideas about GRS 1915+105.
Just as there are similarities between the RB and GRS 1915+105, there are similaritiesbetween the RB the BP: like the RB, the BP shows type II bursts. GRS 1915+105 and the BPare physically better characterized than the RB and it is tempting to search for commonalitiesand attribute those to the RB as well. Both sources have relatively long orbital periods of 33.5and 11.8 d, respectively. IGR J17091–3624 may also have a large orbital period (Wijnandset al. 2012; Ghosh & Chakrabarti 2014). A long orbital period points to a relatively largeaccretion disc, which naturally explains the large accretion rates. It may be smaller for theRB, because its transient outbursts last shorter and recur more frequently, but still longerwith respect to the average LMXB. Wu et al. (2010) have shown that a single relation existsbetween the maximum outburst luminosity as a fraction of Eddington and the orbital periodfor NS and BH LMXBs. Substituting the maximum observed persistent luminosity Fpeak =
0.45FEdd (Bagnoli et al. 2013) yields indeed a relatively large Porb = 7.8 d for the RB.It is striking that similar behaviour is present between the RB, an NS system, and the
two BH systems, even more because they are all peculiar sources among their own classes.Also, both the observations analysed here take place at the transition between a type-II-burst-free state and an active type II bursting phase, which suggests that type II bursts and thesevariabilities might be connected. With respect to this, we note that apart from variabilityclasses θ and ρ, GRS 1915+105 shows light curves (particularly those of variability classes µand λ, see Belloni et al. 2000) that resemble the type II burst behaviour in the RB.
However, there are important differences. The type II bursts are well known to show verylittle hardness variations (see e.g., Appendix B in Bagnoli et al. 2015), whereas the inten-sity variations during variability in GRS 1915+105 always correspond to spectral transitions.Also, while the type II burst rise times are always shorter than the decay time (which is whythey can be mistaken for type I bursts and vice versa) and their duration determines the wait-ing time to the next burst, the opposite is true for the λ variability class in GRS 1915+105,where rises are slower than decays and the duration of a burst correlates with that of the pre-
111

5 GRS 1915+105 variability patterns in the RB
vious quiescent phase, compatibly the thermal instability picture mentioned above (Belloniet al. 1997a). Finally, type II bursts in the RB only appear below a critical persistent luminos-ity of about 0.1LEdd (Bagnoli et al. 2015), whereas states of GRS 1915+105 with no largeamplitude variations (ϕ and χ) are not clearly separated in luminosity from the other ones.
Nonetheless, these differences might be related to the nature of the accretor, for exam-ple because NSs possess a strong magnetic dipole field. It would be interesting to performcomplete population studies of the X-ray bursts in the BH systems and the BP, to carry out acomparison with the results by Bagnoli et al. (2015) for the RB.
AcknowledgementsWe would like to thank Jeroen Homan, Peter Jonker, Michiel van der Klis, Alessandro Pa-truno and Manuel Torres for the useful discussion and commentary provided, and the anony-mous referee for their suggestions.
112

Bibliography
Alpar, M. A., Cheng, A. F., Ruderman, M. A., & Shaham, J. 1982, Nature, 300, 728Altamirano, D., van der Klis, M., Wijnands, R., & Cumming, A. 2008, ApJ, 673, L35Altamirano, D., Belloni, T., Linares, M., et al. 2011, ApJ, 742, L17Armitage, P. J., & Livio, M. 1998, ApJ, 493, 898Baade, W., & Zwicky, F. 1934, Physical Review, 46, 76Baan, W. A. 1977, ApJ, 214, 245Baan, W. A. 1979, ApJ, 227, 987Bagnoli, T., in’t Zand, J. J. M., D’Angelo, C. R., & Galloway, D. K. 2015, MNRAS, 449,
268Bagnoli, T., in’t Zand, J. J. M., Galloway, D. K., & Watts, A. L. 2013, MNRAS, 431, 1947Bagnoli, T., in’t Zand, J. J. M., Patruno, A., & Watts, A. L. 2014, MNRAS, 437, 2790Belloni, T., Klein-Wolt, M., Méndez, M., van der Klis, M., & van Paradijs, J. 2000, A&A,
355, 271Belloni, T., Méndez, M., King, A. R., van der Klis, M., & van Paradijs, J. 1997a, ApJ, 488,
L109Belloni, T., Méndez, M., King, A. R., van der Klis, M., & van Paradijs, J. 1997b, ApJ, 479,
L145Belloni, T., Psaltis, D., & van der Klis, M. 2002, ApJ, 572, 392Bhattacharya, D., & van den Heuvel, E. P. J. 1991, Phys. Rep., 203, 1Bhattacharyya, S., & Strohmayer, T. E. 2006a, ApJ, 636, L121Bhattacharyya, S., & Strohmayer, T. E. 2006b, ApJ, 641, L53Bildsten, L. 1998, in NATO ASIC Proc. 515: The Many Faces of Neutron Stars., ed. R. Buc-
cheri, J. van Paradijs, & A. Alpar, 419Bildsten, L. 2000, in American Institute of Physics Conference Series, Vol. 522, American
Institute of Physics Conference Series, ed. S. S. Holt & W. W. Zhang, 359Bildsten, L., & Brown, E. F. 1997, ApJ, 477, 897Boirin, L., Keek, L., Méndez, M., et al. 2007, A&A, 465, 559Brown, E. F., & Bildsten, L. 1998, ApJ, 496, 915Castro-Tirado, A. J., Brandt, S., Lund, N., et al. 1994, ApJS, 92, 469Cavecchi, Y., Watts, A. L., Braithwaite, J., & Levin, Y. 2013, MNRAS, 434, 3526
113
BIBLIOGRAPHY
Cavecchi, Y., Watts, A. L., Levin, Y., & Braithwaite, J. 2015, MNRAS, 448, 445Cavecchi, Y., Patruno, A., Haskell, B., et al. 2011, ApJ, 740, L8Chadwick, J. 1932, Nature, 129, 312Chakraborty, M., & Bhattacharyya, S. 2011, ApJ, 730, L23Chamel, N., & Haensel, P. 2008, Living Reviews in Relativity, 11, 10Chandrasekhar, S. 1931, ApJ, 74, 81Chen, K., & Ruderman, M. 1993, ApJ, 408, 179Cornelisse, R., in ’t Zand, J. J. M., Verbunt, F., et al. 2003, A&A, 405, 1033Cui, W. 1997, ApJ, 482, L163Cumming, A., & Bildsten, L. 2000, ApJ, 544, 453Cumming, A., Zweibel, E., & Bildsten, L. 2001, ApJ, 557, 958D’Angelo, C. R., Fridriksson, J. K., Messenger, C., & Patruno, A. 2015, MNRAS, 449, 2803D’Angelo, C. R., & Spruit, H. C. 2010, MNRAS, 406, 1208D’Angelo, C. R., & Spruit, H. C. 2011, MNRAS, 416, 893D’Angelo, C. R., & Spruit, H. C. 2012, MNRAS, 420, 416Davis, S. W., Stone, J. M., & Pessah, M. E. 2010, ApJ, 713, 52Degenaar, N., Miller, J. M., Harrison, F. A., et al. 2014, ApJ, 796, L9Degenaar, N., Miller, J. M., Wijnands, R., Altamirano, D., & Fabian, A. C. 2013, ApJ, 767,
L37Done, C., & Gierlinski, M. 2003, MNRAS, 342, 1041Done, C., Gierlinski, M., & Kubota, A. 2007, A&A Rev., 15, 1Duncan, R. C., & Thompson, C. 1992, ApJ, 392, L9Egron, E., di Salvo, T., Burderi, L., et al. 2011, A&A, 530, A99Falanga, M., Farinelli, R., Goldoni, P., et al. 2004, A&A, 426, 979Falanga, M., Kuiper, L., Poutanen, J., et al. 2011, A&A, 529, A68Fender, R., & Belloni, T. 2004, ARA&A, 42, 317Ferrario, L., & Wickramasinghe, D. 2006, MNRAS, 367, 1323Finger, M. H., Koh, D. T., Nelson, R. W., et al. 1996, Nature, 381, 291Fisker, J. L., Thielemann, F.-K., & Wiescher, M. 2004, ApJ, 608, L61Fox, D., Smith, D., Lewin, W., & Rutledge, R. 1998, The Astronomer’s Telegram, 32, 1Fox, D. W., Lewin, W. H. G., Rutledge, R. E., et al. 2001, MNRAS, 321, 776Frank, J., King, A., & Raine, D. J. 2002, Accretion Power in Astrophysics: Third EditionFrank, J., King, A. R., & Lasota, J.-P. 1987, A&A, 178, 137Frogel, J. A., Kuchinski, L. E., & Tiede, G. P. 1995, AJ, 109, 1154Fujimoto, M. Y., Hanawa, T., & Miyaji, S. 1981, ApJ, 247, 267Fujimoto, M. Y., Sztajno, M., Lewin, W. H. G., & van Paradijs, J. 1987, ApJ, 319, 902Fujimoto, M. Y., Sztajno, M., Lewin, W. H. G., & van Paradijs, J. 1988, A&A, 199, L9Galloway, D. K., Cumming, A., Kuulkers, E., et al. 2004, ApJ, 601, 466Galloway, D. K., & in ’t Zand, J. J. M. 2010, The Astronomer’s Telegram, 3000, 1Galloway, D. K., Lin, J., Chakrabarty, D., & Hartman, J. M. 2010a, ApJ, 711, L148Galloway, D. K., Muno, M. P., Hartman, J. M., Psaltis, D., & Chakrabarty, D. 2008, ApJS,
114

BIBLIOGRAPHY
179, 360Galloway, D. K., Psaltis, D., Chakrabarty, D., & Muno, M. P. 2003, ApJ, 590, 999Galloway, D. K., Yao, Y., Marshall, H., Misanovic, Z., & Weinberg, N. 2010b, ApJ, 724, 417Ghosh, A., & Chakrabarti, S. K. 2014, ArXiv e-prints, arXiv:1406.7262 [astro-ph.HE], adsGhosh, P., & Lamb, F. K. 1979, ApJ, 232, 259Gold, T. 1968, Nature, 218, 731Goodson, A. P., Winglee, R. M., & Boehm, K. 1997, ApJ, 489, 199Gögüs, E., Alpar, M. A., & Gilfanov, M. 2007, ApJ, 659, 580Gourgouliatos, K. N., & Cumming, A. 2014, MNRAS, 438, 1618Greiner, J., Cuby, J. G., & McCaughrean, M. J. 2001, Nature, 414, 522Grindlay, J., Gursky, H., Schnopper, H., et al. 1976, ApJ, 205, L127Guerriero, R., Fox, D. W., Kommers, J., et al. 1999, MNRAS, 307, 179Haensel, P., & Zdunik, J. L. 1990, A&A, 227, 431Hansen, C. J., & van Horn, H. M. 1975, ApJ, 195, 735Hasinger, G., & van der Klis, M. 1989, A&A, 225, 79Hayashi, M. R., Shibata, K., & Matsumoto, R. 1996, ApJ, 468, L37Heger, A., Cumming, A., & Woosley, S. E. 2007, ApJ, 665, 1311Hessels, J. W. T., Ransom, S. M., Stairs, I. H., et al. 2006, Science, 311, 1901Hewish, A., Bell, S. J., Pilkington, J. D. H., Scott, P. F., & Collins, R. A. 1968, Nature, 217,
709Hoffman, J. A., Marshall, H. L., & Lewin, W. H. G. 1978, Nature, 271, 630Homan, J. 2012, ApJ, 760, L30Homan, J., Jonker, P. G., Wijnands, R., van der Klis, M., & van Paradijs, J. 1999, ApJ, 516,
L91Homan, J., van der Klis, M., Fridriksson, J. K., et al. 2010, ApJ, 719, 201Illarionov, A. F., & Sunyaev, R. A. 1975, A&A, 39, 185in ’t Zand, J. J. M., Kuulkers, E., Verbunt, F., Heise, J., & Cornelisse, R. 2003, A&A, 411,
L487in’t Zand, J. J. M., Galloway, D. K., & Ballantyne, D. R. 2011, A&A, 525, A111in’t Zand, J. J. M., Keek, L., & Cavecchi, Y. 2014, A&A, 568, A69in’t Zand, J. J. M., Galloway, D. K., Marshall, H. L., et al. 2013, A&A, 553, A83Jahoda, K., Markwardt, C. B., Radeva, Y., et al. 2006, ApJS, 163, 401Janiuk, A., Grzedzielski, M., Capitanio, F., & Bianchi, S. 2015, A&A, 574, A92Jiang, Y.-F., Stone, J. M., & Davis, S. W. 2014, ApJ, 784, 169Jonker, P. G., Galloway, D. K., McClintock, J. E., et al. 2004, MNRAS, 354, 666Jonker, P. G., van der Klis, M., Homan, J., et al. 2000, ApJ, 531, 453Jonker, P. G., van der Klis, M., & Wijnands, R. 1999, ApJ, 511, L41Keek, L., Cyburt, R. H., & Heger, A. 2014, ApJ, 787, 101Keek, L., Galloway, D. K., in ’t Zand, J. J. M., & Heger, A. 2010, ApJ, 718, 292Keek, L., Heger, A., & in ’t Zand, J. J. M. 2012, ApJ, 752, 150Keek, L., Langer, N., & in ’t Zand, J. J. M. 2009, A&A, 502, 871
115

BIBLIOGRAPHY
King, A. L., Miller, J. M., Raymond, J., et al. 2012, ApJ, 746, L20Kitamoto, S., Miyamoto, S., Tanaka, Y., et al. 1984, PASJ, 36, 731Klein-Wolt, M., Fender, R. P., Pooley, G. G., et al. 2002, MNRAS, 331, 745Klein-Wolt, M., Homan, J., & van der Klis, M. 2004, Nuclear Physics B Proceedings Sup-
plements, 132, 381Knowles-Carter, B. G. 2011, Run the world (Girls)Kouveliotou, C., van Paradijs, J., Fishman, G. J., et al. 1996, Nature, 379, 799Kubota, A., Tanaka, Y., Makishima, K., et al. 1998, PASJ, 50, 667Kuijpers, J., & Kuperus, M. 1994, A&A, 286, 491Kulkarni, A. K., & Romanova, M. M. 2008, MNRAS, 386, 673Kunieda, H., Tawara, Y., Hayakawa, S., et al. 1984, PASJ, 36, 215Kuulkers, E., Homan, J., van der Klis, M., Lewin, W. H. G., & Méndez, M. 2002, A&A, 382,
947Lamb, D. Q., & Lamb, F. K. 1978, ApJ, 220, 291Lamb, F. K., Fabian, A. C., Pringle, J. E., & Lamb, D. Q. 1977, ApJ, 217, 197Lattimer, J. M., & Prakash, M. 2004, Science, 304, 536Lattimer, J. M., & Prakash, M. 2007, Phys. Rep., 442, 109Levine, A. M., Bradt, H., Cui, W., et al. 1996, ApJ, 469, L33Lewin, W. H. G., van Paradijs, J., & Taam, R. E. 1993, Space Sci. Rev., 62, 223Lewin, W. H. G., Doty, J., Clark, G. W., et al. 1976, ApJ, 207, L95Lightman, A. P., & Eardley, D. M. 1974, ApJ, 187, L1Lii, P. S., Romanova, M. M., Ustyugova, G. V., Koldoba, A. V., & Lovelace, R. V. E. 2014,
MNRAS, 441, 86Linares, M., Altamirano, D., Chakrabarty, D., Cumming, A., & Keek, L. 2012, ApJ, 748, 82Linares, M., Chakrabarty, D., & van der Klis, M. 2011, ApJ, 733, L17Liu, Q. Z., van Paradijs, J., & van den Heuvel, E. P. J. 2007, A&A, 469, 807Lubin, L. M., Lewin, W. H. G., Dotani, T., et al. 1992a, MNRAS, 256, 624Lubin, L. M., Lewin, W. H. G., Rutledge, R. E., et al. 1992b, MNRAS, 258, 759Lubin, L. M., Lewin, W. H. G., Tan, J., van Paradijs, J., & van der Klis, M. 1991, MNRAS,
252, 190Lubin, L. M., Lewin, W. H. G., van Paradijs, J., & van der Klis, M. 1993, MNRAS, 261, 149Lyubarskii, Y. E. 1997, MNRAS, 292, 679Mahasena, P., Inoue, H., Asai, K., & Dotani, T. 2003, PASJ, 55, 827Makishima, K., Maejima, Y., Mitsuda, K., et al. 1986, ApJ, 308, 635Marshall, H. L., Hoffman, J. A., Doty, J., Lewin, W. H. G., & Ulmer, M. P. 1979, ApJ, 227,
555Marshall, H. L., Rutledge, R., Fox, D. W., et al. 2001, AJ, 122, 21Masetti, N. 2002, A&A, 381, L45Masetti, N., Frontera, F., Stella, L., et al. 2000, A&A, 363, 188Melia, F., & Zylstra, G. J. 1992, ApJ, 398, L53Miller, J. M., Maitra, D., Cackett, E. M., Bhattacharyya, S., & Strohmayer, T. E. 2011, ApJ,
116
BIBLIOGRAPHY
731, L7Miller, K. A., & Stone, J. M. 1997, ApJ, 489, 890Mirabel, I. F., & Rodríguez, L. F. 1994, Nature, 371, 46Mitsuda, K., Inoue, H., Koyama, K., et al. 1984, PASJ, 36, 741Morrison, R., & McCammon, D. 1983, ApJ, 270, 119Motta, S., D’Aı, A., Papitto, A., et al. 2011, MNRAS, 414, 1508Mukherjee, D., Bult, P., van der Klis, M., & Bhattacharya, D. 2015, ArXiv e-prints,
arXiv:1507.02138 [astro-ph.HE], adsNeilsen, J., Remillard, R. A., & Lee, J. C. 2011, ApJ, 737, 69Nomoto, K., & Kondo, Y. 1991, ApJ, 367, L19Oppenheimer, J. R., & Volkoff, G. M. 1939, Physical Review, 55, 374Paczynski, B. 1983, ApJ, 267, 315Page, D., & Reddy, S. 2006, Annual Review of Nuclear and Particle Science, 56, 327Papitto, A., D’Aì, A., Motta, S., et al. 2011, A&A, 526, L3Parmar, A. N., & White, N. E. 1988, Journal of the Italian Astronomical Society, 59, 147Patruno, A., Alpar, M. A., van der Klis, M., & van den Heuvel, E. P. J. 2012, ApJ, 752, 33Patruno, A., & D’Angelo, C. 2013, ApJ, 771, 94Patruno, A., Watts, A., Klein Wolt, M., Wijnands, R., & van der Klis, M. 2009, ApJ, 707,
1296Patruno, A., & Watts, A. L. 2012, ArXiv e-prints, arXiv:1206.2727 [astro-ph.HE], adsPenninx, W., Damen, E., van Paradijs, J., Tan, J., & Lewin, W. H. G. 1989, A&A, 208, 146Perna, R., Bozzo, E., & Stella, L. 2006, ApJ, 639, 363Piro, A. L., & Bildsten, L. 2007, ApJ, 663, 1252Pringle, J. E., & Rees, M. J. 1972, A&A, 21, 1Rao, A., & Vadawale, S. V. 2012, ApJ, 757, L12Raymond, J. C., & Smith, B. W. 1977, ApJS, 35, 419Reid, M. J., McClintock, J. E., Steiner, J. F., et al. 2014, ApJ, 796, 2Revnivtsev, M., Churazov, E., Gilfanov, M., & Sunyaev, R. 2001, A&A, 372, 138Rodriguez, J., Corbel, S., Caballero, I., et al. 2011, A&A, 533, L4Romanova, M. M., Kulkarni, A. K., & Lovelace, R. V. E. 2008, ApJ, 673, L171Romanova, M. M., Ustyugova, G. V., Koldoba, A. V., & Lovelace, R. V. E. 2009, MNRAS,
399, 1802Romanova, M. M., Ustyugova, G. V., Koldoba, A. V., & Lovelace, R. V. E. 2012, MNRAS,
421, 63Rutledge, R. E., Lubin, L. M., Lewin, W. H. G., et al. 1995, MNRAS, 277, 523Sana, H., de Mink, S. E., de Koter, A., et al. 2012, Science, 337, 444Saracino, S., Dalessandro, E., Ferraro, F. R., et al. 2015, ApJ, 806, 152Sato, K. 1979, Progress of Theoretical Physics, 62, 957Schatz, H., Aprahamian, A., Barnard, V., et al. 2001, Nuclear Physics A, 688, 150Shakura, N. I., & Sunyaev, R. A. 1973, A&A, 24, 337Shakura, N. I., & Sunyaev, R. A. 1976, MNRAS, 175, 613
117

BIBLIOGRAPHY
Shaposhnikov, N., Jahoda, K., Markwardt, C., Swank, J., & Strohmayer, T. 2012, ApJ, 757,159
Spitkovsky, A., Levin, Y., & Ushomirsky, G. 2002, ApJ, 566, 1018Spruit, H. C., & Taam, R. E. 1993, ApJ, 402, 593Stella, L., Haberl, F., Lewin, W. H. G., et al. 1988, ApJ, 324, 379Strohmayer, T., & Bildsten, L. 2006, New views of thermonuclear bursts, ed. W. H. G. Lewin
& M. van der Klis, 113Sturner, S. J., & Dermer, C. D. 1996, ApJ, 465, L31Suleimanov, V., Poutanen, J., & Werner, K. 2011, A&A, 527, A139Sunyaev, R. A., & Shakura, N. I. 1977, Soviet Astronomy Letters, 3, 138Sztajno, M., van Paradijs, J., Lewin, W. H. G., et al. 1985, ApJ, 299, 487Taam, R. E., & Lin, D. N. C. 1984, ApJ, 287, 761Tan, J., Lewin, W. H. G., Lubin, L. M., et al. 1991, MNRAS, 251, 1Thompson, C., & Duncan, R. C. 1993, ApJ, 408, 194Titarchuk, L. 1994, ApJ, 434, 570Titarchuk, L., Cui, W., & Wood, K. 2002, ApJ, 576, L49Titarchuk, L., & Lyubarskij, Y. 1995, ApJ, 450, 876Tolman, R. C. 1939, Physical Review, 55, 364Turolla, R. 2009, in Astrophysics and Space Science Library, Vol. 357, Astrophysics and
Space Science Library, ed. W. Becker, 141Ulmer, M. P., Lewin, W. H. G., Hoffman, J. A., Doty, J., & Marshall, H. 1977, ApJ, 214, L11Valenti, E., Ferraro, F. R., & Origlia, L. 2010, MNRAS, 402, 1729Valinia, A., & Marshall, F. E. 1998, ApJ, 505, 134van der Klis, M. 1995, in The Lives of the Neutron Stars, ed. M. A. Alpar, U. Kiziloglu, &
J. van Paradijs, 301van der Klis, M. 2001, ApJ, 561, 943van der Klis, M. 2006, Rapid X-ray Variability, ed. W. H. G. Lewin & M. van der Klis, 39van der Klis, M., Chakrabarty, D., Lee, J. C., et al. 2000, IAU Circ., 7358, 3van Paradijs, J., & Lewin, H. G. 1986, A&A, 157, L10van Paradijs, J., Sztajno, M., Lewin, W. H. G., et al. 1986, MNRAS, 221, 617van Straaten, S., van der Klis, M., & Méndez, M. 2003, ApJ, 596, 1155Verbunt, F., & Hut, P. 1987, in IAU Symposium, Vol. 125, The Origin and Evolution of
Neutron Stars, ed. D. J. Helfand & J.-H. Huang, 187Viganò, D., Rea, N., Pons, J. A., et al. 2013, MNRAS, 434, 123Villarreal, A. R., & Strohmayer, T. E. 2004, ApJ, 614, L121Walker, M. A. 1992, ApJ, 385, 651Wallace, R. K., & Woosley, S. E. 1981, ApJS, 45, 389Watts, A., Espinoza, C. M., Xu, R., et al. 2015, Advancing Astrophysics with the Square
Kilometre Array (AASKA14), 43Watts, A. L. 2012, ARA&A, 50, 609White, N. E., & Swank, J. H. 1982, ApJ, 253, L61
118
BIBLIOGRAPHY
Wijnands, R., & van der Klis, M. 1998, Nature, 394, 344Wijnands, R., Yang, Y. J., & Altamirano, D. 2012, MNRAS, 422, L91Woosley, S. E., Heger, A., & Weaver, T. A. 2002, Reviews of Modern Physics, 74, 1015Woosley, S. E., & Taam, R. E. 1976, Nature, 263, 101Worpel, H., Galloway, D. K., & Price, D. J. 2013, ApJ, 772, 94Wu, Y. X., Yu, W., Li, T. P., Maccarone, T. J., & Li, X. D. 2010, ApJ, 718, 620Yakovlev, D. G., Gasques, L. R., Afanasjev, A. V., Beard, M., & Wiescher, M. 2006,
Phys. Rev. C, 74, 035803Zhang, G., Méndez, M., Altamirano, D., Belloni, T. M., & Homan, J. 2009, MNRAS, 398,
368Zhang, W., Jahoda, K., Swank, J. H., Morgan, E. H., & Giles, A. B. 1995, ApJ, 449, 930
119


Contribution from co-authors
Chapter 2: Indications for a slow rotator in the Rapid Burster from its thermonuclear burst-ing behaviourT. Bagnoli, J.J.M. in ’t Zand, D.K. Galloway and A.L. WattsPublished in Monthly Notices of the Royal Astronomical Society, Volume 431, Issue3, p.1947-1955 (2013)
Chapter 3: Double-peaked thermonuclear bursts at the soft–hard state transition in the RapidBursterT. Bagnoli, J.J.M. in ’t Zand, A. Patruno and A.L. WattsPublished in Monthly Notices of the Royal Astronomical Society, Volume 437, Issue3, p.2790-2801 (2014)
Chapter 4: A population study of type II bursts in the Rapid BursterT. Bagnoli, J.J.M. in ’t Zand, C.R. D’Angelo and D.K. GallowayPublished in Monthly Notices of the Royal Astronomical Society, Volume 449, Issue1, p.268-287 (2015)
Chapter 5: Discovery of GRS 1915+105 variability patterns in the Rapid BursterT. Bagnoli and J.J.M. in ’t ZandPublished in Monthly Notices of the Royal Astronomical Society: Letters, Volume450, Issue 1, p.L52-L56 (2015)
121


Publications
First-author articles1. Bagnoli, T.,; in ’t Zand, J.J.M.; Galloway, D.K.; Watts, A.L.; 2013
MNRAS, 431, 1947. (Chapter 2)Indications for a slow rotator in the Rapid Burster from its thermonuclear burstingbehaviour
2. Bagnoli, T.,; in ’t Zand, J.J.M.; Patruno, A.; Watts, A.L.; 2014MNRAS, 437, 2790. (Chapter 3)Double-peaked thermonuclear bursts at the soft-hard state transition in the RapidBurster
3. Bagnoli, T.,; in ’t Zand, J.J.M.; D’Angelo, C.R.; Galloway, D.K.; 2015MNRAS, 449, 268. (Chapter 4)A population study of type II bursts in the Rapid Burster
4. Bagnoli, T., & in ’t Zand, J.J.M.; 2015Letters to MNRAS, 450, 52. (Chapter 5)Discovery of GRS 1915+105 variability patterns in the Rapid Burster
Co-authored articles1. in’t Zand, J. J. M.; Cumming, A.; Triemstra, T. L.; Mateijsen, R. A. D. A.; Bagnoli,
T., 2014.A&A, 562, 16.The cooling rate of neutron stars after thermonuclear shell flashes
123


Summary
This thesis presents a study of X-ray bursts coming from neutron stars in X-ray binaries. Sowhat does that mean?
Neutron stars are one of the possible outcomes of stellar evolution. All stars, includingour Sun, spend their lives as stellar objects that burn light elements into heavier ones (hy-drogen into helium, helium into carbon, and so on). It is the outward radiative push fromthis powerful burning that counterweights the force of gravity, which in turn pulls to collapsethe star. This self-maintained equilibrium – between the expansion that would result fromburning, and the shrinking that would result from gravity – must eventually come to an endwhen most of the light elements have been burnt out.
What then follows depends on how much mass starts to collapse under its own weight.Low-mass stars, like our Sun and up to eight times as heavy as it, will shrink to about tenthousand km in radius (for comparison, the Sun’s present radius is about one million km),when they will eventually find a pressure force to counter gravity in the quantum behaviourelectrons show when they are pushed against each other at such high densities. The resultingobject is called a white dwarf.
But for stars about eight times heavier than the Sun, the electron pressure cannot balancegravity. If such a star is lighter than about thirty times the Sun, its core will shrink all theway down to just about ten km. The density achieved in this case generates a stronger pres-sure, coming from the neutrons resisting further collapse (at these densities most protons andelectrons merge into neutrons). If the initial star was even heavier than thirty times the Sun,nothing can stop it from collapsing all the way into a black hole, an object so compact noteven light is fast enough to escape its gravity.
Neutron stars are therefore the densest objects in the visible universe. Matter inside themlooks nothing like it does on Earth. Atoms around us are mostly empty: the nucleus, whichhosts protons and neutrons and therefore practically the entire mass of an atom, occupiesonly a tiny fraction of its total volume, which is mostly occupied by the surrounding electroncloud. In a neutron star, no such liberty is possible, and densities in its core are even greaterthan in an atomic nucleus. Investigating what matter looks like under such extreme conditionsis beyond our current knowledge and beyond the scope of this thesis.
Most stars are born in multiple systems. Therefore, many neutron stars are found in a
125

5 Summary
Figure A: Artistic impression of an X-ray binary. The gas is seen streaming from the companion starand into an accretion disc, until reaching the central compact object. Jets can sometimes be launched(Credit: ESA, NASA and Felix Mirabel).
binary orbit with a companion star. When the companion star has a mass roughly similar tothat of our Sun, a stable transfer of mass from the companion onto the neutron star can takeplace. Gas leaves the companion star and orbits in a disc around the neutron star, spirallingin until finally being accreted on to the neutron star surface. Because this process makes thebinary visible in the X-ray portion of the electromagnetic spectrum, one speaks at this pointof an X-ray binary (see Fig. A).
This thesis is concerned with two kinds of sudden energy release that can take place insuch a system. First, the gas that piles up on the neutron star surface can suddenly ignite andburn at depths of about one meter. The atmosphere above heats up to millions of degrees,suddenly making the neutron star surface visible in the X-ray light, in what we call a type Iburst. These bursts last between several seconds and tens of minutes. Second, the transferof gas from the disc to the neutron star surface can take place in a discontinuous fashion.Relatively low levels of accretion can be followed by extremely high ones, which are alsoaccompanied by a brightening of the corresponding X-ray radiation. These high-accretion
126

phases are what we call type II bursts, which have similar durations to the type I bursts.The two types of bursts are therefore very different in origin, despite the fact that they
can look remarkably similar in the data. There is one more fundamental difference betweenthem: while type I bursts can be observed from more than a hundred sources, type II burstshave only been observed in two. So while we can try to connect the variations in type I burstproperties across different sources with the changing of conditions specific to each of them(such as their neutron star spin rate, or magnetic field strength), the study of type II burstsdoes not allow for this generalizing step. The question is then: what is so exceptional aboutthese two sources? Why does the flow of gas from the disc onto the neutron star behave sodifferently in these two systems?
In fact, only one of them, called the Rapid Burster, shows both types of bursts. The nameof this source is indeed due to its type II bursts, because these accretion instabilities canrecur a lot faster – in a matter of seconds, in fact – than the type I bursts, which require theaccumulation of a thick enough pile of material on the neutron star surface before this canignite, a process that typically takes hours.
What we therefore set out to do at the beginning of this study was to look into the typeI burst behaviour of the Rapid Burster – which we are supposed to understand fairly well,in comparison with the other sources – to find there hints to the exceptional nature of thissource. In chapter 2 we have looked at the complete sample of type I bursts observed bythe Proportional Counter Array (PCA) instrument onboard the satellite Rossi X-ray TimingExplorer. We have studied how the tens of type I bursts behave as the Rapid Burster changesin luminosity; that is, as the stream of gas from the disc onto the neutron star proceeds atslower or faster mass-accretion rates. To our surprise, we find that when the Rapid Burster isaccreting matter faster, it takes less time for enough gas to pile up and ignite in a type I burst.
Wait, isn’t that logical? Indeed it is! What makes it surprising, however, is that of allthe over a hundred sources of type I bursts, there is only one more that also behaves in sucha logical fashion. All the other bursting neutron stars show, counterintuitively, fewer burstswhen they are accreting matter faster. What our research has shown is then that the RapidBurster is exceptional even in its type I bursting behaviour.
Why then? The only other ‘well-behaved’ source, IGR J17480–2446, does actually havean outstanding property among other sources of type I bursts: it rotates unusually slow,namely eleven times per second. This rotation speed might sound remarkably fast, but itis still twenty times slower than any other neutron star emitting type I bursts. And what doesthe slow rotation mean? Generally, a neutron star in an X-ray binary is spun up by the ac-cretion of material over several billion years. IGR J17480–2446 is therefore assumed to bea relatively young X-ray binary. Perhaps, then, the Rapid Burster is also a slowly-rotatingand relatively young X-ray binary. Strengthening this suspicion, the neutron star in the onlyother source of type II bursts, the Bursting Pulsar, also spins at a relatively slow 2 rotationsper second.
Young age has also another implication: a larger magnetic field. All neutron stars are bornwith large magnetic fields, but these decay over time, particularly after mass transfer from
127

5 Summary
the companion has started. Perhaps, then, IGR J17480–2446 and the Rapid Burster share amagnetic field large enough to force matter falling along the disc to follow the magnetic fieldlines leading to the stellar poles. If this is true, matter would land on the surface of these twosources with a relatively small tangential velocity, while in normal bursters it would land onthe surface with the maximum one. This shear can heat up the gas by mixing to lower (andhotter) depths, causing a type I burst to go off earlier than we would predict if this effect isnot properly taken into account.
Among the sample of type I bursts from the Rapid Burster in our dataset, six stand outfor their unusual evolution, as we report in chapter 3. All the other type I bursts show a quickrise in luminosity, lasting about 10 seconds, peaking, and then slowly decaying in about a100 seconds. Overall, their duration and shape is typical of what we know to be the productof burning of a mix of hydrogen and helium in plenty of other sources. The six outliers shownot one, but two peaks: they rise, start decaying, rise again and finally decay. Further analysisshows that this is not because, for example, the surface of the neutron star temporarily stopsburning to then start again. Rather, extra material is coming in the line of sight between usand the surface, briefly obscuring the neutron star right after a type I burst went off.
By looking at the evolution of the mass transfer before and after these double-peaked typeI bursts take place, we discovered that the Rapid Burster undergoes a transition at the sametime: while in the previous observations no type II bursts are observed, they are present inthe following observations. This pattern has repeated itself at least three different times overmany years, and it is hard to argue that it is due to a chance occurrence. It seems, therefore,that as changes take place in the accretion disc while it prepares to enter an active type-II-burst phase, it also becomes susceptible to disturbances caused by the type I bursts that areable to affect large enough amounts of material to obscure the neutron star surface. It isdifficult, however, to understand how the type I bursts can trigger such disturbances in thedisc that their effect lasts as long as a minute (the observed distance between the two peaks):the type I bursts are already becoming fainter while the surface is obscured, and an accretionflow should restore itself on very quick time scales.
Having extensively studied the type I bursts, but always with an eye to trying to explainthe type II bursts, we finally proceeded to look at the roughly 7600 of them (as mentionedearlier, they can recur very quickly) that have been observed with the Rossi X-ray TimingExplorer. Thanks to this huge sample, which we describe in chapter 4, we have been ableto discover many previously unknown properties of the bursts, such as that they can last asshort as just a tenth of a second, that they have a maximum luminosity, and that they havevery different feedback effects on the persistent accretion flow depending on whether theyare short or long.
We have compared our results on type II burst properties with those predicted by severalmodels, and we favour one in which the culprit is a particular combination of stellar magneticfield strength, stellar spin, and mass accretion rate. While none of these are unique to theRapid Burster, the model also requires a high degree of alignment between the spin axis andthe magnetic field axis, compatibly with the properties of the Rapid Burster but not with
128

those of the other source of type II bursts, the Bursting Pulsar. It is therefore evident thatfurther modelling is necessary, but models that include the magnetic field as a gate betweenthe accretion disc and the neutron star surface are the most promising.
Finally, we conclude with an exciting discovery in chapter 5, where we report that occa-sionally the Rapid Burster displays variations in its mass accretion rate that are very differentfrom type II bursts. These instabilities are quasi-periodic in nature, and look like carboncopies of those seen in a puzzling X-ray binary containing a black hole instead of a neu-tron star, GRS 1915+105. For a long time, the unexplainable behaviour of GRS 1915+105has been ascribed to its unusually large luminosities. If this is indeed the case, the sameinstability taking place in the ten-times fainter Rapid Burster cannot be accounted for in thesame way. As we report, the commonality between the Rapid Burster, GRS 1915+105 andthe Bursting Pulsar might be a very large binary orbit, resulting in a larger accretion disc,which could perhaps pave the way for the development of otherwise impossible accretioninstabilities.
129


Nederlandse Samenvatting
In deze thesis worden uitbarstingen van röntgenstraling bestudeerd die afkomstig zijn vanneutronensterren in dubbelstersystemen. Maar wat betekent dit eigenlijk?
Een neutronenster is een van de mogelijke eindstadia van sterevolutie. Alle sterren, zoook onze Zon, fuseren gedurende hun leven lichte elementen tot zwaardere in hun kern (bij-voorbeeld waterstof tot helium en helium tot koolstof). Dit krachtige fusieproces levert ge-noeg energie op in de vorm van straling om tegendruk te bieden aan instorting van de ster tengevolge van de zwaartekracht. Het evenwicht dat ontstaat tussen uitzetting en instorting vande ster zal verstoord raken als de meeste lichte elementen in de kern van de ster opgebruiktzijn. De zwaartekracht wordt dan niet meer tegengewerkt en de ster zal imploderen.
Het vervolgscenario hangt geheel af van de massa van de ster in kwestie. Lichte sterren,die tot acht keer zo zwaar kunnen zijn als de Zon, zullen instorten tot een bol met een straalvan ongeveer tienduizend kilometer (ter vergelijking heeft de Zon op het moment een straalvan ongeveer een miljoen kilometer). Bij de extreem hoge dichtheid die in de ster wordtbereikt biedt het kwantumgedrag dat elektronen vertonen als ze tegen elkaar worden geduwdtegendruk aan de zwaartekracht. Een nieuw evenwicht kan in dit geval ontstaan in de vormvan een compacte ster die we een witte dwerg noemen.
Voor sterren zwaarder dan achtmaal de Zon, kan zelfs de druk van de elektronen de zwaar-tekracht niet evenaren. Sterren die lichter zijn dan dertigmaal de Zon zullen imploderen totdathun straal nog maar tien kilometer bedraagt. De inwendige dichtheid die nu wordt bereiktforceert de versmelting van protonen en elektronen tot neutronen. Neutronen storten op hunbeurt niet verder in en kunnen wel weerstand bieden aan de zwaartekracht. Een neutronensteris geboren. In de gevallen waar de ster zwaarder is dan dertigmaal de Zon, kan geen elektronof neutron zijn ineenstorting tot een zwart gat voorkomen. Zwarte gaten hebben een dermatehoge dichtheid dat zelfs licht niet aan hun zwaartekracht kan ontsnappen.
Neutronensterren zijn derhalve de meest compacte objecten in het zichtbare heelal ende materie waar ze uit bestaan verschilt sterk van die op Aarde. De atomen waaruit wij ende dingen om ons heen bestaan zijn vooral erg leeg: de protonen en neutronen in de kernbepalen voornamelijk massa van het atoom, maar nemen maar een piepklein gedeelte in vande ruimte die het atoom opeist. Het zijn vooral de elektronen die zich in een wolk rond dekern bevinden die deze ruimte opvullen. Binnenin een neutronenster is de dichtheid hoger
131

5 Nederlandse Samenvatting
Figuur A: Artistieke impressie van een X-ray binary. De gas stroomt van de donorster door een accre-tieschijf, tot hij de centrale object bereikt. Soms worden stralen gelanceerd. (Credit: ESA, NASA andFelix Mirabel).
dan die in een atoomkern. Hoe materie zich onder zulke extreme omstandigheden gedraagtis vooralsnog niet bekend, in dit werk gaan we hier verder niet op in.
De meeste sterren worden geboren in systemen met meer dan een ster. Het is daaromwaarschijnlijk dat een neutronenster zich ook in de nabijheid van een andere ster bevindt.Met zijn partner vormt de neutronenster een dubbelstersysteem dat in een baan rond het mas-samiddelpunt beweegt. Als deze partner niet te ver weg staat en ongeveer net zo zwaar is alsde Zon, kan er massaoverdracht plaatsvinden. Gas van het oppervlak van de Zonachtige stervoelt de extreme zwaartekracht van de neutronenster en valt in zijn richting. In een schijf ont-doet het zich van draaimoment en valt in een steeds kleinere baan rond de neutronenster omuiteindelijk het oppervlak te bereiken. Tijdens dit proces, dat accretie wordt genoemd, wordthet gas zo warm dat het begint te stralen in het röntgengedeelte van het elektromagnetischspectrum. We kunnen nu spreken van een röntgendubbelstersysteem (zie Figuur A).
In deze thesis worden twee soorten plotselinge energieuitbarstingen onderzocht die voorkunnen komen in een dergelijk systeem. Ten eerste kan het gas dat zich verzamelt op het neu-
132

tronensteroppervlak op een diepte van ongeveer een meter plotseling ontbranden. De atmos-feer hier direct boven wordt verwarmd tot miljoenen graden en veroorzaakt een kortdurendezogenaamde type I röntgenuitbarsting. De andere soort uitbarsting vindt zijn oorsprong invariaties van de gasstroom tussen de accretieschijf en de neutronenster. Deze stroom is alles-behalve vloeiend. Periodes van veel en weinig invallend gas wisselen elkaar af, en dit wordtgekenmerkt door een varierende hoeveelheid uitgezonden röntgenstraling. In een periode vanveel invallend gas spreken we van een type II röntgenuitbarsting.
Zowel type I als type II uitbarstingen duren seconden tot tientallen minuten, en kunnenvoor een waarnemer verraderlijk veel op elkaar lijken. De tijdschaal waarop de uitbarstingenzich herhalen is voor beide typen wel anders. Type I uitbarstingen liggen uren uiteen, er moetgenoeg gas op het oppervlak gevallen zijn om te kunnen ontbranden. Type II uitbarstingenherhalen zich op de kortere tijdschaal van enkele seconden. Er is nog een belangrijk verschiltussen de twee, en dat is dat type II uitbarstingen vele malen zeldzamer zijn. Waar er meer danhonderd röntgenbronnen bekend zijn die type I uitbarstingen vertonen, zijn er in maar tweebronnen type II uitbarstingen waargenomen. In het geval van de type I uitbarstingen kunnenwe verschillende kenmerken van de uitbarstingen proberen toe te schrijven aan specifiekeeigenschappen van de bronnen (zoals rotatiesnelheid, magnetische veldsterkte etc.), bij typeII uitbarstingen is dit niet mogelijk. De grote vraag die te binnenschiet is: wat is er zobijzonder aan deze twee bronnen? Waarom gedraagt de gasstroom vanuit de accretieschijfnaar het oppervlak van deze twee neutronensterren zich zo abnormaal?
Maar een van de twee bronnen vertoont beide typen, zich langzaam en snel herhalende,uitbarstingen. Om deze reden wordt de röntgenbron ’Rapid Burster’ genoemd. De eerste stapdie we daarom hebben gezet om een antwoord te krijgen op onze vragen was het vergelijkenvan de type I uitbarstingen die de Rapid Burster vertoont met type I uitbarstingen van bronnendie geen type II uitbarstingen vertonen. In hoofdstuk 2 hebben we alle type I uitbarstingendie waar zijn genomen met de Rossi X-ray Timing Explorer satelliet onderzocht. Specifiekhebben we gekeken naar de eigenschappen van de Type I uitbarstingen in relatie tot de hoe-veelheid gas die per tijdseenheid op de neutronenster valt. Tot onze verbazing vinden we datde type I uitbarstingen van de Rapid Burster zich bij een grotere hoeveelheid invallend gasper tijdseenheid sneller herhalen.
Dit klinkt niet verrassend, maar is het wel! Van de 100 andere bronnen die bekend zijngedraagt maar een enkele bron zich hetzelfde. Bij alle andere neutronensterren herhalen deuitbarstingen zich langzamer bij een grotere hoeveelheid invallend gas. We hebben hiermeeaangetoond dat de Rapid Burster, naast de type II uitbarstingen, ook verschillend gedragvertoont wat betreft de type I röntgenuitbarstingen. Van de andere bron die zich zo gedraagt,IGR J17480–2446 zijn geen type II uitbarstingen waargenomen maar de neutronenster heeftwel een andere excentrieke karaktertrek, namelijk een extreem langzame rotatiesnelheid vanelf keer per seconde.
Dit klinkt aardig snel, maar is gemiddeld twintig keer langzamer dan roterende neutro-nensterren in röntgenbronnen die type I uitbarstingen vertonen. Wat betekent deze langzamerotatiesnelheid? Over het algemeen gaat een neutronenster over tijd steeds sneller rond zijn
133

5 Nederlandse Samenvatting
as draaien door het gas dat hij van andere sterren aantrekt. Van IGR J17480–2446 wordtaangenomen dat het dus een relatief jonge röntgenbron is. Wellicht betekent dit dat de RapidBurster ook een langzaam draaiende neutronenster bevat en vrij jong is. Steun voor dit voor-stel komt van de tweede bron die type II, en alleen type II, uitbarstingen vertoont en maartwee keer per seconde om zijn as draait: de Bursting Pulsar.
Hoe jonger een neutronenster is, des te groter is zijn magnetische veldsterkte. Alle neu-tronensterren hebben bij hun vorming een sterk magnetisch veld dat over tijd afzwakt. Hetzou zo kunnen zijn dat IGR J17480–2446 en de Rapid Burster over een dermate sterk mag-neetveld beschikken dat invallend gas de magnetische veldlijnen naar de magnetische polenvolgt en zich daar in een klein gebied verzamelt. Als dit het geval is, dan zal het gas eenlagere hoeksnelheid hebben, het raakt het oppervlak nagenoeg loodrecht, dan in bronnen meteen zwak magnetisch veld. De schuifspanning zal het gas tot op grotere diepte mengen enmeer verhitten, waardoor een type I uitbarsting sneller tot stand komt.
Zes van de type I uitbarstingen afkomstig van de Rapid Burster hebben een ongewoonverloop, zoals we in hoofdstuk 3 laten zien. Alle andere uitbarstingen gaan gepaard metverhoogde helderheid die gedurende tien seconden piekt en vervolgens in ongeveer 100 se-conden afzwakt. Dit verloop is karakteristiek voor het verbrandingsproces van waterstof enhelium zoals ook in veel andere bronnen wordt waargenomen. De zes bijzondere uitbarstin-gen pieken niet een maar twee keer voordat de helderheid afzwakt. De dubbele piek is niethet resultaat van bijvoorbeeld het tijdelijk stagneren van het verbrandingsproces, maar komtomdat ons het zicht op de verbrandingslocatie tijdelijk wordt ontnomen door tussenkomendmateriaal.
Door de evolutie van de massaoverdracht in de gasstroom vlak voor en na de dubbelepiek te onderzoeken, zijn we erachter gekomen dat de Rapid Burster zich anders gedraagtna deze bijzondere uitbarstingen. Waar er voor een type I uitbarsting met dubbele piek geentype II uitbarstingen te zien waren, zijn die er na een dergelijke uitbarsting wel. Dit patroonherhaalt zich ten minste driemaal in meerdere jaren; toeval kan het niet zijn. Het lijkt eropdat de accretieschijf in aanloop naar een type II uitbarsting tijdelijk gevoelig wordt voorverstoringen veroorzaakt door type I uitbarstingen. Deze verstoringen blokkeren vervolgensde zichtlijn naar het neutronensteroppervlak, met de dubbele piek als gevolg. Het is niet directduidelijk hoe de type I uitbarstingen de accretieschijf minutenlang kan blijven beïnvloeden,de tijd die gemiddeld tussen de pieken zit. De type I uitbarstingen zwakken al af terwijl hetoppervlak nog niet te zien is, en een accretiestroom zou zich op een kortere tijdschaal moetenkunnen herstellen.
Na het uitvoerig bestuderen van de type I uitbarstingen van de Rapid Burster, hebben weons gericht op de ruim 7600 type II uitbarstingen die door de Rossi X-ray Timing Explorervan deze röntgenbron zijn waargenomen. De omvangrijke dataset, die we beschrijven inhoofdstuk 4, stelde ons in staat veel onbekende eigenschappen van deze uitbarstingen aan hetlicht te brengen. Ze kunnen bijvoorbeeld maar een tiende van een seconde duren, hebbeneen maximale helderheid en hebben, afhankelijk van hun tijdsduur, een aantal verschillendeeffecten op de accretiestroom.
134

We hebben onze bevindingen vergeleken met de voorspellingen van een aantal type IIuitbarstingsmodellen. Onze voorkeur gaat uit naar een model waarin de uitbarstingen totstand komen door een specifieke combinatie van de sterkte van het magneetveld, rotatiesnel-heid en de hoeveelheid massa die per tijdseenheid op de neutronenster valt. Hoewel geenvan deze grootheden uniek is voor de Rapid Burster, vereist het model voor deze bron ookdat de draaias en de as van het magneetveld nagenoeg samenvallen. Deze eis hoeft niet ge-steld te worden aan de Bursting Pulsar, de andere bron die type II uitbarstingen vertoont. Ditmaakt duidelijk dat er betere modellen nodig zijn, en dat de modellen die de invloed van hetmagneetveld op de gasstroom tussen de accretieschijf en het oppervlak van het neutronensterbeschrijven het meest veelbelovend zijn.
Tot slot beschrijven we in hoofdstuk 5 de opwindende ontdekking van variabiliteit in dehoeveelheid massa die per tijdseenheid op de neutronenster valt die compleet verschilt vantype II uitbarstingen. Deze instabiliteiten zijn quasi-periodiek van aard en lijken op de varia-biliteit die GRS 1915+105 vertoont, een dubbelstersyteem met een zwart gat in plaats van eenneutronenster. Lange tijd werd het ongewone emissiepatroon van deze bron toegeschrevenaan zijn extreme helderheid. Als dit juist is, dan heeft dezelfde instabiliteit in de tienmaalminder heldere Rapid Burster een andere oorzaak. De eigenschappen die gedeeld wordendoor de Rapid Burster, GRS 1915+105 en de Bursting Pulsar zouden uitgelegd kunnen wor-den door de ongewoon grote baan rond het massamiddelpunt in deze bronnen, die de vormingvan een grotere accretieschijf en de ontwikkeling van anders onmogelijke instabiliteiten toezou staan.
135


Acknowledgements
Impostor syndrome, the bane of the PhD life, makes writing this section particularly easy: Ican’t count the number of people without the support of whom I wouldn’t have finished thismanuscript. But even if I should ever overcome my insecurities, there’s no denying that thefollowing folks have had a huge impact on making this possible.
Obviously I must start thanking my supervisors and collaborators. Thank you Anna, forfirst introducing me – 6 years ago! – to the beauty of neutron stars through that superflu-idity Astrovaria project, for then encouraging me to apply for this position and finally foroffering me the opportunity to develop myself as a theorist. Thank you Jean, for so carefullyfollowing my progress and never letting me off the hook, even when I truly thought this wasa desperately pointless effort, for actively participating in our research, going beyond yourmere supervising duties, for sending me pretty much anywhere to make our results known tothe outside world and for letting me have my way in venturing in the uncharted territory ofsimulations half way through this PhD project. Thank you both for bearing with my, shallwe say, unadvanced understanding of hierarchies. Thank you Yuri for the illuminating – amI being hyperbolic? – discussions on coding and hydrodynamics that I often had to cut shortwhen I literally couldn’t store any more input. It has proven to the point almost every singletime. Thank you Thijs too, you have taught me so much so much about programming! Thankyou Alessandro, for teaching me that papers can be written in a day, because sometimes youjust gotta stop thinking and start doing. Thank you Duncan and Andrew, for inviting me toMonash and Montreal: on each visit I felt overwhelmed with the number of ideas I wantedto start working on as soon as possible. Thank you Michiel, Rudy, Phil and the rest of theX-ray timing crowd for so passionately scrutinizing my results at our meetings: so long andthanks for all the broodjes. Thanks to Laura and Francesco, without whose help I wouldn’thave been able to propose and carry out my first ToO observations. Thank you Marieke, fornot laughing at me when I presented you with a Dutch translation of this thesis’ summary.Thank you Nathalie for the much-needed excitement and self-confidence boost that I got inthese last couple of months from our observational proposals. Obviously I must thank Es-ther, Lidewijde, Marlies, Milena, Milou, and Susan as well. Who runs the world? Girls do(Knowles-Carter 2011).
And then of course my fellows. Dank aan Rik, Thijs en Marianne: ik had dit project al
137

5 Acknowledgements
lang opgegeven zonder jullie ondersteuning. Jullie hebben vanaf het eerste moment dit arro-gante, vervelende ventje, die jullie taal zo erg mishandelde, togestaan om zijn meningen tij-dens talloze discussies op z’n Italiaans te uiten. Als ik eindelijk iets begrepen van dit land heb,van zijn politiek en gemeenschap, dan heb ik het grotendeels aan jullie te danken. We zijnheel anders dan elkaar: het allerbelangrijkste Nederlandse eigenschap – ff normaaaaaaaaaldoen – heb ik mij nooit eigen gemaakt. Dank dus voor jullie geduld en nuance, want ik hebvan jullie geleerd wat een machtige en waardevolle kwaliteiten dat zijn. Ha, stiekem hebbenjullie mij toch wel ingeburgerd!
Thank you all friends, fairies and comrades. You know who you are and I don’t need tolist you. When I call Amsterdam home, it’s you I’m talking about.
Grazie ai miei genitori per tutto il supporto. Se oggi sono contento di essere dove sono,lo devo prima di tutto a voi due.
TullioAmsterdam, autumn 2015
138