UV Lamps in Air Circulating Ductwork - CED Engineering Air...light, we recommend that test methods...
50
UV Lamps in Air Circulating Ductwork Course No: M04-003 Credit: 4 PDH Steven Liescheidt, P.E., CCS, CCPR Continuing Education and Development, Inc. 9 Greyridge Farm Court Stony Point, NY 10980 P: (877) 322-5800 F: (877) 322-4774 [email protected]
Transcript of UV Lamps in Air Circulating Ductwork - CED Engineering Air...light, we recommend that test methods...
UV Lamps in Air Circulating Ductwork Course No: M04-003
Credit: 4 PDH
Steven Liescheidt, P.E., CCS, CCPR
Continuing Education and Development, Inc. 9 Greyridge Farm Court Stony Point, NY 10980 P: (877) 322-5800 F: (877) 322-4774 [email protected]

ARTI-21CR/610-40030-01 DEFINING THE EFFECTIVENESS OF UV LAMPS INSTALLED IN CIRCULATING AIR DUCTWORK Final Report Date Published – November 2002
Douglas VanOsdell and Karin Foarde RTI P.O. Box 12194 Research Triangle Park, NC 27709-2194 Prepared for the AIR-CONDITIONING AND REFRIGERATION TECHNOLOGY INSTITUTE 4100 N. Fairfax Drive, Suite 200, Arlington, Virginia 22203 Distribution A – Approved for public release; further dissemination unlimited.

DISCLAIMER This report was prepared as an account of work sponsored by the Air-Conditioning and Refrigeration Technology Institute (ARTI) under its “HVAC&R Research for the 21st Century” (21-CR) program. Neither ARTI, the financial supporters of the 21-CR program, or any agency thereof, nor any of their employees, contractors, subcontractors or employees thereof - makes any warranty, expressed or implied; assumes any legal liability or responsibility for the accuracy, completeness, any third party’s use of, or the results of such use of any information, apparatus, product, or process disclosed in this report; or represents that its use would not infringe privately owned rights. Reference herein to any specific commercial product, process, or service by trade name, trademark, manufacturer, or otherwise, does not necessarily constitute nor imply its endorsement, recommendation, or favoring by ARTI, its sponsors, or any agency thereof or their contractors or subcontractors. The views and opinions of authors expressed herein do not necessarily state or reflect those of ARTI, the 21-CR program sponsors, or any agency thereof. Funding for the 21-CR program provided by (listed in order of support magnitude): - U.S. Department of Energy (DOE Cooperative Agreement No. DE-FC05-99OR22674) - Air-Conditioning & Refrigeration Institute (ARI) - Copper Development Association (CDA) - New York State Energy Research and Development Authority (NYSERDA) - Refrigeration Service Engineers Society (RSES) - Heating, Refrigeration and Air Conditioning Institute of Canada (HRAI) Available to the public from U.S. Department of Commerce National Technical Information Service 5285 Port Royal Road Springfield, VA 22161 (703) 487-4650 Available to U.S. Department of Energy and its contractors in paper from U.S. Department of Energy Office of Scientific and Technical Information P.O. Box 62 Oak Ridge, TN 37831 (423) 576-8401

i
ARTI-21CR/610-40030-01 DEFINING THE EFFECTIVENESS OF UV LAMPS
INSTALLED IN CIRCULATING AIR DUCTWORK
Final Report
Date Published – November 2002
Douglas VanOsdell Karin Foarde
Prepared for the AIR-CONDITIONING AND REFRIGERATION TECHNOLOGY INSTITUTE
Under ARTI 21-CR Program Contract Number 610-40030

ii
EXECUTIVE SUMMARY Germicidal ultraviolet (UVGI) lamps have a long history of use for inactivating microbial aerosols. Most reports have focused on the control of infectious diseases, such as tuberculosis (TB), in the occupied spaces of medical facilities. Ventilation duct use of UVGI has been increasing. In-duct applications are generally more concerned with controlling environmental organisms than with controlling infections agents. This document reports the results of a project to investigate the ability of UVGI lamps to inactivate representative environmental microbial aerosols in ventilation ducts. Results During this research, UVGI lamps were experimentally demonstrated to inactivate bioaerosols composed of vegetative bacteria, bacteria spores, or fungal spores to a reproducible degree under conditions of fixed dose. Vegetative bacteria were most susceptible to UVGI, with bacteria and fungal spores being substantially more resistant. The performance equation commonly cited in the literature for UVGI inactivation was found to generally apply, provided its parameters were known. The experimental measurements suggest that the less resistant vegetative organisms, represented by Staphylococcus epidermidis, can be somewhat protected by organic material coating the bioaerosol or by increases in humidity. Even with the added resistance, vegetative bacteria remained susceptible to UVGI relative to the spores. A single lamp inactivated more than 50% of the bioaerosol. Humidity and/or organic material coating the bioaerosol had much less impact on inactivation of the spore-formers, which were much more difficult to kill and required use of more lamps. For example, six lamps were required to inactivate the spore-formers to the same extent reached using a single lamp on the vegetative bacteria. Overall, the microorganism-dependent rate constant values determined during this research are similar to the applicable values. Of the physical factors that might influence UVGI lamp performance, air temperature and flow rate, lamp design, and ballast design were found to be most significant. Isolated changes in humidity had a measurable but very small effect on lamp irradiance. Lamps designated “high output” were found to indeed provide higher irradiance than “low output” lamps, and lamps designed specifically for lower temperature operation also appeared to perform better under those conditions. However, the terminology is not completely consistent. UVGI lamps have a point of maximum output when exposed to various air temperatures and airflow rates. This optimal operating point is fundamentally related to lamp operating temperature and can be reached by various combinations of environment and heat transfer rate (principally air temperature and flow rate) that bring the lamp to the proper operating condition. The reduction in output due to overcooling at temperatures achievable in a heating, ventilation, and air conditioning (HVAC) system has been shown to be as much as a factor of two, which could have a significant effect on kill for bioaerosols.

iii
Conclusions And Recommendations The key factors for the design of in-duct UVGI systems intended to disinfect moving airstreams are (1) UV lamp irradiance at operating conditions, (2) microbial resistance data, (3) having a tested and functioning bioaerosol dose model, and (4) duct wall reflectance. Given this information, UVGI system designers can make reasonable and responsible performance estimates for most in-duct applications. (The common lack of test results that provide lamp output at use temperature and airflow makes independent verification of a vendor’s UVGI system design difficult.) The good news that reliable UVGI system design is available must be tempered by an understanding of the intrinsic variance of microbial populations. Resistance variations between strains of the same organism have the potential to be substantial, but very little work has been done. In consequence of this, UVGI system designers should
• Apply safety factors to their designs, particularly as they depart from operating modes for which they have performance data and field experience.
• Know actual lamp output at the most challenging operating condition in the duct. • Avoid relying solely on design equations to determine the performance of their systems.
Actual testing with the contaminants of interest is highly recommended. • Be extremely cautious regarding claims about UVGI systems’ high levels of inactivation
of pathogenic bioaerosols. While the microbiological science underlying these conclusions applies to pathogenic bioaerosols as well as environmental organisms, much greater caution is required in the former case. It would be irresponsible to claim a high inactivation rate for a pathogenic bioaerosol without substantial testing. Even with substantial testing, design failures may occur.
In the efforts to counter bioterrorism, the use of UVGI is likely to be proposed with increasing frequency. It is a low-pressure-drop, nonintrusive technology that has real potential. In that light, we recommend that test methods and guidance for performance claims regarding bioterrorism agents be developed by an experienced and broadly based group of technical experts, users, and manufacturers. Until rigorous and adequate tests have been developed and performed, claims regarding protection against aerosol bioterrorism agents are suspect. The potential errors are too large and the consequences too great.

iv
TABLE OF CONTENTS
EXECUTIVE SUMMARY...........................................................................................................ii
TABLE OF CONTENTS............................................................................................................. iv
1.0 INTRODUCTION............................................................................................................. 1 1.1 BACKGROUND.................................................................................................................. 1 1.2 PROJECT OBJECTIVES ....................................................................................................... 2 1.3 TECHNICAL APPROACH .................................................................................................... 3 1.4 REPORT OVERVIEW.......................................................................................................... 3
2.0 EXPERIMENTAL METHODS AND APPARATUS.................................................... 3 2.1 FULL-SCALE TEST DUCT.................................................................................................. 4 2.2 UVGI LAMP OPERATION AND IRRADIANCE MEASUREMENT ........................................... 6
2.2.1 UV Lamps and Ballasts ........................................................................................... 6 2.2.2 UV Lamp Operating Configurations....................................................................... 6 2.2.3 In-Duct Irradiance Measurements .......................................................................... 7 2.2.4 Apparatus for All-Angle UVGI Measurements ....................................................... 8
2.3 CHEMICAL BYPRODUCTS EXPERIMENTS ........................................................................ 11 2.3.1 Ozone Measurement.................................................................................................... 11 2.3.2 Volatile Organic Chemical Byproducts Measurement ............................................... 12
2.4 MICROBIOLOGICAL MEASUREMENTS ............................................................................. 12 2.4.1 Bioaerosol Disinfection Efficiency Measurement ....................................................... 12 2.4.2 Test Duct Operation .................................................................................................... 13 2.4.3 Test Bioaerosol Generation ........................................................................................ 13 2.4.4 Bioaerosol Sampling ................................................................................................... 13 2.4.5 Microbiological Growth and Enumeration................................................................. 14 2.4.6 Microbial Kill Estimates for Experimental Planning ................................................. 14 2.4.7 Data Reduction............................................................................................................ 15 2.4.8 Bioaerosol QA/QC ...................................................................................................... 16
2.5 IN-DUCT IRRADIANCE MODEL AND DOSE CALCULATIONS ............................................ 16 2.5.1 UVGI Irradiance Field in an Air Duct........................................................................ 17 2.5.2 Particle Movement in Air Ducts.................................................................................. 18 2.5.2 In-Duct UV Dosage Model.......................................................................................... 20
3.0 KEY FACTORS .............................................................................................................. 21 3.1 PHYSICAL FACTORS RESULTS AND DISCUSSION............................................................. 21
3.1.1 Effect of Duct Air Conditions on UVGI Lamp Output ................................................ 21 3.1.2 Lamp and Ballast Design Effects ................................................................................ 24 3.1.3 Effects of Lamp Soiling ............................................................................................... 25 3.1.4 Reflectance ................................................................................................................... 25 3.1.5 Enclosure and Location Factors ................................................................................. 28
3.2 CHEMICAL BYPRODUCTS RESULTS AND DISCUSSION..................................................... 30 3.2.1 Ozone........................................................................................................................... 30 3.2.2 Effect of UV lights on VOCs........................................................................................ 30

v
3.3 MICROBIOLOGICAL FACTORS RESULTS AND DISCUSSION .............................................. 32
3.3.1 Test Organism Selection.............................................................................................. 32 3.3.2 Growth of Organisms in the Dark............................................................................... 34 3.3.3 Recovery of Damaged Test Organisms ....................................................................... 34 3.3.4 The Influence of Aerosol Composition on Bioaerosol Tests ....................................... 35 3.3.5 The Influence of Relative Humidity on Test Organisms.............................................. 35
4.0 UVGI EFFICACY IN AIR DUCTS ................................................................................... 36 4.1 MEASURED EFFICACY AND DISCUSSION ........................................................................ 36
4.1.1 Vegetative Organisms ................................................................................................. 37 4.1.2 Spore-Forming Bacteria and Fungi............................................................................ 37 4.1.3 Summary of Calculated Microbial Resistance Constants ........................................... 38
4.2 DESIGN OF UVGI SYSTEMS FOR AIR DUCTS....................................................................... 38
5.0 CONCLUSIONS ............................................................................................................. 39
6.0 RECOMMENDATIONS................................................................................................ 40
7.0 REFERENCES................................................................................................................ 40

vi
List of Tables
Table 1. Reflectance of various materials .................................................................................... 26 Table 2. Irradiance measurements with coil in duct..................................................................... 29 Table 3. Effect of Duct Configuration on Microbial Kill ............................................................ 29 Table 4. Chemicals identified in byproduct sampling.................................................................. 31 Table 5. Results of Preliminary Microbial Kill Experiments....................................................... 33 Table 6. Percent kill of the 3 test organims at varying test conditions ........................................ 37 Table 7. Summary of k values for test organisms ........................................................................ 38
List of Figures Figure 1. 52.2 test rig arranged for bioaerosol tests of UV lamps ................................................. 5 Figure 2. Detail of aerosol injection region of test duct................................................................. 5 Figure 3. Lamp and test duct configurations.................................................................................. 7 Figure 4. Inside view of duct mock-up apparatus showing lamps ................................................. 9 Figure 5. Inside of duct mock-up with guillotine and locator grid .............................................. 10 Figure 6. Reflectance measurement position grid........................................................................ 11 Figure 7. Computed % kill as a function of dose and microbial resistance ................................. 15 Figure 8. Effect of air velocity and temperature on “low” power lamp irradiance at 1 m........... 22 Figure 9. Effect of air velocity and temperature on 1 m irradiance for “high” output lamps ...... 22 Figure 10. Measured effect of humidity on irradiance................................................................. 24 Figure 11. Irradiance distribution in galvanized duct .................................................................. 27 Figure 12. Irradiance distribution for black flock paper lined duct ............................................. 27 Figure 13. Ratio of galvanized to black flock irradiance ............................................................. 28 Figure 14. Results of chemical sampling up- and downstream of lamps..................................... 30
1
1.0 INTRODUCTION 1.1 Background The use of ultraviolet (UV) lights to disinfect room air and air streams dates to about 1900. Richard Riley has numerous publications in the 1960’s and 1970’s that deal with UV disinfection and has published an extensive review (Riley, 1988), as has Shechmeister (1991). Early work established that the most effective UV light wavelength was the wavelength range from 220 to 300 nanometers (nm), with the peak effectiveness near 265 nm. In current commercial practice, UV light of the appropriate wavelength is generated by electrical discharge through low-pressure mercury vapor, which is enclosed in a glass tube that transmits UV light. The resulting germicidal lamp produces UV light that has a primary wavelength of 253.7 nm. This wavelength is within the short-wave, or “C” band of UV light. It is sometimes abbreviated as UVC and is alternately known as germicidal UV or ultraviolet germicidal irradiation (both abbreviated as UVGI). UVGI has been shown to deactivate viruses, mycoplasma, bacteria, and fungi. To date, most of the use of UVGI for airborne organism control in buildings has focused on limiting the transmission of very infectious diseases (particularly TB) in occupied spaces such as medical waiting or treatment rooms. In this application, UVGI lamps are often located in the upper part of a room (near the ceiling) and must be visually shielded from the occupied space. Mixing between the breathing zone and the irradiated zone is critical to operation, and mixing fans are sometimes used. The effectiveness of near-ceiling UVGI lamp use is fairly well known. Numerous publications are available. In a recent paper that includes an extensive list of references, Miller and Macher (2000) discuss the use and characterization of occupied-space, near-ceiling UVGI. Application principles have been published (CDC, 1994), as have guidelines for system selection and use (CDC 1999a, CDC 1999b.) The occupied space application of UVGI is not discussed further in this report. UVGI has been used in ducts for some time, and its use is becoming increasingly frequent as concern about indoor air quality increases. Lamp manufacturers have published design guidance documents for in-duct use (Westinghouse, 1982; Phillips, 1985; Phillips, 1992). Recent papers by Schier and Fencl (1996) and Kowalski and Bahnfleth (1998) have summarized the literature and discussed in-duct applications. These and other recent papers were based on case studies and previously published performance data. For constant and uniform irradiance, the disinfection effect of UVGI on a single microorganism population can be expressed as follows (Phillips, 1992): Nt/N0 = exp(- k Eeff ·∆t ) = exp(- k·Dose) (1) where
N0 = the number of microorganisms at the start, Nt = the number of microorganisms after any time t,

2
Nt/N0 = the fraction of microorganisms surviving, k = a microorganism-dependent rate constant, cm2/µW - s, Eeff = the effective (germicidal) irradiance received by the microorganism, µW/cm2, and Dose = the product of Eeff ·∆t, µW ⋅ s/cm2.
The units shown above are common, but others are used as well, including irradiance in J/m2. Eq. 1 describes an exponential decay in the number of living organisms as a constant level of UVGI exposure continues. The same type of equation is used to describe the effect of disinfectants on a population of microorganisms, with the dose in that case being a concentration-time product. The fractional kill after time t is (1-Nt/N0). While the applicability of Eq. 1 is well established for a microorganism exposed to a constant UVGI irradiance, some investigators have detected fine structure in the decay curves, including onset dose thresholds and changes in the k values at high dose (Kowalski et al., 2000.) Eq. 1 appears to be adequate for practical use in ducts. Eq. 1 shows an apparent distribution of resistance to UVGI within a population, with a fraction of the microorganisms being killed at a low dose and others at a higher dose. This effect is thought to be due both to a distribution of resistance inherent to the microorganism population and the presence of various contaminants or multiple layers of organisms that reduce the effective UVGI to the resistant microorganisms. Practically, bioaerosols are generated from active colonies that contain numerous contaminants. In a duct, the use of Eq. 1 is complicated by the movement of the target microorganisms in the airstream and the fact that the UVGI irradiance is not constant within the duct. In addition, the physical parameters of the duct, duct airflow, and UV installation have the potential to affect both the irradiance and the microorganisms’ response to it. As is the case with upper-room UV installation design, the principal design parameters for UVGI in in-duct applications are not simple and include some uncertainty in the data available to analyze them and secondary effects. The discussion below expands on these principal and secondary variables. Recently, the use of UV lamps inside building ventilation ducts has been increasing in both medical and nonmedical buildings for the control of environmental microorganisms. Therefore, a need has arisen to better understand the capabilities of such installations. Prior to this research, public data supporting the design and application of UV products in ducts were very limited. This research arose out of a desire, on the part of the ventilation industry, to independently evaluate the claims and design guidance of UV light vendors and manufacturers. Some UV applications are intended to disinfect the air and others are intended to disinfect surfaces. The research presented in this report was limited to in-duct use of UV lamps intended to disinfect flowing air. Only environmental (not pathogenic) microorganisms were included in the test program. 1.2 Project Objectives The overall objective of this research program was to “obtain reliable scientific data through laboratory testing to determine the antimicrobial efficacy of UVC in circulating air ducts and the

3
potential ability of these lights to kill or inactivate common microbes and subsequently reduce indoor air microbiological contamination.” 1.3 Technical Approach To accomplish the project objective, four tasks were undertaken: 1. Identifying the key factors impacting the use of UVC lights in circulating air ducts, 2. Quantifying the impact of these factors on the ability of UV devices to kill or limit
common environmental microorganisms, 3. Developing documented relationships between UVC disinfection efficacy and in-duct use
and design, and 4. Communicating that understanding to the ARI-member audience through appropriate and
useful test methods and design guidance. Identification of the key factors was accomplished through a literature search and the reconciliation of published UVC performance with the experimental results obtained during the research. Quantification of the impact of these factors and the development of documented relations of UVC performance were linked through the development of a model to calculate (estimate) the UVC dose received by the organisms in the airstream and thereby link the physical and microbiological measurements and permit their generalization to other situations. 1.4 Report Overview Section 2.0 documents the apparatus and methods used during the experimental phase of this research and also describes the model used to calculate the UVGI dose received by the bioaerosols during the experiments. Section 3.0 identifies the key physical and microbiological factors for in-duct UVGI use and briefly summarizes their impact as reported in the literature and as demonstrated in experimental work from this project. Section 4.0 presents and discusses results that bear on the primary research objective. Sections 5.0 and 6.0 present conclusions and recommendations based on this research. References for the report are presented in section 7.0.
2.0 EXPERIMENTAL METHODS AND APPARATUS The experimental methods and apparatus used during this research consisted of the following: 1. Operation of a test duct with UVGI lamps installed. This operation included
microbiological sampling upstream and downstream of the lamps and control and measurement of rig temperature, humidity, and flow rate,
2. Installation, operation, and irradiance measurements for the UVGI lamps, 3. Chemical byproducts measurements in the test rig, 4. Test bioaerosol generation, sampling, counting, and disinfection efficiency calculation,
and 5. Use of a bioaerosol UVGI dose model to compute microbial resistance constants, which
allow generalization of the efficacy results to other lamp and duct configurations and comparison to the literature.
4
2.1 Full-Scale Test Duct The test duct used during this research is shown in Figure 1. It is a full-scale American Society of Heating, Refrigerating, and Air-Conditioning Engineers, Inc. (ASHRAE) 52.2 test rig (ASHRAE, 1999) of recirculating design with airflow control over approximately 600 to 3,000 cfm (17 to 85 m3/min), temperature control between 50 and 85 °F (10 and 30 °C), and humidity (35–85% RH) control. The airflow through the test duct was measured using a calibrated ASME flow nozzle. Flow was controlled by modulating the fan motor speed using the computer interface. Control to the flow set point was automatic with operator tuning as required. Temperature and humidity control were achieved using a flow-modulated chilled water coil and modulated steam injector that were also computer-controlled. The test duct was operated at positive pressure in the sample section to prevent the infiltration of room air aerosol. Air entering the test section was filtered with High Efficiency Particulate Air (HEPA) filters to remove ambient aerosol from the airflow. As shown in Figure 1, the test rig is set up for recirculating operation, which was the operating mode used for all bioaerosol runs. The dampers were set to draw air into the rig from the conditioned space and discharge it through the roof for the byproduct chemicals tests. Figure 2 shows additional details of the aerosol injection region of the test duct. The test bioaerosol was injected at the location shown in Figures 1 and 2. For all experiments, the test bioaerosol was nebulized from a liquid solution using a six-jet Collison nebulizer. The upstream and downstream mixers shown have two parts: an upstream 30.5-cm (12-in.) diameter orifice in a steel plate and a downstream 15.2-cm (6-in.) diameter target disk centered on the orifice. Details of the test rig are given by ASHRAE (1999). For the initial screening tests, the test bioaerosol was injected either directly into the duct (for easily desiccated vegetative bioaerosols) or through the ASHRAE 52.2 drying tower (for more robust bioaerosols, such as the spores) and thence into the duct through a Kr-85 aerosol neutralizer. The drying tower operation is described in ASHRAE 52.2, and provides approximately a 50 s residence time for aerosol conditioning in 0.00189 m3/s (4 cfm) of clean, dry air. Both injection techniques appeared to give adequate dispersion and mixing of the test aerosol, which had a mean aerodynamic particle diameter of 2 to 3 µm. However, use of the drying tower was considered to be better practice and all test bioaerosols were injected through the drying tower for the final tests. Further details of the microbial test aerosol preparation are provided in Section 2.6.

5
Figure 1. 52.2 test rig arranged for bioaerosol tests of UV lamps.
Figure 2. Detail of the aerosol injection region of the test duct.
Aerosol concentrations were measured upstream and downstream of the test section to obtain the challenge and penetrating bioaerosol concentrations, respectively. The inlet nozzles of the upstream and downstream aerosol probes were designed to yield isokinetic sampling conditions for the 28.3 L/min (1-cfm), single-stage Andersen samplers. The bioaerosol sample ports were located at points of well defined airflow and well mixed aerosol conditions, as required to achieve unbiased, representative samples. Mixing and flow at the sample locations were confirmed by following the procedures in ASHRAE 52.2, which require the same suitable flow conditions. Aerosol losses through the duct and the 180° bend, while present, were not large (typically a few percent at 2 µm and less than 20% loss at 10 µm). The data reduction system compensated for these losses as described below in the quality assurance (QA) and quality control (QC) procedures.

6
2.2 UVGI Lamp Operation and Irradiance Measurement
2.2.1 UV Lamps and Ballasts Two types of commercial UV lamps were utilized during this research. Because the industry does not use a standard test to measure UVGI lamp output presented in most sales literature, the lamps are difficult to characterize, except through direct measurement. Performance data are presented below. Visually, the two test lamps were identical except for the label. Both were 0.61-m (24-in) long, T5 (~ 1.6-cm (5/8-in.) diameter), single-ended lamps intended for insertion into a duct from outside. The ballasts were connected to the lamps through four-pin power connectors. Power was provided to the in-duct end of the lamp by small wires running from the power connector along the outside length of the lamp tube. A flange on the power connector was used to clamp them in place perpendicular to the duct wall. The two lamp types were 1. Low-output lamps driven by conventional magnetic ballasts. These lamps were obtained
because they appeared (from inspection of vendor sales literature) to be characteristic of the low-cost end of the in-duct market. They were branded by the vendor and thus could not be independently traced back to a lamp manufacturer. Discussions with industry experts led to a characterization of these lamps as low-pressure mercury lamps driven at low power. In still air at 21°C (70°F), surface output was computed for a single lamp .
2. High-output lamps driven by electronic ballasts. Based on vendor sales literature, these lamps were designed for both higher output and also improved output at low temperature and with air flowing past them. They too were branded by the vendor and could not be independently traced. An industry expert characterized these lamps as low pressure mercury lamps that were over-driven to achieve higher output.
2.2.2 UV Lamp Operating Configurations The UVGI lamps were operated (except during the alternate duct configuration tests) in the test section shown in the center of Figure 3a, with the lamps in a vertical column perpendicular to the airflow (crossflow). There were three primary lamp arrangements: 1. One lamp at duct center, 2. Three lamps, one at the center and one above and below on 20.3-cm (8-in.) centers, 3. Six lamps spaced on 10.2-cm (4-in.) centers in a vertical column. A screen was used to obtain irradiance levels lower than those that could be obtained from a single low-output lamp. The screen consisted of three concentric layers of common window screen, rolled into a cylinder and slipped over the lamp.

7
Figure 3. Lamp and test duct configurations
2.2.3 In-Duct Irradiance Measurements Bioaerosols in a duct may be exposed to UVGI light from all angles, particularly if the duct is significantly reflective to UVGI. The commonly available detector for UVGI is a solid-state

8
detector whose otherwise broad wavelength response is limited (using filters) to the UVC. A calibration is used to convert the voltage produced by the detector to UVGI irradiance. Some filters pass a broad UVC spectrum, while others have a narrower response. All irradiance measurements conducted during this research utilized an International Light (IL) IL1700 Research Radiometer fitted with a factory NIST-traceable calibrated IL SED240 detector, QNDS2 filter, and W quartz diffuser. This detector has a 185 to 310 nm wavelength spectral response. With the diffuser installed, the detector has what is known as a cosine response characteristic. A true irradiance reading is obtained for light entering perpendicularly (incident angle of 0°) into the detector. The detector measures UV light entering from other angles as the product of the true irradiance and the cosine of the angle of incidence. Positioned in the center of the duct and aligned in the direction of flow, the UV detector measures all UV light striking it at 0° and 70.7% of the UV light striking it at an incident angle of 45°. Very little UVGI is detected as the incidence angle widens to the sides of the detector and, of course, no UVGI from the back can be detected. All common UVGI radiometers utilize the same operating principle and have the same limitation. Use of a standard, cosine-response UVGI radiometer in this research was desirable because it is the instruments most likely to be used in the ventilation industry. The use of this type of radiometer required investigation because a bioaerosol particle receives UVGI energy from all angles, while the UVGI radiometer does not. Should reflected UVGI from the duct walls be a high fraction of the total UVGI impinging on the bioaerosol particles, single-position measurements made with these detectors aligned with the duct axis would underestimate the total dose and be of limited value. Multi-axis measurements with a cosine-response detector would be time consuming and require consolidation of the data into a total irradiance value. (Photosensitive chemical methods have been developed for time-integrated UVGI dose measurement; however, these are also difficult to implement in the field.) Irradiance measurements within the test duct were made at various distances from the lamps. The detector was centered in the duct at distances ranging from 25 to 100 cm (10 to 39.4 in.)from the lamp centerline and aligned along the duct centerline. The instrument cable was run through a duct wall penetration and connected to the IL1700. All lamp performance measurements were made after allowing the UV lamps to stabilize at the duct operating conditions.
2.2.4 Apparatus for All-Angle UVGI Measurements A mocked-up duct section was utilized to measure irradiance from all possible incident angles and thereby permit evaluation of the errors attendant to use of the radiometer detectors. The duct mock-up was used in place of the test duct to allow the detector to be rapidly positioned without exposing the operator to the UVGI. The sections below describe the apparatus and methods.
2.2.4.1 Duct mock-up and all-angle UVGI measurements The duct mock-up was a 61- by 61-cm (24- by 24-in.) interior dimensions duct section in which the light from the lamps could be blocked to allow the radiometer to be adjusted without exposing the operator to the UV light. The wall materials could also be easily changed for

9
reflectance measurements. The mock-up consisted of a box with a replaceable lining. The ends of the apparatus were covered with grills to prevent accidental exposure. Access into the box was through two full-depth doors that formed the top of the duct mock-up. The three test lamps were installed in a vertical column on the right side of the apparatus as shown in Figure 4. Because the lamps needed to be kept at a stable operating temperature, they could not be turned off without allowing for a substantial warm-up period. Accordingly, they remained on throughout the experiment, and a sheet metal guillotine damper (seen in Figure 5) was lowered before the access door was opened. The relative irradiance level was primary in this experiment, not the absolute level, and therefore temperature control beyond a stable operating condition was not required. For all of these experiments, three low-output lamps powered by magnetic ballasts were positioned perpendicular to the “flow direction” in the duct mock-up, as shown in Figure 4. One lamp was at the horizontal center, one 20.3 cm (8 in.) above, and one 20.3 cm (8 in.) below.
Figure 4. Lamps shown in an inside view of duct mock-up apparatus.
The radiometer and detector were described above. The detector was mounted on a rotating and hinged protractor-equipped base and tripod that allowed the detector to be moved vertically and aligned in any horizontal or vertical angle. A pencil laser (mounted below, and aligned with, the detector axis of measurement) was used to accurately position it using the grid on the damper. While not obvious in the photographs, a 22° acceptance angle cone was mounted on the front of the detector to prevent confusion when interpreting the all-angle measurement data.

10
Figure 5. Inside of duct mock-up with guillotine and locator grid.
The UV detector was positioned at 50 and 100 cm (19.7 and 39.4 in.)from the plane of the lamps at the center of the test duct. Irradiance measurements were made every 22.5° around both a horizontal and a vertical plane, with 0° being the perpendicular from the plane of the lamps to the detector face.
2.2.4.2 Measurement of irradiance with lined duct Different materials reflect UV light to a different extent, as further discussed below. The apparatus was used to allow the measurement of irradiance for both relatively high- and low-reflectance materials. The purpose was to determine effect of reflectance on the uniformity of irradiance in the duct and the level of irradiance measured using the radiometer.

11
Figure 6 is a schematic drawing of the measurement locations in the duct mock-up. The irradiance from three low-output lamps was measured at static flow conditions, which allowed comparison within this data set. The measurements were made within a single quadrant of the duct mock-up. This quadrant was divided into 9 segments, each 10.2 (4 in.) on a side (this is the same grid used in the performance model). Measurements were made with the radiometer detector facing the lamps at 30, 50, 75, and 100 cm (11.8, 19.7, 29.5, and 39.4 in.) from the plane of the lamps. The same set of measurements was made for new galvanized metal and for photographic black flock paper.
Figure 6. Reflectance measurement position grid.
2.3 Chemical Byproducts Experiments All chemical byproducts measurements were conducted in the full-scale test duct at ambient temperature and humidity and at a flow rate of 0.472 m3/s (1,000 cfm.) To prevent buildup of any byproducts, the test duct was operated in open-loop mode, without recirculation. Inlet air was drawn from conditioned space, filtered ahead of the test section, and discharged through a roof vent. Six lamps were mounted and operated in crossflow on 10.2-cm (4-in.) centers. They were allowed to operate for at least 15 minutes prior to beginning each test.
2.3.1 Ozone Measurement Specific types of UV lamps are used to generate ozone in laboratory settings, which raises questions about ozone production by UVGI lamps. The 185-nm emission line for mercury is generated in low-pressure discharge lamps and would generate ozone in air. However, most low-pressure UVGI lamps intended for use in air utilize glass that does not pass the 185-nm

12
wavelength; this eliminates/minimizes ozone production. Medium-pressure mercury lamps, on the other hand, may generate ozone. The intent of the ozone generation experiment was to validate the assertion that no measurable ozone was produced under normal operating conditions. The challenge of this experiment lay in the large amount of air required to operate normally and hence the expected low concentration difference between inlet and outlet concentrations. The potential for UVGI lamps to produce ozone under operating conditions was investigated using an ambient ozone analyzer (Thermo-Environmental Instruments, Inc., Model 49 UV Photometric O3 Analyzer, 0–50 ppm range) to measure ozone upstream and downstream of the six UVGI lamps. The gas sample was drawn directly into the instrument. The upstream sample was obtained at the bioaerosol upstream port (2.13 m (7 ft) upstream of the lamps), and the downstream samples were centered approximately 46 cm (1.5 ft) downstream and at the downstream bioaerosol sample port [6.1 m (20 ft) downstream.] Tests were run with both the low- and high-output lamps.
2.3.2 Volatile Organic Chemical Byproducts Measurement Similarly to the issues regarding ozone production by UV lamps UV light under some conditions is also known to induce chemical reactions in some volatile organic chemicals (VOCs). The goal of this experiment was to operate the UVGI lamps under normal duct operating conditions, challenge them with a “cocktail” of VOCs, sample upstream and downstream, and look for chemicals downstream that were not found upstream. As with the ozone experiment, the major experimental challenge was the level of dilution, which would make detection of low levels of byproducts very difficult. The test duct was operated at 0.472 m3/s (1,000 cfm), 22°C (72 °F), and 50% RH in open loop mode. A VOC cocktail consisting of approximately equimolar fractions of toluene, hexane, 2-butanol (commonly known as methyl ethyl ketone, or MEK), and iso-butanol was injected into a total vaporizer at 0.2 mL/min. The vaporized liquid entered a 57 L/min (2-cfm) hot airstream that was injected into the test duct, producing an approximately 1.5 ppm VOC challenge. Air samples were drawn through adsorbent sampling tubes at 0.2 L/min for 90 min to obtain upstream and downstream samples of the duct air. The sample tubes were located at the duct center at the location of the bioaerosol upstream and downstream sample ports. Duplicate samples were drawn; the total duct operating time was approximately 3.5 hours. A field blank adsorbent tube was also obtained. The sample tubes were returned (chilled) to the commercial analysis company, where they were desorbed into a GC/MS and the concentrations of total and individual VOCs were measured. 2.4 Microbiological Measurements
2.4.1 Bioaerosol Disinfection Efficiency Measurement The basic measurement of bioaerosol kill by UVGI irradiation was based on the following experimental procedures: 1. Establishment of stable flow and lamp operation in the test duct at the test conditions,

13
2. Generation of a stable test bioaerosol of the desired test organism, 3. Collection of upstream and downstream bioaerosol samples, using one-stage Andersen
biological samplers, 4. Growth and enumeration of microbiological samples, and 5. Data reduction to compute the kill efficiency of the UVGI lamp configuration. The same general procedures were used for each bioaerosol kill measurement.
2.4.2 Test Duct Operation The test duct was operated as described in Section 2.2.
2.4.3 Test Bioaerosol Generation Except for a brief investigation of solid aerosols, all test bioaerosols used during this research were nebulized from an aqueous organism suspension and injected into the test duct. Depending on the organism, the bacterial and fungal challenge suspensions were prepared by either 1. Inoculating the test organism onto solid media, incubating the culture until mature,
wiping a wetted sterile swab across the surface of the pure culture, and eluting from the swab into sterile high-purity deionized [18 megaohm (MΩ)/cm resistance] water to obtain 15% transmission on the spectrometer, or
2. Purchasing a spore suspension from a commercial vendor and diluting it in sterile water. Both correspond to a concentration of approximately 1.5 x 10⁷ CFU/mL. The microorganisms were resuspended in sterile 18 MΩ/cm deionized water. Very high purity water was used to minimize the particles from sources other than the organisms themselves (e.g., dissolved solids). For the broth suspensions, the organisms were prepared following the same protocol, but were resuspended in trypticase soy broth instead of 18 MΩ/cm deionized water. However, in an attempt to minimize particulate contamination from the broth, the broth was prepared in 18 MΩ/cm deionized water. The challenge organism suspensions were aerosolized using a Collison modified MRE-type six-jet nebulizer (BGI, Waltham, MA) at 100 kPa (15 psi) air pressure. The Collison generates droplets with an approximate volume mean diameter of 2 µm. The particle diameter after the water evaporates depends upon the solids content of the suspension. Particle size is determined by the size of the suspended particles (if singlets). During bioaerosol generation, an optical particle counter (OPC) was used to monitor particle levels in real time to enable control of the experiment within the test duct. The output was sent to a RS-232 serial port and was recorded on a computer. The OPC was not used for the efficiency measurements because it cannot distinguish viable from non-viable organisms.
2.4.4 Bioaerosol Sampling Bioaerosol samples were collected by sequential sampling with the one-stage Andersen bioaerosol samplers. Simultaneous triplicate samples were obtained during each upstream or downstream sampling session, and two upstream and two downstream sample sessions were run on any single experimental condition. The bioaerosol sampling lines were 1.4 cm ID stainless

14
steel lines (5/8-in. OD tube) with dimensions chosen to minimize particle losses during sampling. The sample lines upstream and downstream had the same configuration in terms of diameter, horizontal and vertical lengths, and number of bends limit upstream and downstream differences. Full flow quick-connects were used to connect the bioaerosol samplers to the upstream and downstream sample lines. Sampling nozzles of the appropriate entrance diameter were placed on the ends of the sample probes to maintain isokinetic sampling for the test flow rate. The one-stage Andersen samplers (Graseby Andersen, Atlanta, GA) are 400-hole multiple-jet impactors operating at 28.3 L/min (1 cfm.) During sampling, air is impinged on agar in petri dishes positioned beneath the stages. Only culturable, viable microorganisms were measured.
2.4.5 Microbiological Growth and Enumeration The bioaerosol sampler plates were allowed to grow and colony-forming units (CFUs) were enumerated. The growth media used were trypticase soy agar (TSA) for the bacteria and Sabauroud’s dextrose agar (SDA) for the fungi. CFUs were counted shortly after moderate growth became apparent. A “positive-hole” correction is applied to adjust for the probability that more than one viable microorganism is collected through a sampling hole and combined with other microorganisms to produce a single CFU (Macher, 1989). The impactor cut-point (d50) is 0.65 µm for the one-stage Andersen.
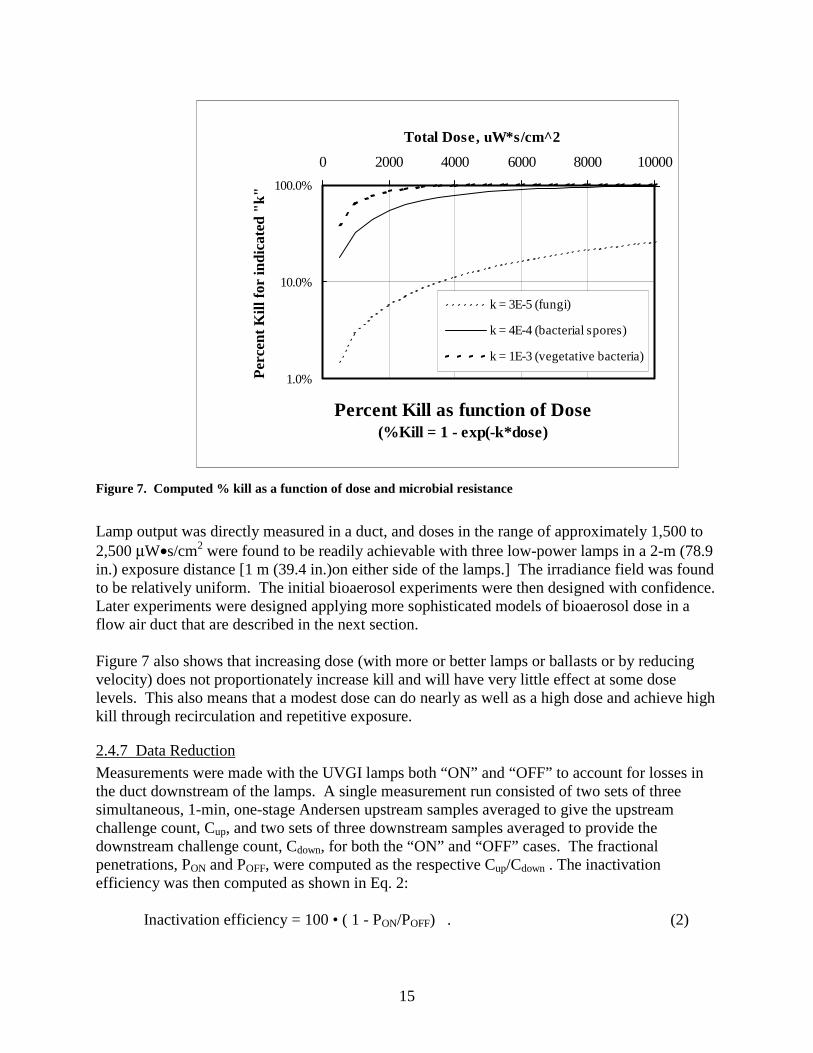
2.4.6 Microbial Kill Estimates for Experimental Planning An individual microbiological kill effectiveness test as described above provides the kill in the form of the ratio Nt/N0 for a given organism, configuration, lamp, and operating condition (flow, temperature, RH.) Eq. 1 can be used to generalize effectiveness measurements for various UV lamps and microorganisms by computing the microbial resistance constant, k, provided all the other terms are known. This requires that the parameters in Eq. 1 be in a measurable range. The radiometer described above had a sufficient dynamic range to measure Eeff from as many lamps as was practical to place within the test duct. The exposure duration, ∆t, was calculable as the bioaerosol path length having meaningful UVGI exposure, divided by the duct velocity. For the microbial kill experiments, it was important to stay within a measurable range of kill. An experimental condition that achieves 100% kill cannot be analyzed because the fraction of UVGI radiation that is “wasted” cannot be evaluated. Similar, zero kill (below the detection limits of the impactors) experiments were not useful. The tests were conducted in an expected kill range of roughly 10–95%, although dilutions and long sampling runs extended the range somewhat. For these reasons, the initial step in setting up the UV lamp systems for these experiments was to estimate the microbial kills for different configurations of UVGI lamps and duct velocities. Eq. 1 was used to estimate the UVGI dose required in a duct to achieve a measurable microbial kill. Figure 7 plots Eq. 1 for a reasonable range of k. Fungi are the most resistant to UVGI, while vegetative bacteria are easily killed. Figure 7 shows that achieving UVGI doses in the 500 to 2,500 µW•s/cm2 range should provide adequate range for the bioaerosol experiments.
15
Percent Kill as function of Dose(%Kill = 1 - exp(-k*dose)
1.0%
10.0%
100.0%
0 2000 4000 6000 8000 10000
Total Dose, uW*s/cm^2
Perc
ent K
ill fo
r in
dica
ted
"k"
k = 3E-5 (fungi)
k = 4E-4 (bacterial spores)
k = 1E-3 (vegetative bacteria)
Figure 7. Computed % kill as a function of dose and microbial resistance
Lamp output was directly measured in a duct, and doses in the range of approximately 1,500 to 2,500 µW•s/cm2 were found to be readily achievable with three low-power lamps in a 2-m (78.9 in.) exposure distance [1 m (39.4 in.)on either side of the lamps.] The irradiance field was found to be relatively uniform. The initial bioaerosol experiments were then designed with confidence. Later experiments were designed applying more sophisticated models of bioaerosol dose in a flow air duct that are described in the next section. Figure 7 also shows that increasing dose (with more or better lamps or ballasts or by reducing velocity) does not proportionately increase kill and will have very little effect at some dose levels. This also means that a modest dose can do nearly as well as a high dose and achieve high kill through recirculation and repetitive exposure.
2.4.7 Data Reduction Measurements were made with the UVGI lamps both “ON” and “OFF” to account for losses in the duct downstream of the lamps. A single measurement run consisted of two sets of three simultaneous, 1-min, one-stage Andersen upstream samples averaged to give the upstream challenge count, Cup, and two sets of three downstream samples averaged to provide the downstream challenge count, Cdown, for both the “ON” and “OFF” cases. The fractional penetrations, PON and POFF, were computed as the respective Cup/Cdown . The inactivation efficiency was then computed as shown in Eq. 2:
Inactivation efficiency = 100 • ( 1 - PON/POFF) . (2)

16
The two replicate runs were compared and averaged to arrive at a final test result for the device, challenge organism, and operating conditions. The dose exposure model was then used to compute the k constant for the organism used in the test.
2.4.8 Bioaerosol QA/QC Multiple quality assurance and control tests were used to maintain high-quality data. The first line of checks were physical system checks to ensure that the test conditions were as specified. All measurement instruments were calibrated and maintained as suggested by the manufacturer. System configuration was checked prior to each test to ensure that the test bench was set up as specified. Temperature, humidity, duct flow rate, and UVGI irradiance were measured prior to and following each test. No standard UV germicidal device exists to allow calibration of the microbiological aerosol efficiency measurement in the test duct. However, the test duct can be “zeroed and spanned” by testing at the 0% and 100% penetration points. In previous filter tests, these tests have been found critical for maintaining high-quality data. The 100% penetration tests were performed to provide a relatively stringent check of the adequacy of the overall duct, sampling, measurement, and aerosol generation system, as well as organism viability. These tests were performed as normal disinfection efficiency tests, except that the UVGI lamps were not turned on. A perfect system would yield a measured penetration of 100% for the test bioaerosol. Deviations from 100% efficiency occur because of particle losses in the duct, losses within the test device, differences in the degree of aerosol uniformity (i.e., mixing) at the upstream and downstream probes, differences in particle transport efficiency in the upstream and downstream sampling lines, and loss of viability of the test organism. Results from the no-light tests (POFF correction factors) were used during data analysis to correct the efficiency measurements obtained during the filter tests. The 100% efficiency test was conducted by installing a HEPA filter in the test duct to ensure that near-zero penetration was measured under the sampling conditions. Measurement of significant penetration generally indicates sampling line leaks or sample handling problems. Additional bioaerosol QC tests ensured the purity of the test organism suspension and the sterility of the media and sterile water. 2.5 In-Duct Irradiance Model and Dose Calculations While the UVGI irradiance and the microbial kill achieved can be measured as described above, an important part of the data analysis is the development of a model that allows generalization of a few measurements to the larger world of air ducts. This section describes the model used in this research. The general approach applied was to begin with a model for irradiance in a duct and compare that model to measurements made with the radiometer. The model was then calibrated such that it predicted the irradiance measured at a few locations. A set of reasonable bioaerosol trajectories in the duct were then proposed, and the dose received by a particle following each trajectory was computed step-wise over a distance of 1 m (39.4 in.) This trajectory dose was used with Eq. 1 to compute bioaerosol survival fractions on that trajectory.

17
The survival fractions were averaged over all of the trajectories to obtain an average survival, from which an average k could be computed.
2.5.1 UVGI Irradiance Field in an Air Duct UV light is electromagnetic radiation, and as such is governed by well known physics. All photocatalytic reactions (smog formation, for instance) and radiant heat transfer follow the same physical laws. The energy passing through a fixed area decreases according to the inverse square law, because the irradiance reduction is inversely proportional to the square of the distance from the source. This assumes a point source and point receptor. Because commercial UVGI lamps are generally cylindrical sources with finite length and diameter, the inverse square law is not easily used to compute the UVGI irradiance field within a duct. An arbitrary location in the duct is irradiated by the whole length of the lamp as well as by reflected light. In practice, the UVGI field falls off roughly as the inverse of distance from the lamps. For most lamps and ducts, this means that the biological inactivation takes place within 0.5 to 1.0 m (20 to 40 in.) of the lamps. Note: Terminology is not uniform within the literature. Phillips (1992) uses “irradiance,” which is defined with units of power per unit area (e.g., µW/cm2), as does Ryer (1998) in his Light Measurement Handbook. Irradiance is a different quantity than “intensity,” which is an angular measure with units of power per steradian (e.g., W/sr) as stated by Ryer (1988). The UV literature, however, sometimes uses “intensity” with the meaning and units of “irradiance.” Confusion will be minimized by carefully observing the units that accompany the numbers. Use of the view factor calculation is an available alternative. Because photocatalytic reactions and radiant heat transfer have both been studied extensively, means to compute the energy passing through a unit area have been developed for numerous geometries, including a cylindrical source and planar receptor. Use of these equations is cited by Phillips (1992) and Kowalski and Bahnfleth (2000). The intensity of the lamp is assumed to be constant over its length, and the irradiance can then be calculated at any location in the duct. The direct UVGI irradiance field at any position can be calculated for cylindrical lamps by using a view factor equation originally developed for radiant heat transfer from cylinders (Modest, 1993). The applicable view factor is that for a “differential planar element to a right-circular cylinder of finite length, l, and radius, r; normal to element that passes through one end of the cylinder and is perpendicular to the cylinder axis.” The length of the normal between the cylinder and the element is h. For an arbitrary differential planar element and a UV lamp, the view factor must be computed for each end of each lamp because the perpendicular passes through one end of the cylinder. The sum of the view factors for the two ends of the lamp gives the total view factor for the lamp. The product of the lamp view factor and the lamp surface intensity gives the total UVGI energy predicted to pass directly through point P.
+−−
+−−+
−= −−−
11tan
)1()1(tan2
1tan1 11
2
1
HH
HYHX
XYHX
HL
LHLVF
π (3)

18
where VF = view factor, either left or right end of lamp, l = lamp segment length, r = lamp radius, h = perpendicular distance from lamp to point, P, in duct, L = l / r, dimensionless lamp length, H = h / r, dimensionless distance, X = (1 + H)2 + L2, and Y = (1 - H)2 + L2. VFentire lamp = VFleft + VFright . Irradiance at P = lamp UVGI surface irradiance ⋅ VFentire lamp ; Irradiance at P = (energy into lamp ⋅ UVGI output efficiency)/lamp surface area . The calculation was repeated for each lamp and the irradiance added to obtain total irradiance at each point. Dose calculations have been reported using an assumption of total mixing with irradiance computed at a fixed distance to use of the view factor equation to compute irradiance at multiple points along an assumed or computed particle trajectory. The view factor calculation does not account for reflected light. As stated above, the literature (in most cases) accounts for reflectance from ducts by multiplying the direct irradiance by a factor that depends on the duct wall material. Kowalski and Bahnfleth (2000) mention use of a ray-tracing method that allows direct calculation of the UVGI energy reflected from a surface. Ray tracing appears to have some potential advantages as a more exact calculational tool, but the discussion is limited and its overall usefulness relative to more conventional techniques is not clear. Precision in the UVGI calculations may not limit the design of UVGI systems. Practically, UVGI lamp output is known to be affected by a number of factors, as discussed below. The data appear to have trends, but the published literature is incomplete. Because this project deals with the practical issue of how to ensure that germicidal UVGI installations work with high reliability, measurements are needed. These measurements can then be correlated with the microbiological effects.
2.5.2 Particle Movement in Air Ducts
2.5.2.1 Duct airflow pattern The mean velocity of the ventilation air in the vicinity of UVGI devices is commonly in the range of 7.1 to 14.2 m/min (250 to 500 ft/min.) In a ventilation air duct that has dimensions of feet, this velocity results in turbulent flow with a Reynolds number of 20,000 to 50,000. Depending on the upstream duct design, fittings, and obstructions, this flow may be fairly evenly distributed in the duct, or significant flow variation may be present. For UVGI, a fairly uniform velocity distribution across the duct is desirable because it generally provides uniform particle loading, and irradiating all of the microorganism particles is the goal. As in many other ventilation applications, an asymmetric flow profile could lead to surprises in UV disinfection.

19
Normal duct flow characterization using Pitot tube traverses or averaging flow measurement devices is sufficient. While a turbulent flow condition suggests that considerable mixing is taking place, this may not be so. The turbulence found in air ducts at moderate Reynolds numbers is composed of moderate-sized eddies that may travel several meters down a duct without a great deal of mixing. For example, the author has observed, in a low-speed wind tunnel, neutral density bubbles moving about within, but staying in, the 15.2-cm (6-in.) square eddy created by an egg-crate flow straightener over a distance of approximately 8 m (25 ft.) The eddies are not stable, and form, die, and re-form constantly, which causes some mixing. However, the actual flow path of an arbitrary “particle” of fluid is a random path around a relatively straight average line of flight, and mixing is limited over a the effective range of UVGI lamps. Flow smoothing devices such turning vanes tend to further reduce mixing. While the flow is indeed turbulent, to assume that all particles of the fluid are mixed in a short distance is a mistake. A fluid particle in the corner as the flow enters the UV-irradiated portion of the duct is likely to stay there as it moves through. For critical applications, the Eeff·∆t product (or dose) must be adequate to kill (or achieve the target level of reduction) in the furthest corner of the duct. This is consistent with the advice offered by Phillips (1992): “The critical factor is to reach the (dose) threshold at the wall. There the irradiation level is at minimum ....”
2.5.2.2 Particle dynamics in airflow Environmental microbiological particles, while having various shapes and surface characteristics, follow the same flow dynamics that other airborne particles follow. They are generally in the range of 1 to 4 µm in aerodynamic diameter. Aerosol particles of this size in a flow field at duct velocities [127 cm/s (250 ft/min)] generally follow the main fluid flow path, deviating as the vector sum of their momentum and drag force require. The settling velocity of such particles is on the order of 0.003 to 0.05 cm/s, and the particle velocity is dominated by the duct airflow. Most will follow the flow closely. (Other forces on particles are less important in the open duct.) Particle momentum leads to particles’ modest deviation from the turbulent eddy movement. Particles near the boundaries of an eddy, however, may deviate sufficiently to enter the next eddy. This results in particle mixing as well as air mixing, as does the death and formation of eddies. As mentioned in the previous section, however, the mixing is not a great as might be assumed. Particles are not always evenly distributed across a duct. Micrometer-sized particles are known to stratify in the elbows of ducts, and the bottoms of ducts collect most of the dust deposit. Common particle sampling guidelines suggest that 10 duct diameters are required to recover a mixed velocity and particle distribution condition downstream of a flow obstacle. Kowalski and Bahnfleth (2000) assert that “sufficient mixing will occur at these velocities to temper the effects of a non-uniform velocity profile” and make other statements endorsing the assumption of complete mixing within the UV irradiated zone. Their exact meaning is not clear, but the authors are probably justifying the use of an average velocity rather than implying that an air duct is a “completely mixed reactor.”

20
From a UV system design viewpoint, unless the particles are so concentrated that they appreciably attenuate the UV radiation, particle position in the duct does not matter so long as the entire duct is irradiated to the threshold dose. (Position would be an issue under dusty conditions; under such conditions, the UV lamps would become soiled and the installation would be limited by soiling, not by its design.) Thus no assumption of particle position is required—provided the duct is fully irradiated with a dose adequate to achieve the desired performance. On the other hand, particle position would be very important if a UV light or UV device was installed such that it was not symmetric in the duct. Under such conditions, particle stratification could lead to significant differences in performance because some microorganisms would receive a larger dose than others by virtue of their transit path.
2.5.3 In-Duct UV Dosage Model The model was implemented in a spreadsheet. It was based on the following: 1. Estimation of lamp surface output from the irradiance measured at a few points near the
duct centerline, and use of that output in the view factor equation. 2. Use of the view factor equation to compute the UV irradiance at 100 points along each of
9 straight-line particle trajectories. These 9 trajectories were the centerline of the squares in 1 quadrant, much as was shown in Figure 6. The product of the time step duration and the irradiance at each point, added up over the full length of the trajectory, gave the calculated dose for that trajectory. This amounts to an assumption of complete mixing within the cell for each time step, but not from time step to time step. A 0.01-s time step was used, which gave about 80 irradiance calculations along each trajectory in a 1-m travel distance for each of the 9 cells. By symmetry, the irradiance in each quadrant is identical, so the 9 cells represented the entire duct. For the dimensions of the test duct, each trajectory was the centerline of a 10- by 10- by 100-cm (4- by 4- by 39.4-in.) cell.
3. The assumption is made that the microbial particles are uniformly distributed among these 36 trajectories.
4. Calculation of the accumulated dose for microbial particles passing through each of the 100 UV calculation points as they travel along the 36 trajectories.
5. Calculation of expected kill from literature values of microbial resistance to UV. The results from the model were then compared to the measured microbial kill within the test rig. The model is currently as sophisticated as is appropriate for a spreadsheet model. It seems to be working well, in that the estimated lamp efficiency values and the estimated microbial kill values agree reasonably well (~20%) with literature values.
21
3.0 KEY FACTORS 3.1 Physical Factors Results and Discussion
3.1.1 Effect of Duct Air Conditions on UVGI Lamp Output
3.1.1.1 Duct air temperature and velocity Phillips Lighting (1992) states that the resonance line at 254 nm in a low-pressure mercury lamp is strongest at a particular vapor pressure that occurs in their proprietary UVGI lamps at a still air ambient temperature of about 68 °F (20 °C). For their lamps, this gives a lamp wall temperature of about 104 °F (40 °C), and the UVGI output is greatest at that temperature. At both higher and lower temperatures, the UVGI output is reduced, with the output at 50 °F (10 °C) being about 88% of that at 68 °F (20 °C). In their product literature, Westinghouse (1985) concurs. They note that the output of their UVGI lamps, like all other gaseous discharge lamps, diminishes as the temperature increases or decreases from the design temperature, which for the Westinghouse lamps is stated to be 80 °F (27 °C) in still air. They note that the output of one lamp at 40 °F (5 °C) is only two-thirds of its output at 80 °F (27 °C.) Westinghouse (1985) also notes that low temperatures can reduce the operating life of the lamps and that another of their proprietary lamps responds differently. Another lamp, when operated at its highest current input, is said to be much less sensitive to ambient temperature changes. Phillips Lighting (1992) makes a similar argument, saying that their medium-pressure mercury lamp, relative to the low-pressure lamp, has a higher power density and higher wall temperature and is less sensitive to ambient temperature fluctuations. High lamp output at the lower temperatures encountered in ducts is a central argument for the “high output UVGI emitter” presented by Scheir and Fencl (1998). Westinghouse (1985) further notes that low operating temperatures reduce the operating life of their lamps. The effect of airflow on UVGI lamp output is increased heat transfer that is due to the moving air. If the air moving past the lamp is ambient or cool, the lamp may be cooled below its optimum operating point, which reduces output. If the air is warm, the lamp may be heated above its optimum, which also reduces output. Lamps in the return air of building ventilation systems are likely to be slightly cooled below their optimum temperature, while lamps downstream of a cooling coil could be considerably cooled due to a combination of airflow and low temperature. Lamps designed for operation at low temperatures should also be resistant to airflow effects. The results obtained during this research for irradiance as a function of air temperature and velocity are shown in Figures 8 and 9 for “low” and “high” output lamps, respectively. Both figures show duct center irradiance at 50 cm (19.7 in.) as a function of duct velocity for each of three duct air temperatures. The overall shape of the curves appears to be the same in all cases. At a fixed temperature, the irradiance produced by both kinds of lamps was found to increase from a minimum at no flow (and consequent high lamp temperature) to a maximum at a

22
particular flow rate (the optimum lamp operating temperature), and then to decrease as the flow rate increased further and the lamp was cooled more than was optimum. Airflow has its strongest impact at the lowest temperatures, where the available temperature difference (between the air and the lamp wall) to drive heat transfer is greatest. The apparent reduction in the effect of flow rate at high flow rates [decreasing negative slope of the lines above 2 m/s (400 ft/min)] presumably occurs because the temperature difference between the lamp wall and the air is being reduced and the heat transfer is consequently being reduced.
0.0000
0.0005
0.0010
0.0015
0.0020
0.0025
0.0030
0 1 2 3 4
Velocity in Duct, m/s
Irra
dian
ce, W
/cm
2
14 - 17 C 21 C 30 C
Figure 8. Effect of air velocity and temperature on “low” power lamp irradiance at 1 m
0.0000
0.0005
0.0010
0.0015
0.0020
0.0025
0.0030
0 1 2 3 4
Velocity in Duct, m/s
Irra
dian
ce, W
/cm
2
14 - 17 C 21C 30C
Figure 9. Effect of air velocity and temperature on 1-m irradiance for “high” output lamps.
This behavior is consistent with literature reports and discussions with manufacturers, and the shapes of the curves are similar to those presented by Phillips (1992). UVGI lamp output

23
reaches a maximum output at an operating temperature that is determined by lamp mercury content, fill gases, electrical energy throughput, and other electrical considerations. For any given lamp/ballast combination, the lamp operating temperature is most affected by flow rate and temperature.
3.1.1.2 Relative humidity The literature regarding the effects of humidity on UVGI does not present a completely consistent picture. Water molecules are known to adsorb UV light, so increased humidity should reduce the transmittance of UVGI. The effect should be proportional to absolute humidity (mass of water per volume of dry air), rather than to relative humidity. Within the normal ranges of temperature and humidity in ventilation systems, the effect would be expected to be modest because water makes up only a small fraction of the total gas, and that fraction changes little. As noted by Kowalski and Bahnfleth (2000), “studies on this matter are contradictory and incomplete.” Scheir and Fencl (1998) state that “humidity is an attenuator to UVGI energy.” Phillips Lighting (1985) provides a graphical correction factor to increase the number of lamps that are required when the relative humidity exceeds 60%. On the other hand, Phillips Lighting (1992) does not include this correction factor. The effect of humidity may be different for surface disinfection than for bioaerosol treatment. Relative humidity above approximately 60% has been shown to affect the surface properties of powders (Zimon, 1970); this effect is perhaps due to surface condensation in the interstitial spaces, which might lead to sufficient water to attenuate the UVGI. An effect on direct transmittance seems unlikely. To investigate the effect of air humidity on irradiance, the radiometer UV detector was positioned at a convenient location 1.36 m (4.46 ft) from the lamp centerline, at the center of the duct. The longer path length from lamp to detector (relative to that used in the study of the effects of flow rate) was deliberate. The same detector and filter arrangement was used. The test rig was operated at 0.472 m/s (1,000 cfm) and 24°C (74˚F), and the relative humidity varied from 35 to 85% RH in three levels in a random order. The results of this investigation are shown in Figure 10. The effect of humidity is modest but detectable. Over this short path length, UVGI irradiance decreases linearly with absolute (not relative) humidity, as would be expected for the direct interaction of water molecules and the UV photons. References in the UVGI literature stating that the effect of humidity are unclear may be the result of liquid droplet carryover in some field installations, which would result in much greater attenuation of the UVGI. However, for droplet-free air, the effect of humidity appears straightforward, predictable, and modest.

24
2.74E-04
2.76E-04
2.78E-04
2.80E-04
2.82E-04
2.84E-04
2.86E-04
0.00 0.01 0.02Absolute Humidity, g H2O/ g dry air
Irra
dian
ce, W
/cm
2Data 03-20-01 Irr=.000285-.00034*HumidLower 95% CI Upper 95% CI
Figure 10. Measured effect of absolute humidity on irradiance
3.1.2 Lamp and Ballast Design Effects Lamp design effects have to do with the details of the mercury vapor discharge lamp. Lamp pressure (Phillips, 1992), electrical current (Westinghouse, 1985), voltage, excitation wave form, discharge ignition, and internal gas composition (Scheir and Fencl, 1998) are all mentioned as parameters that can be adjusted to affect lamp output energy and spectrum. Ballasts supply the electrical power to the UV lamps, and ballasts must be chosen to match the requirements of the lamps. Conventional ballasts are transformers, with the advantages of low cost and the disadvantages of low efficiency and weight. Solid-state ballasts are much more efficient and lighter in weight, although they are more expensive. The effect of lamp and ballast can be seen clearly by comparing Figures 8 and 9, which clearly show the higher output for the lamps used in Figure 9. Lamp type and ballast type matters. However, because no standard rating test is applied to the lamp/ballast systems, it is difficult for a purchaser to make informed decisions. There are differences beyond the measured irradiance. Both systems were powered by 110–120 V alternating current (AC). The “low” output lamps, driven by conventional magnetic ballasts, drew an average of 1.69 A (range from 1.65 to 1.76 A) at 120 V AC and with no flow in test duct. The “high” output lamp, driven by solid-state ballasts, drew 0.39 A at the same no-flow condition, and 0.53 A at 1.27 m/s (250 ft/min) and 21°C (69 °F.) The “high” output lamps were also claimed to have a higher power factor than conventional lamps. From Figure 8, we see that the maximum output for the “low” output lamps occurred at less than 0.508 m/s (100 ft/min) at 15°C (58 °F), at 0.635 m/s (125 ft/min) at 21°C (70°F), and at about 1.14 m/s (225 ft/min) at 30°C (85 °F.) The lamps tested are generally specified for use at about 1.27 m/s (250 ft/min) [0.472 m3/s (1,000 cfm) in the duct], so they are normally used at about

25
their maximum output point if the air is at 30°C (85 °F), but would be below their peak output at 15°C (58 °F.) The high-output lamps whose irradiance is presented in Figure 9 were characterized by the manufacturer as lamps designed to operate at lower temperatures than conventional lamps; they appear to have an operating characteristic consistent with that design. At 15°C (58 °F), the maximum output of about 2.50 x 10⁻³ W/m2 was reached at about 0.76 m/s (150 ft/min), while the maximum at 21°C (70 °F) was reached at 1.27 m/s (250 ft/min) and the maximum irradiance at 30°C (85 °F) was reached at about 2.03 m/s (400 ft/min.) One of the factors about this lamp design that enables it to operate at lower temperatures may be the higher power load being put into a lamp, relative to the physical size. The “high” power lamps are thought to be low-pressure lamps operated at higher power loads than the “low” output lamps. Phillips (1992) notes that medium-pressure lamps, operated at appropriate electrical throughput, have a higher wall temperature and are more resistant to cool temperatures than are low-pressure lamps.
3.1.3 Effects of Lamp Soiling As with all lamps, germicidal UV lamps that become soiled suffer a reduction in the delivered irradiance. Phillips (1992) comments that the lamps “must be cleaned at a frequency depending on the degree of grime” in the air to which they are exposed, and the literature concurs. The installation of lamps downstream of filters is generally recommended. Phillips Lighting (1985) states that cleaning polishes may adsorb UVGI and recommends that they not be used to clean and polish reflectors. Westinghouse (1985) recommends using alcohol or ammonia and water and a clean, lint-free cloth for cleaning; leaving a residue should be avoided.
3.1.4 Reflectance The importance of duct surface reflectance is that the effective irradiance delivered to the microorganisms is increased through reflected UV energy. Reflectance specific to UVGI is not the same as that to visible light. Phillips (1985) and others provide reflectance values for a number of clean materials. Phillips Lighting (1992), in their design procedure for an axial lamp mount in a circular duct, takes explicit credit for a reflective duct. They reduce the length of duct necessary to treat air by (1-R), where R is the reflectance of the duct. Phillips (1985) also allows credit for reflectance in their design procedure, though using a different and apparently more conservative design correction. Westinghouse (1982) notes that reflective materials should be used, but does not appear to take explicit credit for reflectance in their design procedure. Given the high likelihood of eventual soiling in a ventilation system, caution is advised with regard to taking credit for reflectance. Table 1 repeats some duct reflectance values from the literature.

26
Table 1. Reflectance of Various Materials
Material Reflectance Aluminum, untreated surface 40–60% Aluminum, sputtered on glass 75–85% Stainless steel plate 25–30% Chromium plating 39% Aluminum paint 40–75% Various white oil paints 3–10% White baked enamel 5–10% Magnesium oxide 75–88% White plastering 40–60% White note paper 25% Typical duct liner 1%
Note: Reflectance values for a typical duct liner are taken from Schier and Fencl, 1996; values for all other listed materials are taken from Phillips, 1985.
The values in Table 1 show that reflectance for UVGI is not the same as for visible light. Aluminum is frequently mentioned as providing a desirable reflector surface. A reflectance value for a galvanized steel duct was not found in the literature, but experience with UVGI lamps in galvanized ducts indicates that galvanized steel has some reflectance for UVGI. The intent of the reflectance measurements made during this research was to evaluate the impact of reflectance on centerline irradiance measurements and the relative contribution of direct UVGI and reflected UVGI on those measurements. The materials used were new galvanized sheet metal and black photographic flock paper, and the basic measurement was irradiance as a function of position in a mocked-up duct. Duct reflectance was investigated in the duct mock-up apparatus by measuring the irradiance from low-power lamps with the duct lined with two materials—new galvanized steel and photographic background black flock paper. Three low-power lamps were mounted horizontally across the duct: one at the center, and one each 20.3 cm (8 in.) above and 20.3 cm (8 in.) below the center. Each lamp was driven by a magnetic ballast and was allowed to reach an equilibrium output before measurements were started. All measurements were made at the same static airflow conditions, and therefore the results can be compared within this data set. Figure 6, above, shows the layout of the measurement points. The same set of measurements was made for both duct lining materials. Figure 11 shows the results of this measurement for the galvanized steel-lined duct, and Figure 12 shows the results for the black flock paper-lined duct. In both cases, the measurement points were laid out as shown in Figure 6, with points 1, 2, and 3 being the row nearest the center, with point 1 to the outside of the duct and point 3 nearest the center. The “sawtooth” shape of the curves, most visible nearest the lamps, results from the point near the outside of the duct receiving less irradiance than the points near the center. In both figures, the “sawtooth” shape is more prominent near the lamps, because measurements near the lamps are dominated by irradiance directly from the lamps, while farther away, more reflected light reaches the detector.

27
0.00E+00
4.00E-04
8.00E-04
1.20E-03
1.60E-03
2.00E-03
1 2 3 4 5 6 7 8 9
Measurement Point
Irrad
ianc
e, W
/cm
2
30 cm 50 cm 75 cm 100 cm
Figure 11. Irradiance distribution in galvanized duct.
0.00E+00
4.00E-04
8.00E-04
1.20E-03
1.60E-03
2.00E-03
1 2 3 4 5 6 7 8 9
Measurement Point
Irrad
ianc
e, W
/cm
2
30 cm 50 cm 75 cm 100 cm
Figure 12. Irradiance distribution for black flock paper-lined duct.
The “sawtooth” is more prominent for the black flock paper-lined duct because essentially all irradiance comes directly from the lamps. Figure 13 shows the ratio of total irradiance in the galvanized duct to total irradiance in the black flock paper-lined duct for all measurement points. It shows that reflected light contributes an increased fraction of the total irradiance as distance from the lamp increases. Simultaneously, because of the increase in distance, the total irradiance decreases. The straight line drawn in Figure 13 is a fit to all the data. The fractional increase due to reflectance is substantial, with the total irradiance increased by a factor of roughly 1.5 at 30 cm (11.8 in.) and by a factor of 3 at 100 cm (39.4 in.) Over the distance studied, the overall effect is near linear with distance from the lamps.

28
0.000
0.500
1.000
1.500
2.000
2.500
3.000
3.500
0 10 20 30 40 50 60 70 80 90 100
Distance from lamps, cm
Rat
io o
f gal
vani
zed-
lined
duc
t to
flock
ed p
aper
-line
d du
ct ir
radi
ance
, %
Figure 13. Ratio of galvanized to black flock irradiance.
These results apply to lamps mounted across the duct in a crossflow configuration with a clean galvanized duct. Reflectance effects should be different with the lamps mounted parallel to the flow.
3.1.5 Enclosure and Location Factors
Objects that are physically in the path of the UV radiation provide shadows and protected regions in which microorganisms will not be effectively irradiated. Blockage near the UV lamps is especially important because the high-irradiance regions require the shortest exposure duration. Other location factors primarily relate to the temperature and airflow dependencies discussed above.
3.1.5.1 Irradiance effects Irradiance at a fixed distance from the UVGI lamps was routinely measured for most operating conditions. Access was not available to make a measurement with the lamps oriented parallel to the flow, but irradiance was measured for the crossflow configurations. The position of the detector relative to the lamps depended on accessibility. Direct comparison is available for the crossflow case with and without the coil with the detector at 50 cm (1.64 ft) upstream from the lamps. Measurements were made for three “high” output lamps with the coil not installed in the duct (the standard configuration), with the lamps between the coil and the detector (coil downstream of the detector), and with the coil moved upstream to be between the lamps and the detector. The air temperature was 22°C (71°F) and the relative humidity 55–59%. Results are given in Table 2.

29
Table 2. Irradiance Measurements with Coil in Duct
Condition Measured irradiance, W/cm2 No coil installed – open duct 0.00252 Coil downstream 0.00260 Coil between lamp and detector (1) 0.00000198 Coil between lamp and detector (2) 0.00000642 Coil between lamp and detector (3) 0.00000161
The first two data rows of Table 2 show that the aluminum coil did not reflect a significant amount of UVGI energy back to the detector; the irradiance measurement with and without the coil is essentially the same. Relative to the top two rows, the three bottom rows show that less than 1% of the UVGI that would be expected to reach the detector penetrates the coil. The cases with the coil blocking the UV are minor variations of the same measurement. For (1), the detector was located exactly at the duct centerline. For (2), the detector was slightly [1.9 cm (0.75 in.) to change the ‘view’ before making the measurement. For (3), UVGI leakage around the coil was essentially stopped by sealing the visible light leaks around the coil. Comparison of (1) and (2) shows that the irradiance measurement is sensitive to detector position with the coil installed, though most UVGI is stopped in both cases. Light reflecting around the outside edges of the coil is shown to be a substantial fraction of the total UVGI measured by (3).
3.1.5.2 Results for microbial kill in various configurations Table 3 compares disinfection efficiency for the four lamp/duct configurations with the same number of lamps in each. Using two different microbial challenge aerosols (Bacillis subtilis and Aspergillis versicolor), penetration was evaluated with and without the lamp bank turned on. Staphylococcus epidermidis was not used as a challenge because three lamps were expected to produce too high a dose to provide useful data. The data were analyzed by comparing results for each alternative arrangement to the crossflow lamp arrangement results; this analysis was required because the alternative configurations were not compatible with the previously developed model that had been used to estimate dose. Comparison using the model to compute k values was not possible because the model was developed for the case of a straight, open duct and was of uncertain usefulness for the other cases. Table 3. Effect of Duct Configuration on Microbial Kill
Lamp Configuration
Number of Lamps
Bacillis subtilis % Kill
Aspergillis versicolor % Kill
6 99 56 Straight duct, crossflow lamps 3 76 20
6 67 40 Straight duct, parallel lamps 3 30 17
6 92 43 Straight duct, coil 3 55 23
6 91 62 Elbow duct 3 55 30

30
3.2 Chemical Byproducts Results and Discussion
3.2.1 Ozone The results of the ozone production measurements for six high-output lamps mounted in crossflow at 0.76 m/s (150 ft/min) were nil. The ozone concentration downstream of the lamps was not different from that upstream. In both cases, the readings were about 28 ppb. Therefore, under flow conditions, ozone production was not detectable.
3.2.2 Effect of UV lights on VOCs The experiment used was described in Section 2.3.2. As with the ozone production experiment, the test was conducted at a normal operating flow rate, not in still air. The results show that no significant change in the concentration of the injected chemicals was detected, and no chemical byproducts were clearly detected. Figure 14 includes the results from two upstream and two downstream tests with the UV lights on; it visibly shows that the upstream and downstream tests were not different. Table 4 shows the chemicals identified in byproduct sampling.
0.1
1
10
100
1000
0 5 10 15 20 25 30 35 40
Compound
ug/m
^3
Up1 Dwn1 Up2 Dwn2
Figure 14. Results of chemical sampling up- and downstream of lamps

31
Table 4. Chemicals Identified in Byproduct Sampling
ID Chemical Name CAS No ID Chemical Name CAS No 1 1-Hexanol, 2-ethyl 104-76-7 21 Nonyl aldehyde (Nonanal) 124-19-6 2 1-Pentene, 4-methyl 691-37-2 22 Octanal* 124-13-0 3 1- Propanol, 2-methyl (Isobuty
alcohol) 78-83-1 23 Pentane, 2-methyl 107-83-5
4 2-Butanone (Methyl ethyl ketone, MEK)
78-93-3 24 Pentane, 3-methyl 96-14-0
5 2-Propenal, 2-methyl* 78-85-3 25 (2,6,6-Trimethyl-bicyclo[3.1.1] hept-2-ene
80-56-8
6 Acetic acid 64-19-7 26 Propanal, 2-methyl (Isobutanal)* 78-84-2 7 Benzaldehyde 100-52-7 27 Toluene (Methylbenzene) 108-88-3 8 Benzene 71-43-2 28 Tridecane 629-50-5 9 Benzene, 1,2,4-trimethyl 95-63-6 29 Xylene (para and/or meta) 106-42-3
10 Benzene, ethyl 100-41-4 30 Xylene, ortho 95-47-6 11 Benzoic Acid* 65-85-0 31 2-Propanol (Isopropanol) 67-63-0 12 Cyclopentane, methyl 96-37-7 32 3-Buten-2-one* 78-94-4 13 Decanal 112-31-2 33 1-ethyl-4-methyl (4-Ethyltoluene) 622-96-8 14 Decane 124-18-5 34 Heptanal (Heptaldehyde) 111-71-7 15 Dodecane 112-40-3 35 Heptane, 2,4-dimethyl 2213-23-2 16 Ethanol 64-17-5 36 Pentane, 2,2,3,4-tetramethyl* 1186-53-4 17 Ethanone, 1-phenyl (9CI) 98-86-2 37 3-Buten-2-one, 3-methyl* 814-78-8 18 Hexane* 110-54-3 38 Acetone 67-64-1 19 1-Methyl-4-
(1methylethyl)cyclohexene) 138-86-3 39 Butane, 2-methyl (Isopentane) 78-78-4
20 Methylene chloride (Dichloromethane)
75-09-2

32
3.3 Microbiological Factors Results and Discussion Dosage is defined as the UVGI irradiance received by the microorganism times the duration of exposure. This is the Eeff·• t product of Eq. 1. Eeff is a function of duct position. The most common unit for dosage is µW•s/cm2, but W•s/cm2 and J/cm2 are also used. Given the theoretical ability to compute particle trajectories, the irradiance received by each microorganism particle of each size at any given time appears simple, at least in concept, to predict the disinfection performance of a UVGI installation. To compute the dose, Eeff • t can be integrated over the particle path, and the fraction of microorganisms killed can then be estimated. But numerous microbiological considerations must be taken into account. Although there are multiple tables available that list a series of organisms and the respective dosages or energies required to kill them, a careful review of the literature shows that these tables may unintentionally oversimplify the required dosages. Many of the data in these tables come from the Westinghouse data, which are based on a series of experiments done primarily in the 1940’s. Many of these are truly elegant experiments; however, their goal was a fundamental understanding of UV and not an evaluation of UVGI lamps. More recent summaries of UVGI kill (Kowalski and Bahnfleth, 2000) have perpetuated the problem. There were few common conditions under which the experiments were performed (i.e., some organisms were irradiated while airborne, others when seeded on agar plates or suspended in buffer). These differences may explain a great many of the seemingly inconsistent kill dosages reported for the same organism.
3.3.1 Test Organism Selection Preliminary microbiological tests were conducted with seven organisms: Serratia marcescens, Staphylococcus epidermidis, Pseudomonas fluorescens, Bacillus subtilis, Aspergillis versicolor, Penicillium chrysogenum, and Cladosporium sphaerospermum. The first four are bacteria, and the last three fungi. These organisms cover a broad range of susceptibility to UV. S. marcescens, S. epidermidis, and P. fluorescens are vegetative bacteria that are readily killed. B. subtilis is a spore-forming bacteria, and the three fungi (A. versicolor, P. chrysogenum, and C. sphaerospermum) also form spores. We expected these organisms to be difficult to kill. Most of the tests were conducted at approximately 24 C (75°F), 50% RH, with the test rig at either 0.472 or 0.694 m3/s (1,000 or 1,470 cfm) for an approach velocity of 1.27 or 1.87 m/s (250 or 368 ft/min.) All of the tests utilized one or more “standard” UV lamps [nominal 1.6-cm (5/8-in.) diameter, single-ended, 61-cm (24-in.) length] powered by a large and heavy preheat, self-start ballast and mounted perpendicular to the airflow. Depending on the experiment, the lamps were configured in one of four different ways. The goal was to irradiate all the organisms and remain in an experimental range with reliably measurable kill. For the three fungi and the B. subtilis, we used either six lamps in a single column on 10.2-cm( 4-in.) spacing or three lamps in a single column on 20.3-cm (8-in.) spacing for high and low irradiance levels, respectively. For the three vegetative bacteria, we used either one lamp at the duct center or one lamp covered by three layers of common building screen. In each case, the irradiance was measured at a known distance from the lamp (on the lamp centerline), and that irradiance value was used to calibrate the model. The model was then used to compute the mean

33
dose for all the trajectories, and the k factor was computed from this mean dose and measured microbial kill. A given lamp configuration produces a higher dose at 0.472 m3/s (1,000 cfm) than at 0.694 m3/s (1,470 cfm), as is reflected in Table 5. This large duct experiment is not a preferred way to determine k factors because the distribution of dose is fairly broad across the different trajectories. Computing k values allowed us to compare our full-scale work to the published literature; the agreement is fairly good in most cases. As can be seen in Table 5, with this range of irradiance, all organisms can be brought into the measurable range. Each result is for an individual test or run and they are generally in good agreement. Use of the screened lamp was not fully satisfactory, but it dramatically demonstrated the susceptibility of some organisms and the need for the microbiologically informed testing that was conducted in this project. Table 5. Results of Preliminary Microbial Kill Experiments
Organism Number of Lamps
Dose µW-sec/cm2 % Kill k Factor
1 lamp 1341 99 3.31E-03 1 lamp, 3 screens 369 97 9.16E-03 Serratia marcesens 1 lamp, 3 screens 369 98 9.99E-03 1 lamp 984 81 1.68E-03 1 lamp 984 83 1.77E-03 1 lamp, 3 screens 329 22 7.71E-04 Staphylococcus epidermidis
1 lamp, 3 screens 329 9 2.99E-04 1 lamp 1,341 98 2.90E-03 Pseudomonas fluorescens 1 lamp, 3 screens 369 99.7 1.58E-02 6 lamps 7,509 80 2.17E-04 6 lamps 7,509 90 3.06E-04 3 lamp 3,197 48 2.07E-04 Bacillus subtilis
3 lamp 3,197 53 2.34E-04 6 lamps 7,509 83 2.35E-04 6 lamps 7,509 66 1.45E-04 3 lamps 3,197 5 1.51E-05 Aspergillus versicolor
3 lamps 3,197 16 5.49E-05 6 lamps 7,509 10 1.40E-05 6 lamps 7,509 17 2.46E-05 3 lamps 3,197 0.00 — Penicillum chrysogenum
3 lamps 3,197 1 4.57E-06 6 lamps 7,509 16 2.39E-05 Cladosporium
sphaerospermum 3 lamps 3,197 3 8.24E-06 Note: “3 screens” indicates that the single lamp was wrapped with three layers of household screen to reduce irradiance. The experimental conditions achieved were adequate to conduct useful tests with all of the microbial organisms. That is, the results fell within a useful experimental range and provided the

34
needed information. The vegetative bacteria (S. marcescens, S. epidermidis, and P. fluorescens) were readily killed. The spore-forming bacteria (B. subtilis) was, as expected, much more resistant. The three fungi whose spores were irradiated (A. versicolor, P. chrysogenum and C. sphaerospermum) were also relatively resistant, although significant kill was achieved by arranging sufficient UVGI irradiance. The results of the experiments are in general agreement with previously published microbial kill data and design information. Therefore, we selected the vegetative bacteria S. epidermidis, the spore-forming bacteria B. subtilis, and the fungus A. versicolor for the final testing of the lights.
3.3.2 Growth of Organisms in the Dark All of the plates collected during the testing were incubated in the dark. UV light kills cells by damaging their deoxyribonucleic acid (DNA). The exact mechanism differs between vegetative cells and spores. Exposure to UV causes the formation of thymine dimers by phototransformation in vegetative cells and by spore photoproduct in spores. This results in a distortion of the DNA strand; replication is then halted. Because cells are commonly exposed to UV, they have developed a number of repair mechanisms to counteract the UV-induced damage. Although the phenomenon of UV repair was reported in the late 1940’s and 1950’s (Kelner, 1949; Dulbecco, 1955), little was understood about the cellular repair mechanisms for UV damage until the 1960’s. Fungal spores, bacteria, and plant, animal, and viral DNA may all be repaired through photoreactivation with near-UV or visible light. Photoreactivation is only one of the repair mechanisms available to cells to repair damaged DNA. In addition to light repair, excision repair, also known as dark repair, and the so called SOS repair mechanism are important. Spores have an additional mechanism of spore photoproduct repair (Setlow, 1992). The enzyme spore photoproduct lyase is activated during germination to repair damage that occurred to the dormant spore (Sun et al., 1994). Excise repair is exactly what it sounds like: the cell cuts out the segment of DNA with the thymine dimer and synthesizes the new strand to replace it. The SOS mechanism is particularly interesting because it results in the misincorporation of DNA bases, which leads to an increased mutation rate for the cell. This mechanism is responsible for the high mutation rate seen in cells irradiated with UV. Scientists have used UV to induce mutations in cells for many years. Mutated cells are by no means dead; while some mutations are lethal, most are not. It is thought that one explanation for the evolutionary development of the SOS mechanism is that at a cellular level, mutation is preferable to death. In human cells, this may assist in the development of skin cancers. However, in microorganisms, some of these mutations may be beneficial or neutral to the cell. The dosages required to kill an organism are affected by these repair mechanisms, and the dominant mechanism for a cell can profoundly affect an organism’s response to UVGI. An additional repair mechanism exists for viruses. The infected cell may repair the damaged viral DNA for the virus if the infected cell contains the repair enzymes.
3.3.3 Recovery of Damaged Test Organisms The selection of the appropriate recovery media was another factor that needed to be addressed. Few of the early experiments that are frequently cited for determining the kill dosages of a specific organism address the fact that damaged organisms will not grow well on standard media

35
after irradiation or any other antimicrobial treatment. The standard bacteriological and mycological media are generally considered too nutrient rich to effectively recover the damaged organism. Recovery of environmentally stressed organisms using minimal nutrient media can be more accurate. Damaged organisms are notoriously difficult to isolate on standard nutrient media. Therefore, the selection of the recovery media was thought to be an important factor in this study. We used media typically used to recover damaged organisms and compared the results with the more standard media. No differences were found for recovery, so trypticase soy agar was used for the bacteria and Sabauroud’s dextrose agar was used for the fungi.
3.3.4 The Influence of Aerosol Composition on Bioaerosol Tests Most of the UV inactivation studies done with airborne microorganisms (bioaerosols) have used pure cultures of one particular organism that were suspended in a liquid diluent and then nebulized. The overall composition of the aerosol, including the bioaerosol, is important. Bacteria suspended in phosphate buffer were more susceptible to UV inactivation than those suspended in broth (Sharp, 1940). Presumably, the more complex organic constituents of broth provide a physical protection or shield from the UV rays. Also, bacteria in broth are less stressed and may be naturally more resistant. On the other hand, Beebe (1958) found that in some cases, dry aerosols of the organism were more resistant to UV than wet (nebulized liquid) aerosols. Other aerosol characteristics are also important. Bacteria in droplet nuclei are more readily killed than aggregates. Dust or other particulates associated with the bioaerosol decrease the efficacy of the UV because of the UV’s poor penetration. Because our goal was to develop a method to test and compare the lights in a test duct, some of these issues needed to be addressed. To address the influence of the confounding/potentially protective aerosol characteristics, the test organisms were generated in both water and broth as described in section 2.4.3. The water media was used as the baseline, and the broth for all of the potentially protective circumstances.
3.3.5 The Influence of Relative Humidity on Test Organisms There is little or no agreement in the literature regarding an organism’s sensitivity to UV and the moisture content of the cell. Attempts to correlate the susceptibility of an organism to UV at different RHs have yielded inconsistent results. Some organisms have shown decreased kill at RHs greater than 60–70%, while others have not. Studies with S. marcescens showed decreased kill at RHs both greater than 70% and below 40%. The duct’s RH did not appear to affect particle viability (the upstream and downstream counts with the lamps off were about the same) or particle size (by optical particle counter) between the upstream and downstream measuring points. Because physical equilibrium with water vapor is achieved quickly for micrometer-sized particles, this is not surprising.
36
To help elucidate the RH effect on organisms within the confines of this project, experiments were performed at 55% RH and 85% RH with both water and broth suspensions.
4.0 UVGI EFFICACY IN AIR DUCTS 4.1 Measured Efficacy and Discussion During this research, UVGI lamps were found to inactivate vegetative bacteria, bacteria spores, and fungal spores to a reproducible degree under conditions of fixed dose. Further, Eq. 1 was found to generally apply, provided the dose and the k value were known. This section summarizes the bioaerosol measurements that were the key findings of the research. Table 6 summarizes the final results for our three primary test organisms. The test organisms were suspended in either water or broth to examine the impact of the potentially protective effect of organic matter (dirt, debris, etc.) on the organisms in these tests. The experiments were performed at either 55% RH or 85% RH to assess the impact of the potentially protective effect of humidity on the organisms within the confines of this test method. While the focus of this project was not to elucidate the nature of these organisms, understanding the various effects was critical in developing the test and interpreting the results.
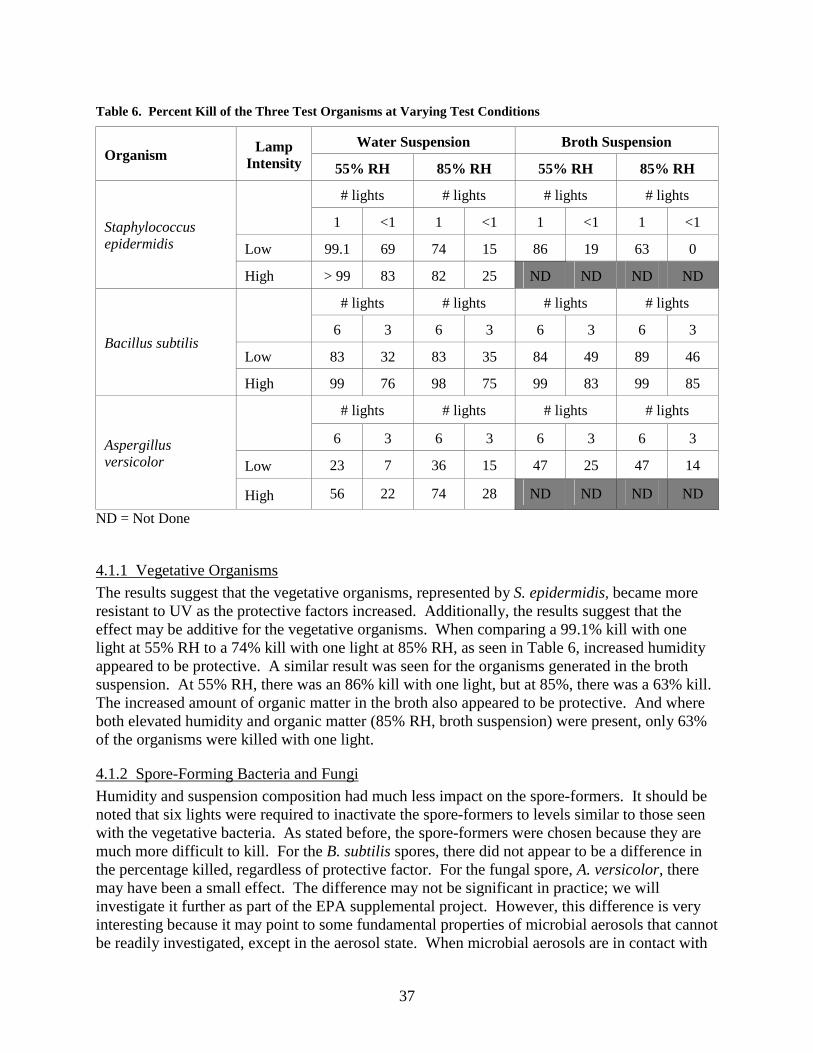
37
Table 6. Percent Kill of the Three Test Organisms at Varying Test Conditions
Water Suspension Broth Suspension Organism Lamp
Intensity 55% RH 85% RH 55% RH 85% RH
# lights # lights # lights # lights
1 <1 1 <1 1 <1 1 <1
Low 99.1 69 74 15 86 19 63 0 Staphylococcus epidermidis
High > 99 83 82 25 ND ND ND ND
# lights # lights # lights # lights
6 3 6 3 6 3 6 3
Low 83 32 83 35 84 49 89 46 Bacillus subtilis
High 99 76 98 75 99 83 99 85
# lights # lights # lights # lights
6 3 6 3 6 3 6 3
Low 23 7 36 15 47 25 47 14 Aspergillus versicolor
High 56 22 74 28 ND ND ND ND
ND = Not Done
4.1.1 Vegetative Organisms The results suggest that the vegetative organisms, represented by S. epidermidis, became more resistant to UV as the protective factors increased. Additionally, the results suggest that the effect may be additive for the vegetative organisms. When comparing a 99.1% kill with one light at 55% RH to a 74% kill with one light at 85% RH, as seen in Table 6, increased humidity appeared to be protective. A similar result was seen for the organisms generated in the broth suspension. At 55% RH, there was an 86% kill with one light, but at 85%, there was a 63% kill. The increased amount of organic matter in the broth also appeared to be protective. And where both elevated humidity and organic matter (85% RH, broth suspension) were present, only 63% of the organisms were killed with one light.
4.1.2 Spore-Forming Bacteria and Fungi Humidity and suspension composition had much less impact on the spore-formers. It should be noted that six lights were required to inactivate the spore-formers to levels similar to those seen with the vegetative bacteria. As stated before, the spore-formers were chosen because they are much more difficult to kill. For the B. subtilis spores, there did not appear to be a difference in the percentage killed, regardless of protective factor. For the fungal spore, A. versicolor, there may have been a small effect. The difference may not be significant in practice; we will investigate it further as part of the EPA supplemental project. However, this difference is very interesting because it may point to some fundamental properties of microbial aerosols that cannot be readily investigated, except in the aerosol state. When microbial aerosols are in contact with

38
agar, as has been the case in most of the reported literature, it would not be possible to investigate the impact of air RH. Additional tests with a dilute protein solution are under way. These tests will help elucidate the importance of humidity on kill for the different classes of organisms. It is critical to understand the effect of humidity on the various organisms. The literature is contradictory on the subject. The physical factors work has shown that the lights are not affected. This makes it critical to clarify the impact of humidity on the organisms.
4.1.3 Summary of Calculated Microbial Resistance Constants One of the more confusing aspects of comparing the effectiveness of different UV lights is that manufacturers report different dosages, and therefore, correspondingly different kills. As can be seen in Table 6, the impact of the high-intensity lights was that a higher percentage of organisms was killed due to the higher dose. As a check on the test method we developed, it was necessary to compare our results to those of the same or similar organisms reported in the literature. To separate out organism effects from light effects, we calculated the k value. The k value was calculated as shown in Eq. 1 and is defined as the microorganism-dependent rate constant. Table 7 shows the k values (cm2/mW-s) calculated from data reported in Table 6 for the three primary organisms in the study at both 55% RH and 85% RH. Only the data from the tests in which the organisms were suspended in water were reported. Table 7. Summary of k Values for Test Organisms
k values, cm2/mW-s, at indicated humidity Test Organism
55% RH 85% RH
Staphylococcus epidermidis 2.4 ± 2.0 (n=18) 0.8 ± 0.2 (n=12)
Bacillus subtilis 0.2 ± 0.06 (n=14) 0.2 ± 0.06 (n=14)
Aspergillus versicolor 0.03 ± 0.02 (n=12) 0.06 ± 0.03 (n=12) n = number of tests As anticipated, the k values for the three test organisms demonstrate that the vegetative bacteria was the most readily killed, while the fungal spore was the most difficult to kill. The values we determined are similar to those reported in the literature. The literature-reported values for organisms similar to S. epidermidis range from 0.4 to 1.9 cm2/mW-s. For B. subtilis, the values range from 0.1 to 0.9 cm2/mW-s. The reported k values for various Aspergilli range from 0.01 to 0.05 cm2/mW-s. 4.2 Design of UVGI Systems for Air Ducts Most of the guidance available from the published literature and manufacturers of UVGI systems appears to have its origin in the design guidance provided by the UV lamp manufacturers Westinghouse (1982) and Phillips (1985, 1992). The guidance is based on the validity of Eq. 1, detailed knowledge of lamp performance under different conditions, and use of either a variation

39
on the inverse-square law or the view factor equation to estimate the effective irradiance in the space. With the caveat that the microbial resistance constants k should not be taken to have great precision, the present research generally confirms these design methods. Conversations with various manufacturers have indicated that some have independently developed models that have the general characteristics of the model we developed to support this research. Any design method must begin with knowledge of the output of the UVGI lamps at the expected operating conditions. For branded lamps, that information is available (at least in part) from the manufacturer. For an unbranded lamp, few assumptions can be made; the irradiance must be measured at operating conditions. The design models can then be used.
5.0 CONCLUSIONS We can draw several conclusions from our studies. The key factors for the design of in-duct UVGI systems intended to disinfect moving air streams are (1) UV lamp irradiance at operating conditions, (2) microbial resistance data, (3) functioning bioaerosol dose model and (4) duct wall reflectance. UVGI lamps have a point of maximum output when exposed to various air temperatures and airflow rates. This optimal operating point is fundamentally related to lamp operating temperature and can be reached by various combinations of environment and heat transfer rate (principally air temperature and flow rate) that bring the lamp to the proper operating condition. Different UVGI lamps have different characteristics, and the optimum cooling rate may be different for each. The reduction in output due to overcooling at temperatures achievable in an HVAC system has been shown to be as much as a factor of two, which could have a significant effect on kill for bioaerosols. The variance in k values reported in section 4.1.3 for the present work (results reported as mean and standard deviation) and the ranges of reported k values should be considered to be measures of real variability in microbial resistance until proven otherwise. Humidity and organic matter were shown in sections 4.1.1 and 4.1.2 to have protective effects that would be difficult to distinguish from natural variation in an environmental organism, and significant variation should be expected. Resistance variations between strains of the same organism have the potential to be substantial. Very little work has been done. In consequence of this, UVGI system designers should
• Apply safety factors to their designs, particularly as they depart from operating modes with which they have performance data and field experience.
• Avoid relying solely on design equations to determine the performance of their systems. Actual testing with the contaminants of interest is highly recommended.
• Be extremely cautious regarding claims about UVGI systems’ high levels of inactivation of pathogenic bioaerosols. While the microbiological science underlying these

40
conclusions is thought to apply to pathogenic bioaerosols as well as environmental organisms, much greater caution is required in the former case. Claiming a high inactivation rate for a pathogenic bioaerosol without substantial testing would be irresponsible. Even with substantial testing, design failures may occur.
6.0 RECOMMENDATIONS Because lamp output varies so strongly with temperature and airflow rate, lamp output measurements should either be made at the expected use conditions or extrapolated to those conditions. In the efforts to counter bioterrorism, the use of UVGI is likely to be proposed with increasing frequency. It is a low-pressure-drop, nonintrusive technology that has real potential. In that light, we recommend that test methods and guidance for performance claims regarding bioterrorism agents be developed by an experienced and broadly based group of technical experts, users, and manufacturers. Until rigorous and adequate tests have been developed and performed, claims regarding protection against aerosol bioterrorism agents are suspect. The potential errors are too large and the consequences too great.
7.0 REFERENCES ASHRAE. 1999. Standard 52.2-1999: Method of Testing General Ventilation Air-Cleaning
Devices for Removal Efficiency by Particle Size. American Society of Heating, Refrigerating, and Air-Conditioning Engineers, Inc. Atlanta, GA.
Beebe, James M. 1958. Stability of disseminated aerosols of Pasteurella tularensis subjected to
simulated solar radiation at various humidities. Journal of Bacteriology 78:18-24. Dulbecco, R. 1955. Photoreactivation. In Radiation Biology. Vol. II. A. Hollaender, Ed.
New York: McGraw-Hill. pp. 455-486. CDC. 1994. Guidelines for Preventing the Transmission of Mycobacterium Tuberculosis in
Health-Care Facilities. Centers for Disease Control and Prevention, Atlanta, GA. CDC. 1999a. Guidelines for the Application of Upper-Room Ultraviolet Germicidal Irradiation
for Preventing Transmission of Airborne Contagion—Part I: Basic Principles. Centers for Disease Control and Prevention, Atlanta, GA.
CDC. 1999b. Guidelines for the Application of Upper-Room Ultraviolet Germicidal Irradiation
for Preventing Transmission of Airborne Contagion—Part II: Design. Centers for Disease Control and Prevention, Atlanta, GA.
Kelner, A. 1949. Effect of visible light on the recovery of Streptomyces griseus conidia from
ultraviolet irradiation injury. PNAS 35:73-79.

41
Kowalski, W. J., W. P. Bahnfleth, D. L. Witham, B. F. Severin, and T.S. Whittam. Mathematical modeling of ultraviolet germicidal irradiation for air disinfection. Quantitative Microbiology 2:249-270.
Kowalski, W. J., and W. Bahnfleth. 1998. Airborne respiratory diseases and mechanical
systems for control of microbes. Heating/Piping/Air Conditioning. July. p34-46, 48. Miller, S.L., and J. M. Macher. Evaluation of a methodology for quantifying the effect of room
air ultraviolet germicidal irradiation on airborne bacteria. Aerosol Science and Technology 33:274-295.
Phillips Lighting Division. 1985. Germicidal lamps and applications. Booklet Phillips Lighting Division. 1992. Disinfection by UV-radiation. Booklet 3222 C34 00671. Ryer, A. D. 1997. Light Measurement Handbook. Available at http://www.intl-
light.com/handbook/. Newburyport, Maine: International Light, Inc. Scheir, R., and F. B. Fencl, 1996. Using UVGI technology to enhance IAQ. Heating/Piping/Air
Conditioning 68:109-114, 117-118, 123-124. Setlow, P. 1992. I will survive: Protecting and repairing spore DNA. Journal of Bacteriology
174:2737-2741. Sharp, D. Gordon. 1940. The effects of ultraviolet light on bacteria suspended in air. Journal of
Bacteriology 38: 535-547. Shechmeister, I. L. 1991. Sterilization by ultraviolet radiation. In Disinfection, Sterilization,
and Preservation. S. S Block, Ed. Philadelphia: Lea & Febiger, pp. 553-565. Sun, Y., K. Palasingam, and W. Nicholson. 1994. High-pressure liquid chromatography assay for
quantitatively monitoring spore photoproduct repair mediated by spore photoproduct lyase during germination of UV-irradiated Bacillus subtilis spores. Analytical Biochemistry 221:61-65.
Westinghouse Electric Corp. 1982. Booklet A-8968.